Headlines
|
|
Three weight of the evidence indicators presently flashing green:
There are dangers presently for the stock market. But several "weight of the evidence" breadth indicators are flashing green under the surface. While there are no guarantees, taken together, they suggest the recent decline may be a normal pullback in a larger uptrend.
|
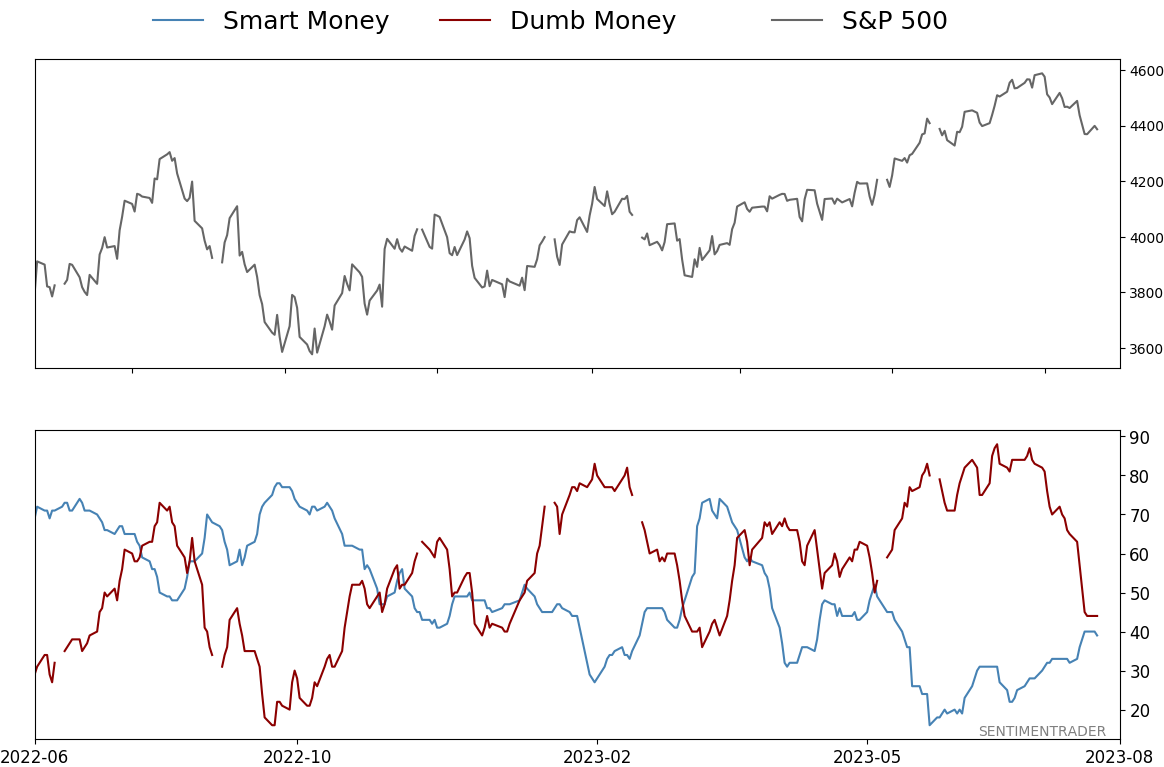
Smart / Dumb Money Confidence
|
Smart Money Confidence: 39%
Dumb Money Confidence: 44%
|
|
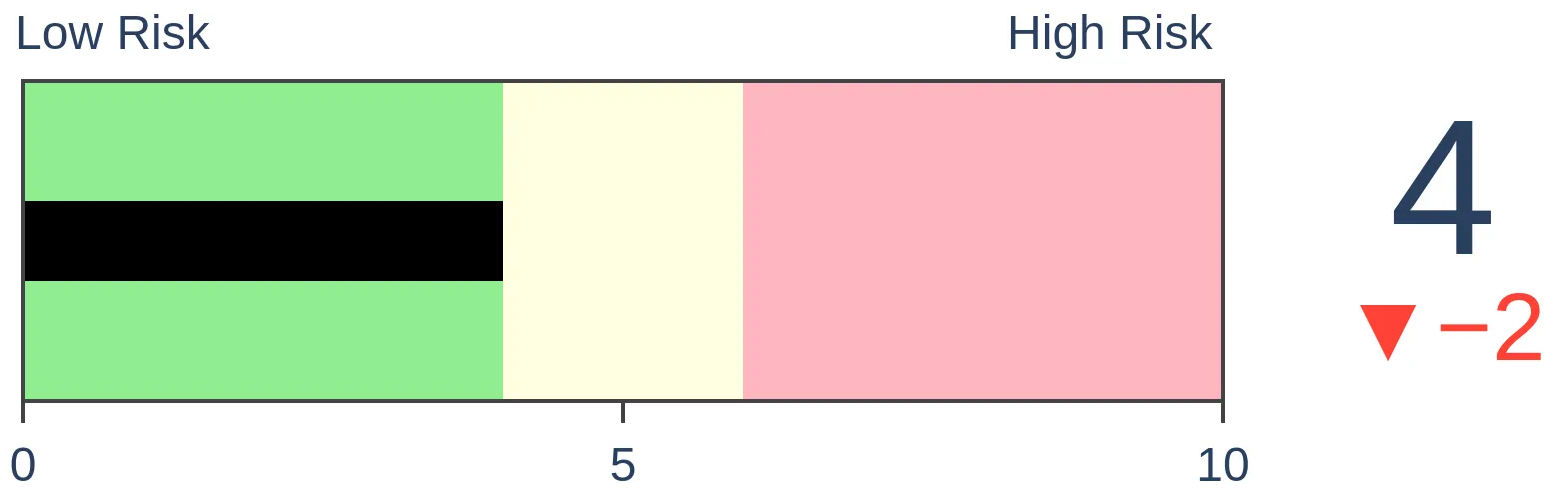
Risk Levels
Stocks Short-Term
|
Stocks Medium-Term

|
|
Bonds
|
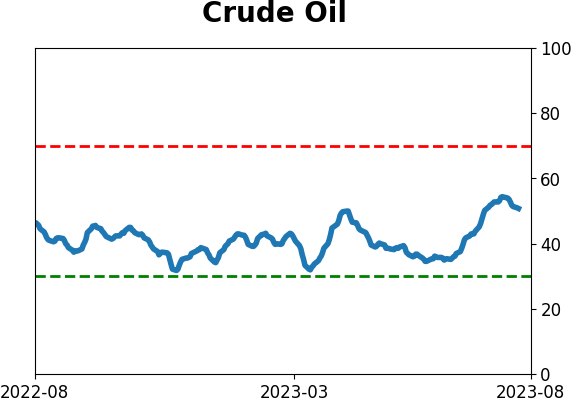
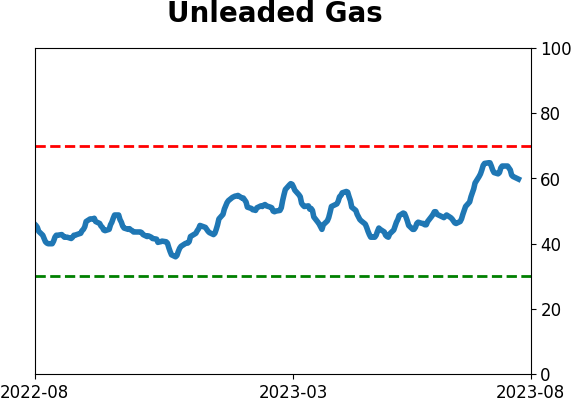
Crude Oil

|
|
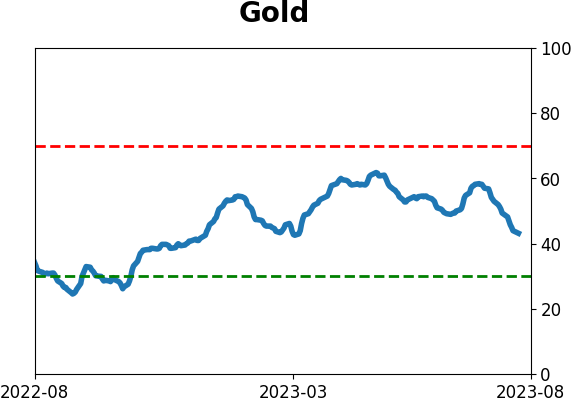
Gold
|
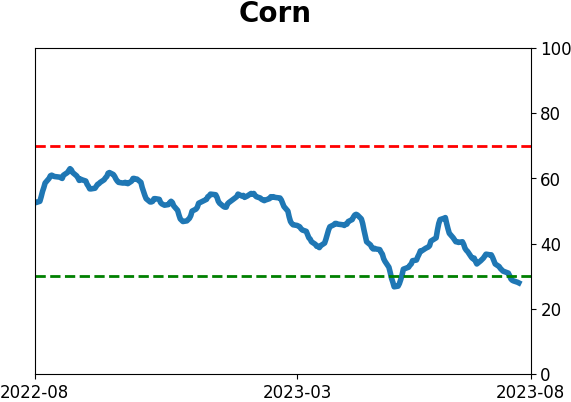
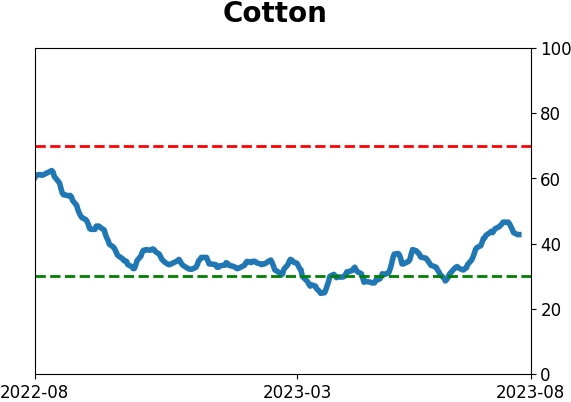
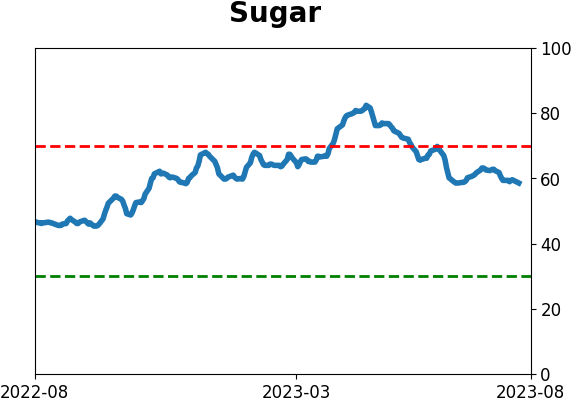
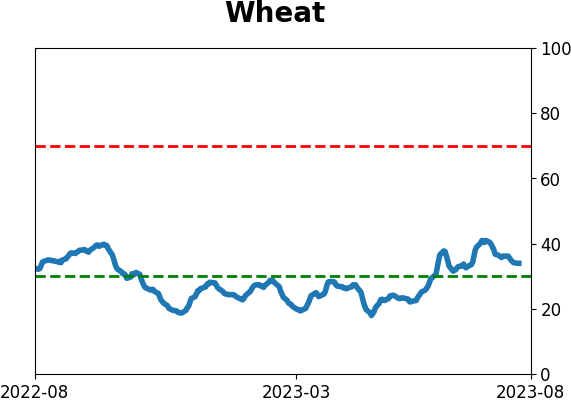
Agriculture
|
|
Research
By Jay Kaeppel
BOTTOM LINE
There are dangers presently for the stock market. But several "weight of the evidence" breadth indicators are flashing green under the surface. While there are no guarantees, taken together, they suggest the recent decline may be a normal pullback in a larger uptrend.
FORECAST / TIMEFRAME
None
|
Key points
- A variety of indicators are suggesting that the recent decline in the market is a typical pullback within a more significant uptrend
- The NASDAQ McClellan Oscillator recently reached an oversold level
- The % of Industry Groups in a Bear Market flashed a counterintuitively higher - but still favorable reading
- The % S&P 1500 RSI 2-day < 30 indicator recently spiked to a level that has often highlighted a pullback in an ongoing bull market
The NASDAQ McClellan Oscillator reaches an oversold level
The chart below highlights all dates when the Nasdaq McClellan Oscillator dropped below -75 while the Nasdaq 100 Index was above its 200-day moving average. The latest signal occurred on 2023-08-17.
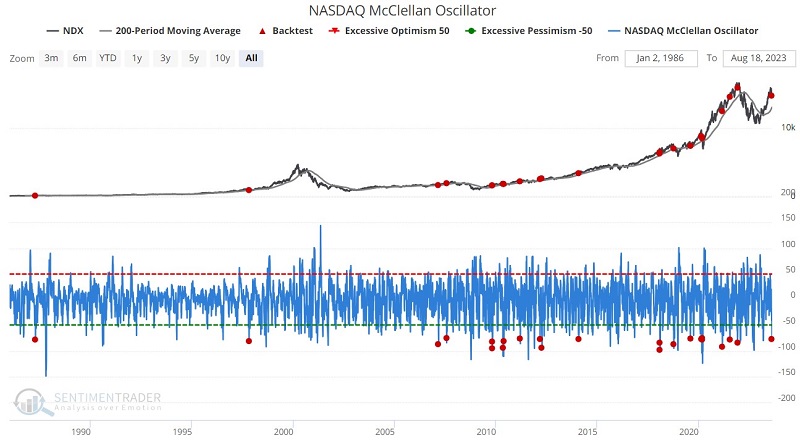
The tables below display a summary of post-signal SPX performance and signal-by-signal results.
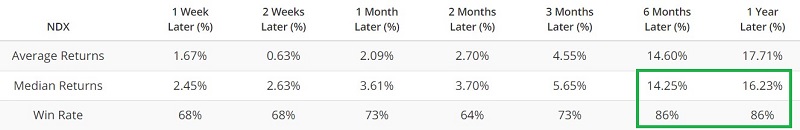
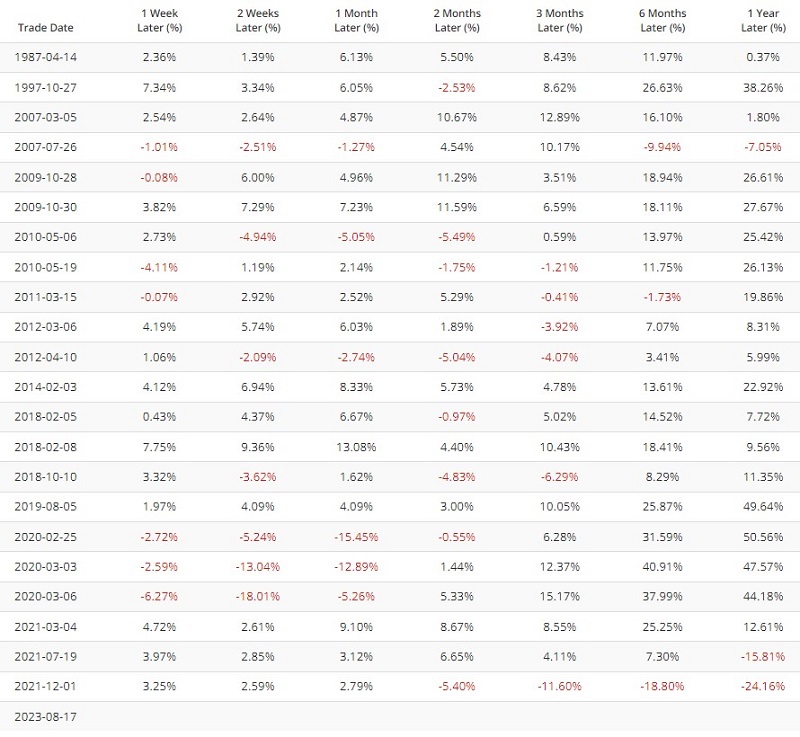
The results are far from perfect (significant declines followed more recent signals in mid and late 2021) and do not guarantee a resumption of the recent uptrend in stock prices but stand as bullish weight of the evidence.
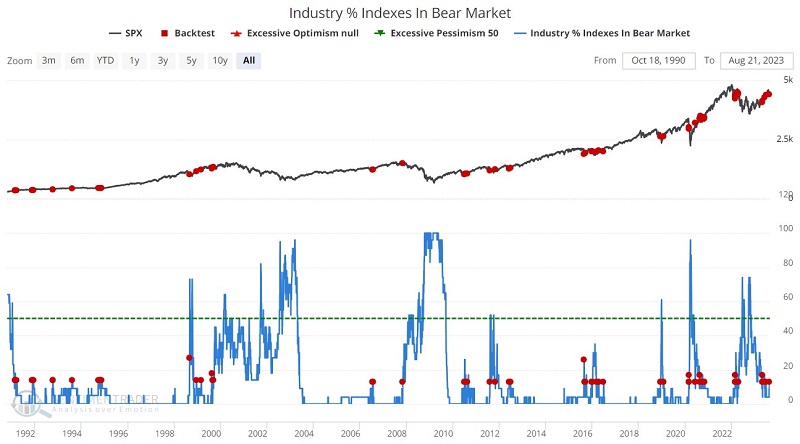
% of industries in a bear market gives a sign
The Industry % Indexes In Bear Market indicator measures the % of 23 industry groups that we follow that are 20% or more below their 52-week high. In a perfect world, this number would always be zero. Intuitively, when this number rises, that's a bad thing - and a rising value ultimately precedes every bear market. That said, we have also found that far more often than not, crosses above 10% mark a routine pullback in a bull market and not necessarily the start of a new bear market. As a standalone model, this might be risky to trade. However, as part of the weight of the evidence approach, it can be pretty helpful.
The chart below highlights all dates when the Industry % Indexes In Bear Market indicator crossed above 10%. Recent signals occurred in April, May, and June of 2023, with the most recent signal occurring on 2023-08-16.
The tables below display a summary of post-signal SPX performance results.
The high Win Rates for 3-to-12 months are encouraging.
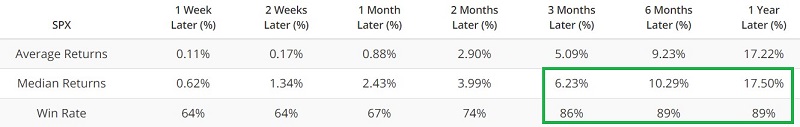
% S&P 1500 RSI 2-day < 30 reaches an important level
As the name implies, the % S&P 1500 RSI 2-day < 30 indicator measures the % of stocks in the S&P 1500 index showing a 2-day RSI of 30% or less. Like the indicators above, this one is best used as part of a weight of the evidence approach and not as a standalone indicator.
The chart below highlights all dates when this indicator was above 75 while the S&P 500 Index was above its 150-day moving average. The latest signal occurred on 2023-08-16.
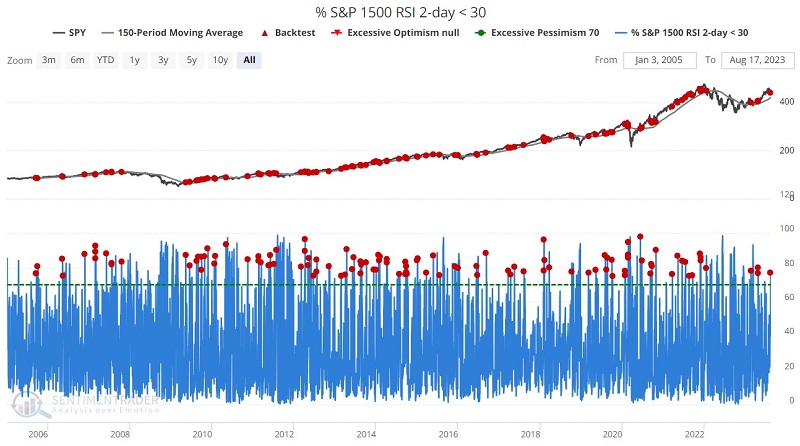
The table below displays a summary of post-signal SPX performance.
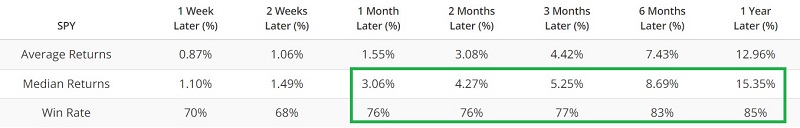
As with the other indicators, the generally high Win Rates for one month and longer do not guarantee a resumption of an uptrend - but they offer investors a reason to give the bullish case the benefit of the doubt.
What the research tells us…
There are dangers in the stock market at the moment - recent price weakness, rising interest rates, high valuations, and impending seasonal weakness. The potential for a 1987 scenario or at least a more extensive correction cannot be ignored, and investors should be prepared to manage risks. That said, the action of the indicators highlighted above suggests that the recent decline in the major indexes is nothing more than a typical pullback in an ongoing bull market.
If price weakness continues and stops are hit, investors and traders should act accordingly (i.e., defensively). For now, the results shown above suggest not letting scary headlines influence one's thinking.
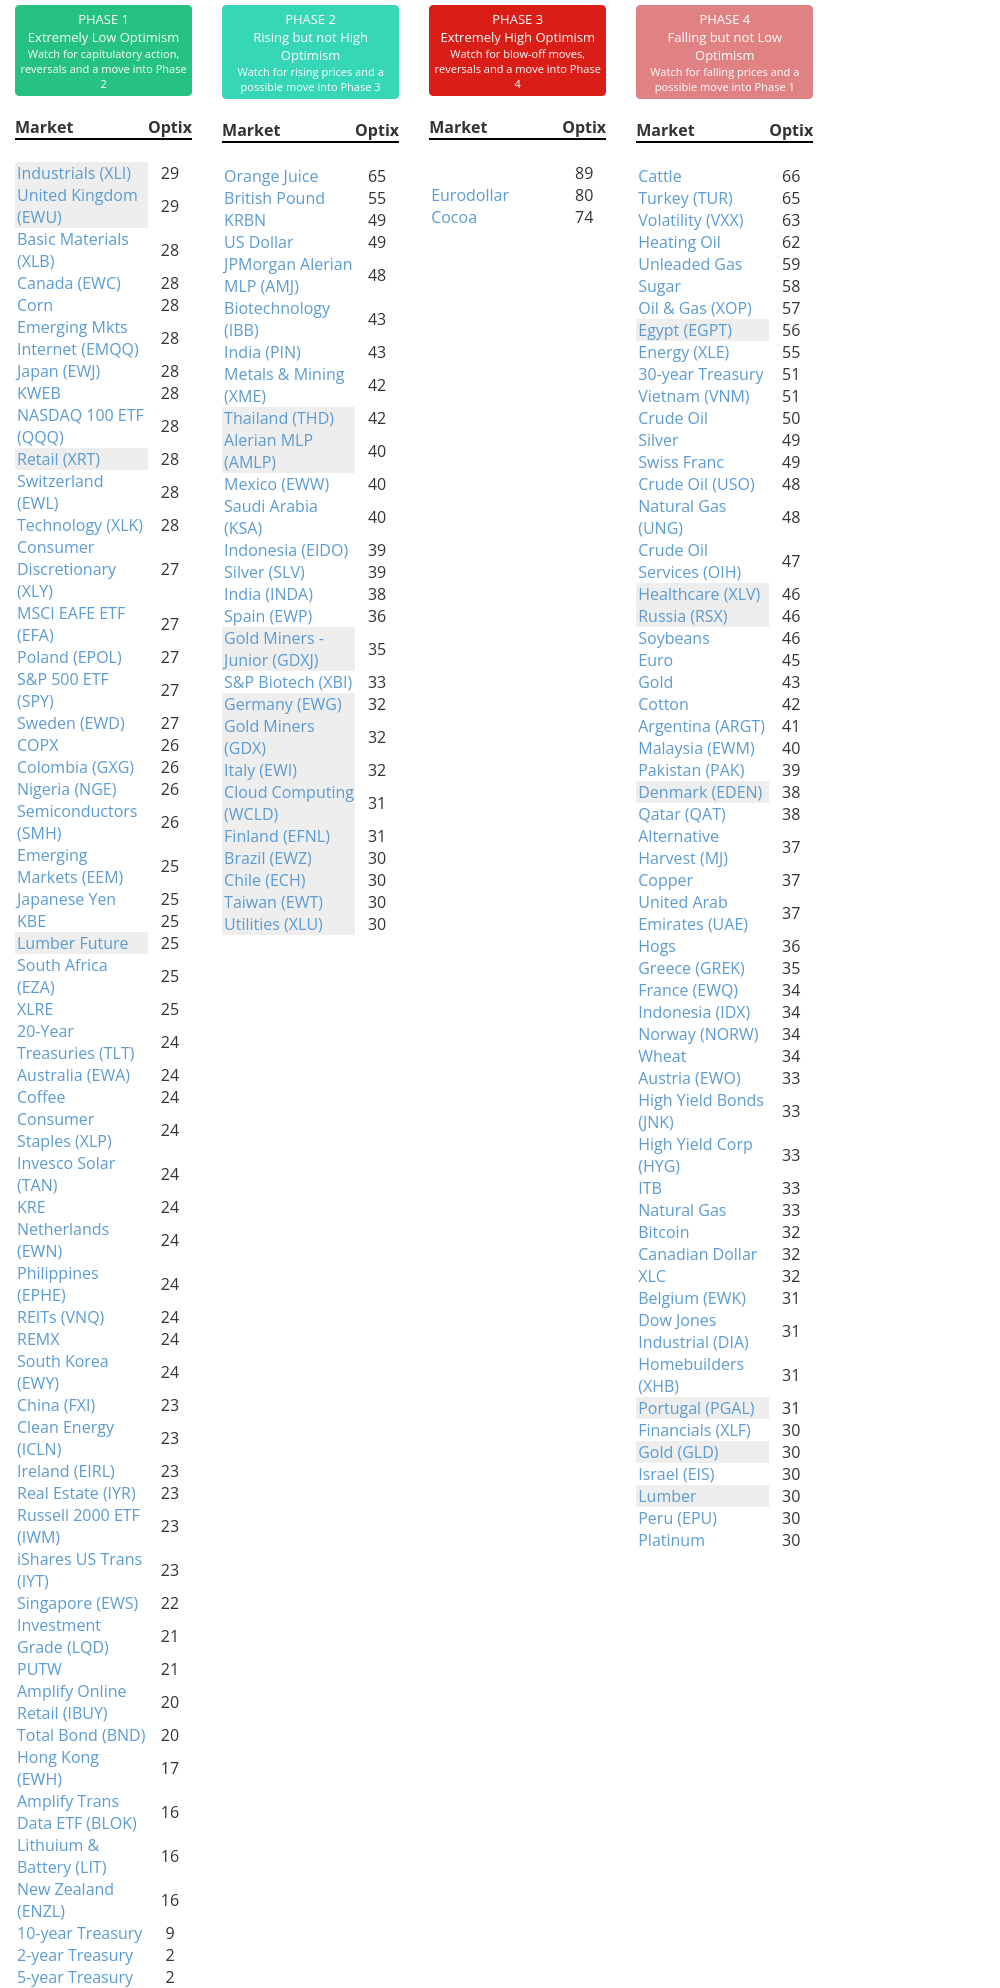
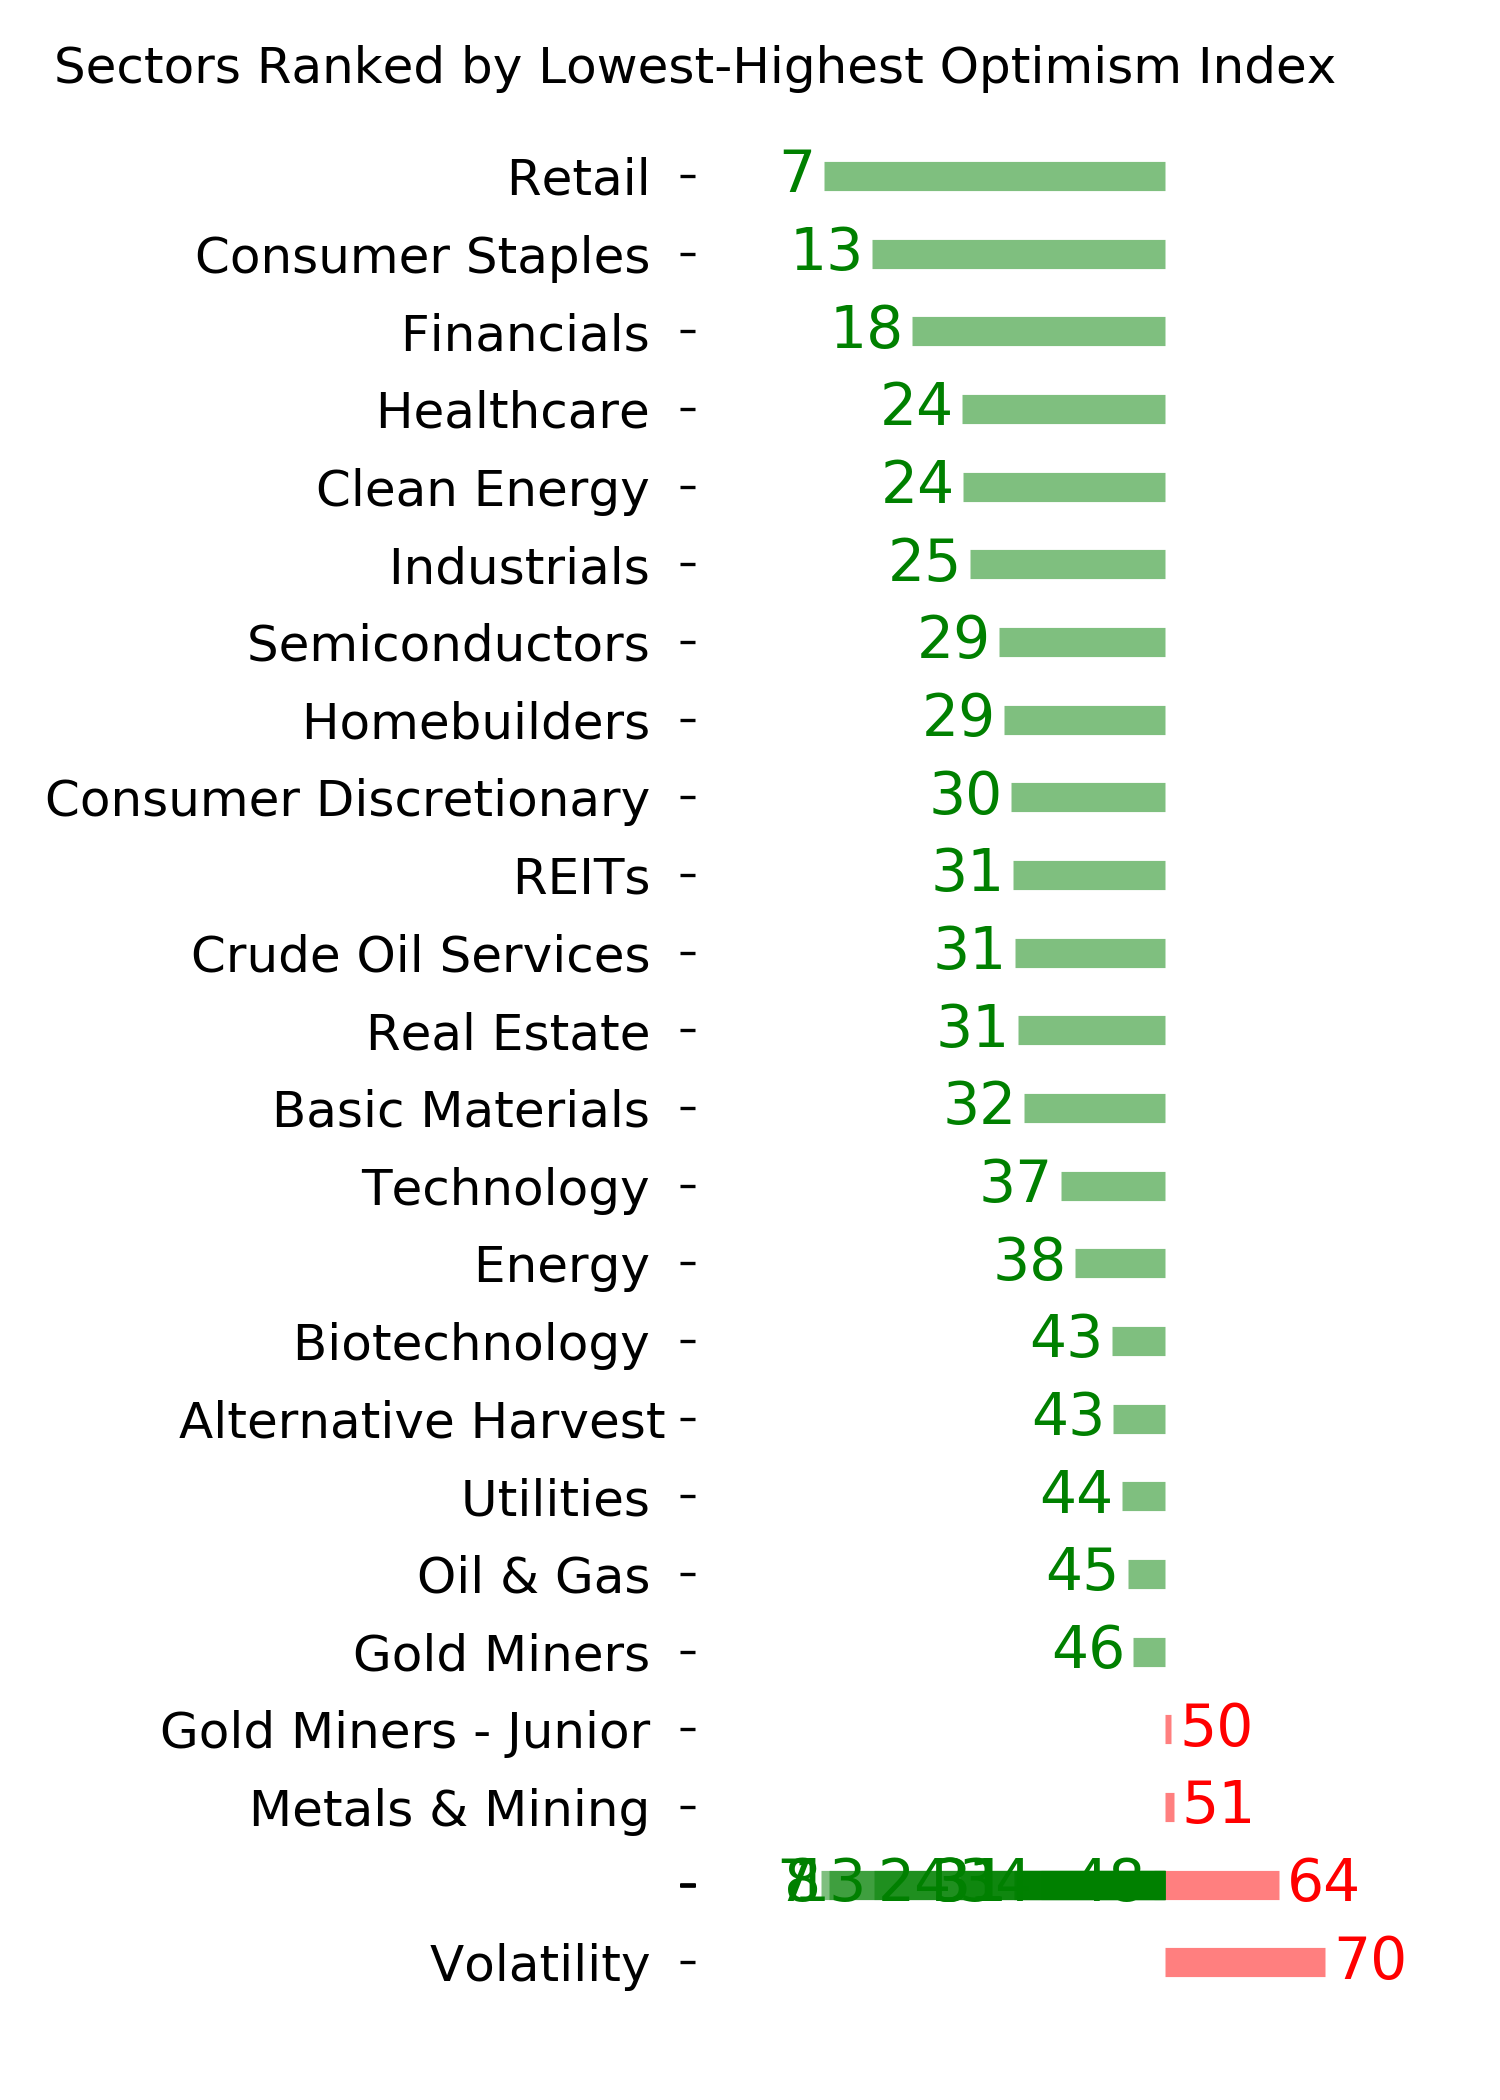
Indicators at Extremes
Phase Table
Ranks
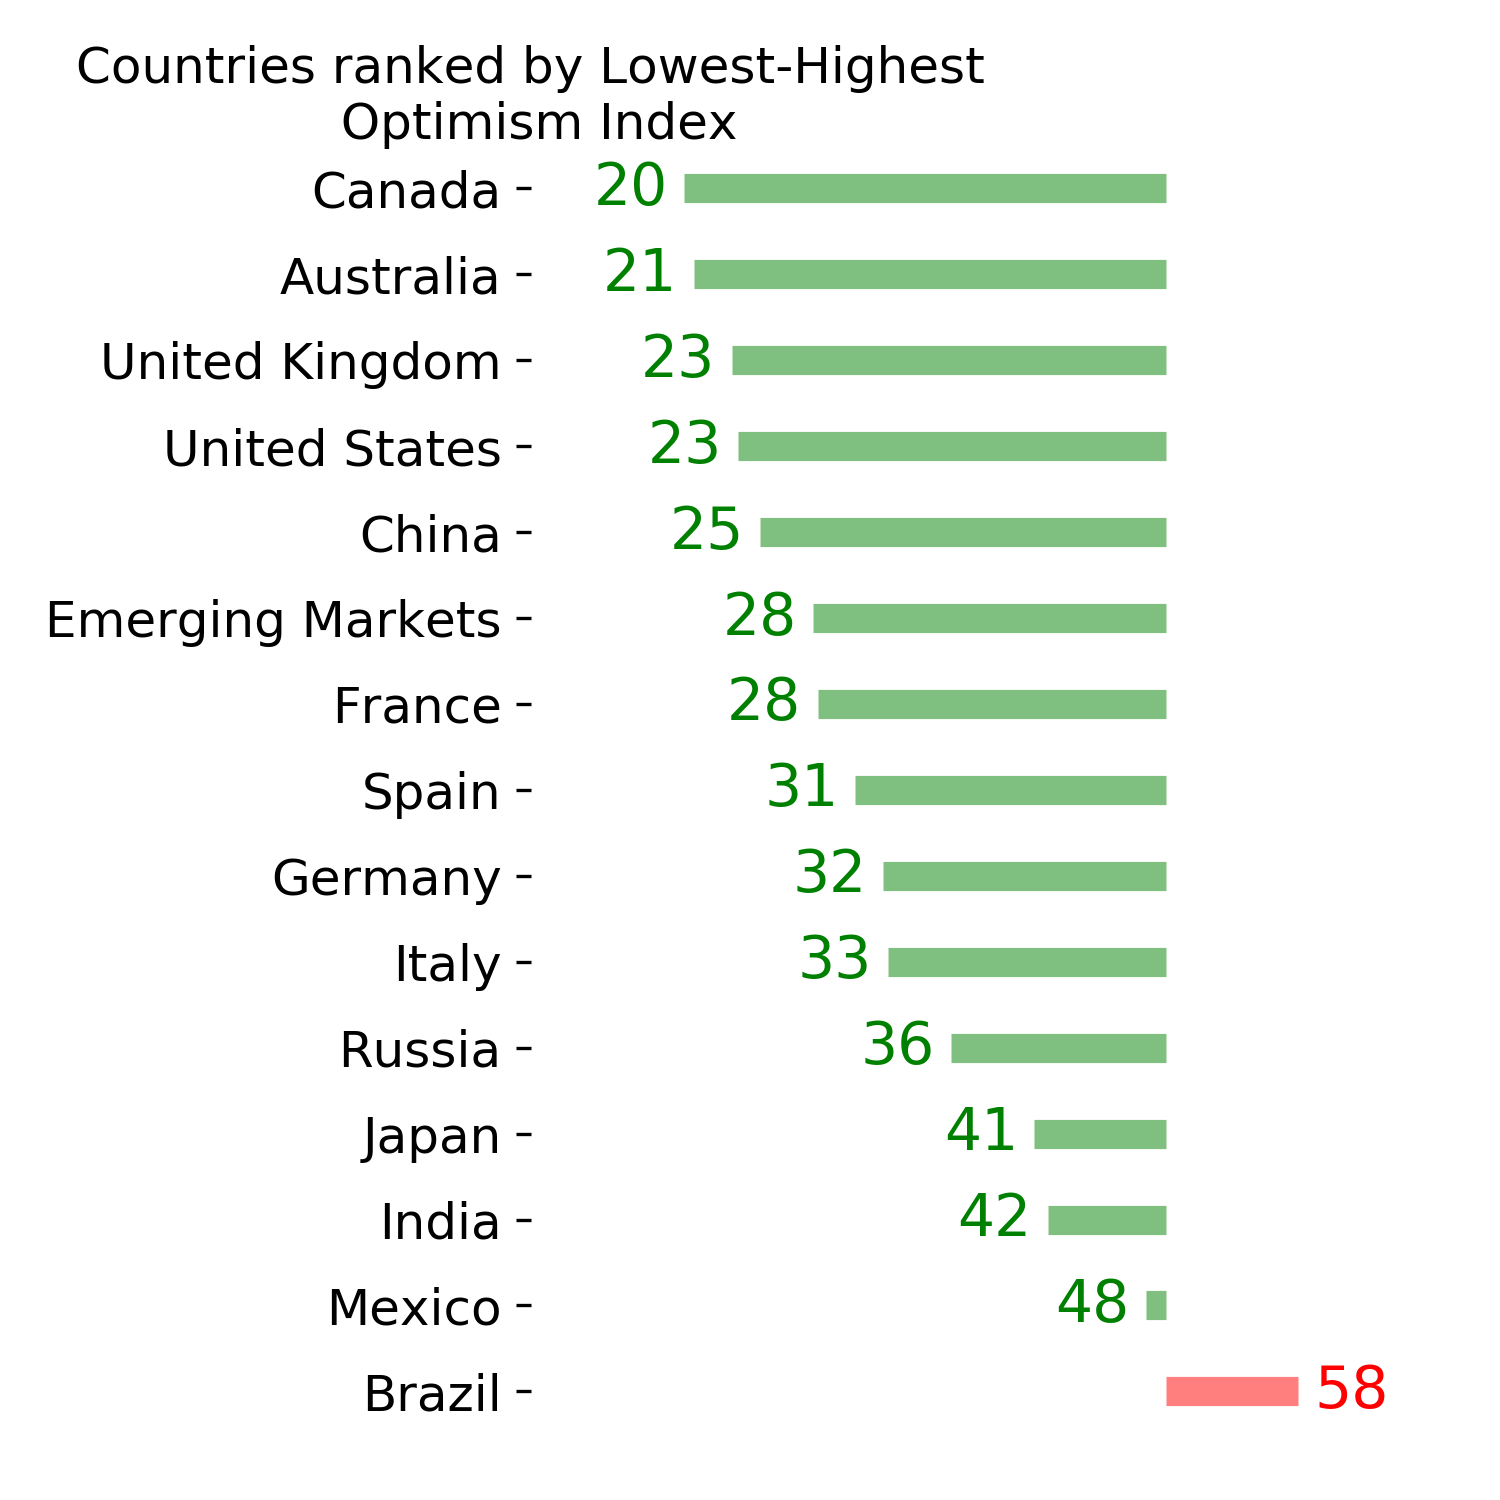
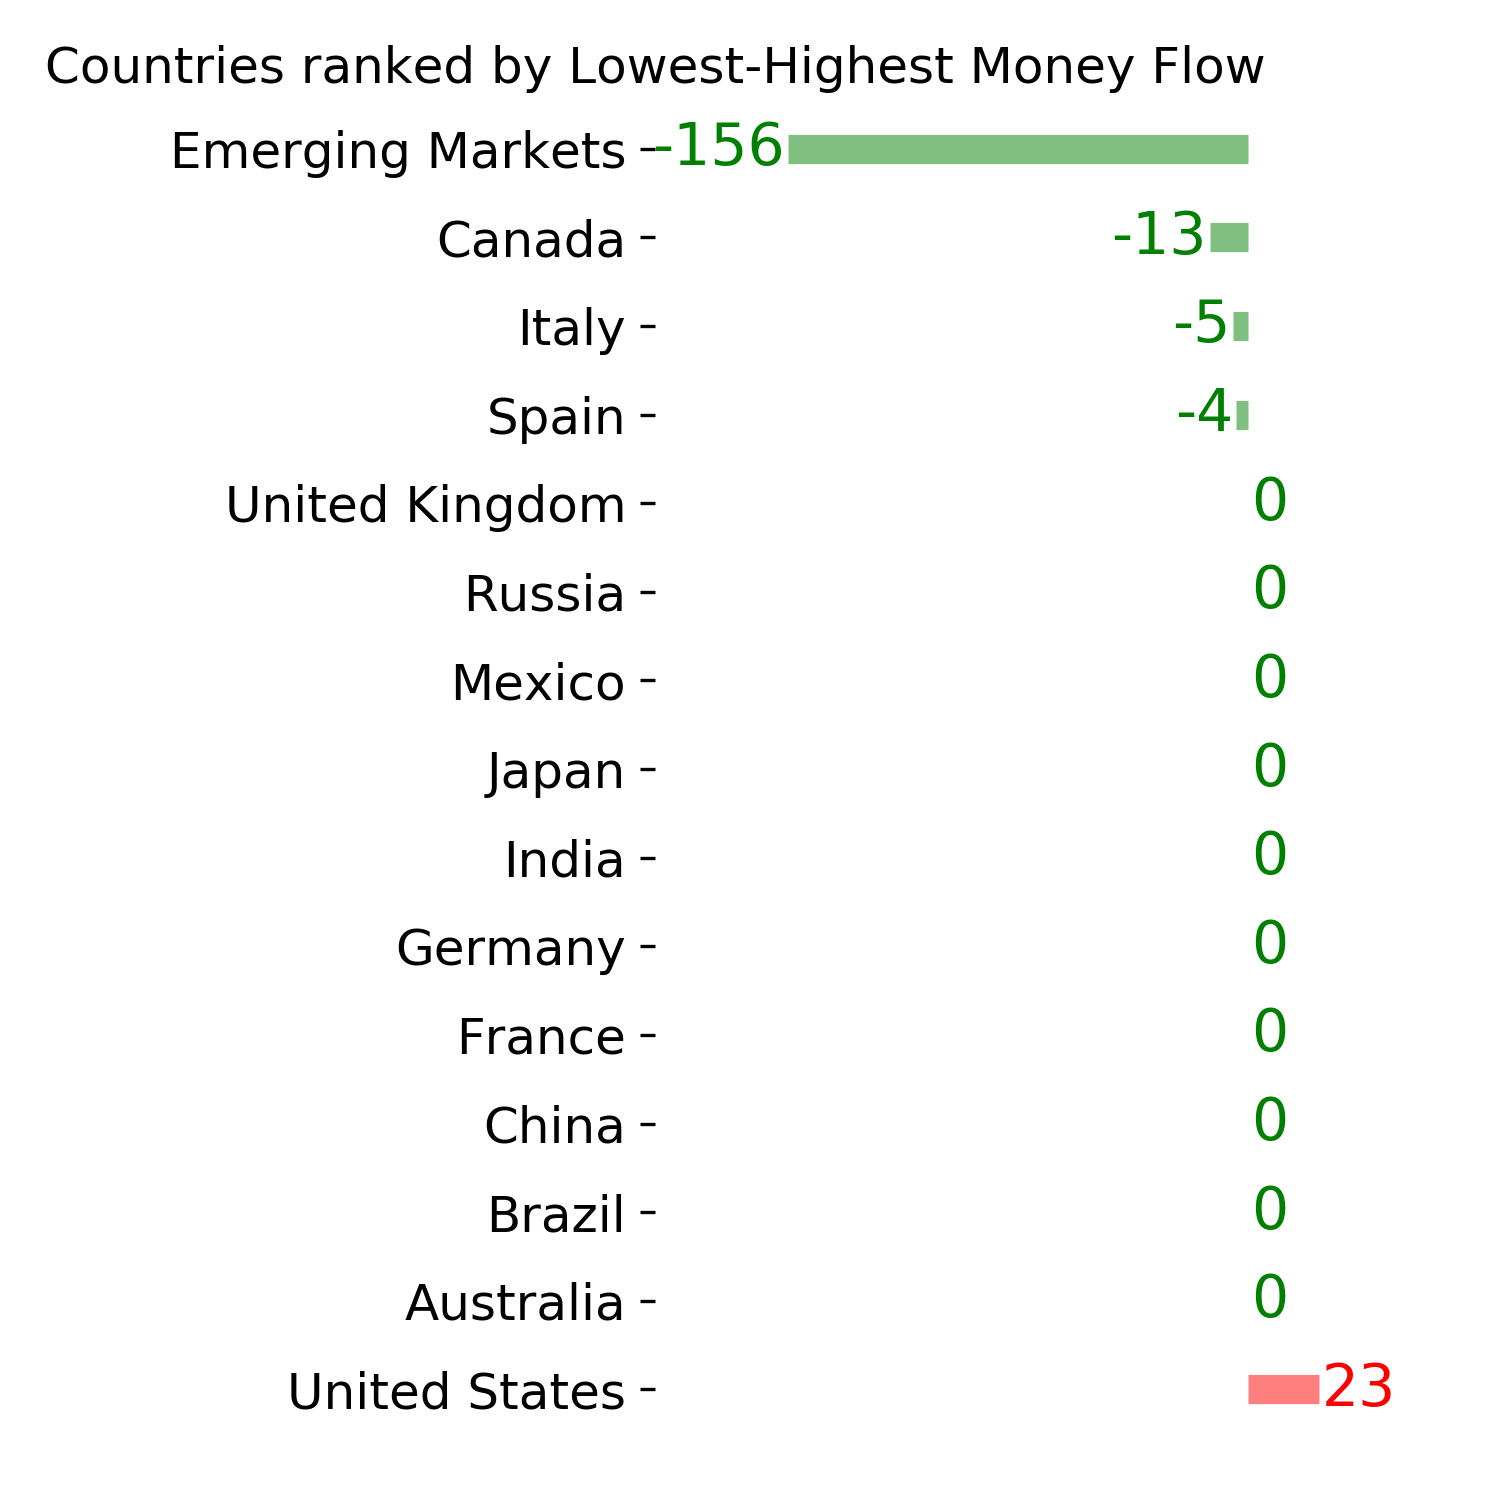
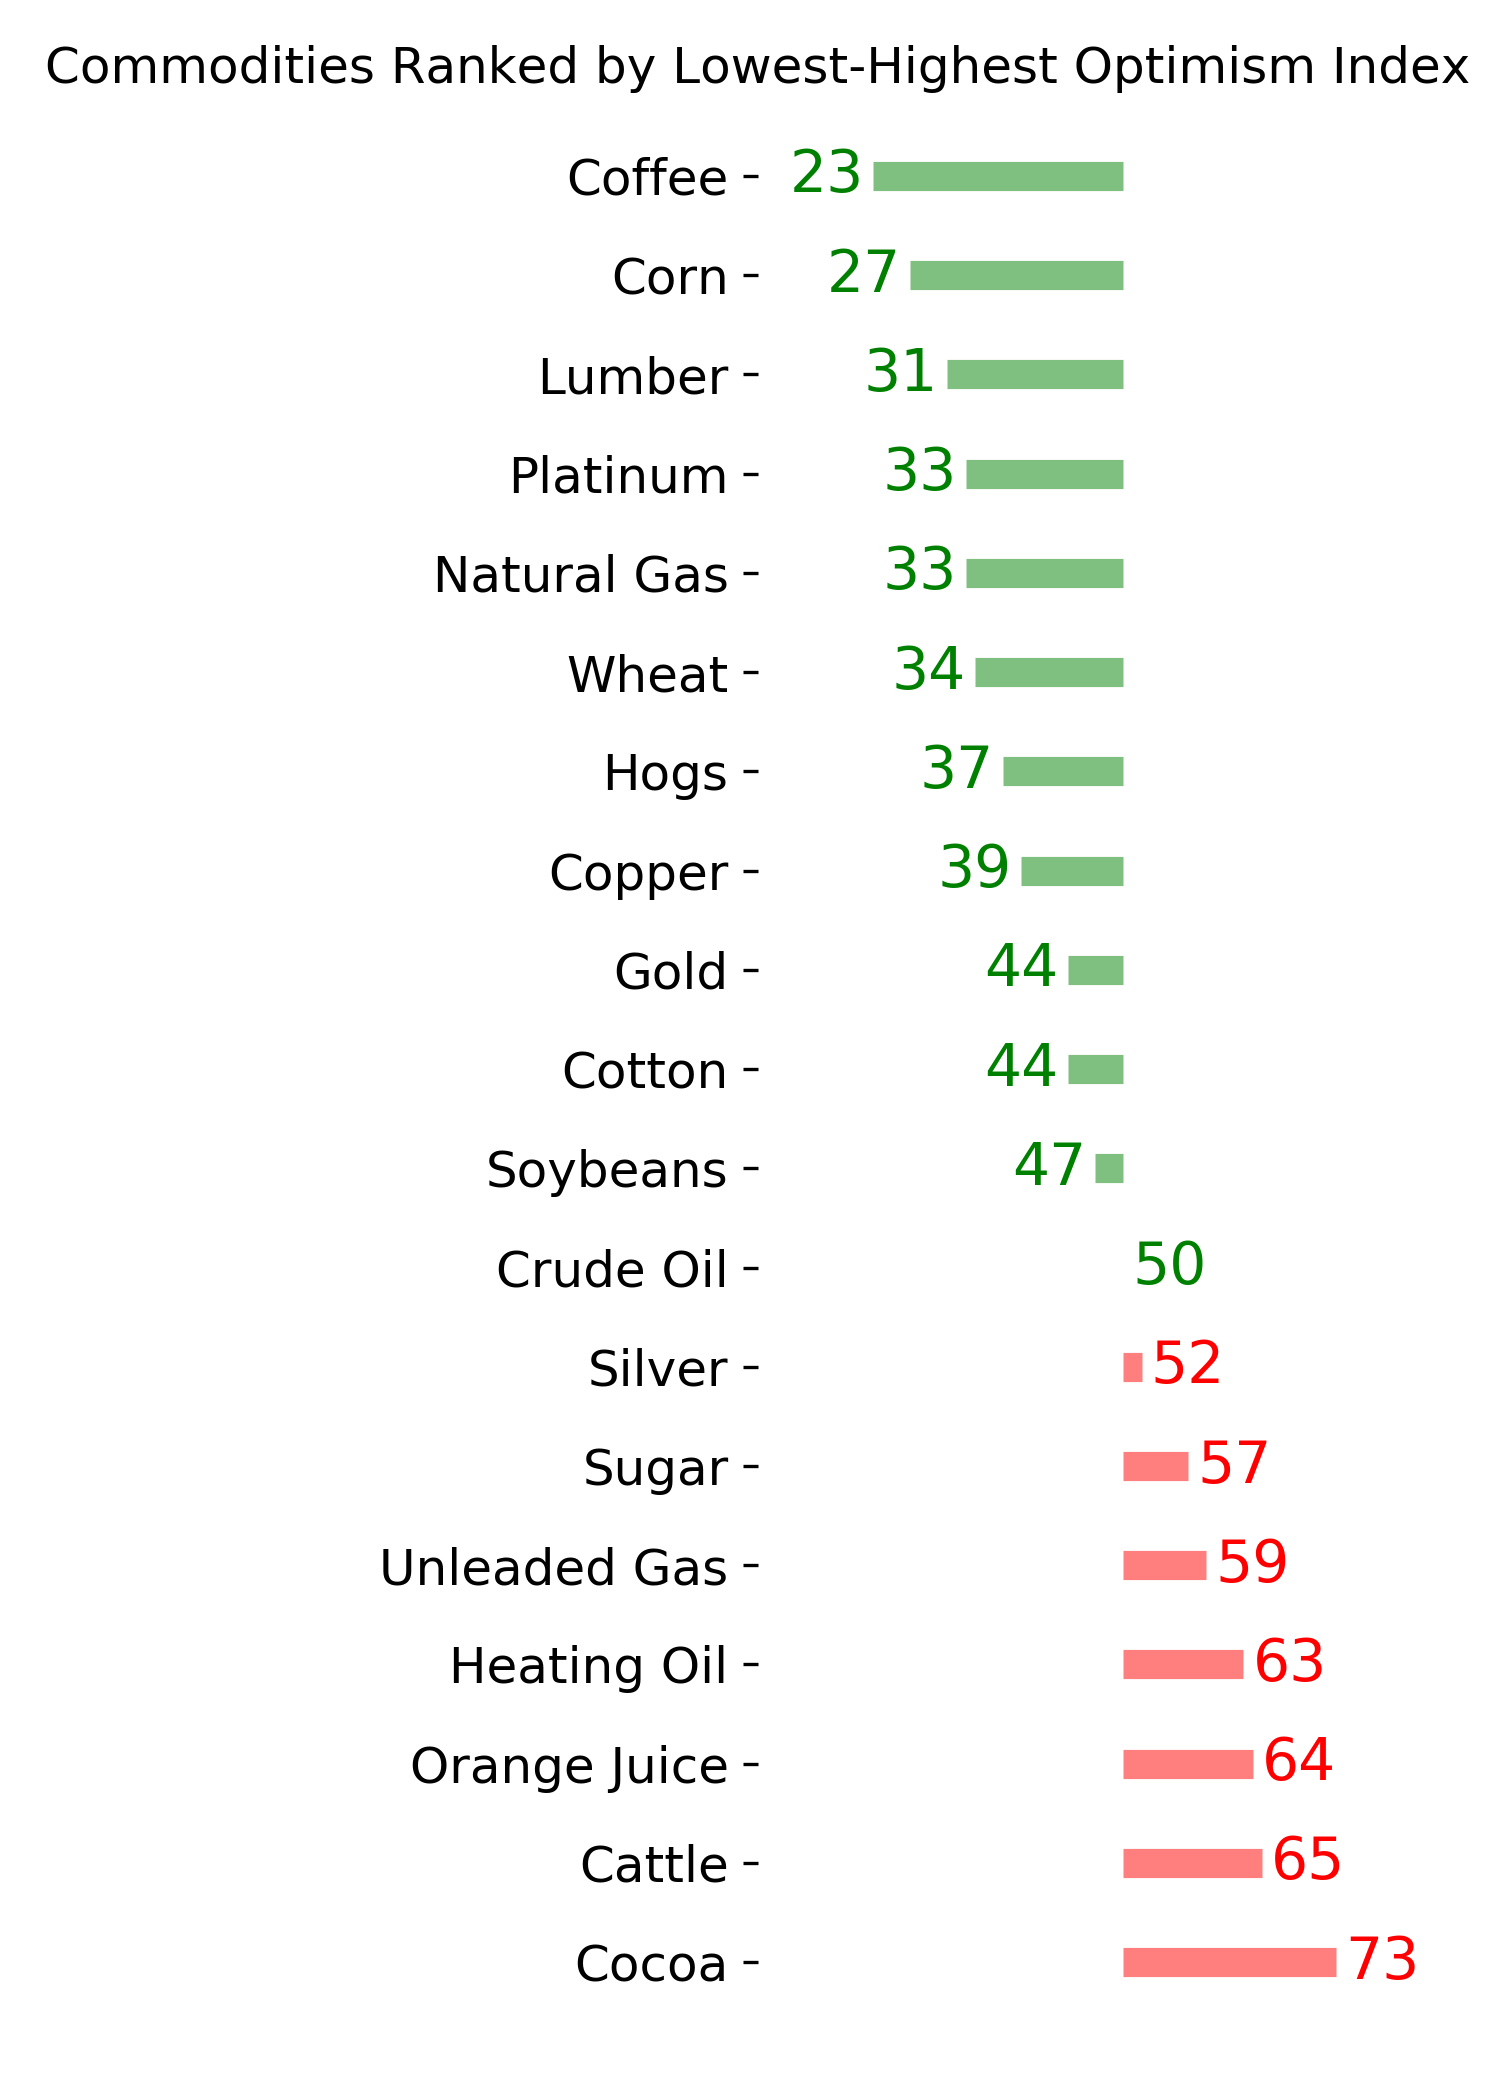
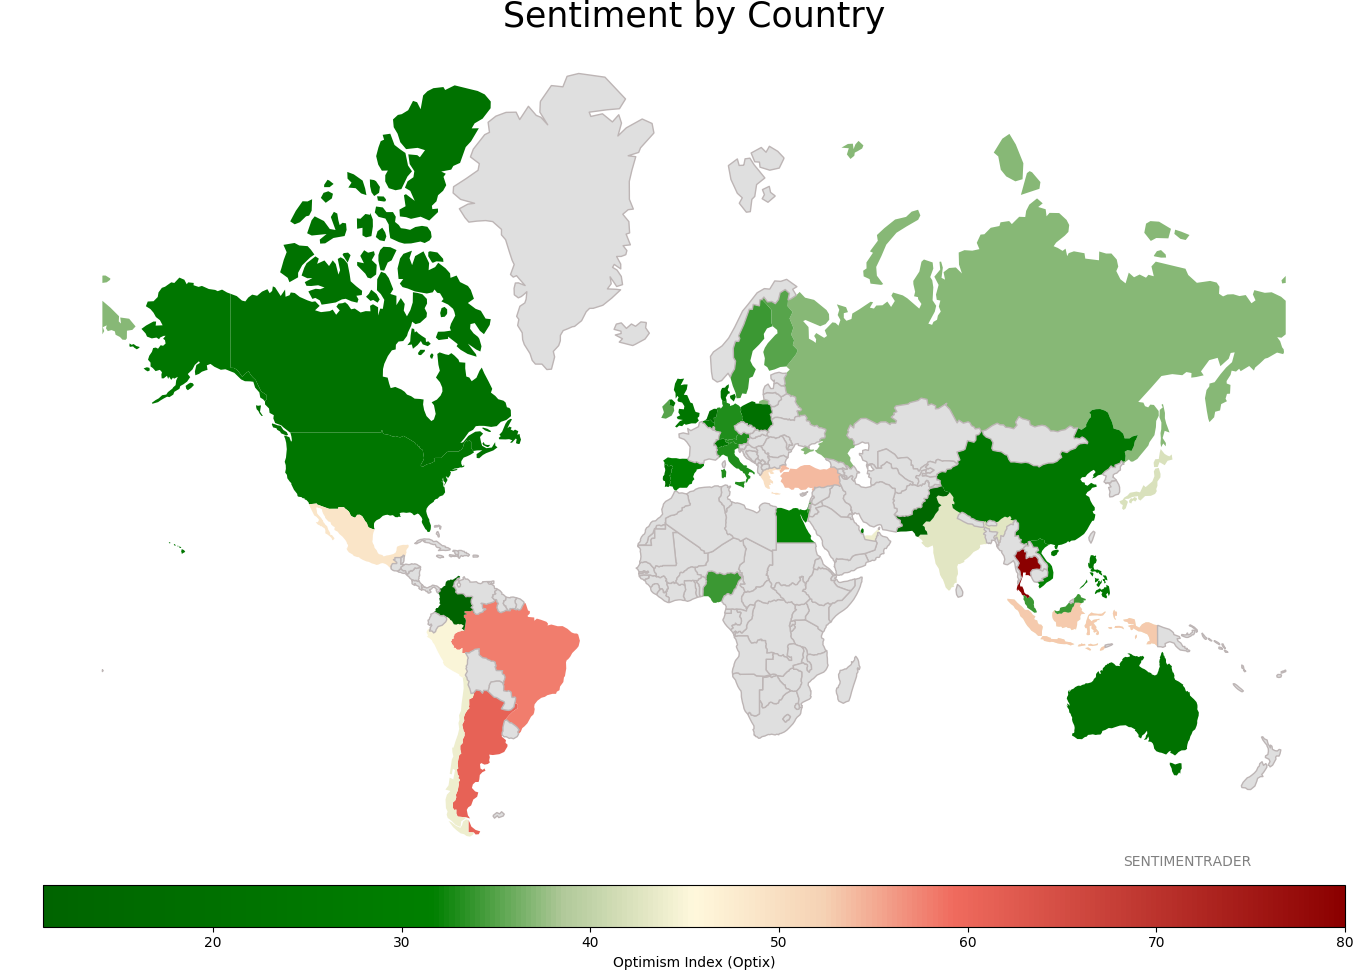
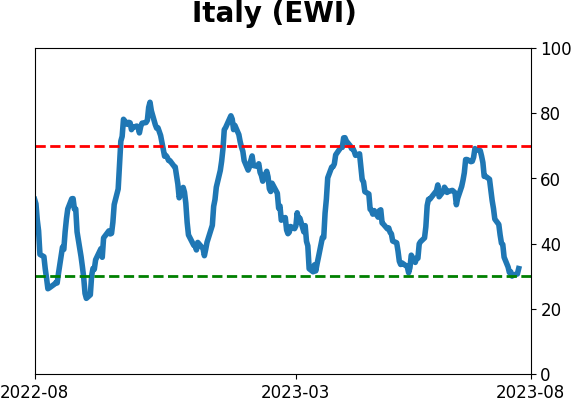
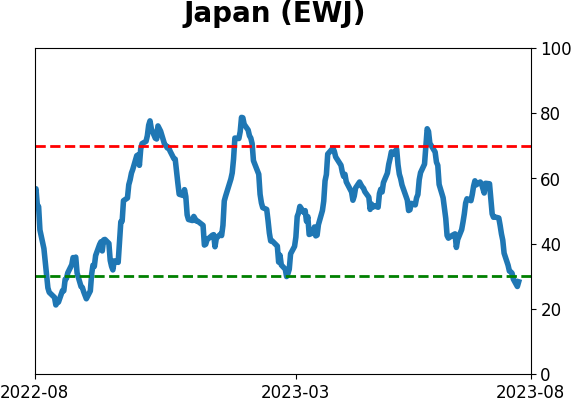
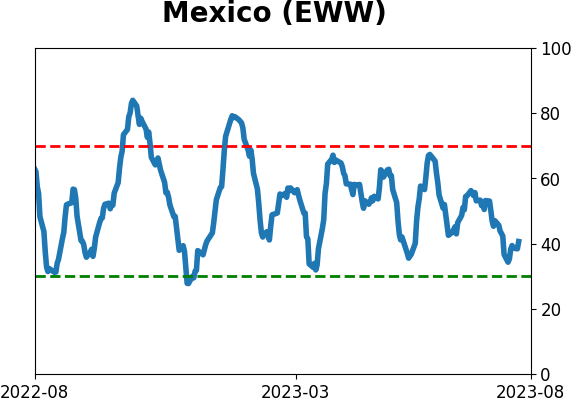
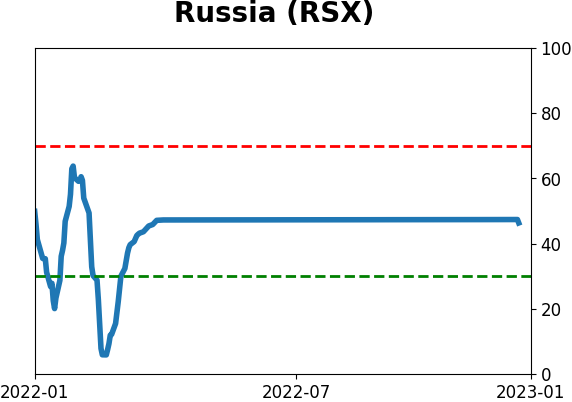
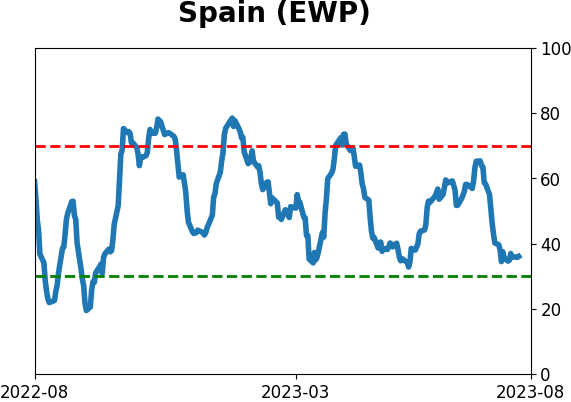
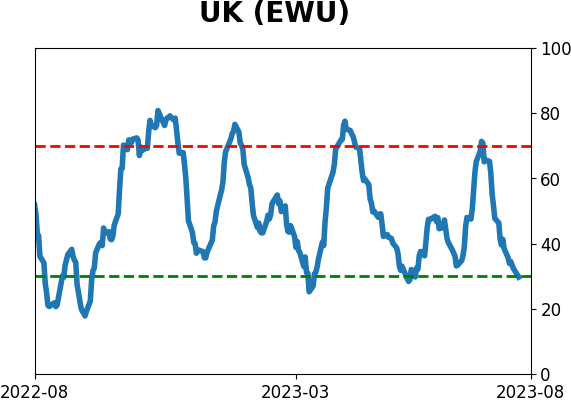
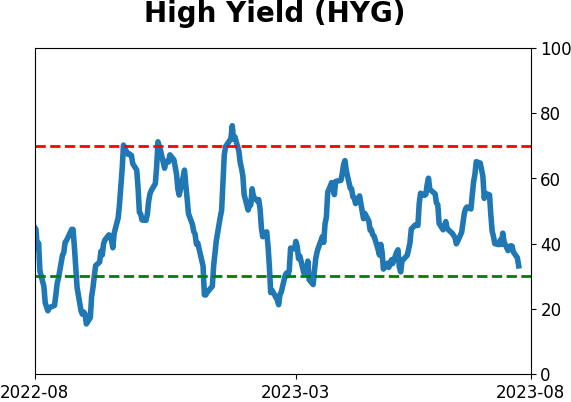
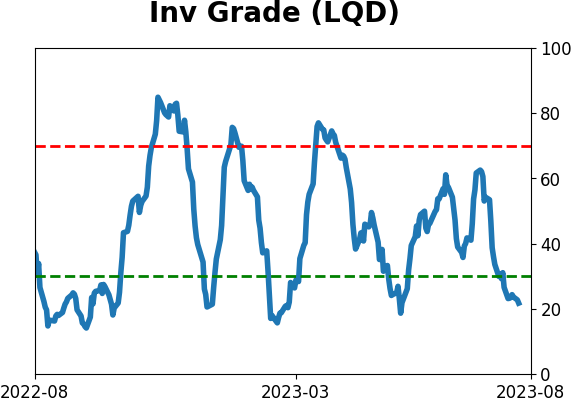
Sentiment Around The World
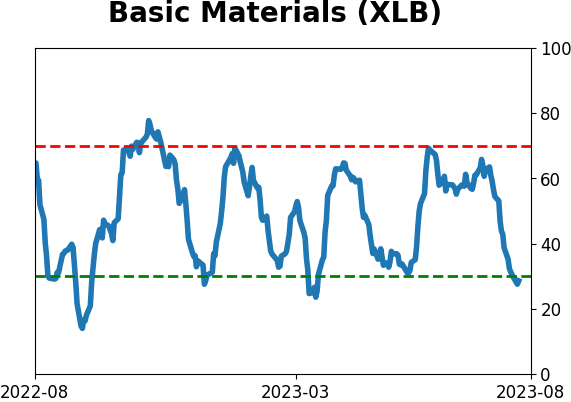
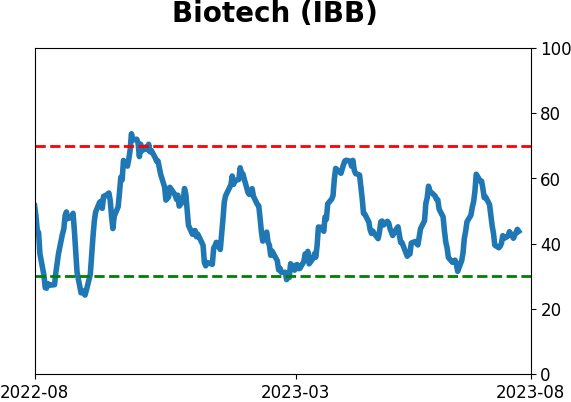
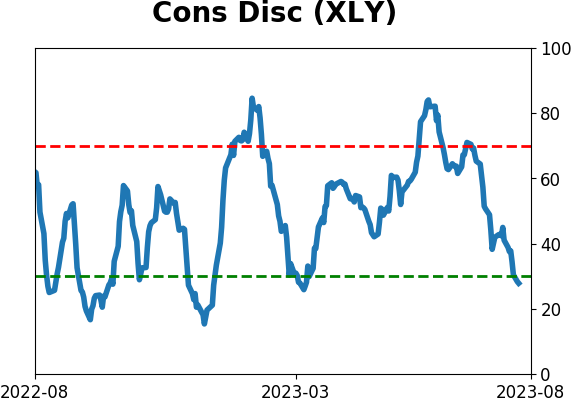
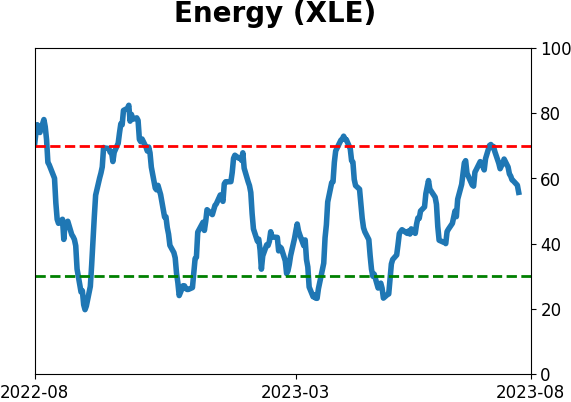
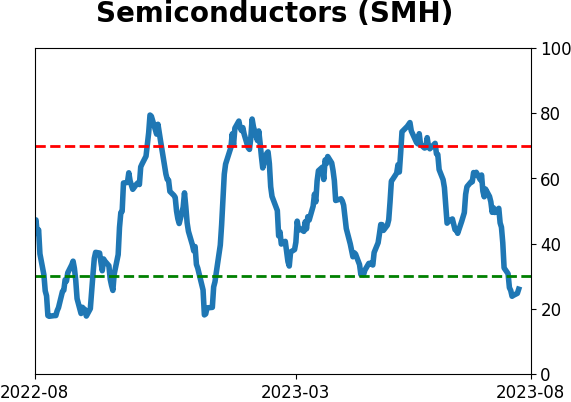
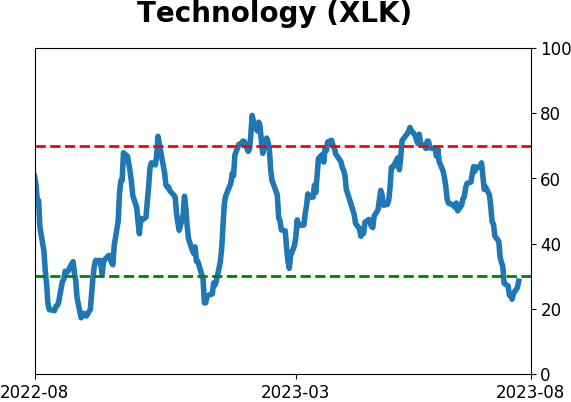
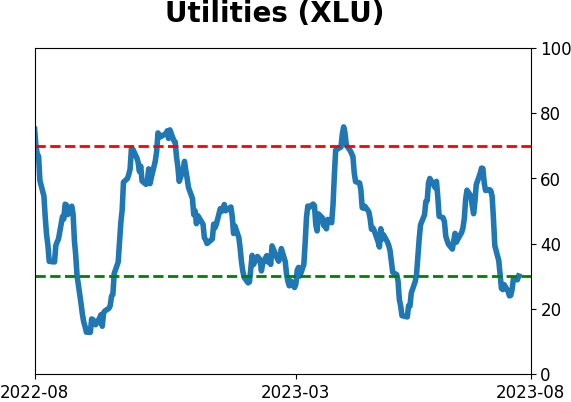
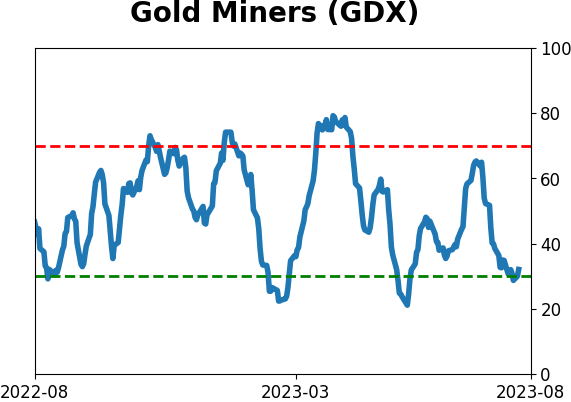
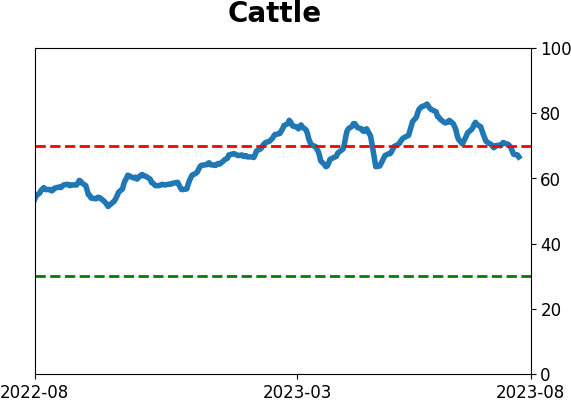
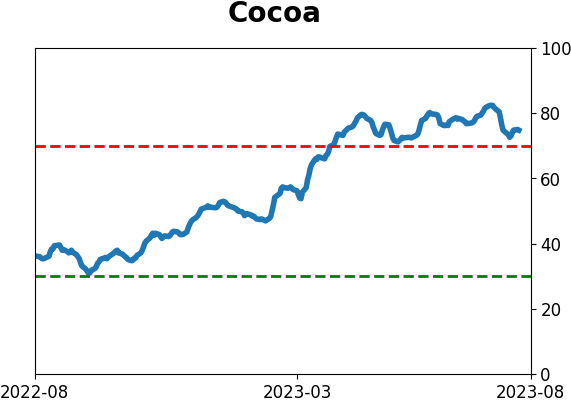
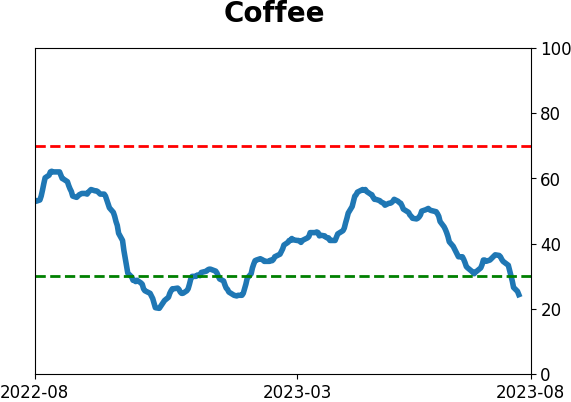
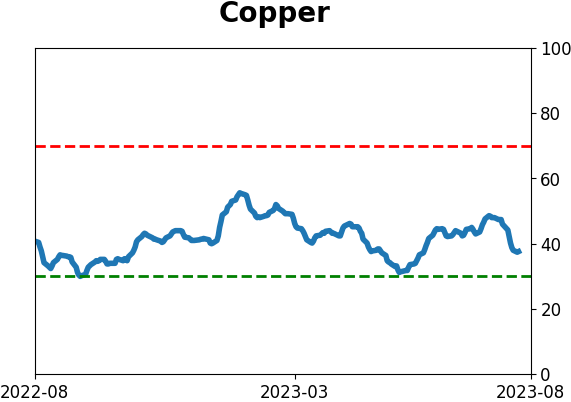
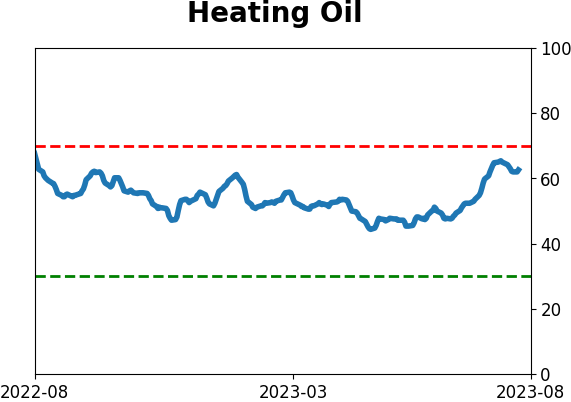
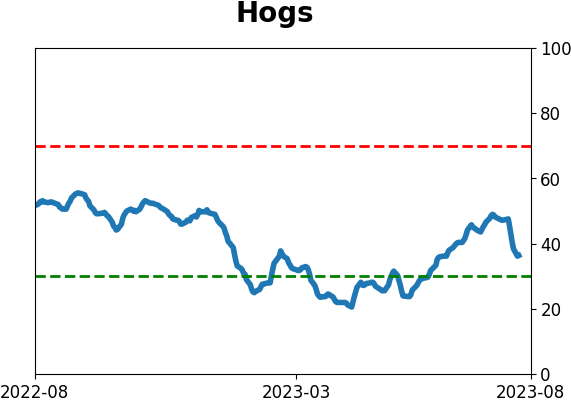
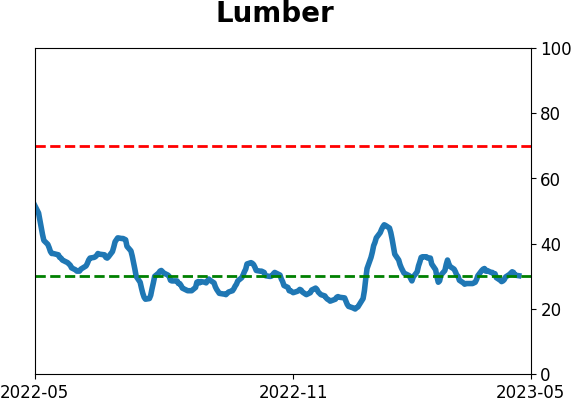
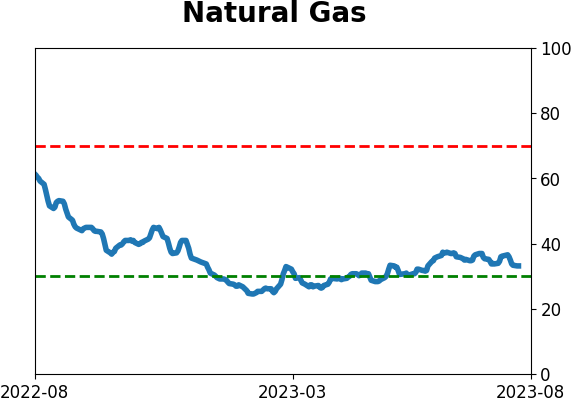
Optimism Index Thumbnails
|
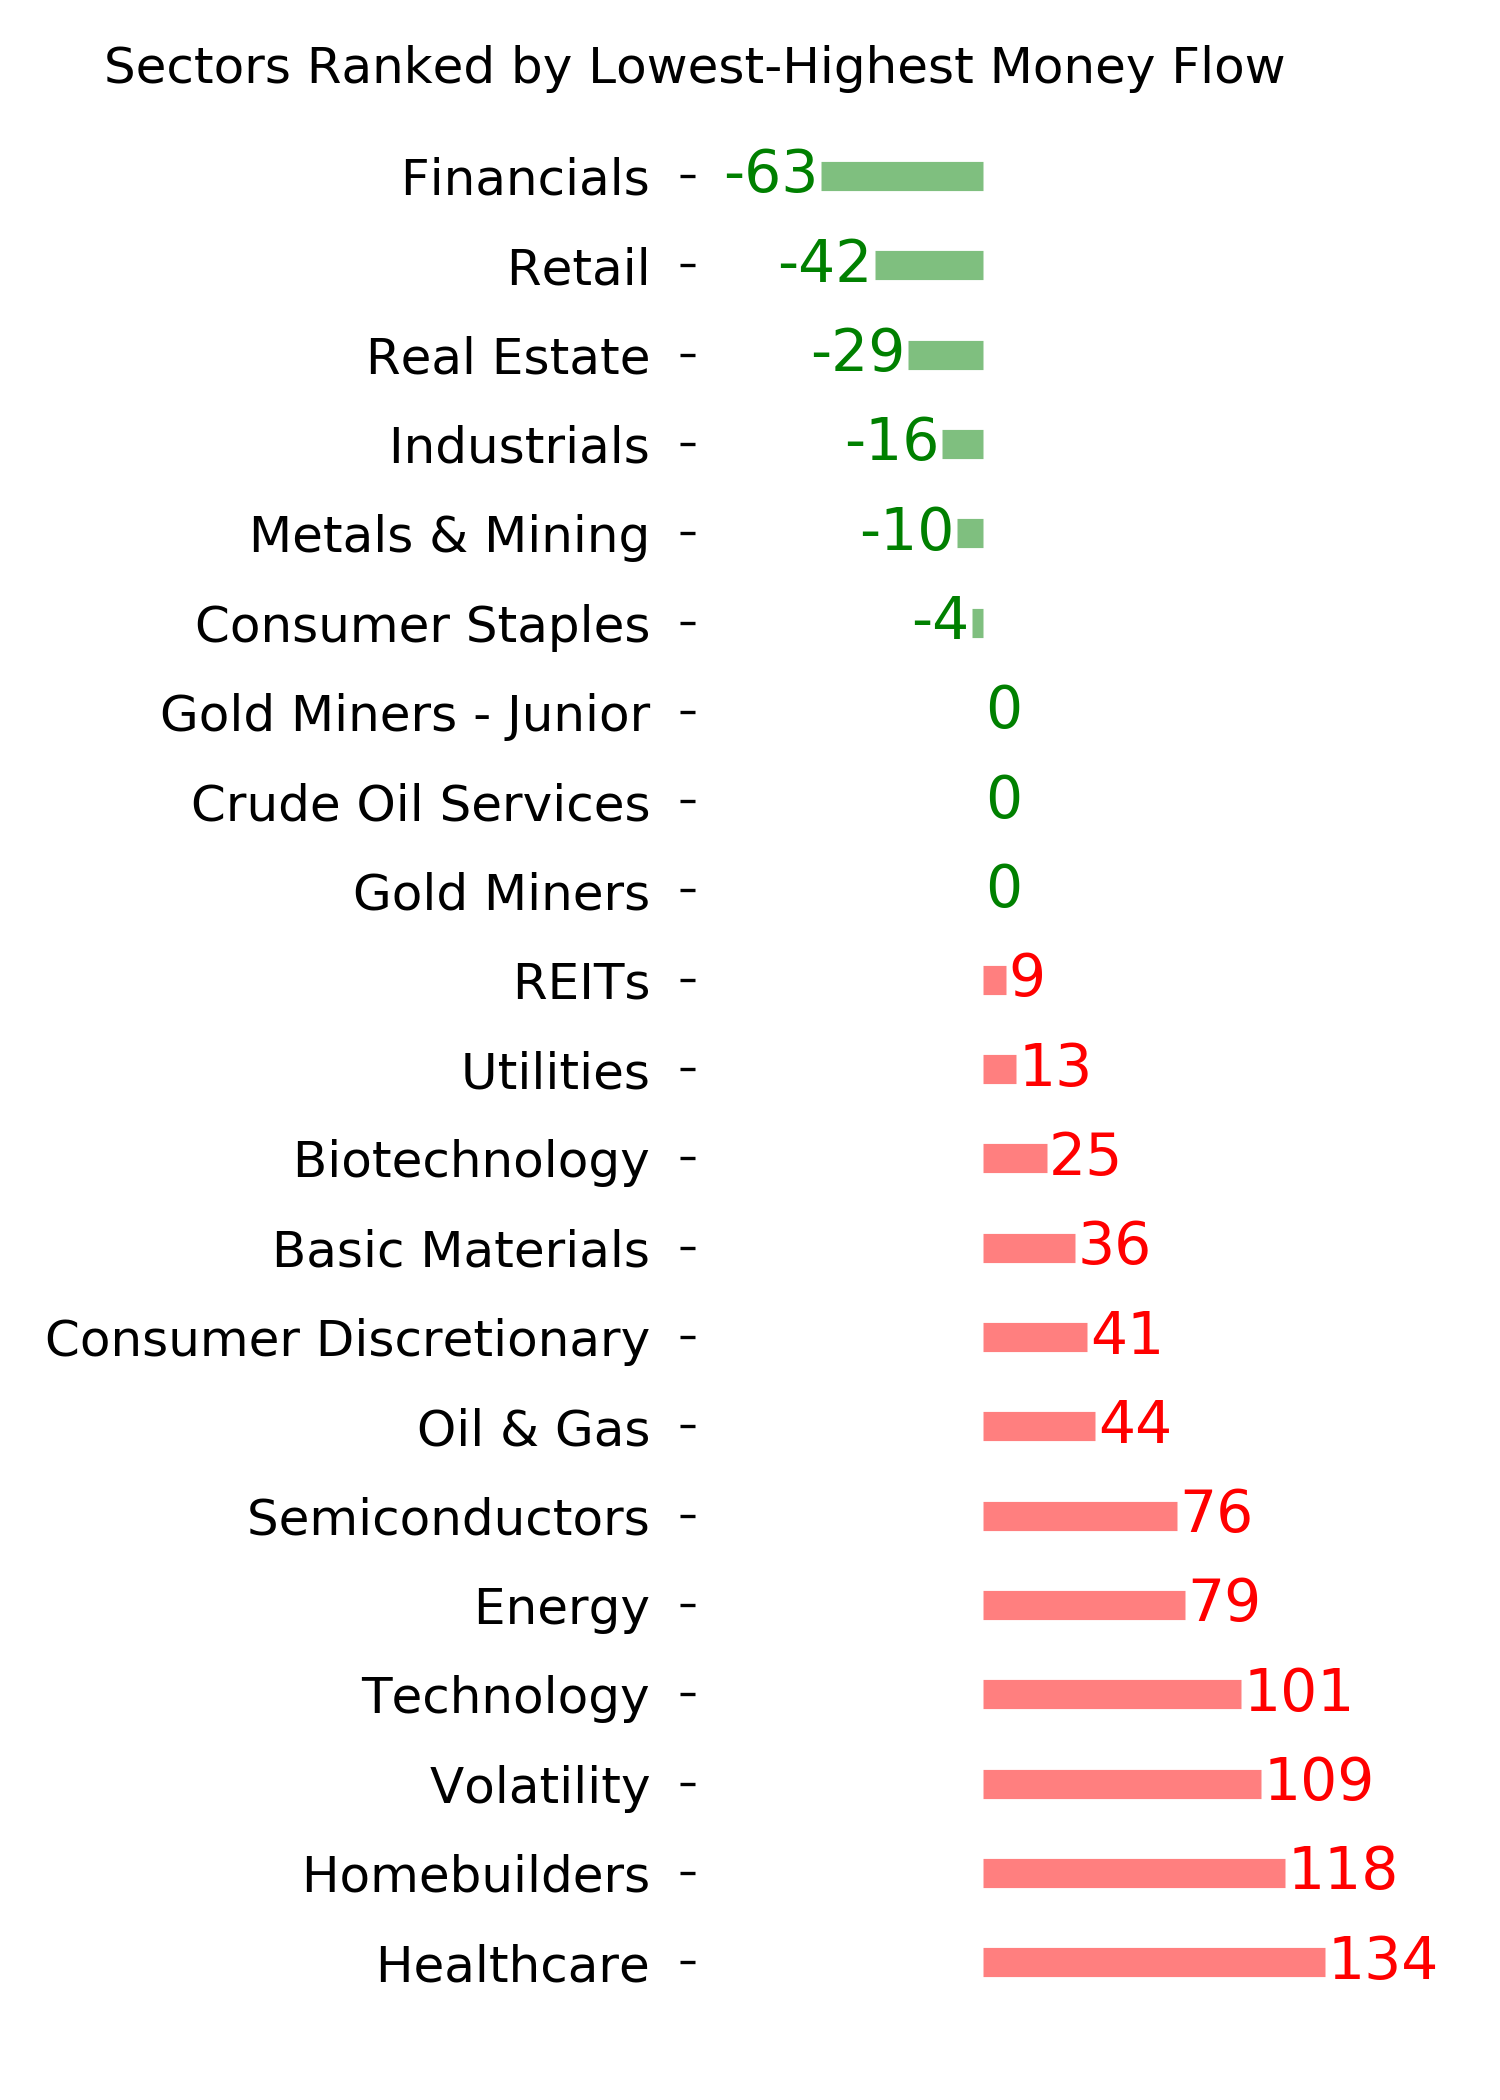
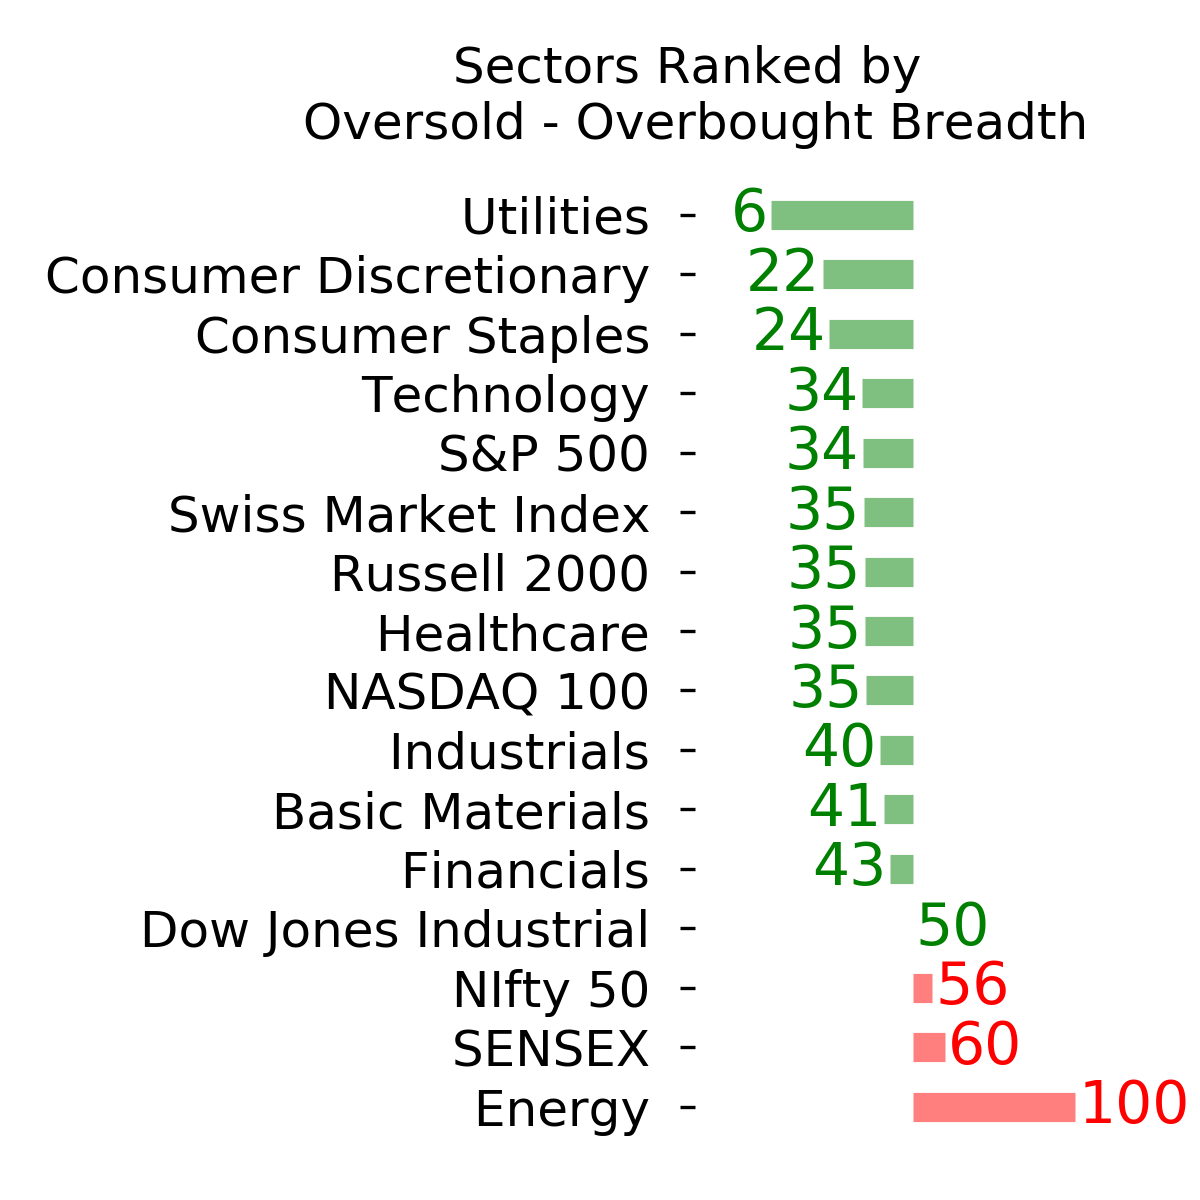
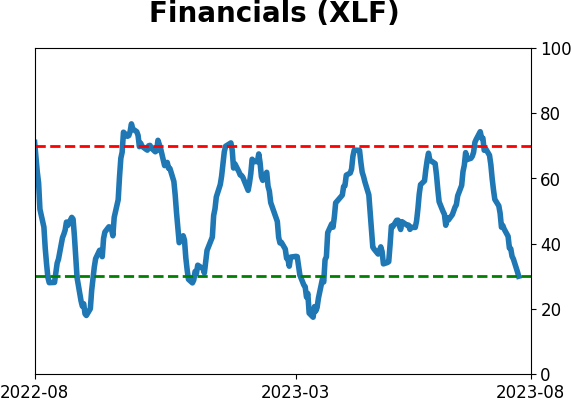
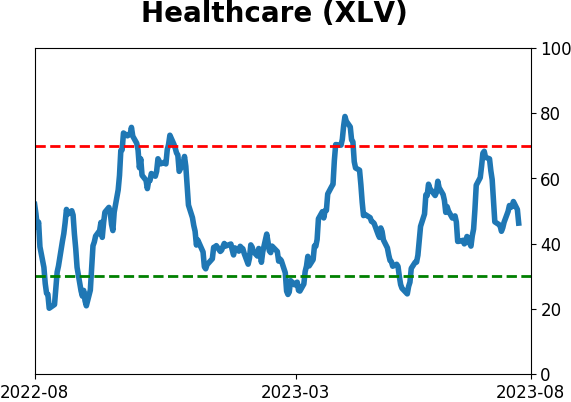
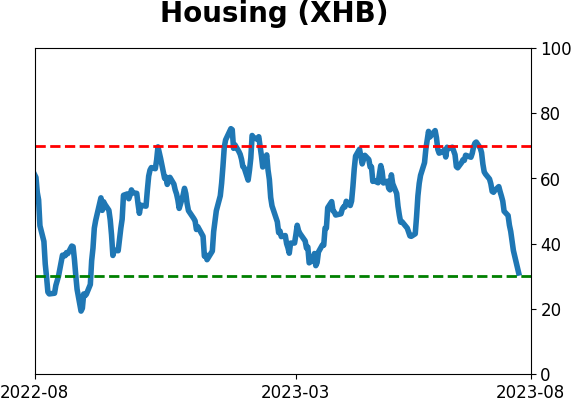
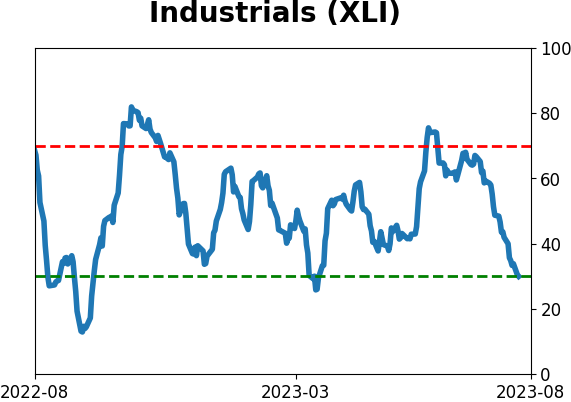
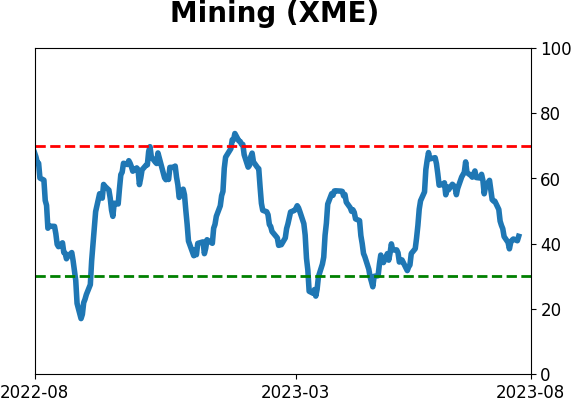
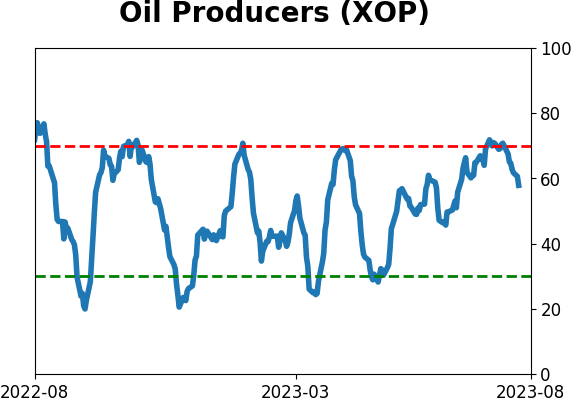
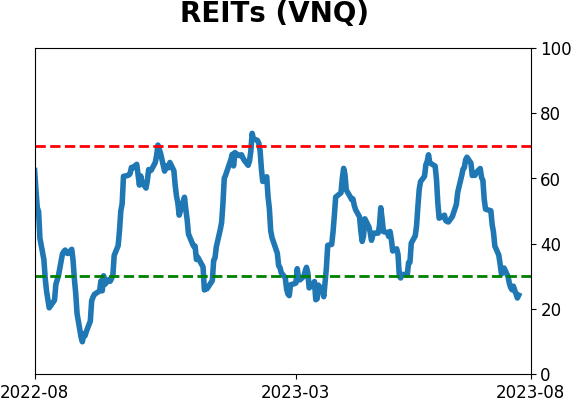
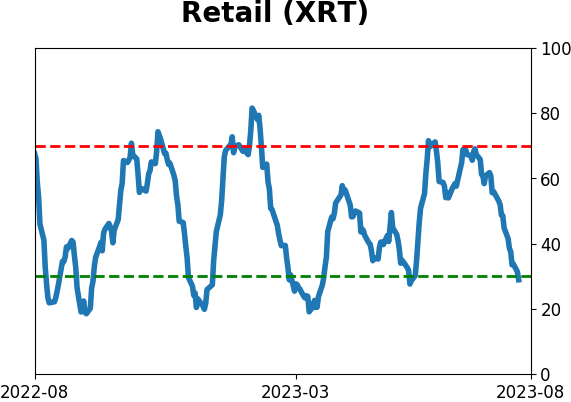
Sector ETF's - 10-Day Moving Average
|
|
|
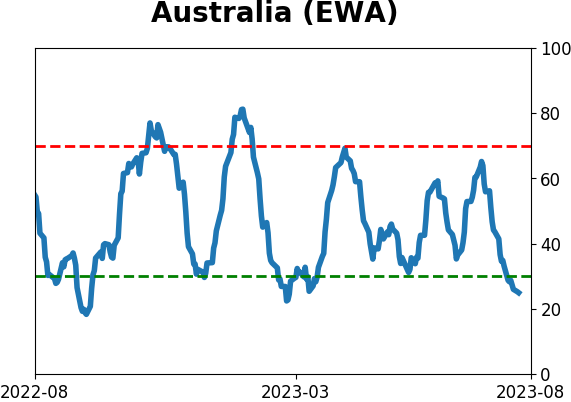
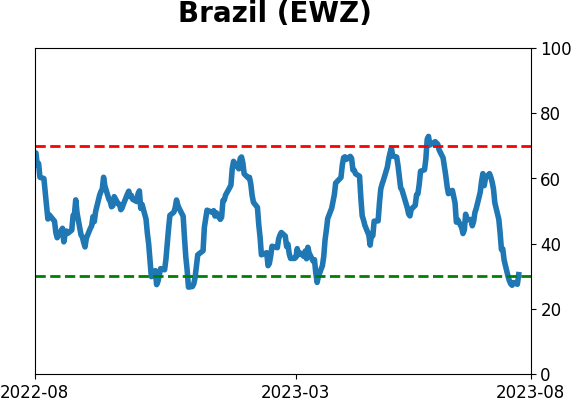
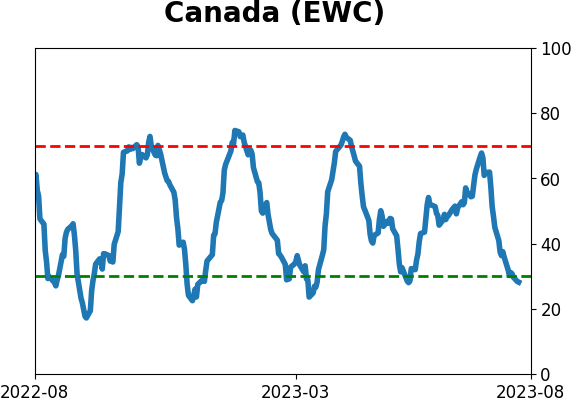
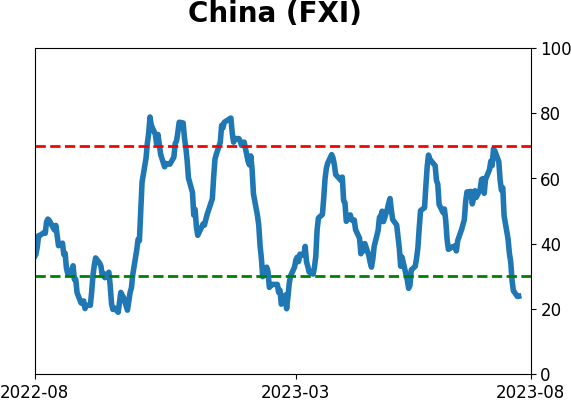
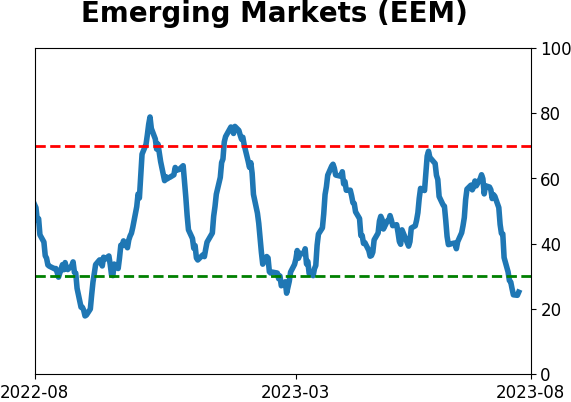
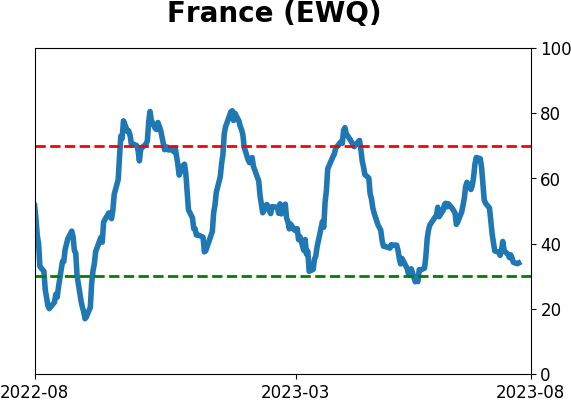
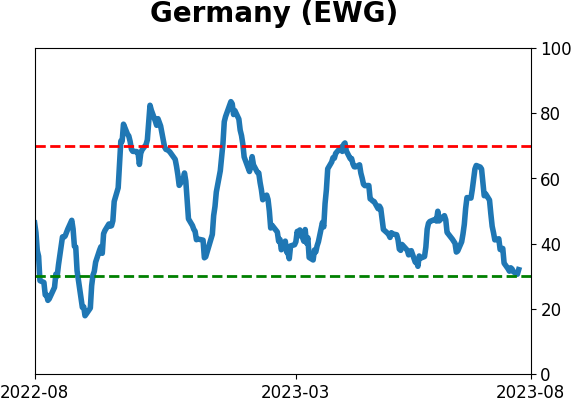
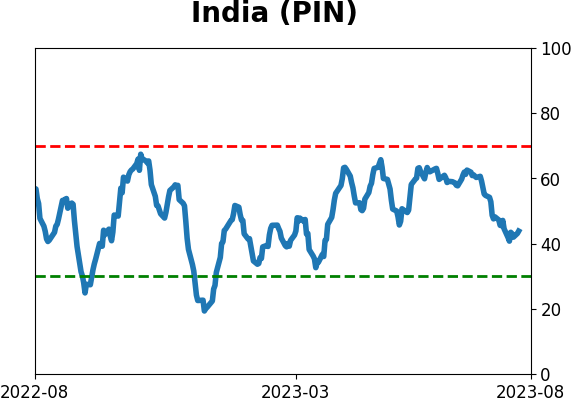
Country ETF's - 10-Day Moving Average
|
|
|
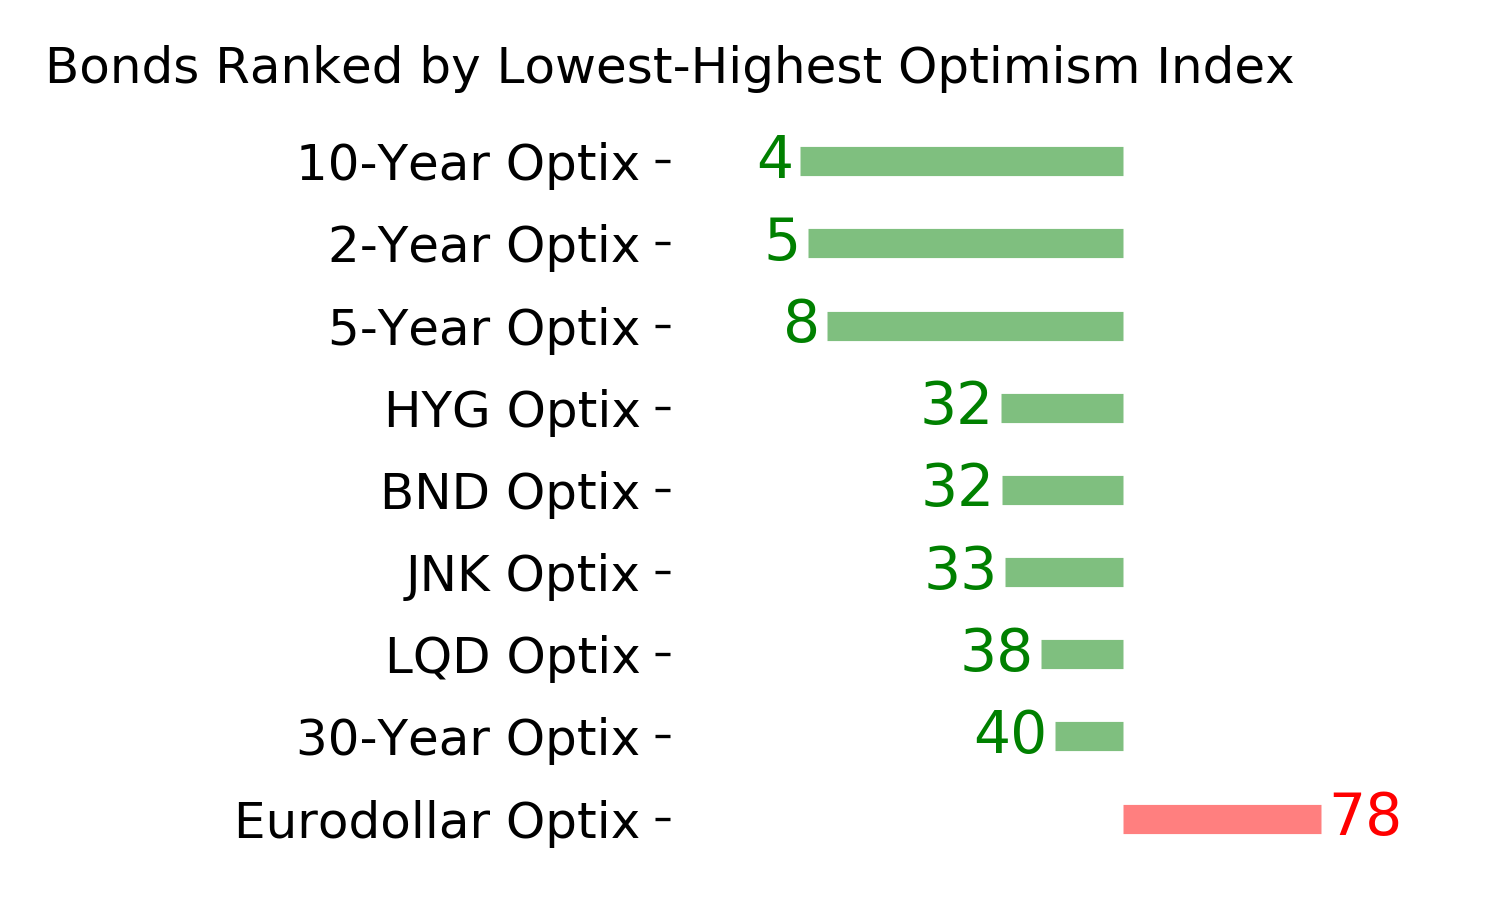
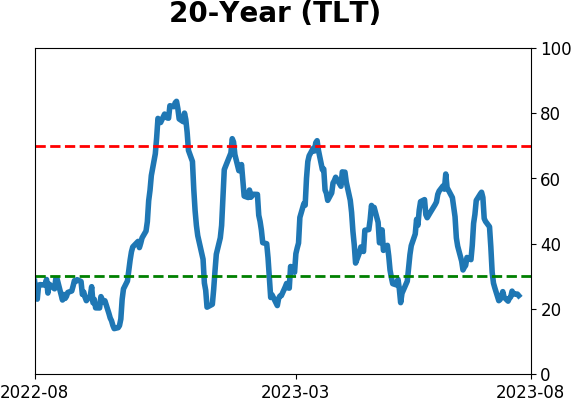
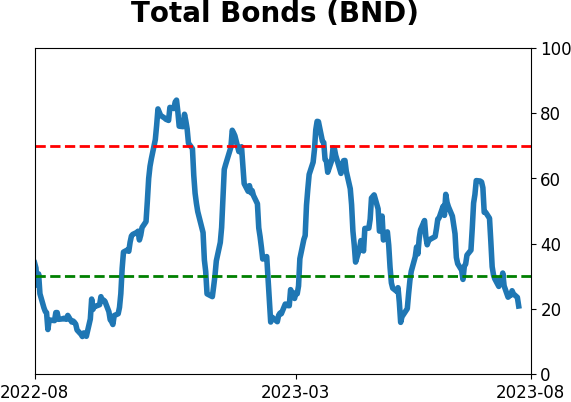
Bond ETF's - 10-Day Moving Average
|
|
|
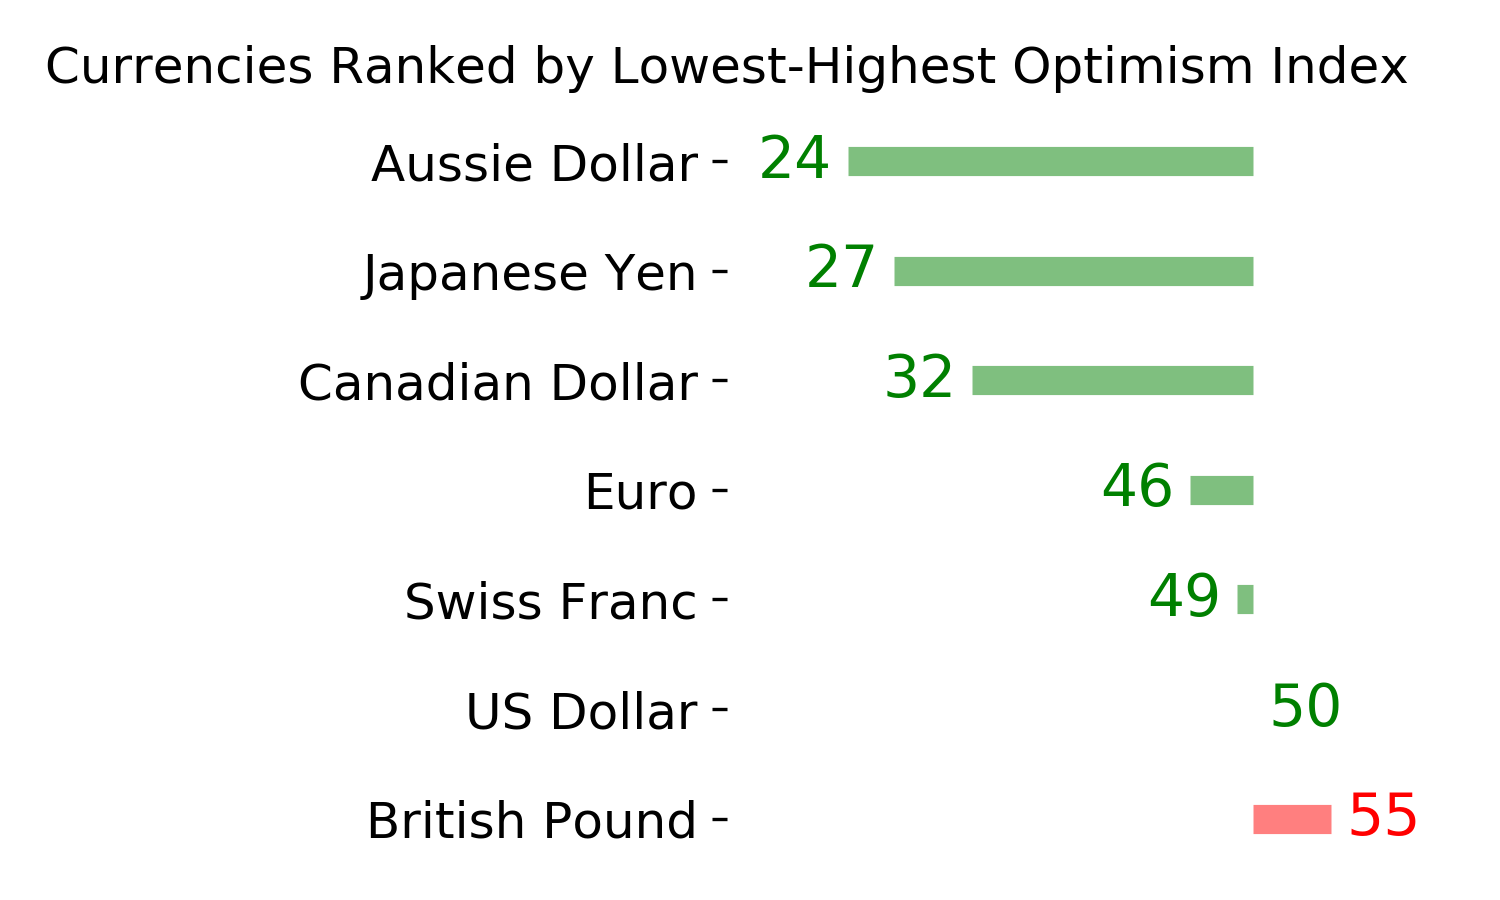
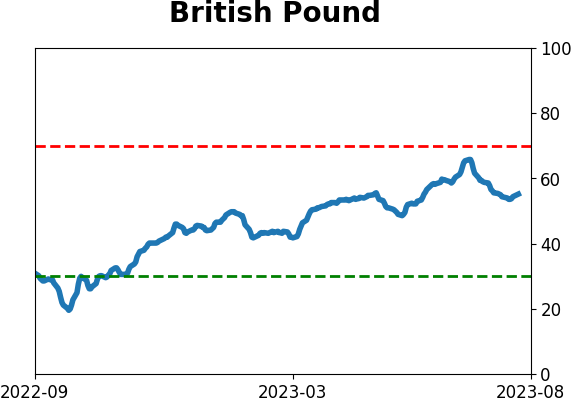
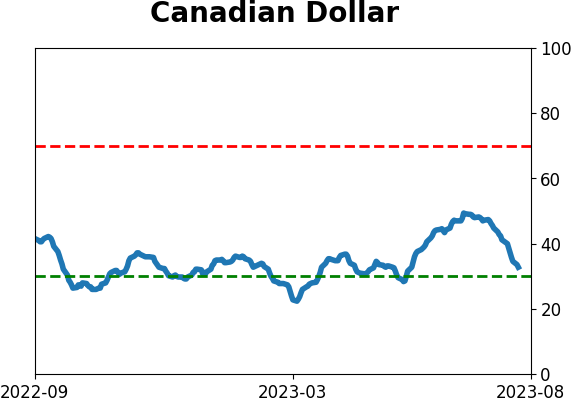
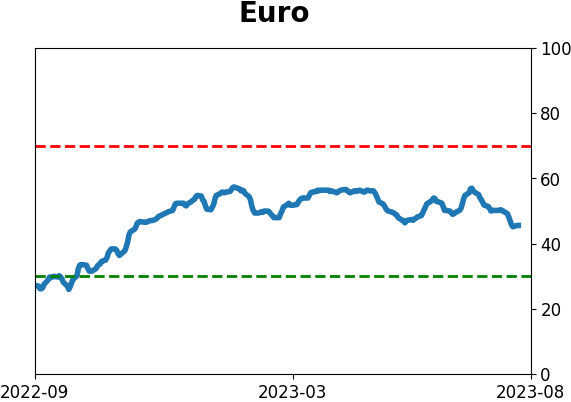
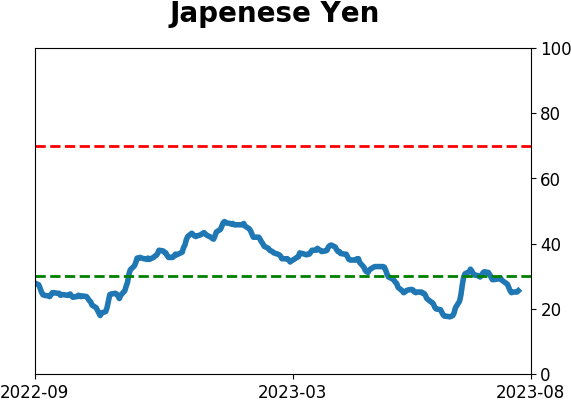
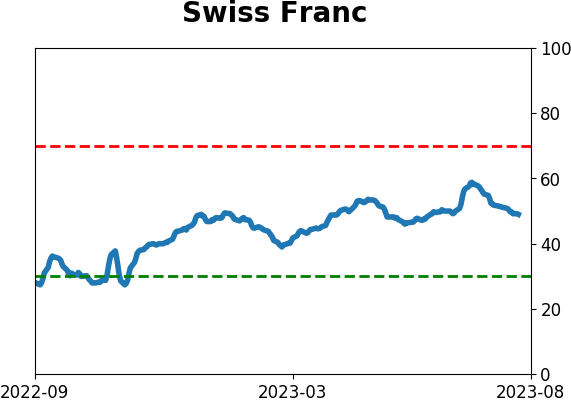
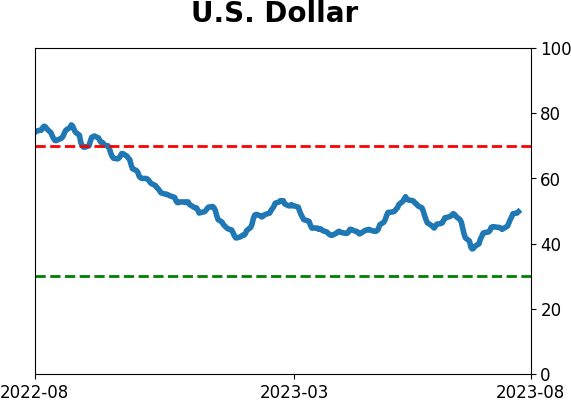
Currency ETF's - 5-Day Moving Average
|
|
|
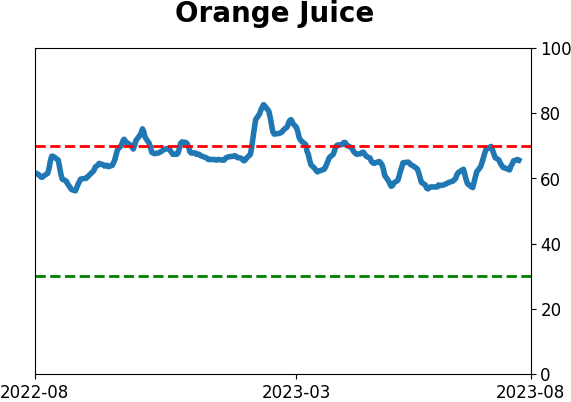
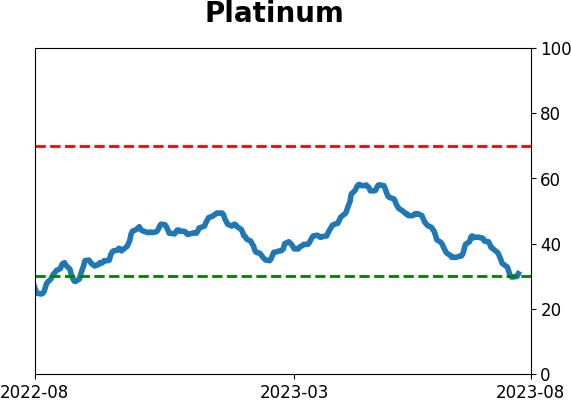
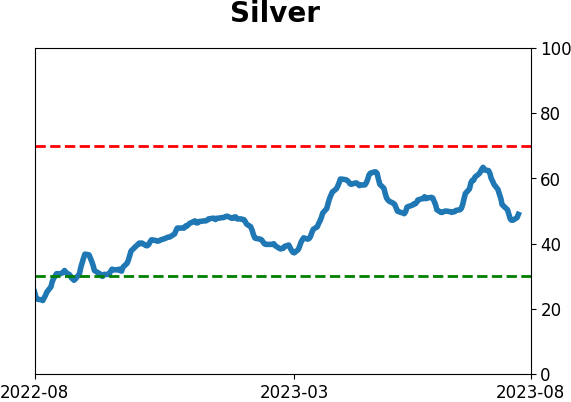
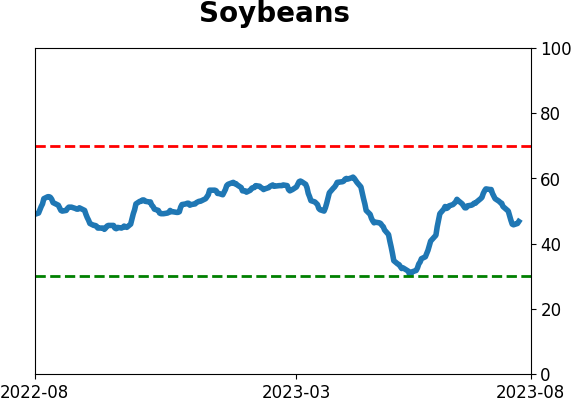
Commodity ETF's - 5-Day Moving Average
|
|