Headlines
|
|
During a down week, retail traders bought while pros sold:
Stocks declined last week but small options traders picked up their speculative activity, buying more calls and fewer puts. But large traders did exactly the opposite, buying fewer calls and more puts. Similar behavior during down weeks led to below-average returns for the S&P 500.
|
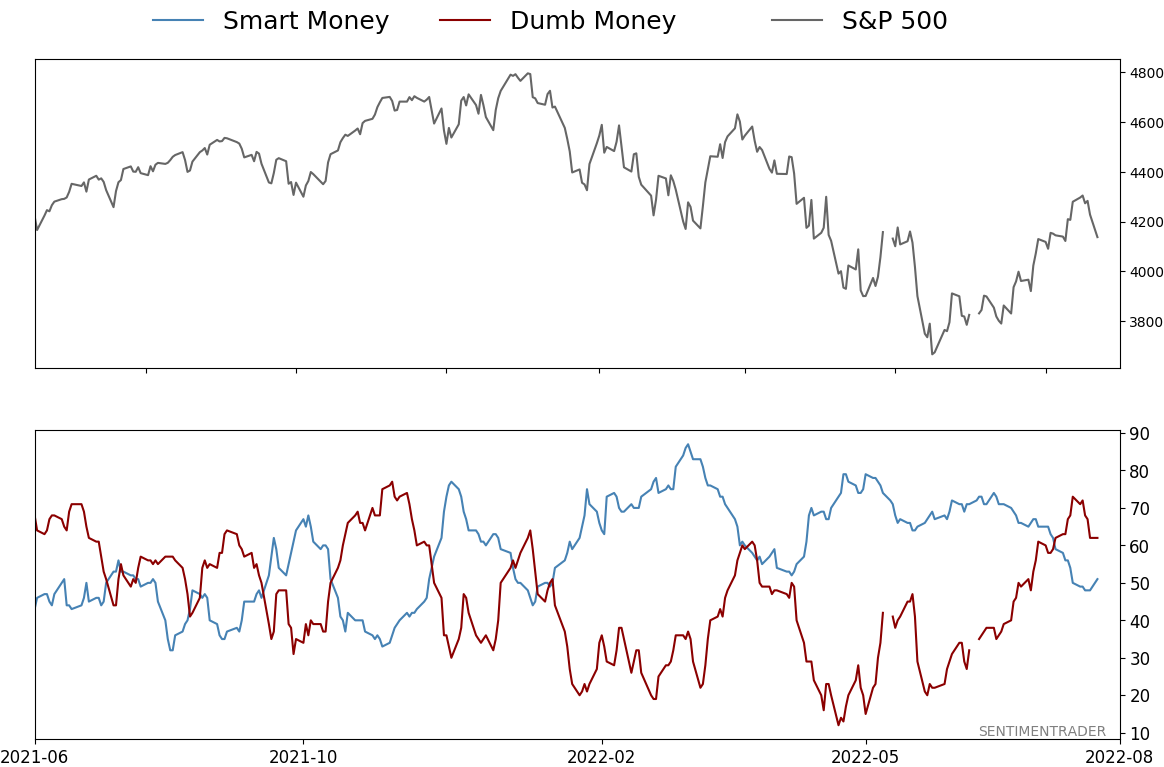
Smart / Dumb Money Confidence
|
Smart Money Confidence: 51%
Dumb Money Confidence: 62%
|
|
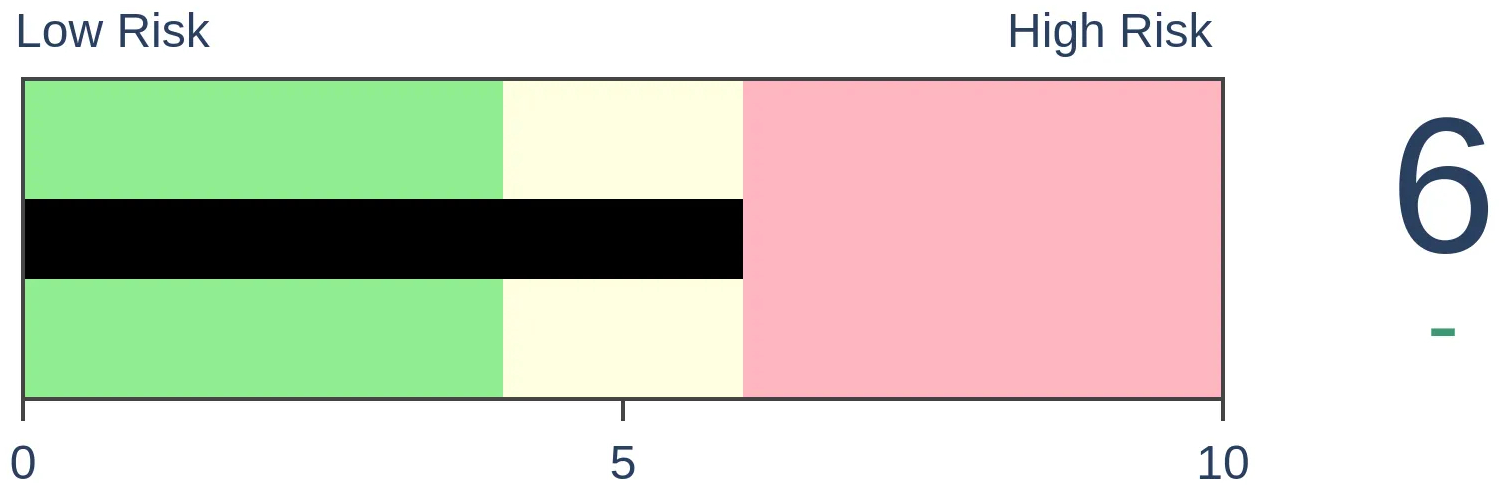
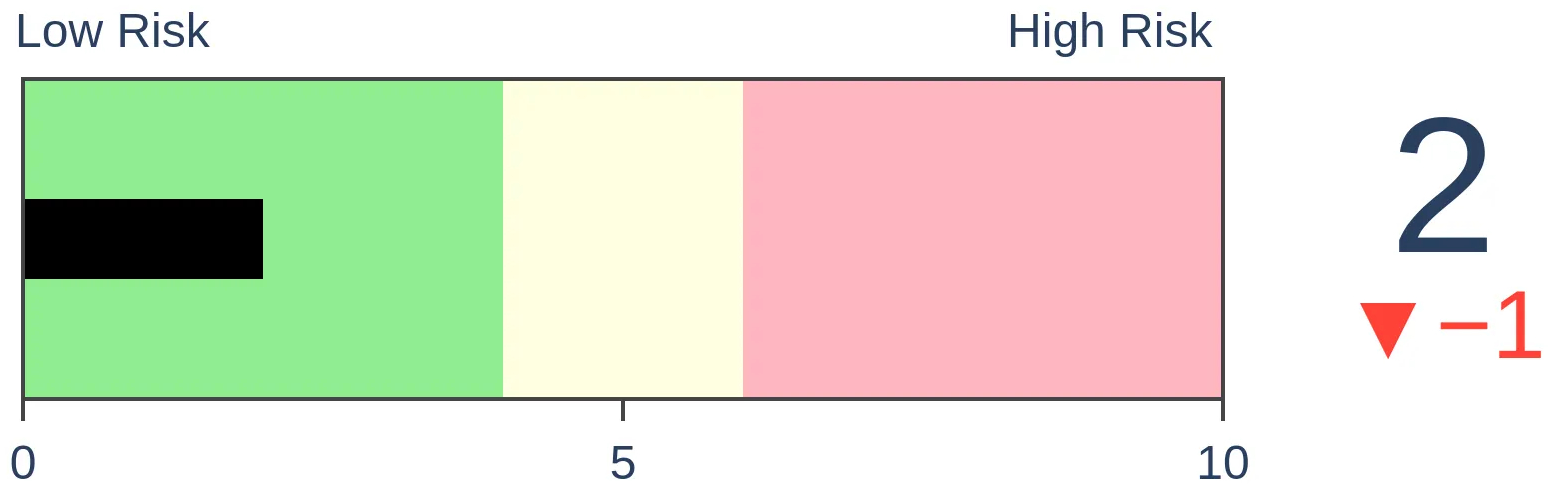
Risk Levels
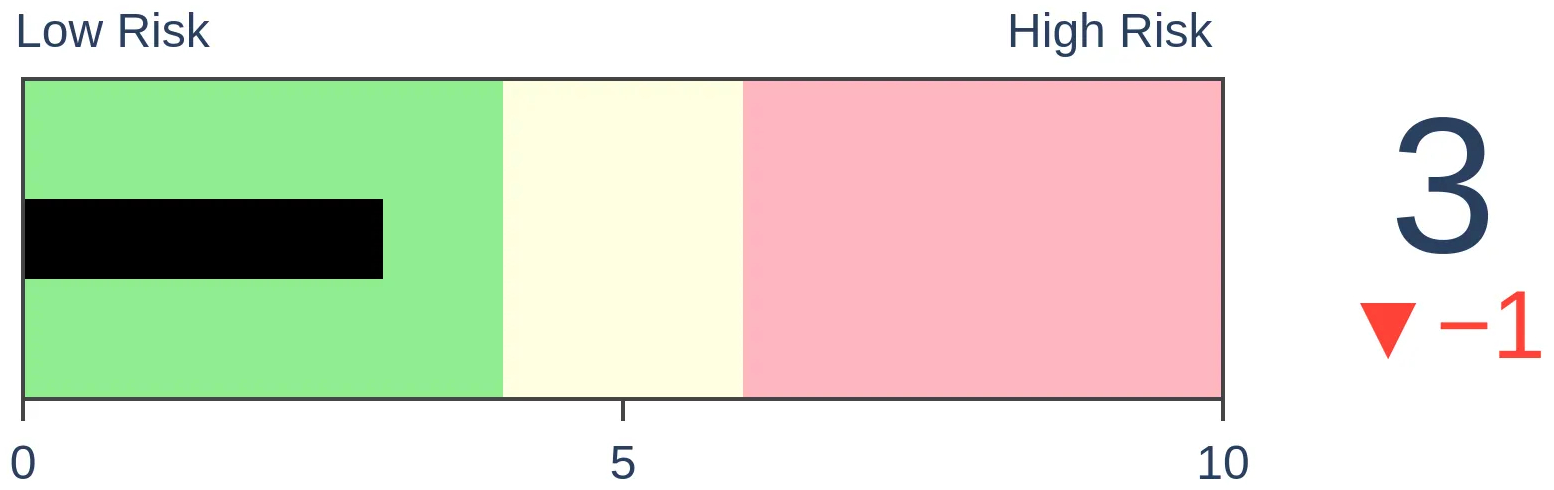
Stocks Short-Term

|
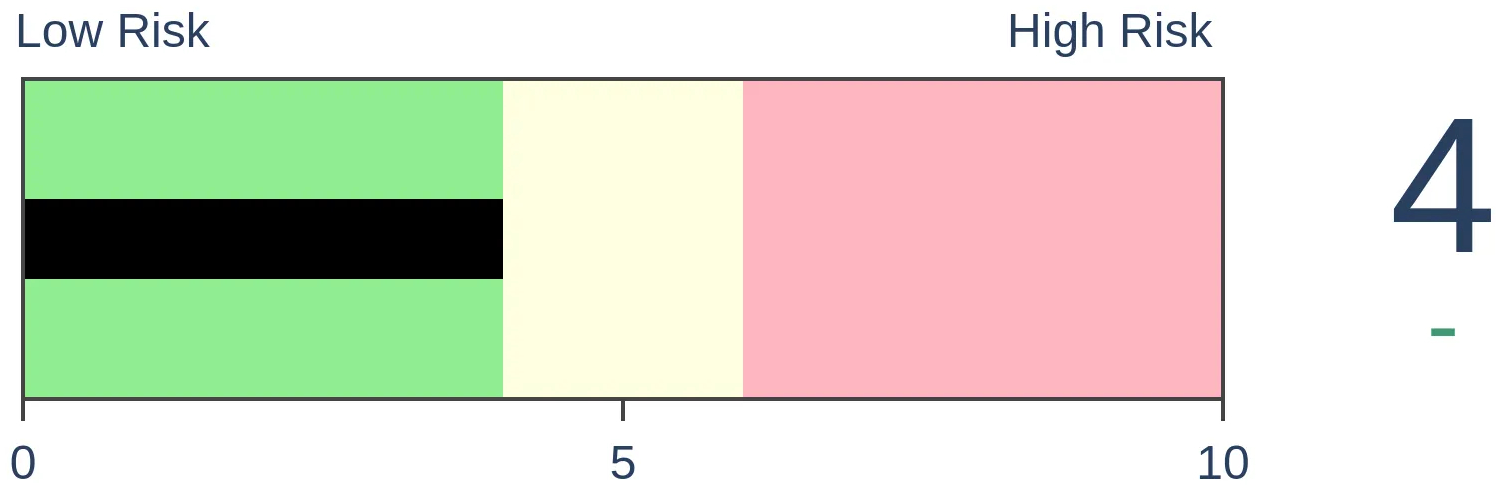
Stocks Medium-Term
|
|
Bonds
|
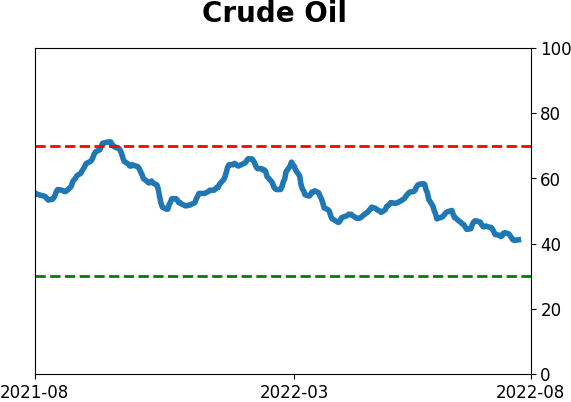
Crude Oil

|
|
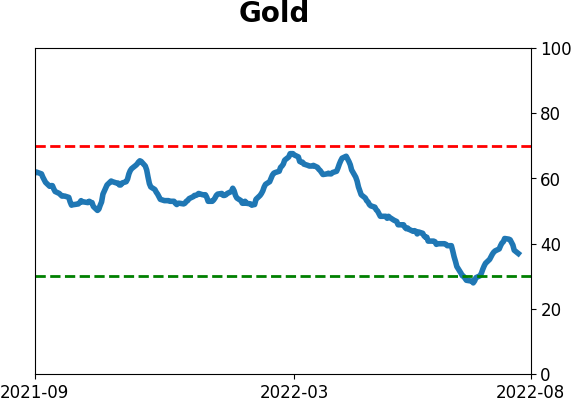
Gold
|
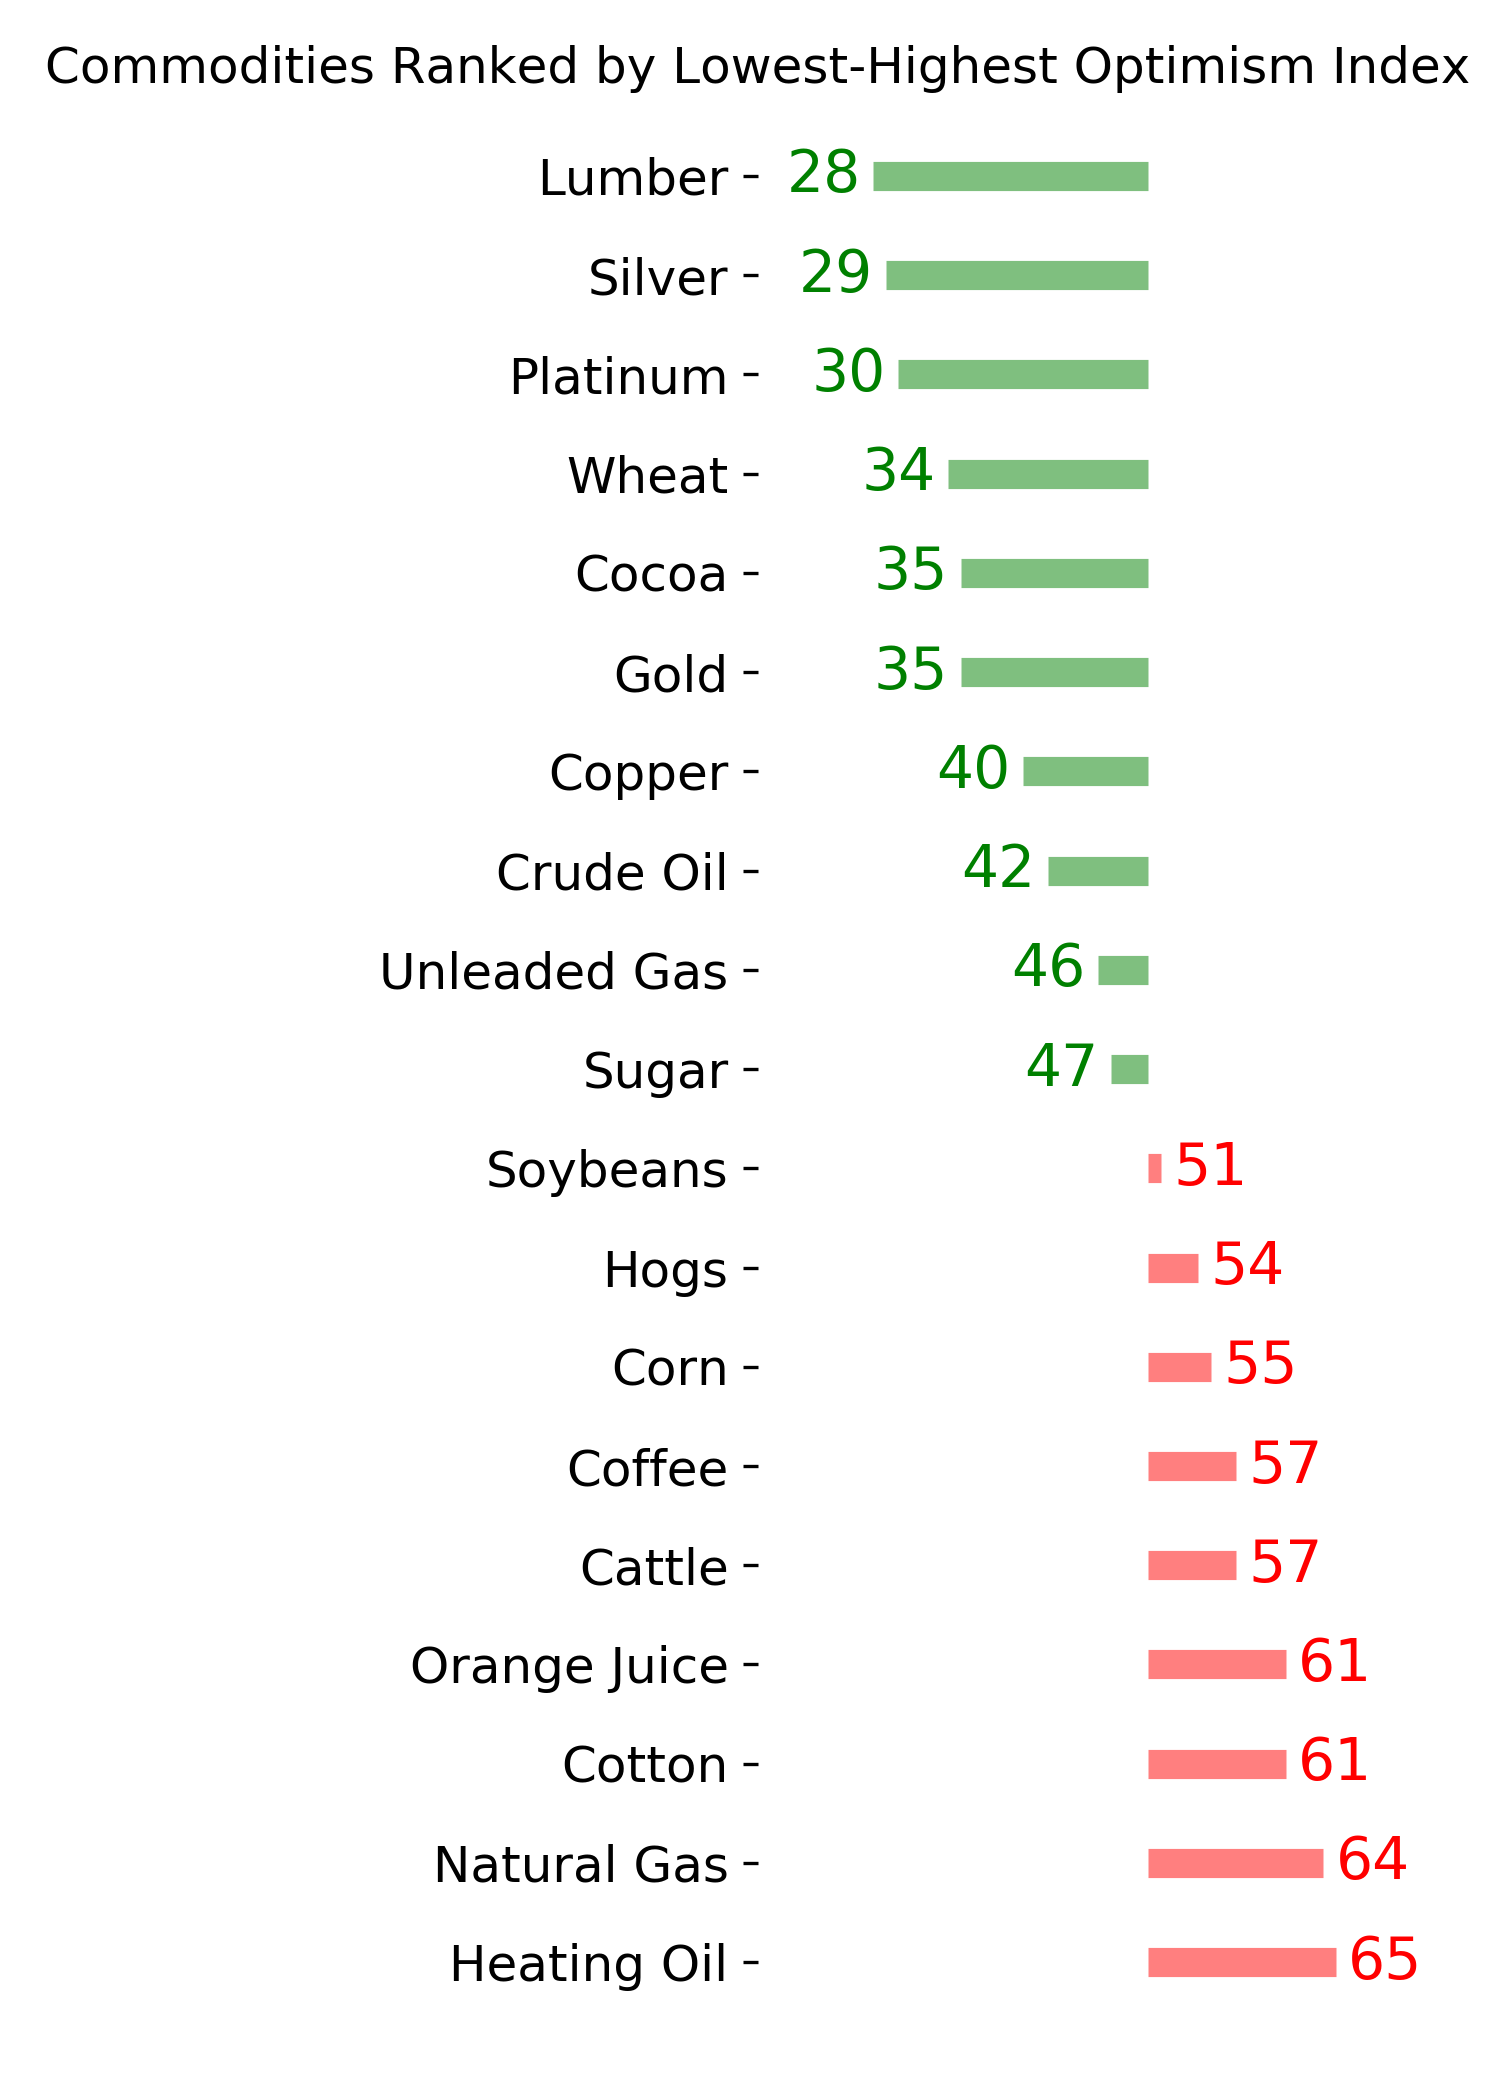
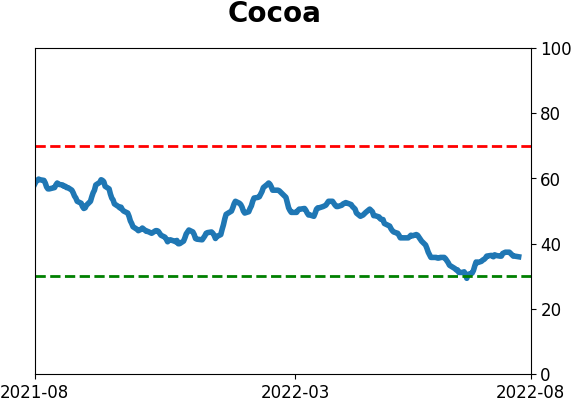
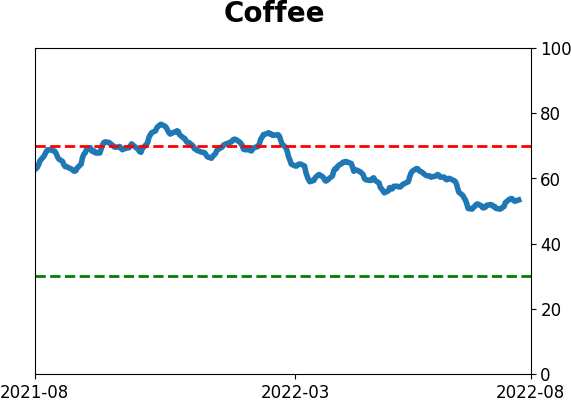
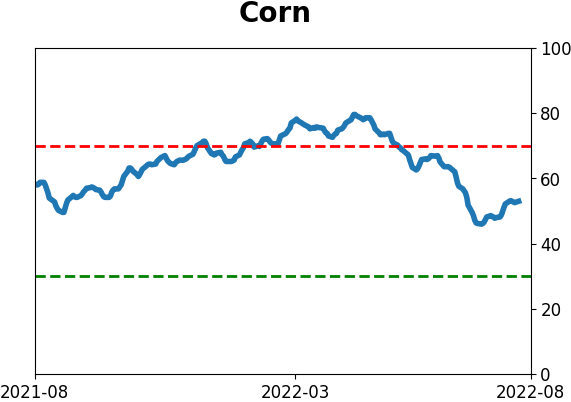
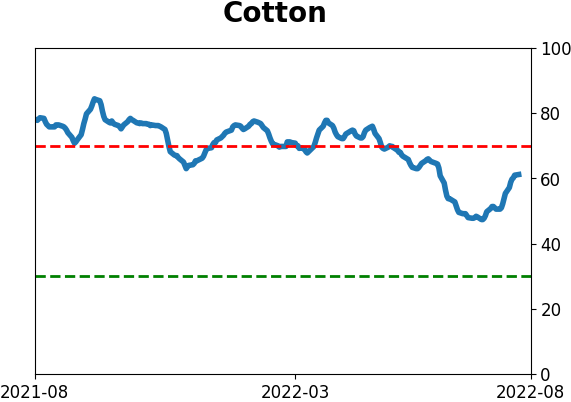
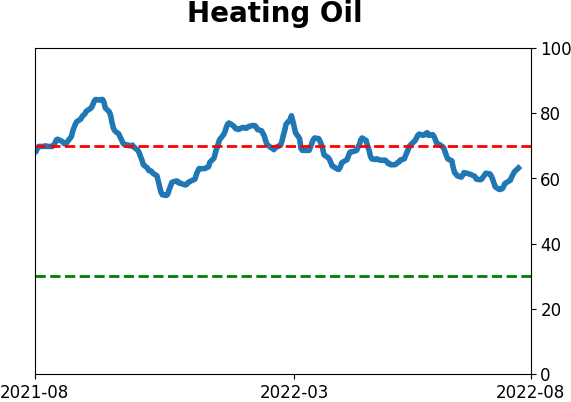
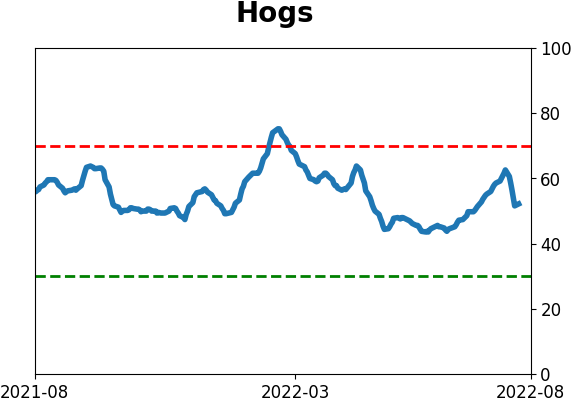
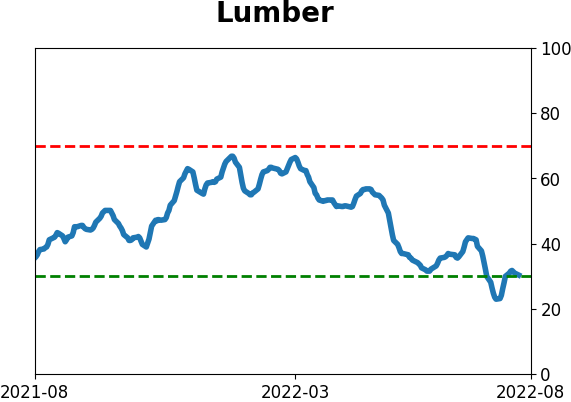
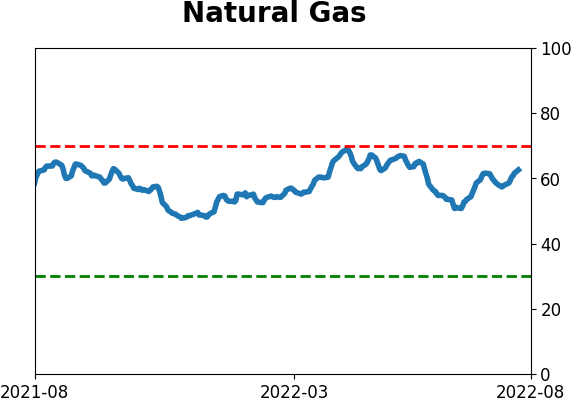
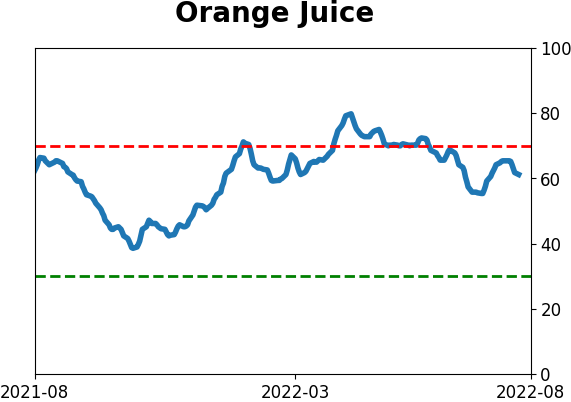
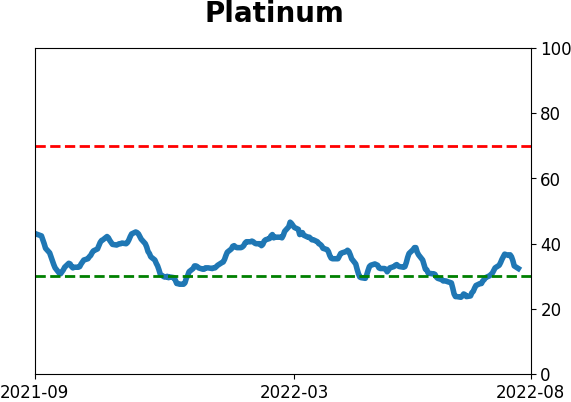
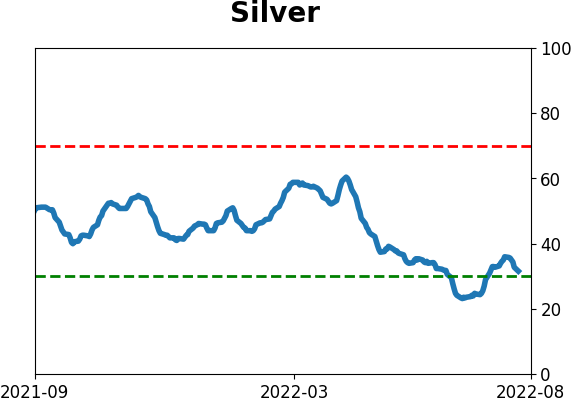
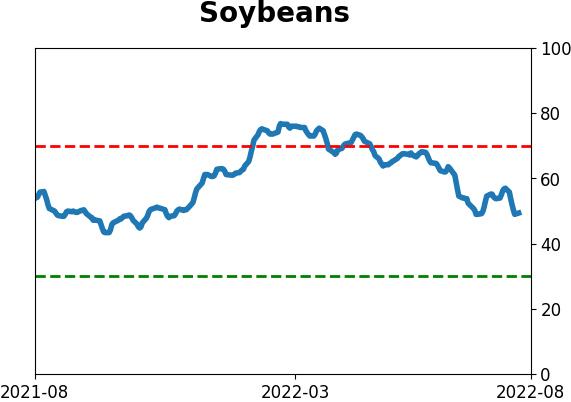
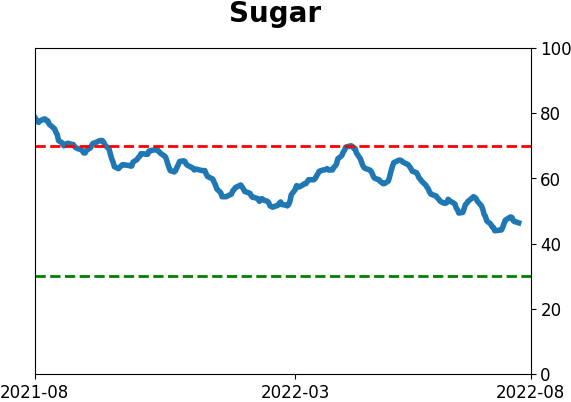
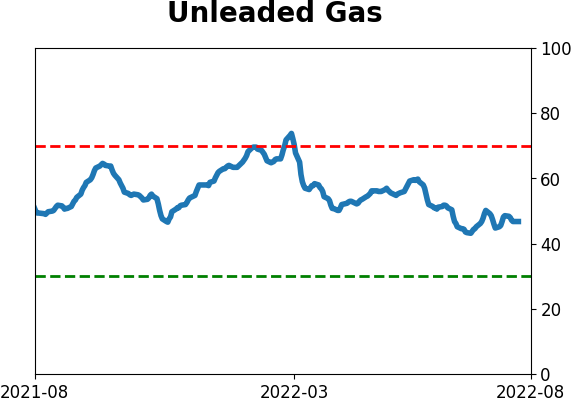
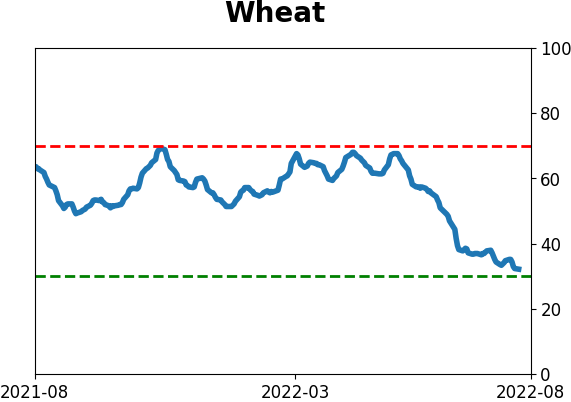
Agriculture
|
|
Research
By Jason Goepfert
BOTTOM LINE
Stocks declined last week but small options traders picked up their speculative activity, buying more calls and fewer puts. But large traders did exactly the opposite, buying fewer calls and more puts. Similar behavior during down weeks led to below-average returns for the S&P 500.
FORECAST / TIMEFRAME
None
|
Key points:
- Last week, stocks declined, but small options traders bought more calls and fewer puts
- Large traders behaved precisely the opposite, buying fewer calls and more puts
- The S&P 500 has performed worse when small traders buy speculative options into a decline
During a down week, small traders bought and large ones sold
Stocks suffered their first weekly loss in a month last week. This was the first chance to buy the dip for small traders, and they did. Large traders, however, did the opposite.
At the risk of reading too much into a single set of indicators, which we're in danger of doing here, last week's behavior in the options market was a bit troubling. As stocks dropped, the smallest options traders increased their call buying and reduced put buying; large traders did exactly the inverse.
As a result, the ROBO Put/Call Ratio, which reflects trades for ten contracts or fewer at a time, decreased. But the LOBO Put/Call Ratio, which reflects trades for fifty or more contracts, rose. The chart below shows how unusual this is. So far this year, sentiment among the two groups of traders has generally risen and declined together.
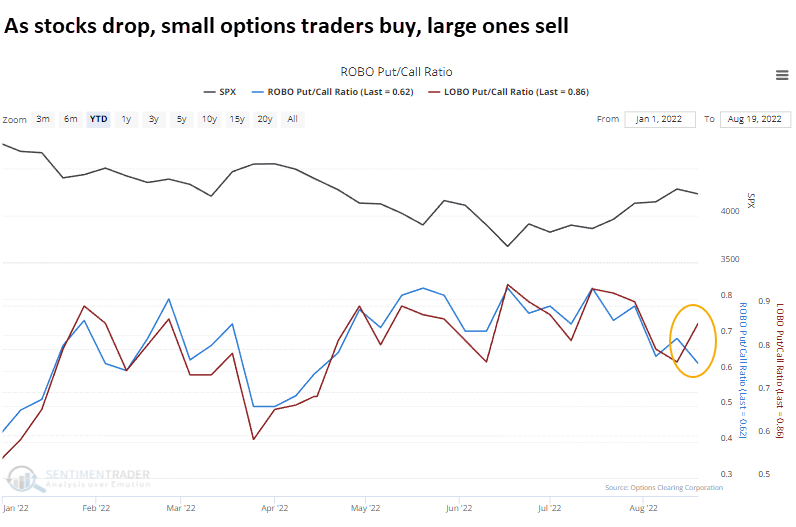
Again, there is a danger in reading too much into these traders' weekly behavioral shifts. The data have been more useful when they move to extremes, as they are consistent contrary indicators. But the options market has grown in importance over the past two years, and perhaps it pays to watch the market more closely than in years past.
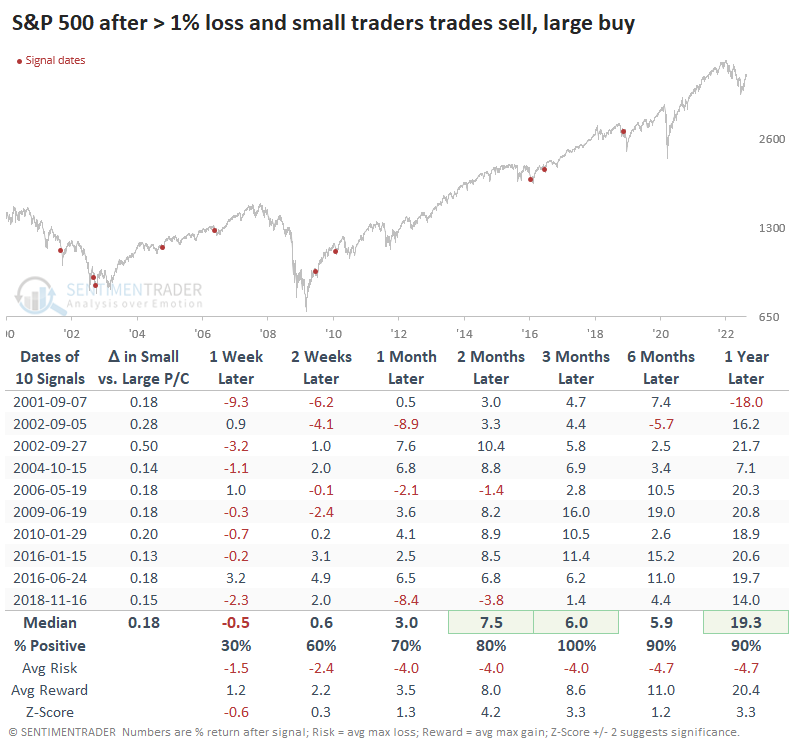
Better when small traders sell and large traders buy
We consider a week when the ROBO Ratio declined to be one when small traders were buying. That means they were buying more call options and/or fewer put options.
The table below shows S&P 500 returns after a week when it lost 1% or more, and the ROBO Ratio declined (small traders were buying) while the LOBO Ratio rose (large traders were selling).
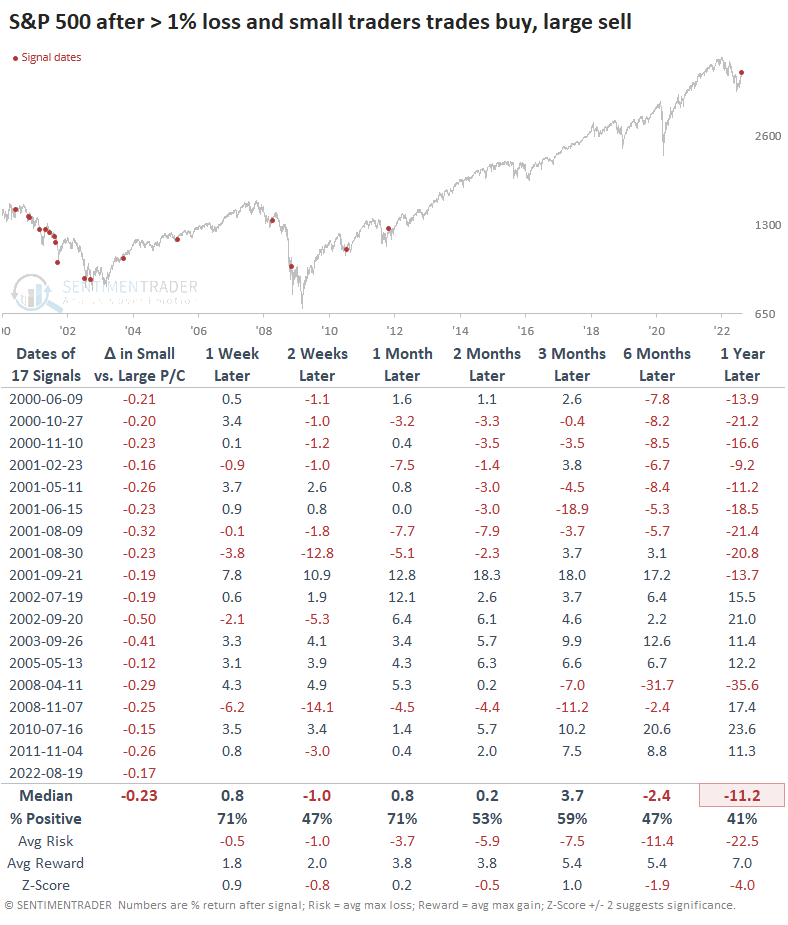
Overall, returns were fairly bad, especially over the medium- to long-term, thanks to most of this behavior triggering during the post-internet bubble meltdown. That's arguably our most historical comparison, given the speculative euphoria peaking in early 2021. But since then, returns were okay, other than a couple of signals in 2008.
There's not much to go on there, but here's the troubling part. We like to invert the studies to see if opposite conditions give opposite results. If so, we can be more confident in what the studies suggest.
And in this case, it's true. After a down week when small traders sold and large traders bought, the S&P performed very well in the months ahead. It's not something we often saw during the post-2000 meltdown.
What the research tells us...
We've spent a lot of time in recent weeks discussing why we're probably not seeing just a bear market rally. The build-up of a historic amount of pessimism, followed by a bevy of breadth thrusts and a significant retracement of the decline, all strongly argue against an immediate and sustained failure. The rejection of the most important index at its most important level is a worry because buyers haven't been interested after becoming greedy. Short-term losses aren't all that unusual after a push like the past month; if those losses continue to build in the week(s) ahead, we have to worry about the potential for a historic technical failure.
Indicators at Extremes
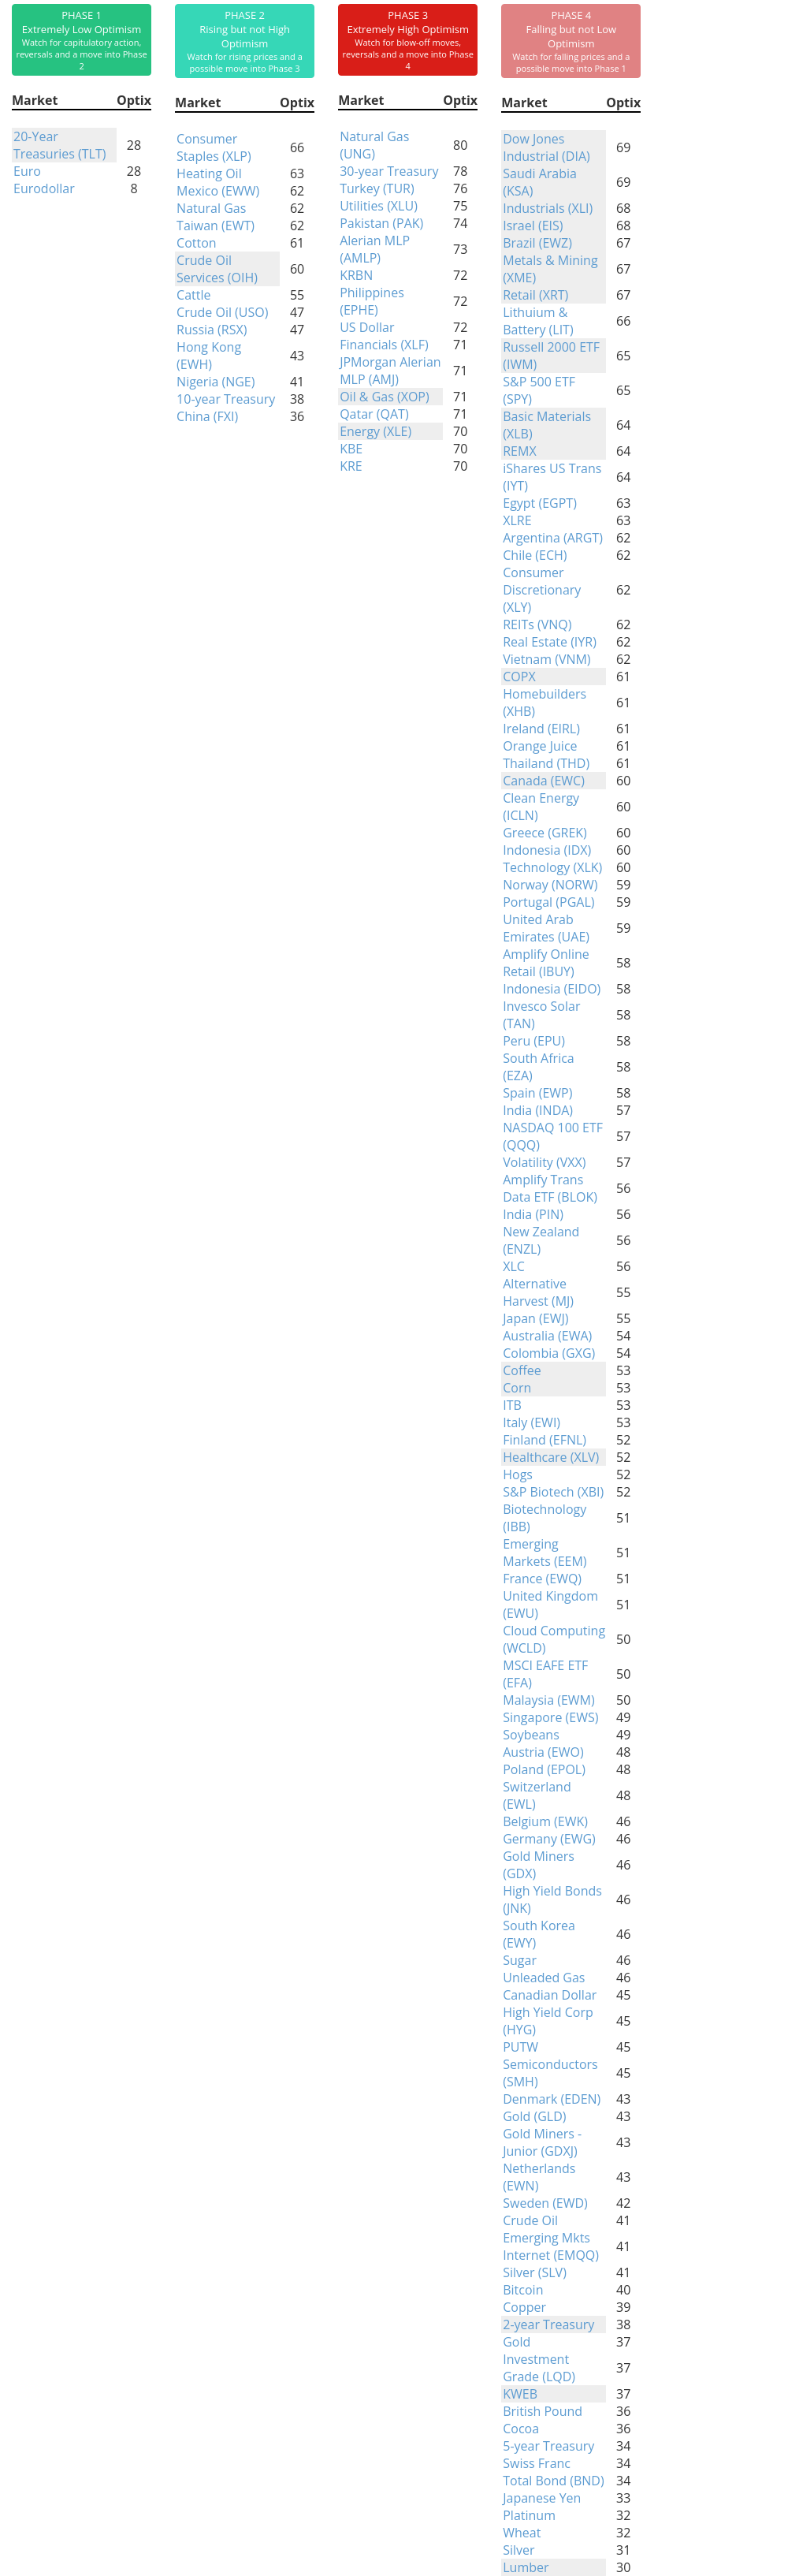
Phase Table
Ranks
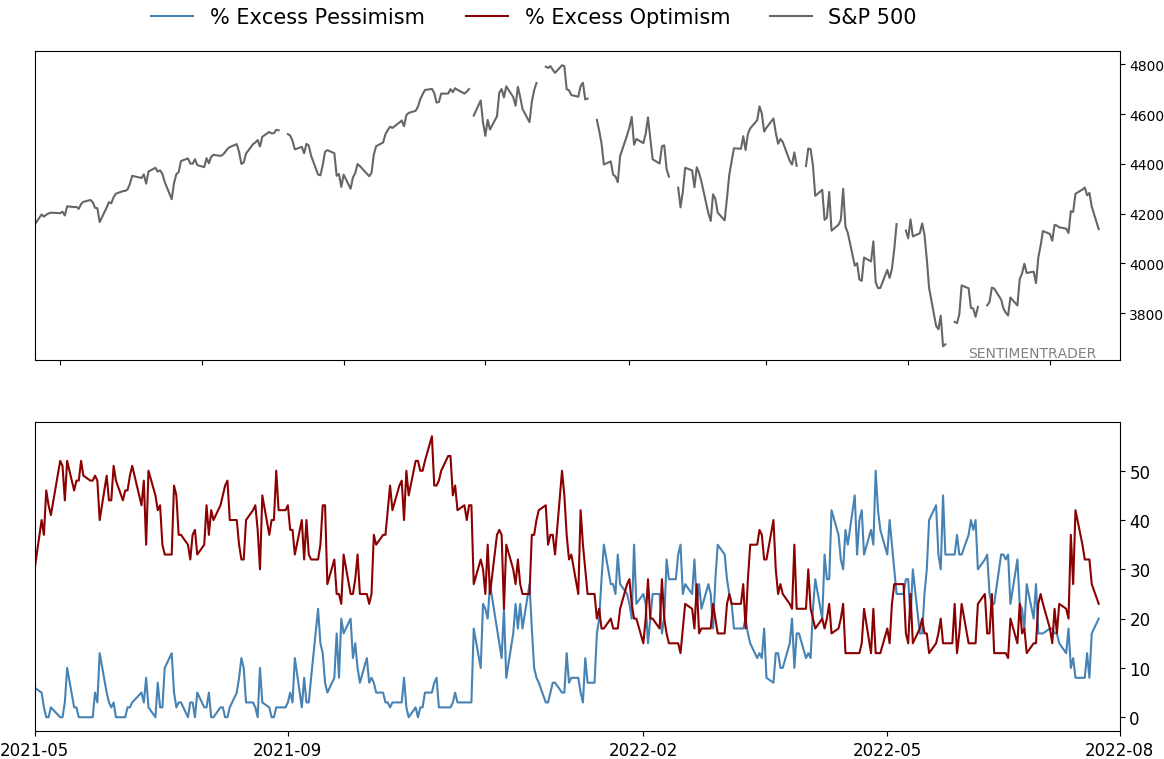
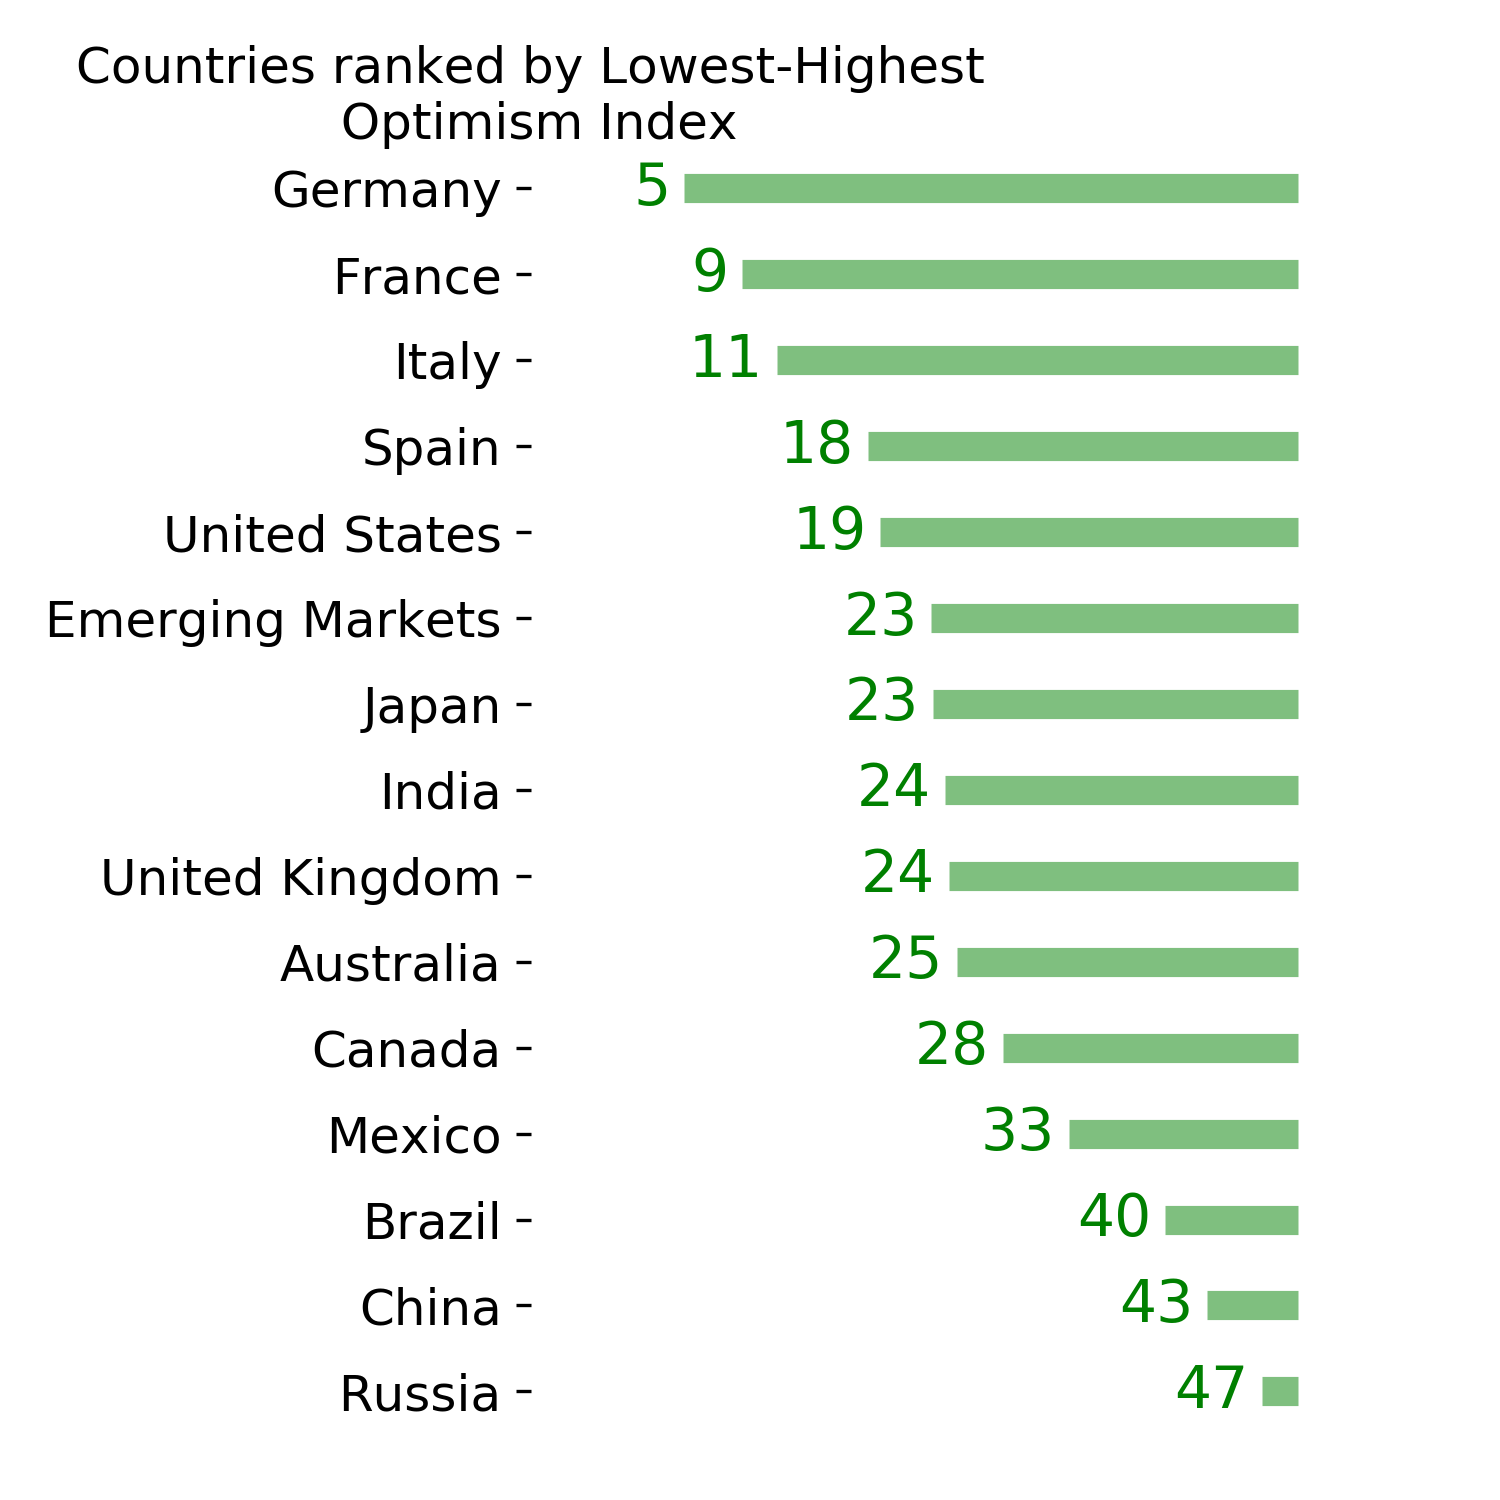
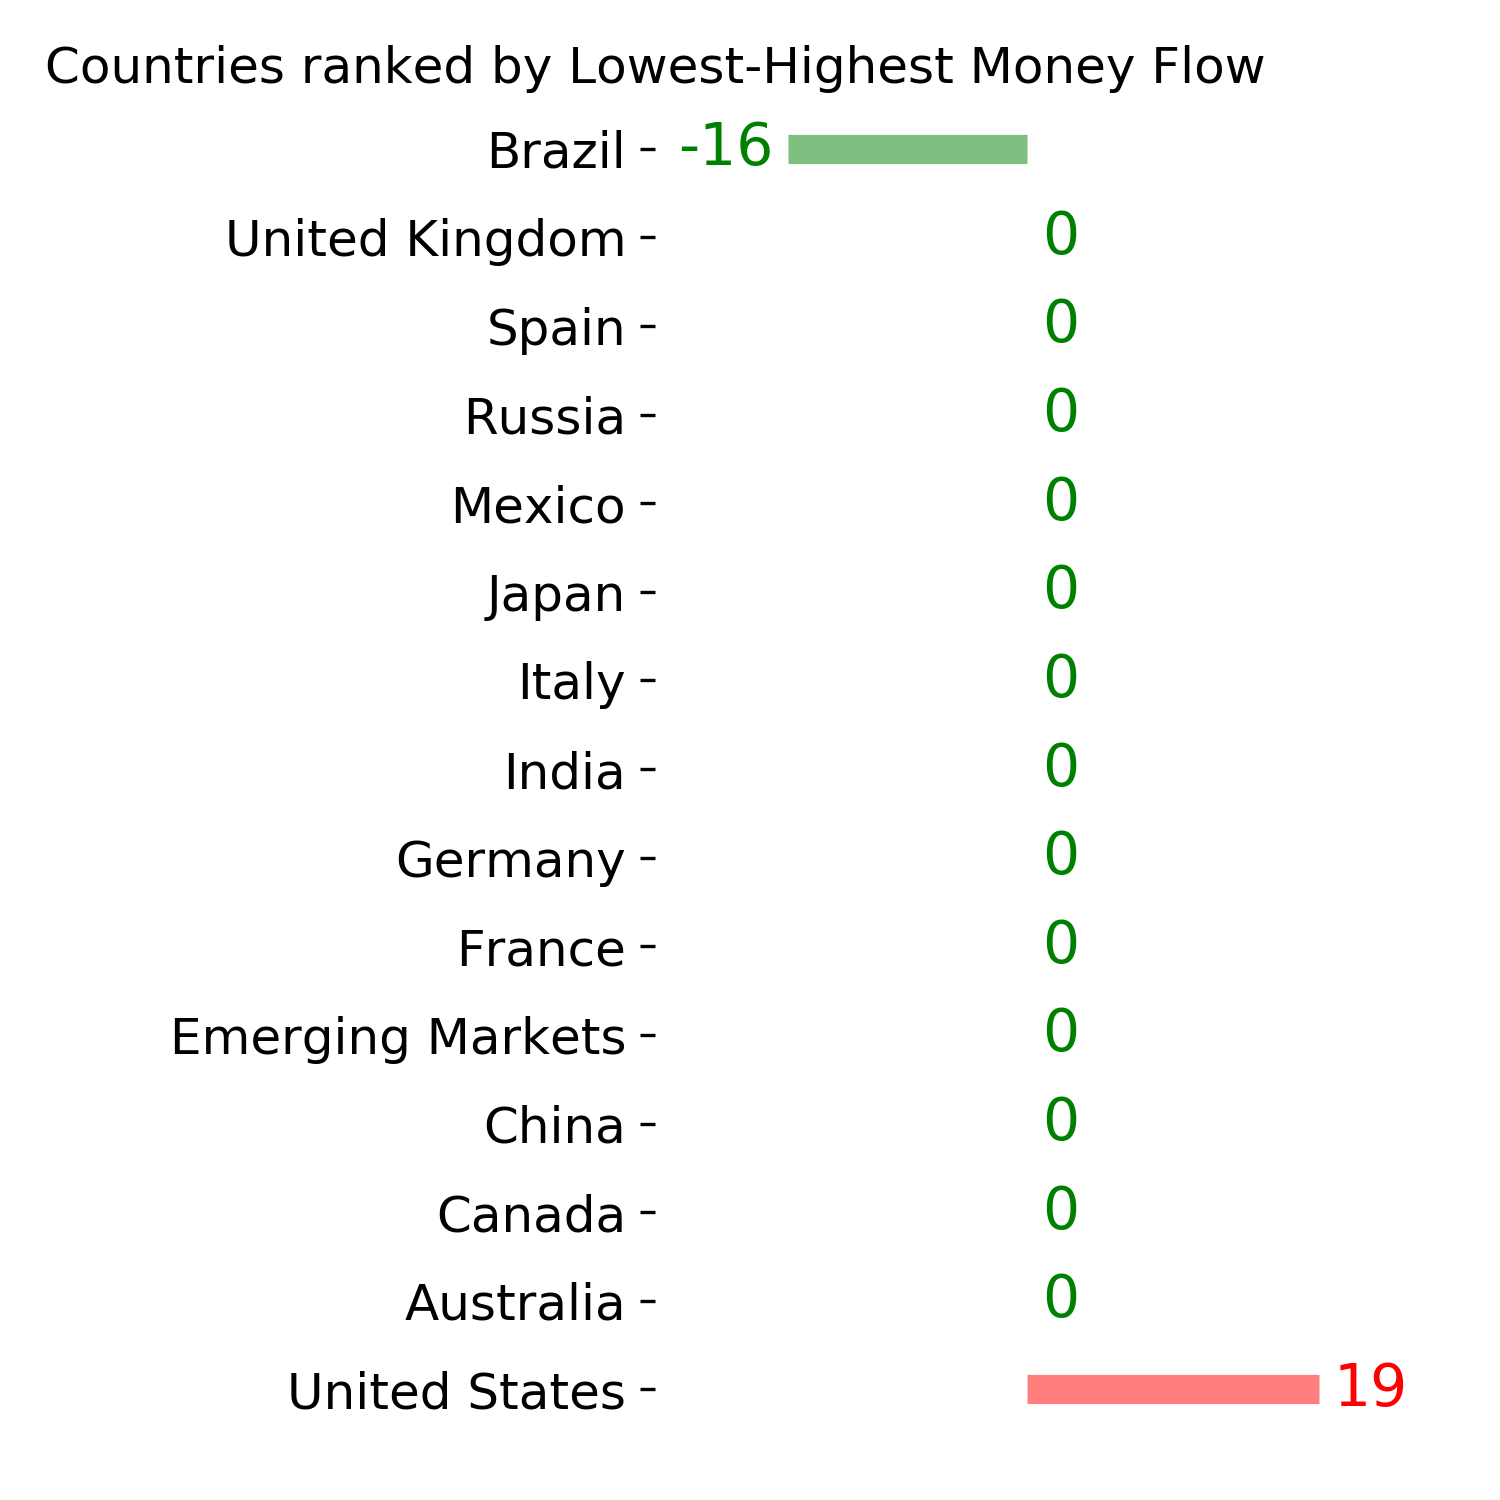
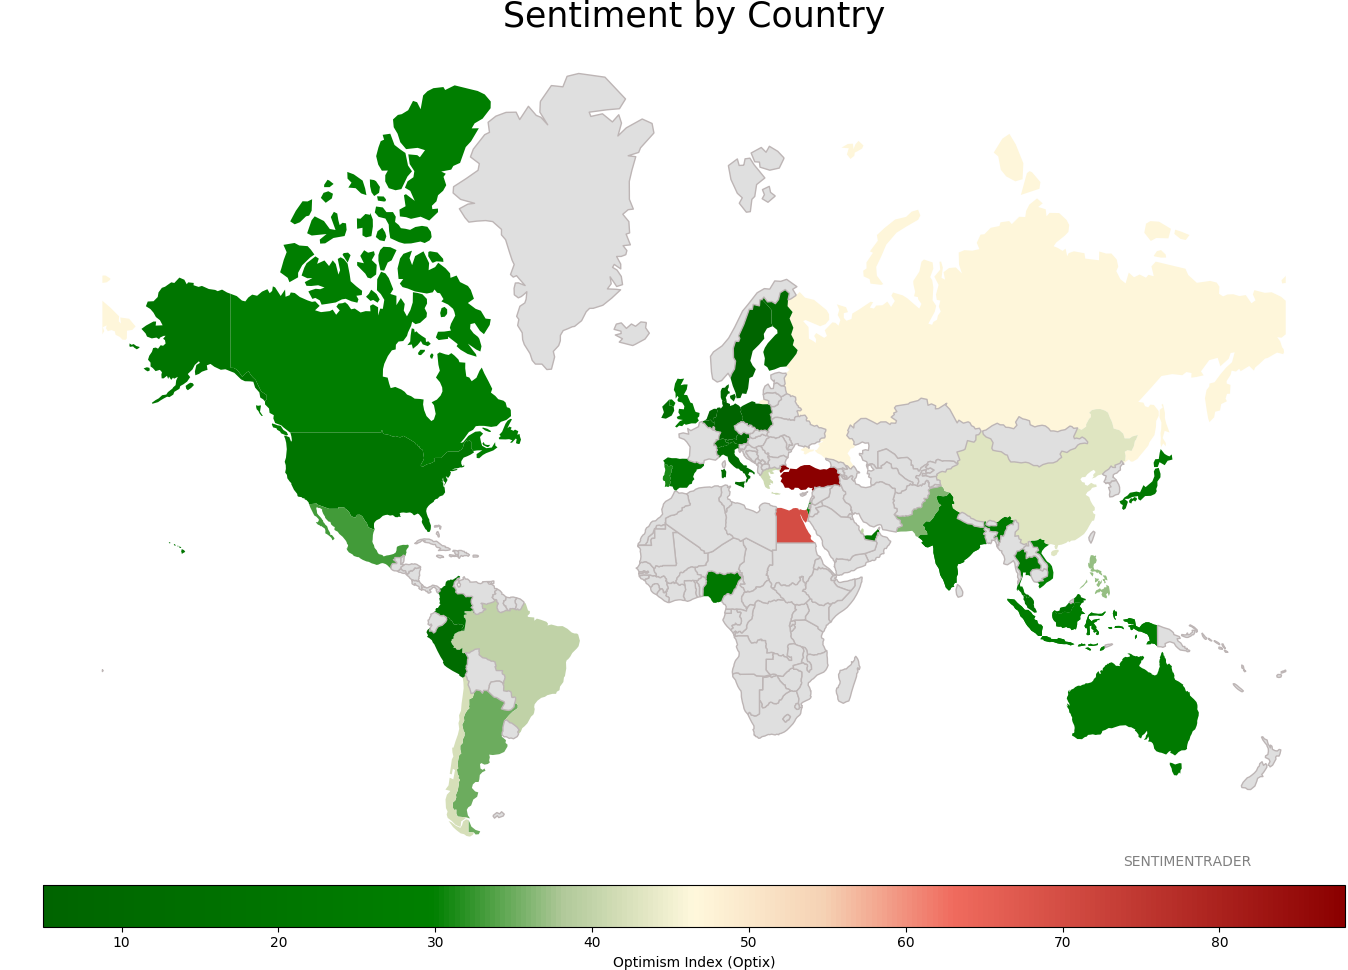
Sentiment Around The World
Optimism Index Thumbnails
|
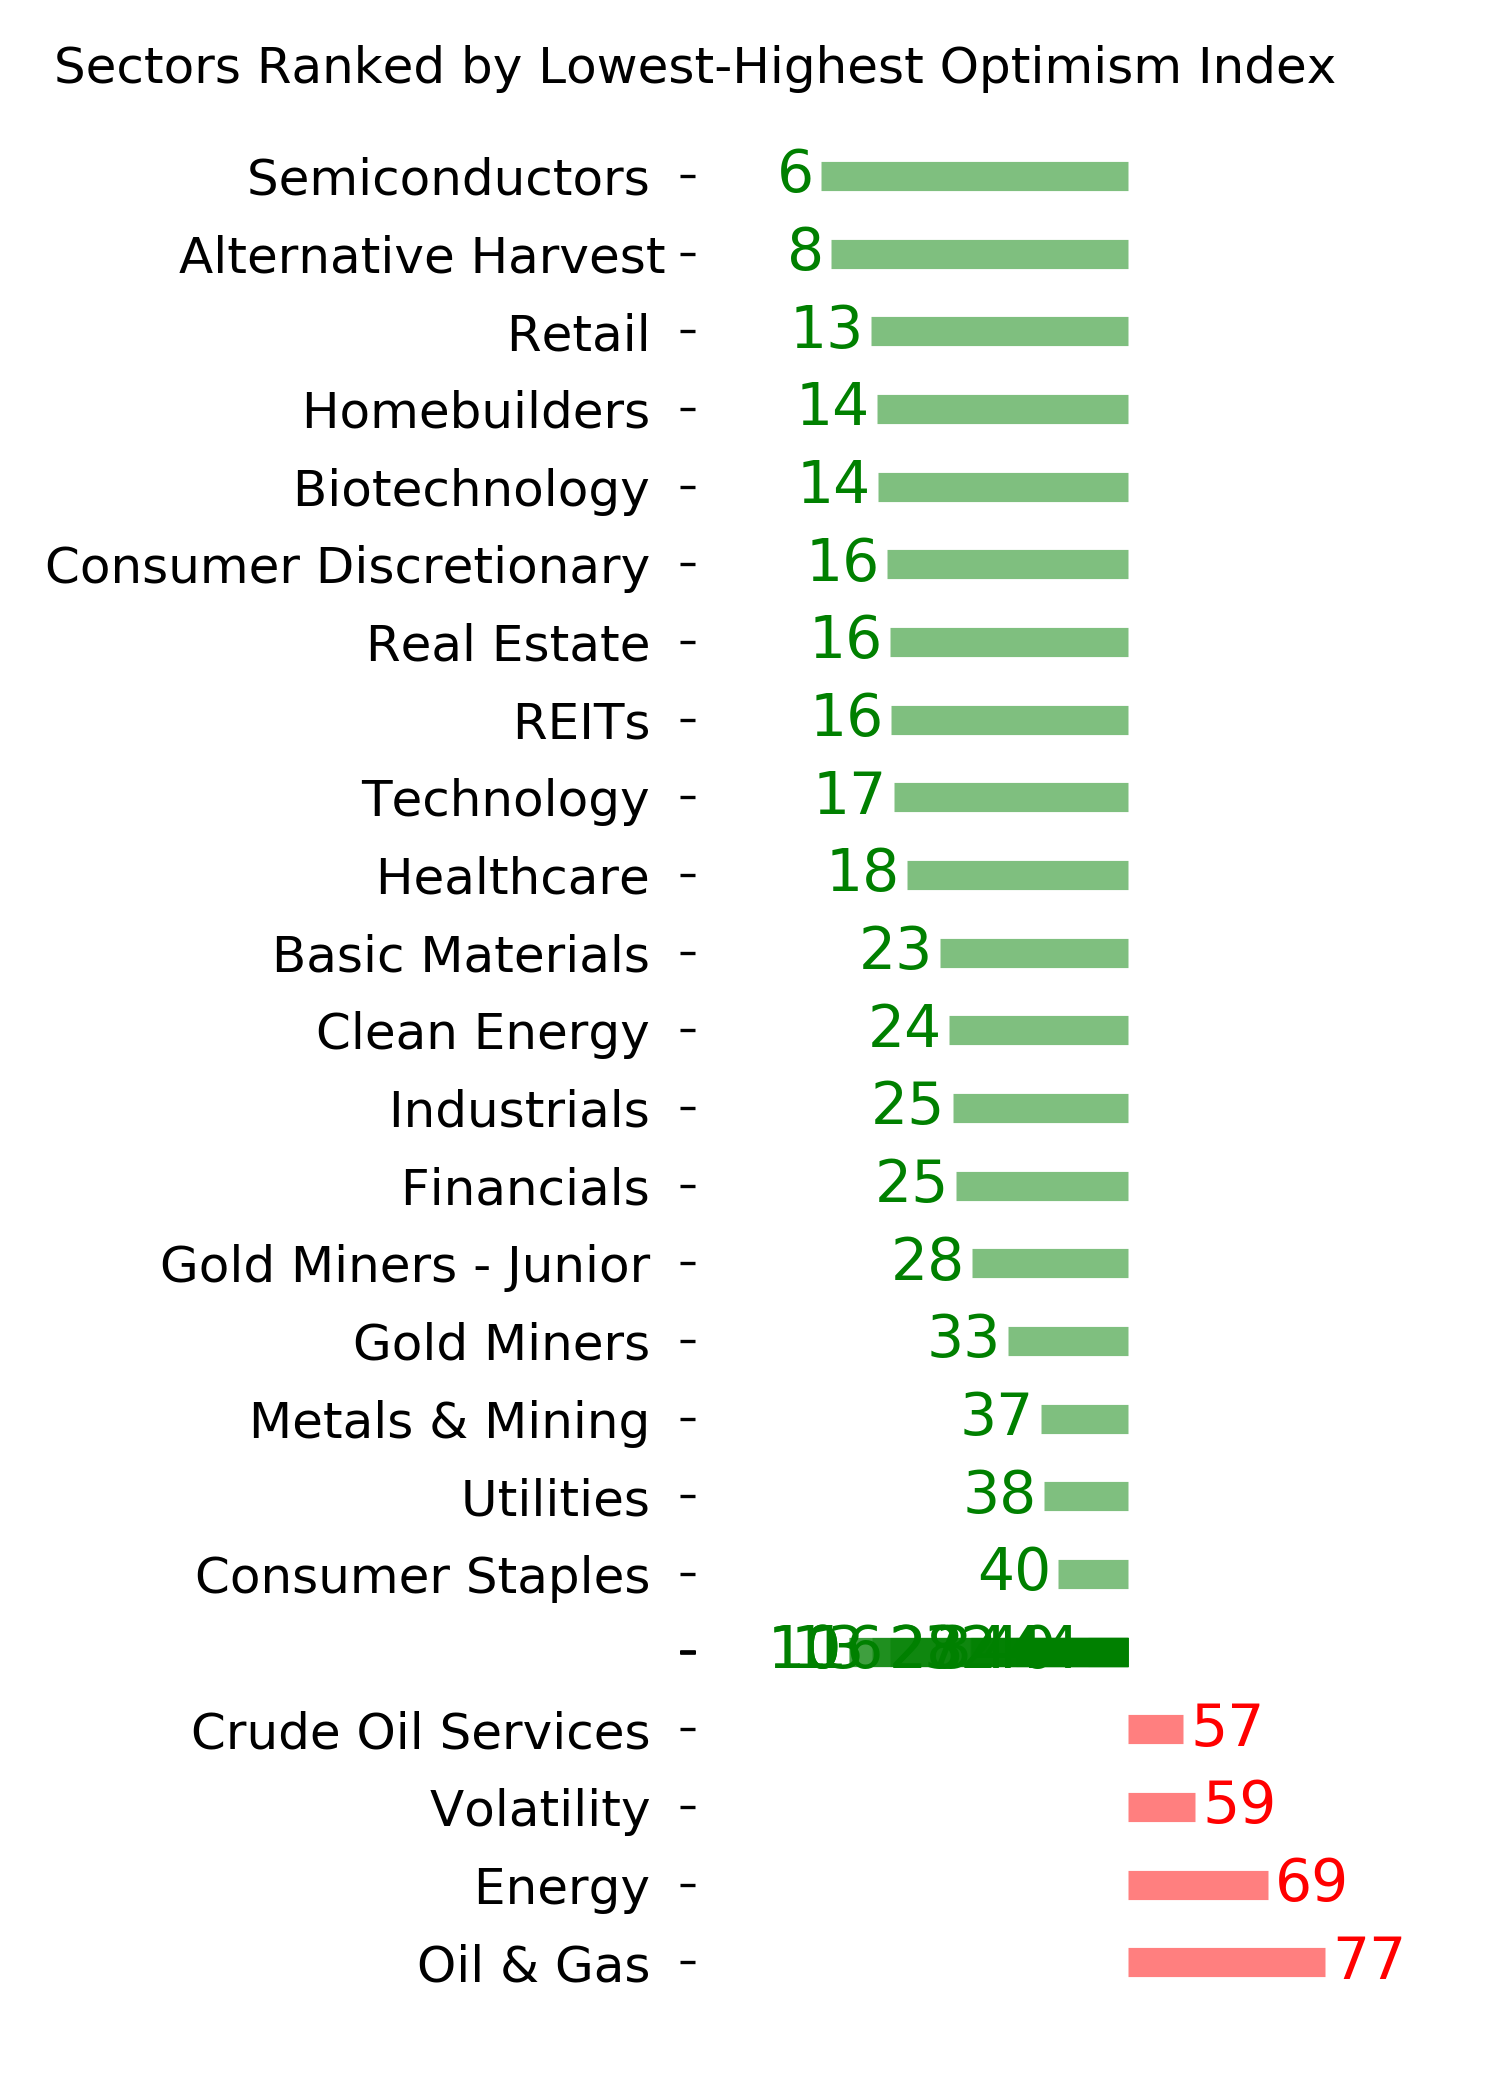
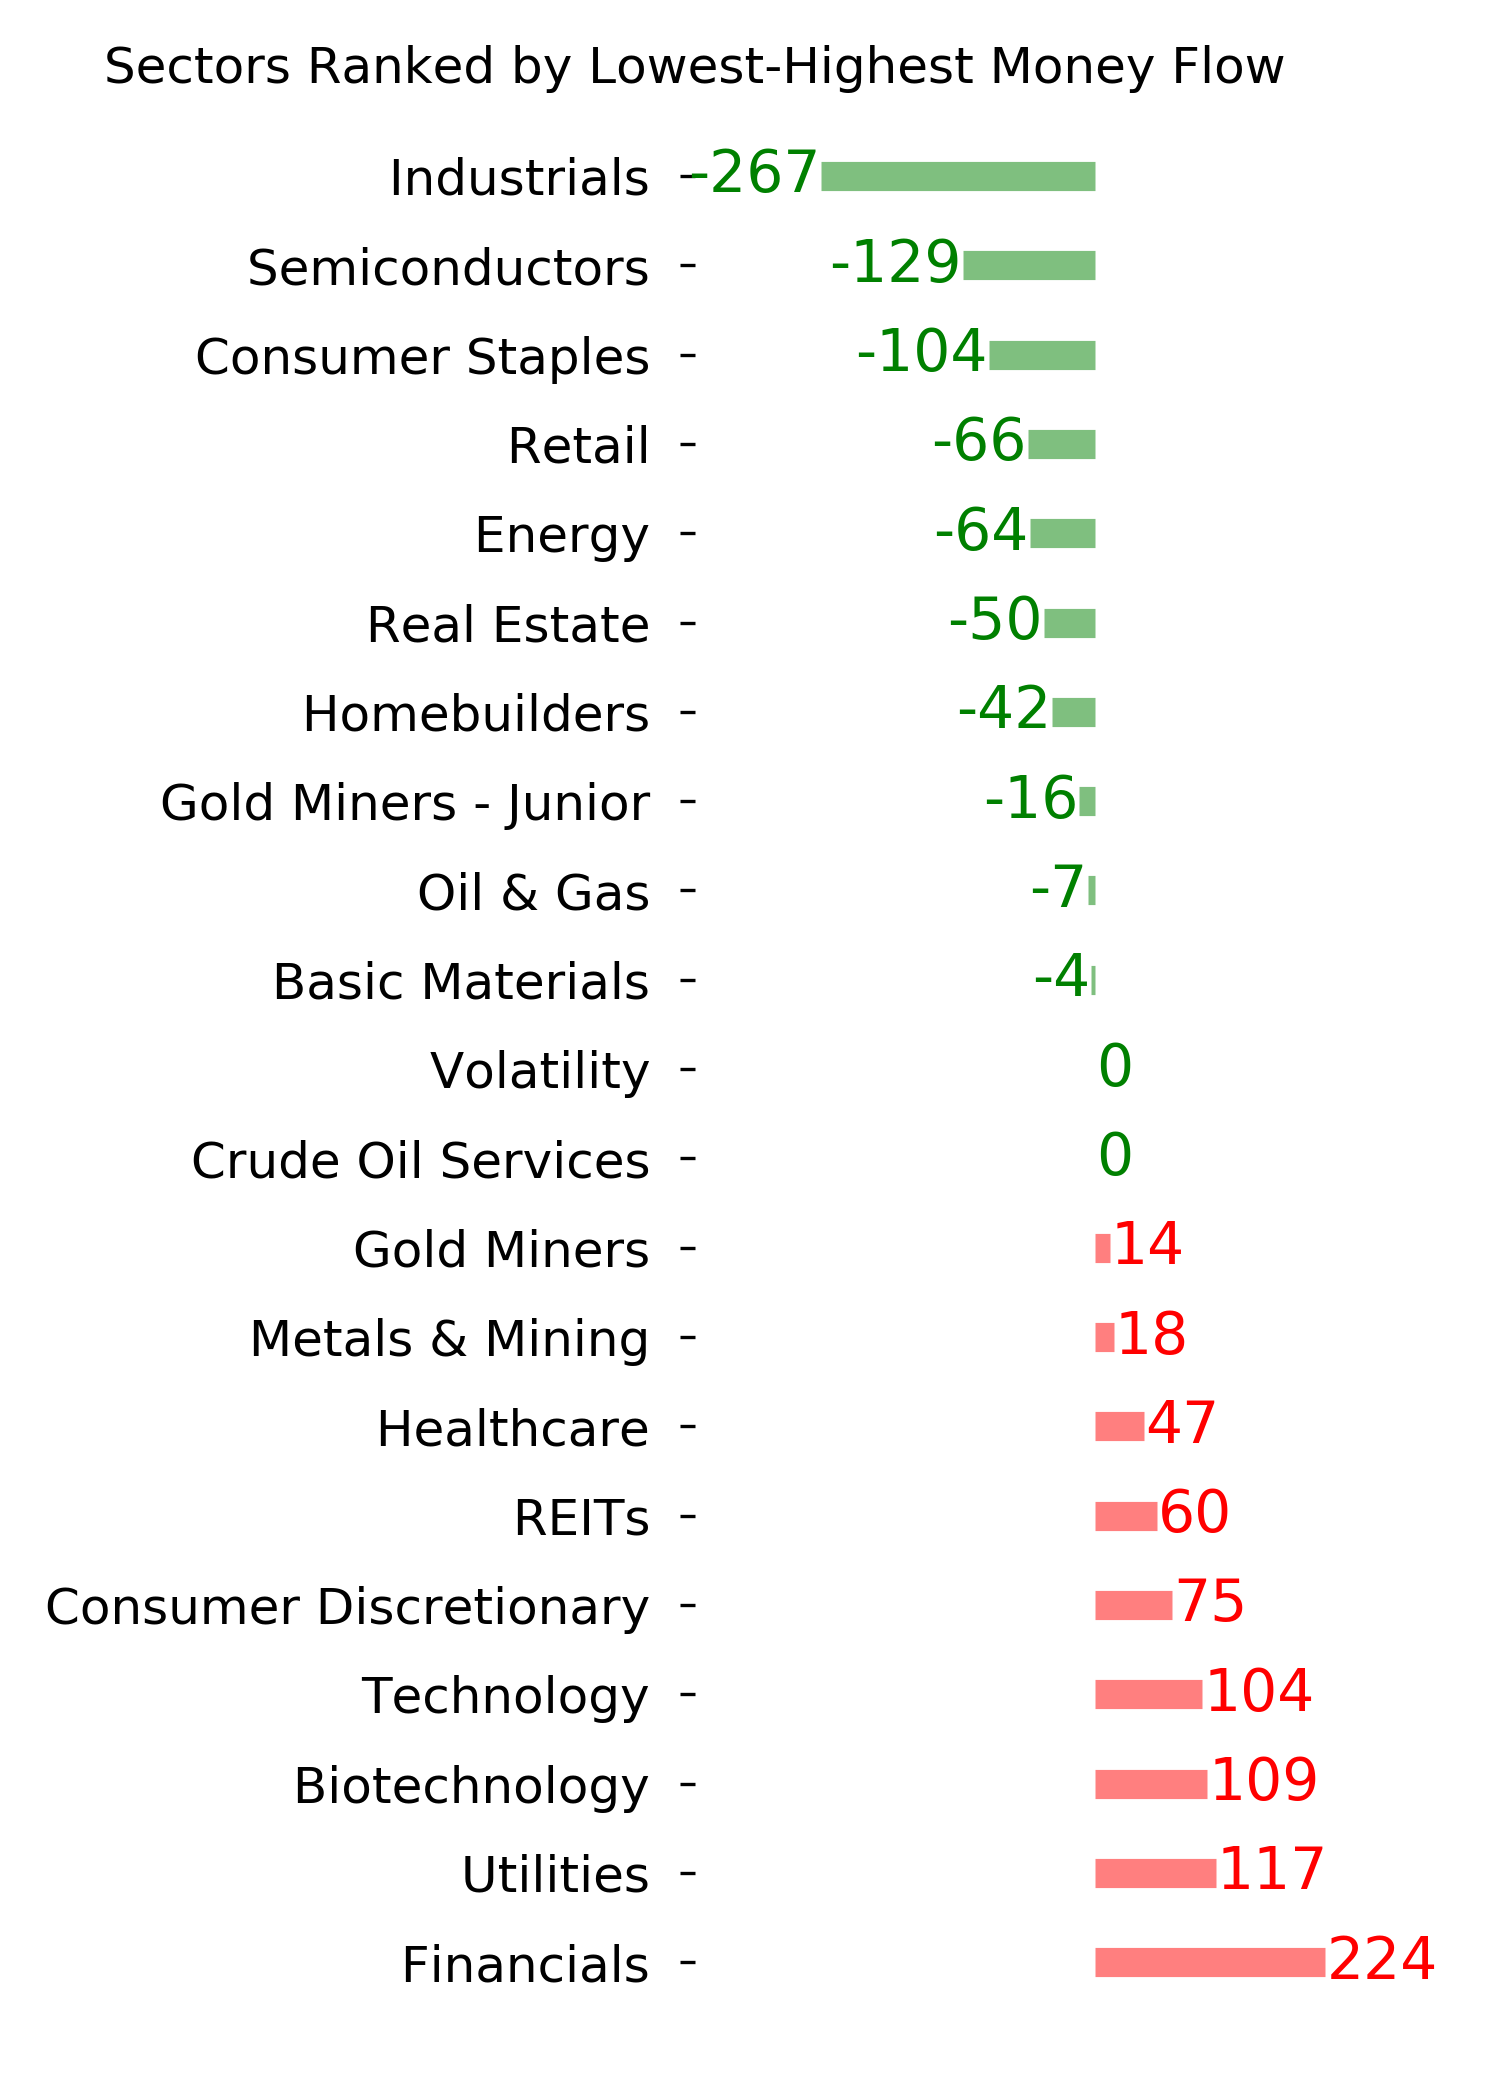
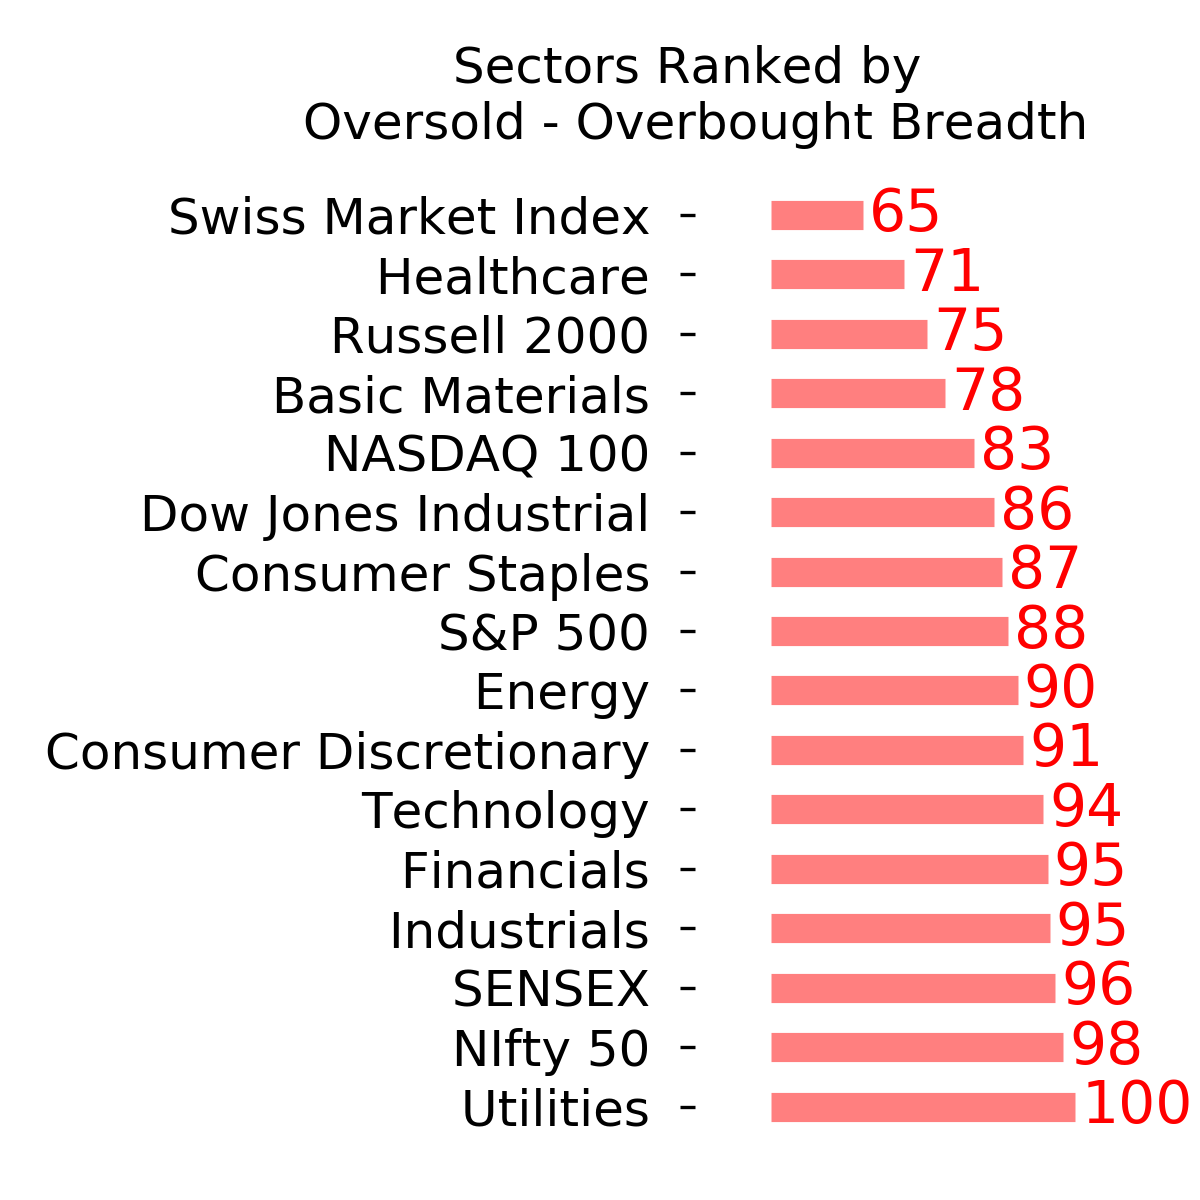
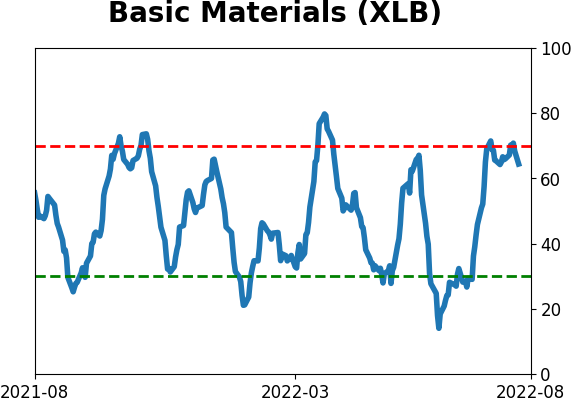
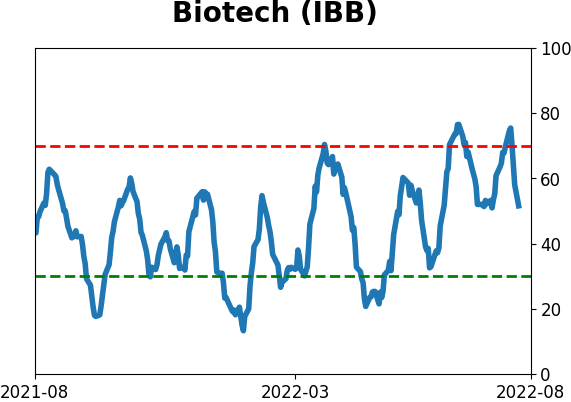
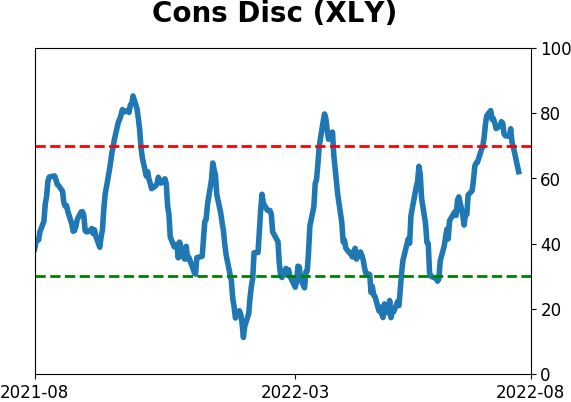
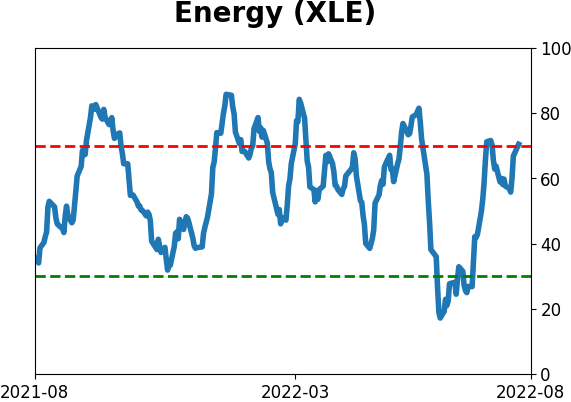
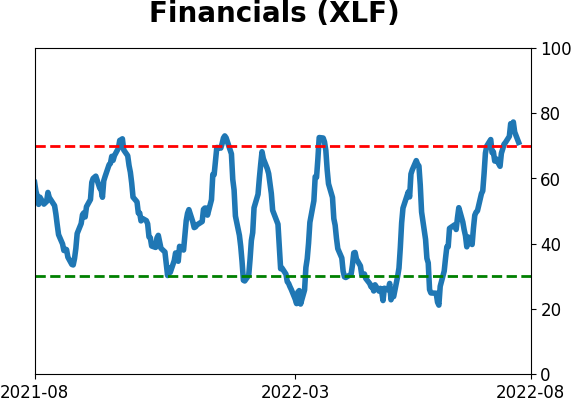
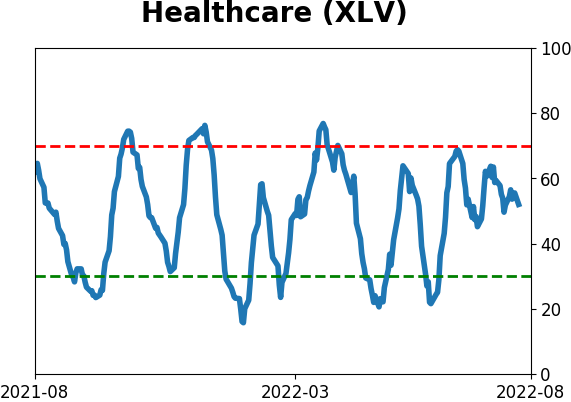
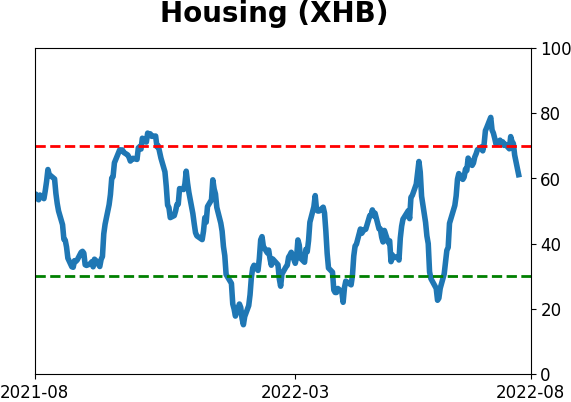
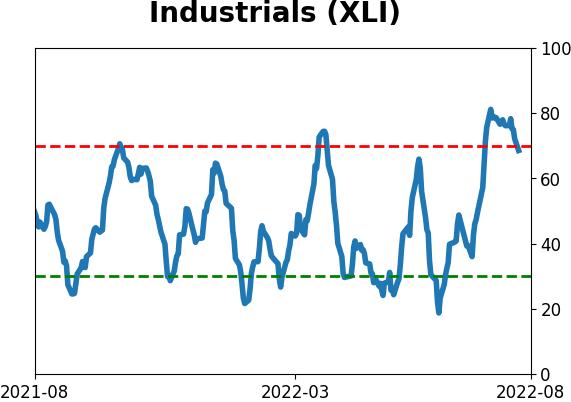
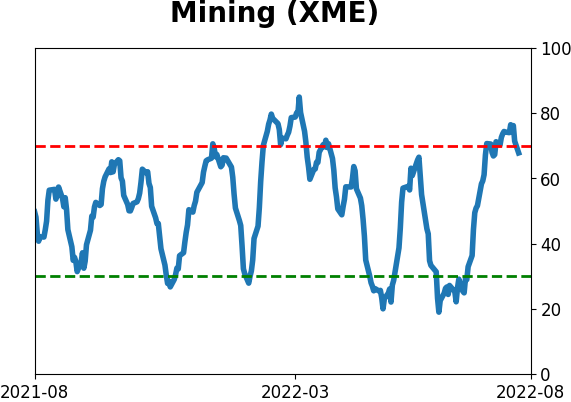
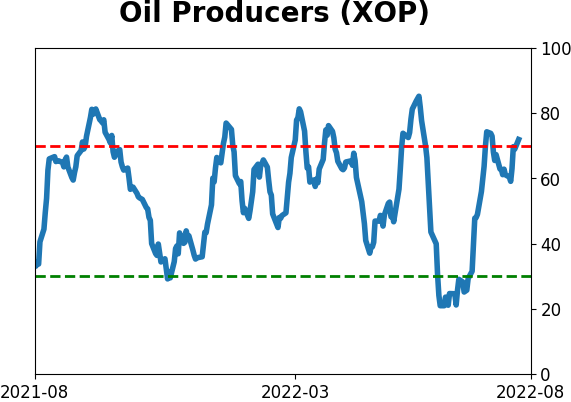
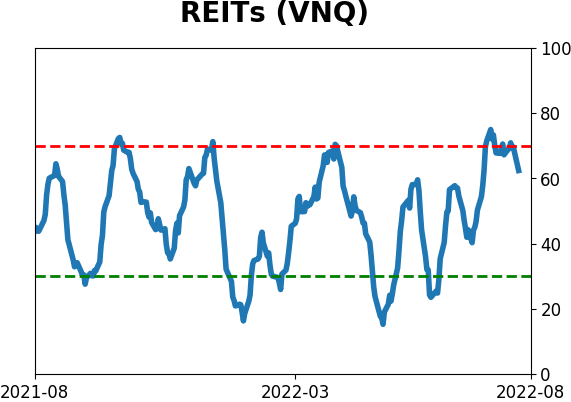
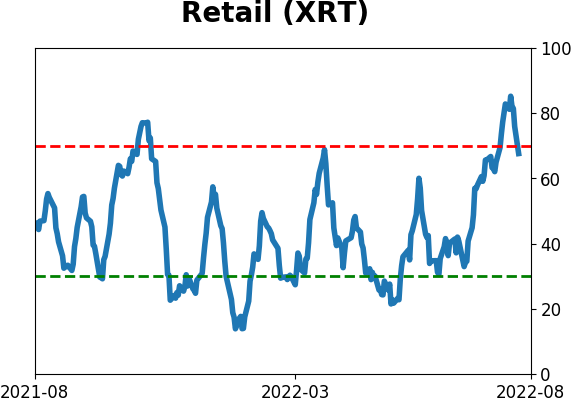
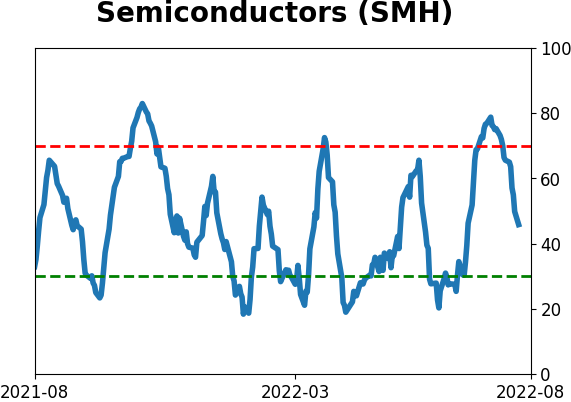
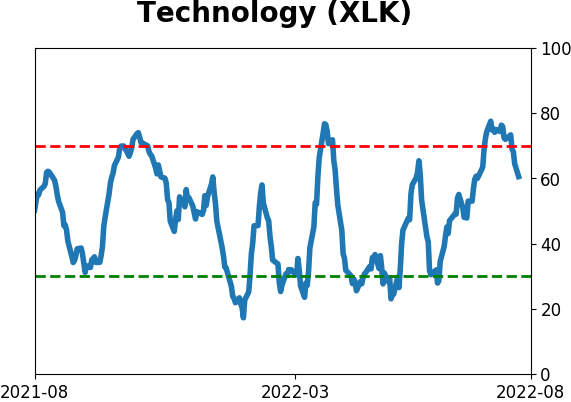
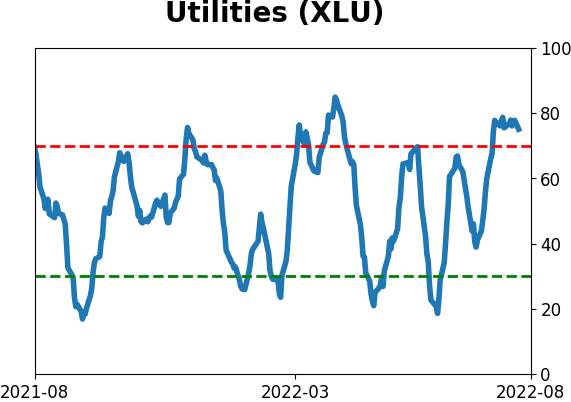
Sector ETF's - 10-Day Moving Average
|
|
|
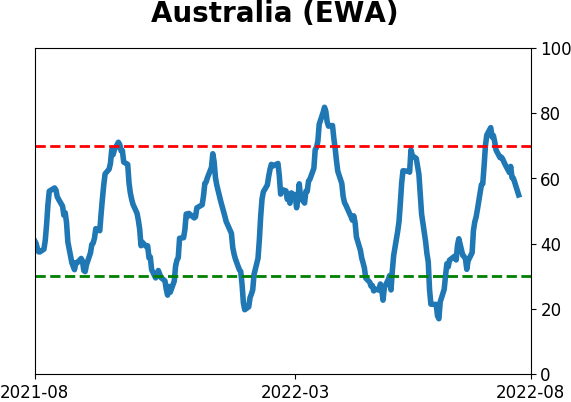
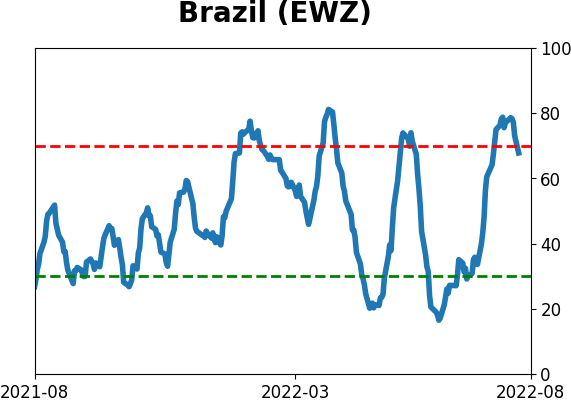
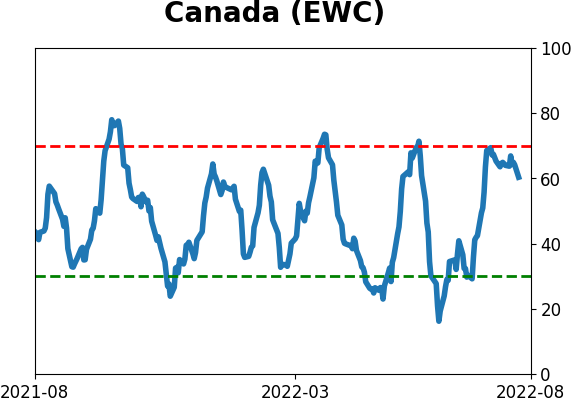
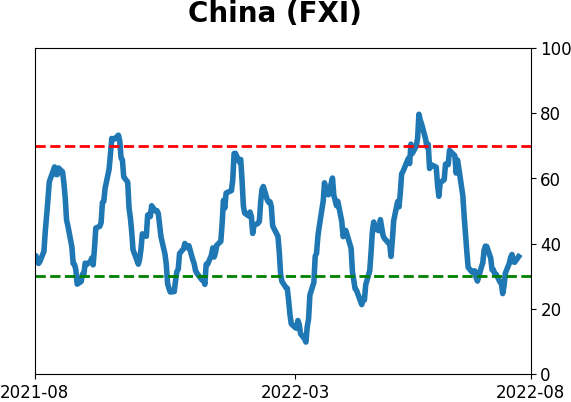
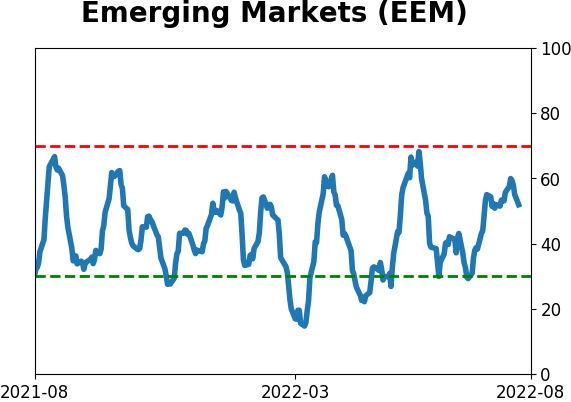
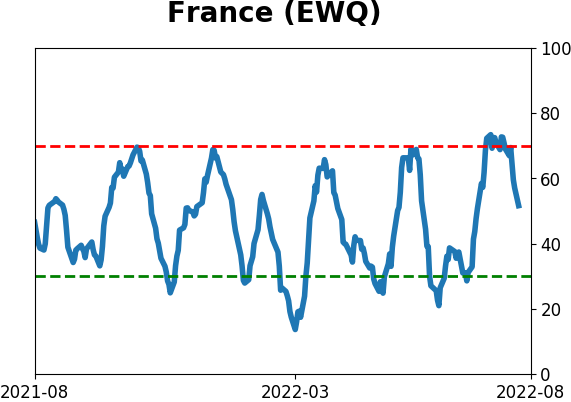
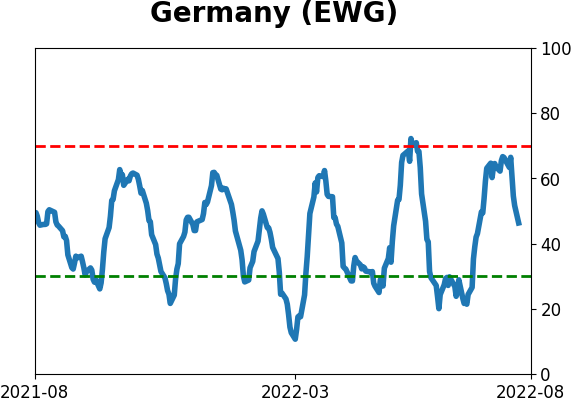
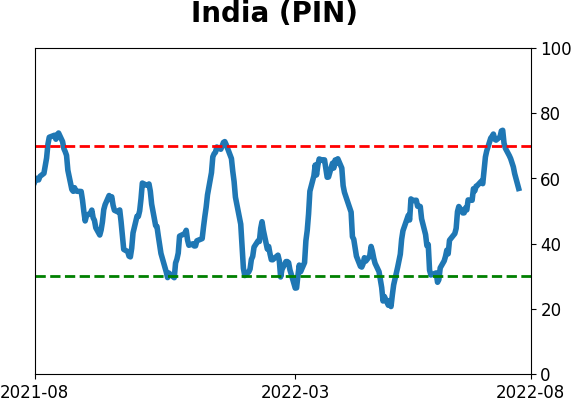
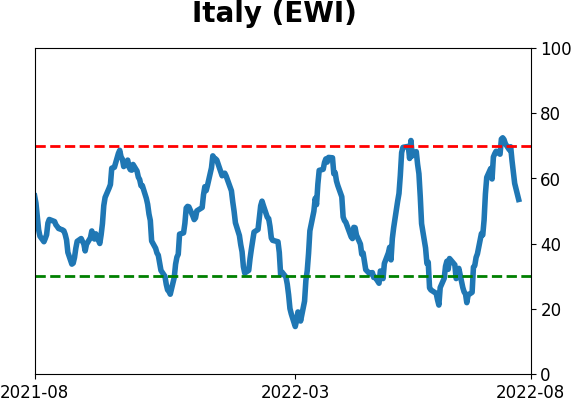
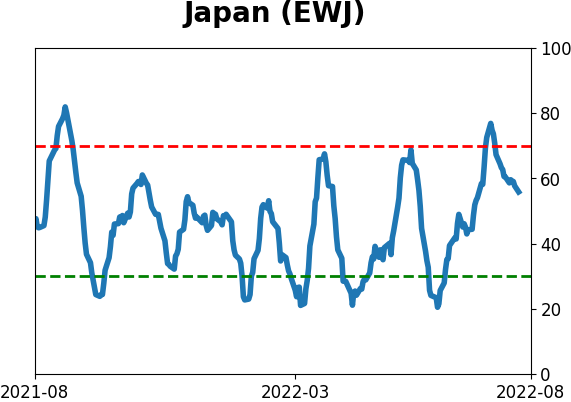
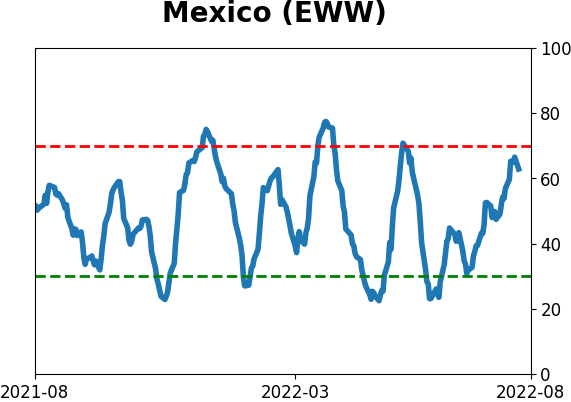
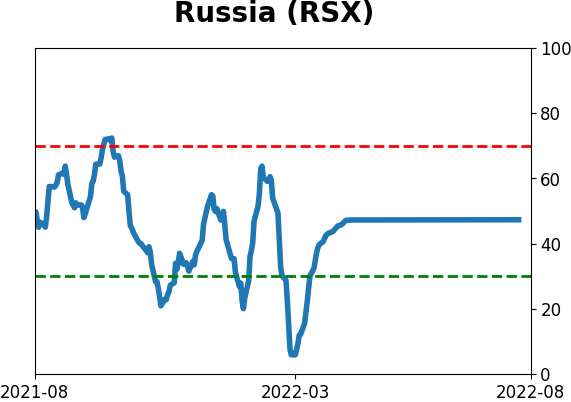
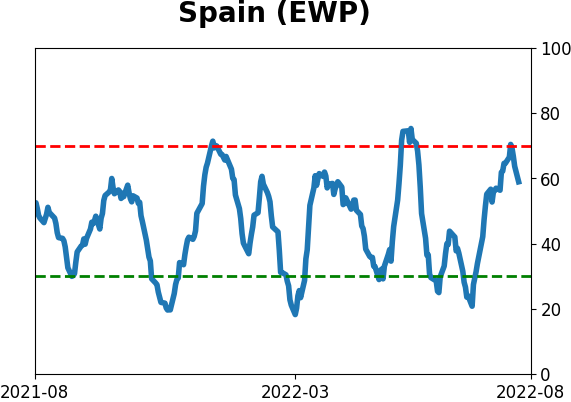
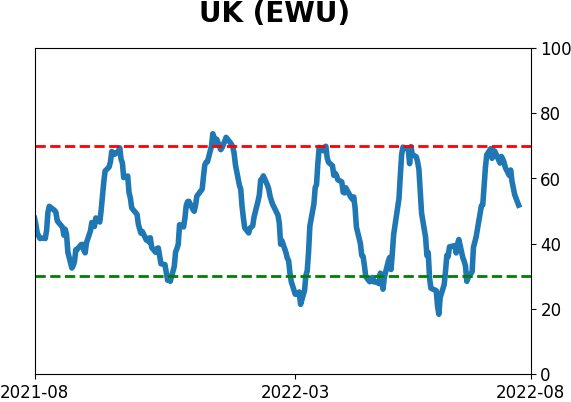
Country ETF's - 10-Day Moving Average
|
|
|
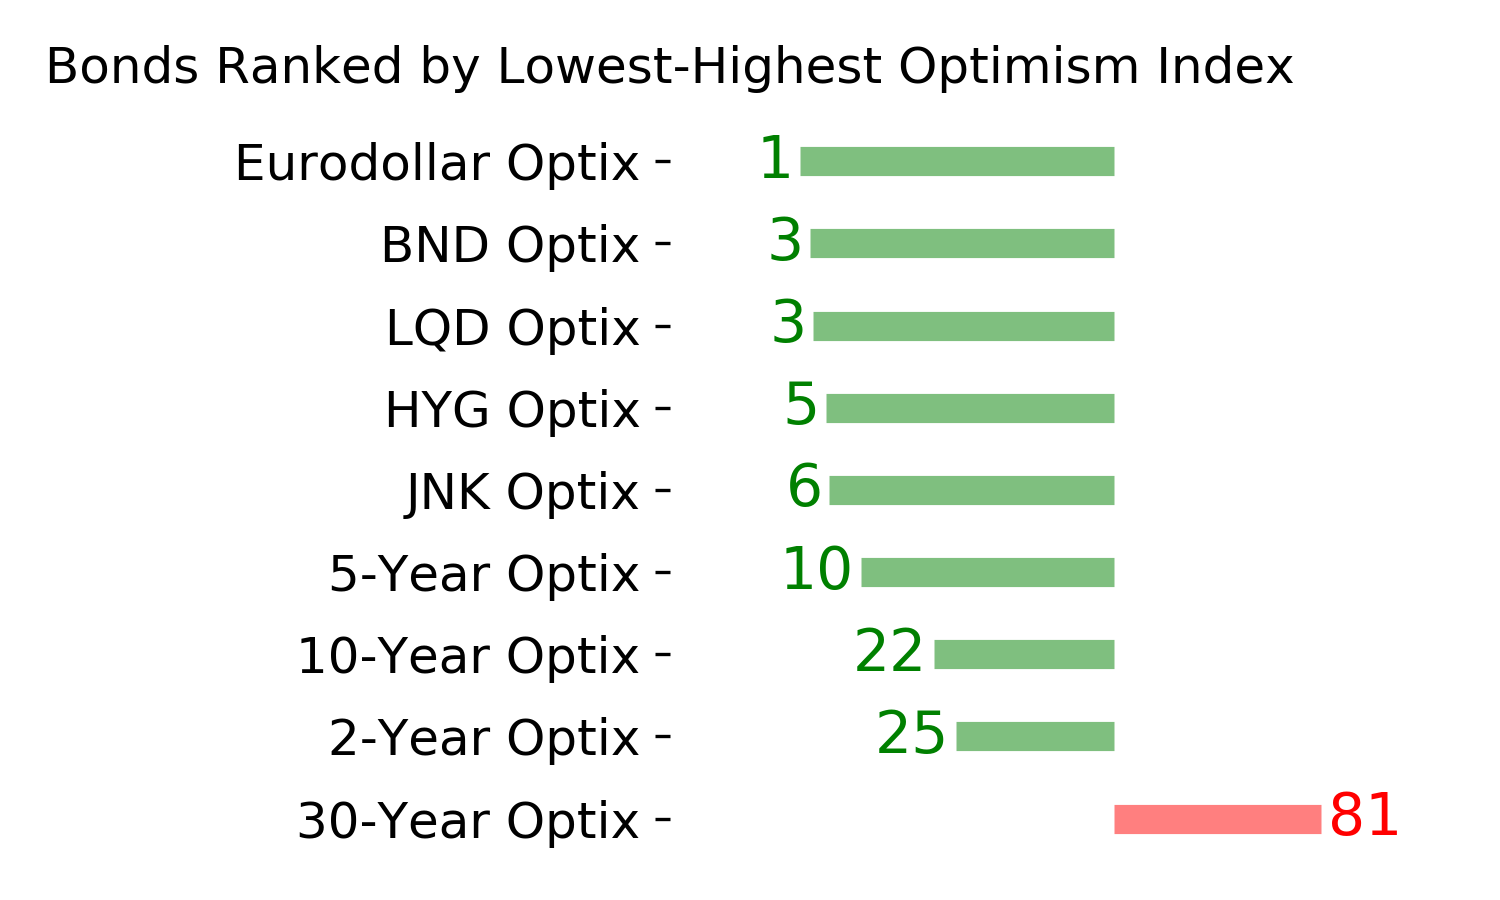
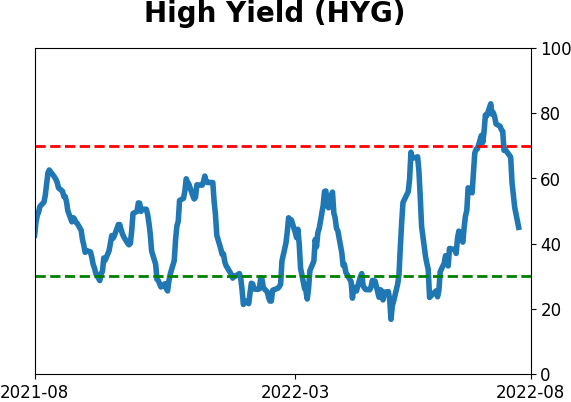
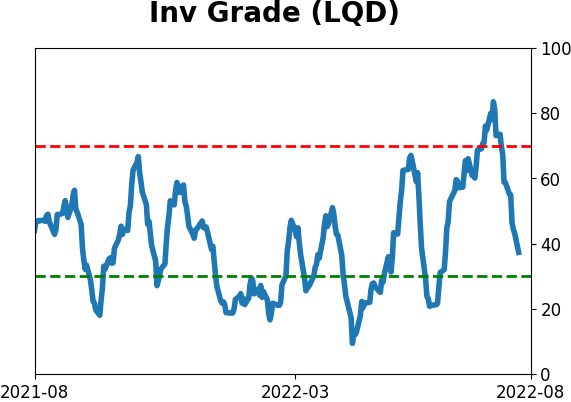
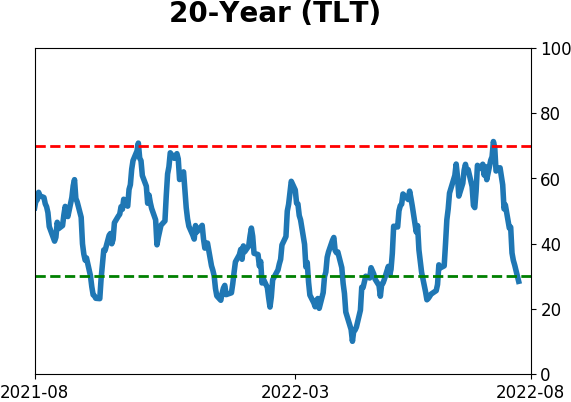
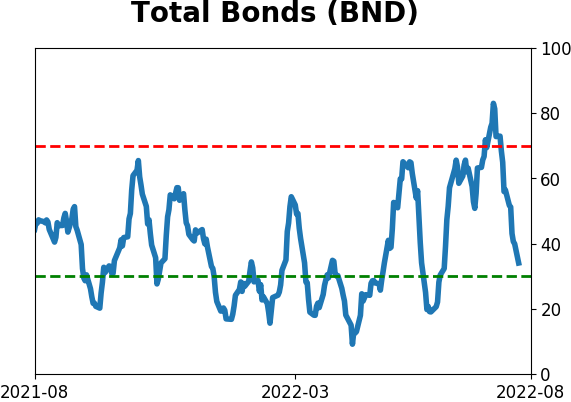
Bond ETF's - 10-Day Moving Average
|
|
|
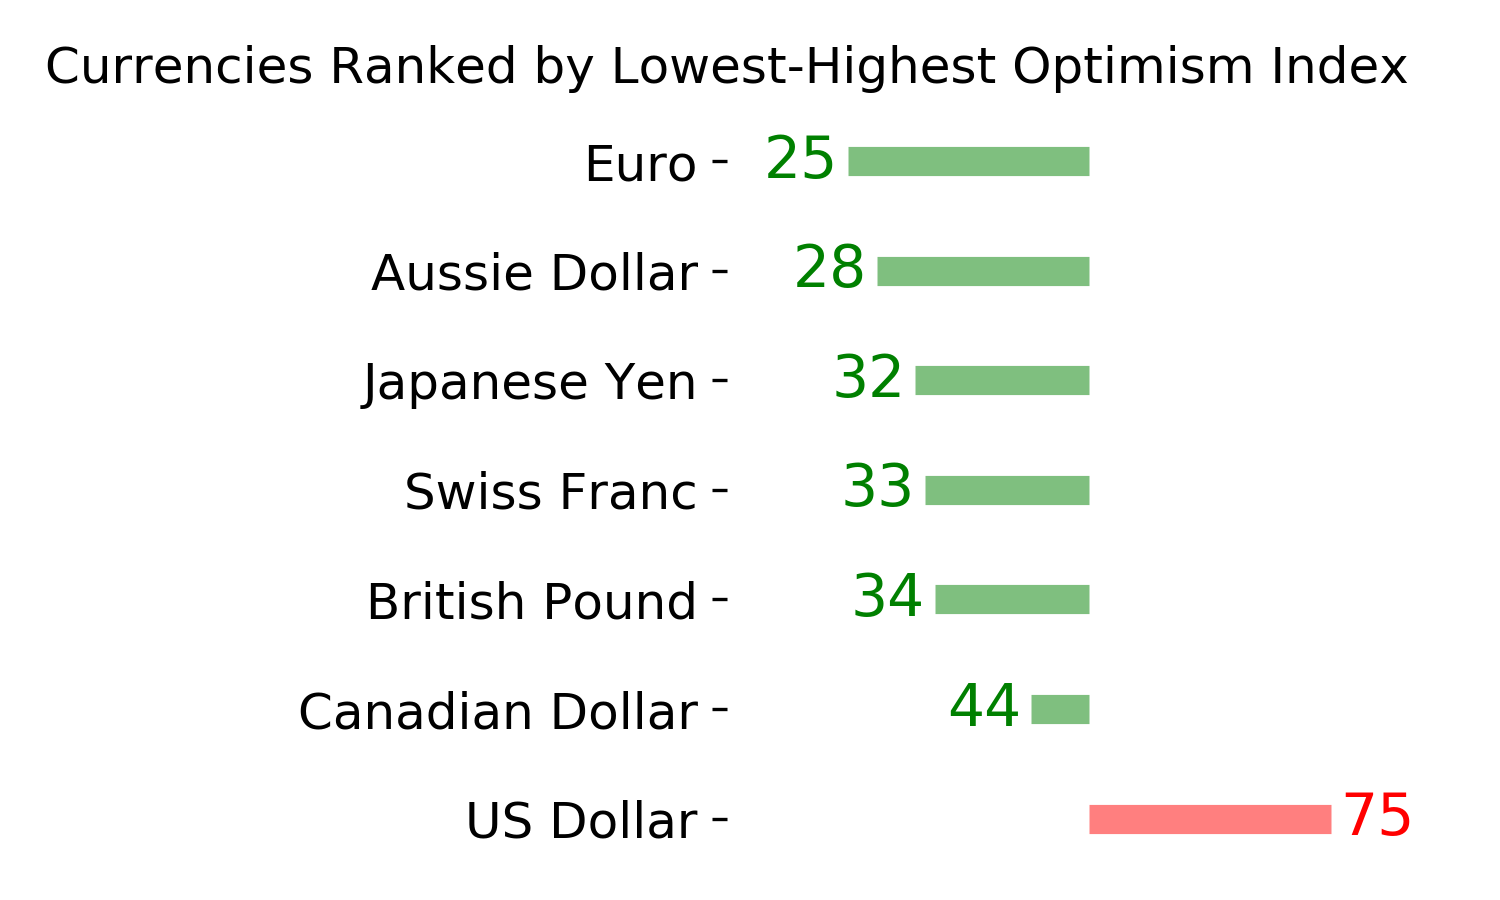
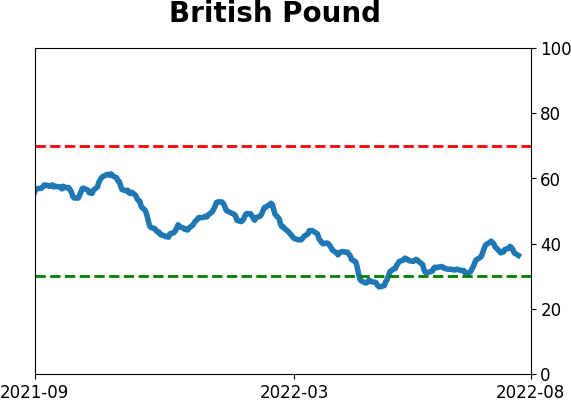
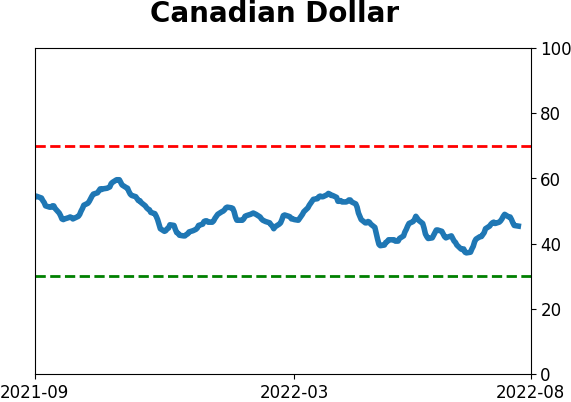
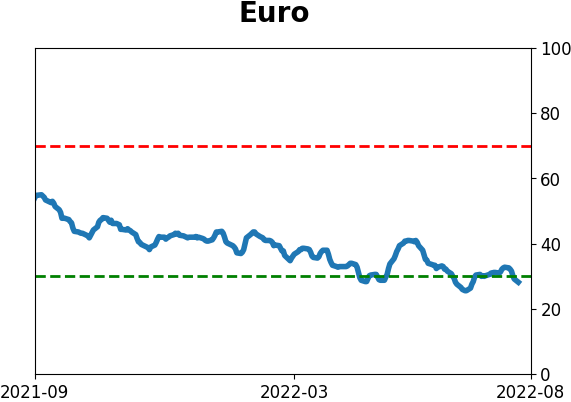
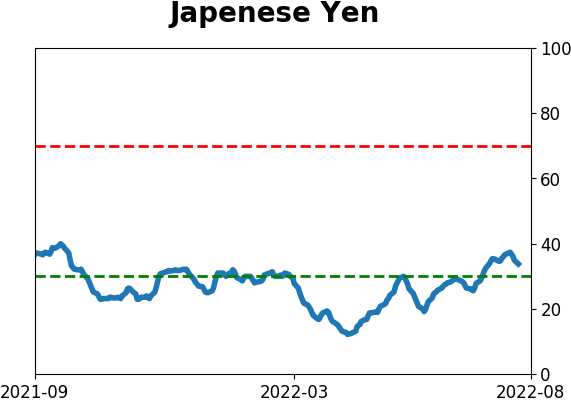
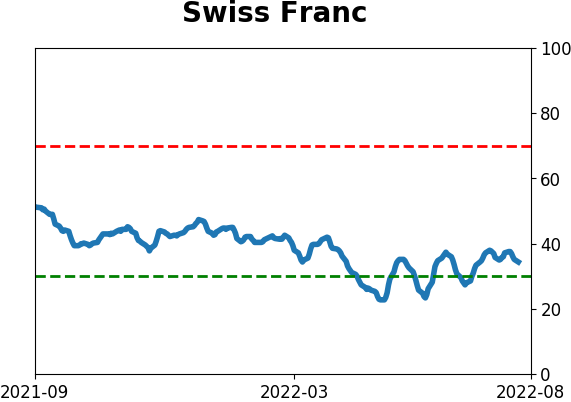
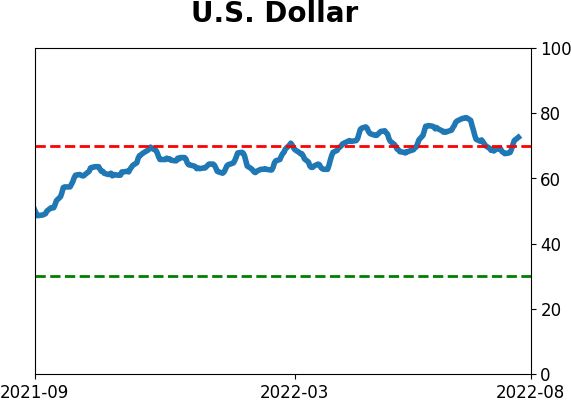
Currency ETF's - 5-Day Moving Average
|
|
|
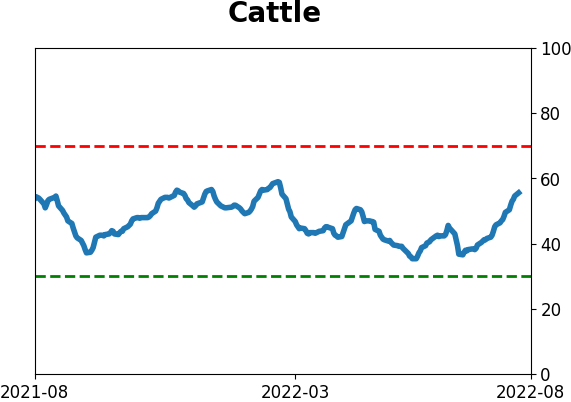
Commodity ETF's - 5-Day Moving Average
|
|