Headlines
|
|
The most important index rejected by its most important indicator:
The S&P 500 approached its 200-day average this week, after spending months below it. So far, it has failed the test and is trading below its approach point. Similar failures triggered in 2001 and 2008. But those were outliers, and other failures were quickly reversed. Also, the Dow Industrials has passed its test so far, a good sign for future returns.
|
Smart / Dumb Money Confidence
|
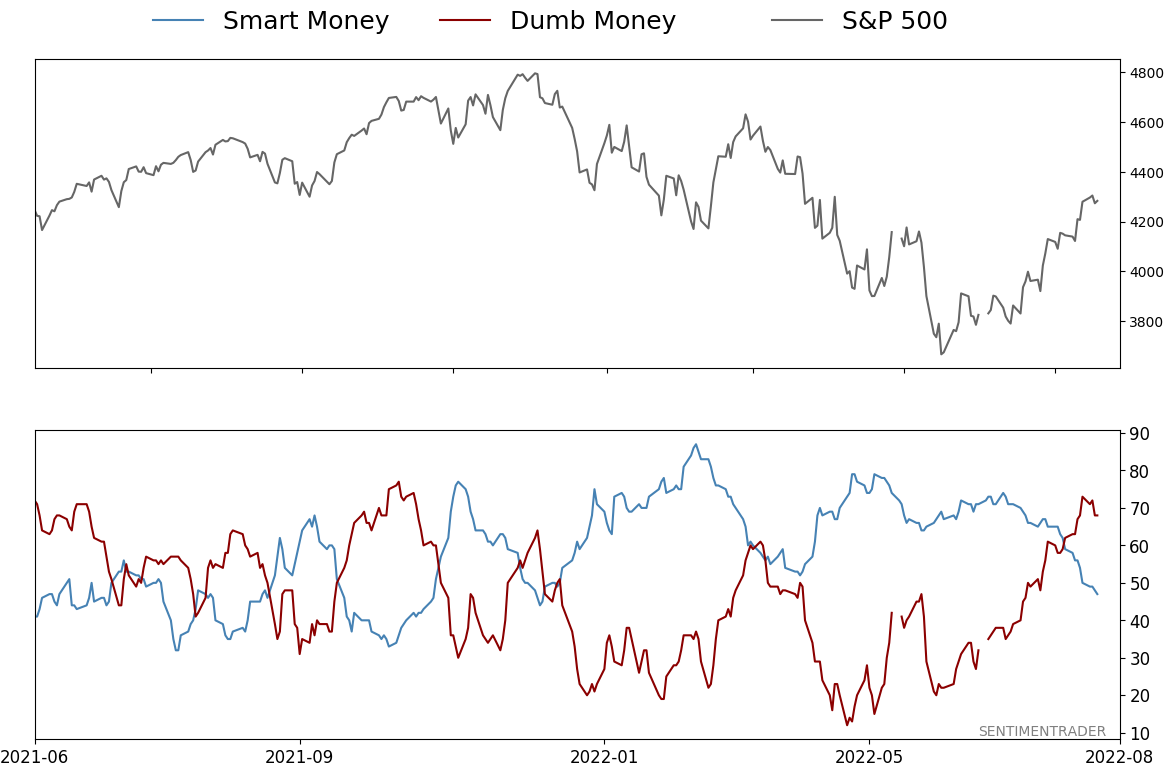
Smart Money Confidence: 47%
Dumb Money Confidence: 68%
|
|
Risk Levels
Stocks Short-Term
|
Stocks Medium-Term
|
|
Bonds
|
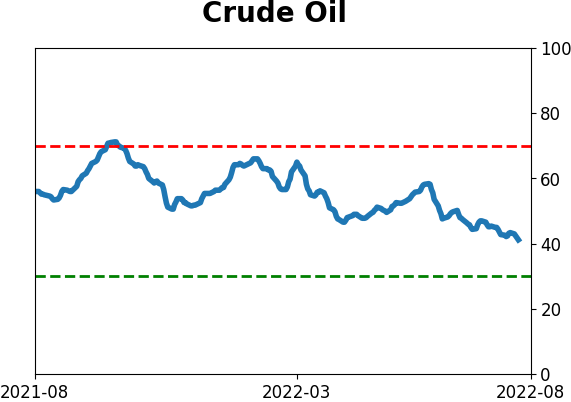
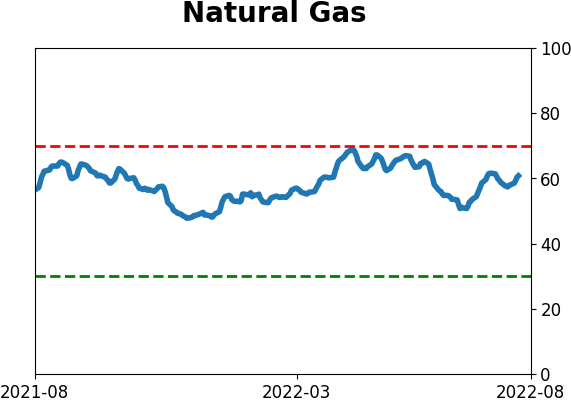
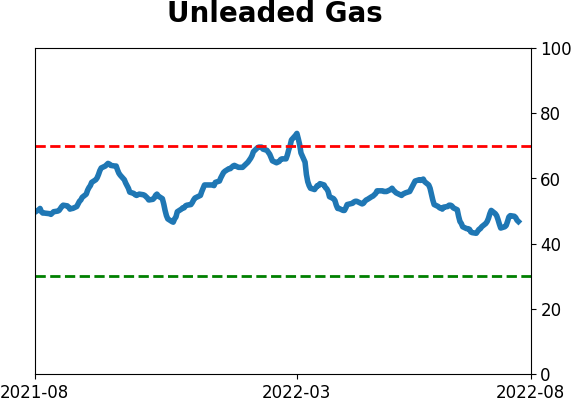
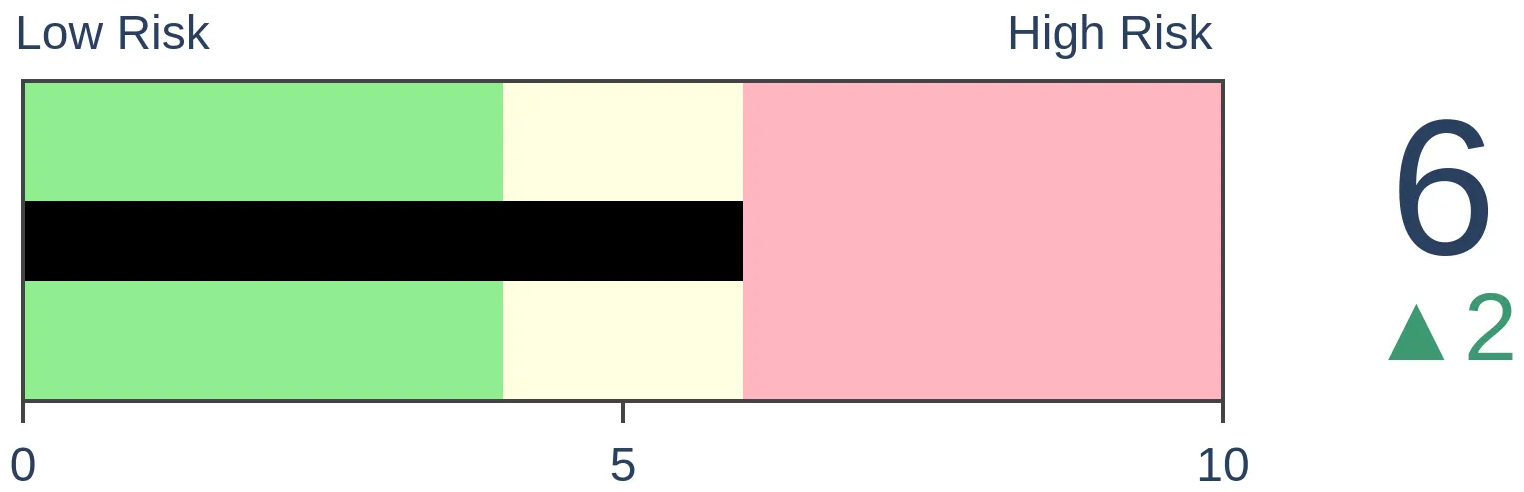
Crude Oil
|
|
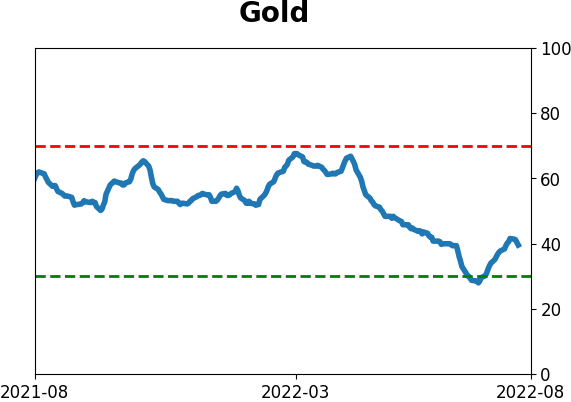
Gold

|
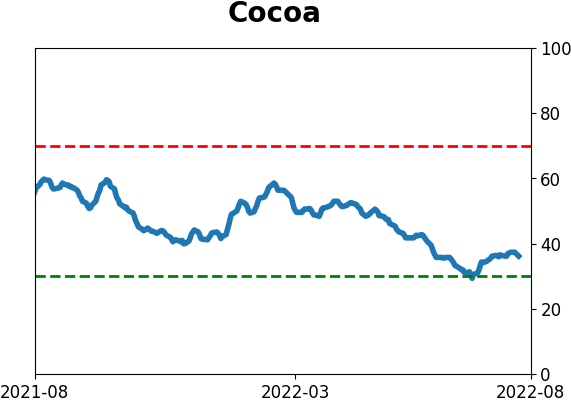
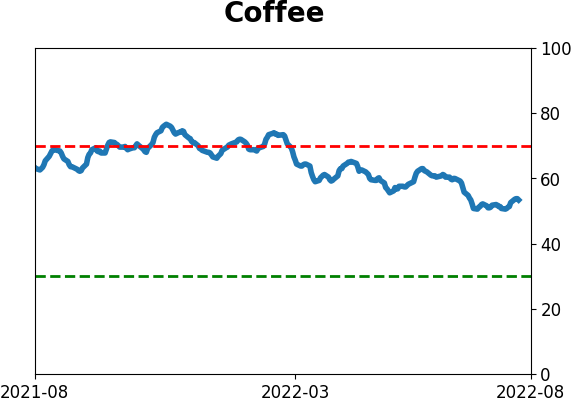
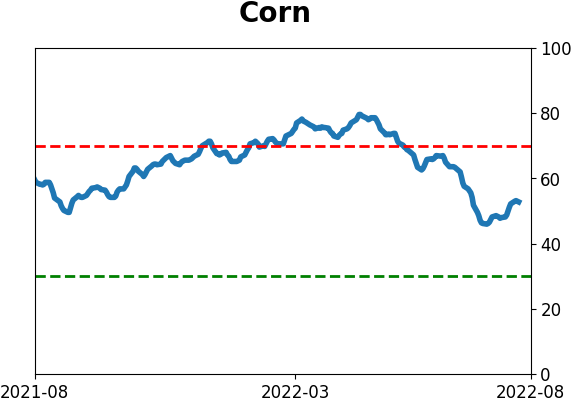
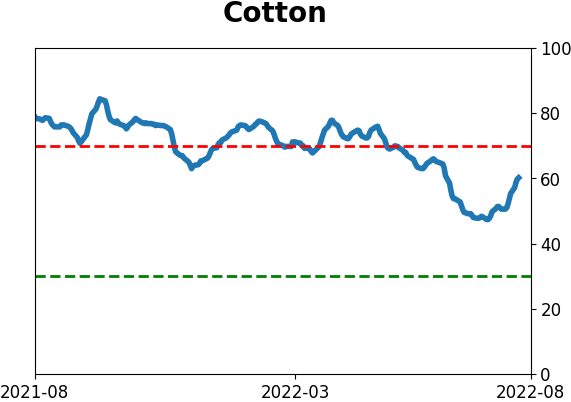
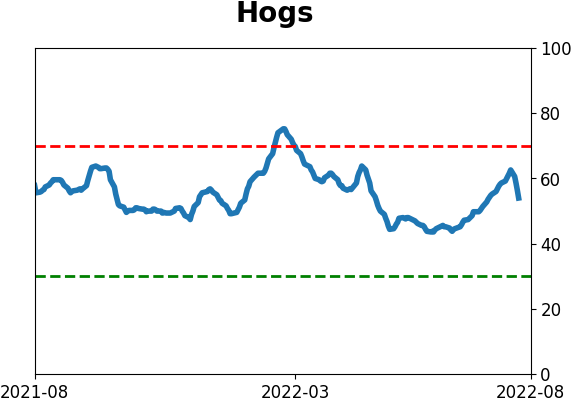
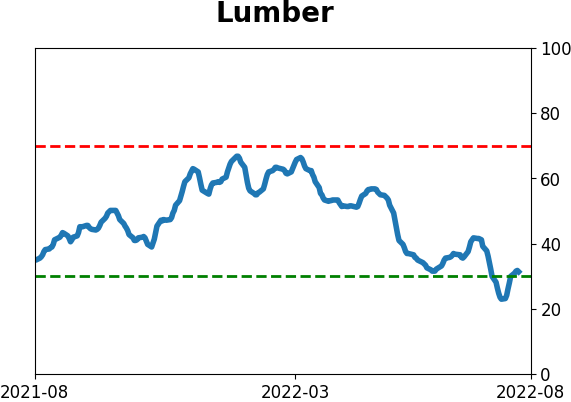
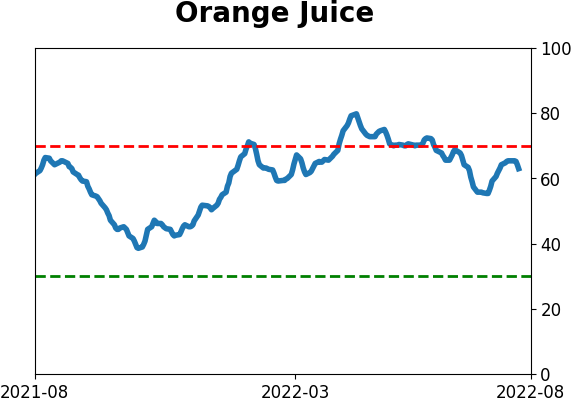
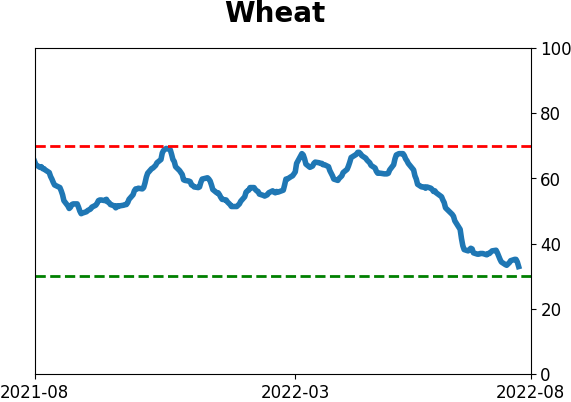
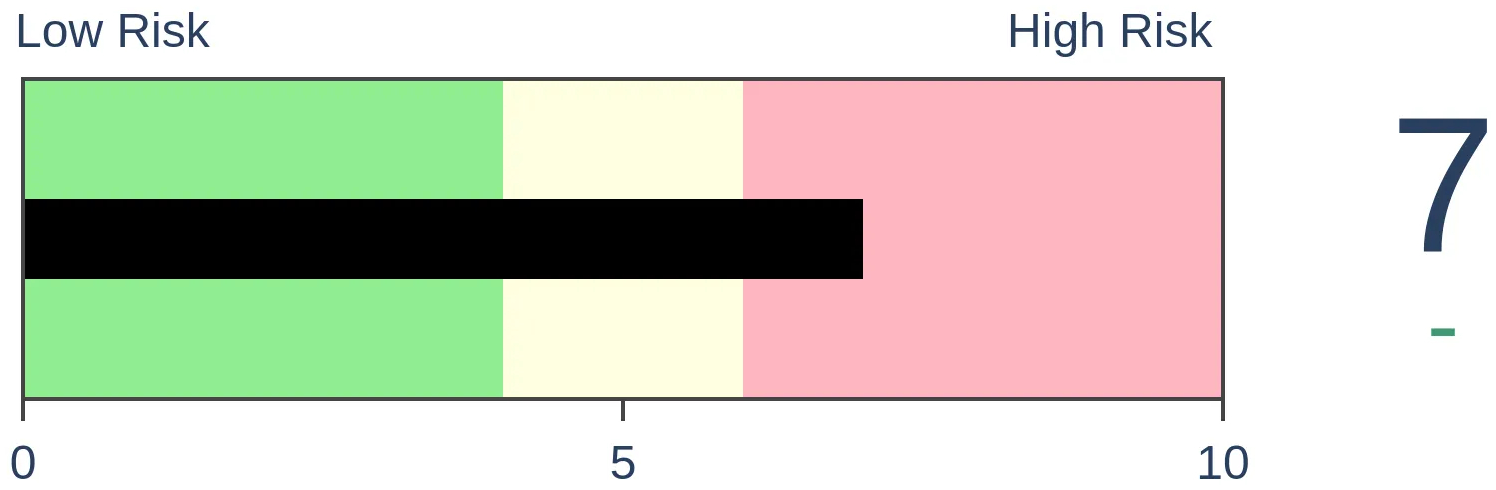
Agriculture
|
|
Research
By Jason Goepfert
BOTTOM LINE
The S&P 500 approached its 200-day average this week, after spending months below it. So far, it has failed the test and is trading below its approach point. Similar failures triggered in 2001 and 2008. But those were outliers, and other failures were quickly reversed. Also, the Dow Industrials has passed its test so far, a good sign for future returns.
FORECAST / TIMEFRAME
None
|
Key points:
- The S&P 500 approached its 200-day average after months below and failed
- Previous failures triggered in 2001 and 2008, but overall, it was not a consistent warning sign
- The Dow Industrials passed its test, with a successful breach of its 200-day, a good sign for future returns
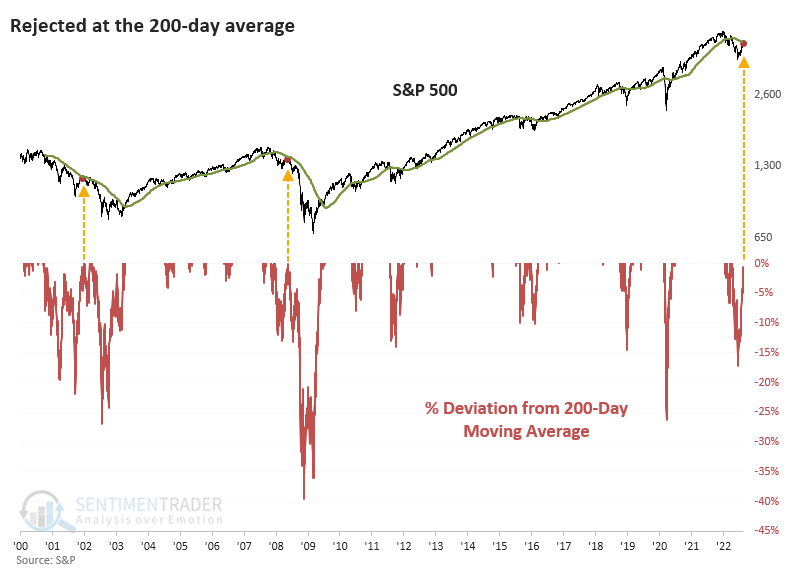
The S&P 500 failed its test against the 200-day average
The most important index in the world approached the most important technical level in the world on Monday. It failed.
Both superlatives are arguable, of course. But the S&P 500 has more assets benchmarked against it than any other global index. And the 200-day moving average is the most consistently used indicator among those who look at price charts.
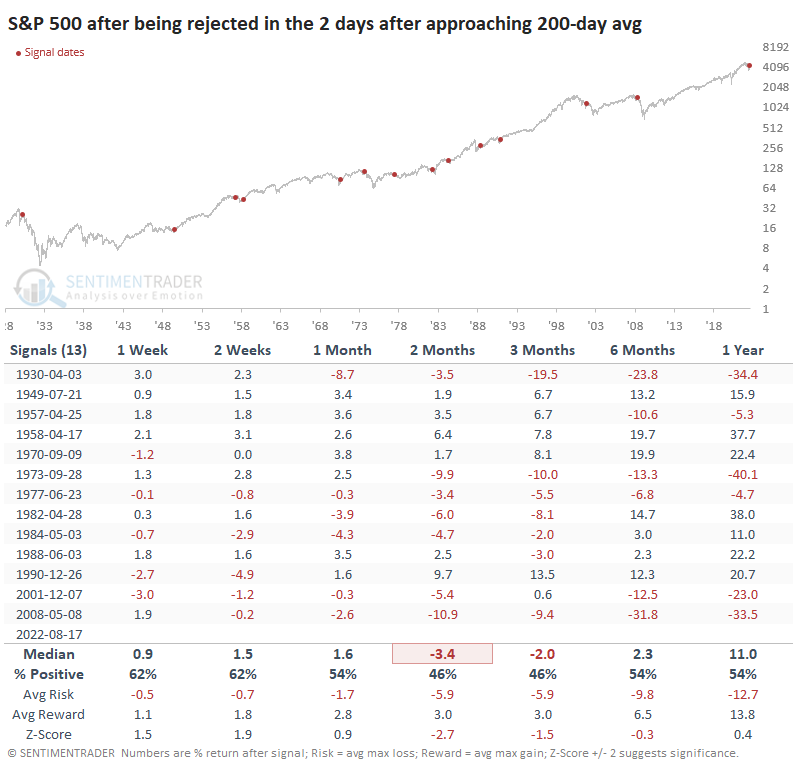
For the first time in several months, the S&P approached its 200-day average on Monday, and so far, it has failed to pop above it. This also happened in 2001 and 2008. Gulp.
This only includes times when the index spent more than 63 trading days at least 1% below its 200-day average. It got close to this in 2011 and 2020 but didn't quite meet the criteria.
Since 1928, there have been a dozen similar failures in the couple of days following an approach to the 200-day average. These short-term rejections led to massive losses in 1930 and 1973, along with 2001 and 2008. Those are the cherry-picked disasters that bears will focus on, but there were nine times when the rejections didn't mean much. Seven of them preceded double-digit gains over the next year.
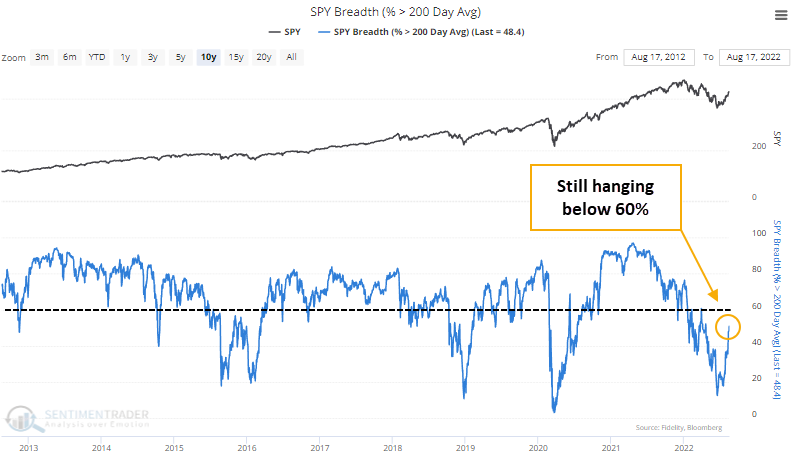
While the S&P index neared its 200-day moving average, fewer than half of its member stocks have climbed above theirs. A hallmark of a healthy index is when 60% or more of the constituent stocks trade above their 200-day moving averages; we still haven't seen that.
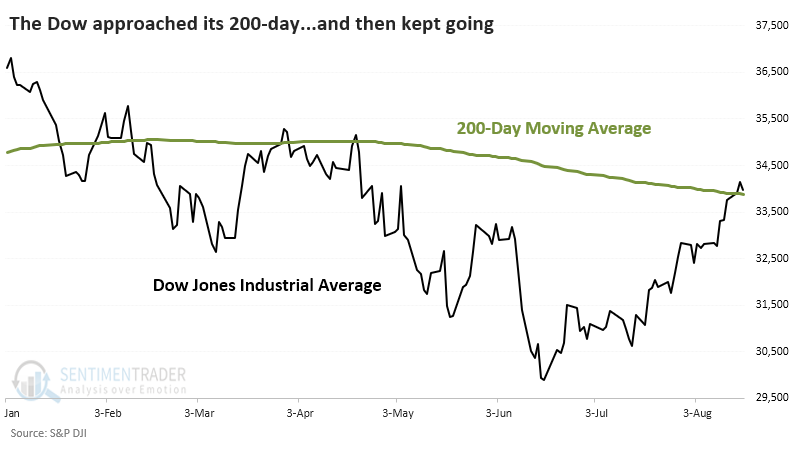
The Dow passed its test, though
Some might argue that the Dow Jones Industrial Average is the most important index. They wouldn't have much of an argument, but at least it's among the most established. And for its part, it approached its 200-day average after months below it and then kept right on chugging.
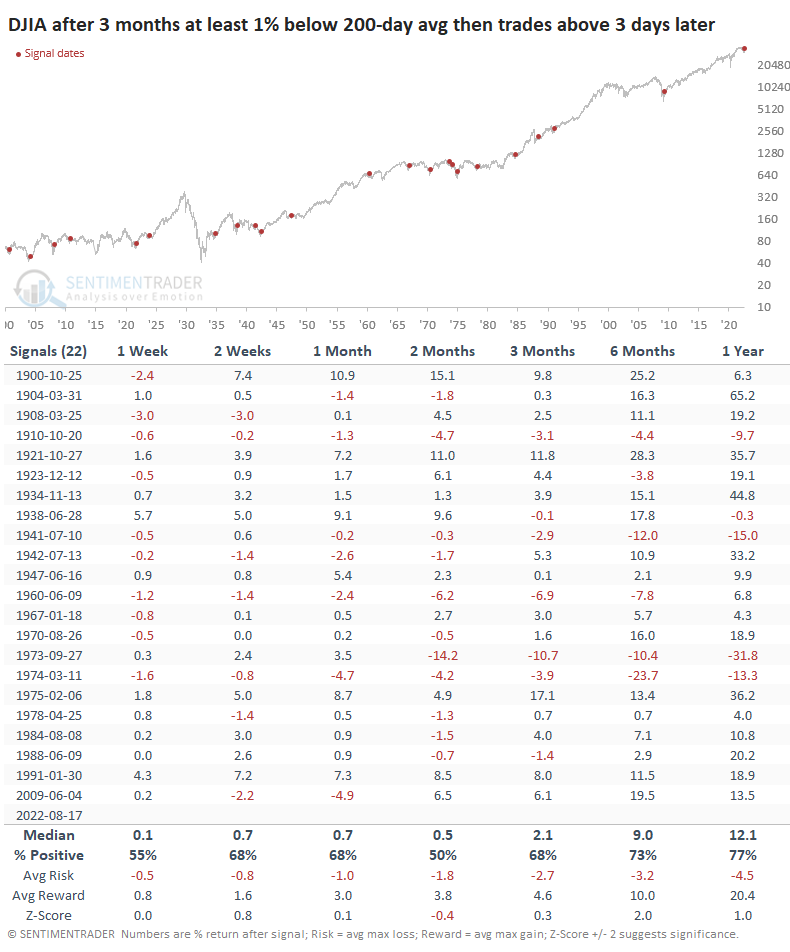
Since 1900, there have been a couple of dozen times when the Dow spent at least three months more than 1% below its average and then, after the next few days, successfully breached the average and traded higher.
These successful approaches did have a better track record of gains for the Dow in the months ahead. Most importantly, risk was significantly reduced. In the table above, the S&P 500 witnessed a median drawdown of -12.7% within the following year. After the Dow breached its 200-day, it suffered an average drawdown of only -4.7%.
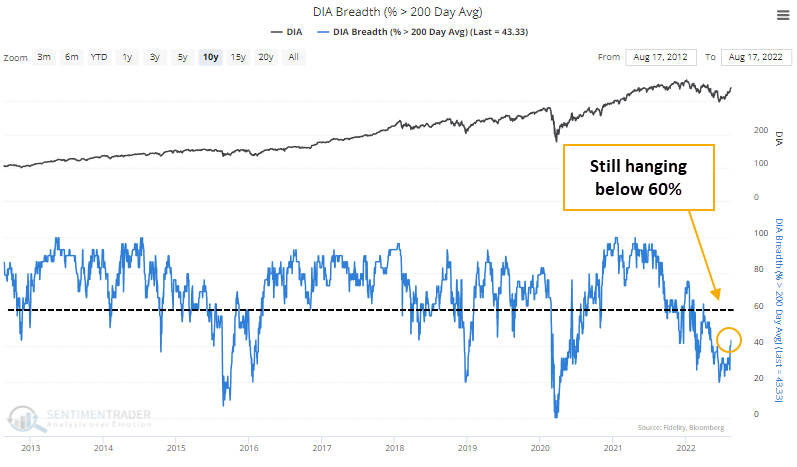
One worrying sign is that most Dow member stocks haven't been able to hurdle their 200-day moving averages. It's even worse than in the S&P, with barely 40% of index members holding above their averages.
What the research tells us...
Whether stocks have passed the test of their 200-day average depends on what we mean by "stocks." As a general rule, we use the S&P 500 because that's the index upon which $13 trillion of assets is benchmarked. And so far, that index has failed its test. The last couple of failures were ill omens, and it's worth keeping in mind.
It's not a very robust warning - a slight modification in the test lessens the bearish outcomes, and there were twice as many big gains as big losses. Also, the DJIA has so far passed its test. While that wasn't necessarily a buy signal, it was a good sign for future returns. We just need to see more stocks within the indexes rise above and hold their averages.
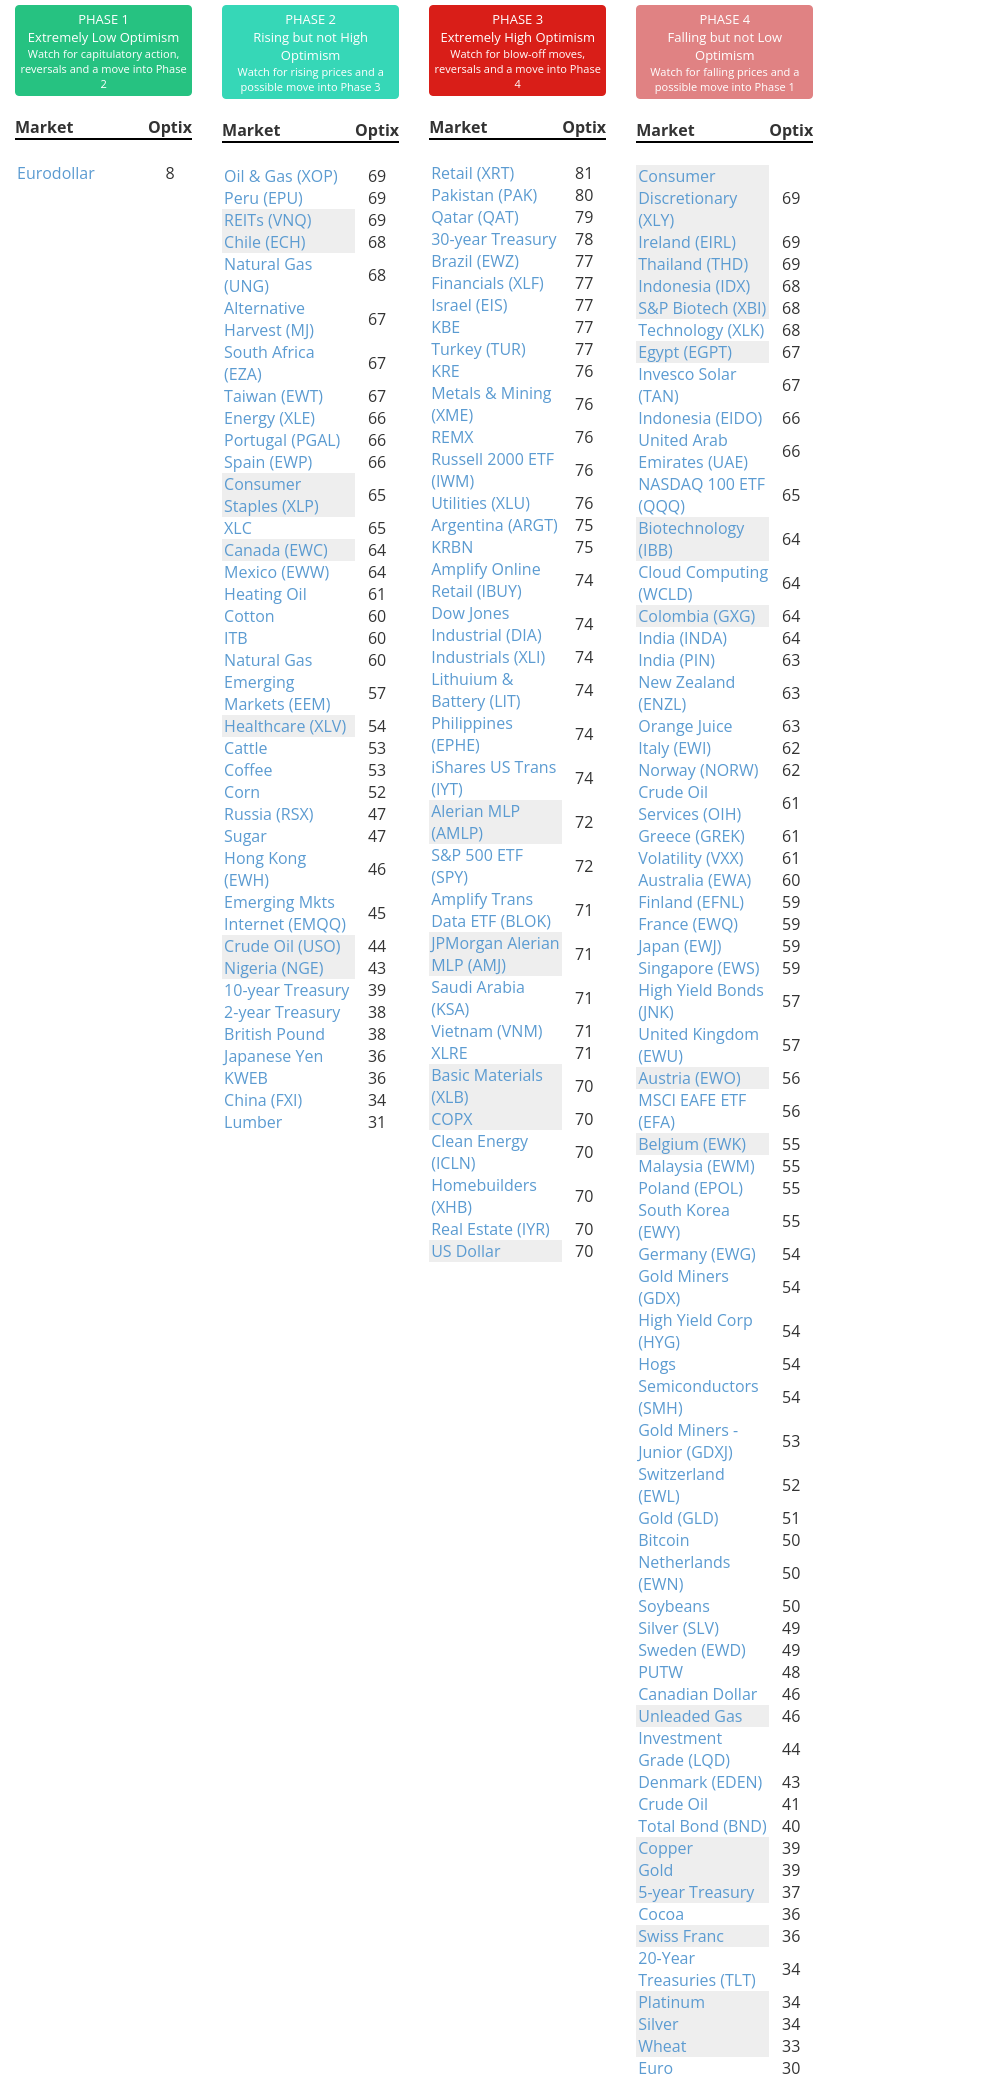
Indicators at Extremes
Phase Table
Ranks
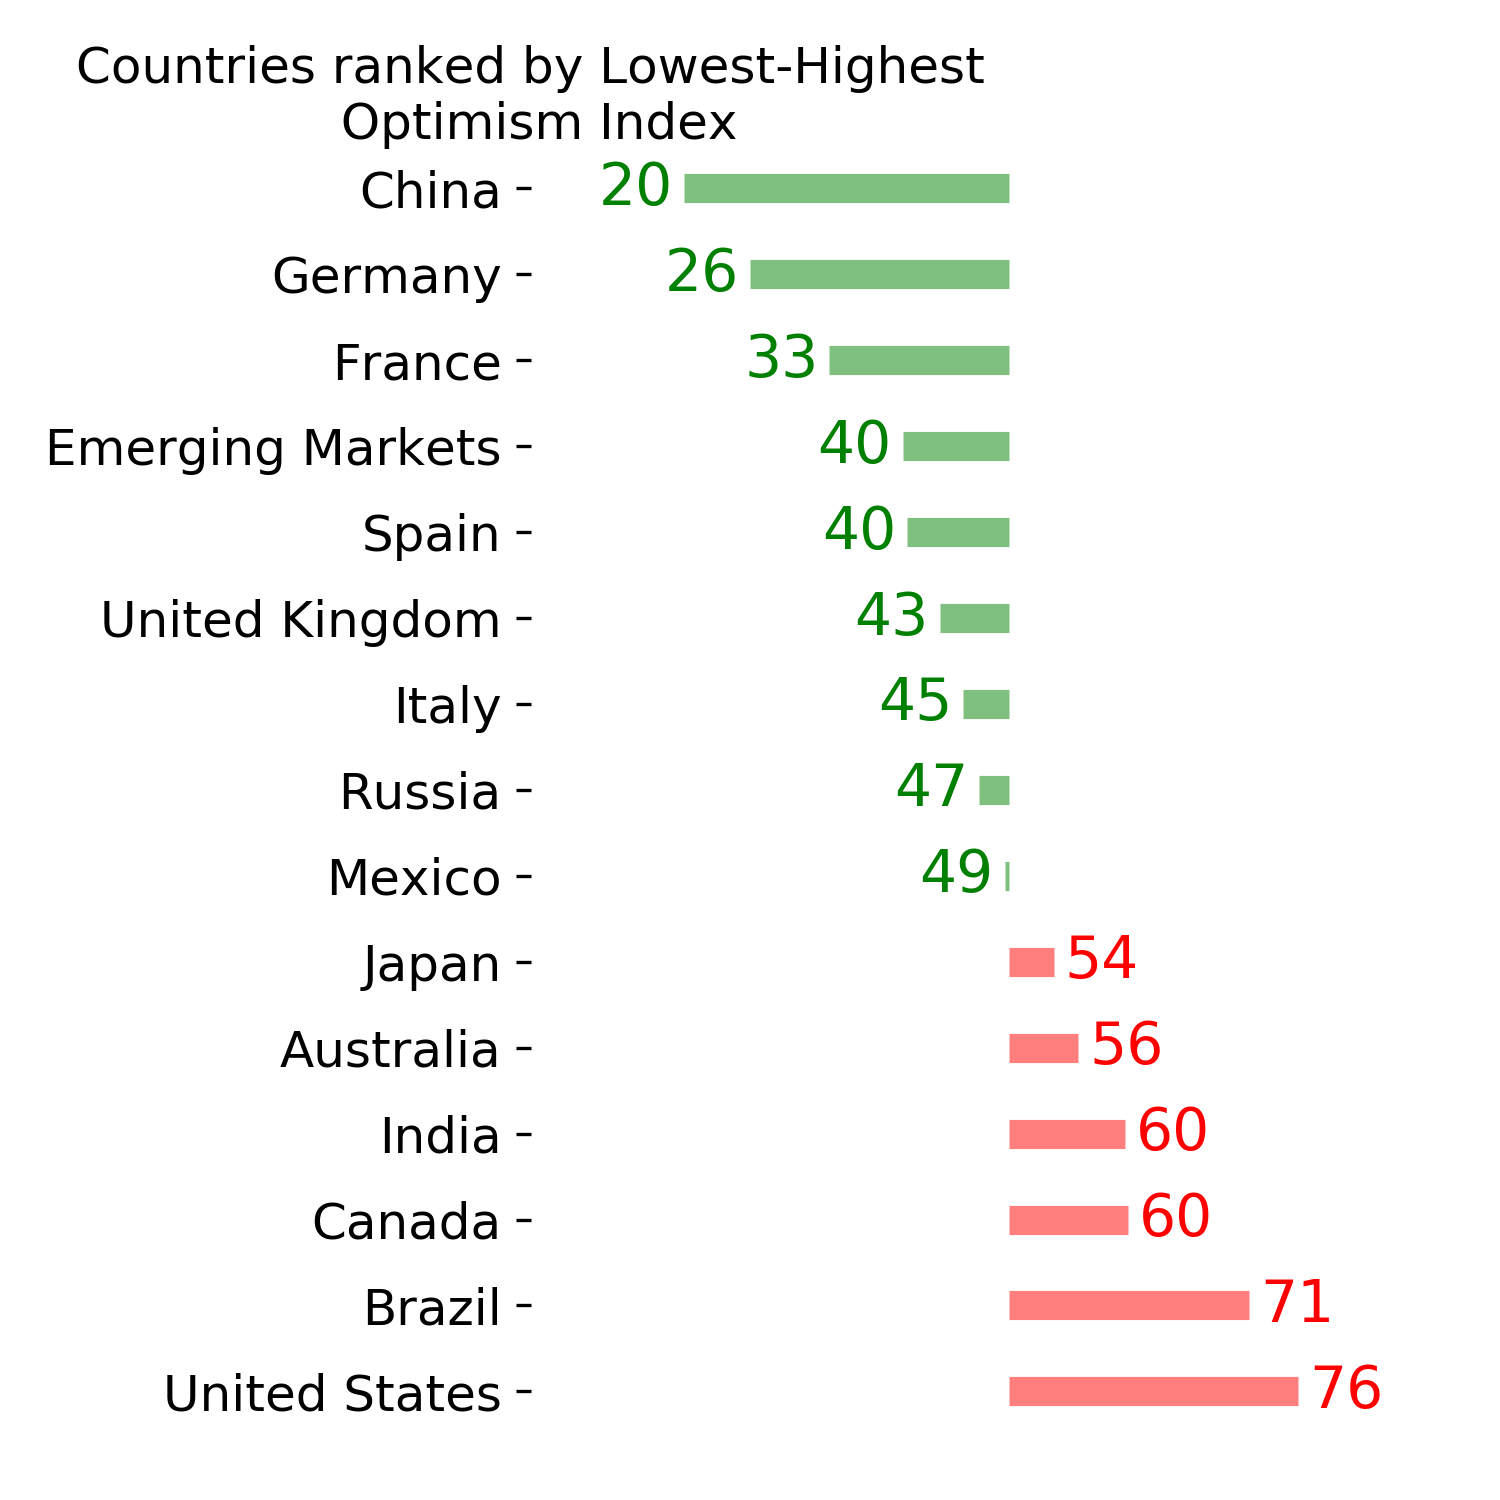
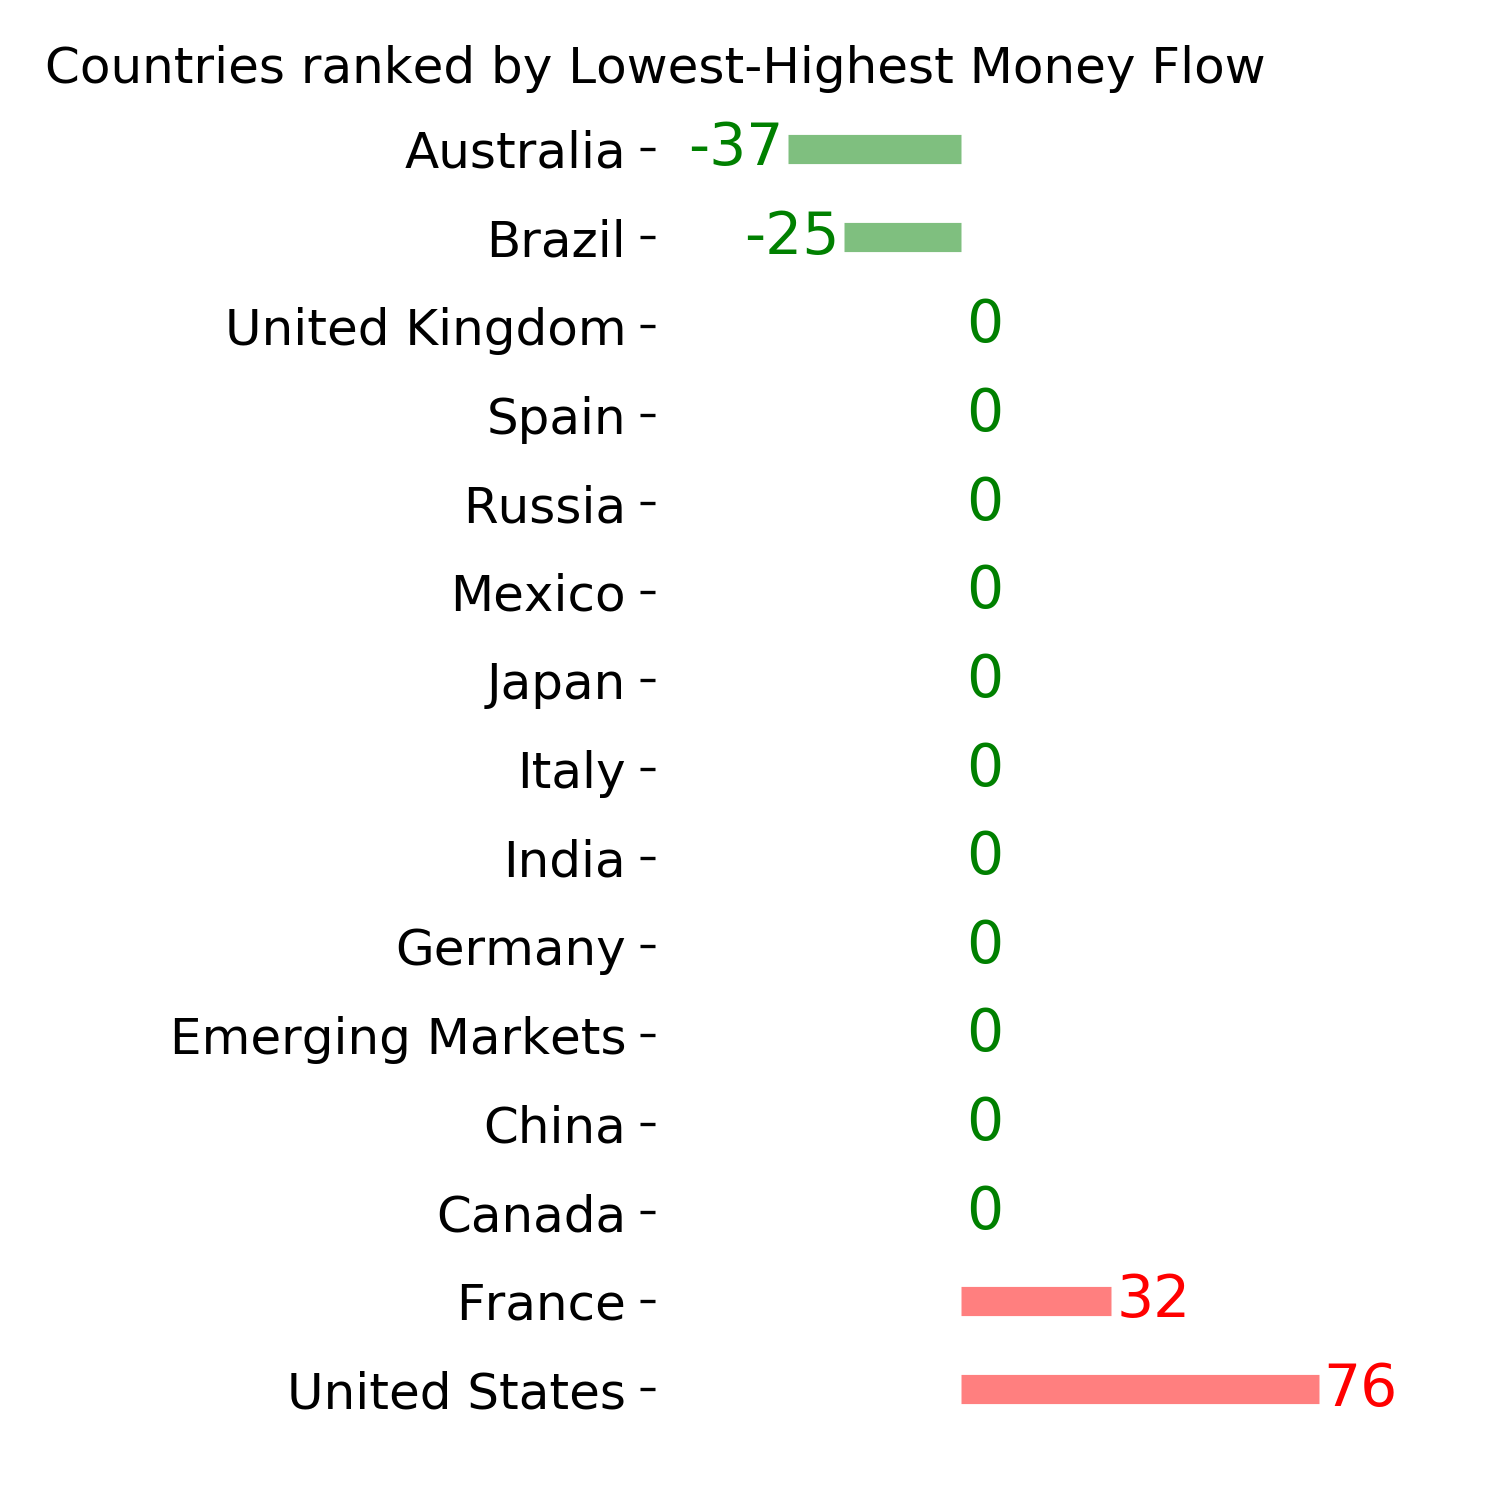
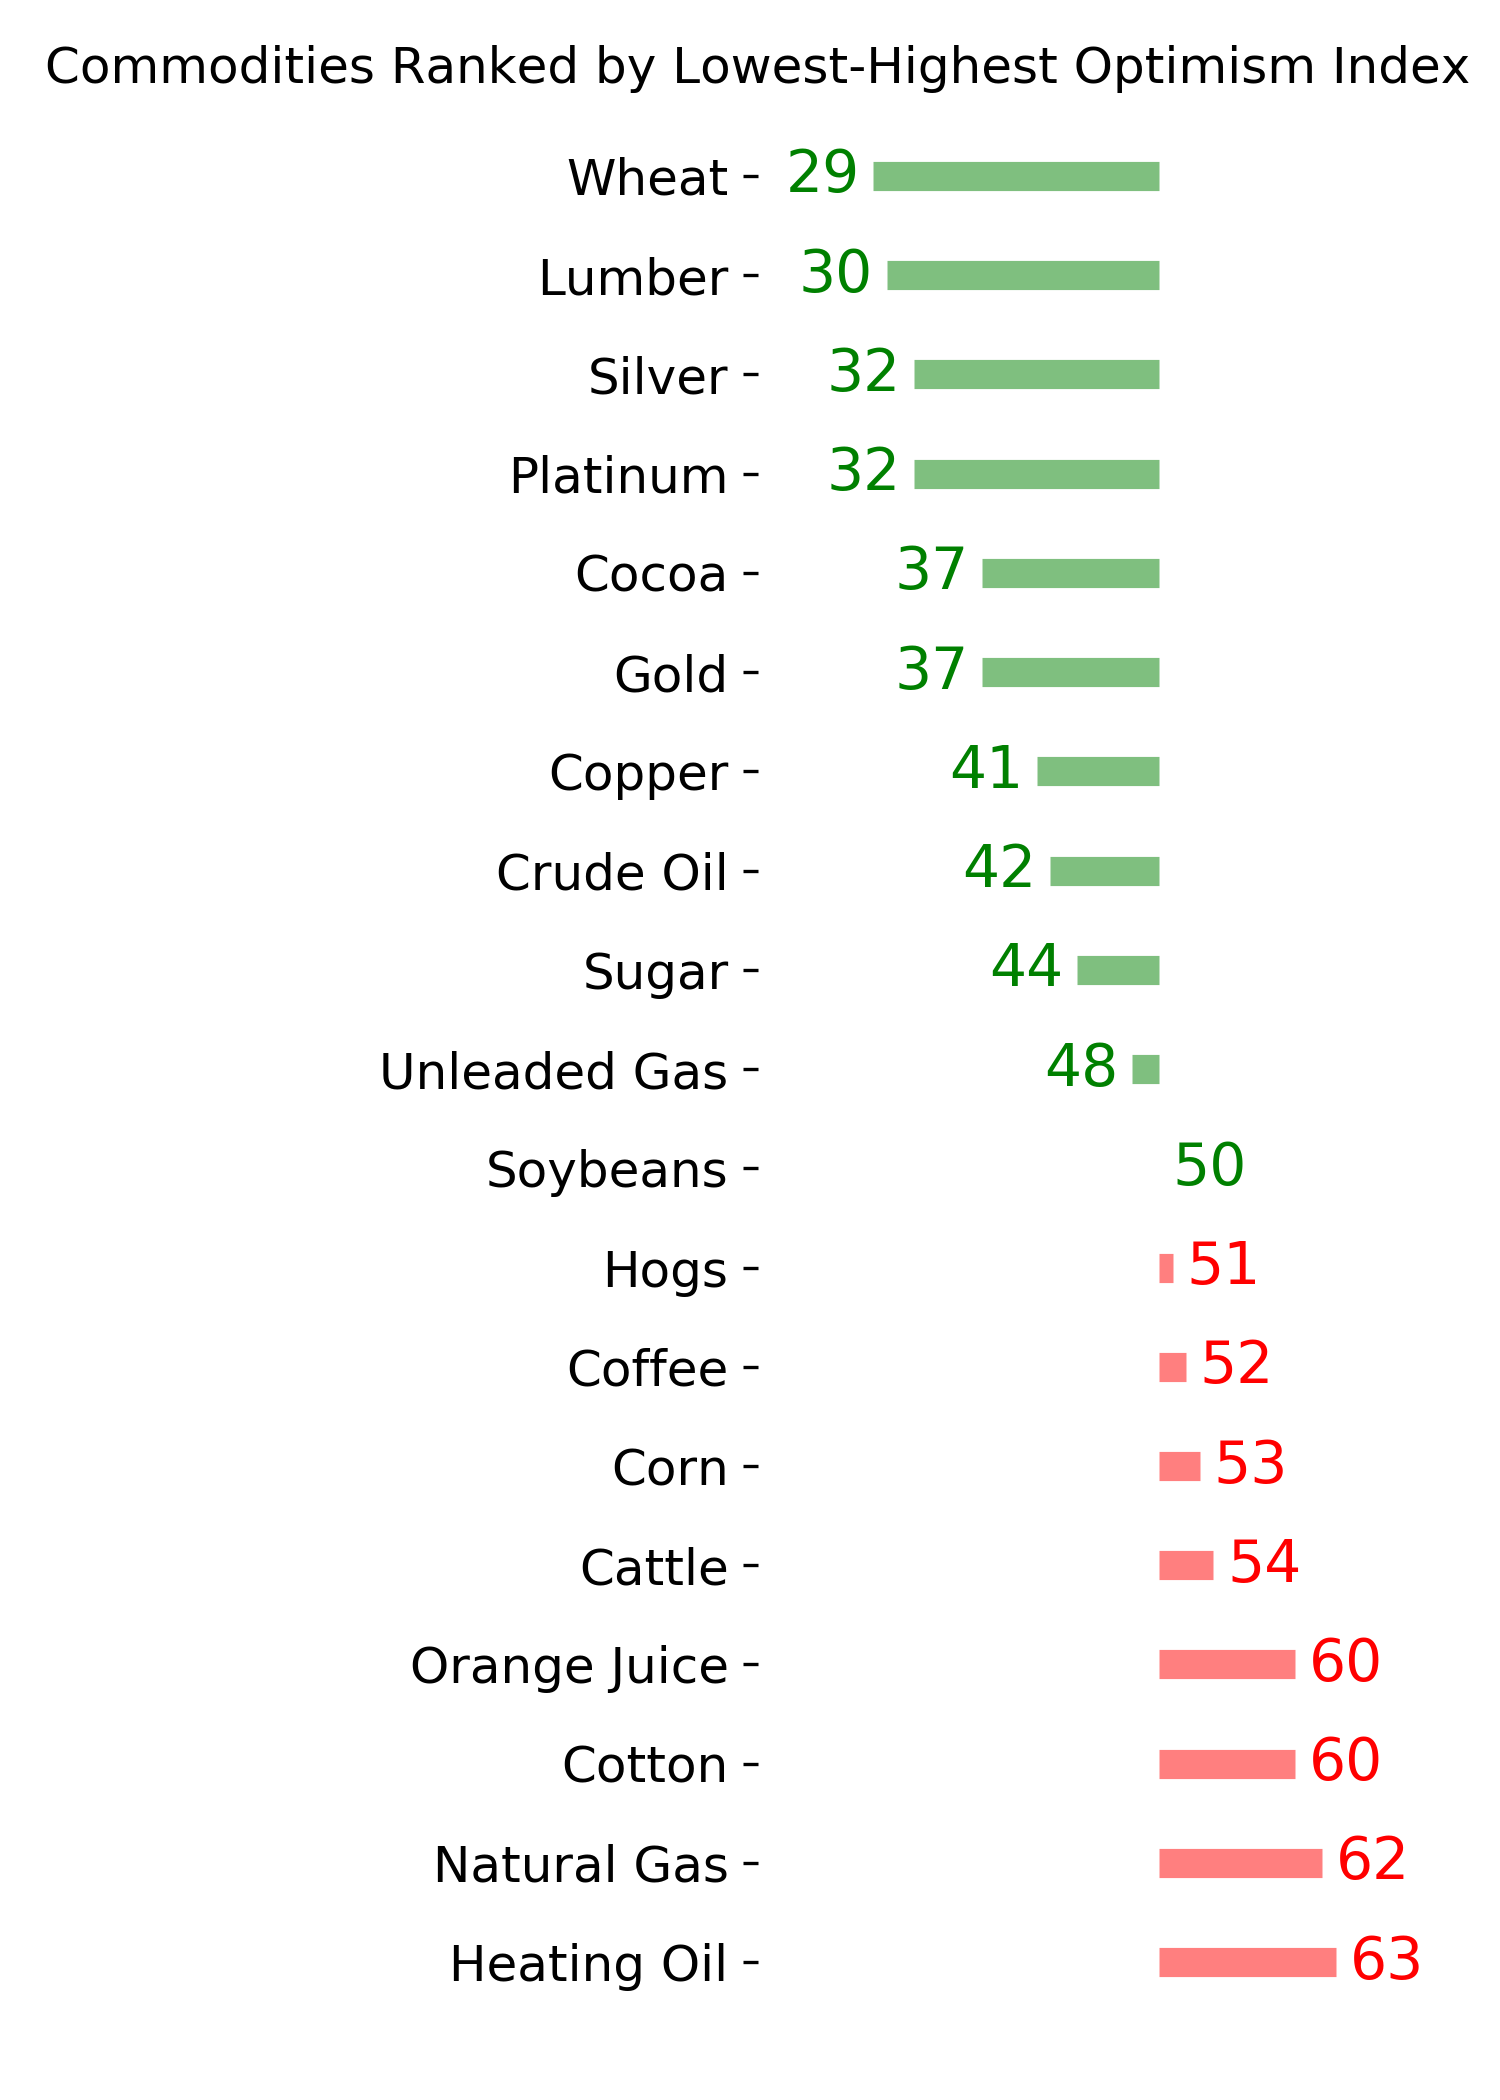
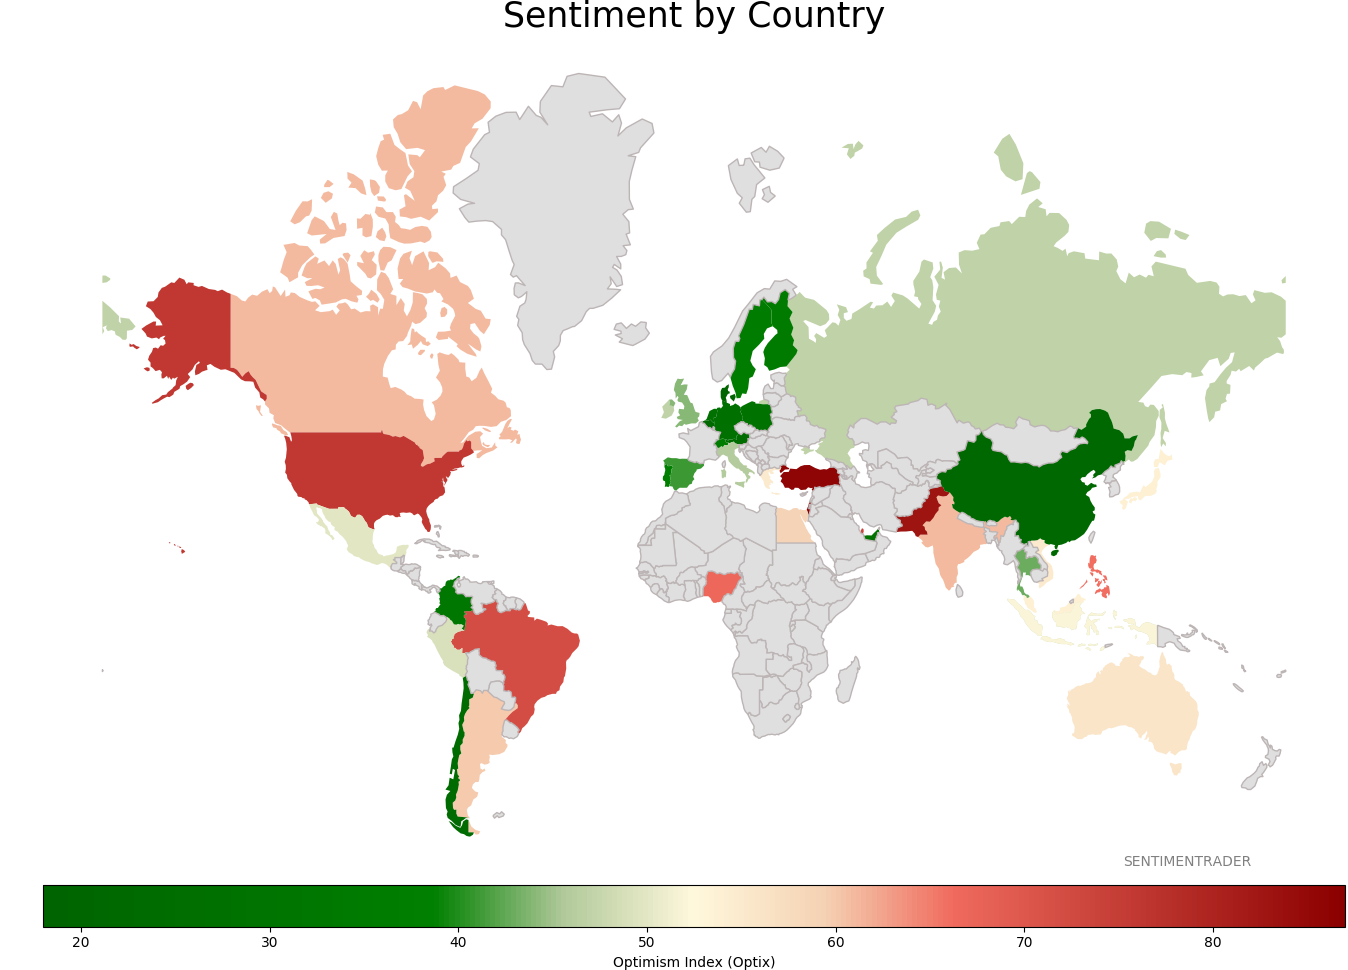
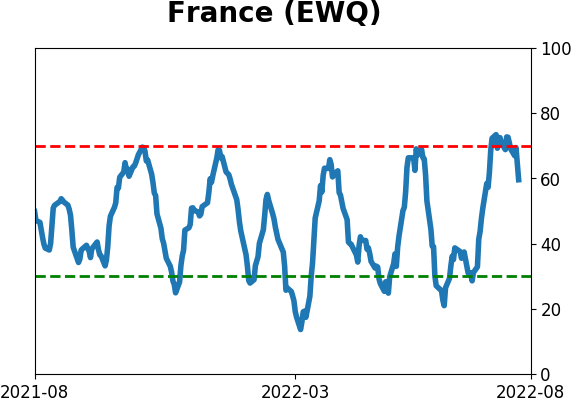
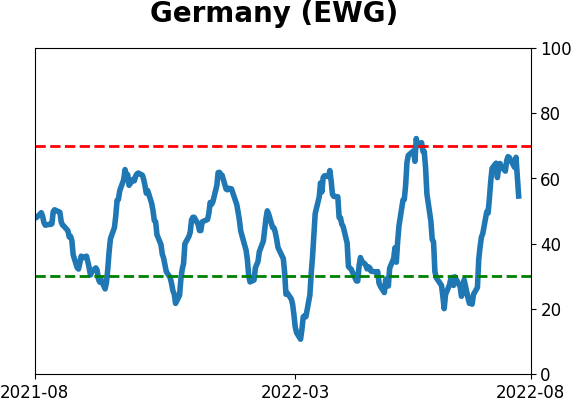
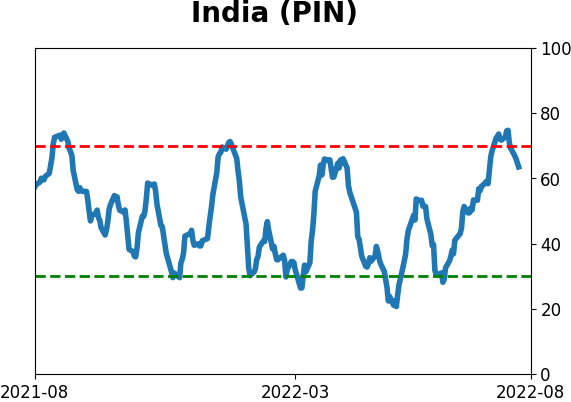
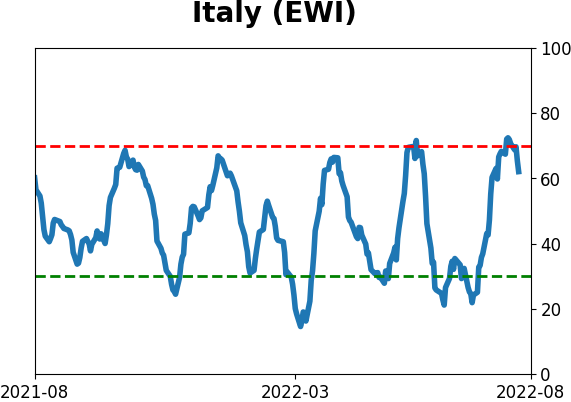
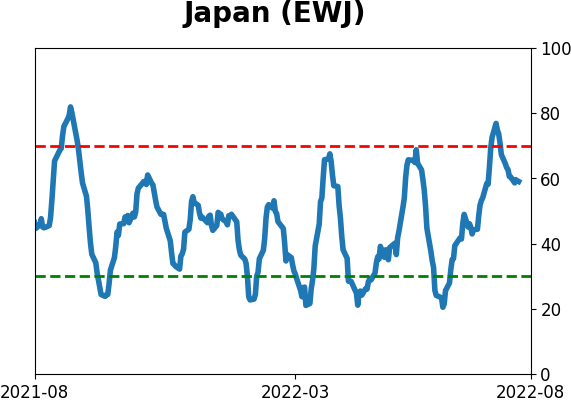
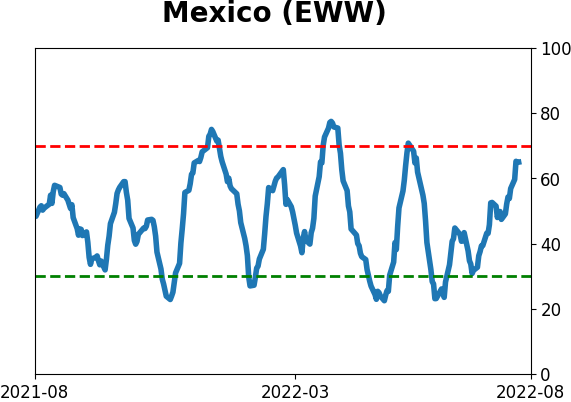
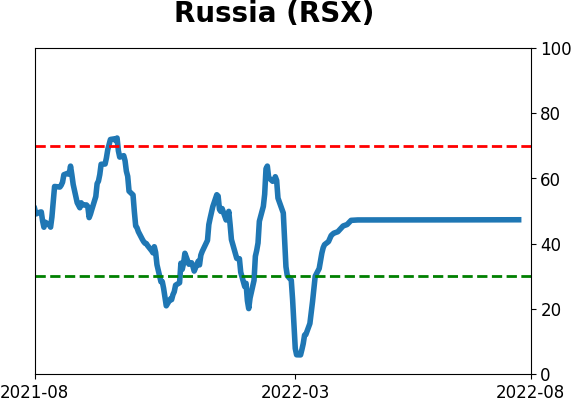
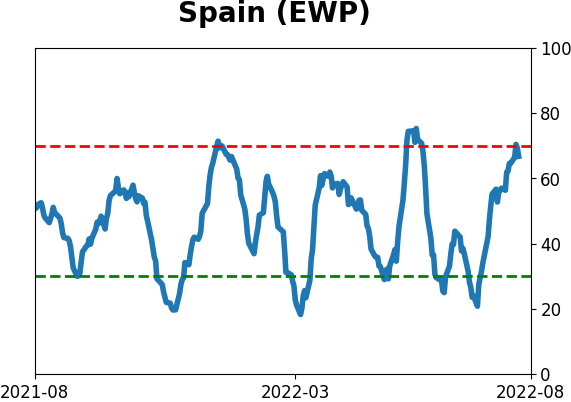
Sentiment Around The World
Optimism Index Thumbnails
|
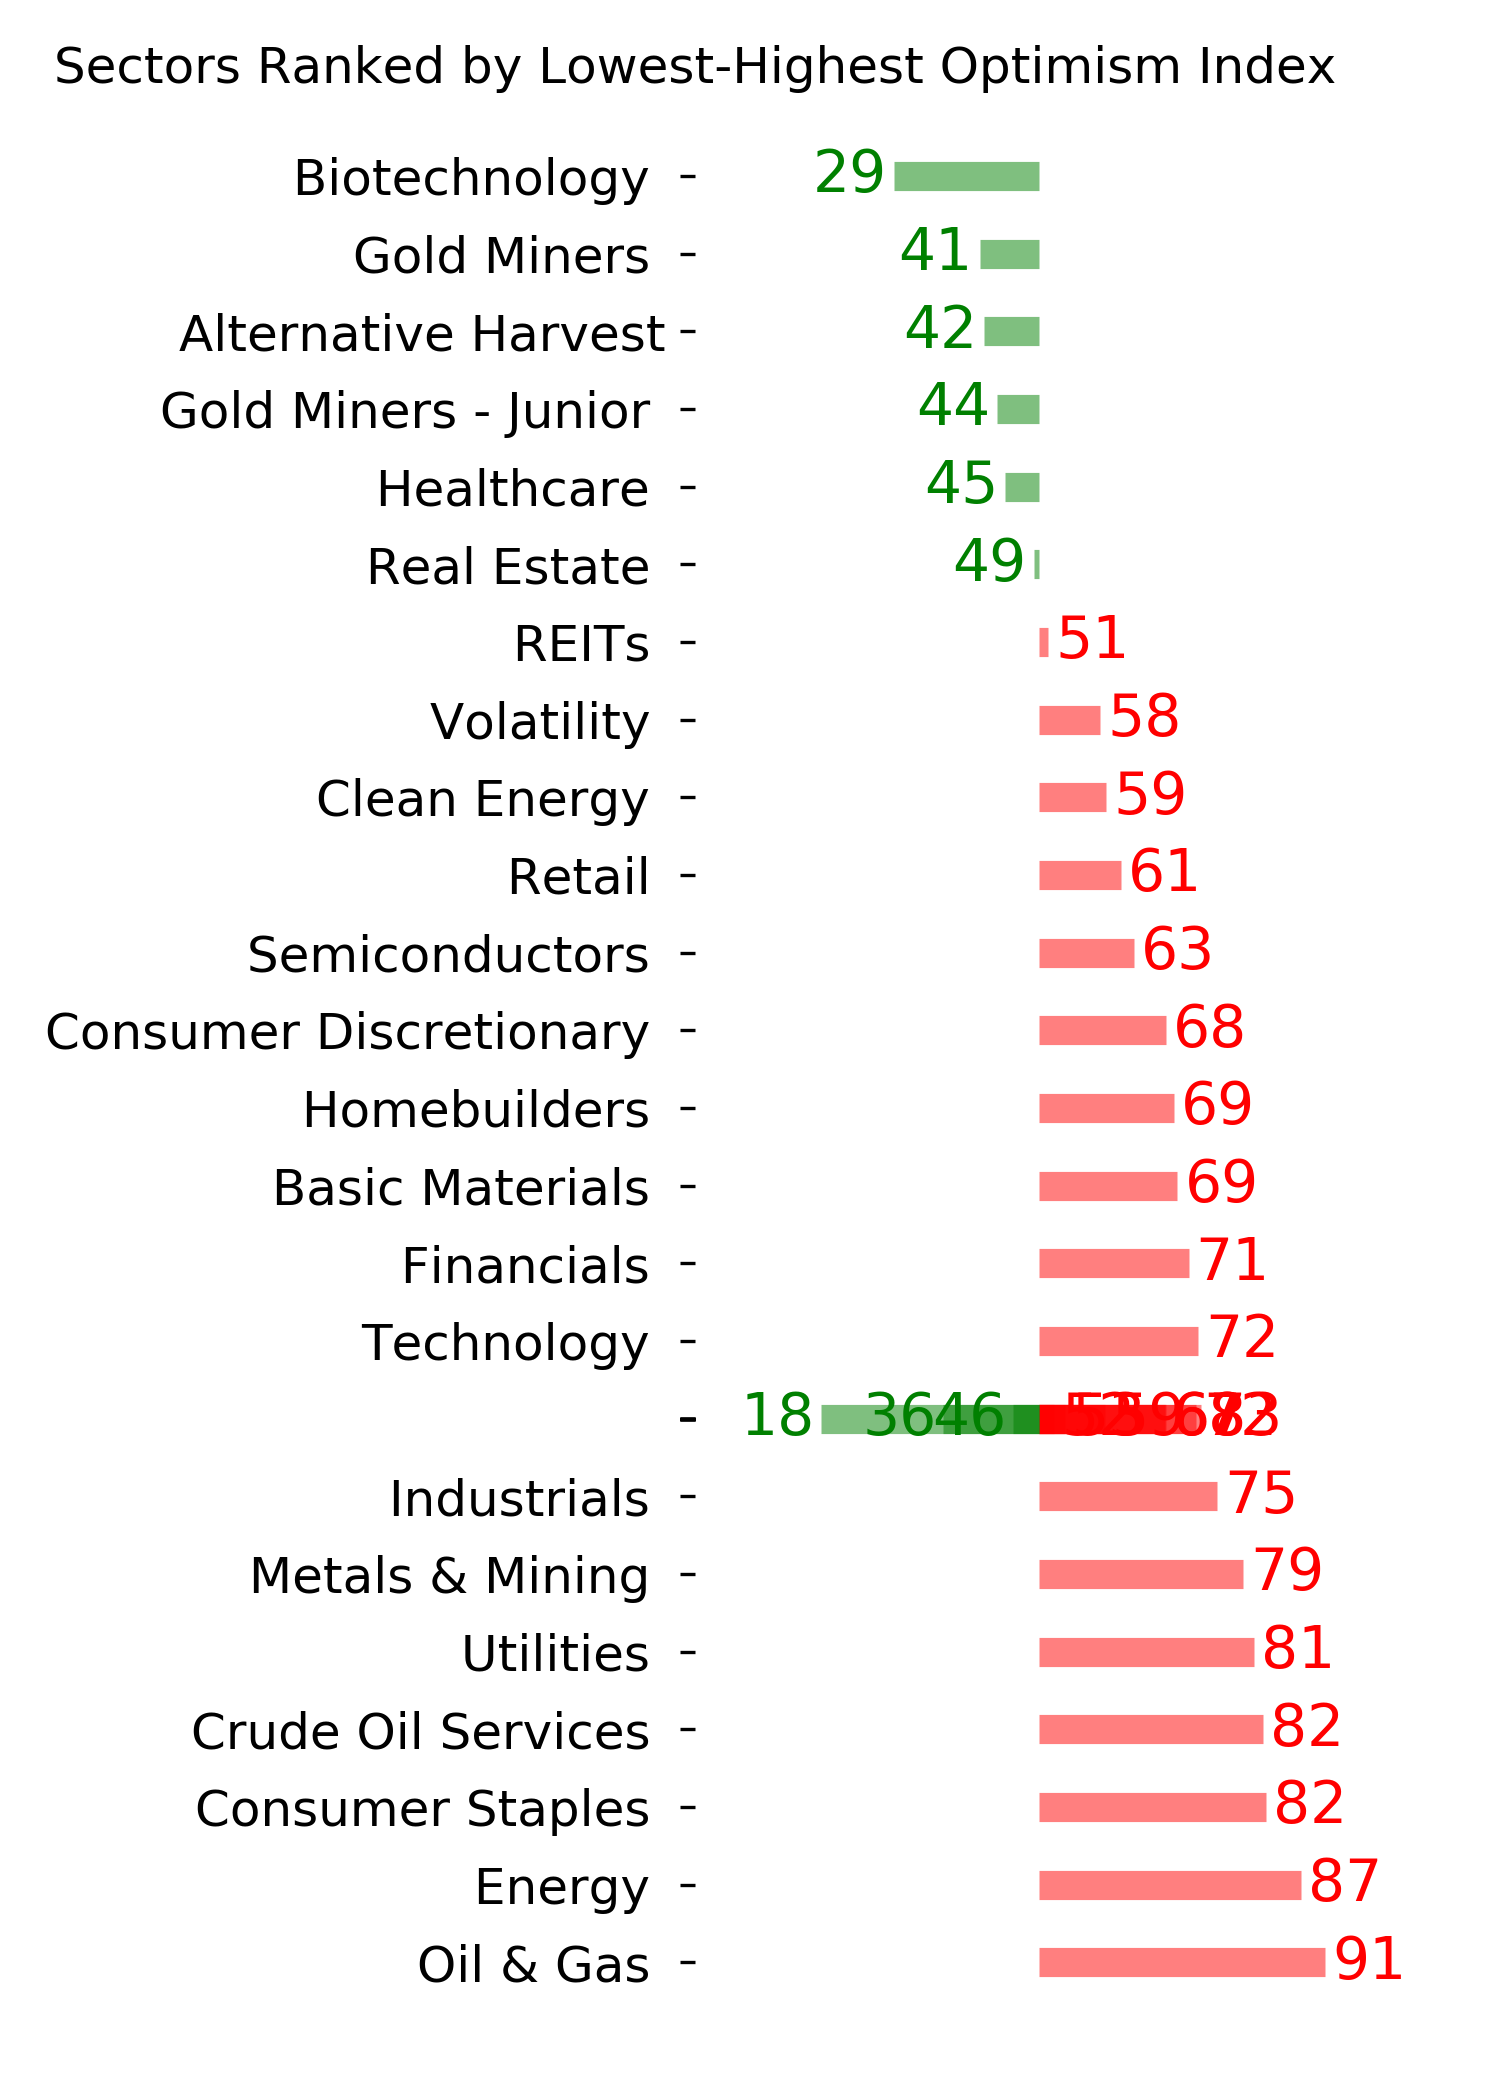
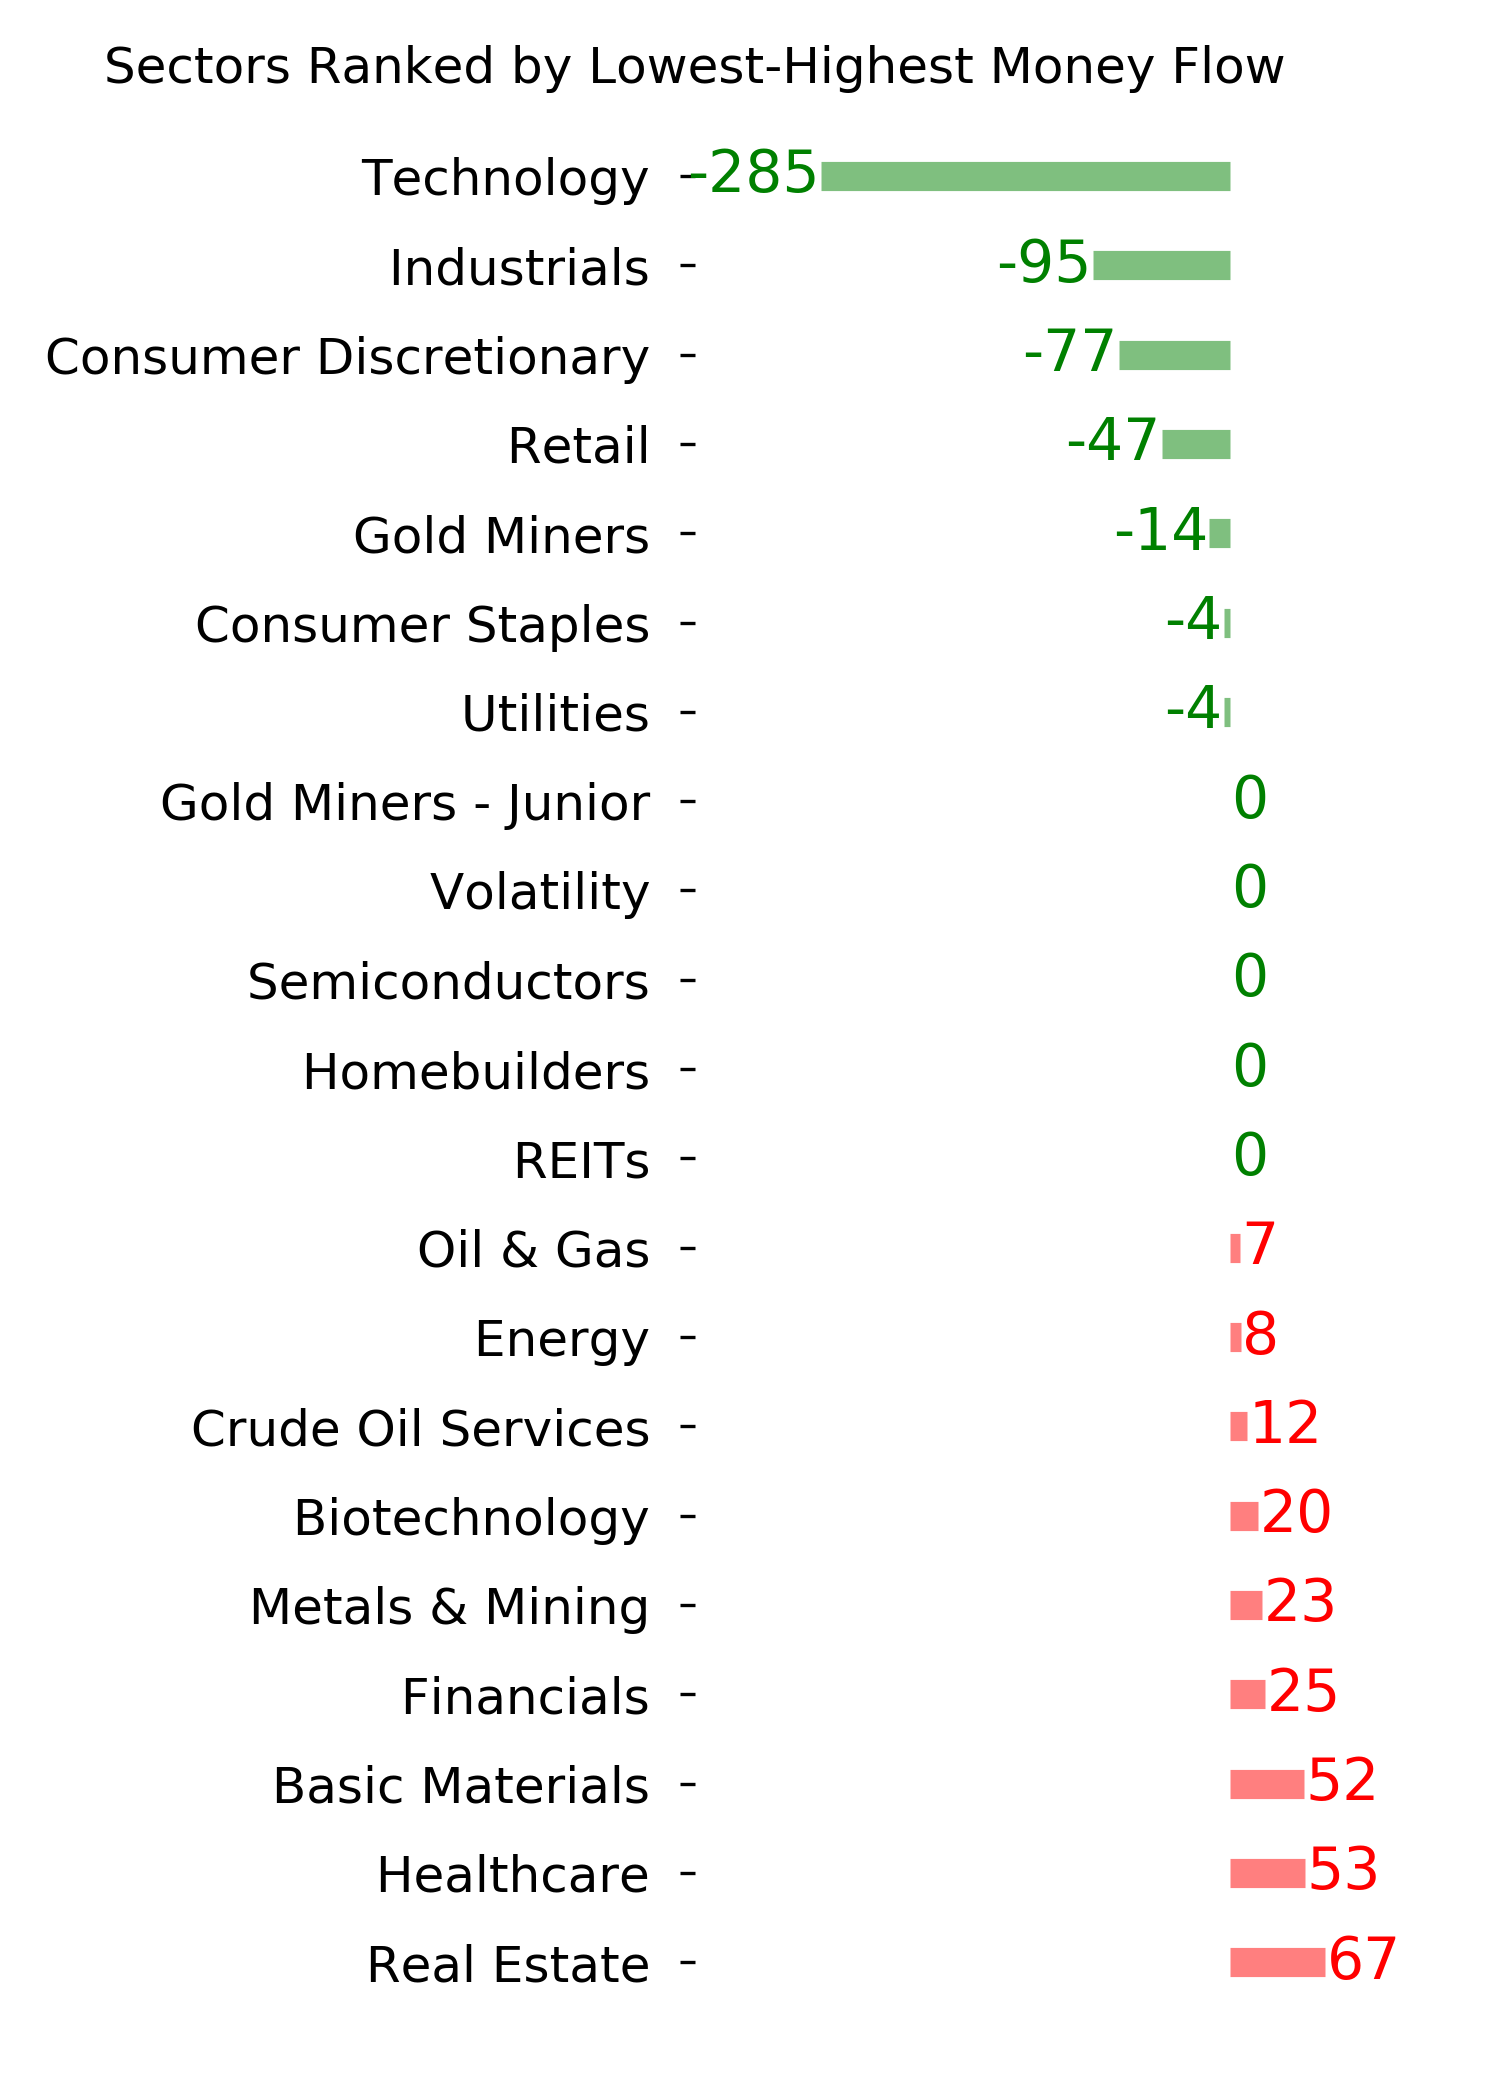
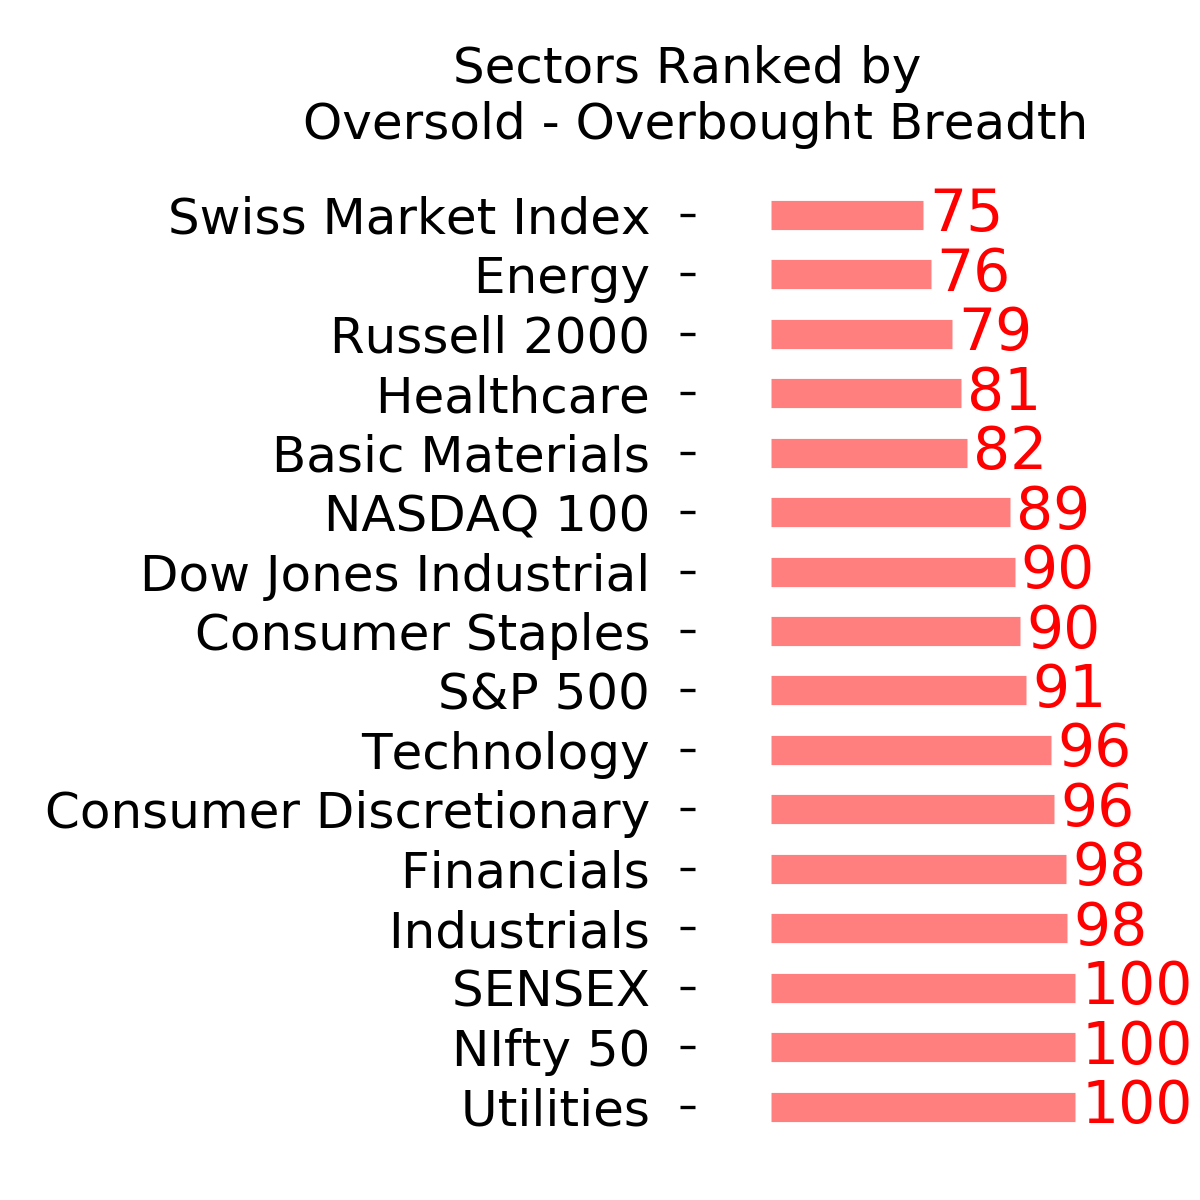
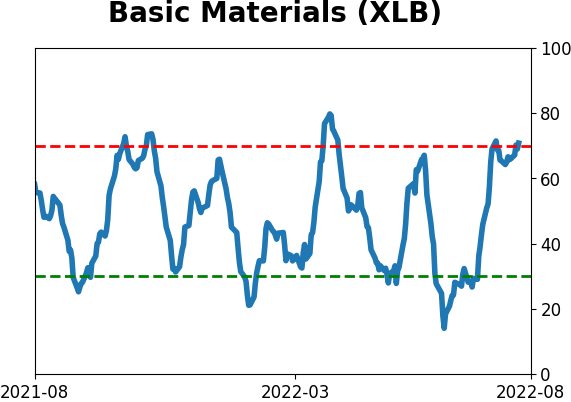
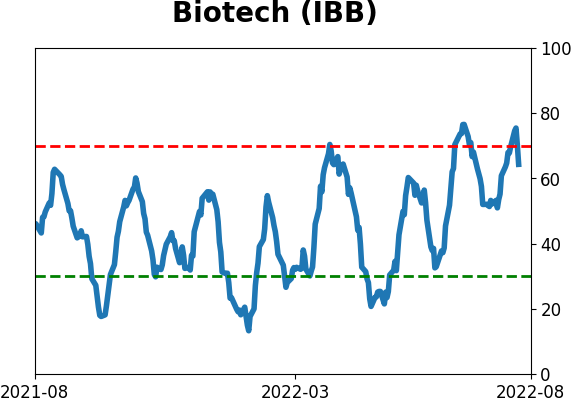
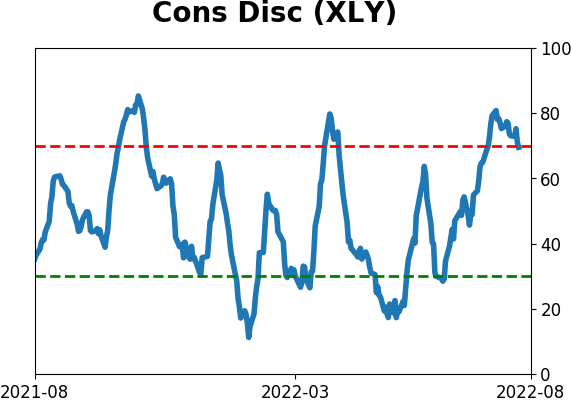
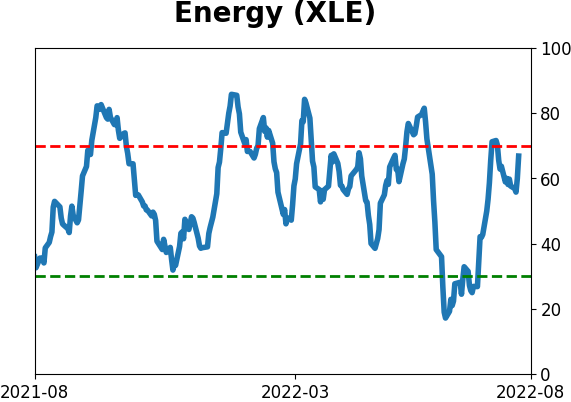
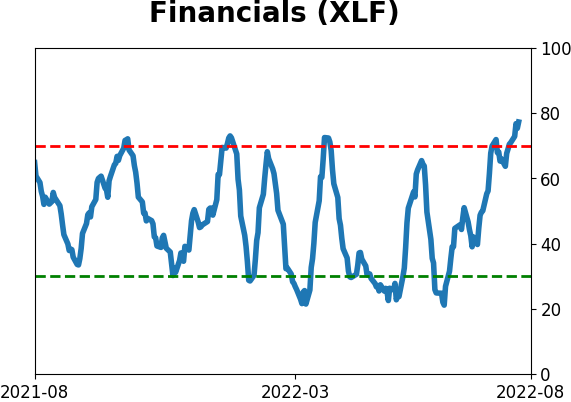
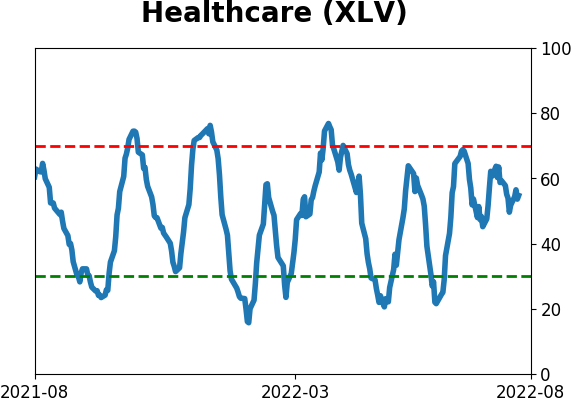
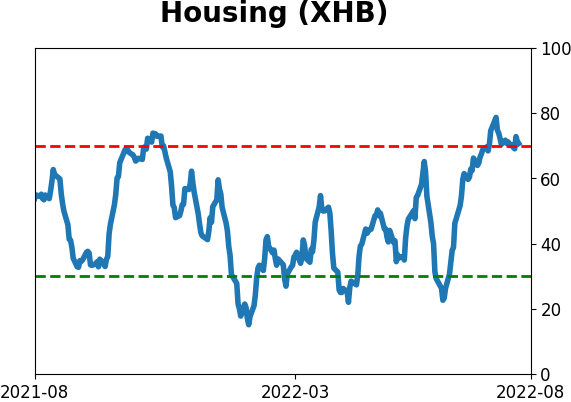
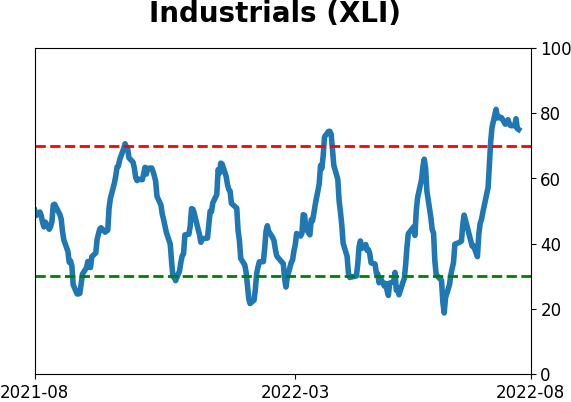
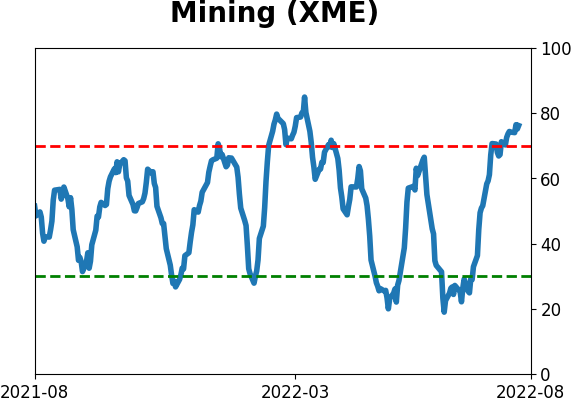
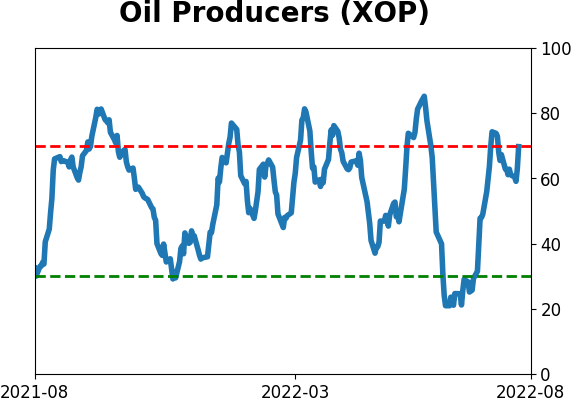
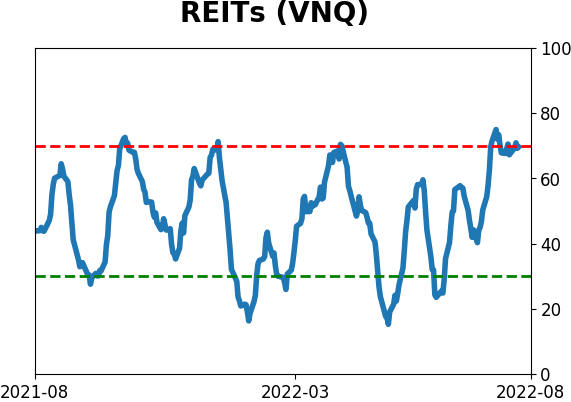
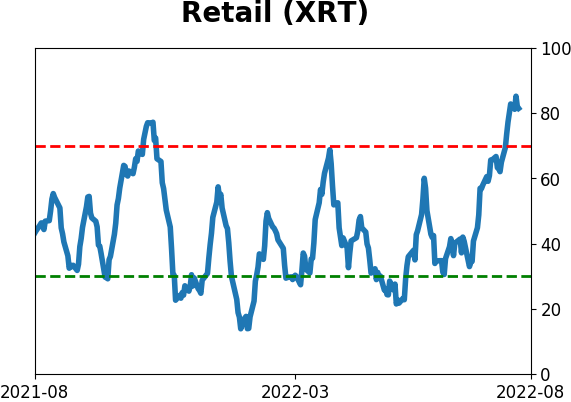
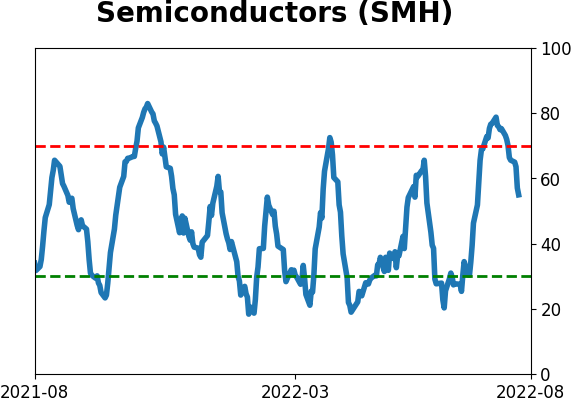
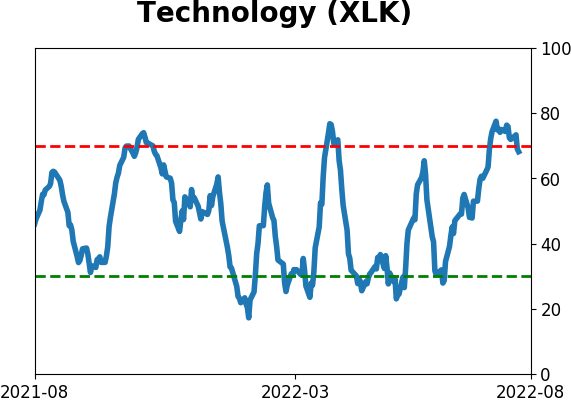
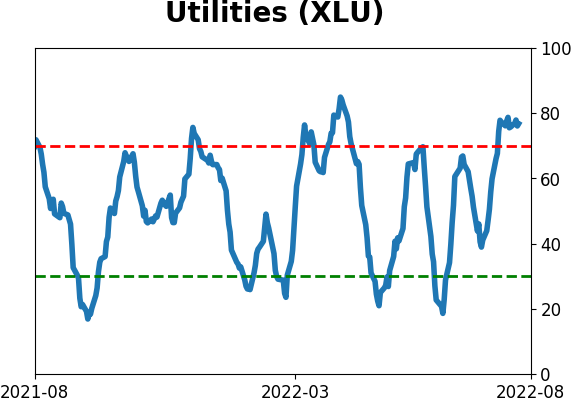
Sector ETF's - 10-Day Moving Average
|
|
|
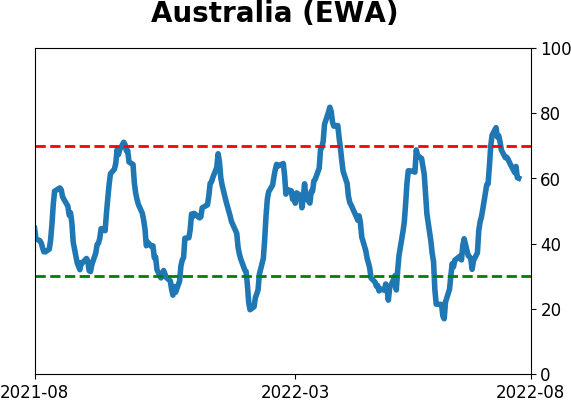
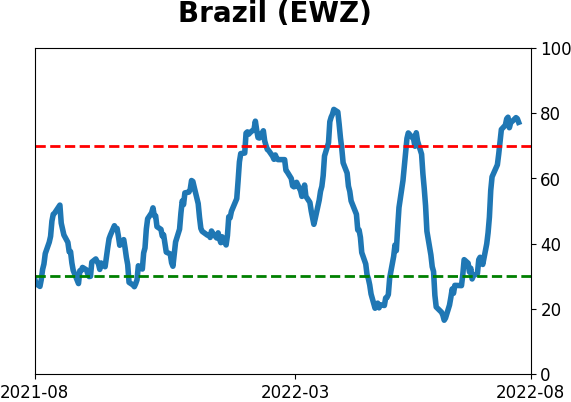
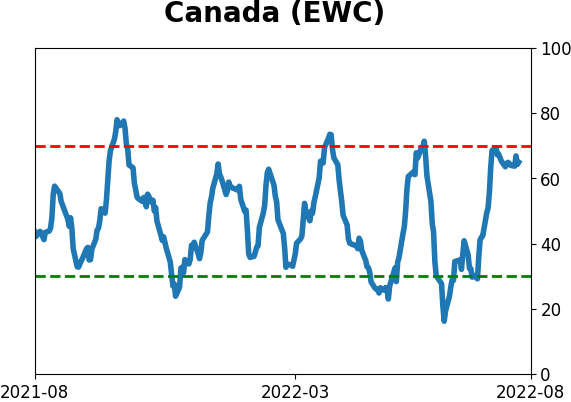
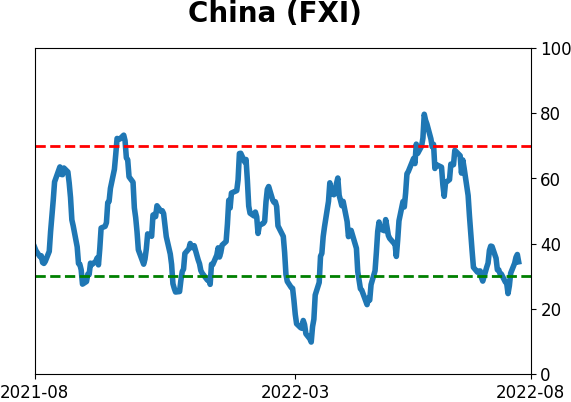
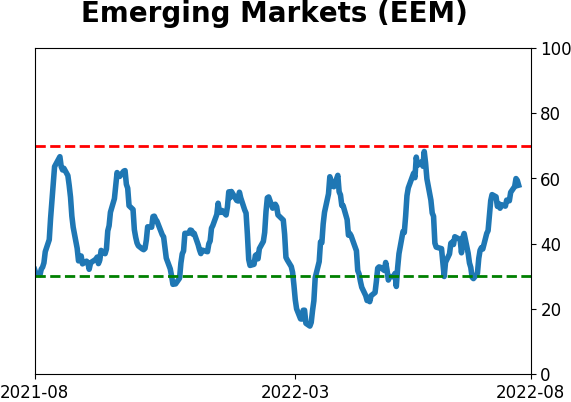
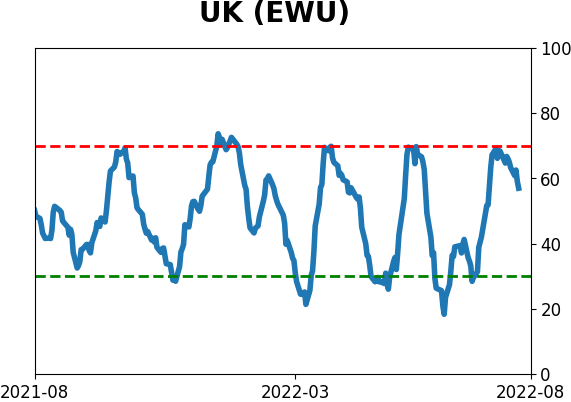
Country ETF's - 10-Day Moving Average
|
|
|
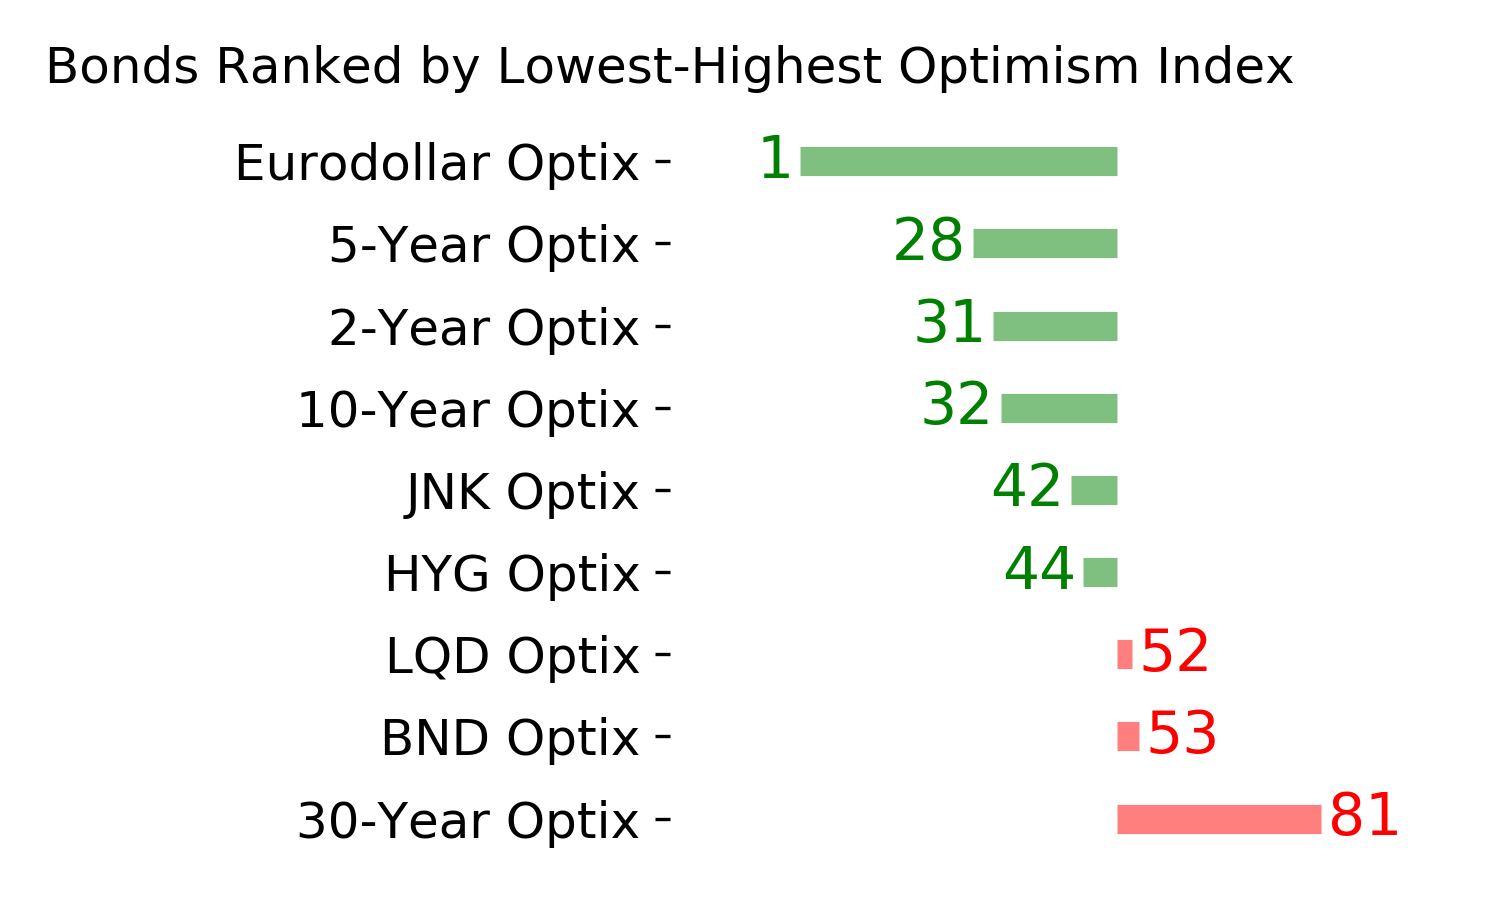
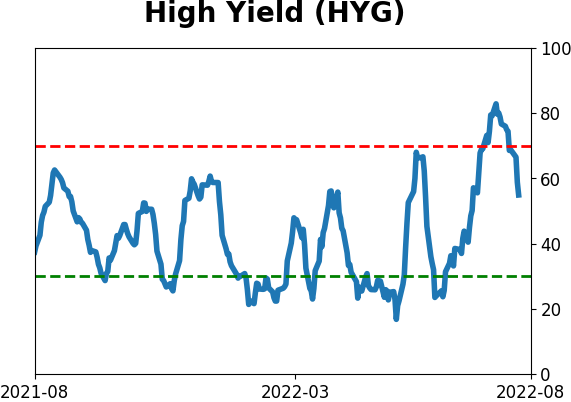
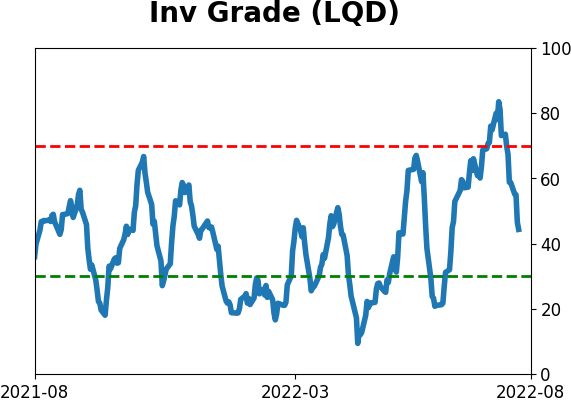
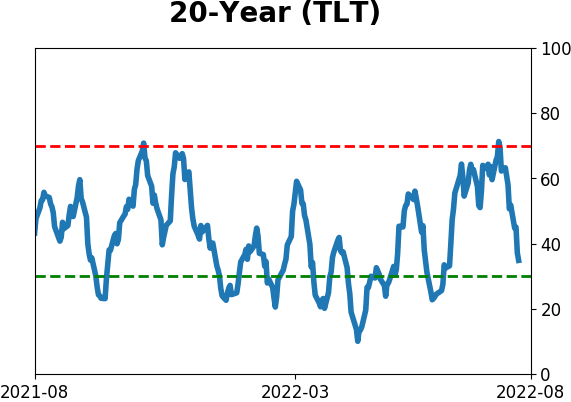
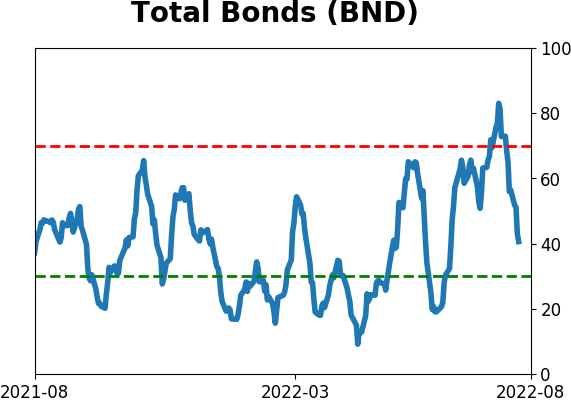
Bond ETF's - 10-Day Moving Average
|
|
|
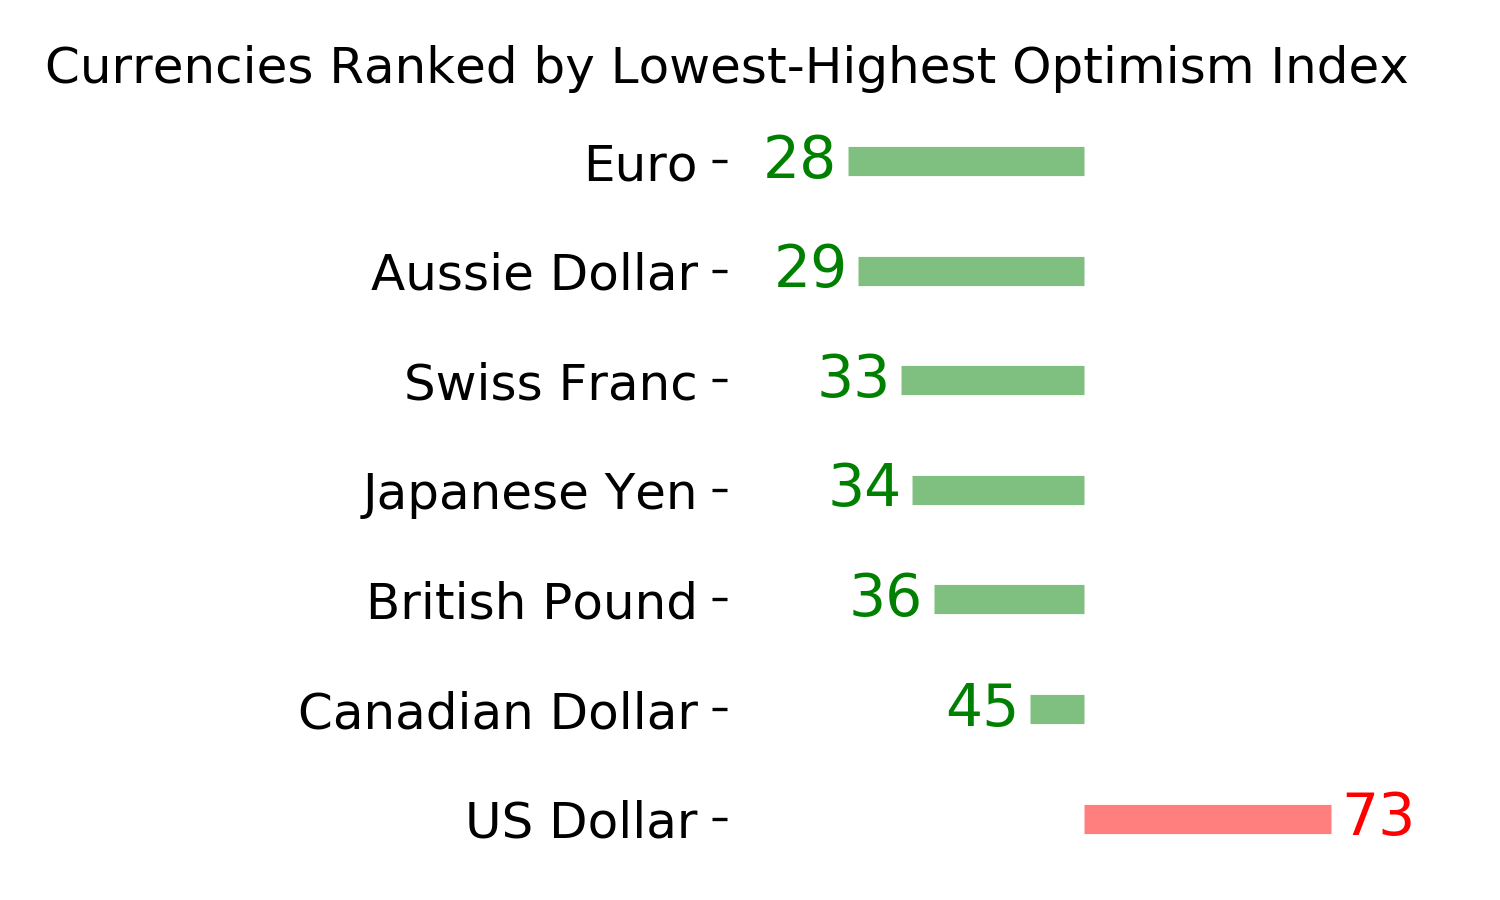
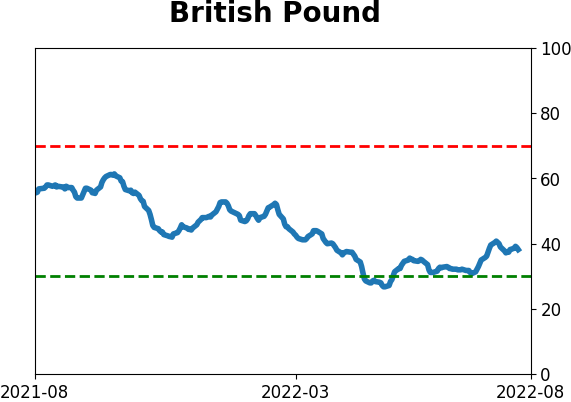
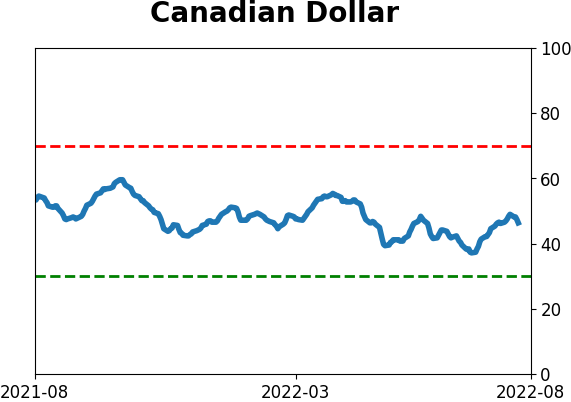
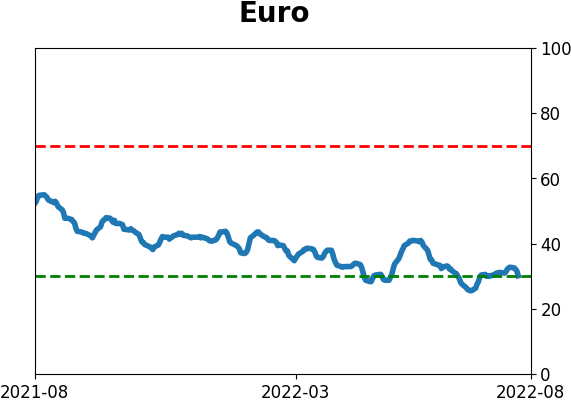
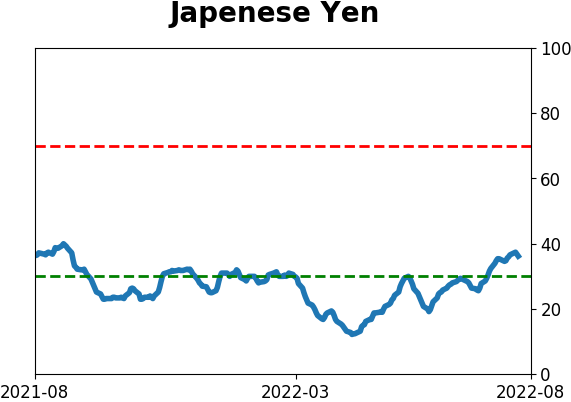
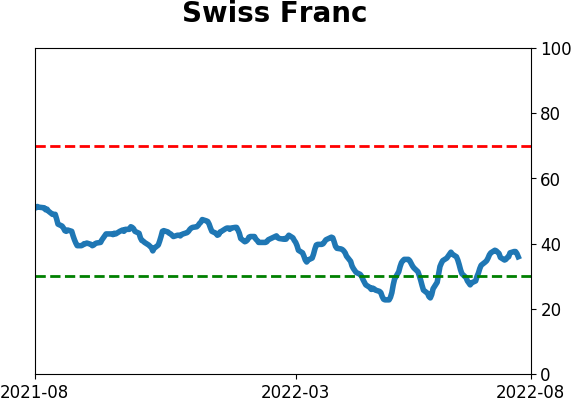
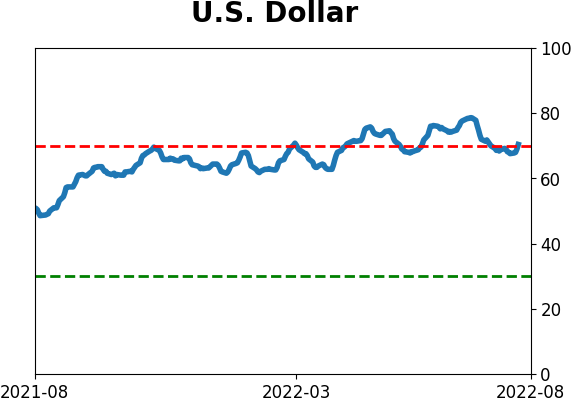
Currency ETF's - 5-Day Moving Average
|
|
|
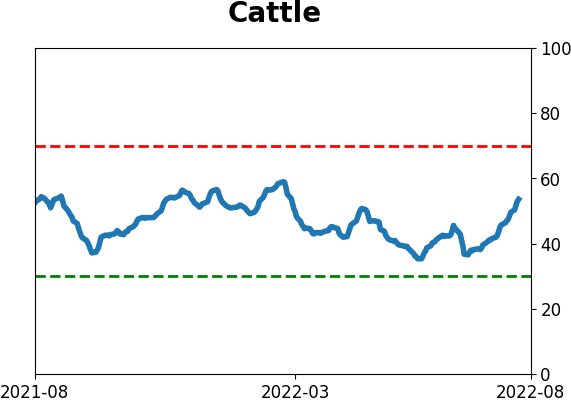
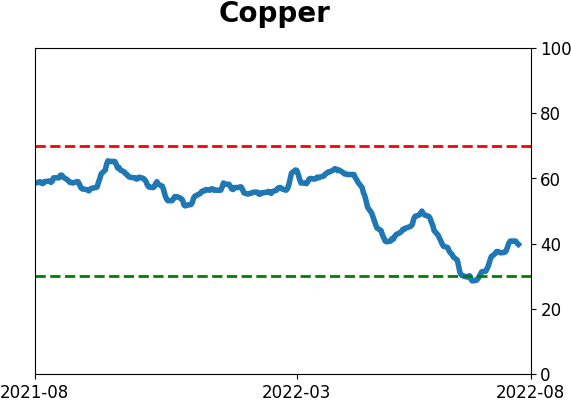
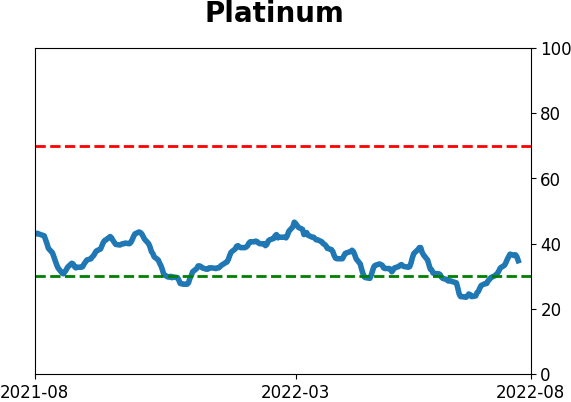
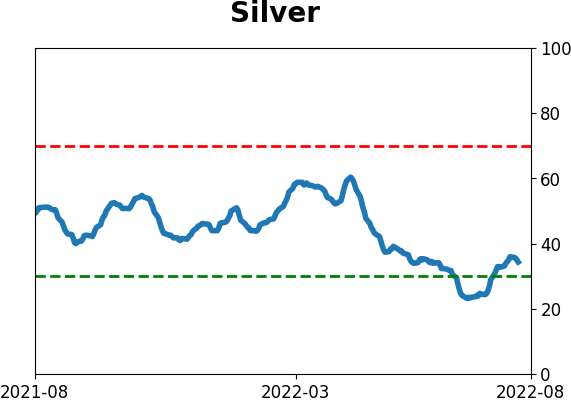
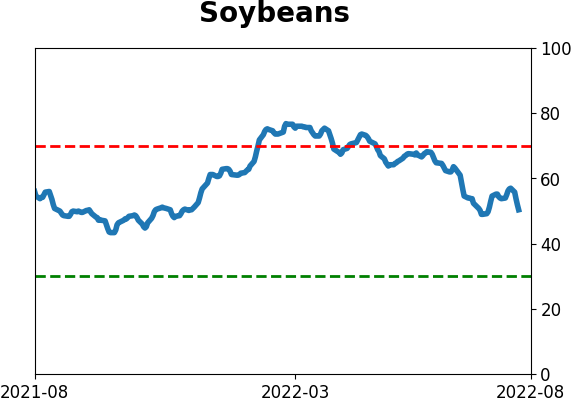
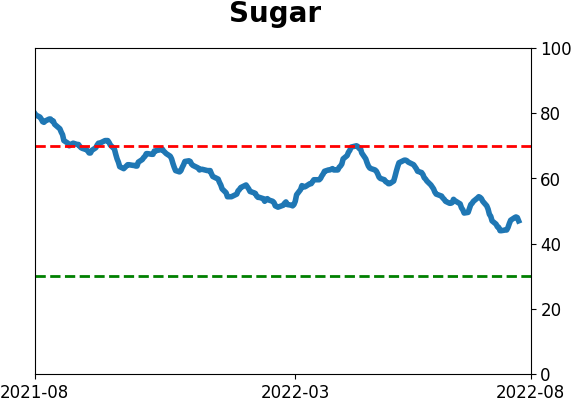
Commodity ETF's - 5-Day Moving Average
|
|