Headlines
|
|
A significant downward shift in the Risk On/Off Indicator:
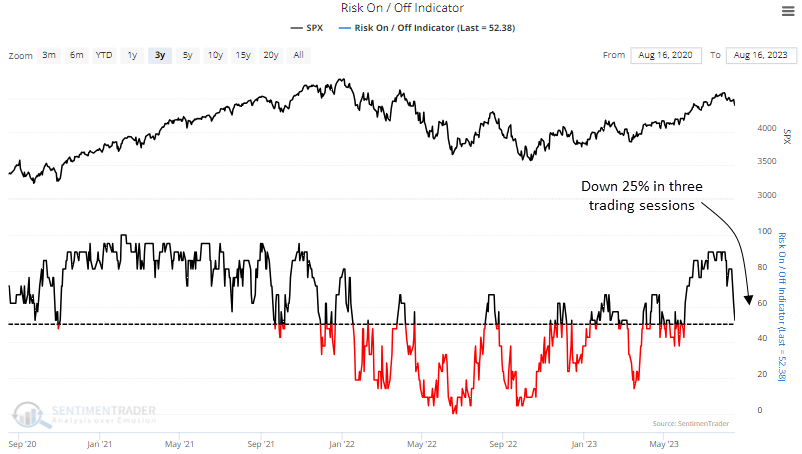
The SentimenTrader Risk On/Off Indicator, a composite that measures the percentage of indicators considered to be risk-on, declined by more than 25% over three trading sessions. After similar downshifts, the S&P 500 struggled over the next three weeks.
|
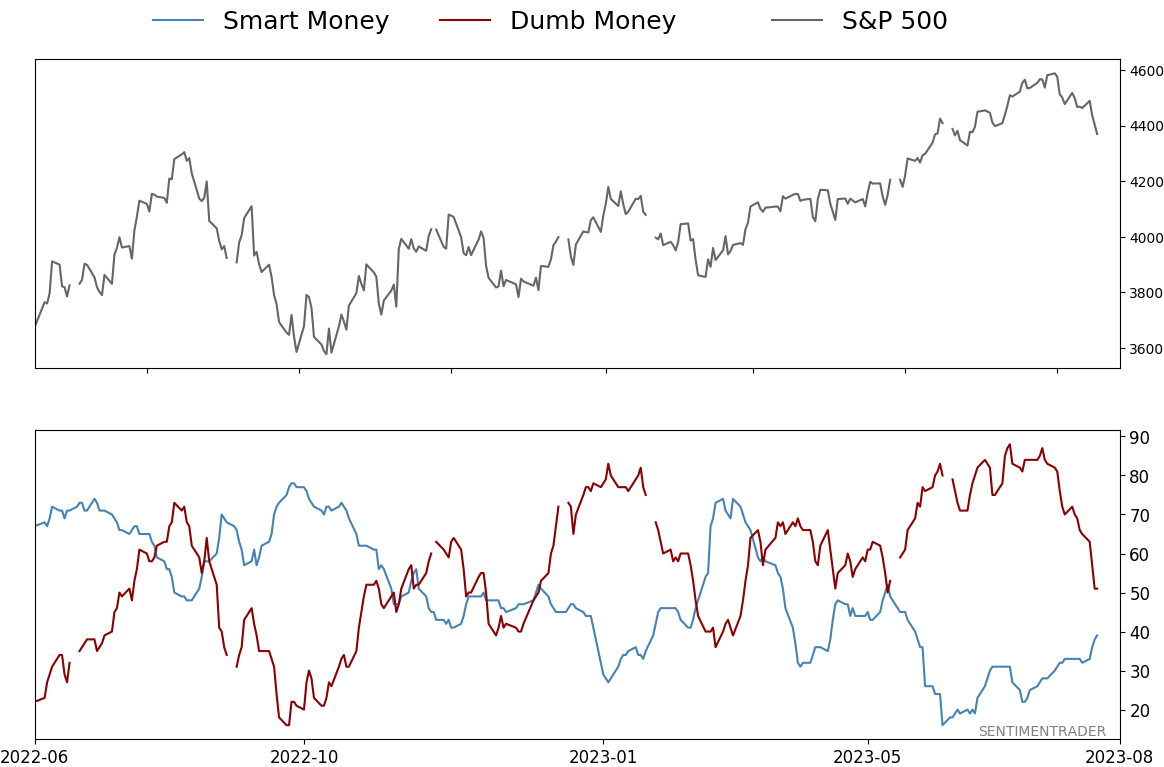
Smart / Dumb Money Confidence
|
Smart Money Confidence: 39%
Dumb Money Confidence: 51%
|
|
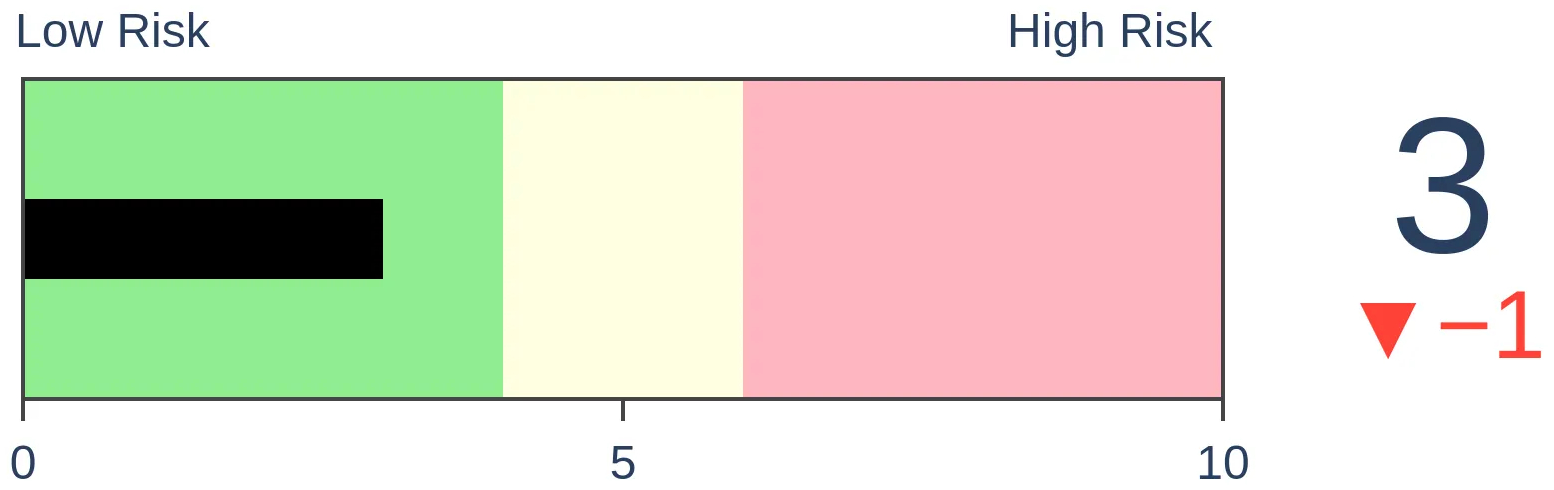
Risk Levels
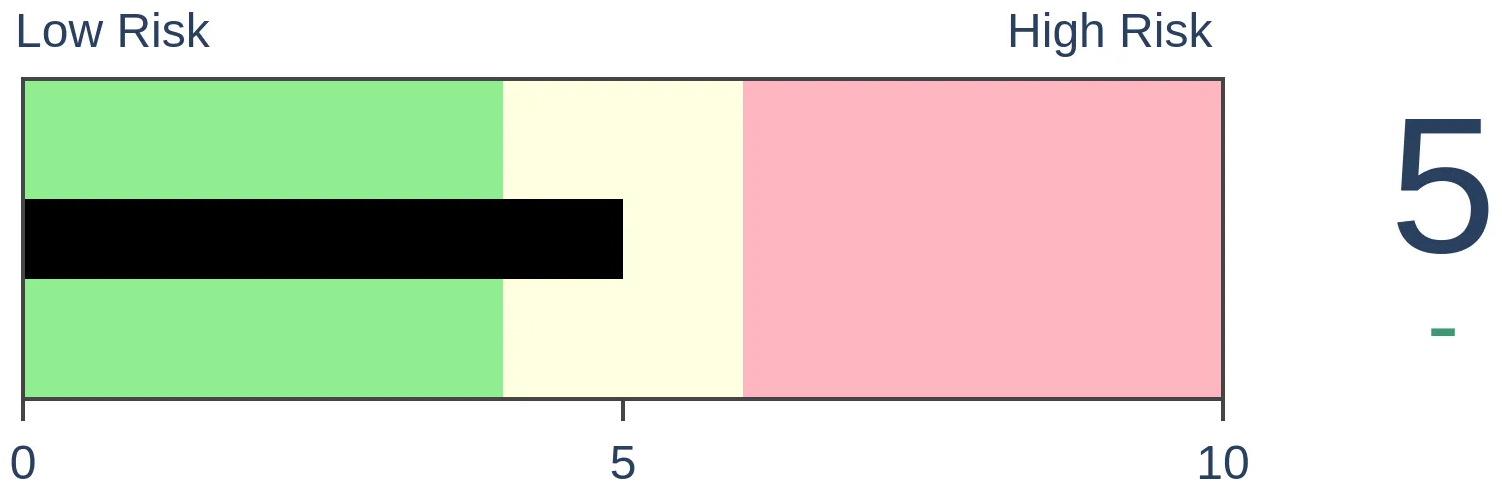
Stocks Short-Term
|
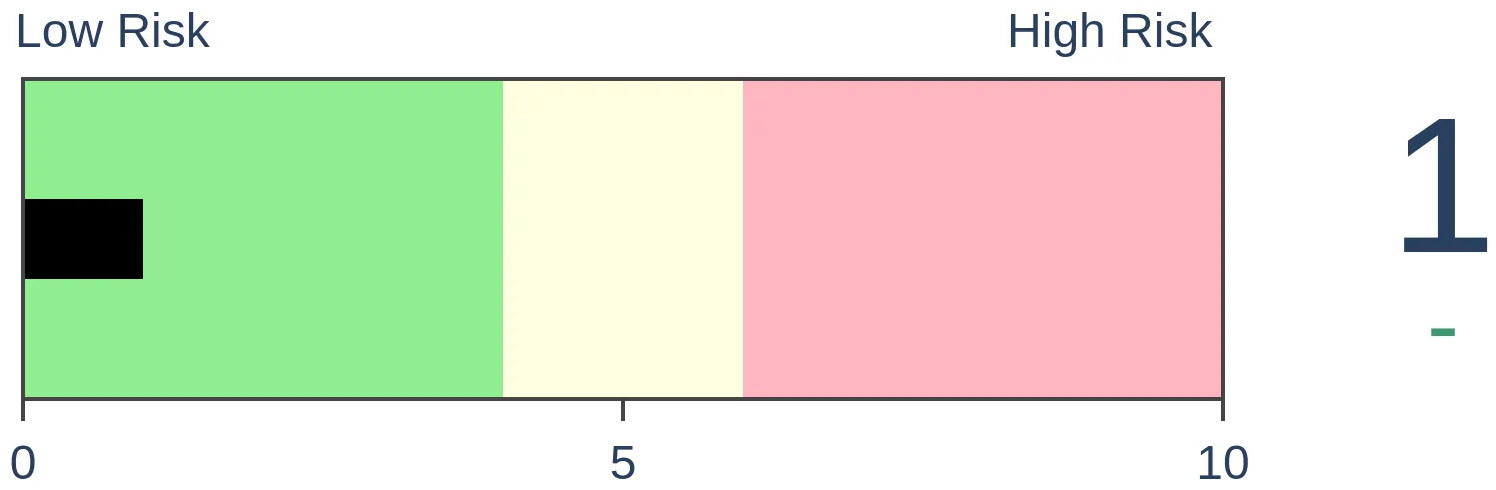
Stocks Medium-Term
|
|
Bonds
|
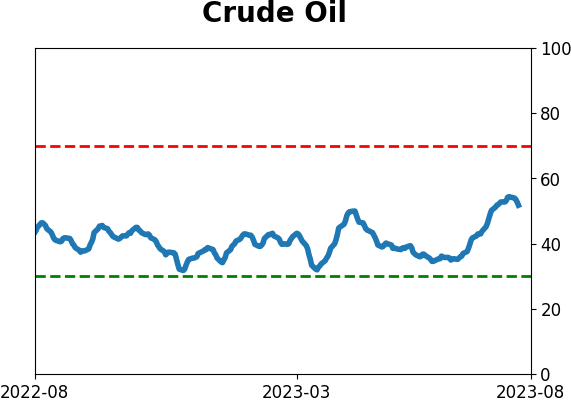
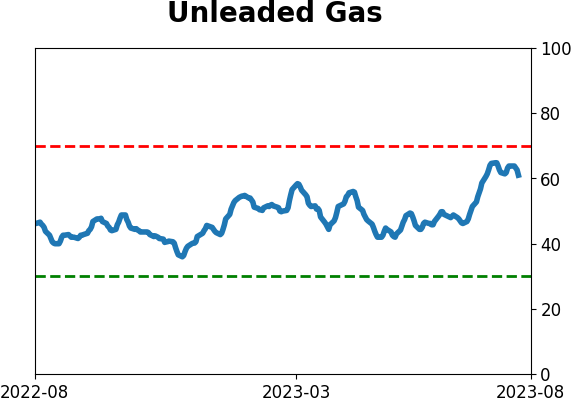
Crude Oil

|
|
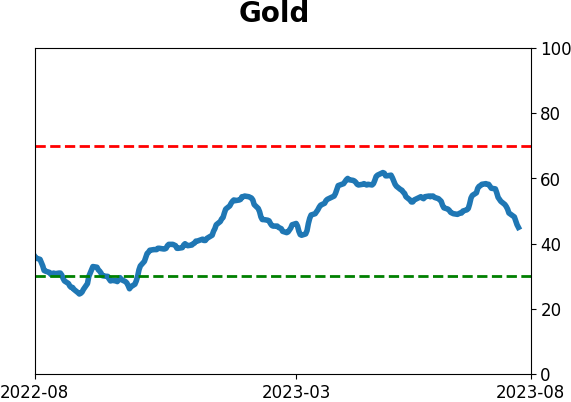
Gold
|
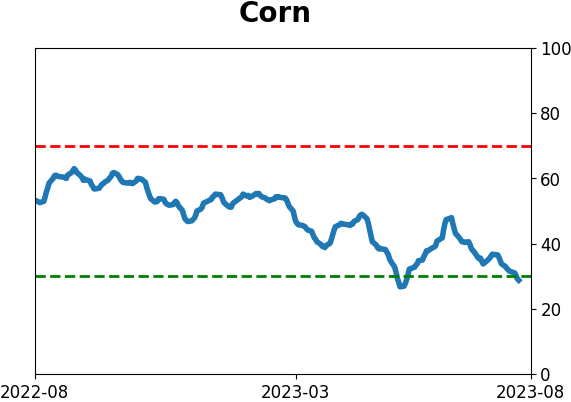
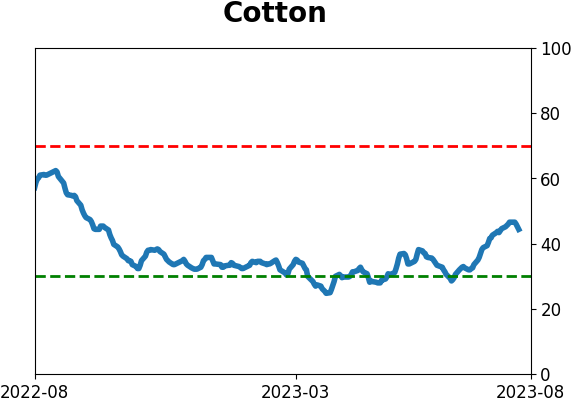
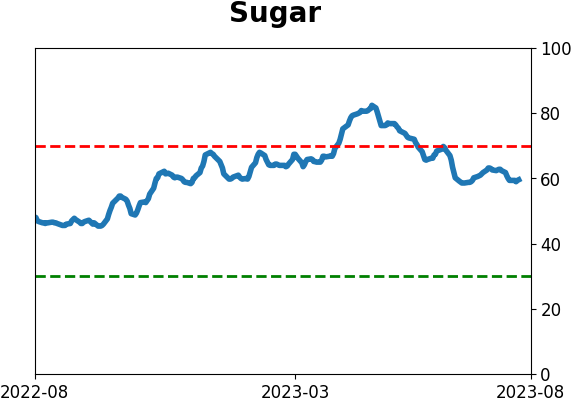
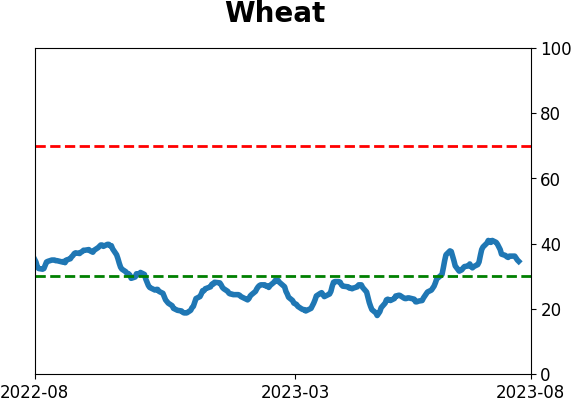
Agriculture

|
|
Research
By Dean Christians
BOTTOM LINE
The SentimenTrader Risk On/Off Indicator, a composite that measures the percentage of indicators considered to be risk-on, declined by more than 25% over three trading sessions. After similar downshifts, the S&P 500 struggled over the next three weeks.
FORECAST / TIMEFRAME
None
|
Key points:
- The SentimenTrader Risk On/Off Indicator declined by 25% over three trading sessions
- Similar shifts in the composite led to weak returns for the S&P 500 over the next three weeks
- Defensive sectors tend to outperform other groups under similar conditions
Sharp and sudden shifts in indicators provide useful insights
Stocks continue to drift lower in an orderly manner after a solid start to the year. As I discussed in a note a few weeks ago, the breakout in rates suggested stocks could consolidate/correct. That was especially the case during FOMC tightening cycles.
With stocks retreating, the SentimenTrader Risk On/Off Indicator contracted meaningfully over the last three trading sessions.
The model, a composite that measures the percentage of indicators considered to be risk-on, declined by more than 25%.
For context, I established a rule that required the indicator to surpass the 90% threshold before a new alert could trigger again. Additionally, I stipulated that the composite must be under 55%, ensuring similar conditions to the current signal.
Similar swift contractions in the Risk On/Off indicator suggest stocks struggle
Whenever the Risk-On/Off indicator saw a 25% decline over three consecutive trading sessions, the S&P 500 typically faced challenges in the immediate future. The weakness was especially pronounced three days later, with the world's most benchmarked index declining 70% of the time.
An assessment to determine the ideal number of days to hold a short position in the S&P 500 based on the signal conditions returned an optimal holding period of 14 trading days, emphasizing the short-term nature of the alert.
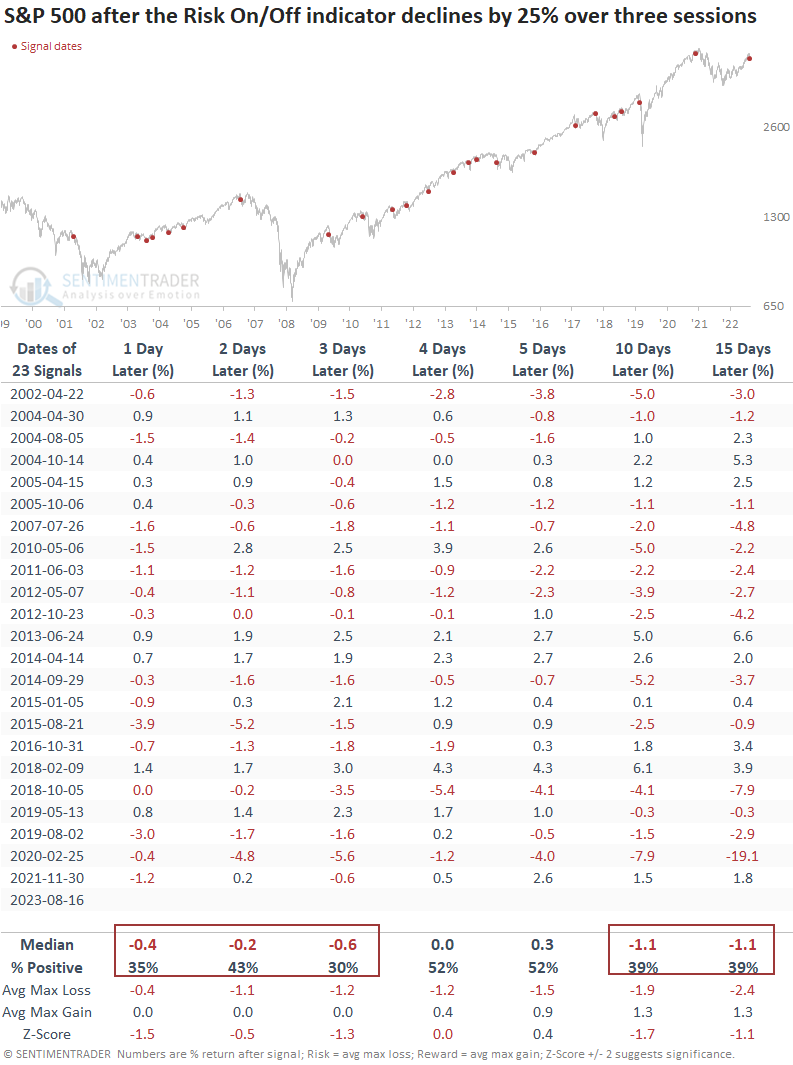
It's important to remember that the signal required a reset above 90%, a level associated with uptrends in stocks. Because of this condition, the alert typically occurs within the context of a bull market correction.
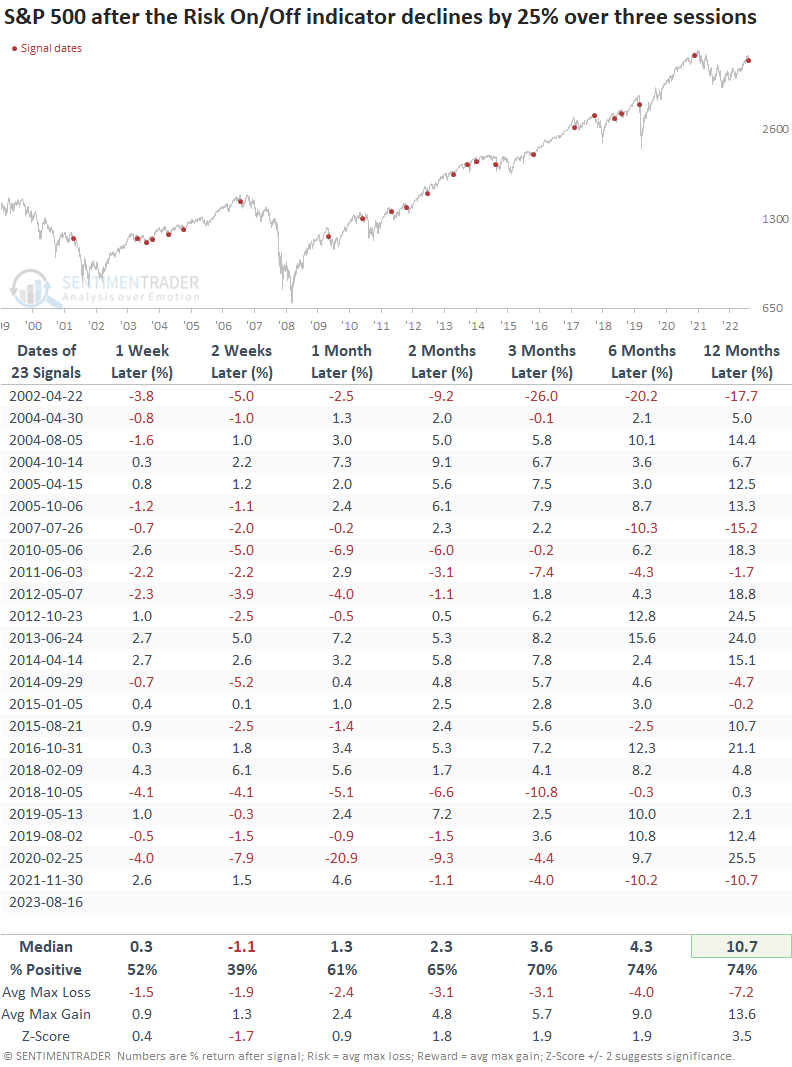
From two to twelve months later, S&P 500 returns were above the average return over the study period.
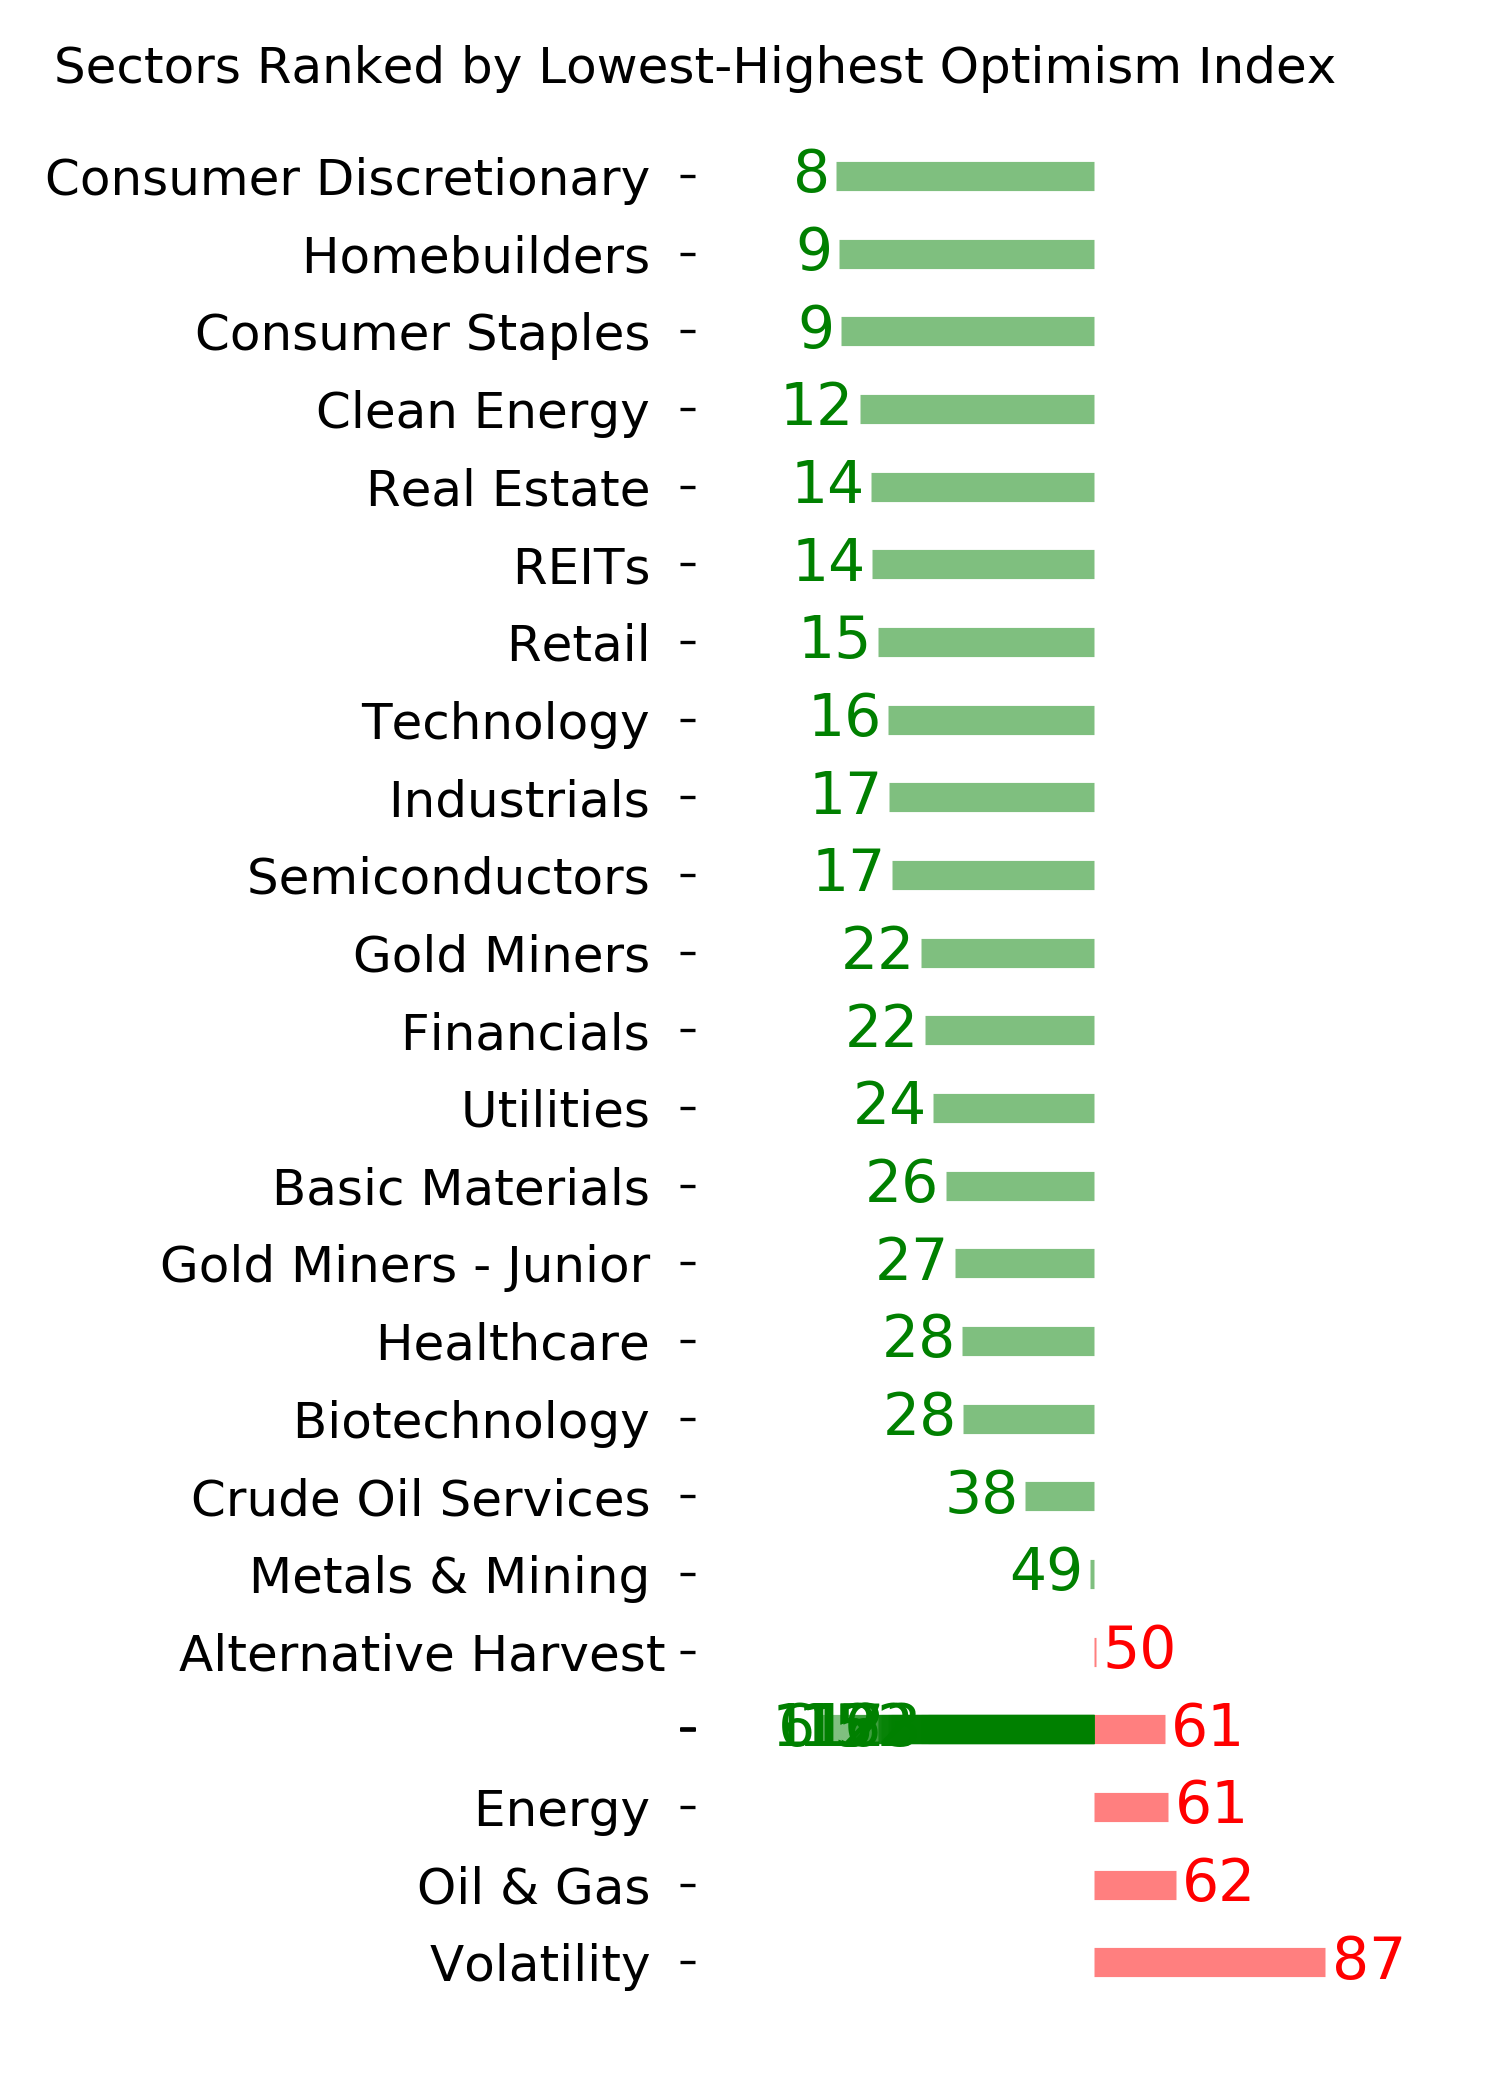
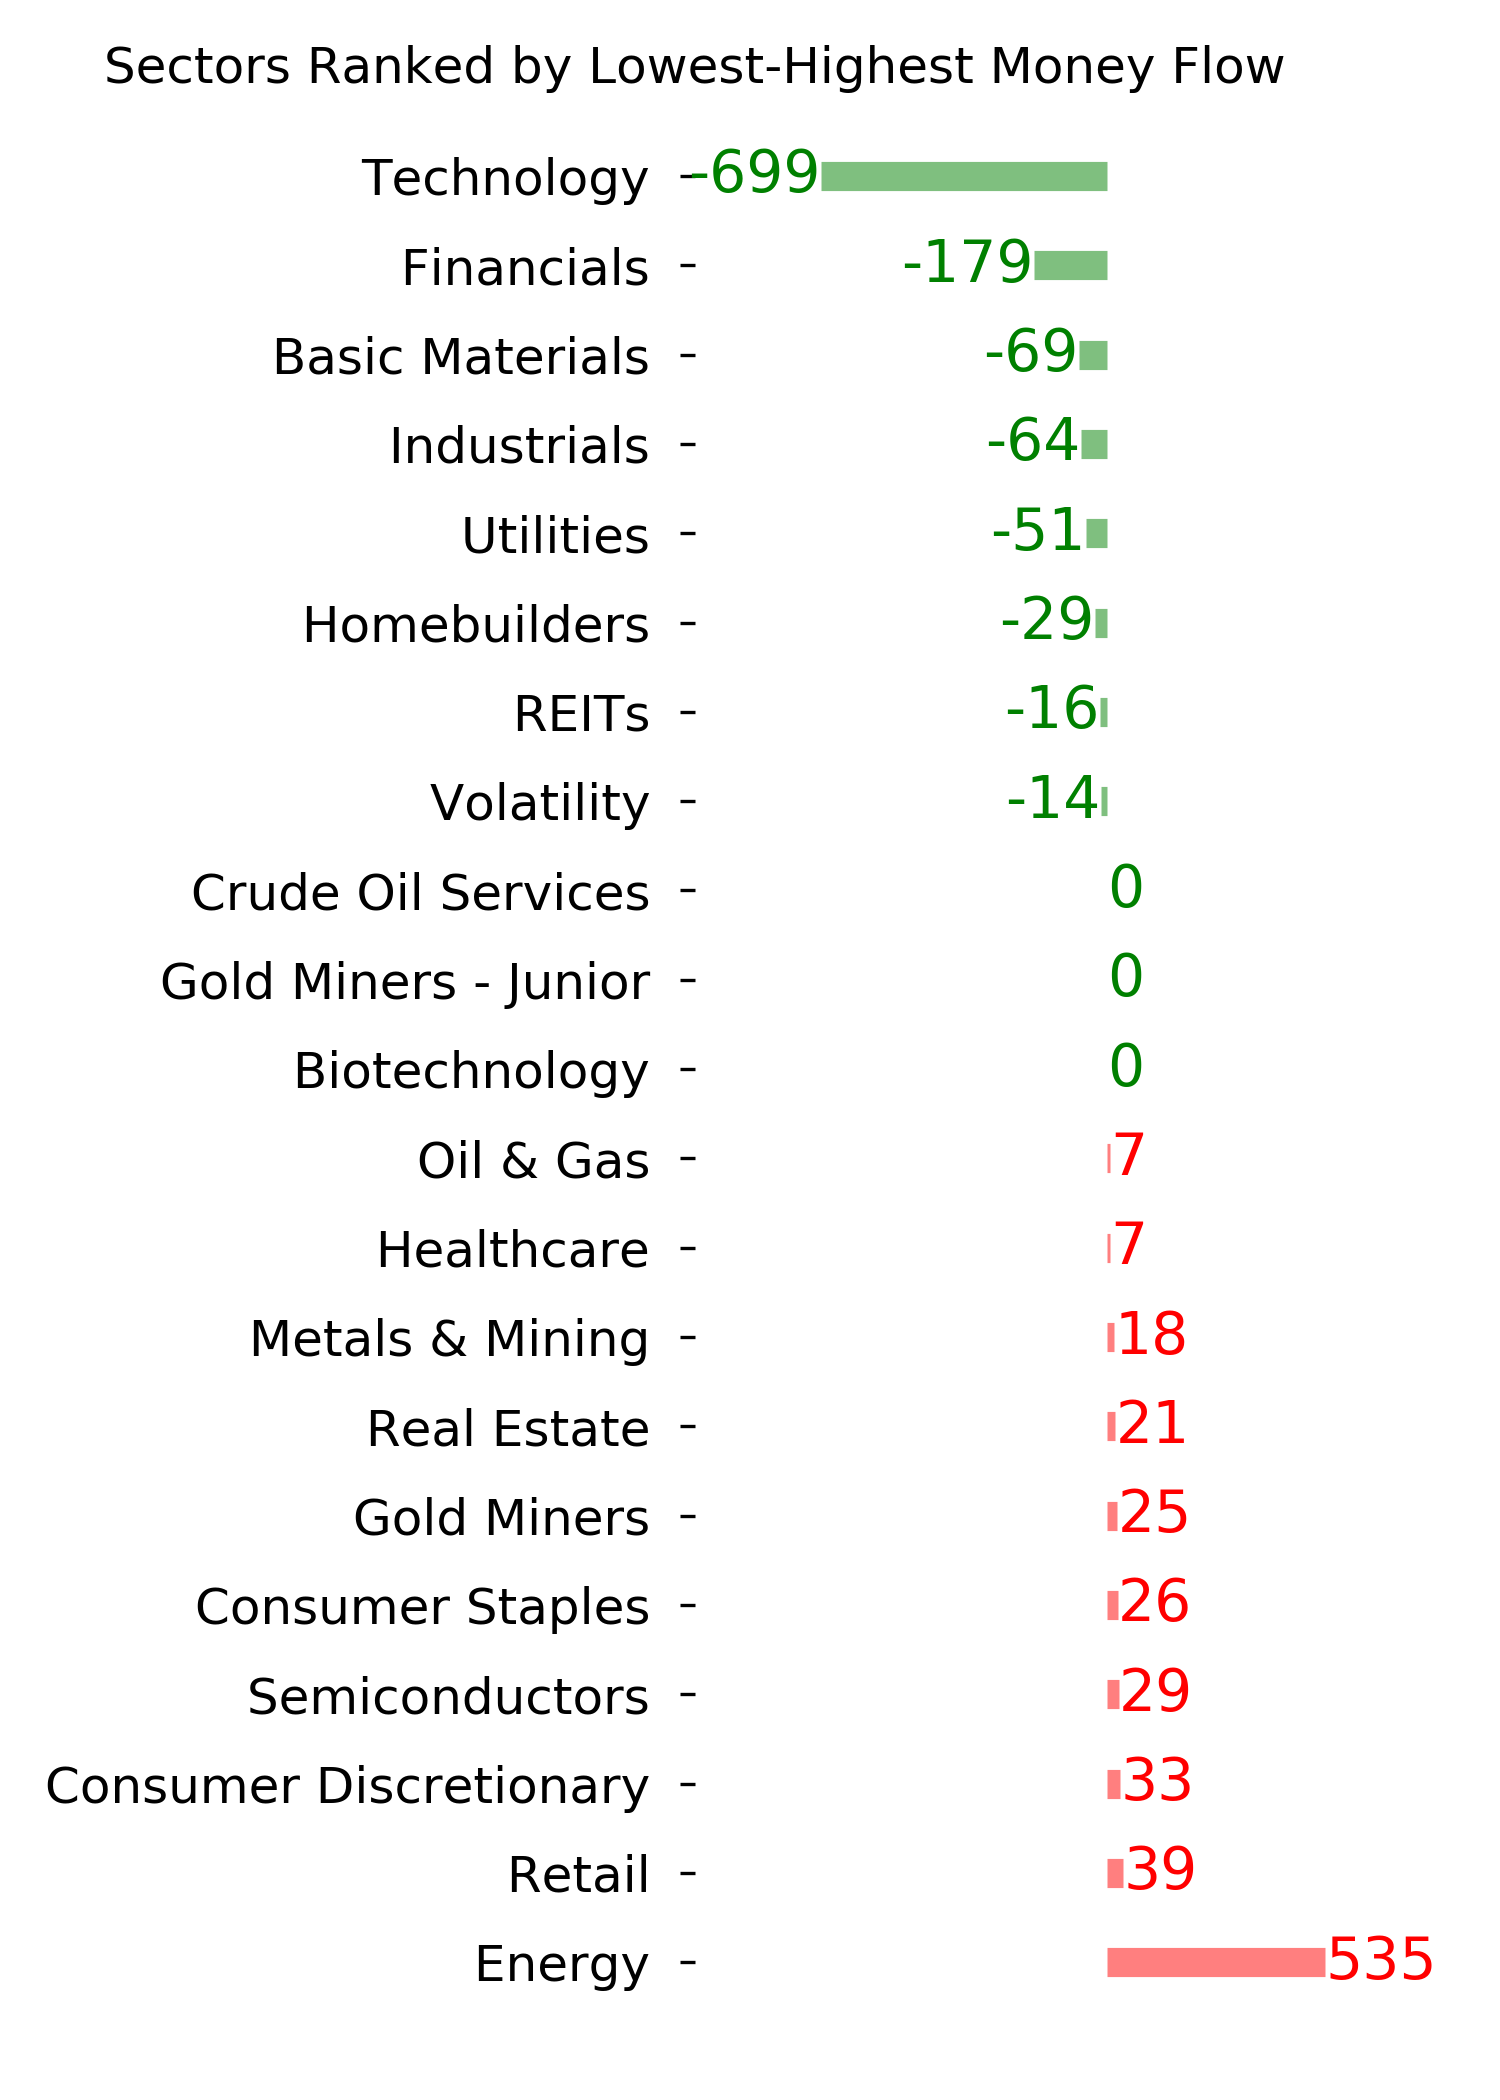
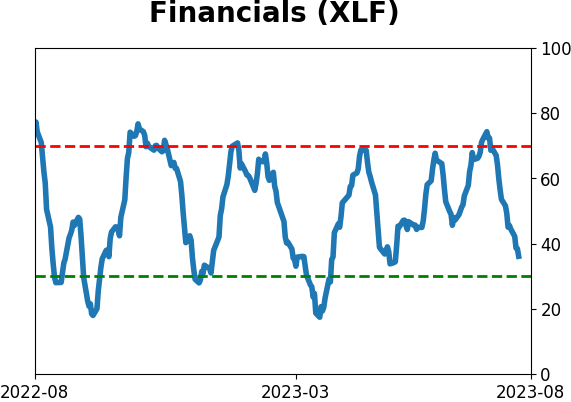
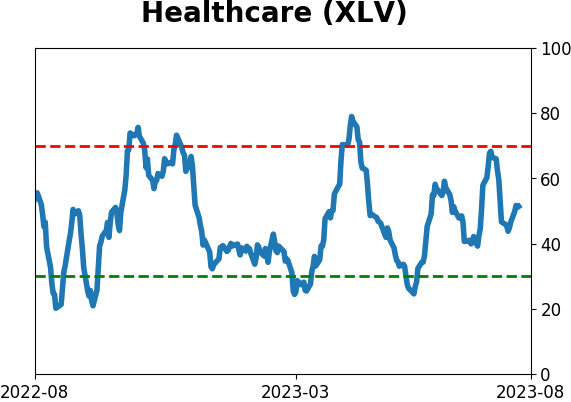
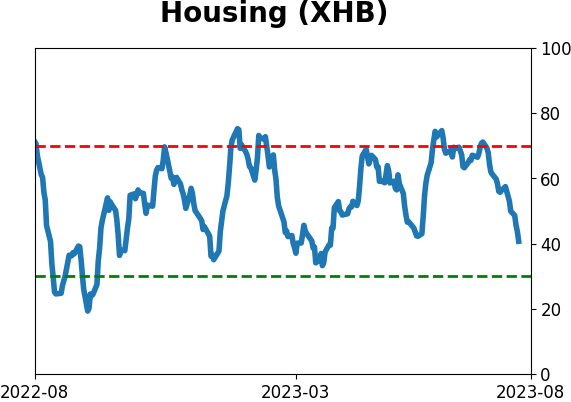
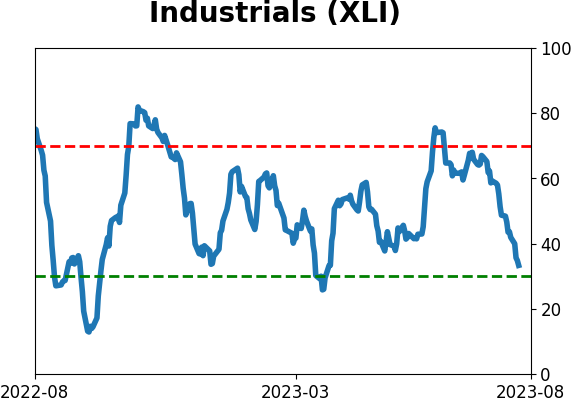
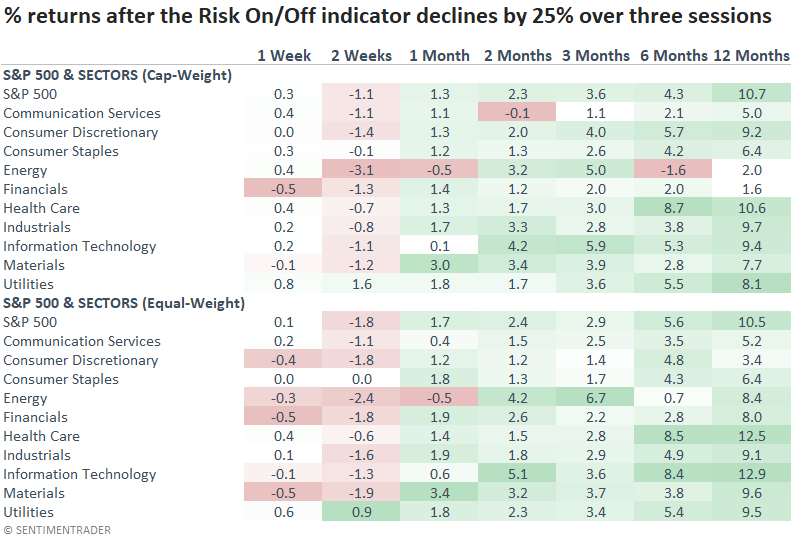
Not surprisingly, defensive sectors like Consumer Staples and Utilities outperform other sectors over the next few weeks, in line with their historical behavior in drawdowns.
What the research tells us...
A significant number of components in the Risk On/Off Indicator deteriorated, causing the composite to fall over 25% in only three sessions. Similar downshifts tend to produce weak returns for the S&P 500 over the next three weeks, with the worst outlook occurring only a few days later. With constructive long-term results that exceed the average return over the study period, traders should patiently wait for the correction to play out.
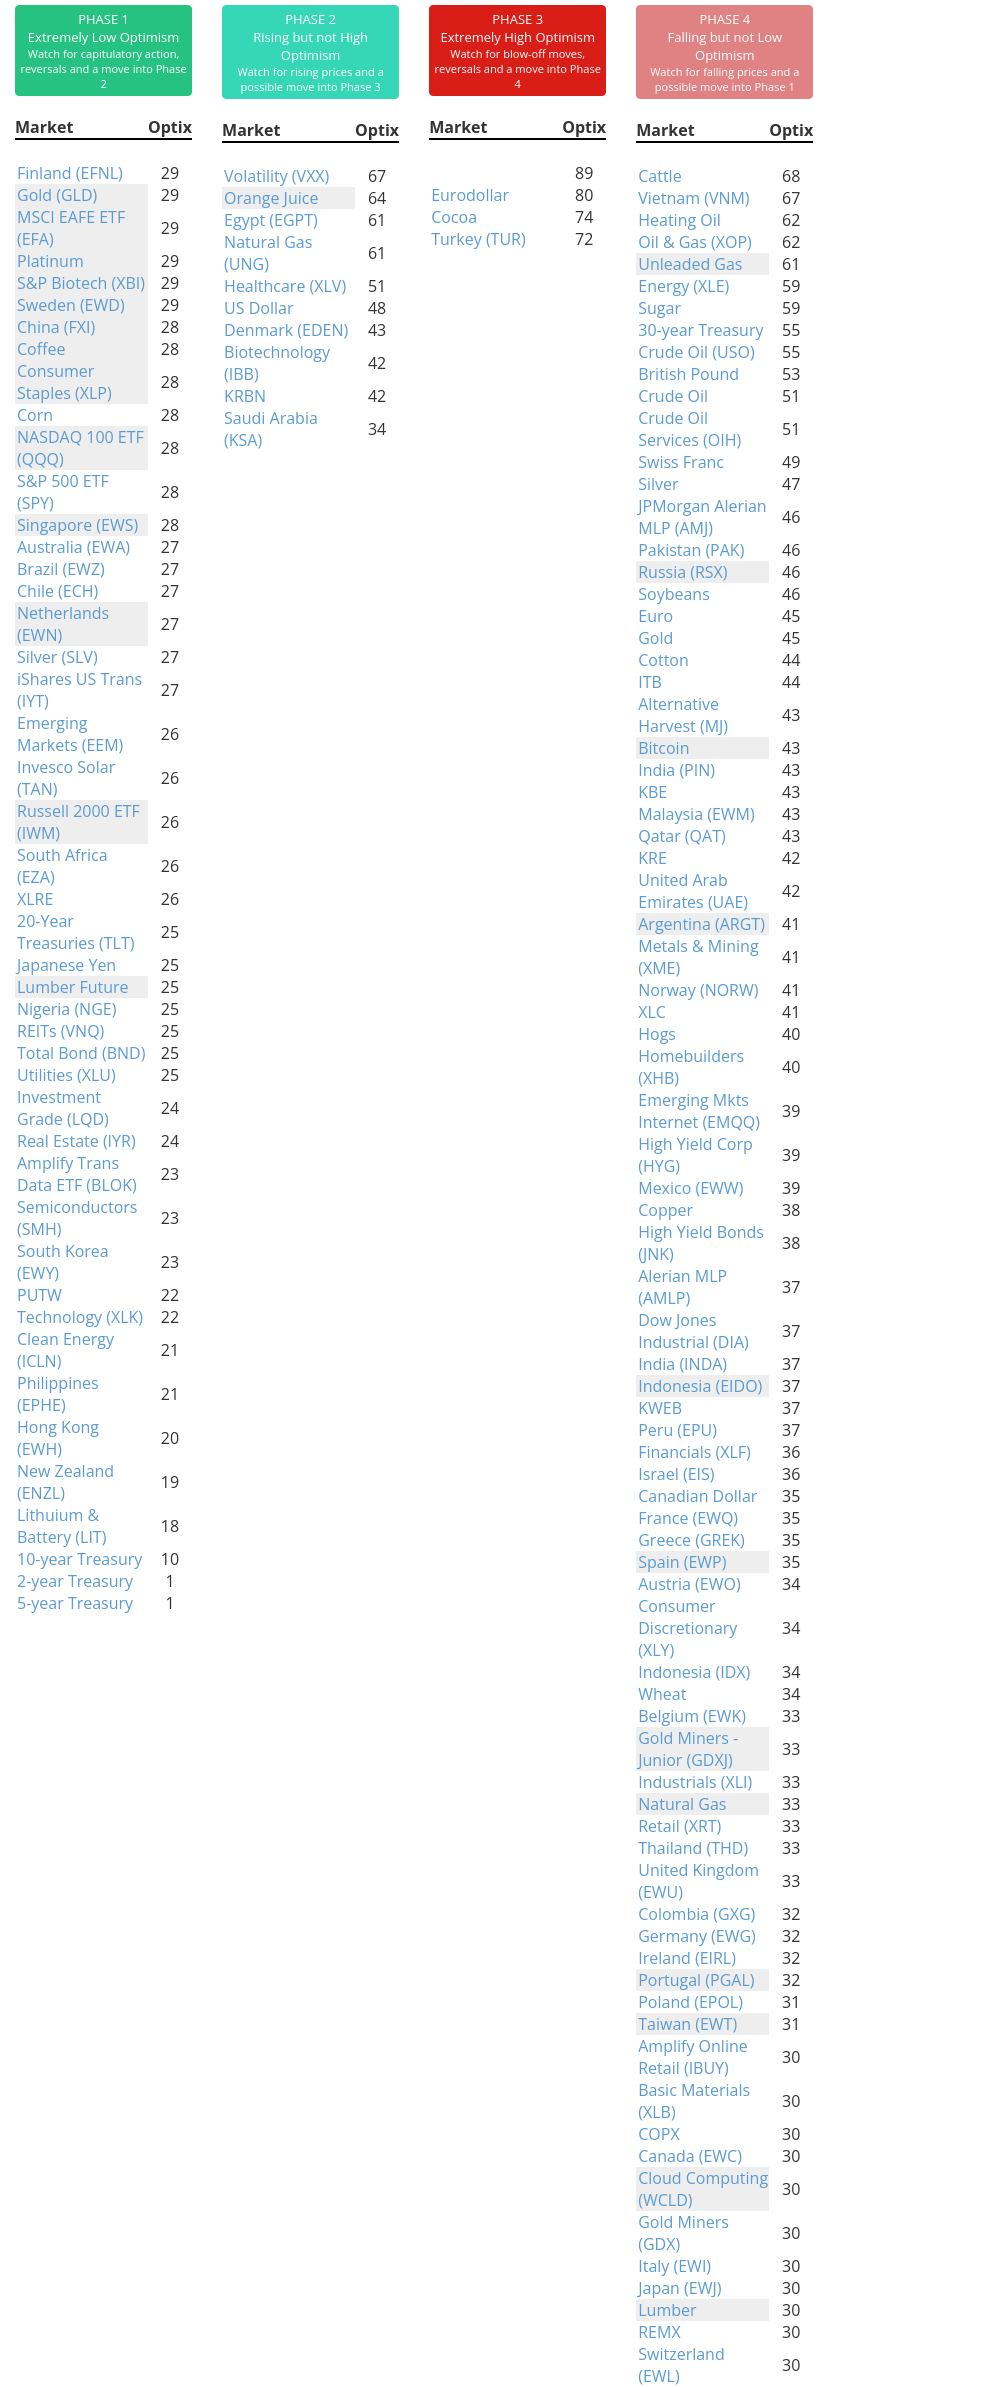
Indicators at Extremes
Phase Table
Ranks
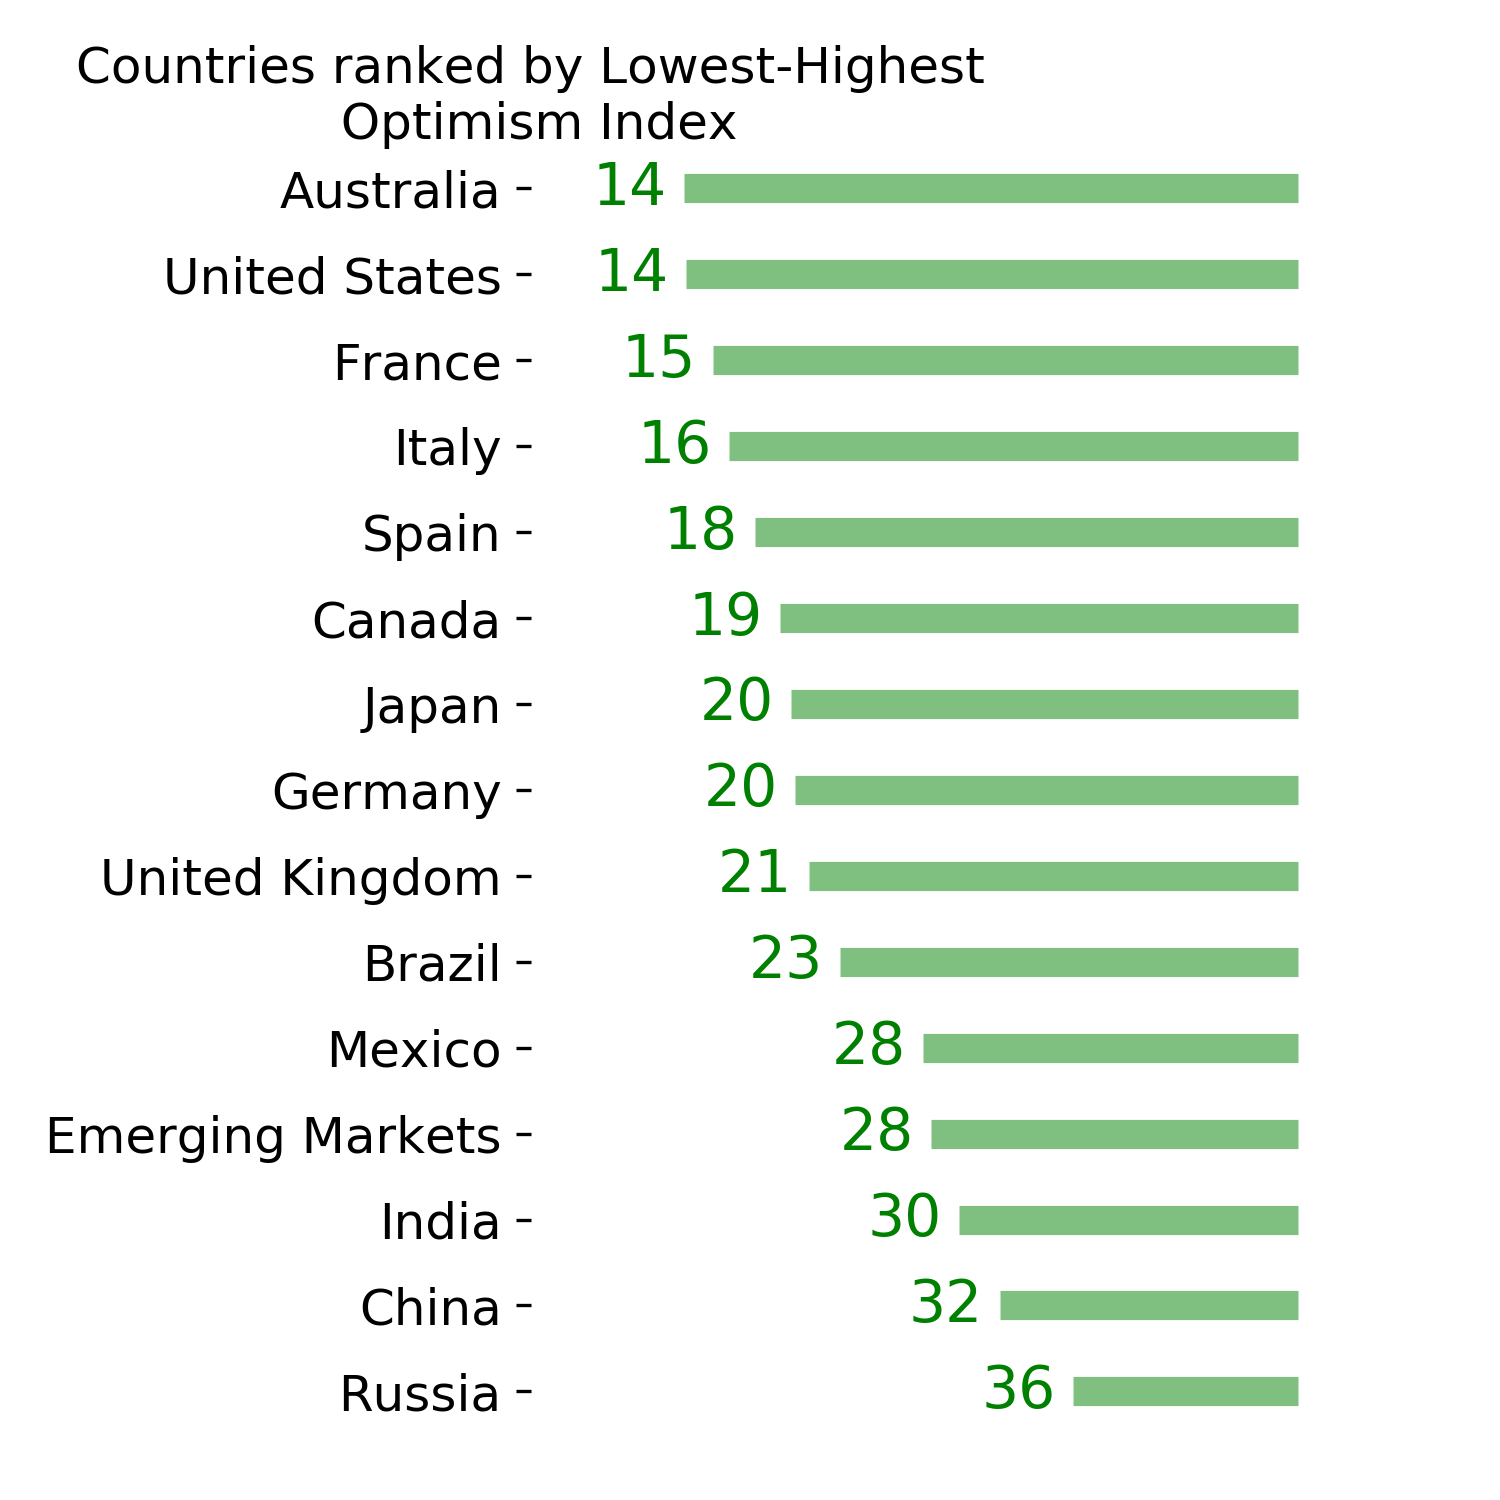
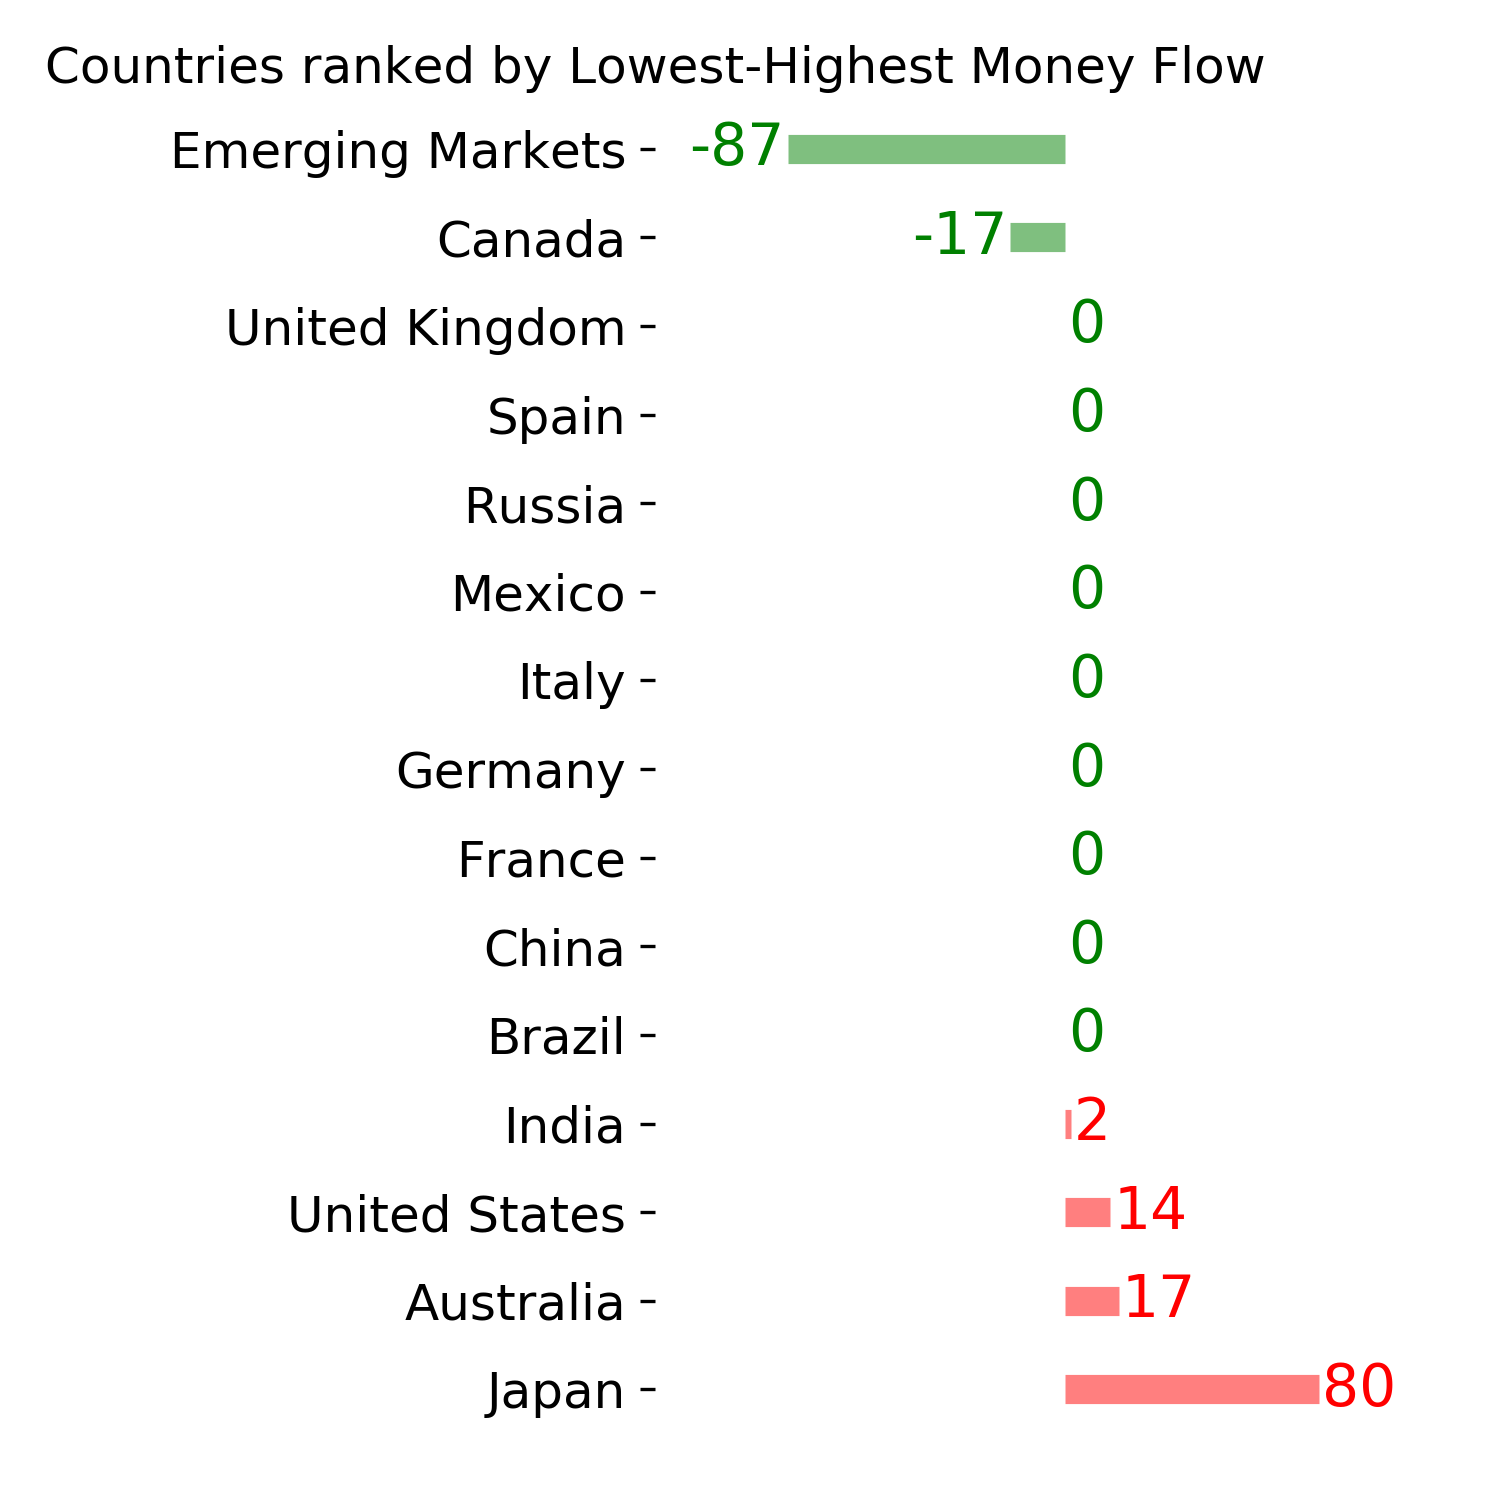
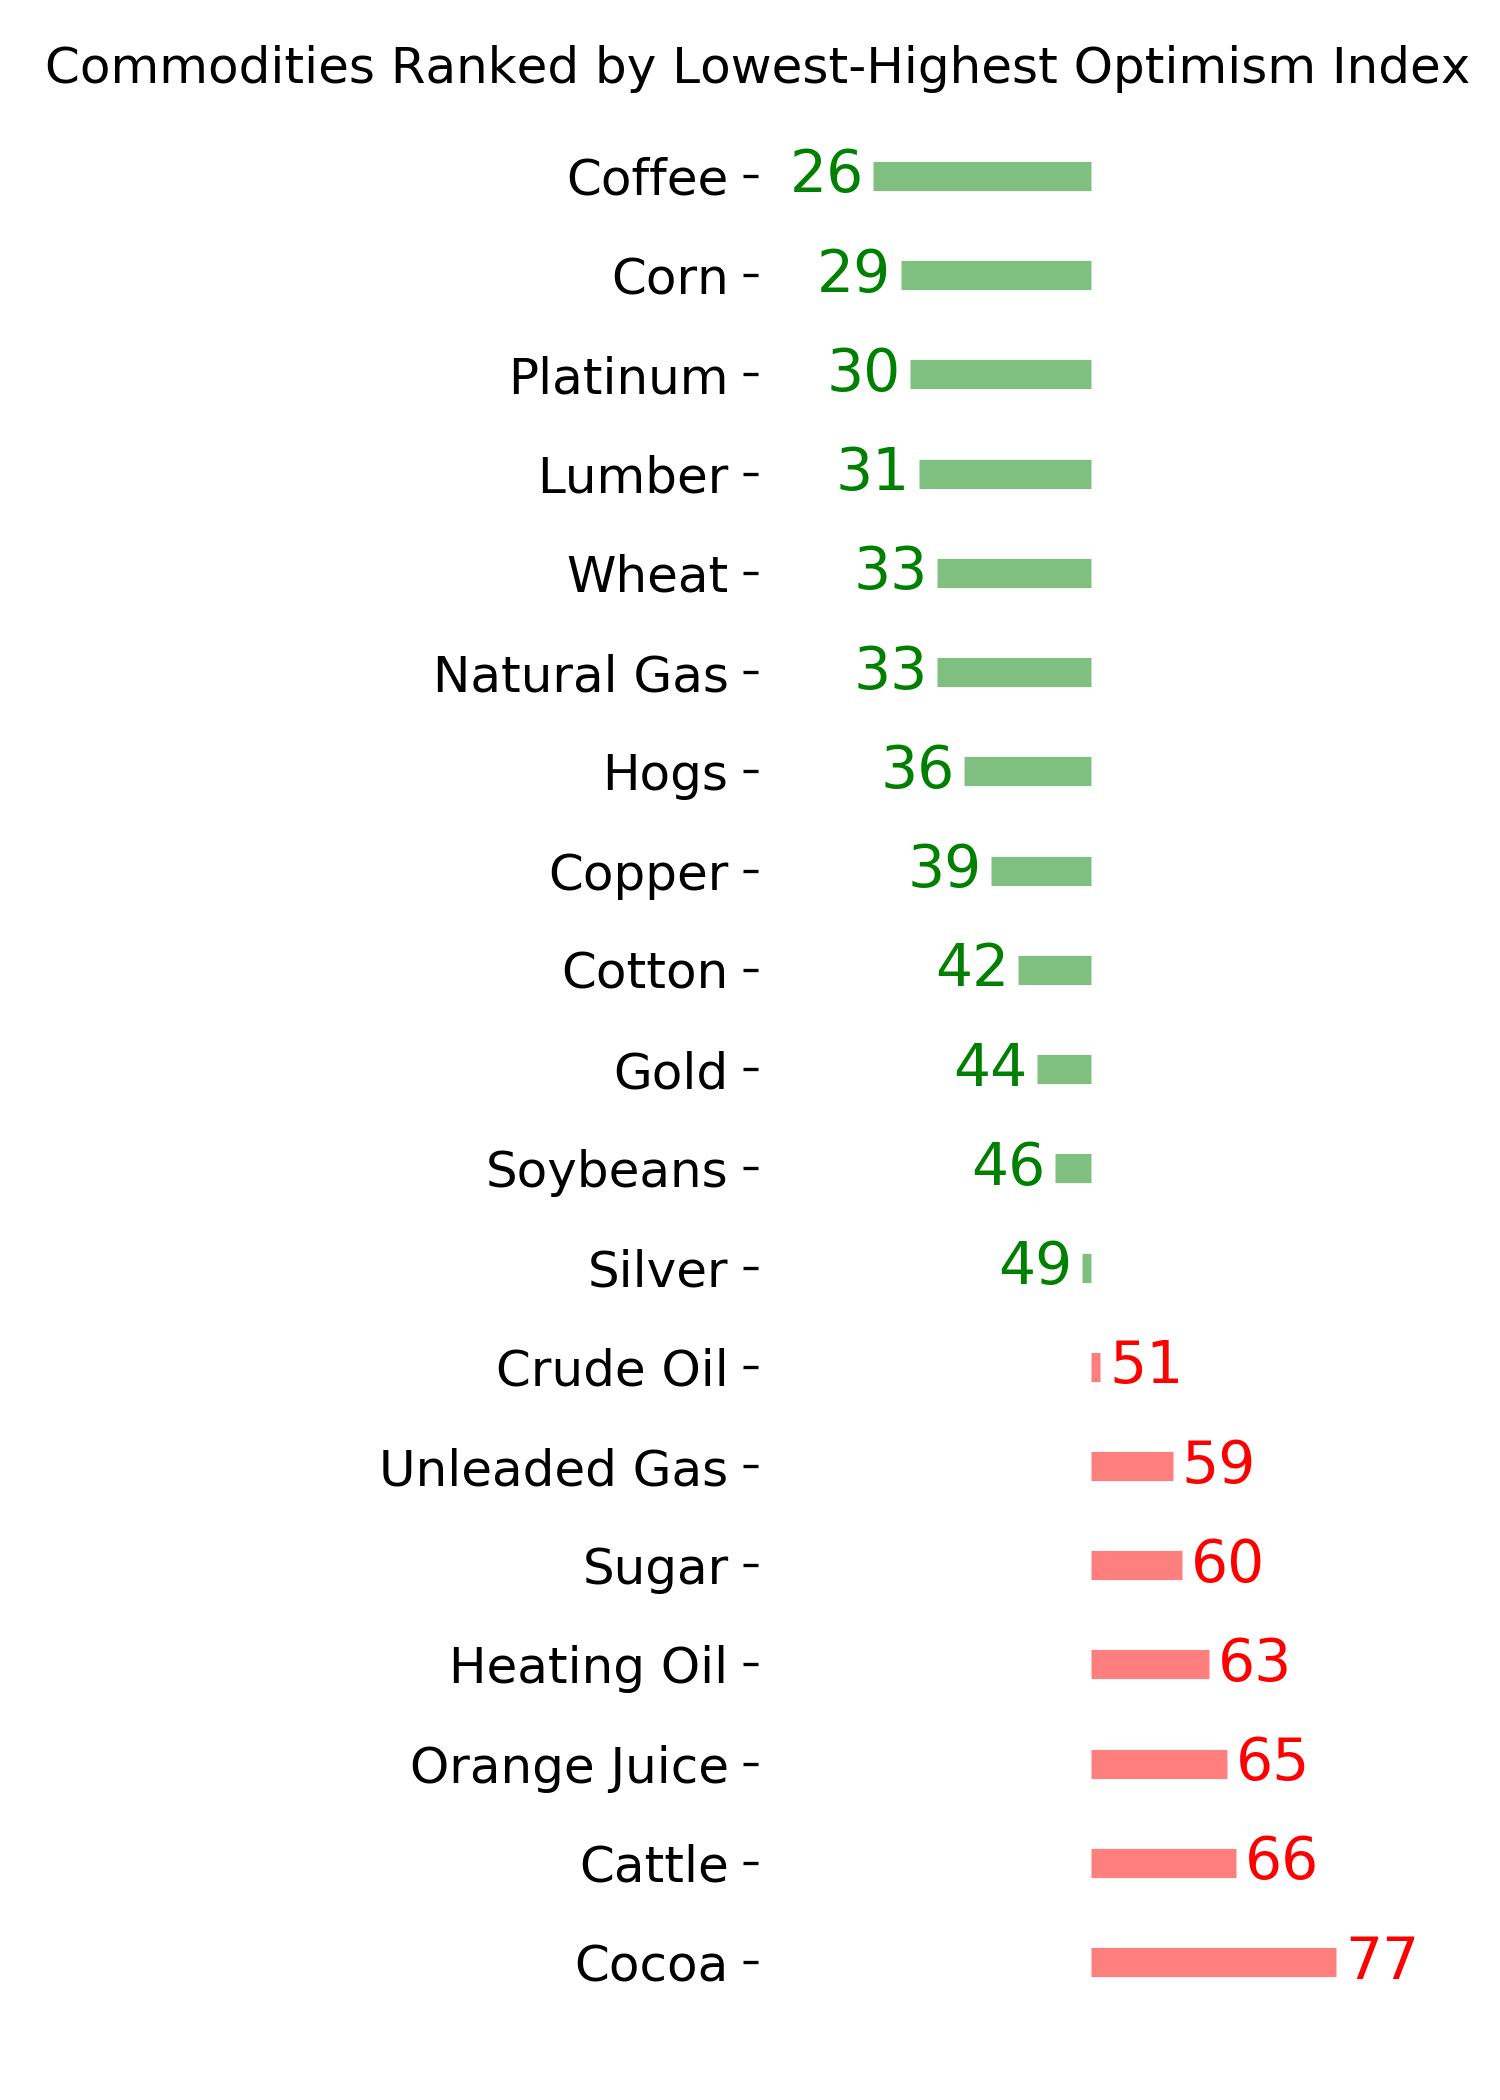
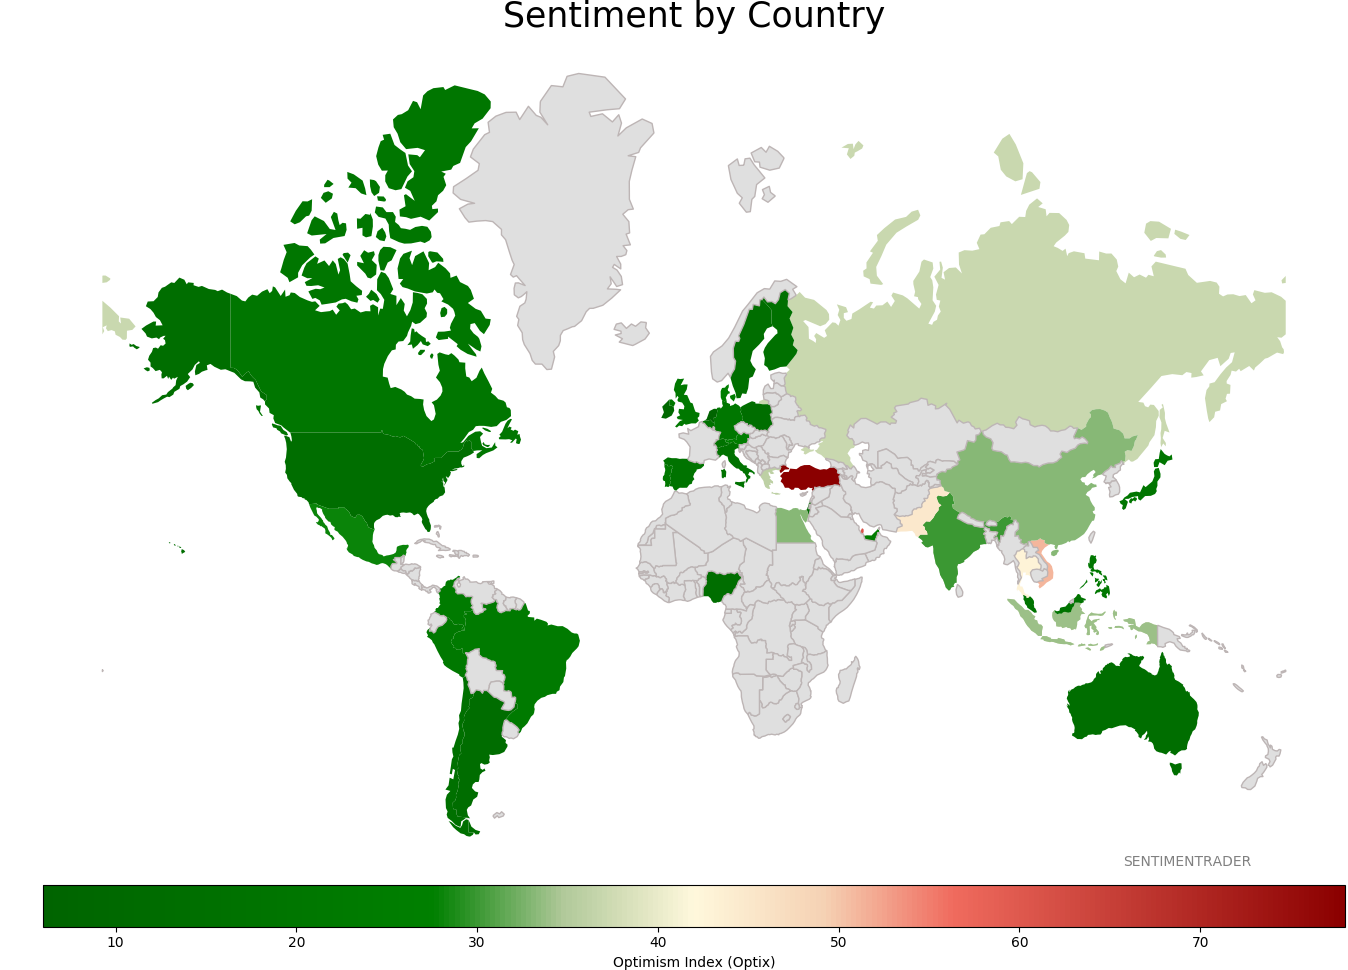
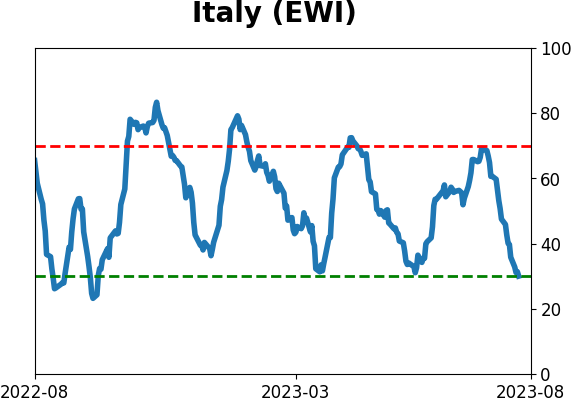
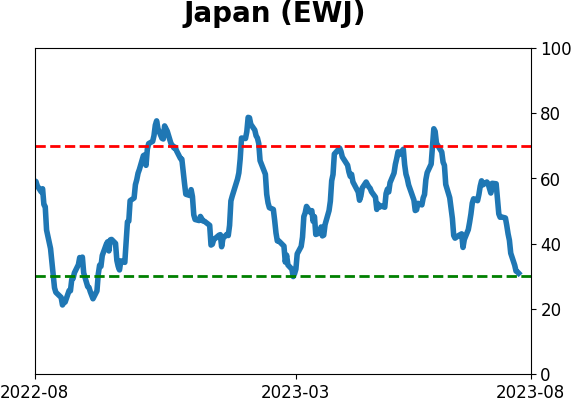
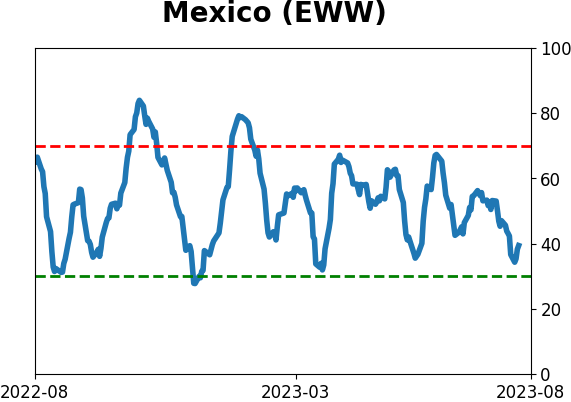
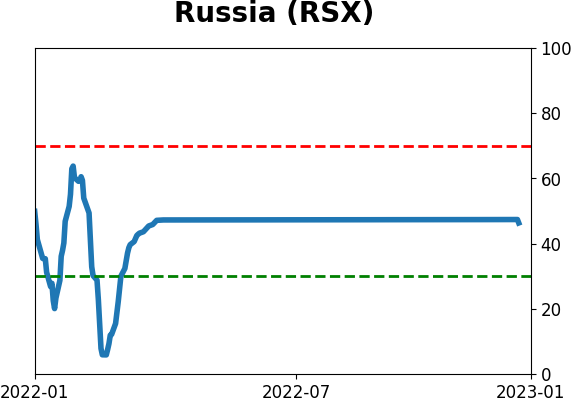
Sentiment Around The World
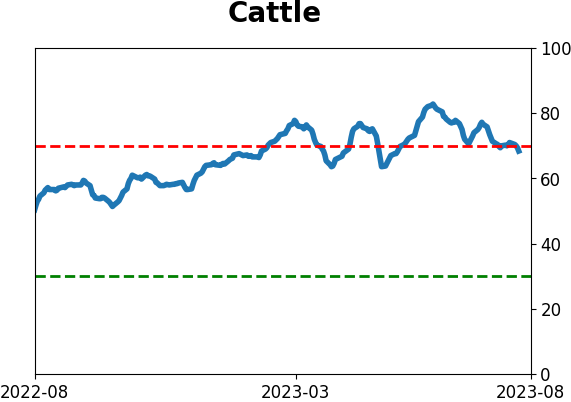
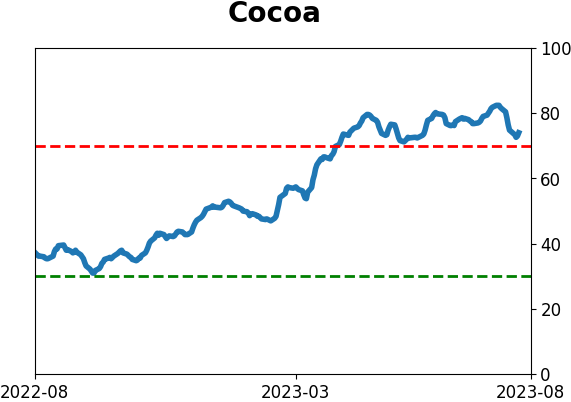
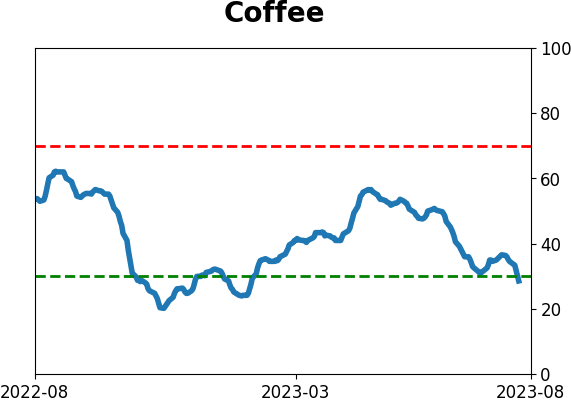
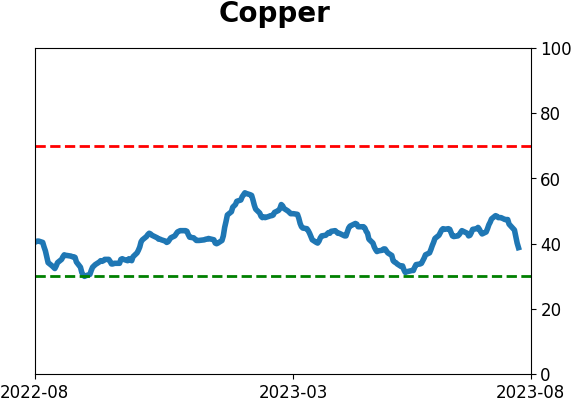
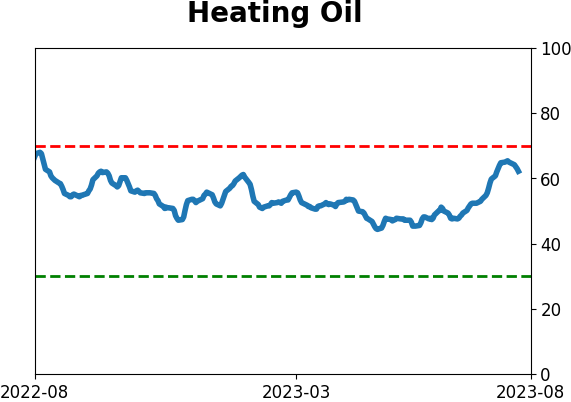
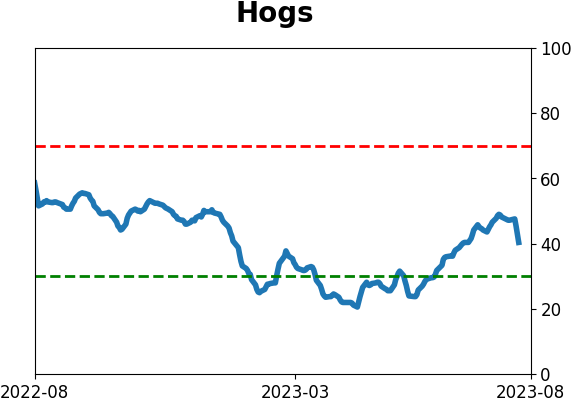
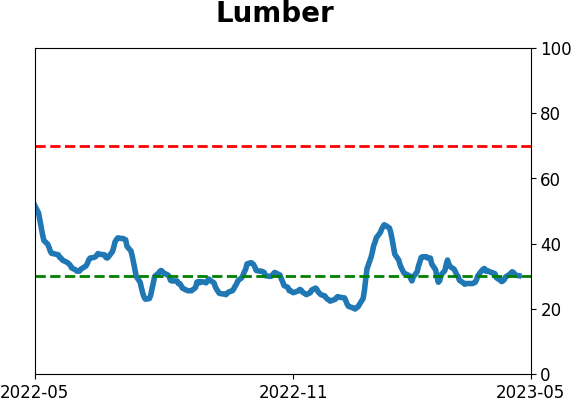
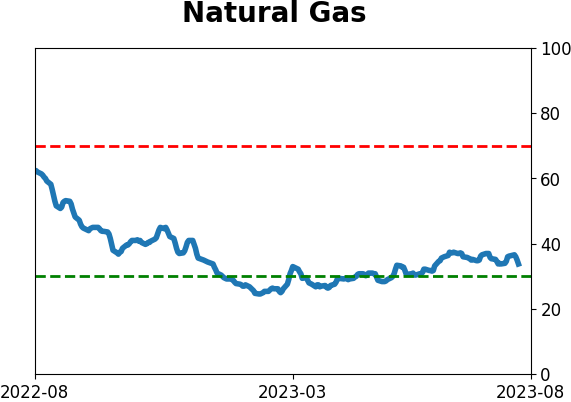
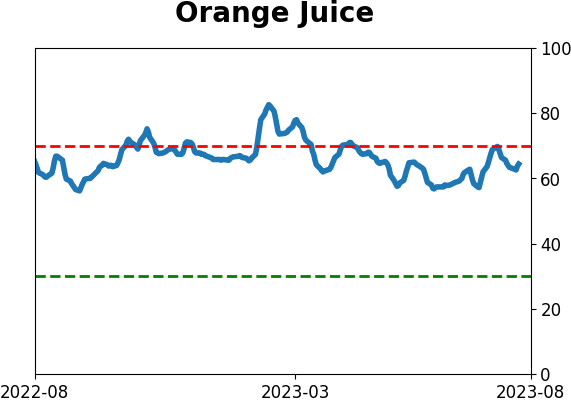
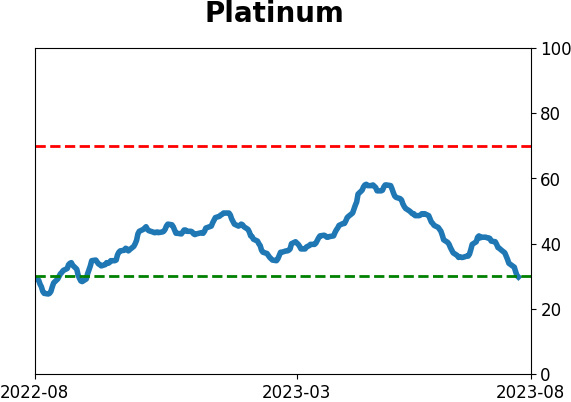
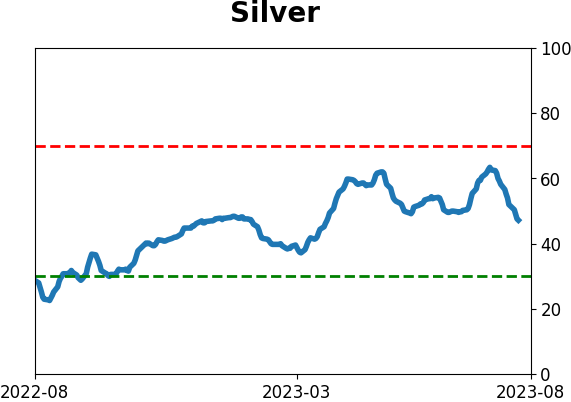
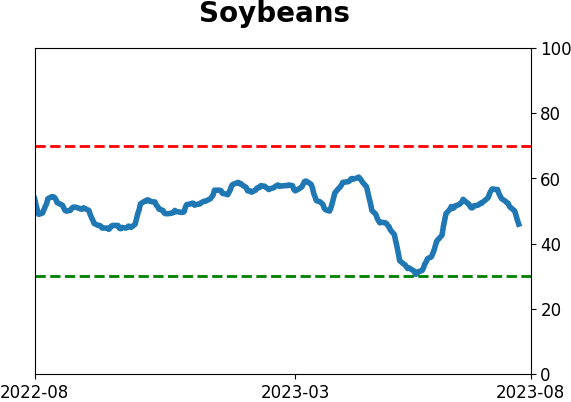
Optimism Index Thumbnails
|
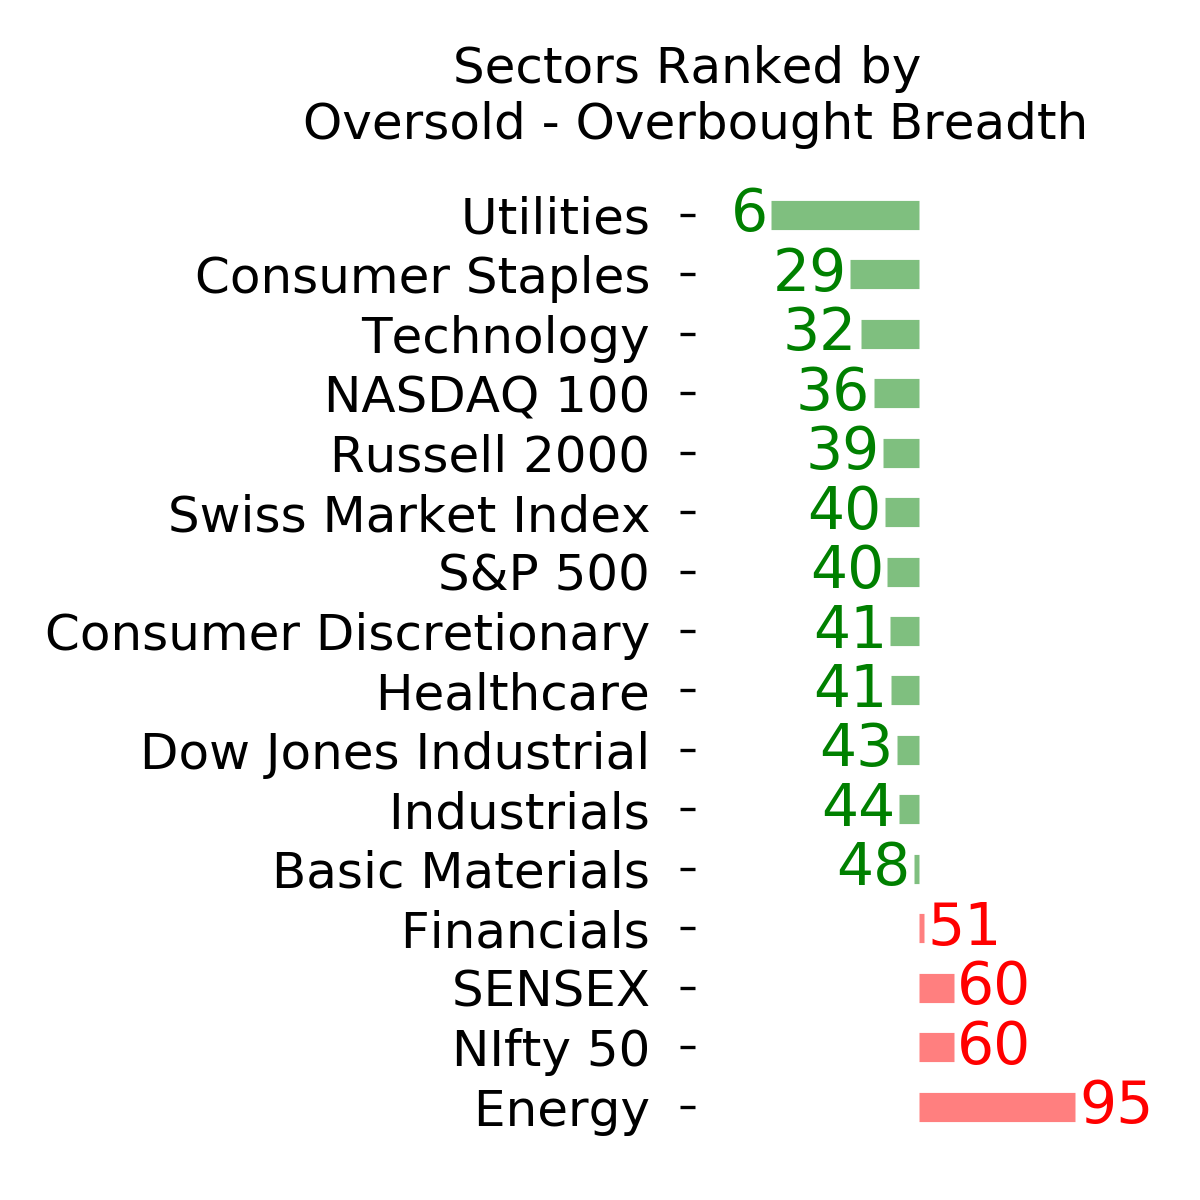
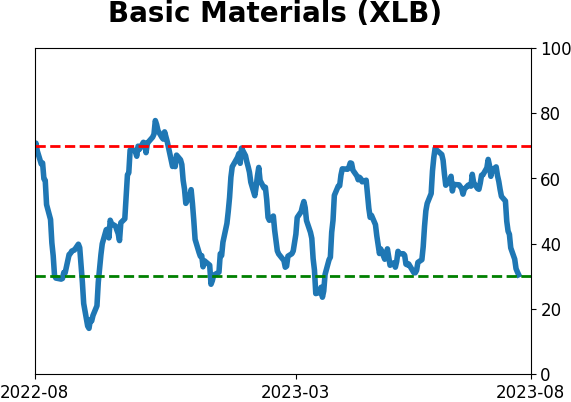
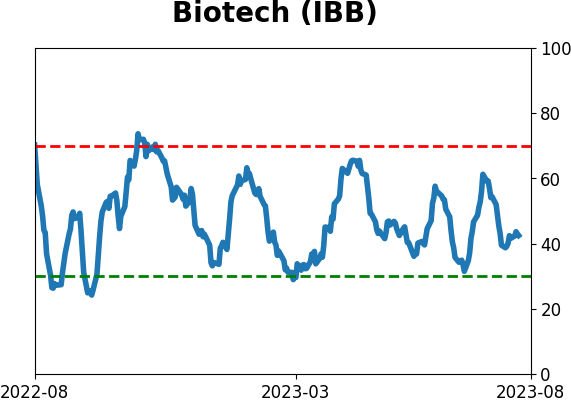
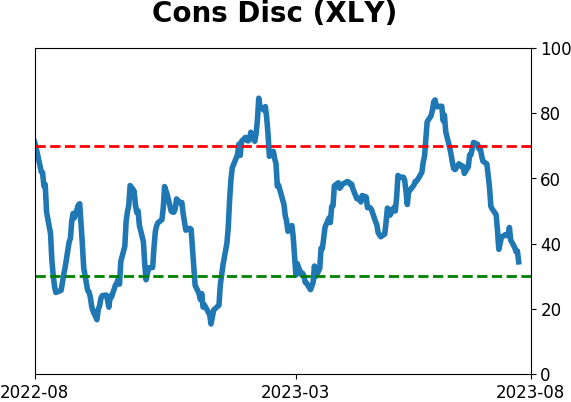
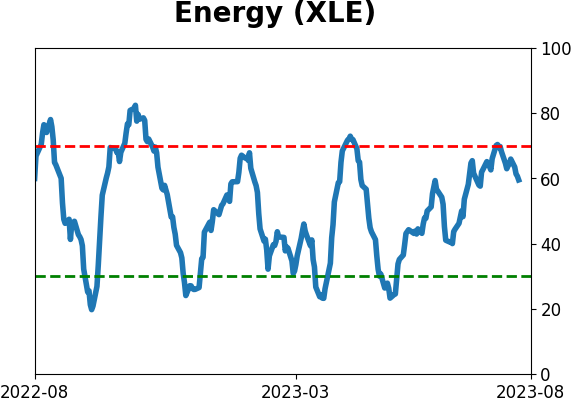
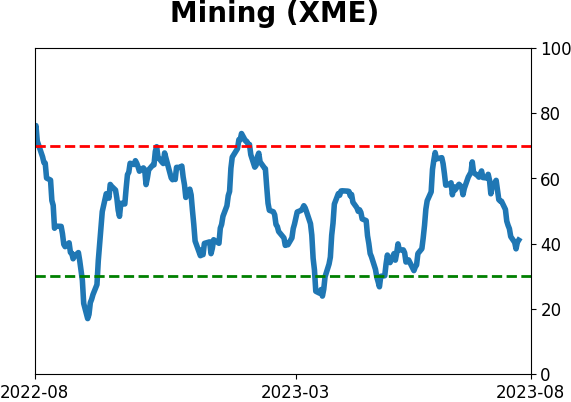
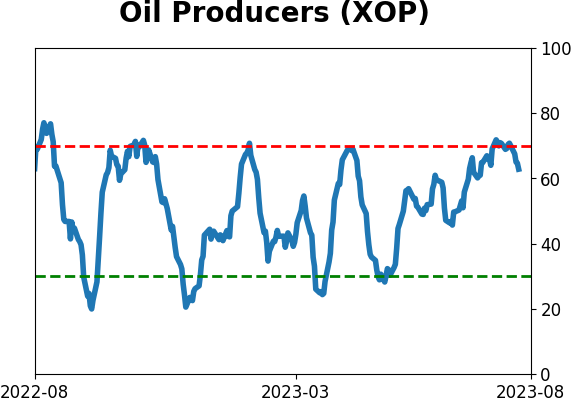
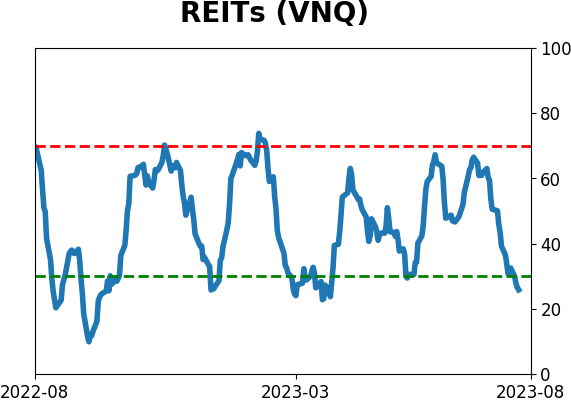
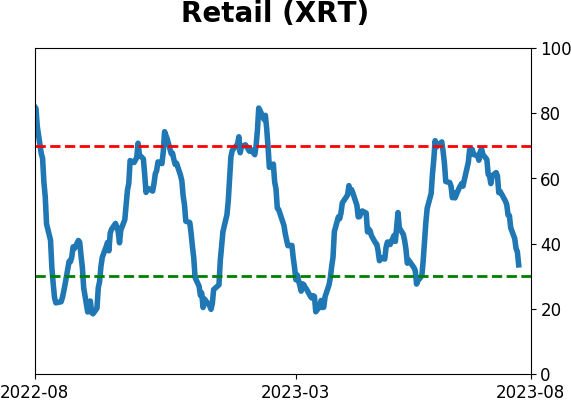
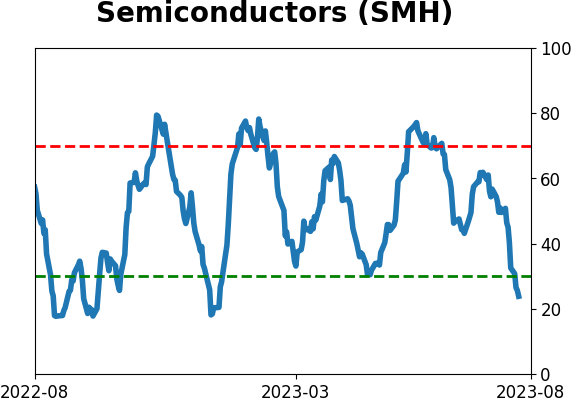
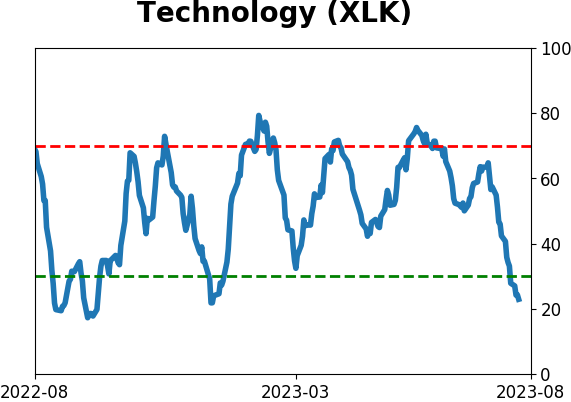
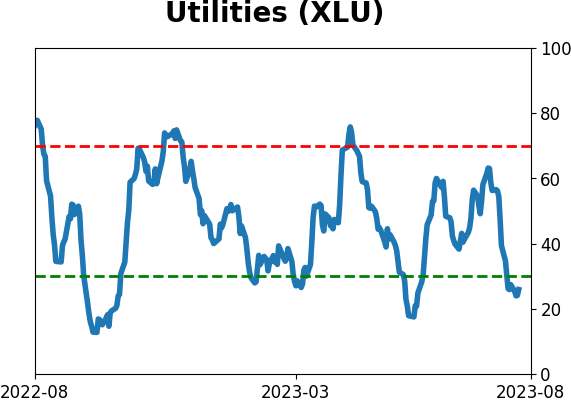
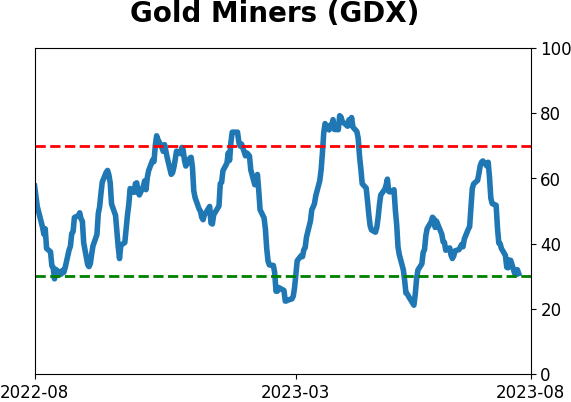
Sector ETF's - 10-Day Moving Average
|
|
|
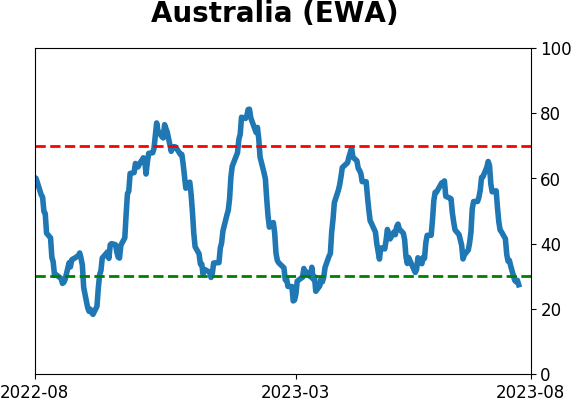
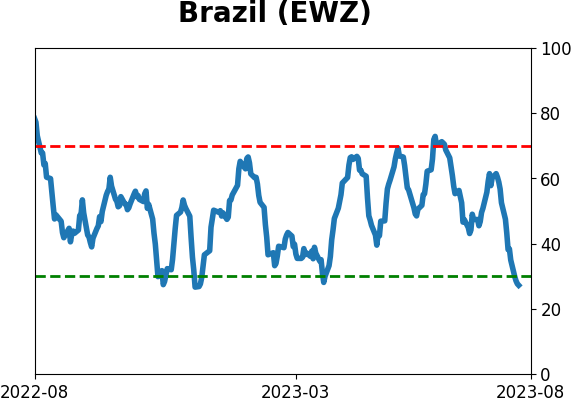
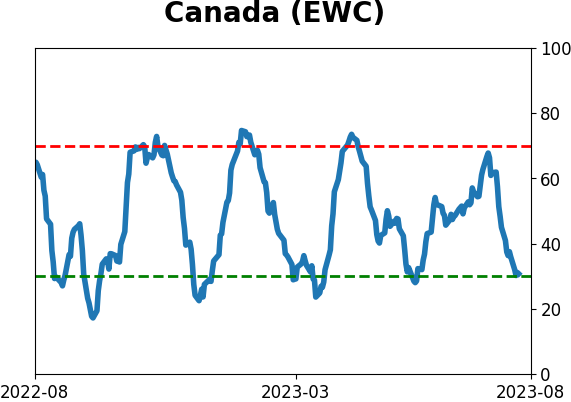
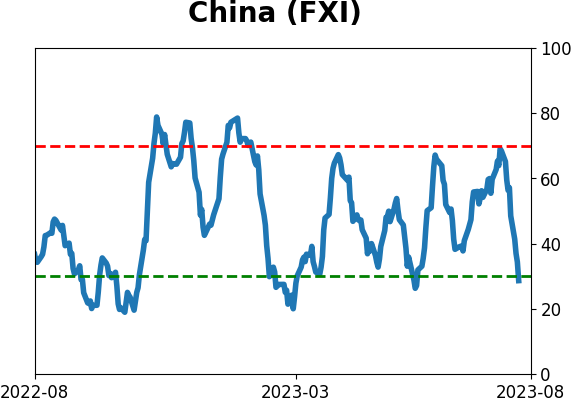
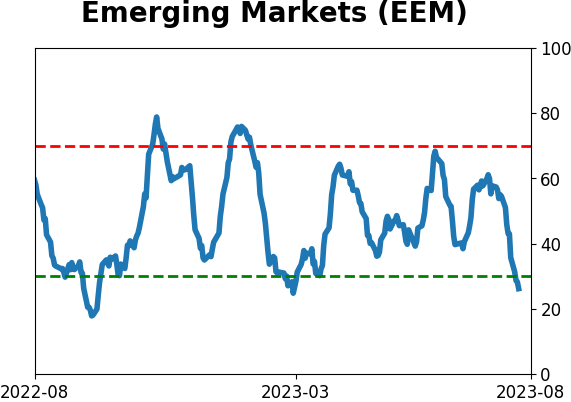
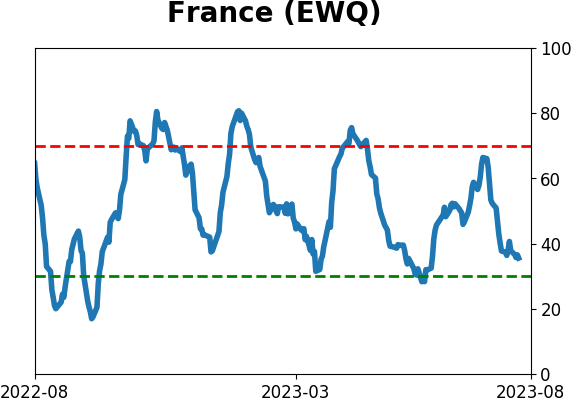
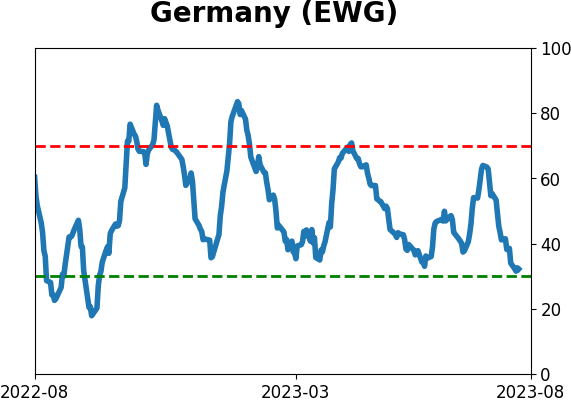
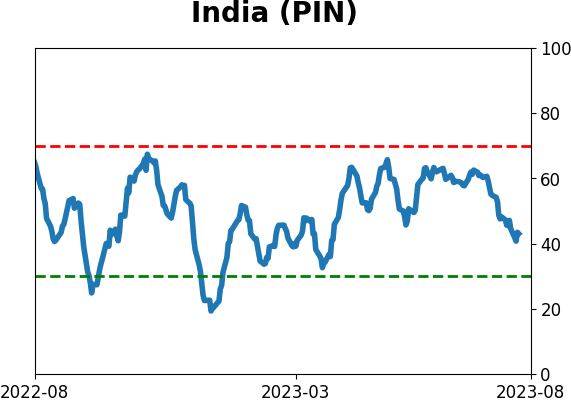
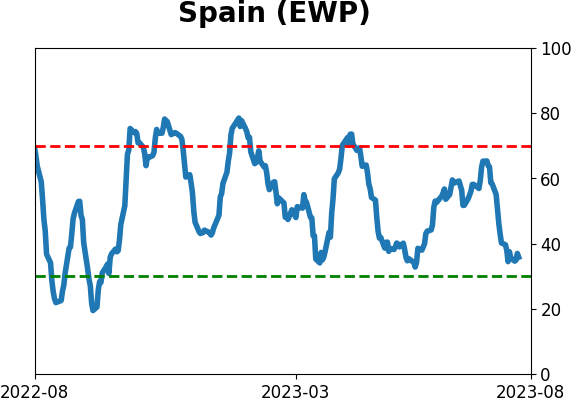
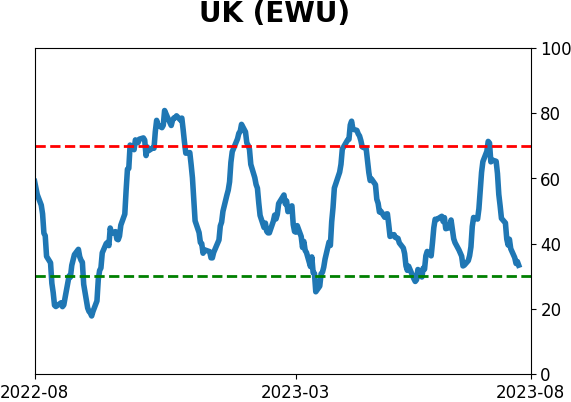
Country ETF's - 10-Day Moving Average
|
|
|
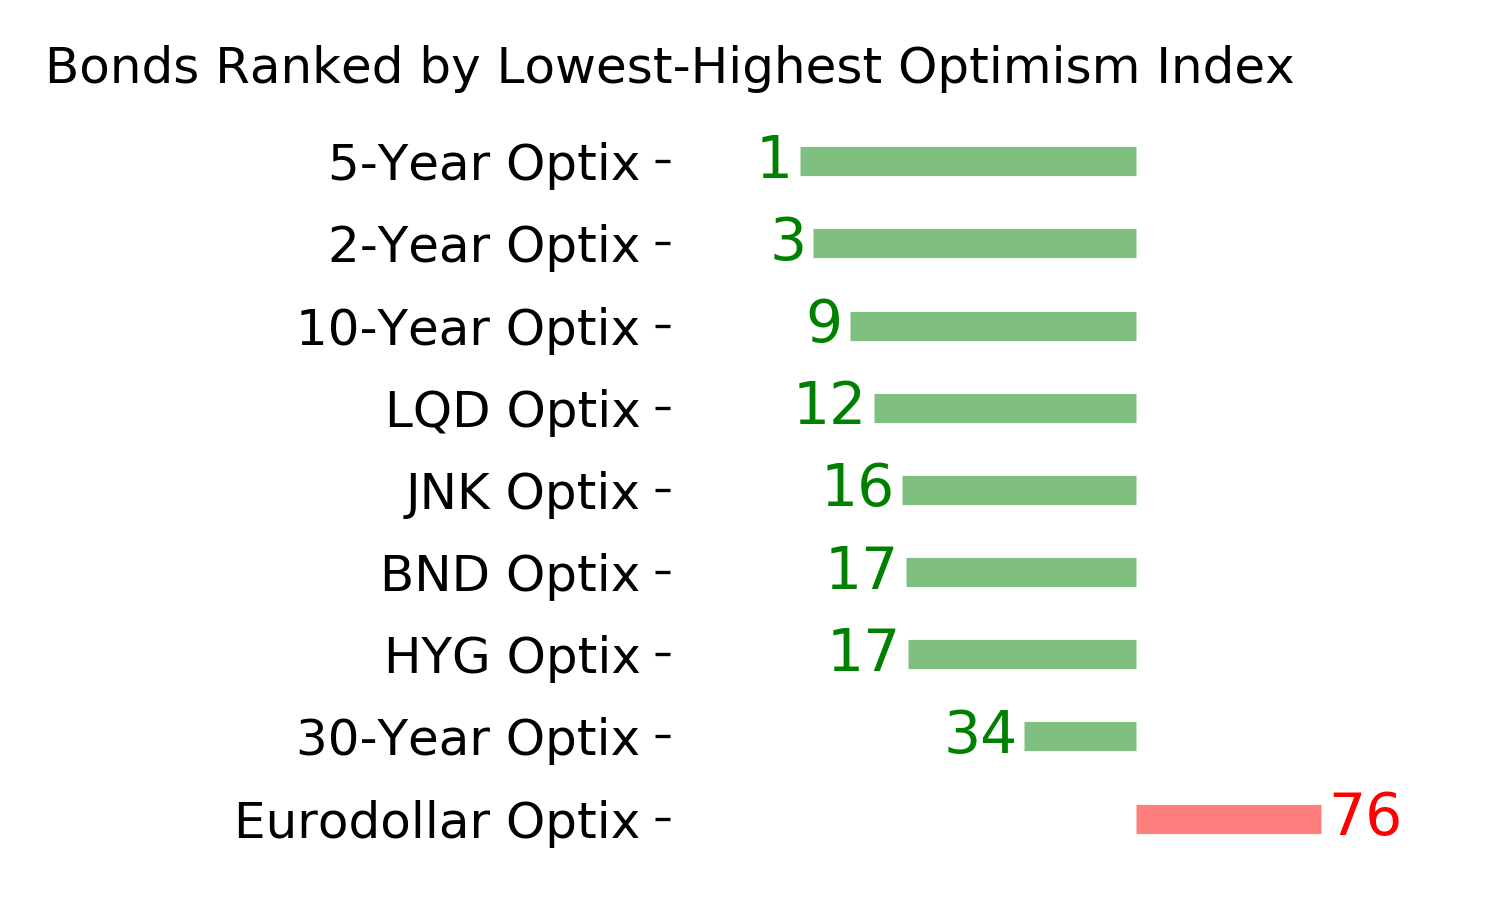
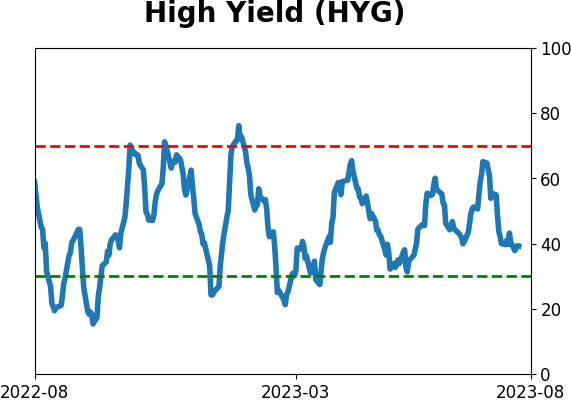
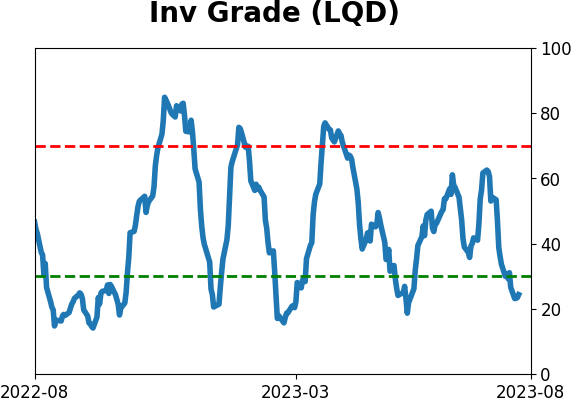
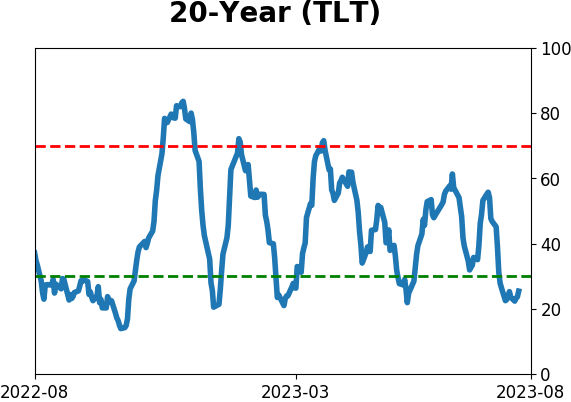
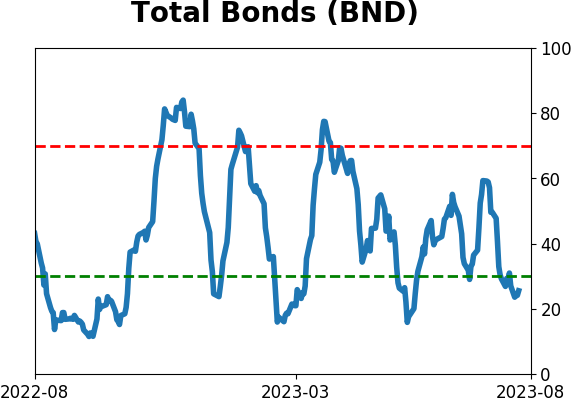
Bond ETF's - 10-Day Moving Average
|
|
|
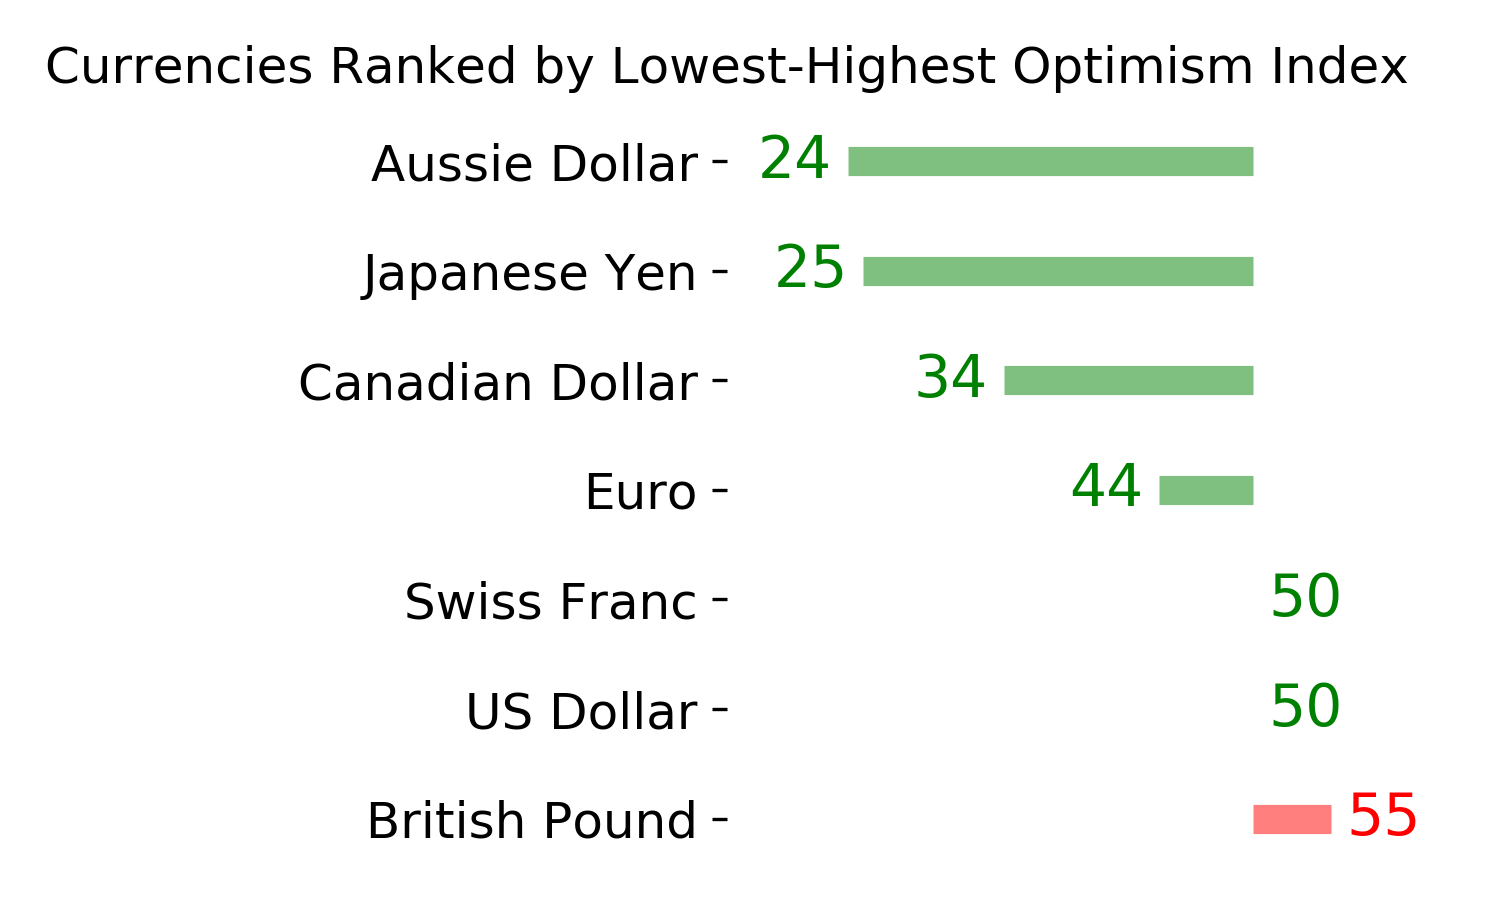
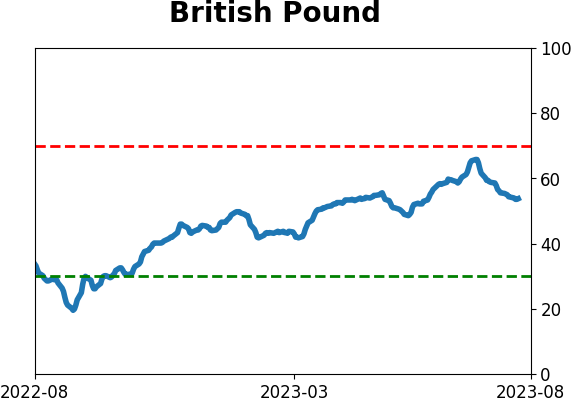
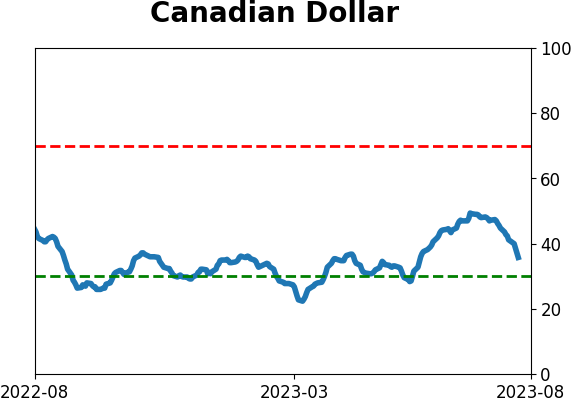
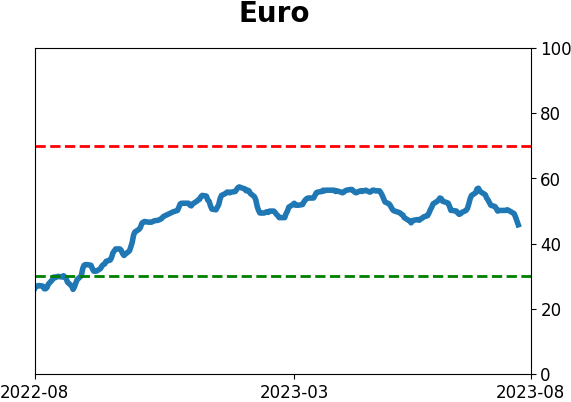
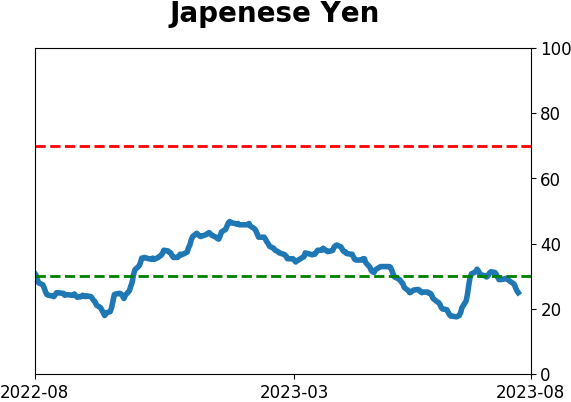
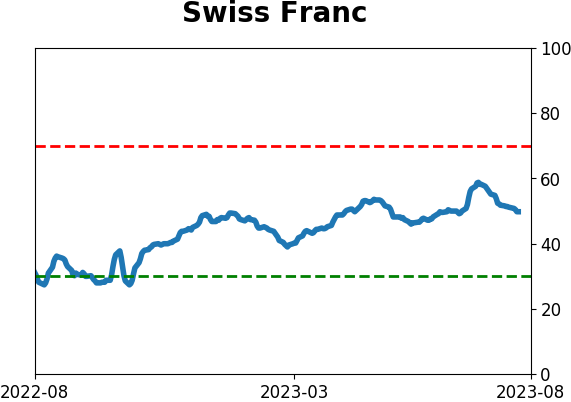
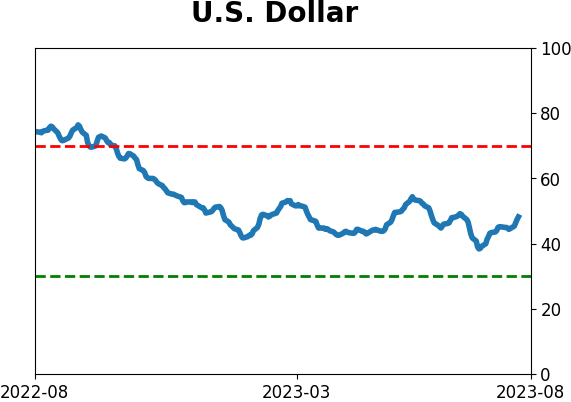
Currency ETF's - 5-Day Moving Average
|
|
|
Commodity ETF's - 5-Day Moving Average
|
|