Headlines
|
|
Chinese tech stock trends continue to deteriorate:
Chinese stocks have had a tough few weeks, and their technology stocks are among them. Stocks in that sector were almost universally in medium-term uptrends at the end of July, but only a couple of weeks later, fewer than 40% of them are. Similar behavior preceded yet more losses for the sector.
|
Smart / Dumb Money Confidence
|
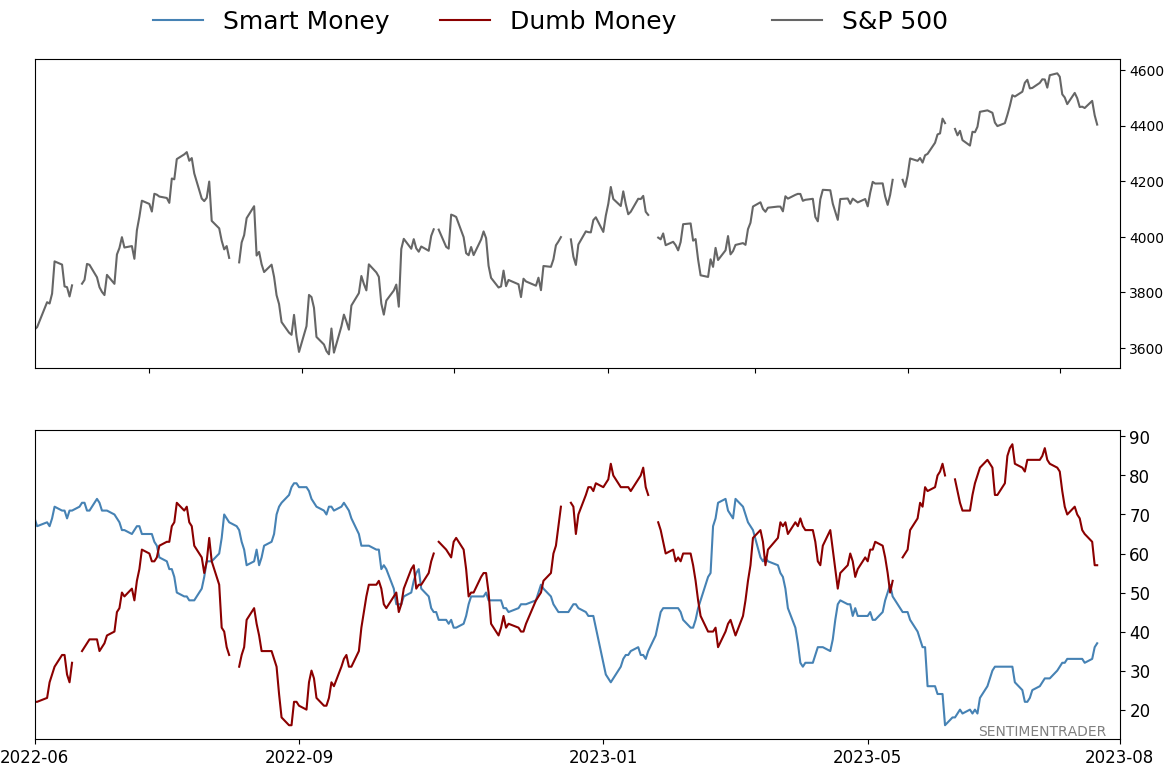
Smart Money Confidence: 37%
Dumb Money Confidence: 57%
|
|
Risk Levels
Stocks Short-Term
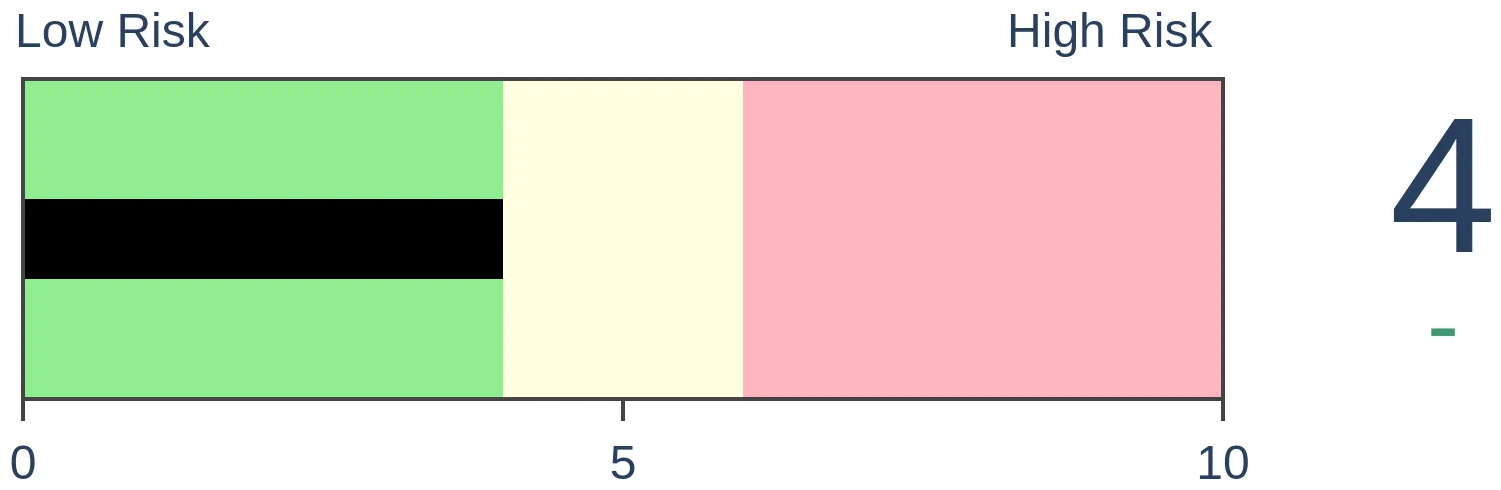
|
Stocks Medium-Term
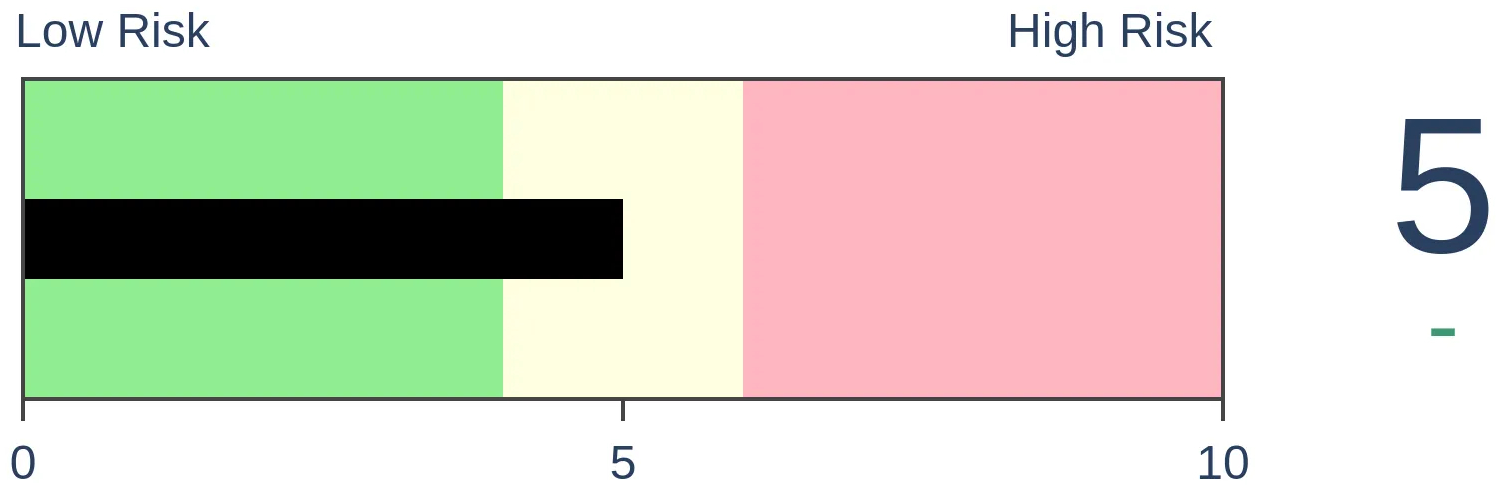
|
|
Bonds
|
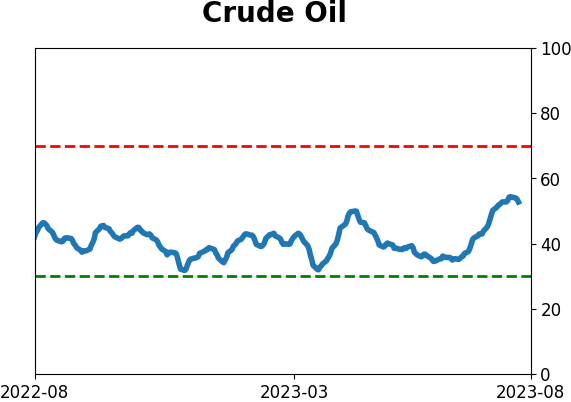
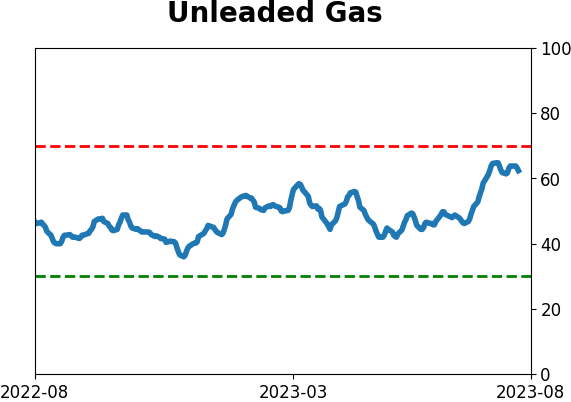
Crude Oil

|
|
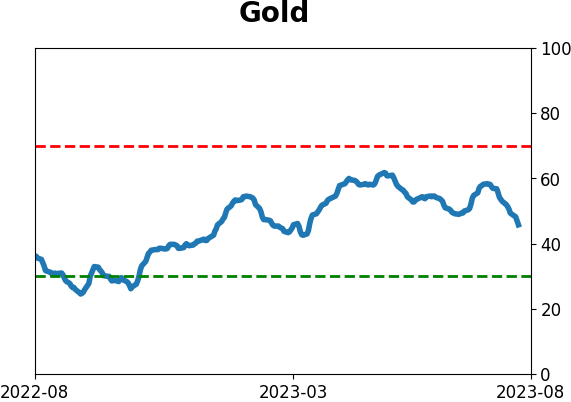
Gold

|
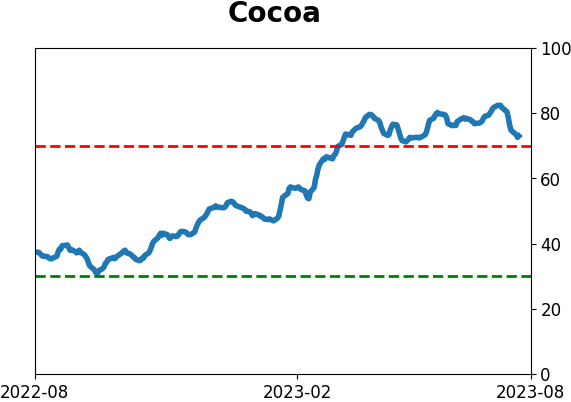
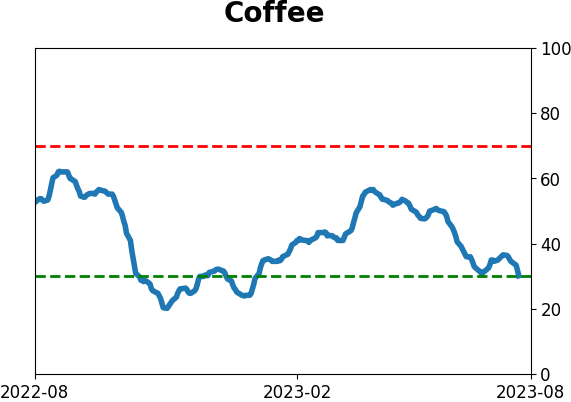
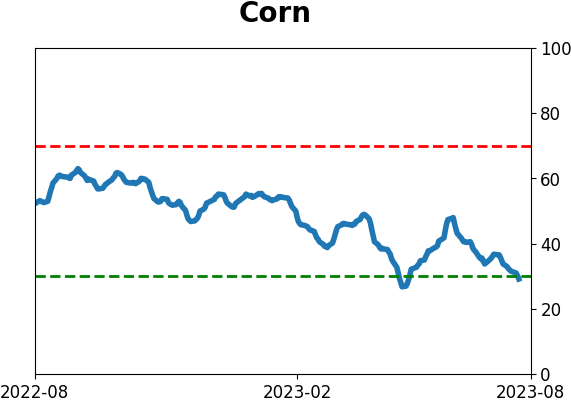
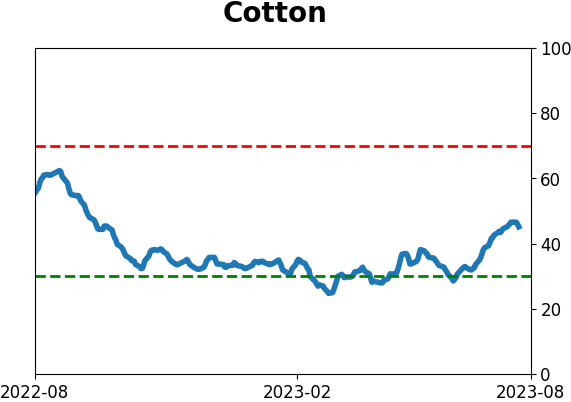
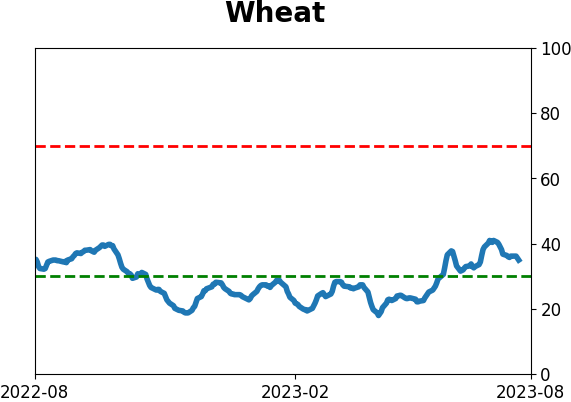
Agriculture

|
|
Research
By Jason Goepfert
BOTTOM LINE
Chinese stocks have had a tough few weeks, and their technology stocks are among them. Stocks in that sector were almost universally in medium-term uptrends at the end of July, but only a couple of weeks later, fewer than 40% of them are. Similar behavior preceded yet more losses for the sector.
FORECAST / TIMEFRAME
None
|
Key points:
- Chinese internet stocks have had a tough couple of weeks, with broad losses
- Almost all the stocks were in medium-term uptrends two weeks ago, while now fewer than 40% are
- Similar cycles preceded losses over the next 2-3 months almost every time
Tech stocks aren't suffering just in the U.S.
It's impossible, or nearly so, to find a positive spin on anything happening in China, particularly from U.S. media. There is little question that sentiment is sour, and the stocks are suffering, as we saw yesterday with a historically quick reversal in overbought conditions among stocks in the Shanghai Composite.
Chinese technology companies are arguably even more of a focus for investors outside of that country due to their scale, market penetration, and historically cheap valuations. It has been difficult for their shares to gain traction among domestic and foreign investors due to all the issues we hear about ad nauseam.
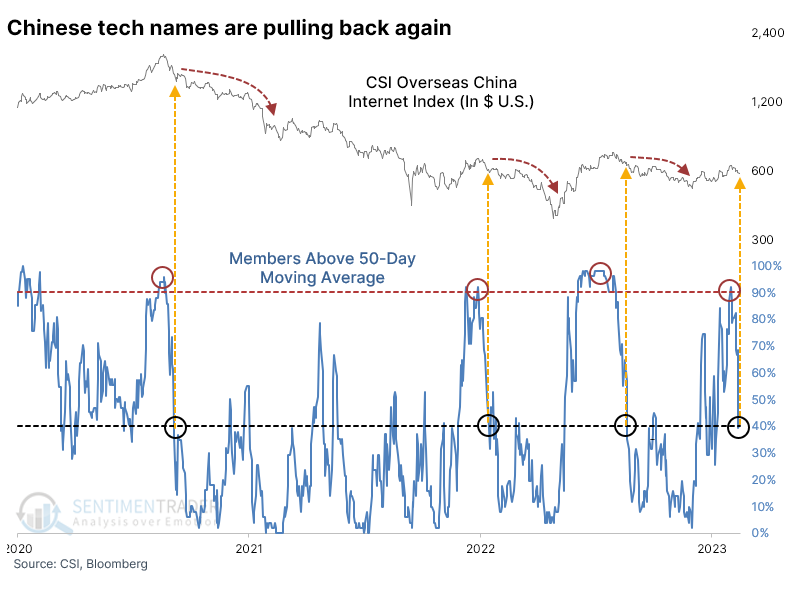
We last visited these stocks in May. At the time, it appeared the group had become uninvestable again, but based on some technical measures, it was difficult to support an immediate rebound. They did decline for a couple more weeks, then surged into July. Since then, it has been a tough slog, and the last few weeks have seen deteriorating conditions.
Among stocks in the CSI Overseas China Internet Index, upon which the KWEB fund is based, medium-term trends are quickly flipping from up to down. As recently as July 31, more than 90% of stocks in the index were above their 50-day moving average. That has since plunged to fewer than 40%. Since the sector peaked in 2020, there have been three similar cycles, and all preceded months more of pain.
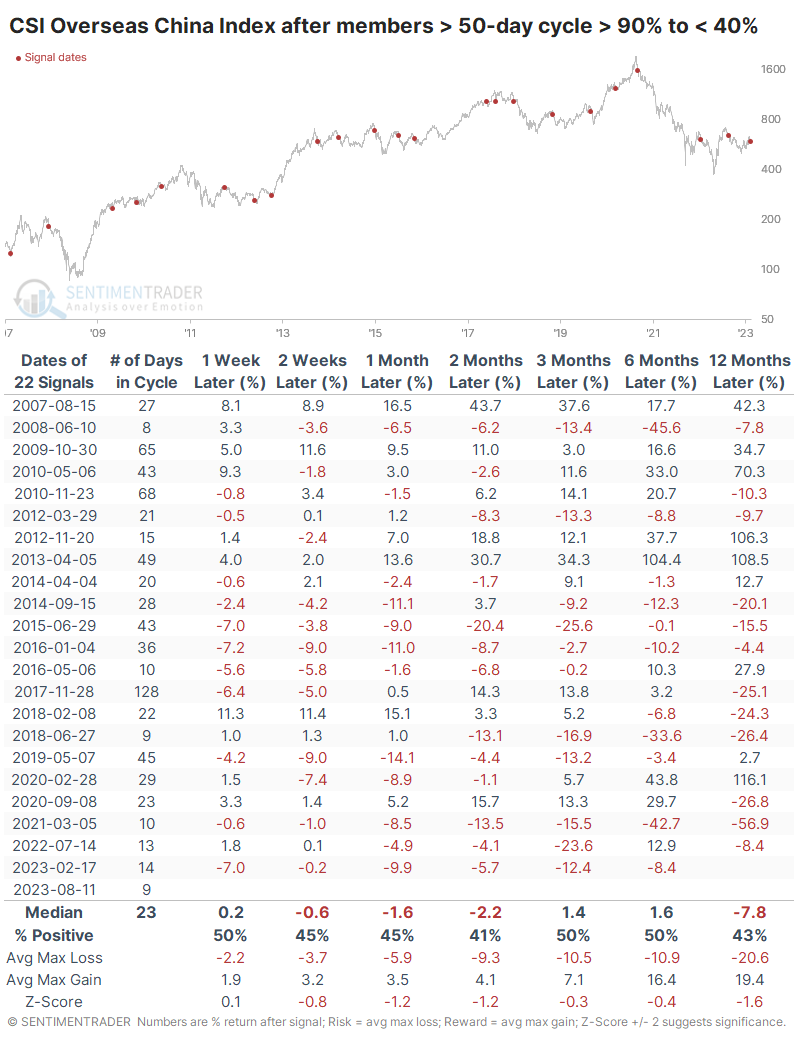
The table below shows every time when there was a cycle of more than 90% of the stocks above their medium-term averages to fewer than 40%. As we saw on Tuesday, when sentiment on these names turns sour, it tends to persist. Over the next two months, the index rebounded only 41% of the time. Median returns and risk/reward ratios were poor across all time frames though there were a handful of double-digit rallies.
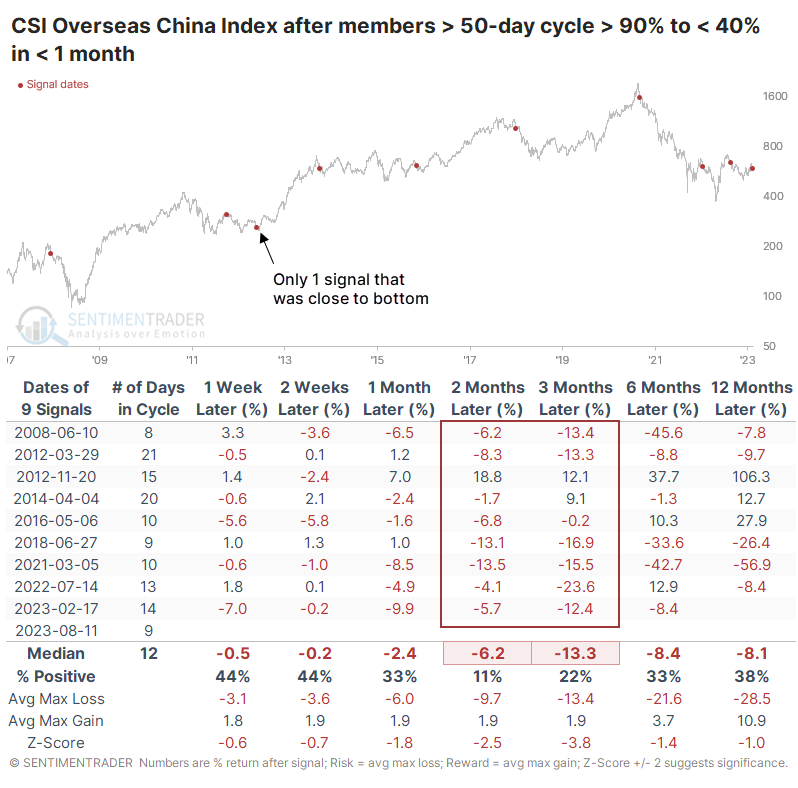
As we did earlier, let's focus on the quicker cycles, as often that provides a better clue as to how investors are reacting to the stocks' outlooks. And it's not good. This was the 2nd-fastest cycle from more than 90% of stocks above their averages to fewer than 40%, and it barely missed being the quickest cycle. Investors have abandoned ship at a historically rapid pace.
Unlike most other markets, quick shifts in sentiment have not consistently preceded rebounds. Of the nine other times when investors behaved similarly, only one enjoyed a positive return two or three months later. That proved to be one of the most opportune times in history to own the stocks.
What the research tells us...
It's hard to be optimistic about Chinese investments at the moment. Well, it's always hard because there is a definite skew to the media, thanks to geopolitical considerations, but this is harder than usual. They have been mired in a challenging environment, and rallies have not proved sustainable. Currently, the indicators we track mostly show deteriorating conditions but oversold indications are few and far between. It has not been a good sign when we've seen deterioration like we're seeing now. Internal pressure has not been washed-out enough to suggest capitulation, but it's weak enough to indicate a poor environment where investors are more eager to hit the bid than take the offer.
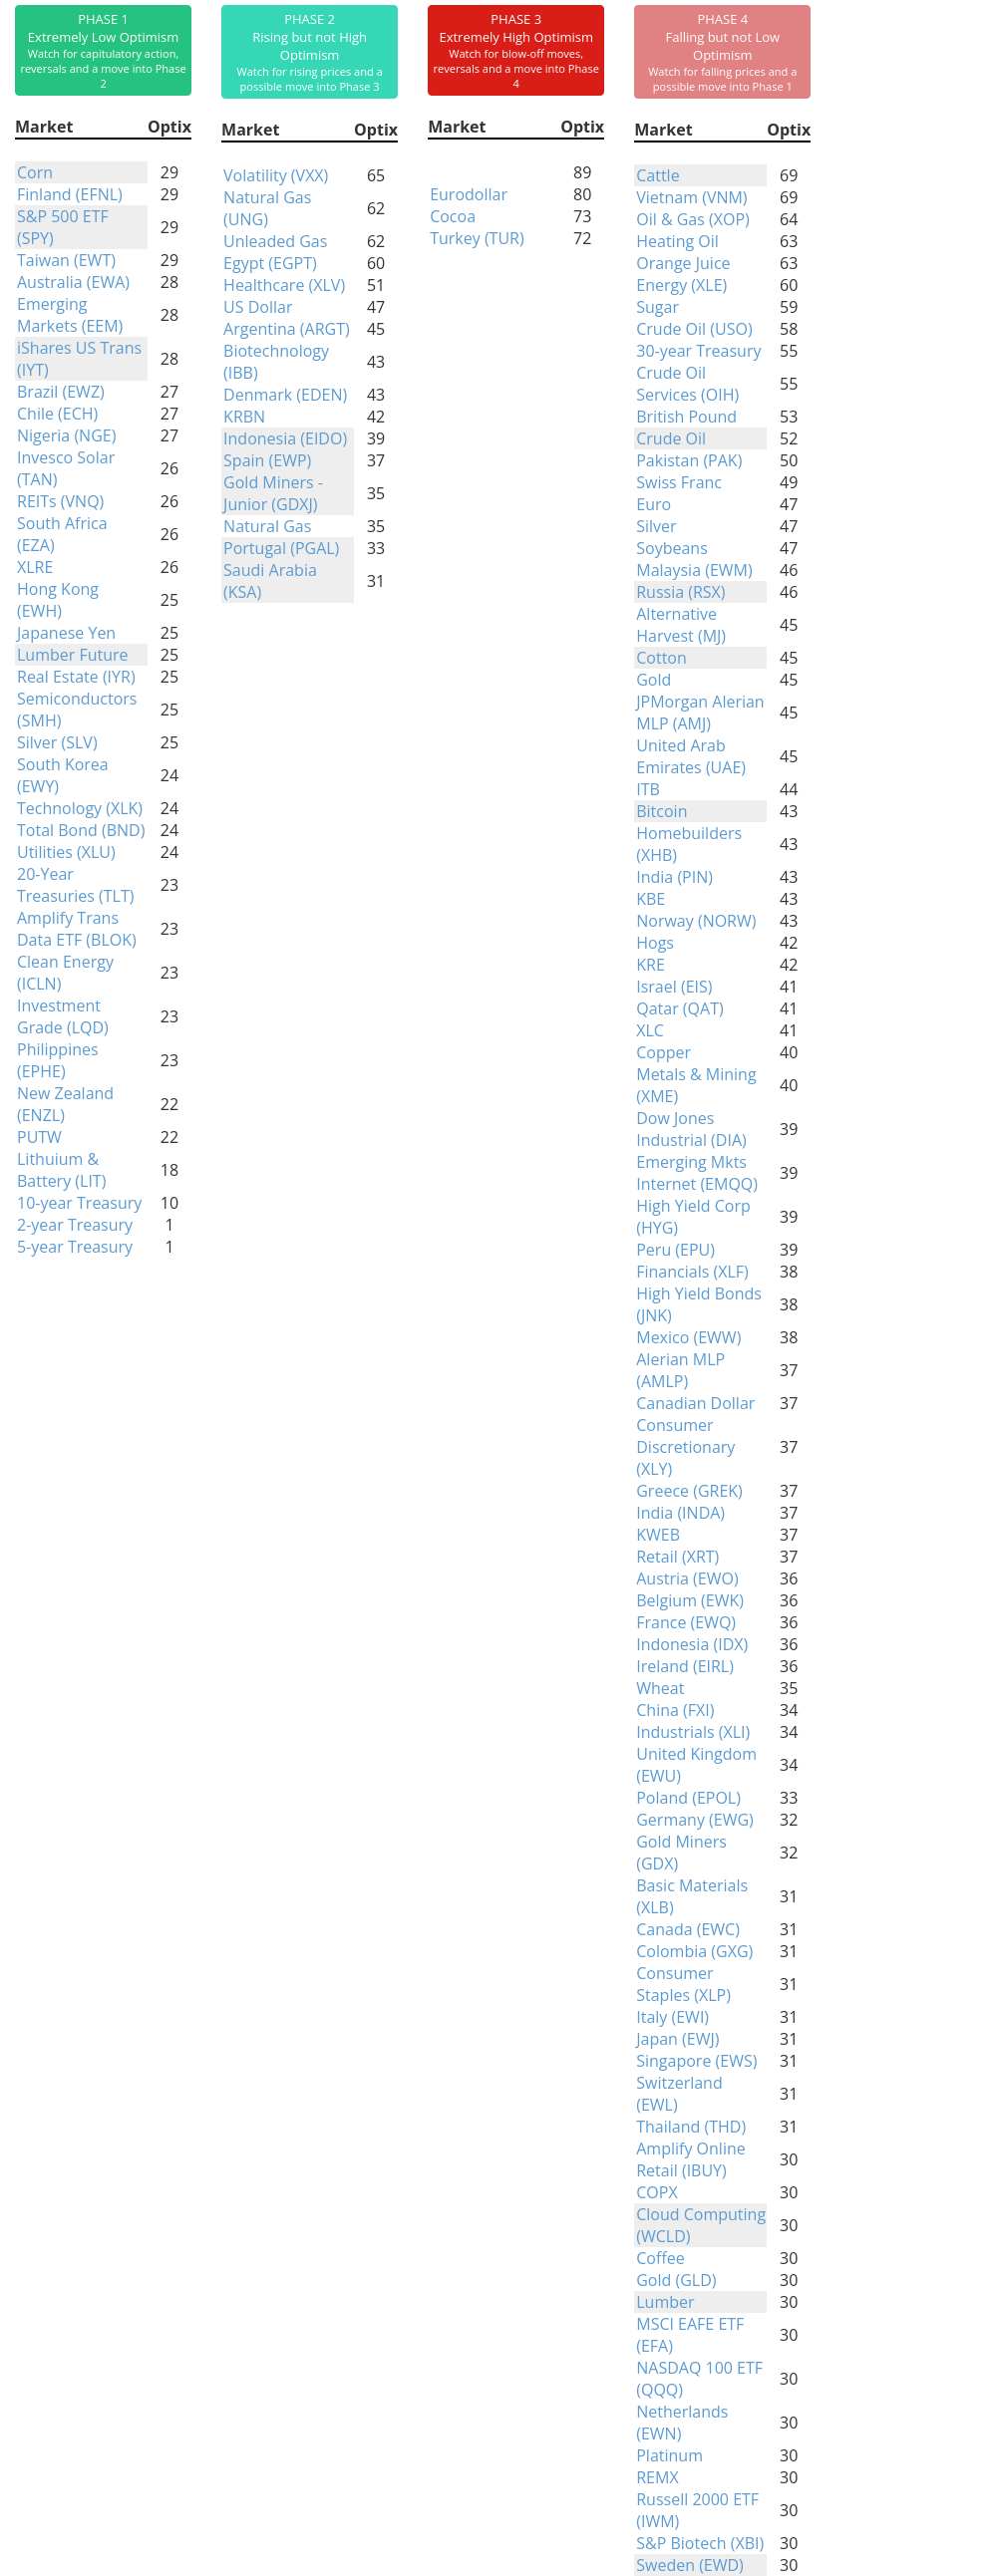
Indicators at Extremes
Phase Table
Ranks
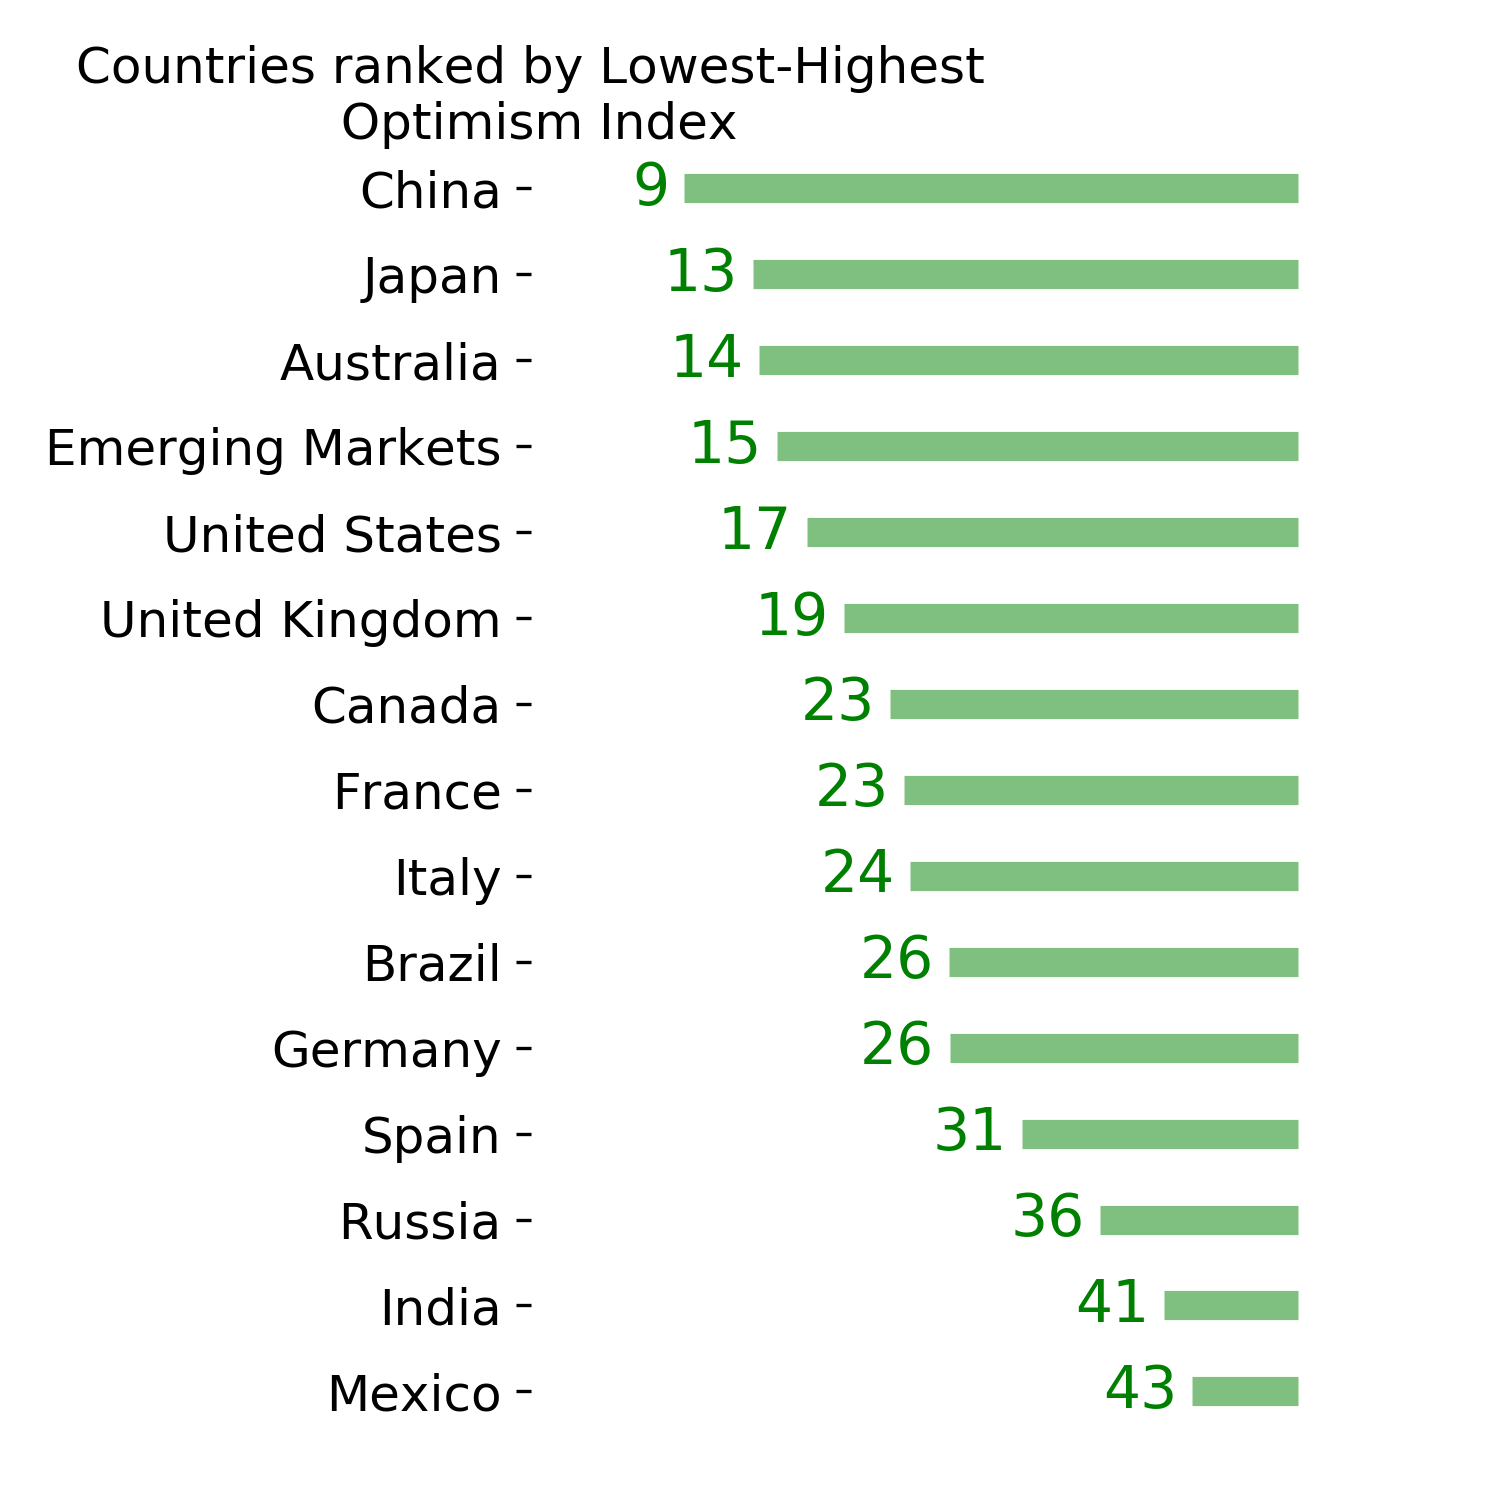
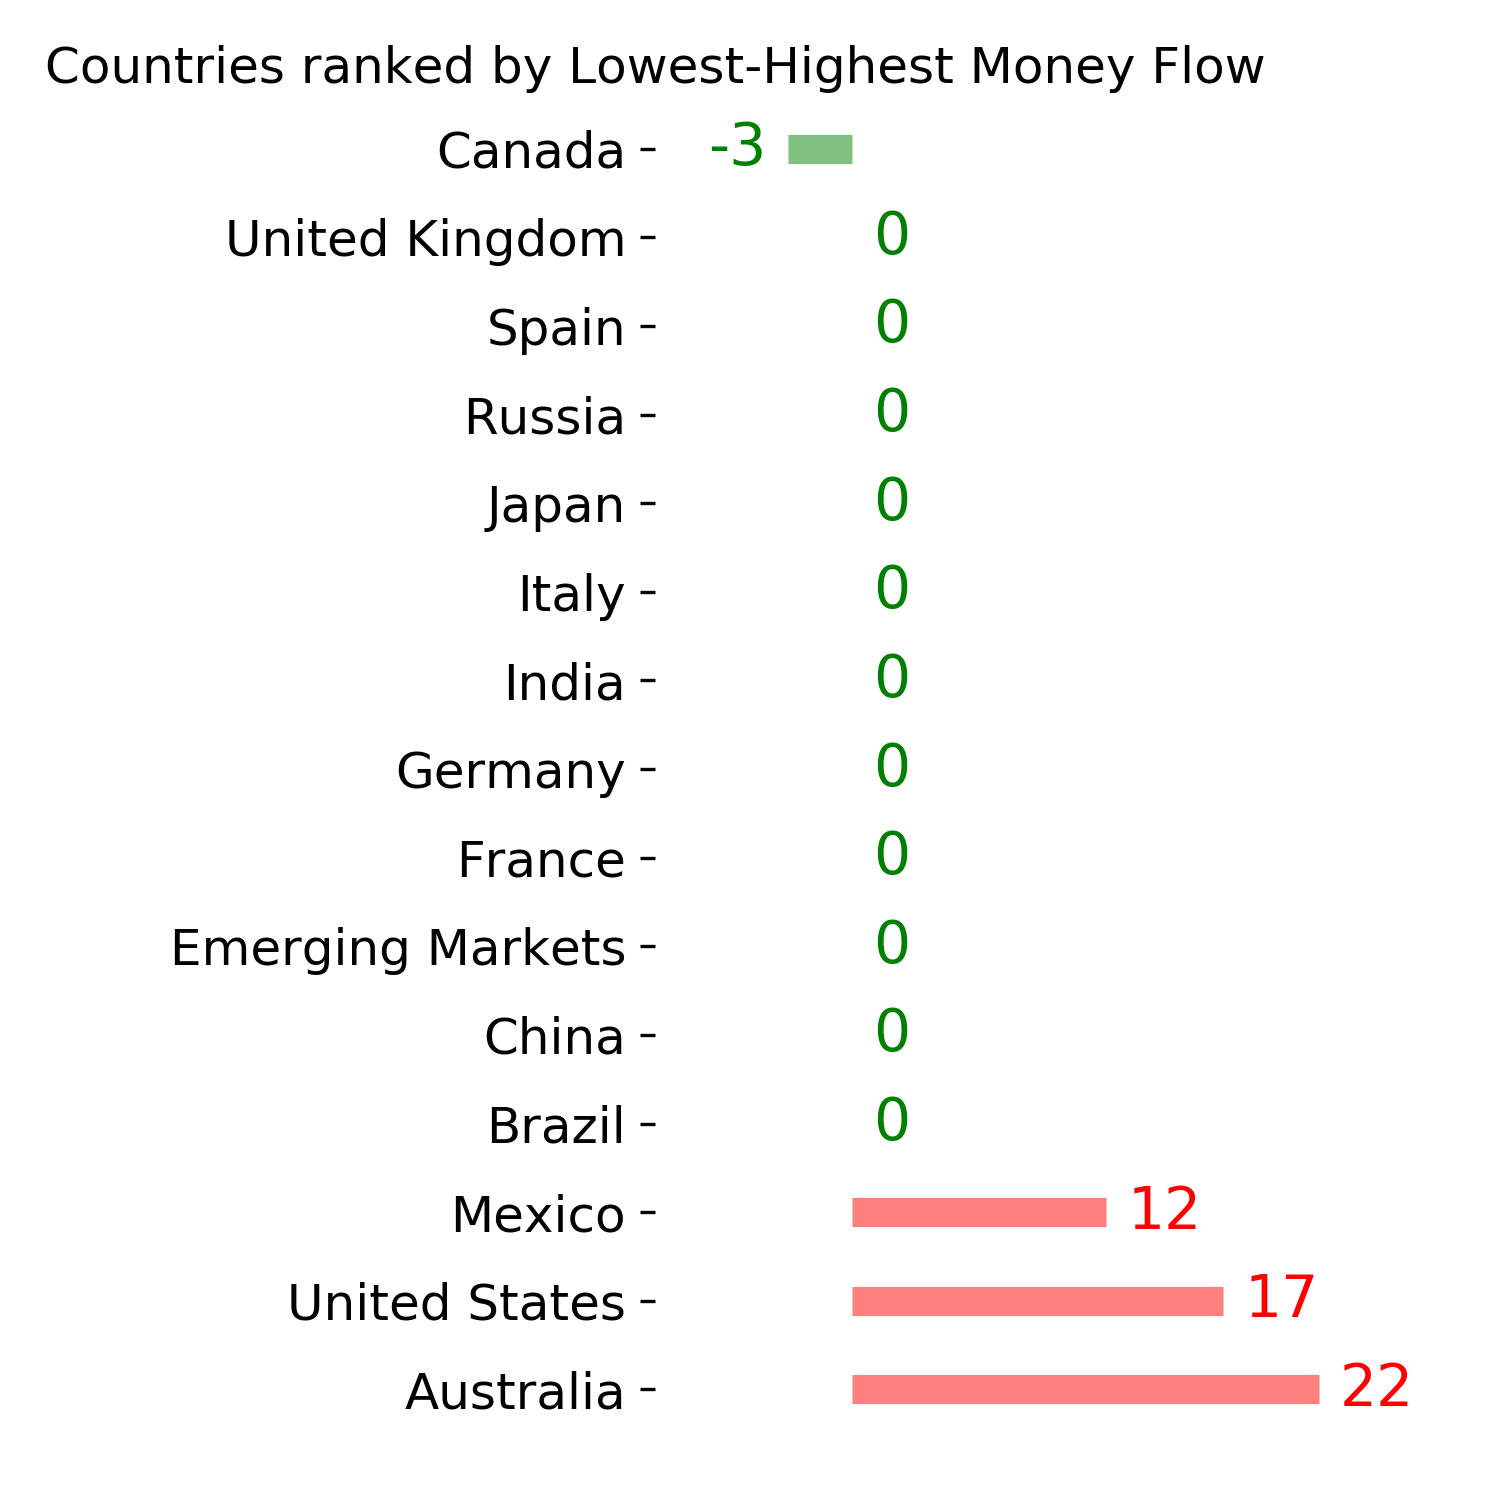
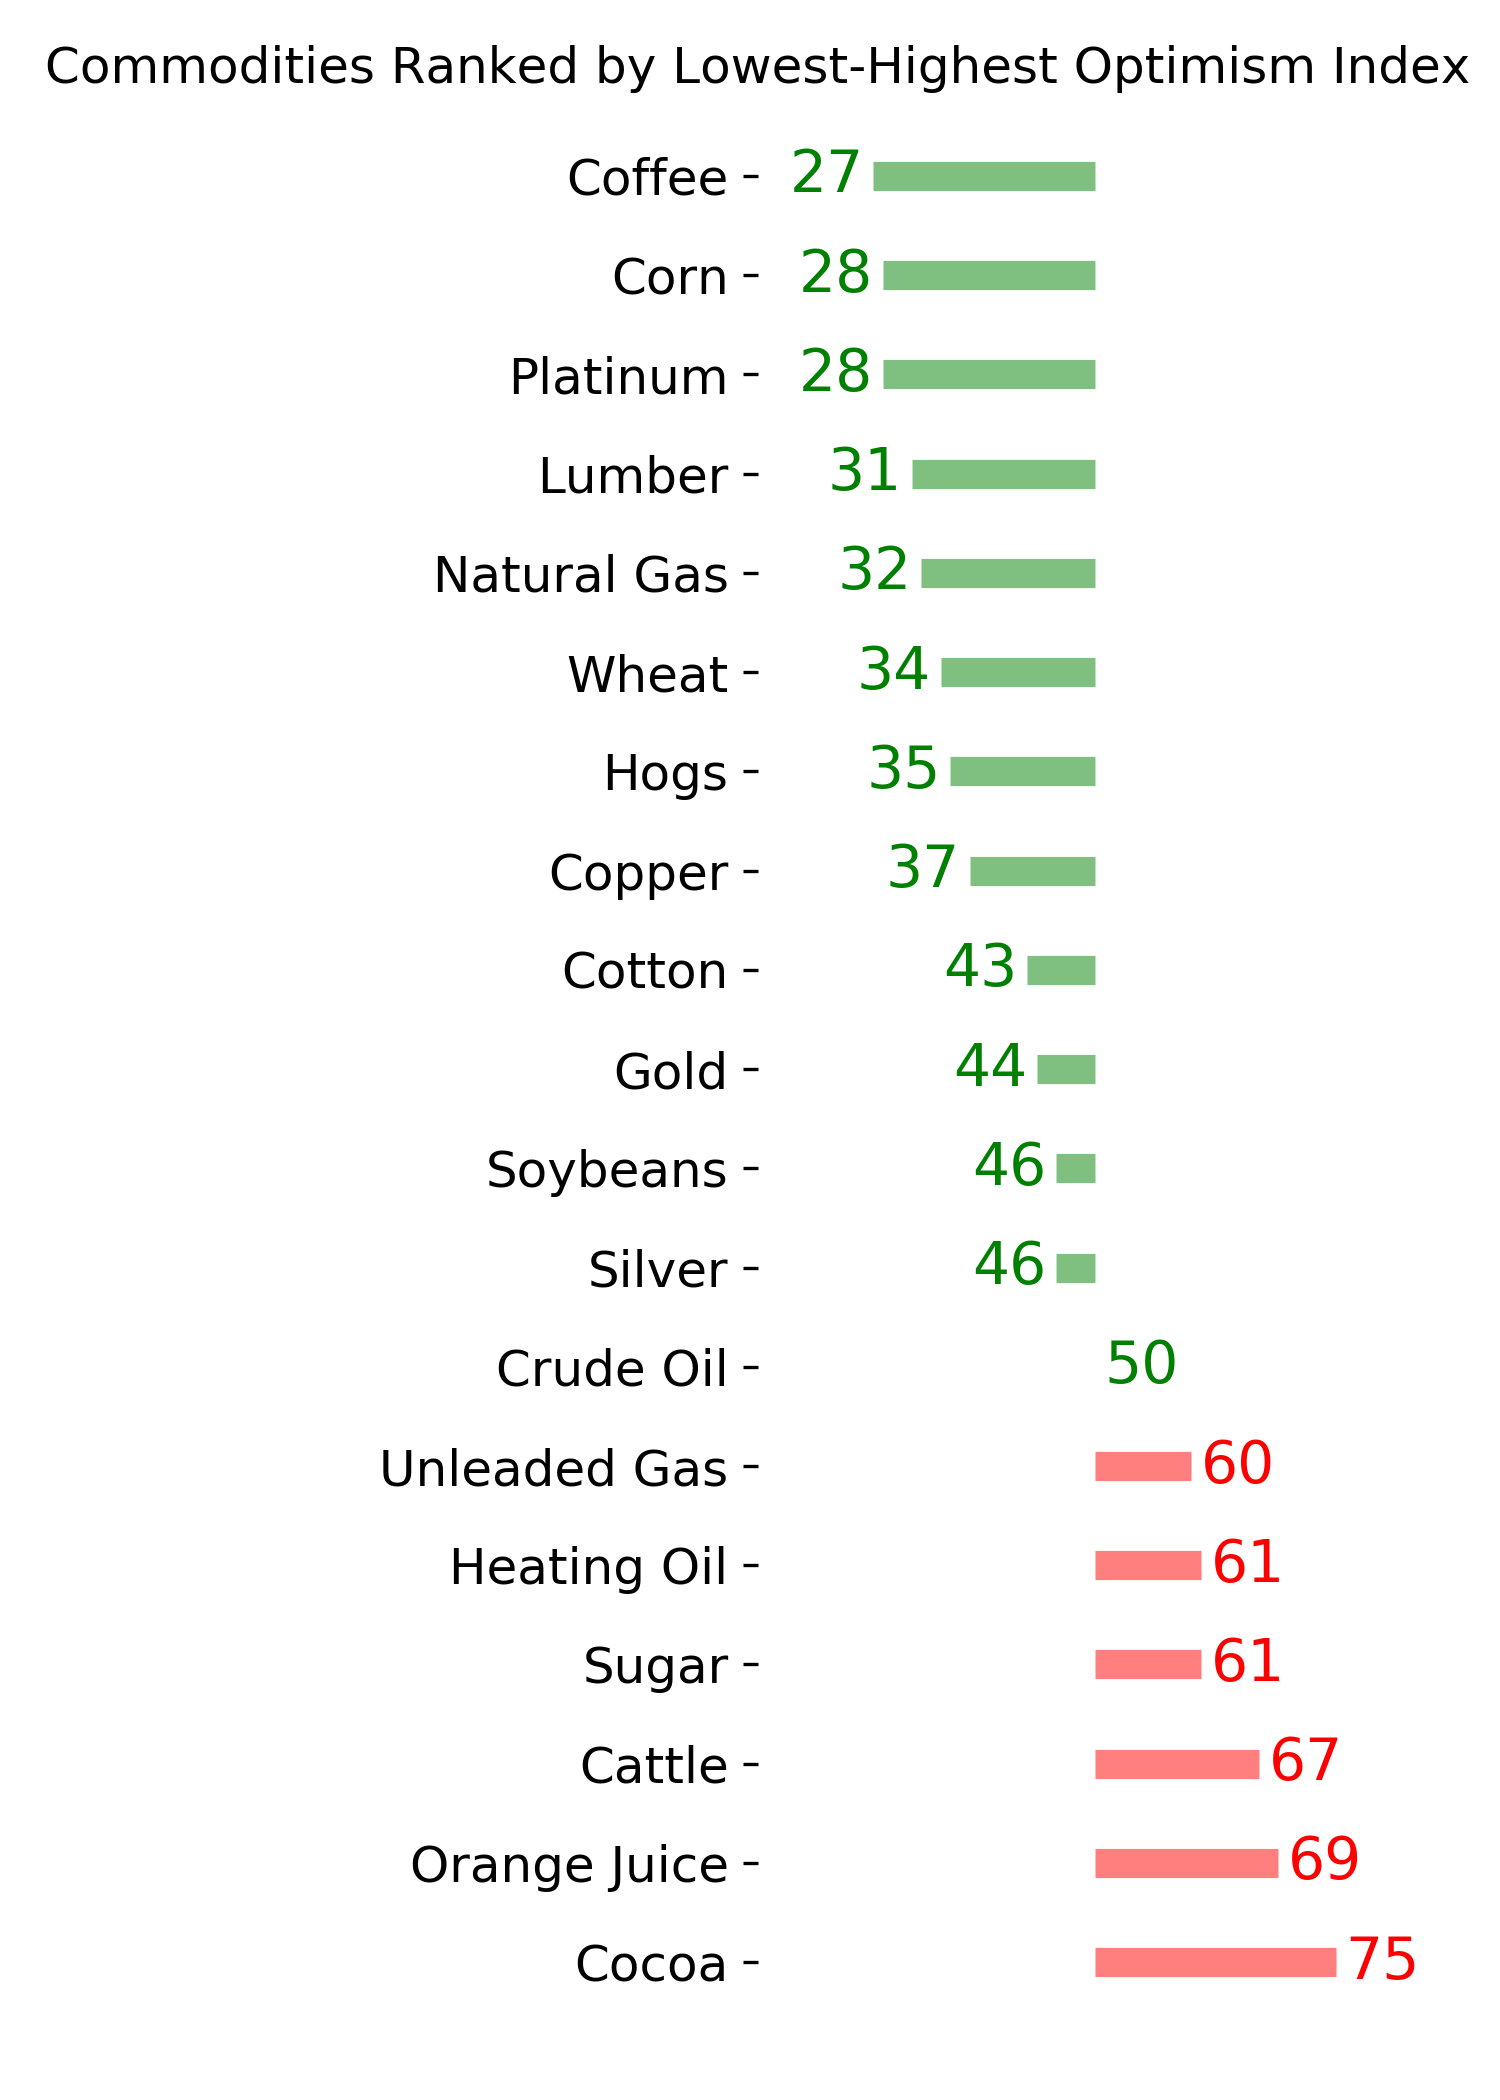
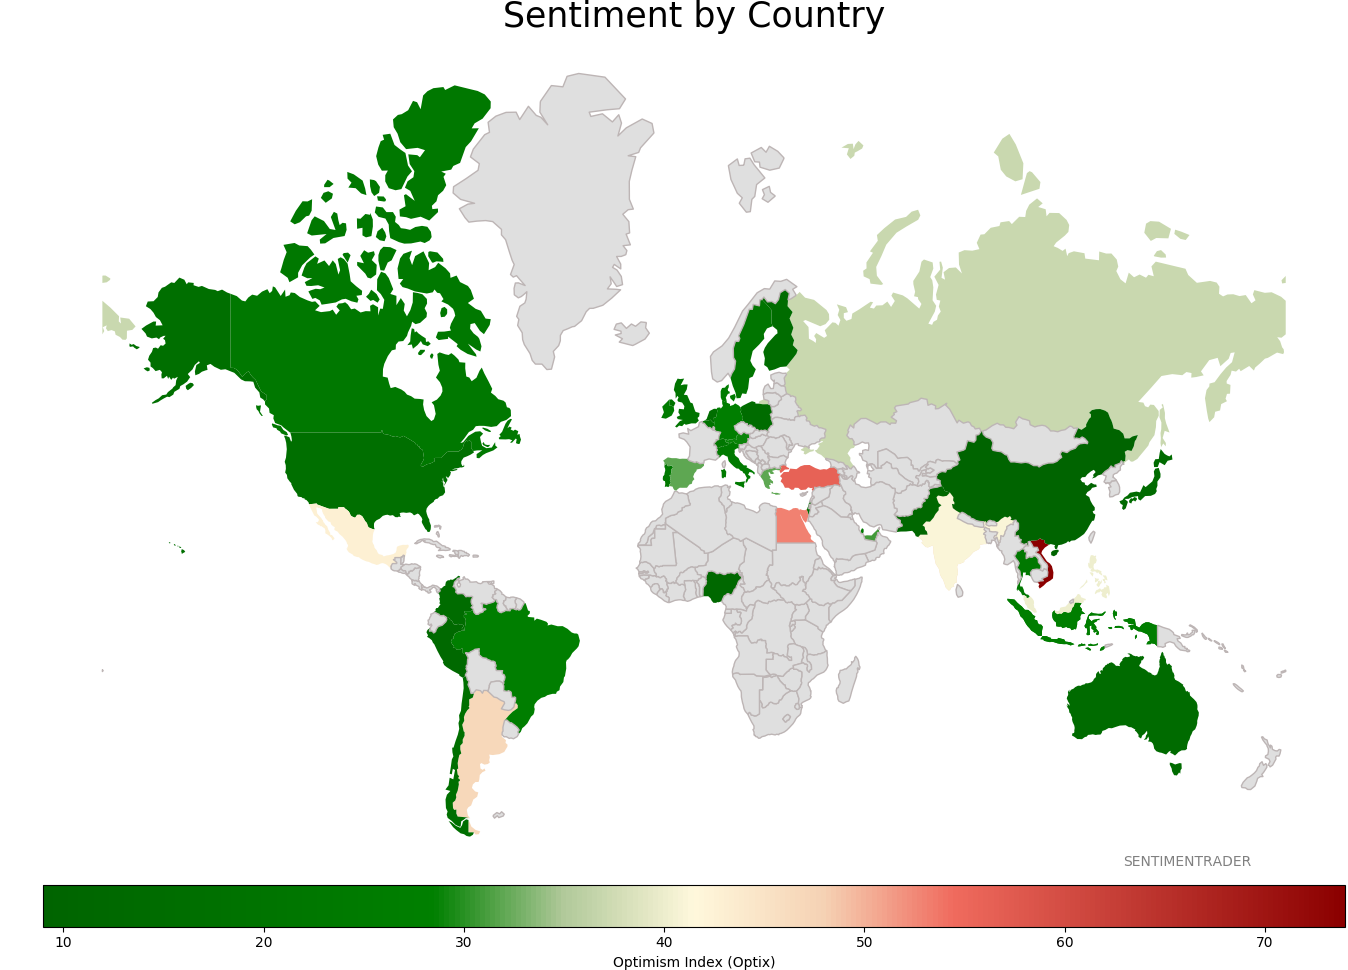
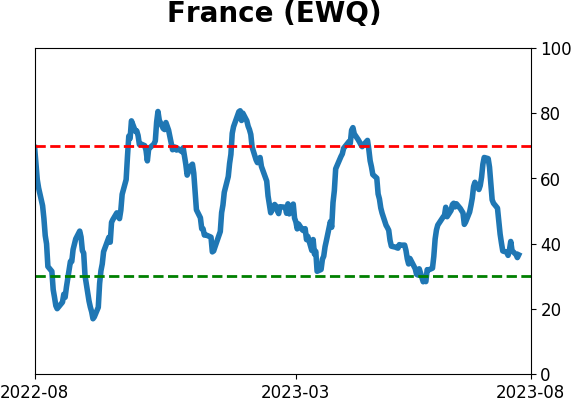
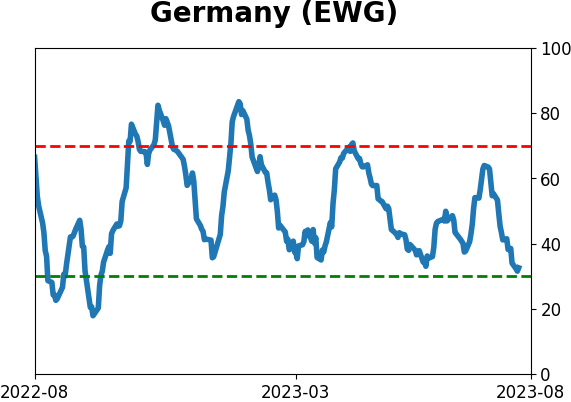
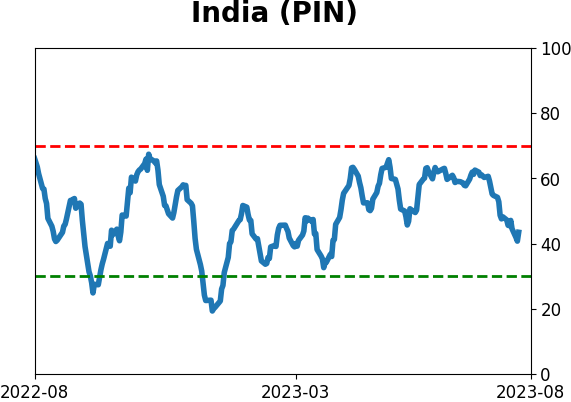
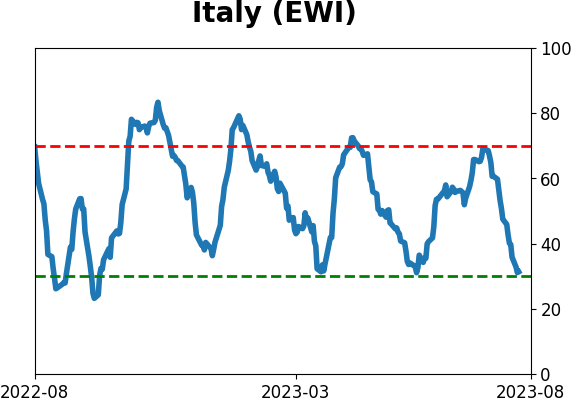
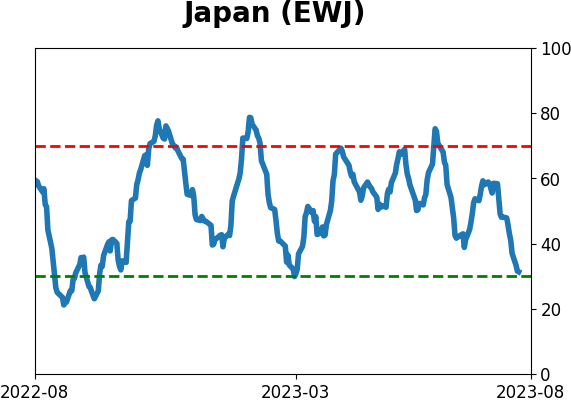
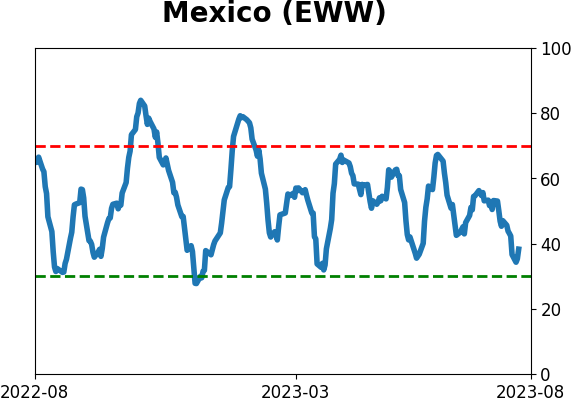
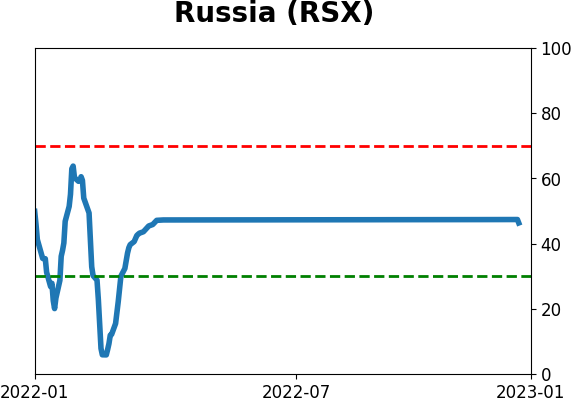
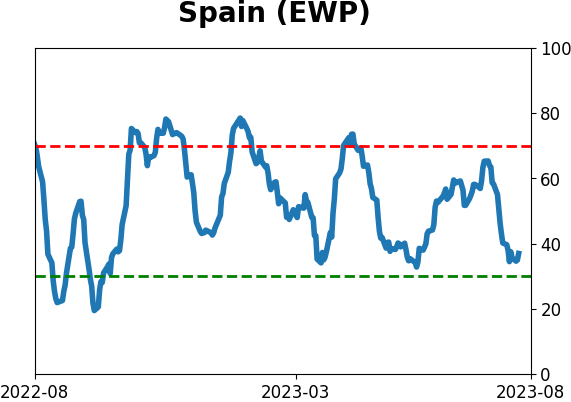
Sentiment Around The World
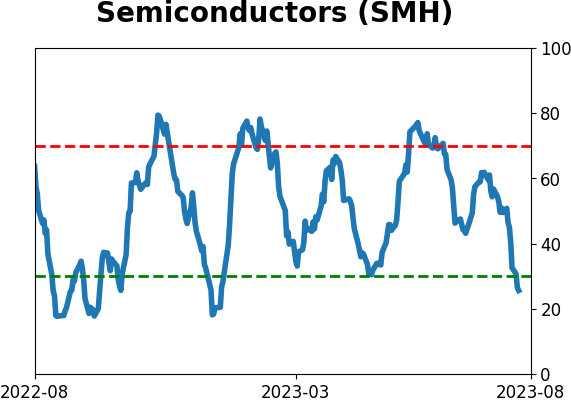
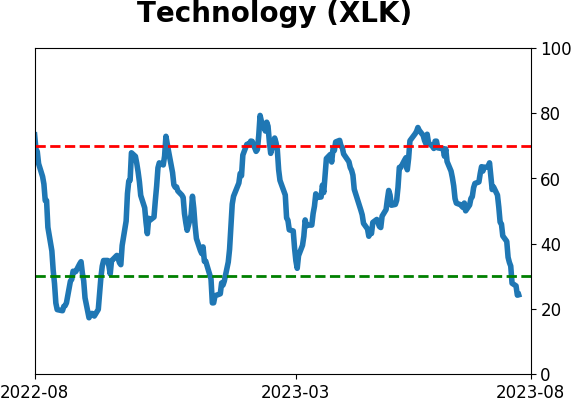
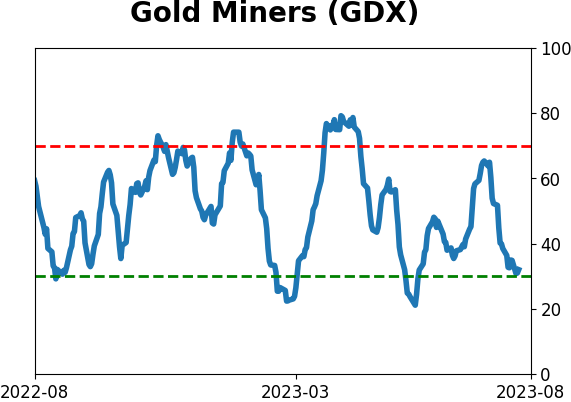
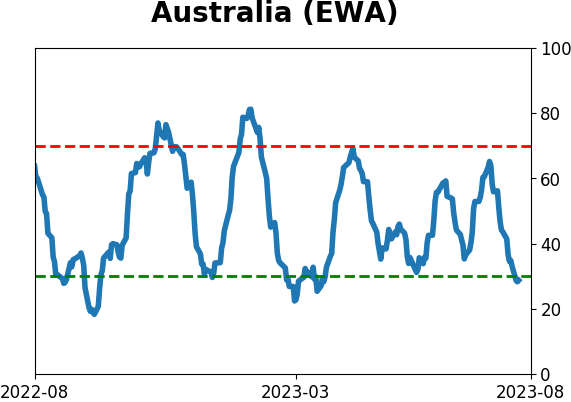
Optimism Index Thumbnails
|
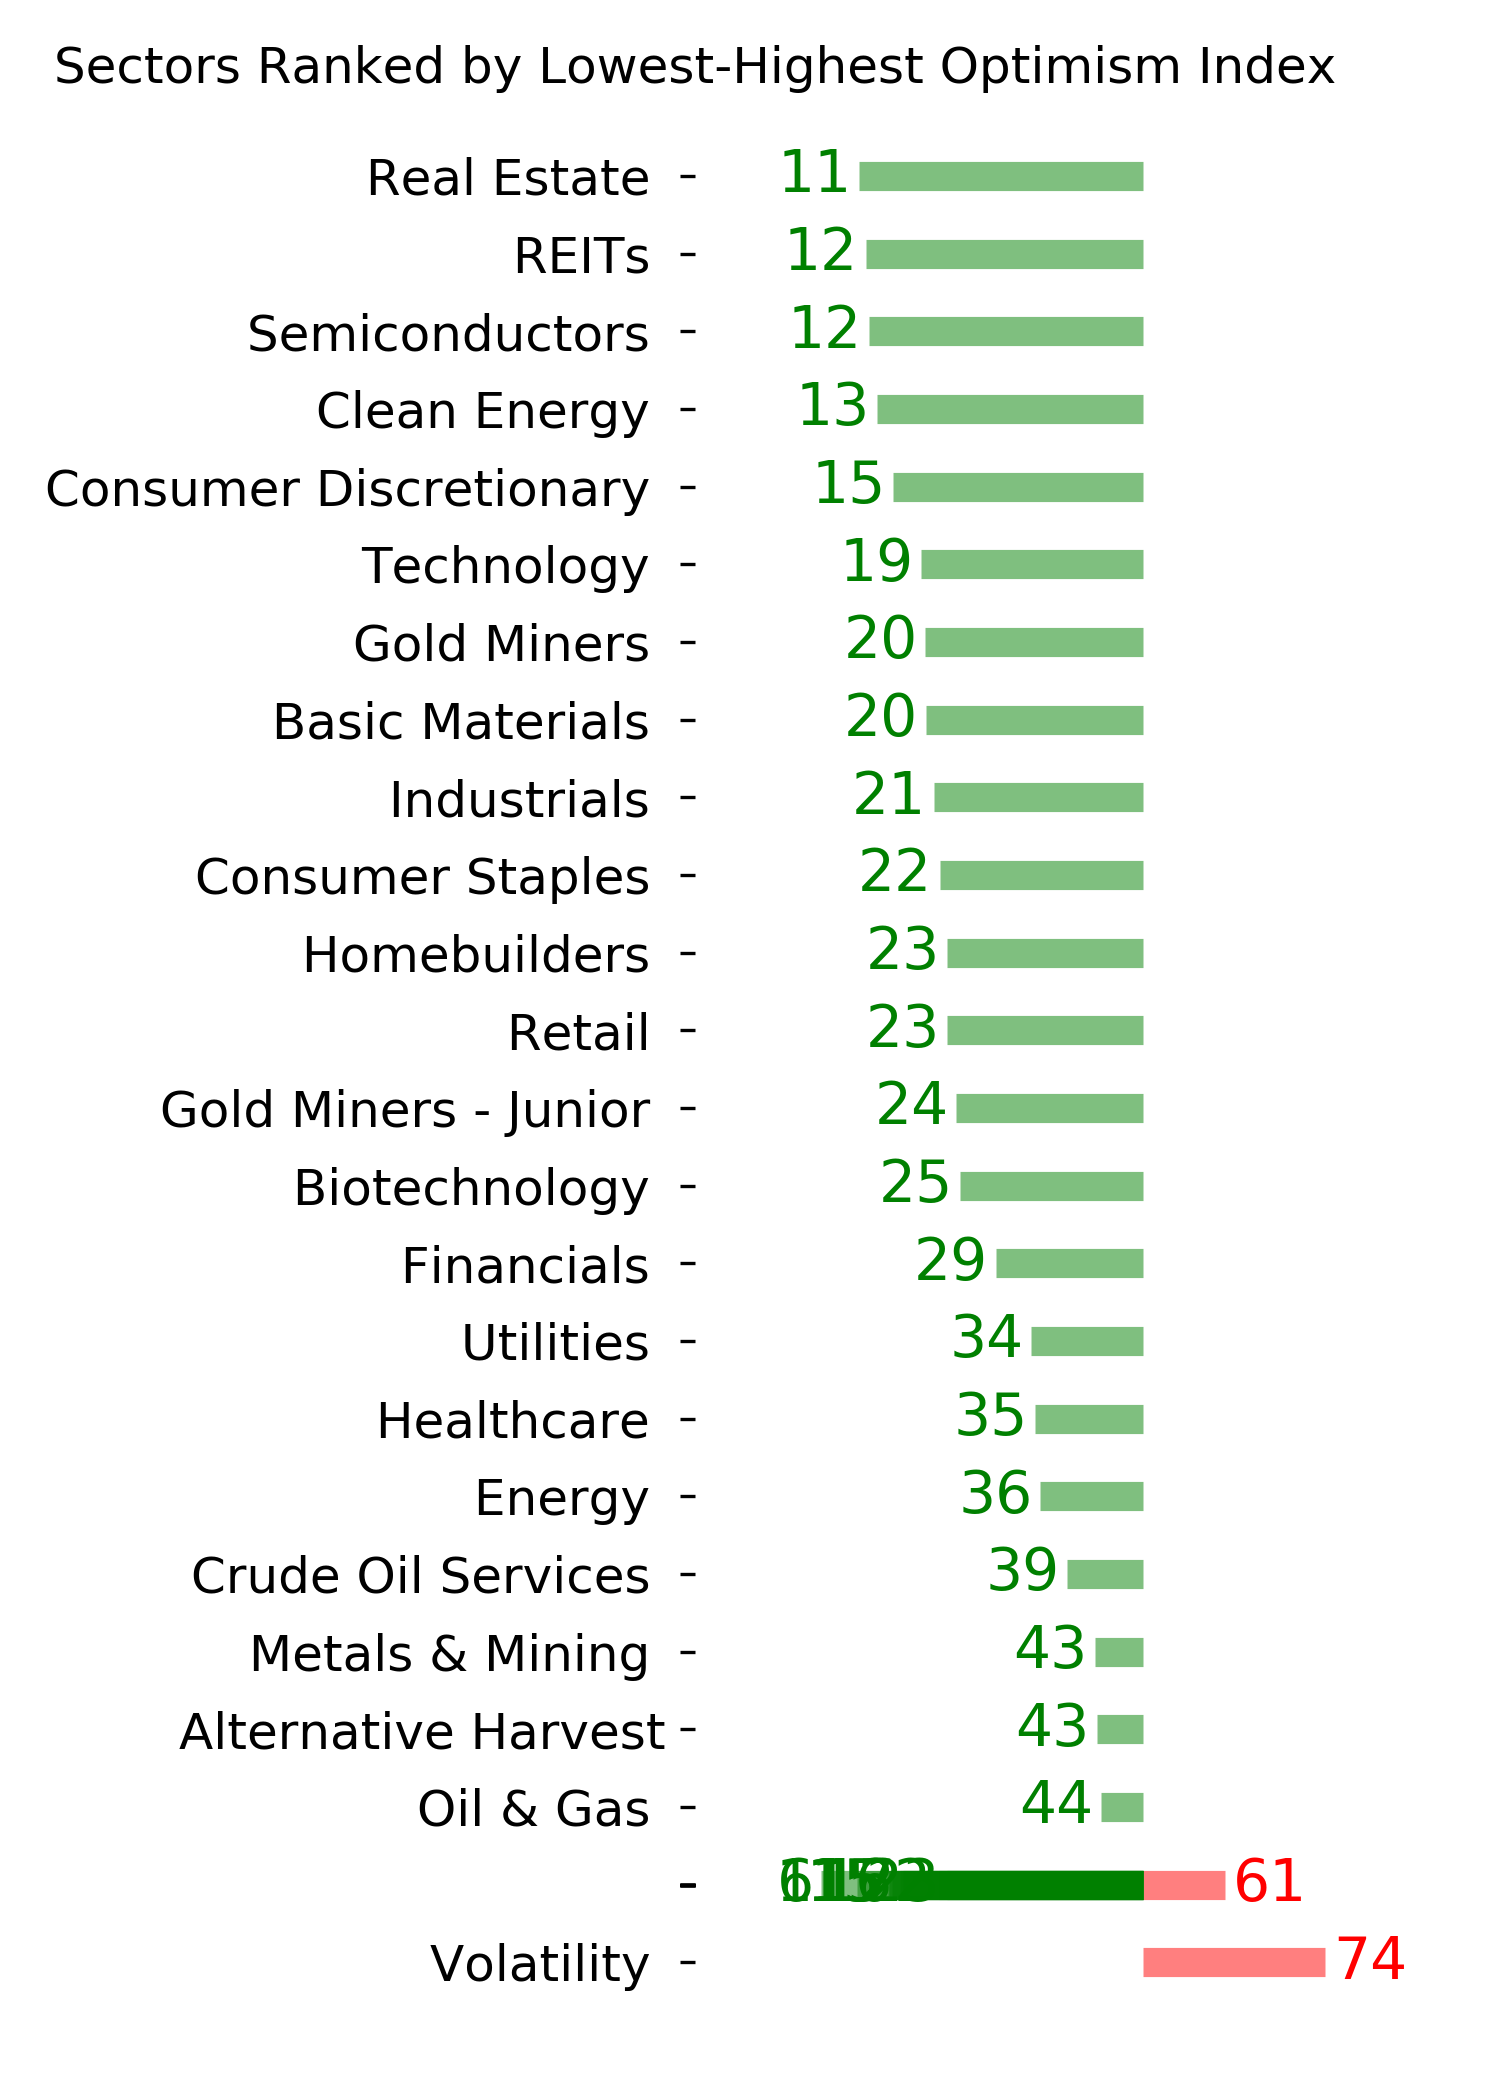
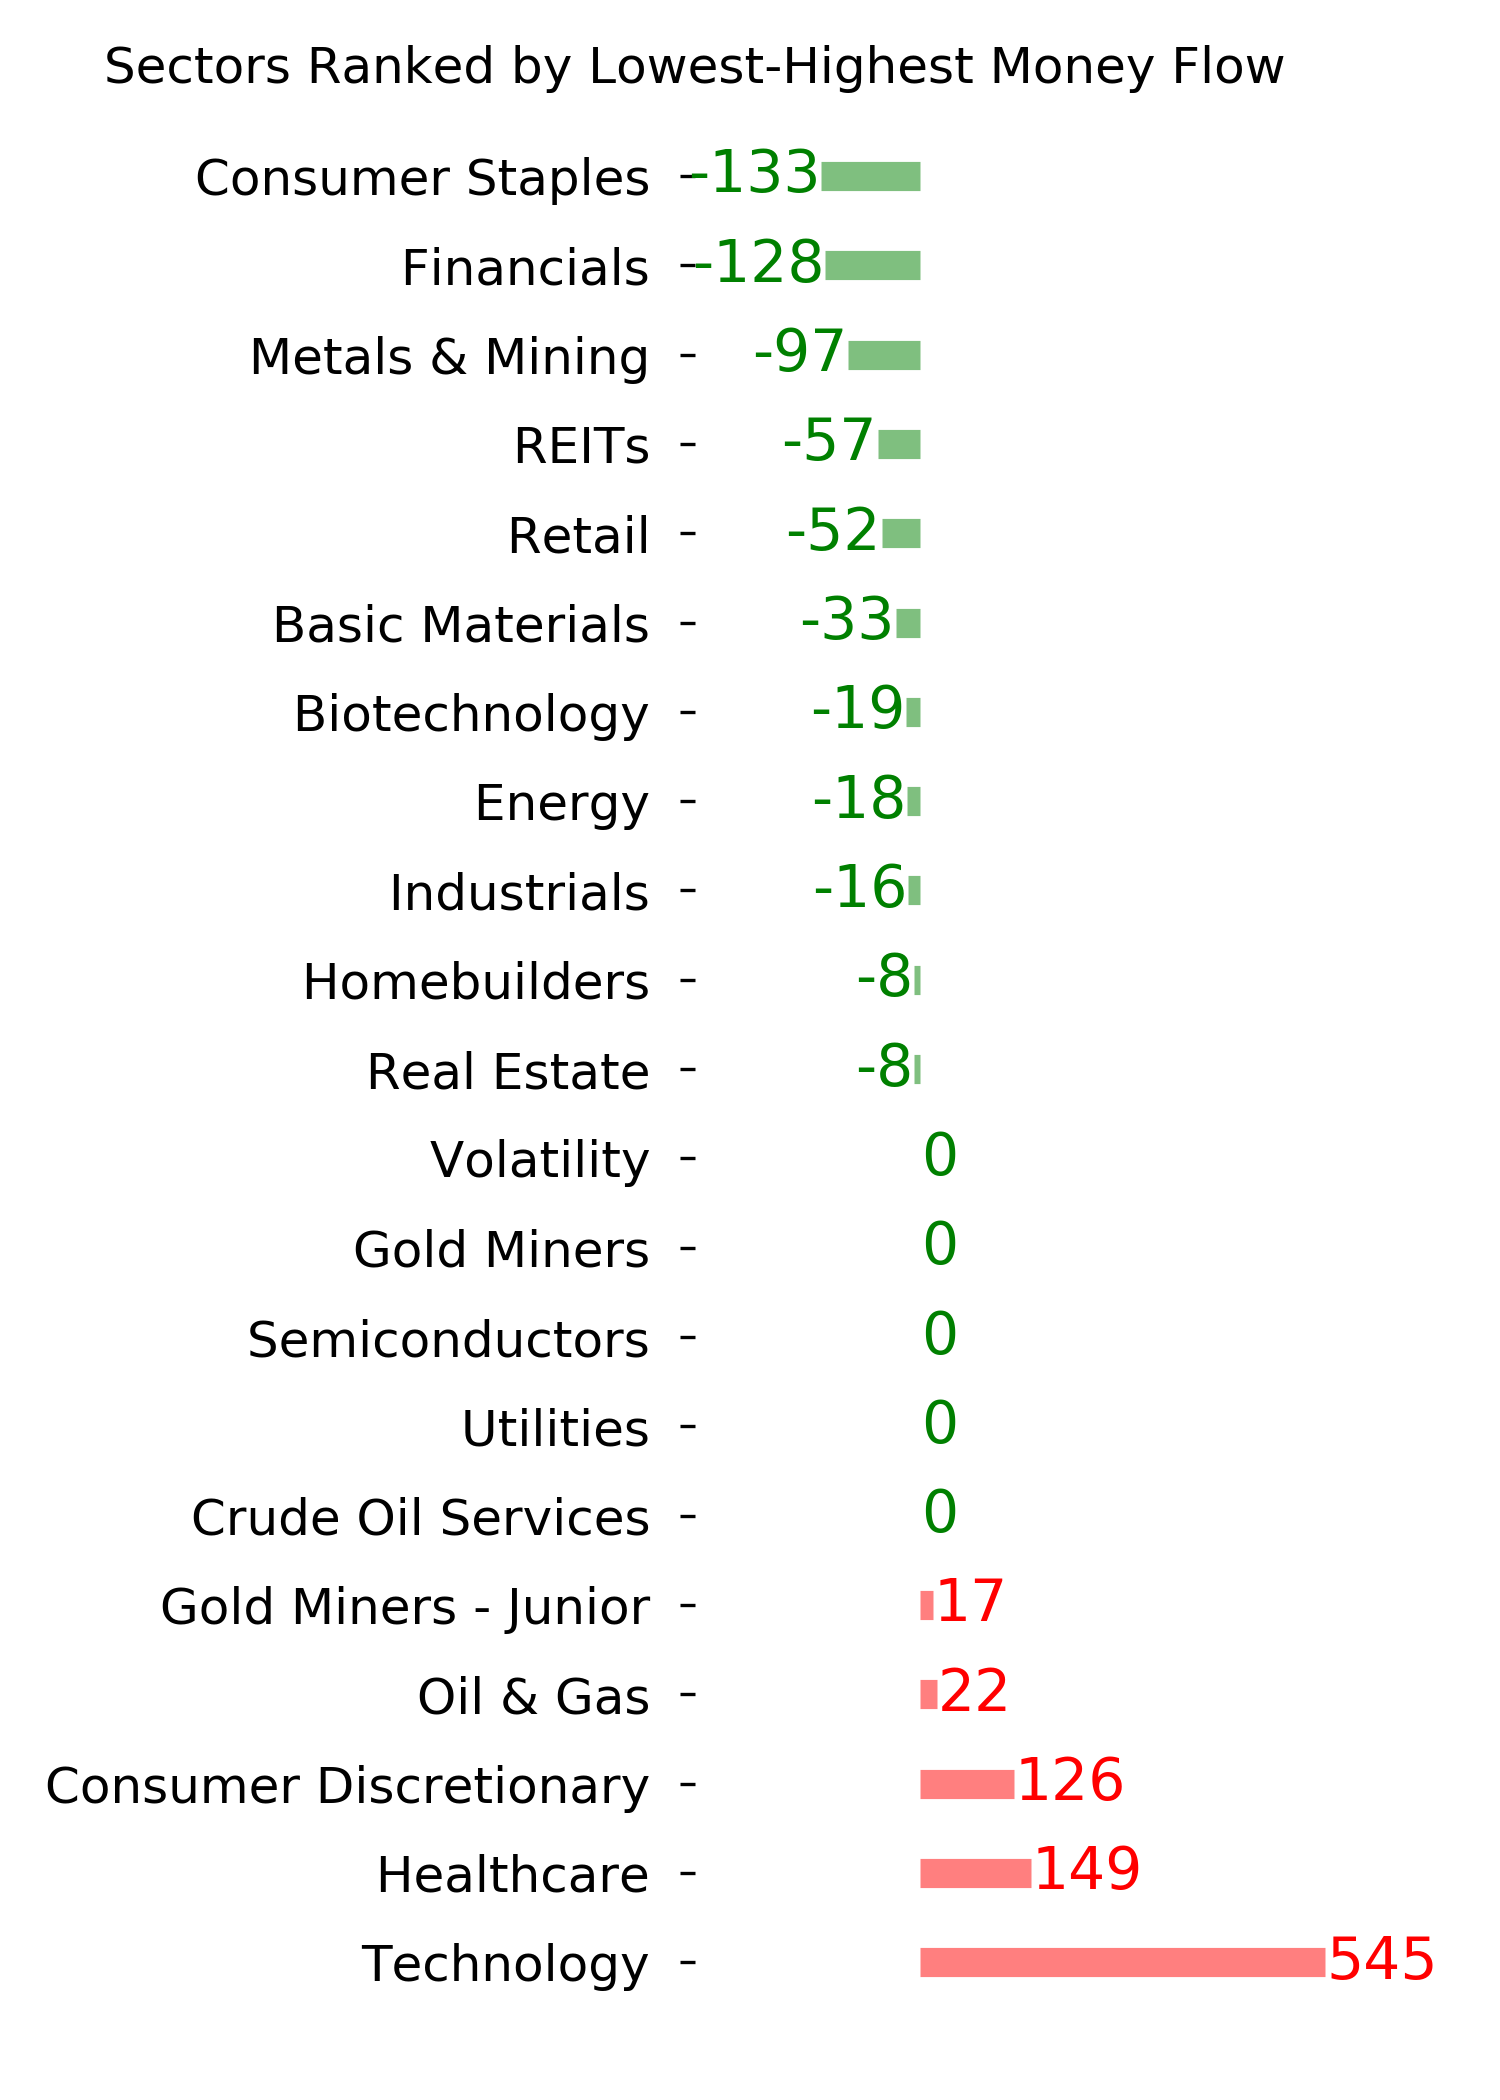
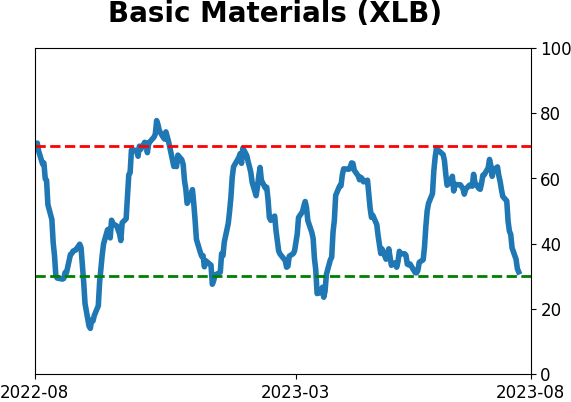
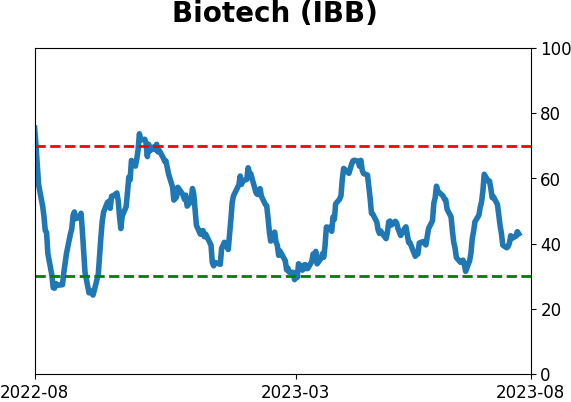
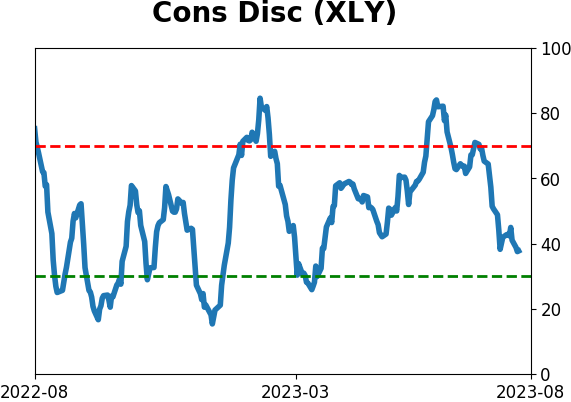
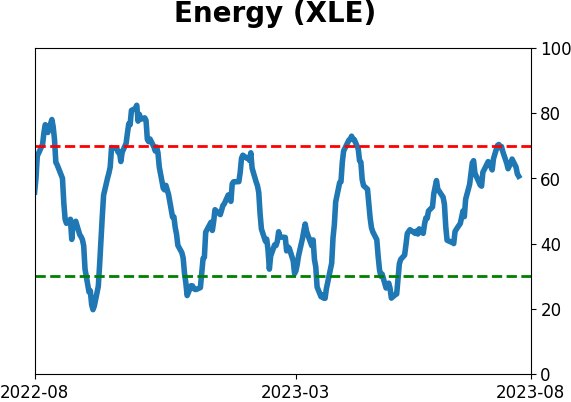
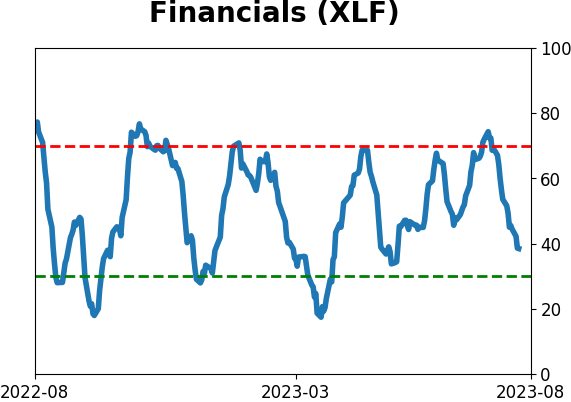
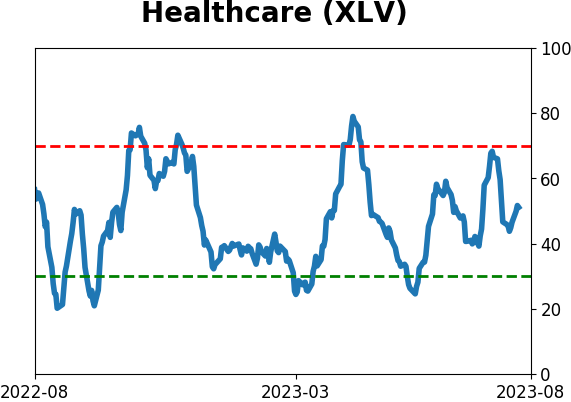
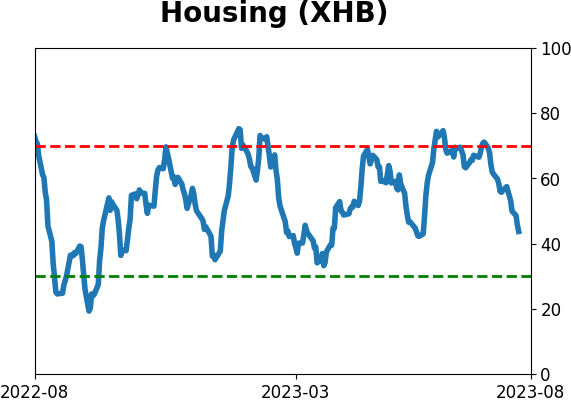
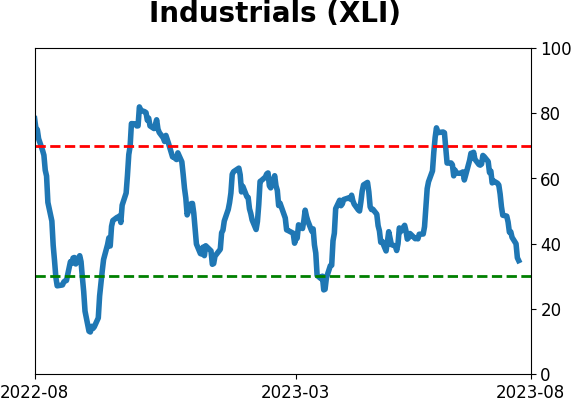
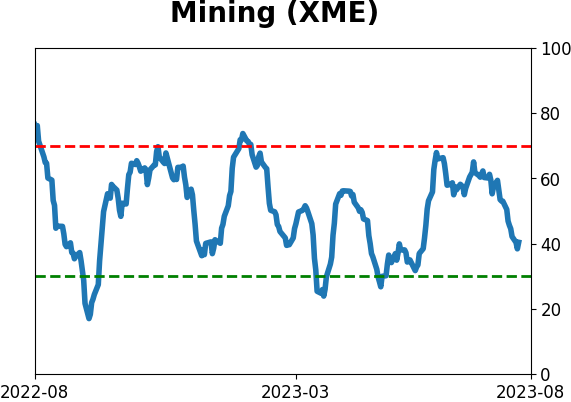
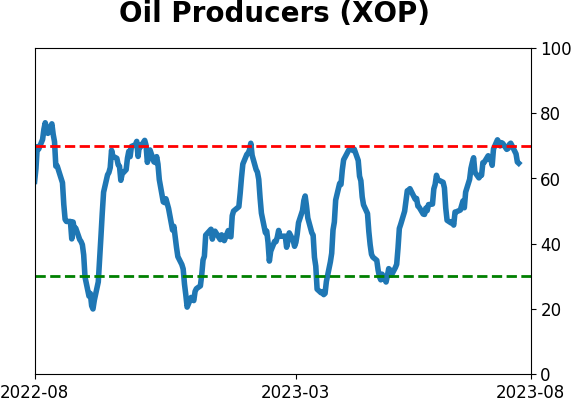
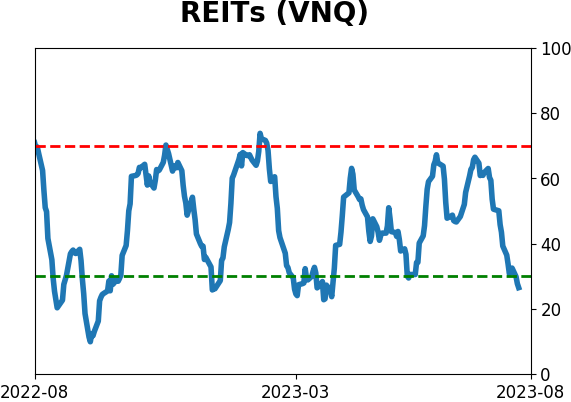
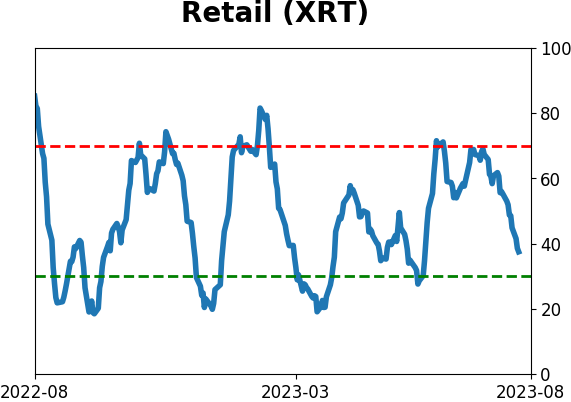
Sector ETF's - 10-Day Moving Average
|
|
|
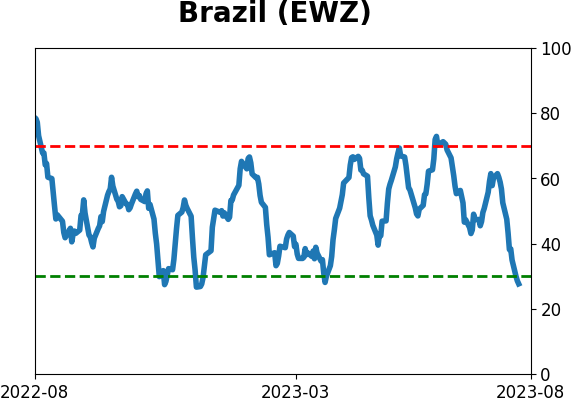
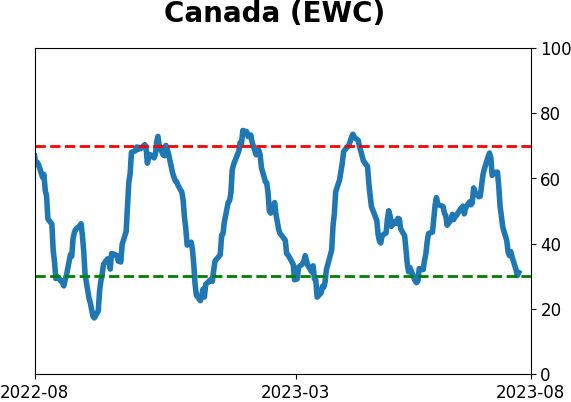
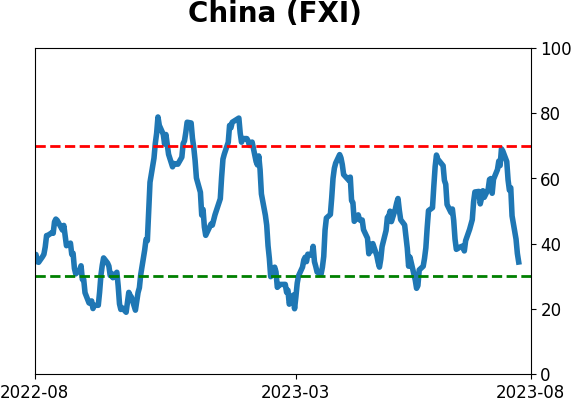
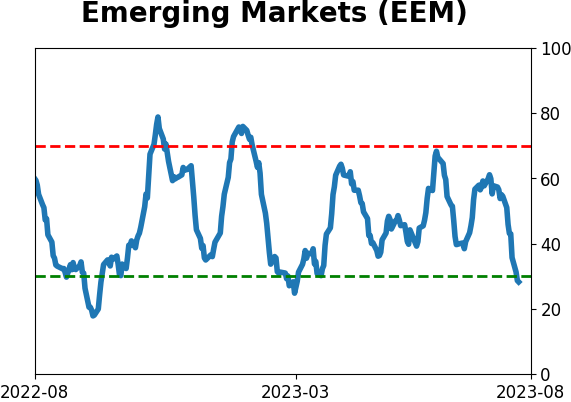
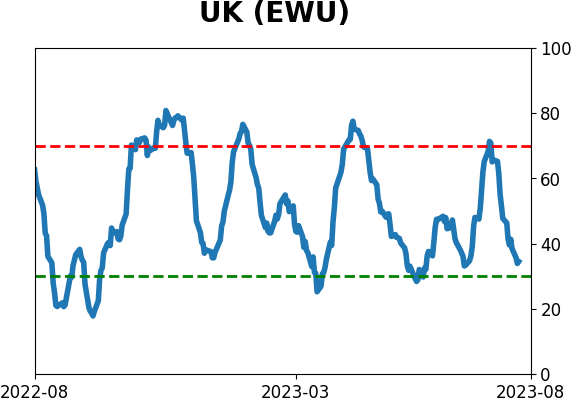
Country ETF's - 10-Day Moving Average
|
|
|
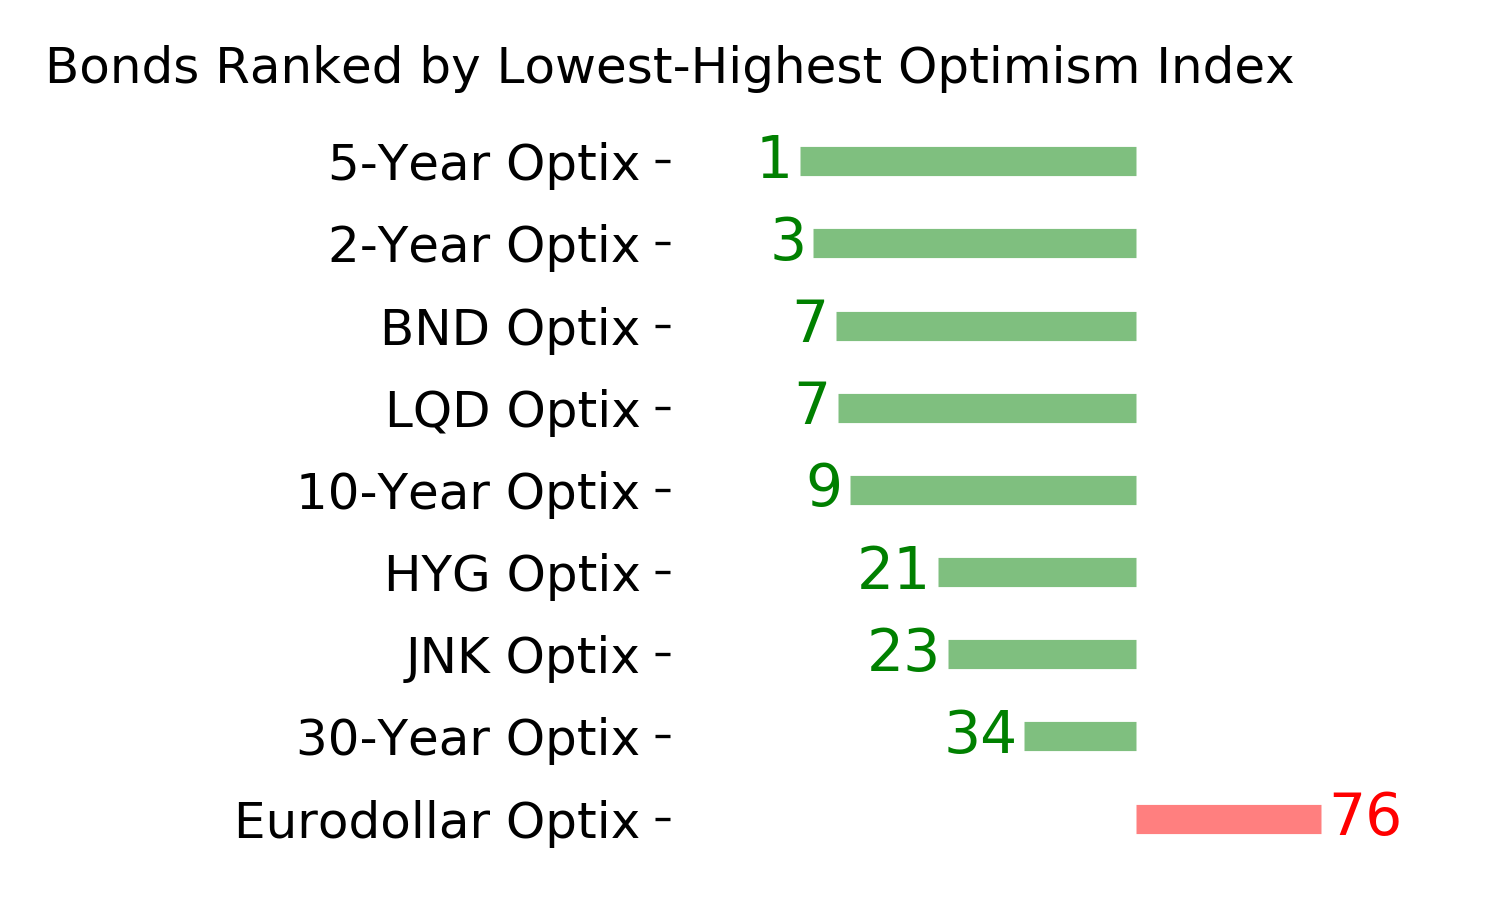
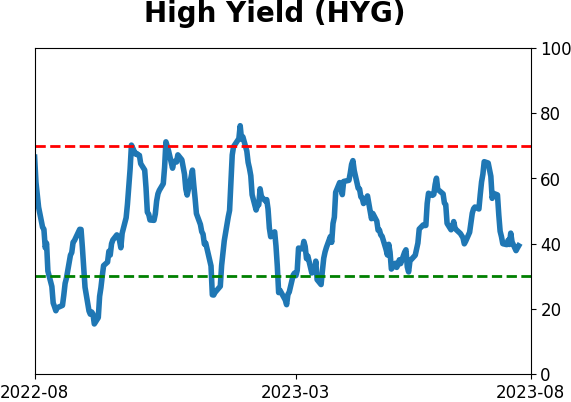
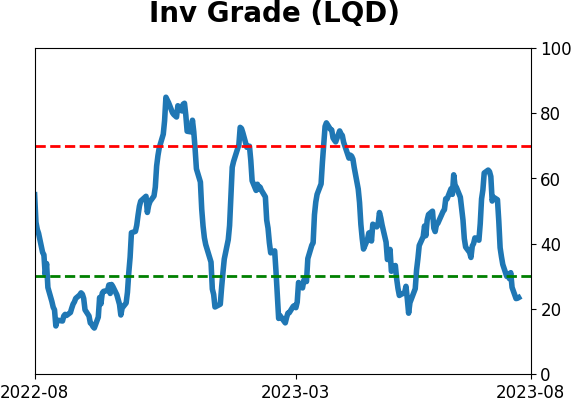
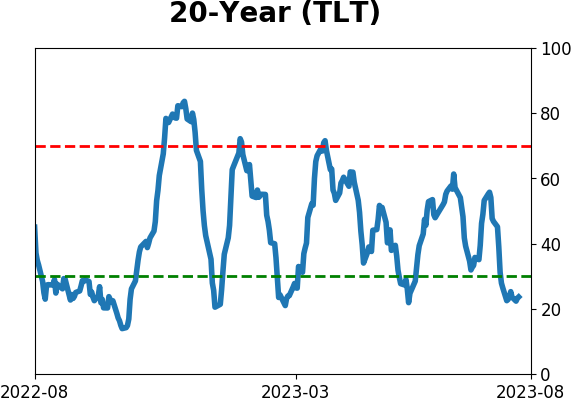
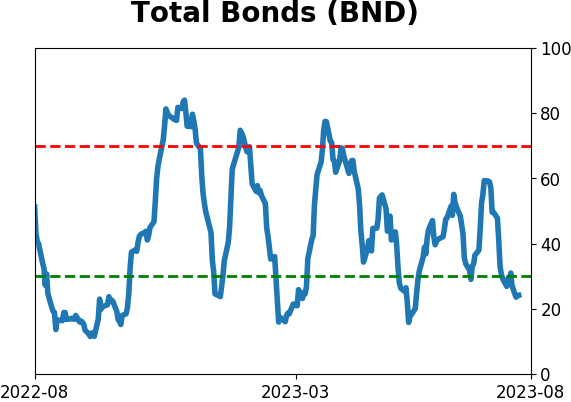
Bond ETF's - 10-Day Moving Average
|
|
|
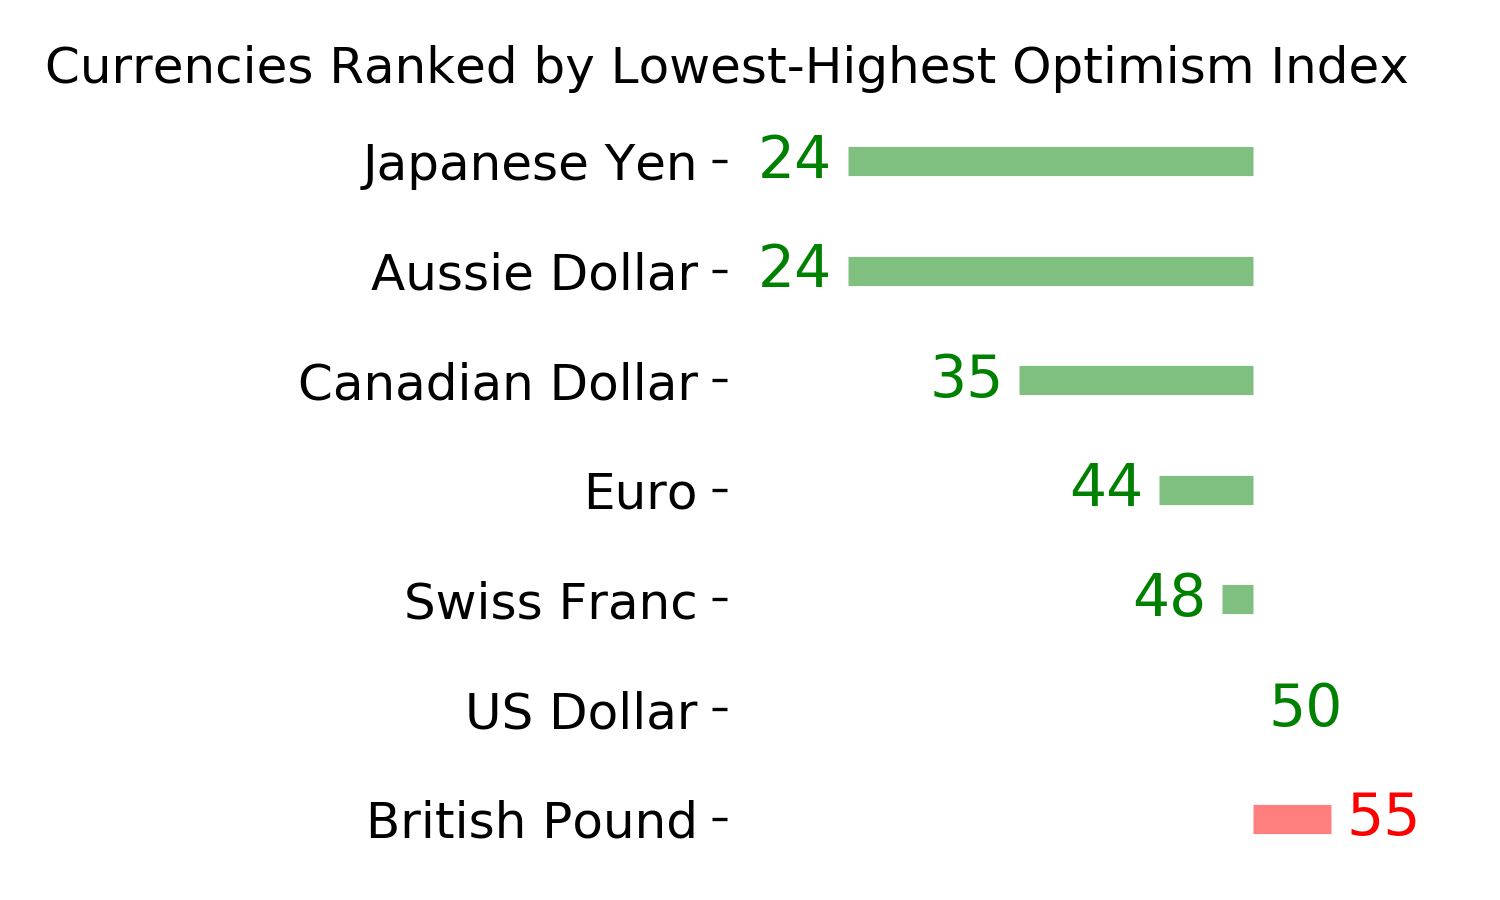
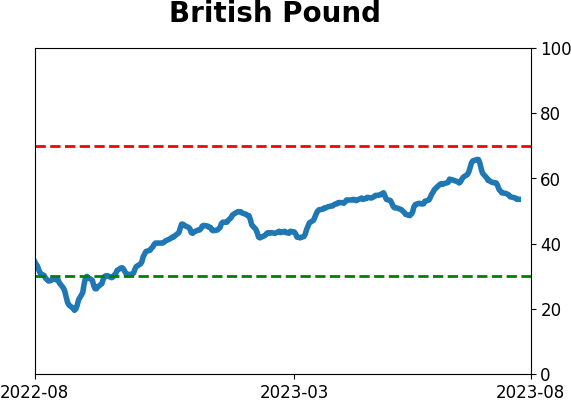
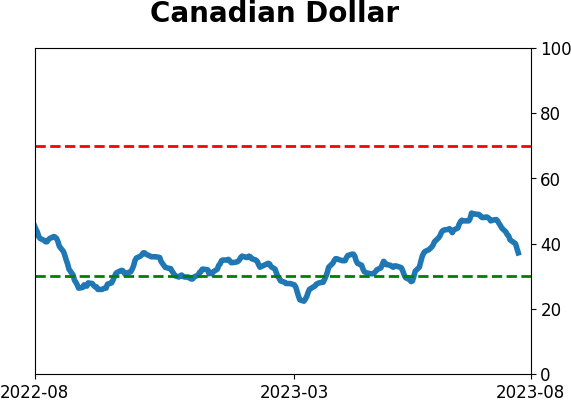
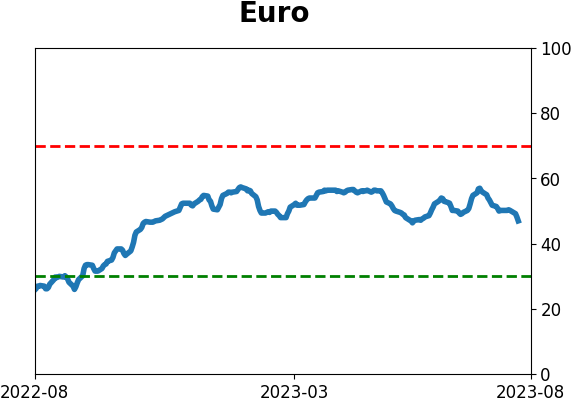
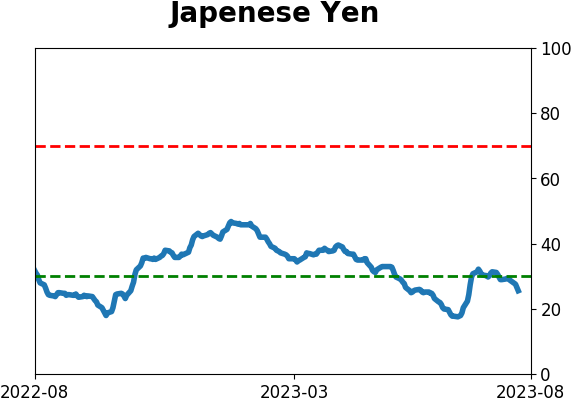
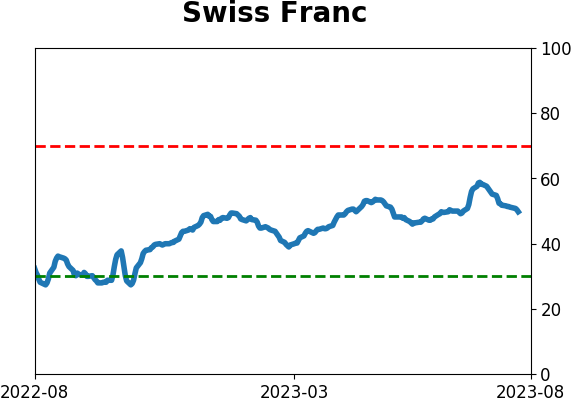
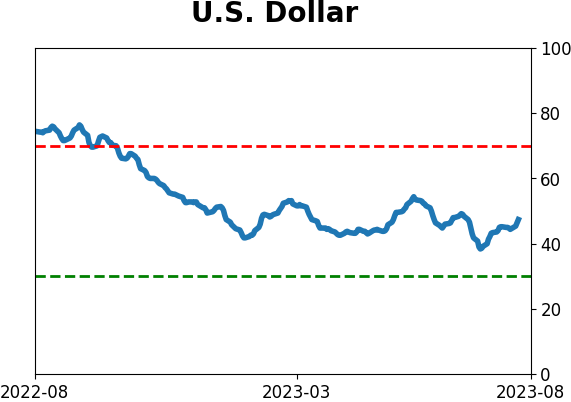
Currency ETF's - 5-Day Moving Average
|
|
|
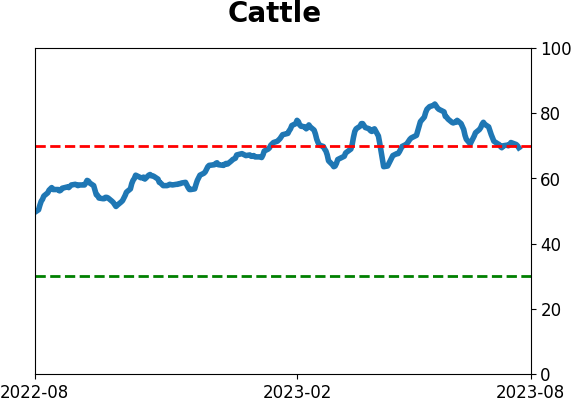
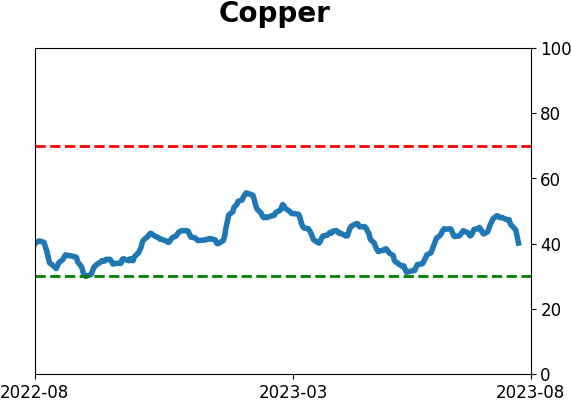
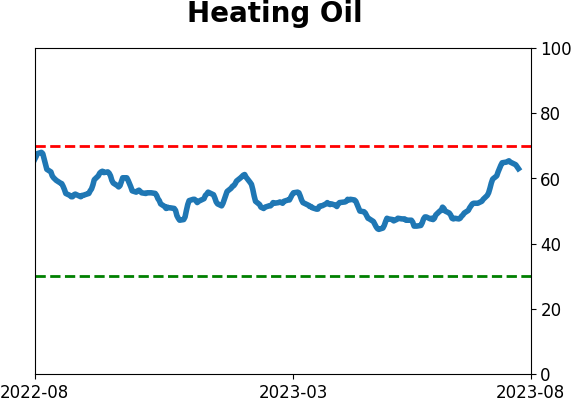
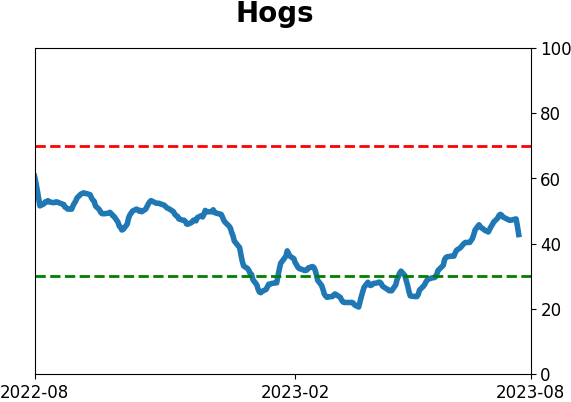
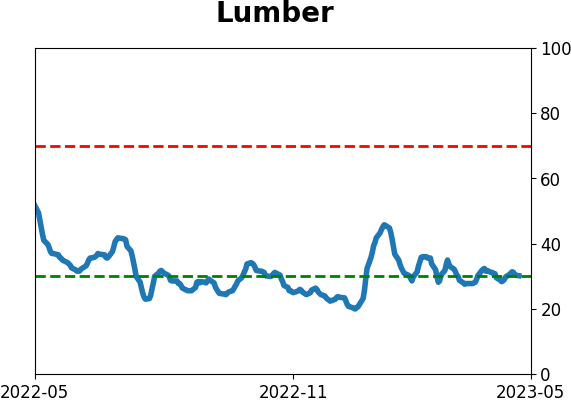
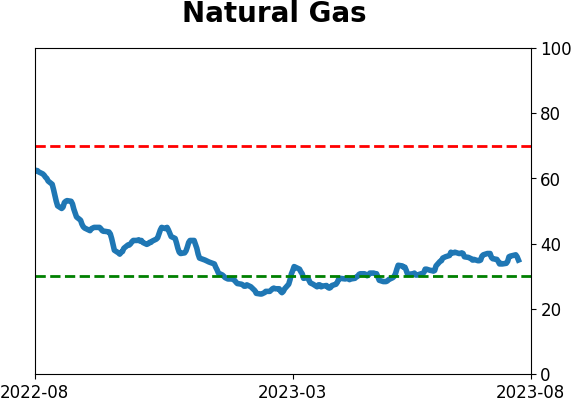
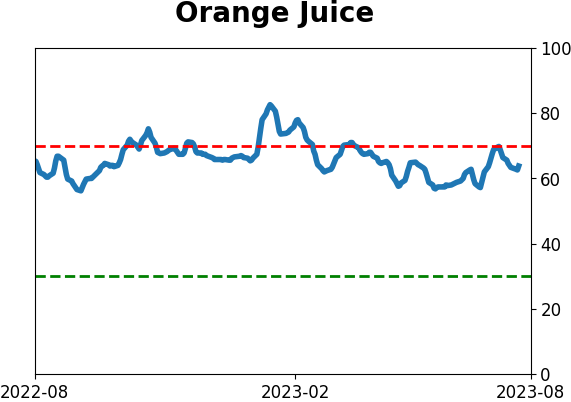
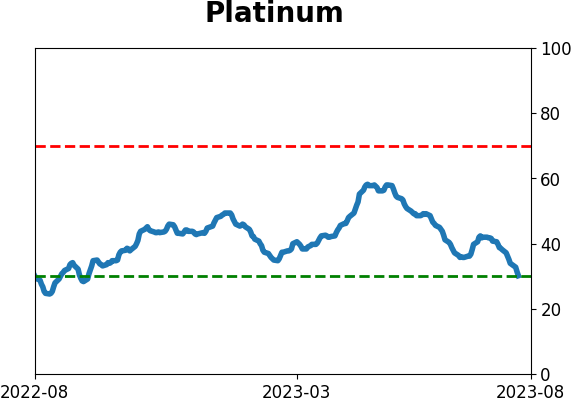
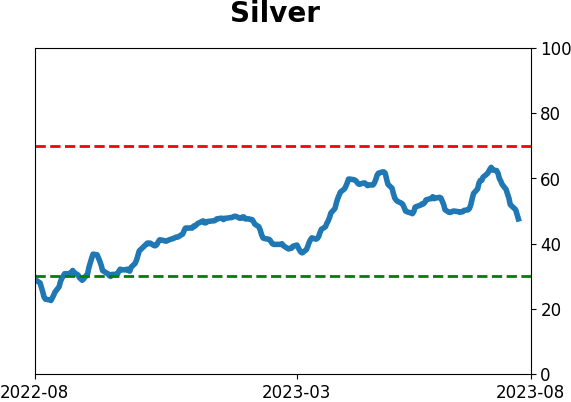
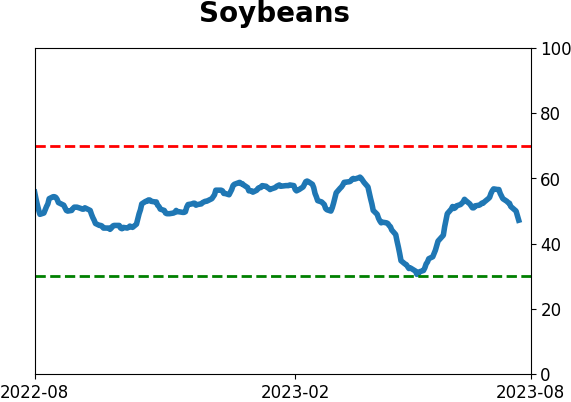
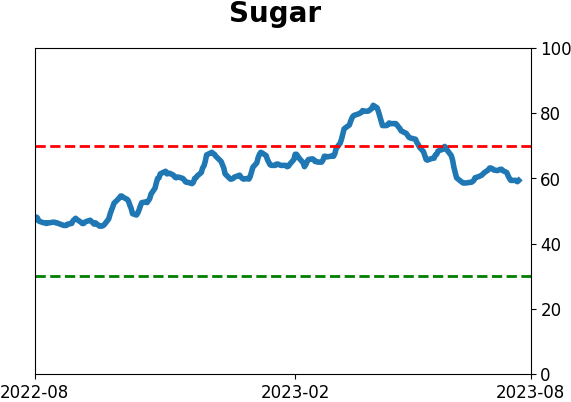
Commodity ETF's - 5-Day Moving Average
|
|