Headlines
|
|
Why tech's slowly-unfolding new bull market is a good thing:
The Nasdaq Composite, and other technology sector indexes, have rallied more than 20% off of their 52-week lows in June. Rallies of 20% that took longer to unfold, like this one, have tended to show better future returns, and lower drawdowns over the next year.
|
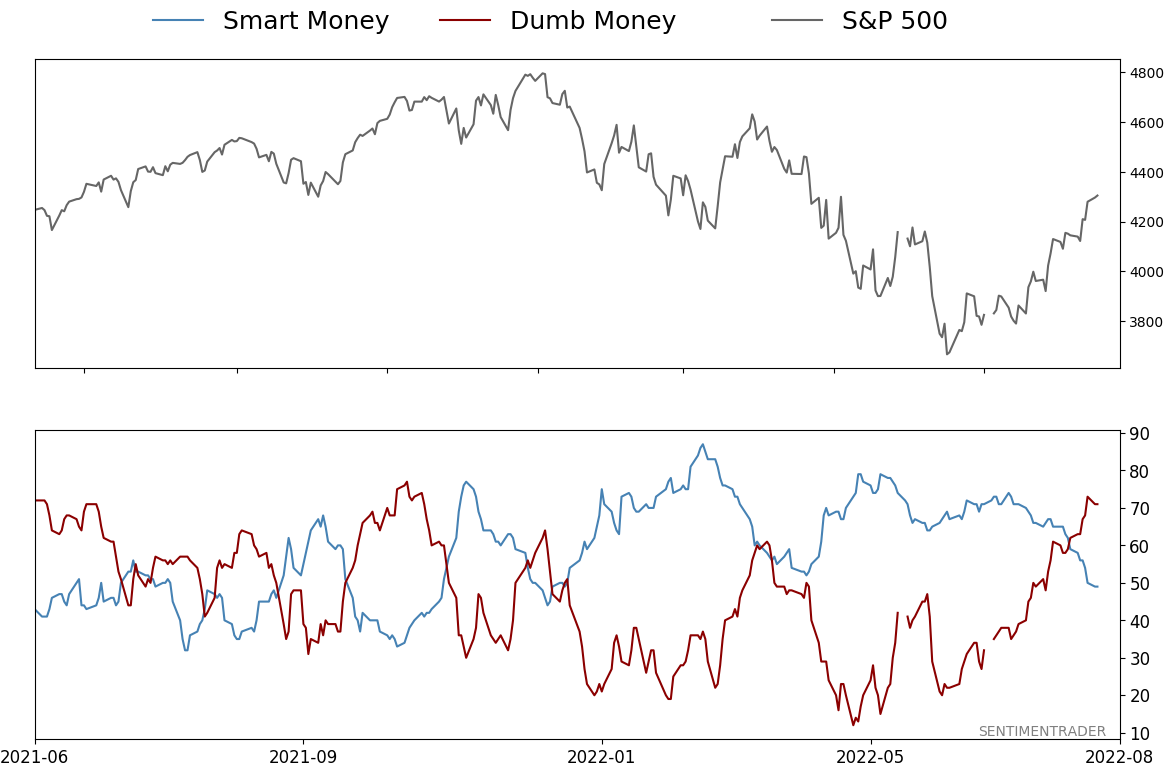
Smart / Dumb Money Confidence
|
Smart Money Confidence: 49%
Dumb Money Confidence: 71%
|
|
Risk Levels
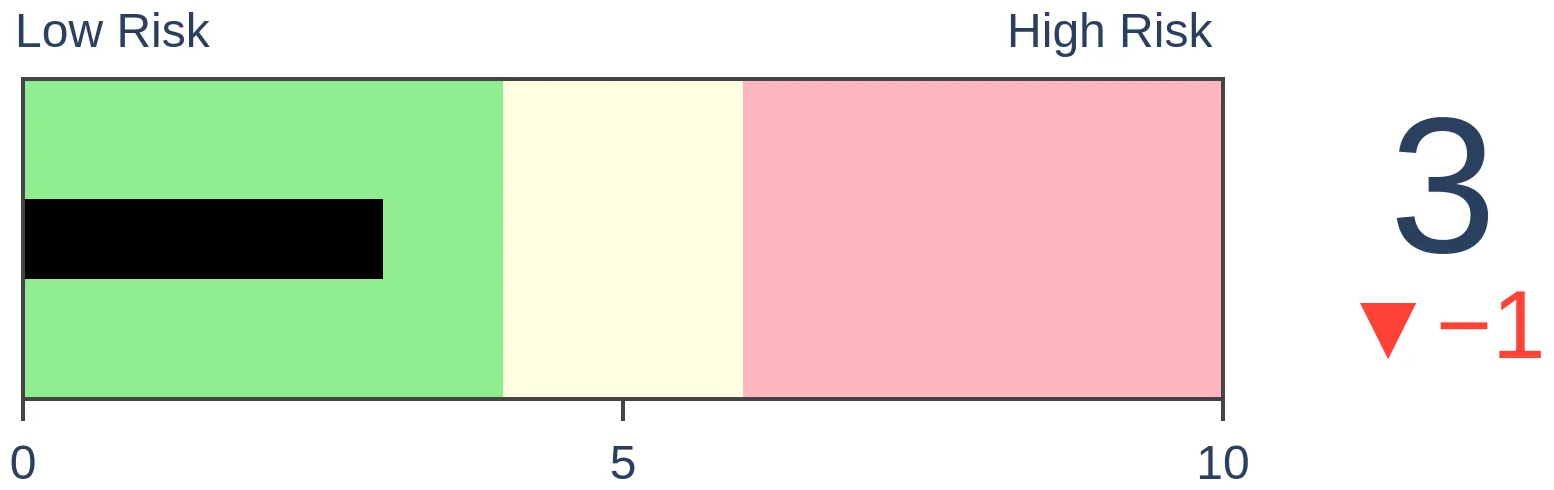
Stocks Short-Term

|
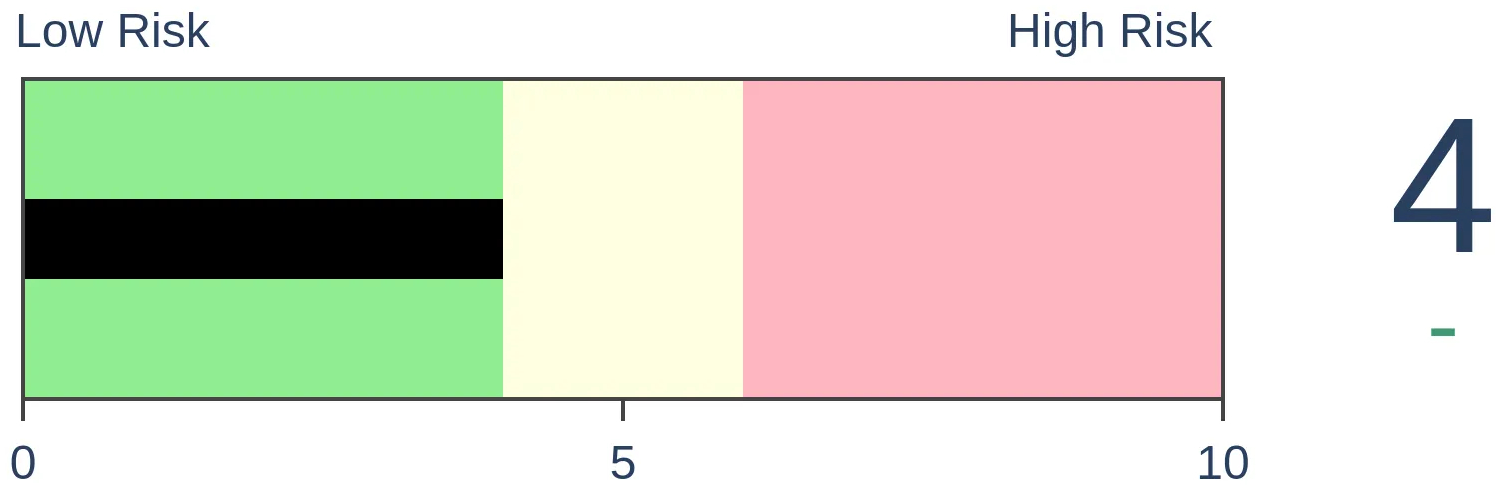
Stocks Medium-Term
|
|
Bonds
|
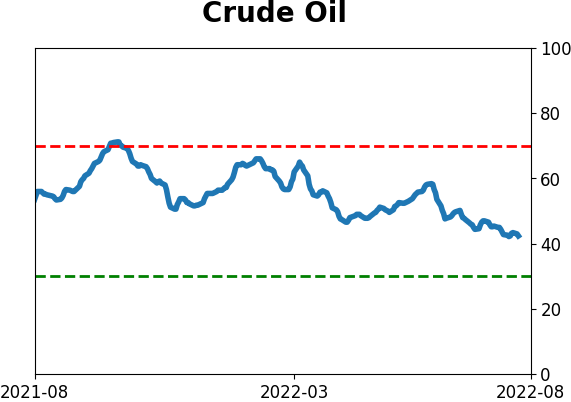
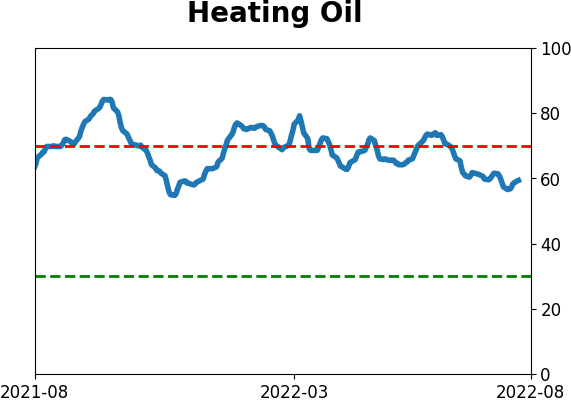
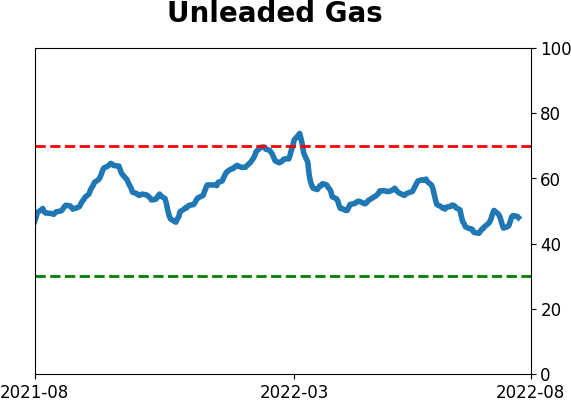
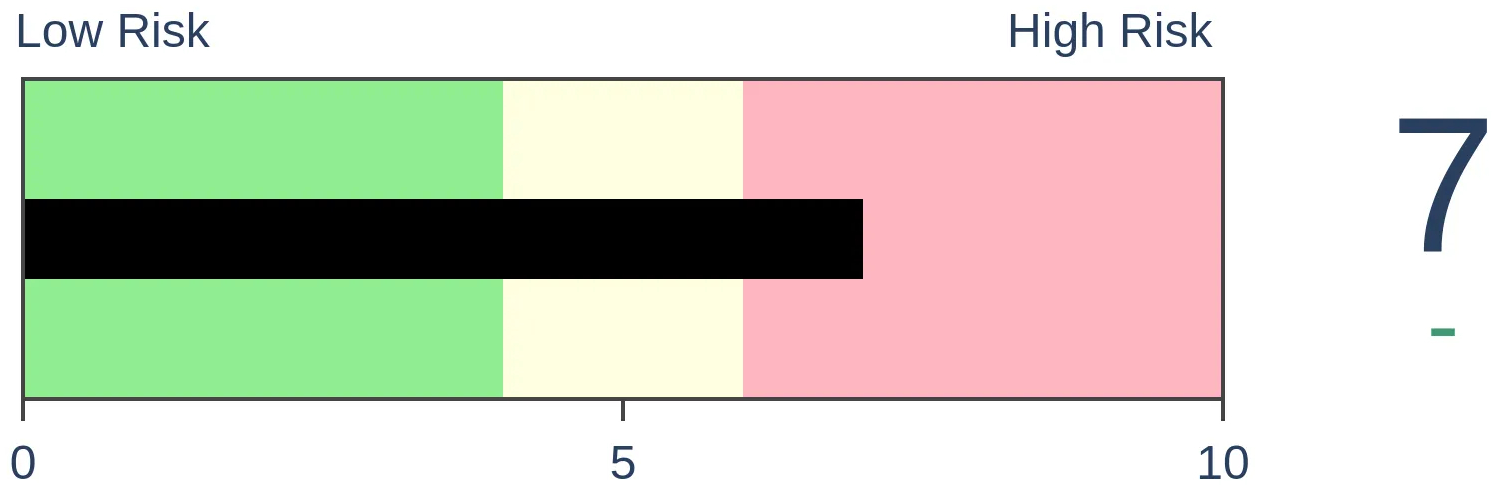
Crude Oil
|
|
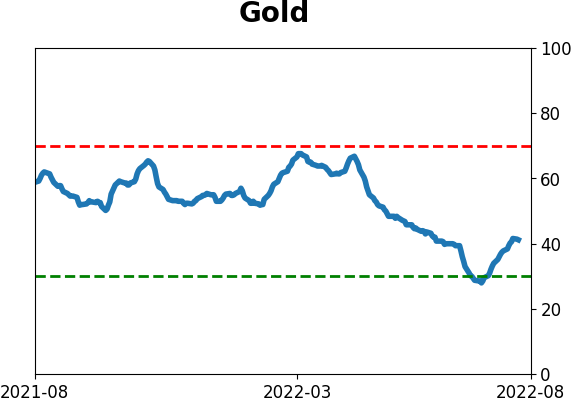
Gold

|
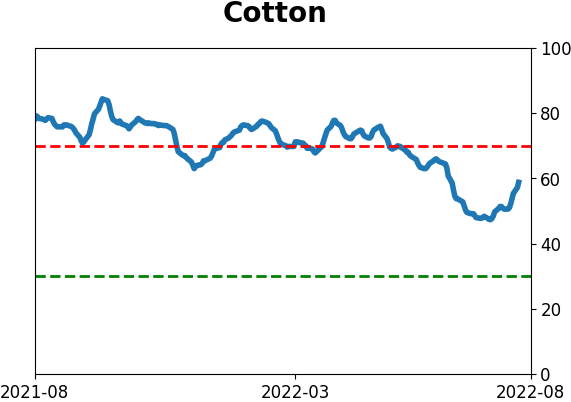
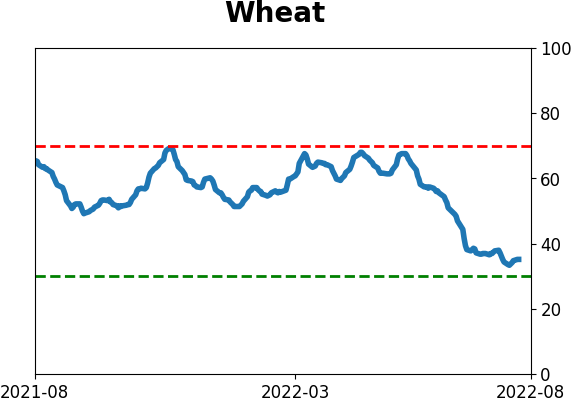
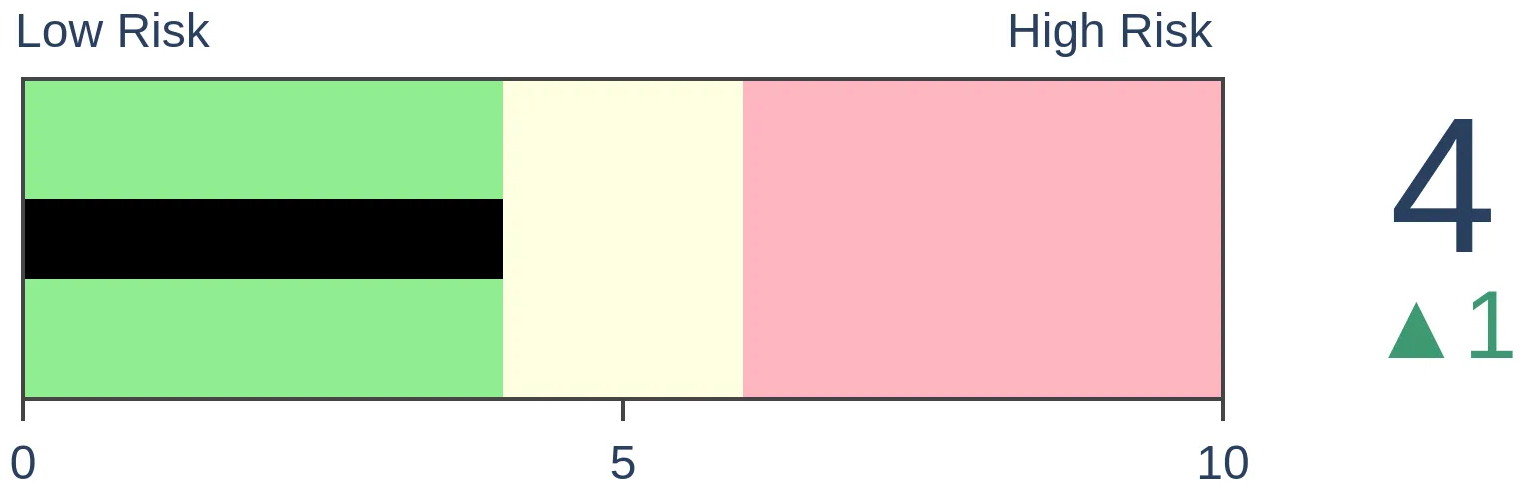
Agriculture
|
|
Research
By Jason Goepfert
BOTTOM LINE
The Nasdaq Composite, and other technology sector indexes, have rallied more than 20% off of their 52-week lows in June. Rallies of 20% that took longer to unfold, like this one, have tended to show better future returns, and lower drawdowns over the next year.
FORECAST / TIMEFRAME
None
|
Key points:
- The tech sector has rallied more than 20% off of its 52-week low
- The rally took nearly 40 days, which is relatively long
- Slower rallies that took at least 30 days to unfold had more staying power and a lower drawdown
Back in a bull
There are compelling reasons to believe this is not just another bear market rally.
On the Nasdaq, a case could be made the bear market is already over. It's pointless to get into silly semantic arguments about whether a 20% decline is a bear market and a 20% rally from a low is a bull market. Let's go with it for convenience and the fact that it is commonly accepted terminology.
So, the Nasdaq is back in a bull market, as are other technology-related indexes. Including dividends, the S&P 500 Information Technology rally popped above 20% last week.
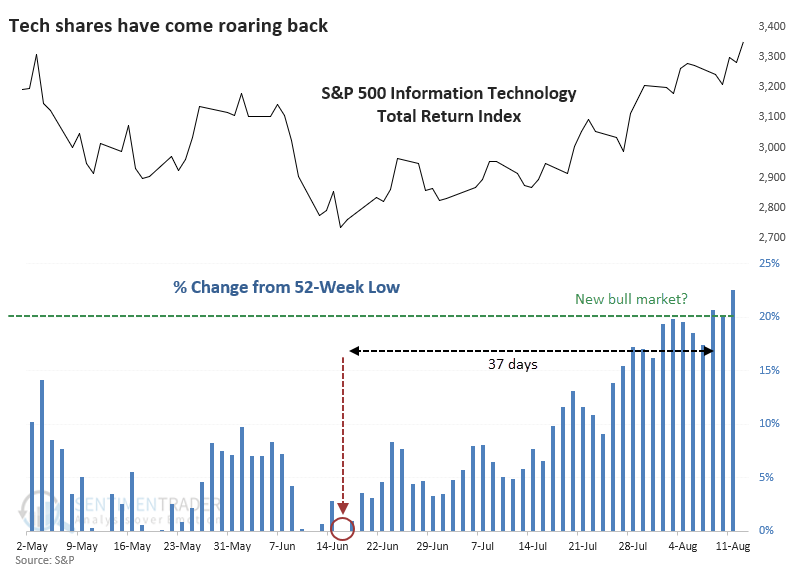
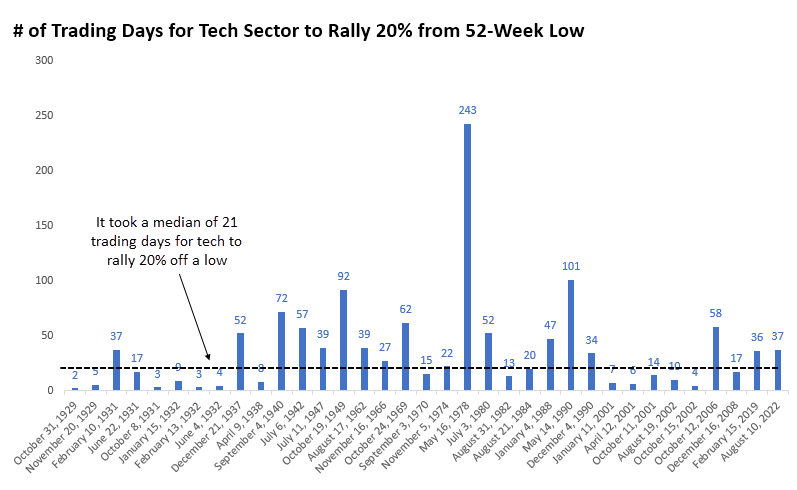
The rally took 37 trading days from the last 52-week low on June 16 until the 20% threshold last week. That seems short, but it's not. Since 1926, the tech sector's total return has enjoyed 34 rallies of 20% off a 52-week low. It took a median of only 21 days for it to accomplish that.
Longer rallies tend to have more staying power
Maybe this is counter-intuitive, but it has been better for the index to enjoy a slower-unfolding rally than a quicker one. The table below shows every 20% rally from a low that took 30 or more trading days to unfold.
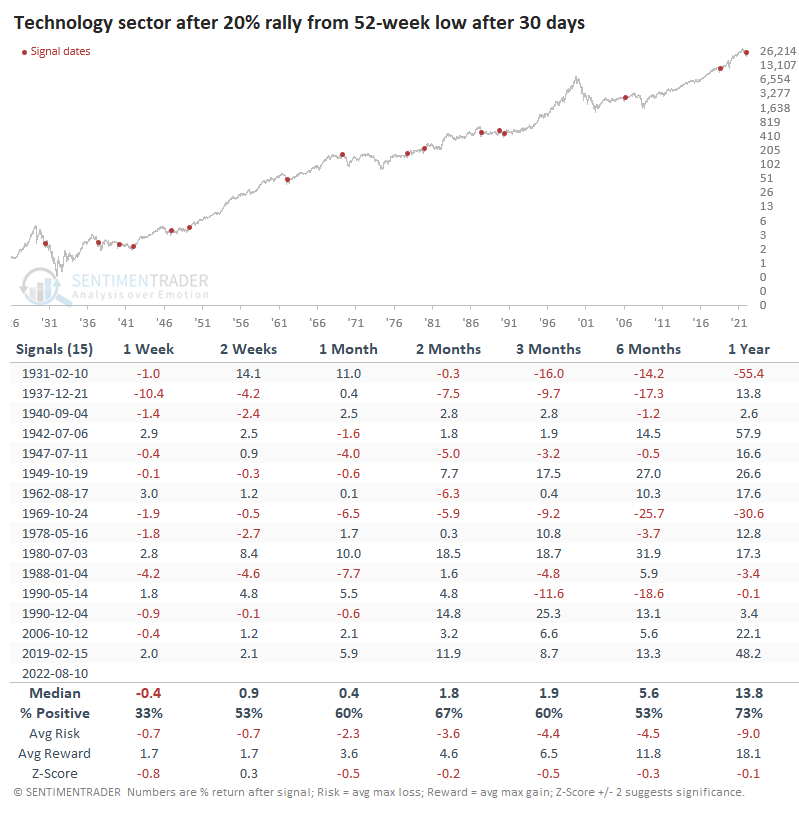
The sector's forward returns were okay. It rallied most of the time, but its median returns were below random, and the risk/reward skew was unimpressive.
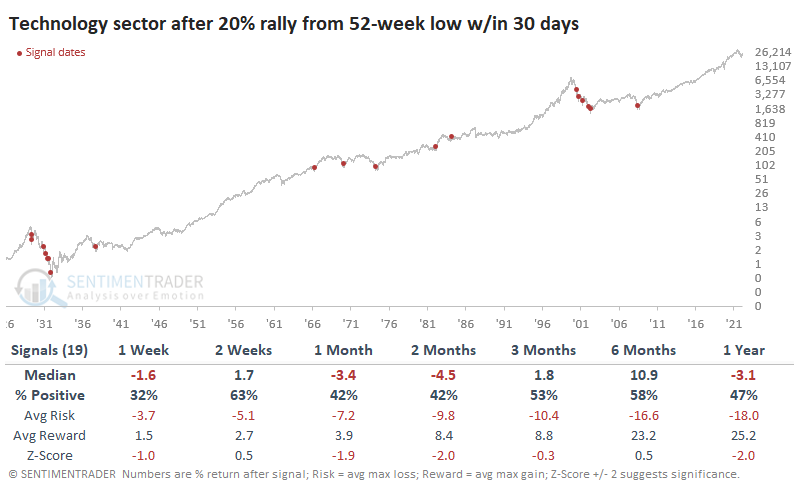
But they're better than quicker rallies. When rallies took fewer than 30 days to jump 20%, the sector's future returns were significantly weaker across most time frames.
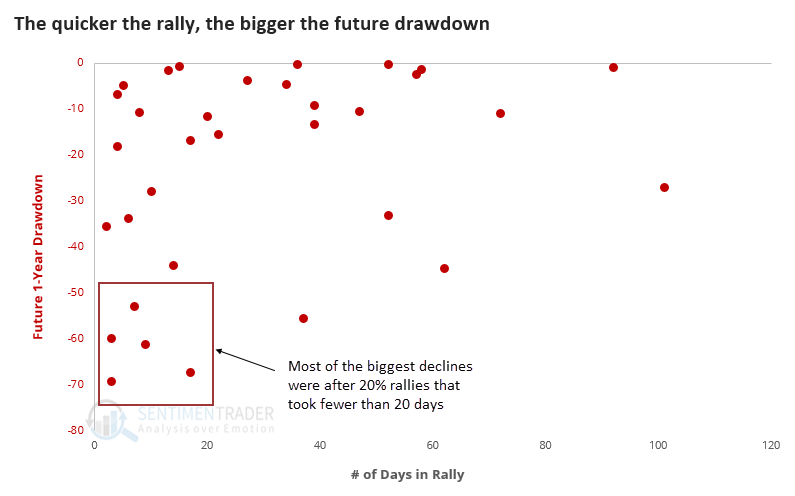
What sticks out the most is risk. There was a correlation between how long it took tech to rally 20% off a low and how much of a drawdown the stocks suffered within the following year; the quicker the rally, the bigger the future drawdown. This refers to the cliché that bear market rallies are quick and vicious.
After slower rallies, 8 out of 15 showed a drawdown larger than -5% within the following year. After quicker rallies, 15 out of 19 showed a drawdown larger than -5%, and the median drawdown was twice as large.
What the research tells us...
Many Wall Street tropes have a tiny grain of truth in them if any at all. Most are just old heuristics that either no longer apply or have the sole purpose of generating revenue for the Street. In the case of vicious bear market rallies, there is more truth than most. When we see a massive rally that unfolds over only a handful of sessions, the probability is high that it's just an actual short-covering exercise and is bound to fail. Not always, but usually.
When it takes longer, there is a higher probability that other factors and more patient investors are driving it. That's what we've seen with this one, and it's a decent sign for the rally's health.
Indicators at Extremes
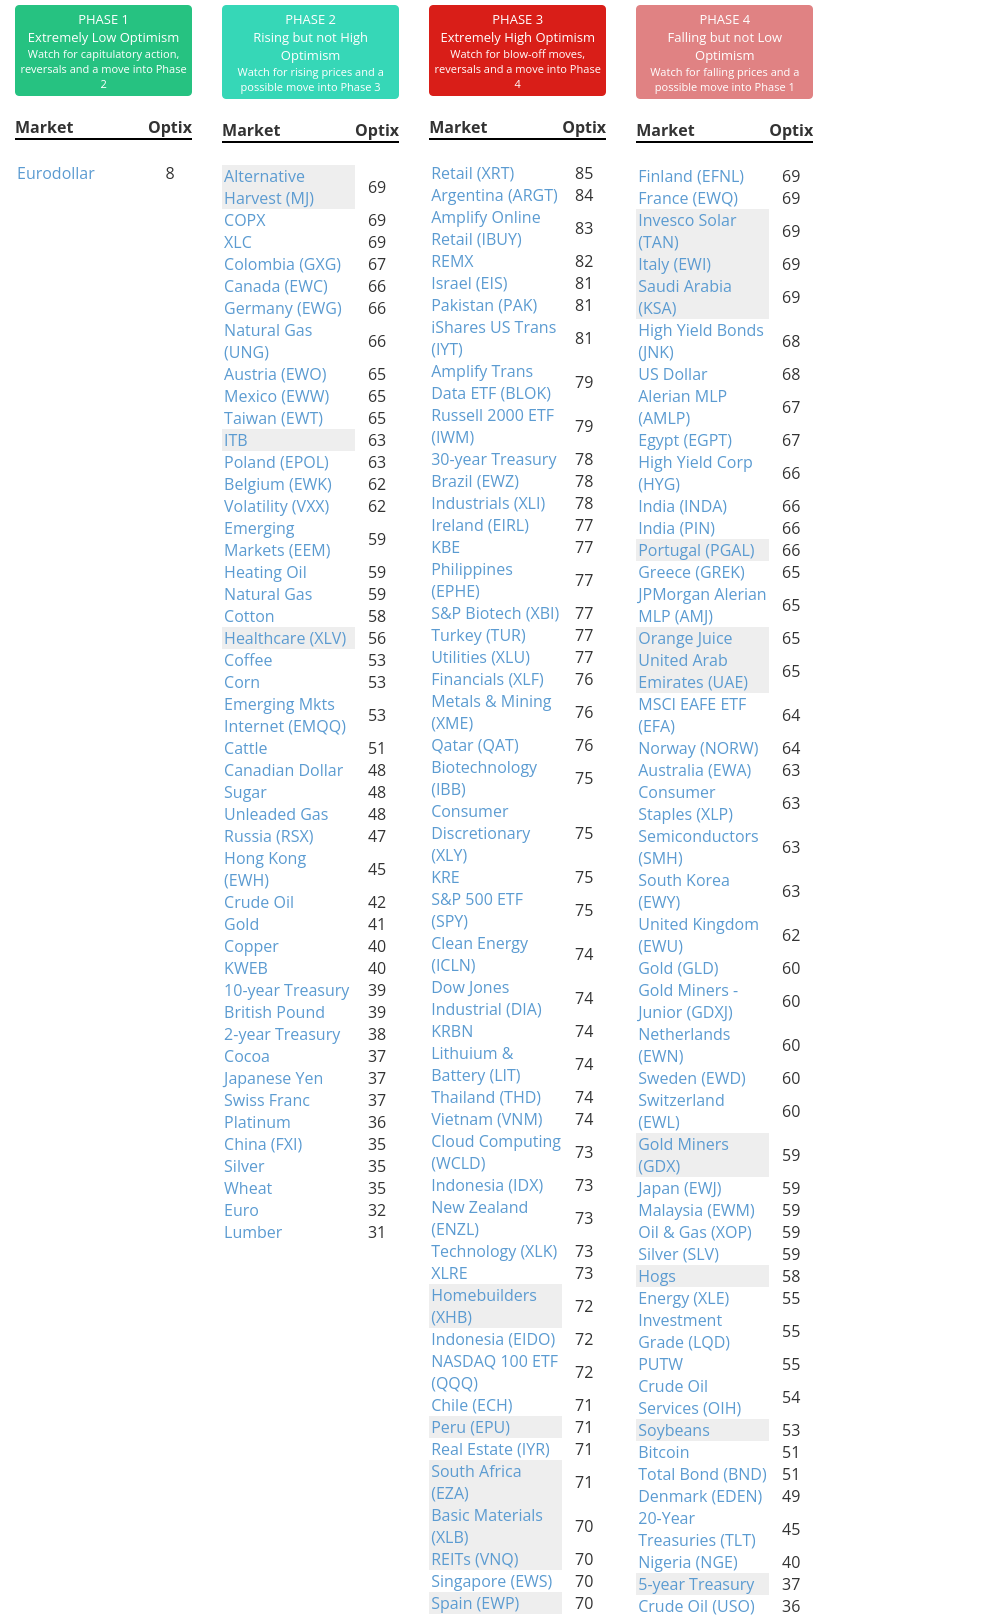
Phase Table
Ranks
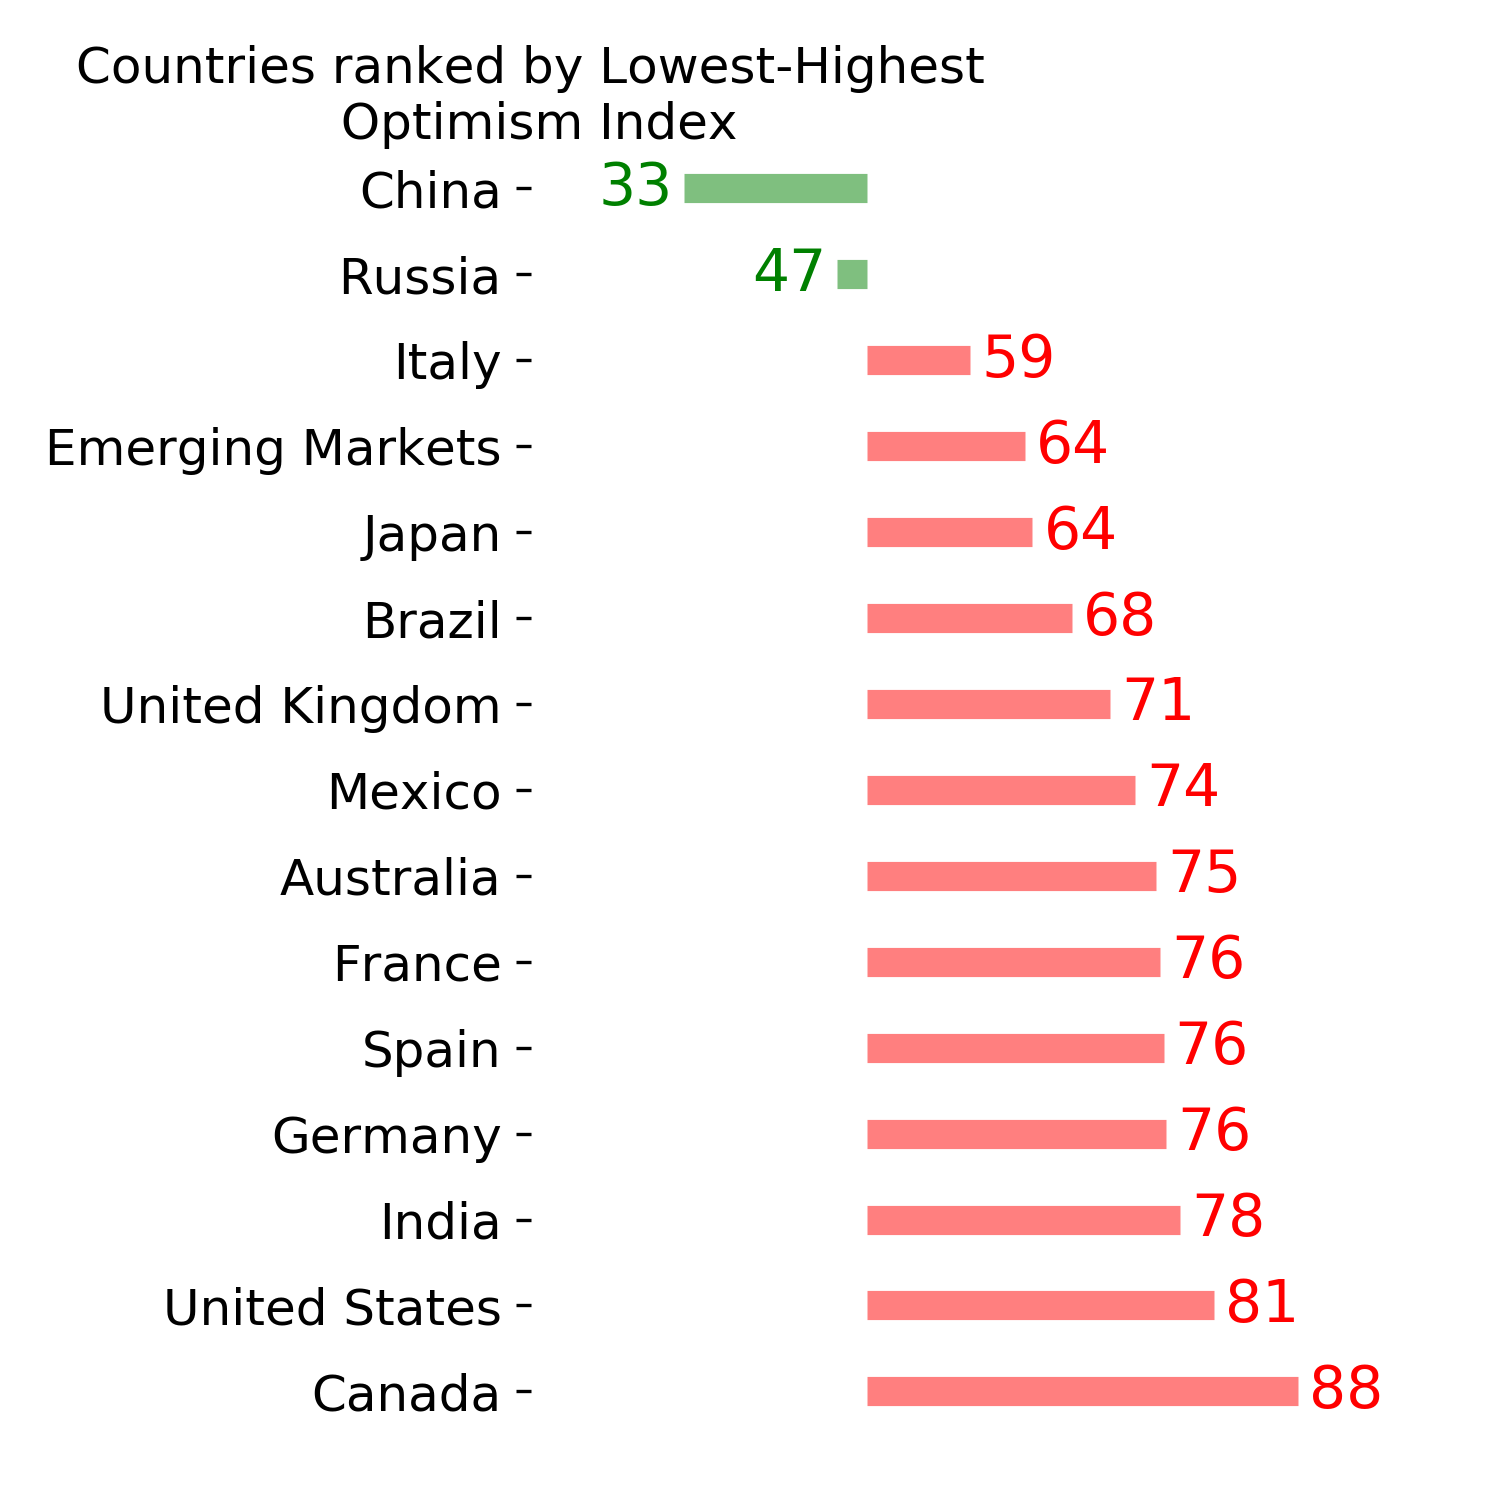
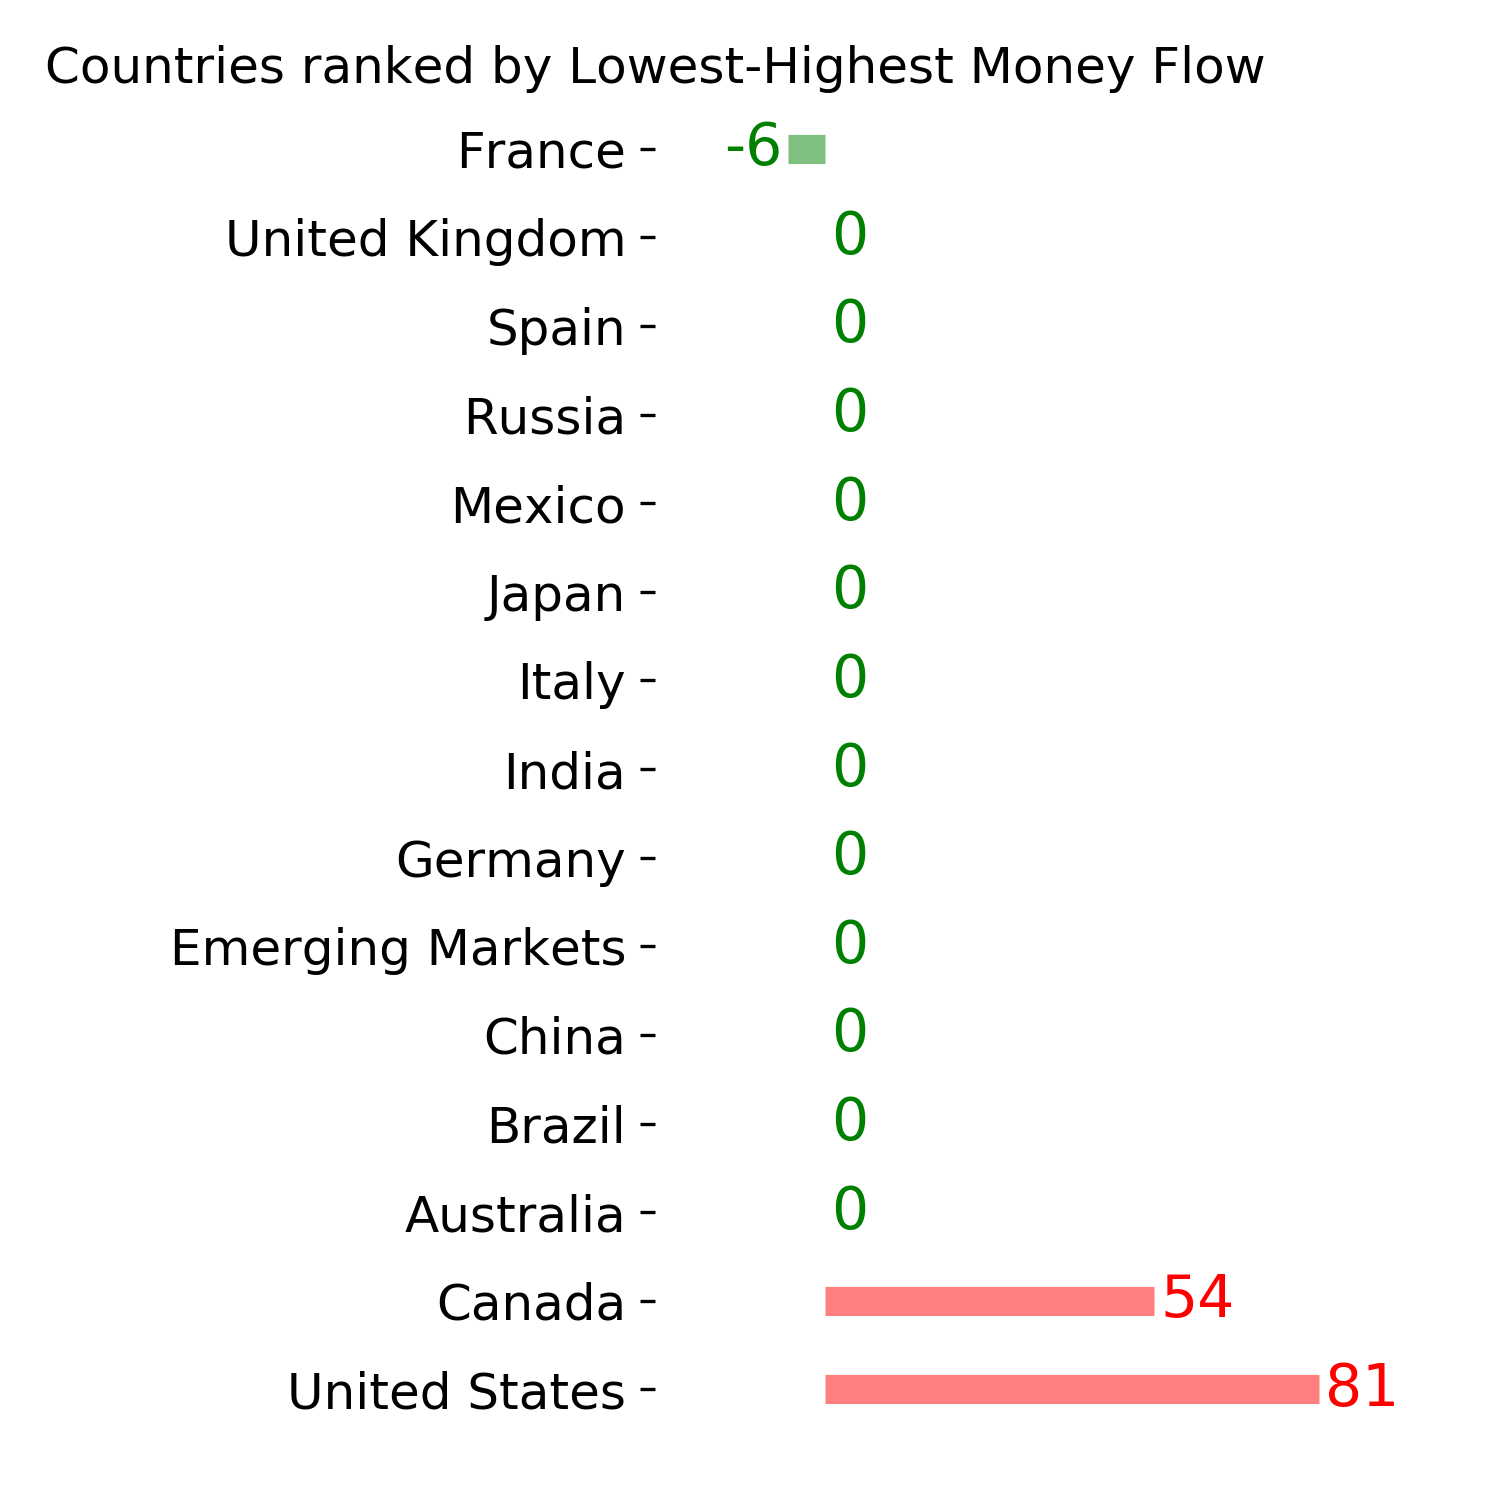
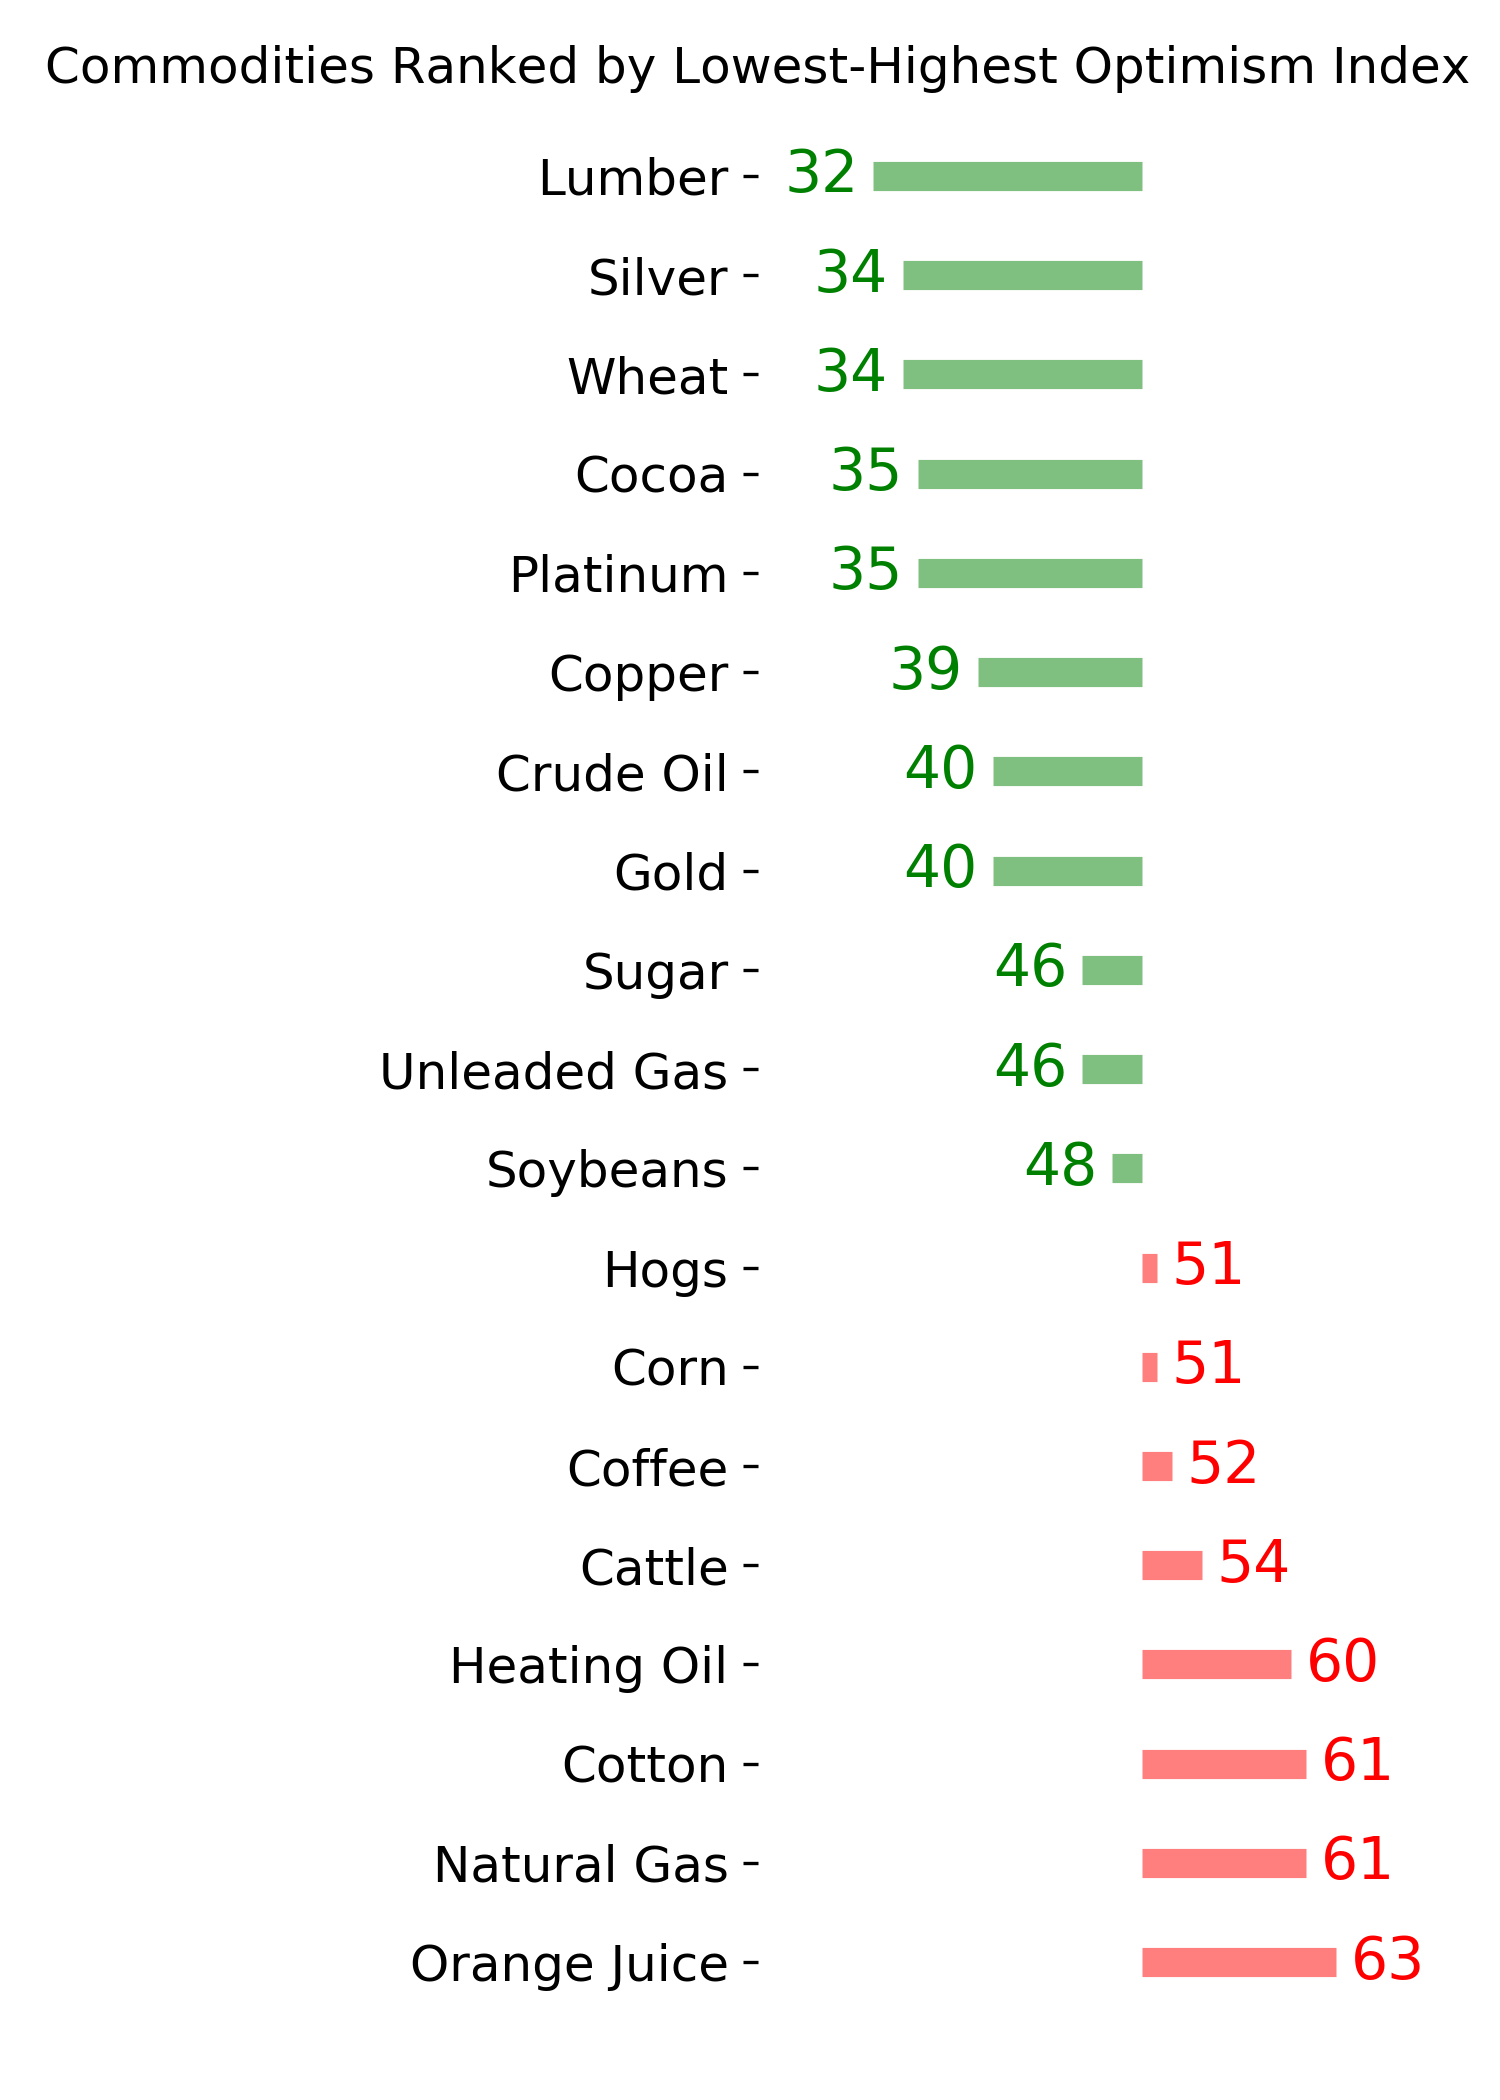
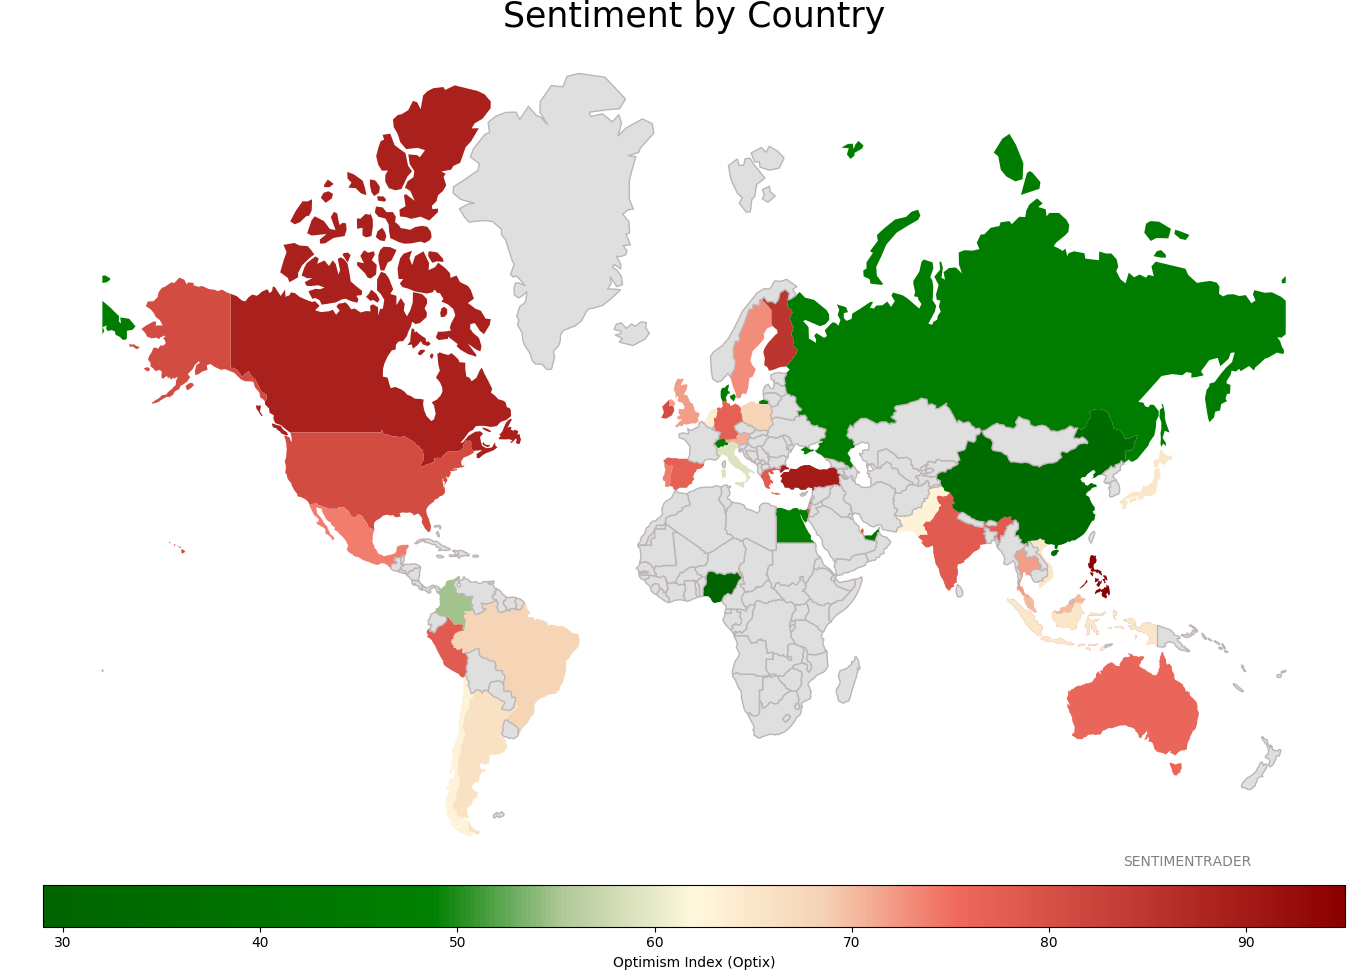
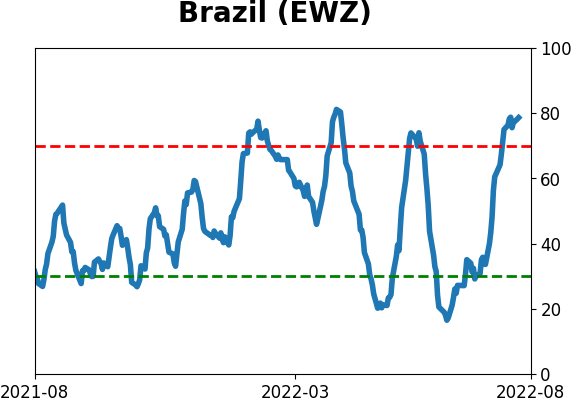
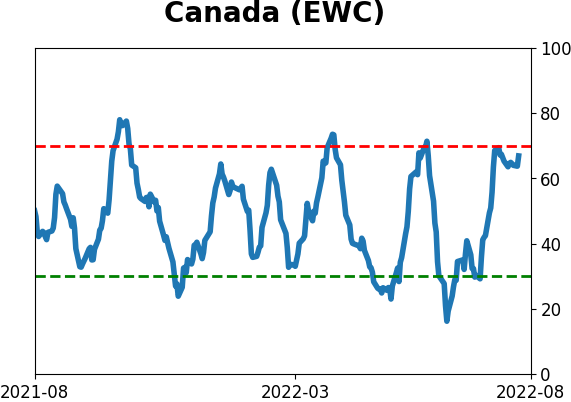
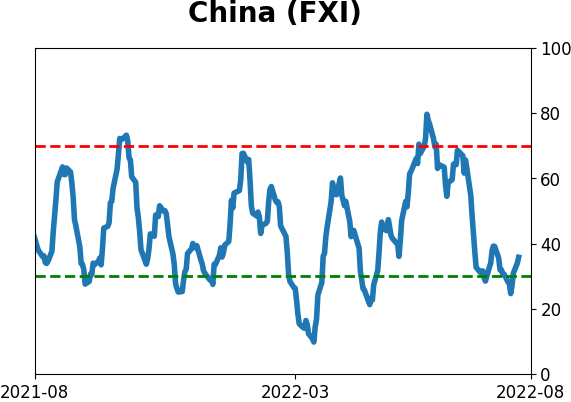
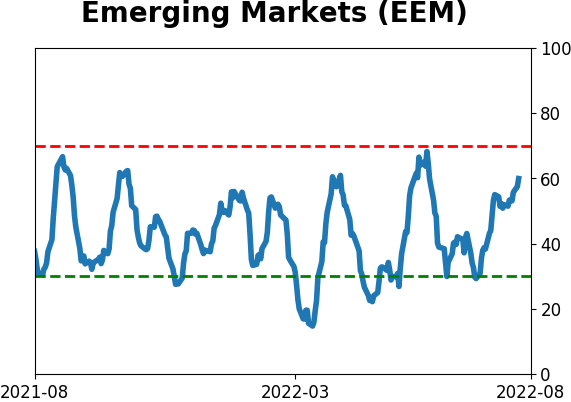
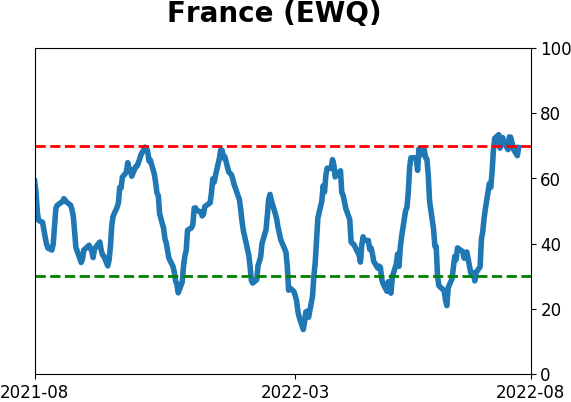
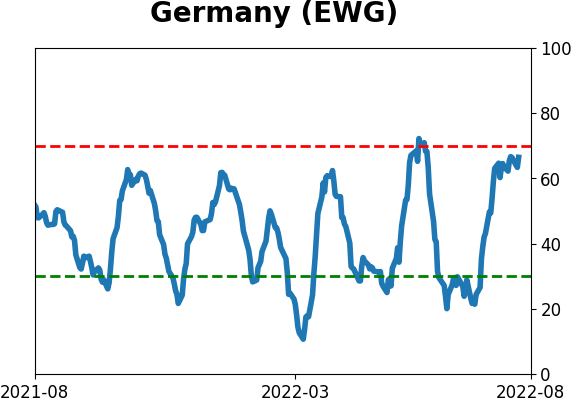
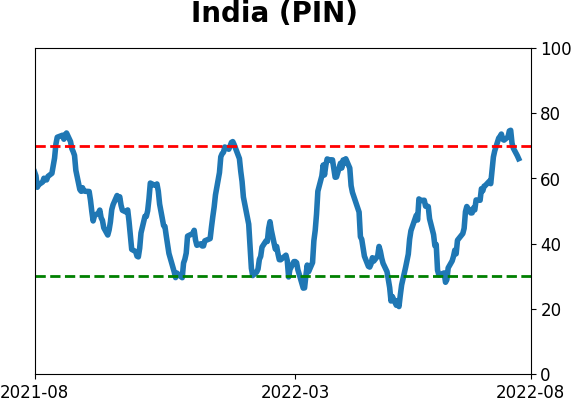
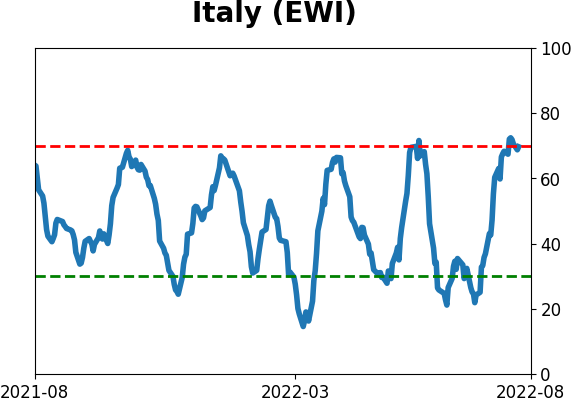
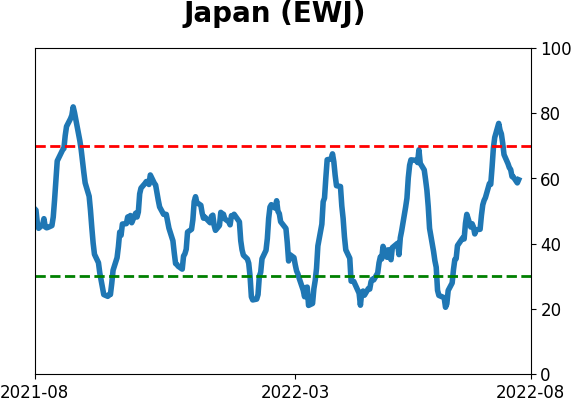
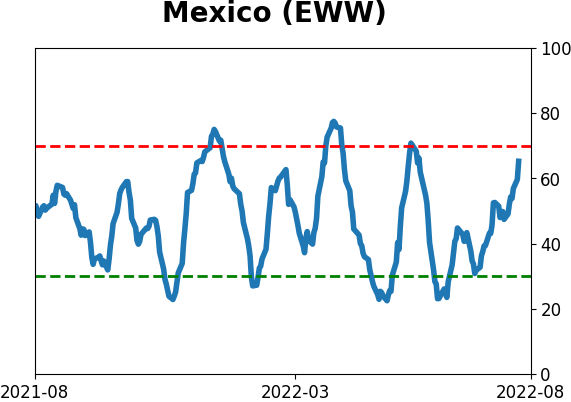
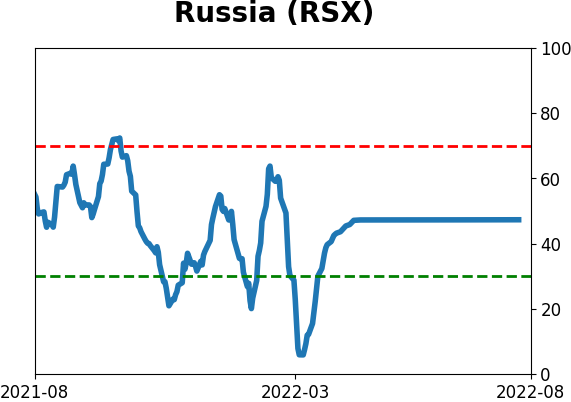
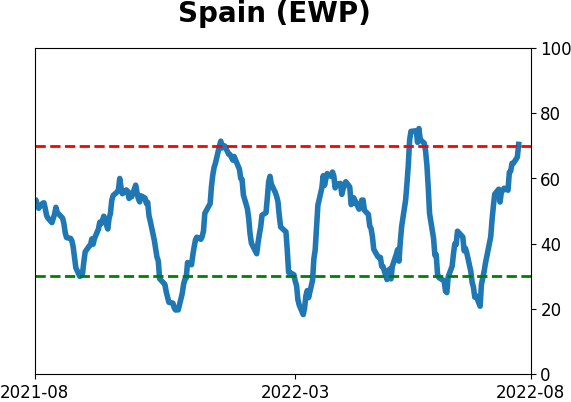
Sentiment Around The World
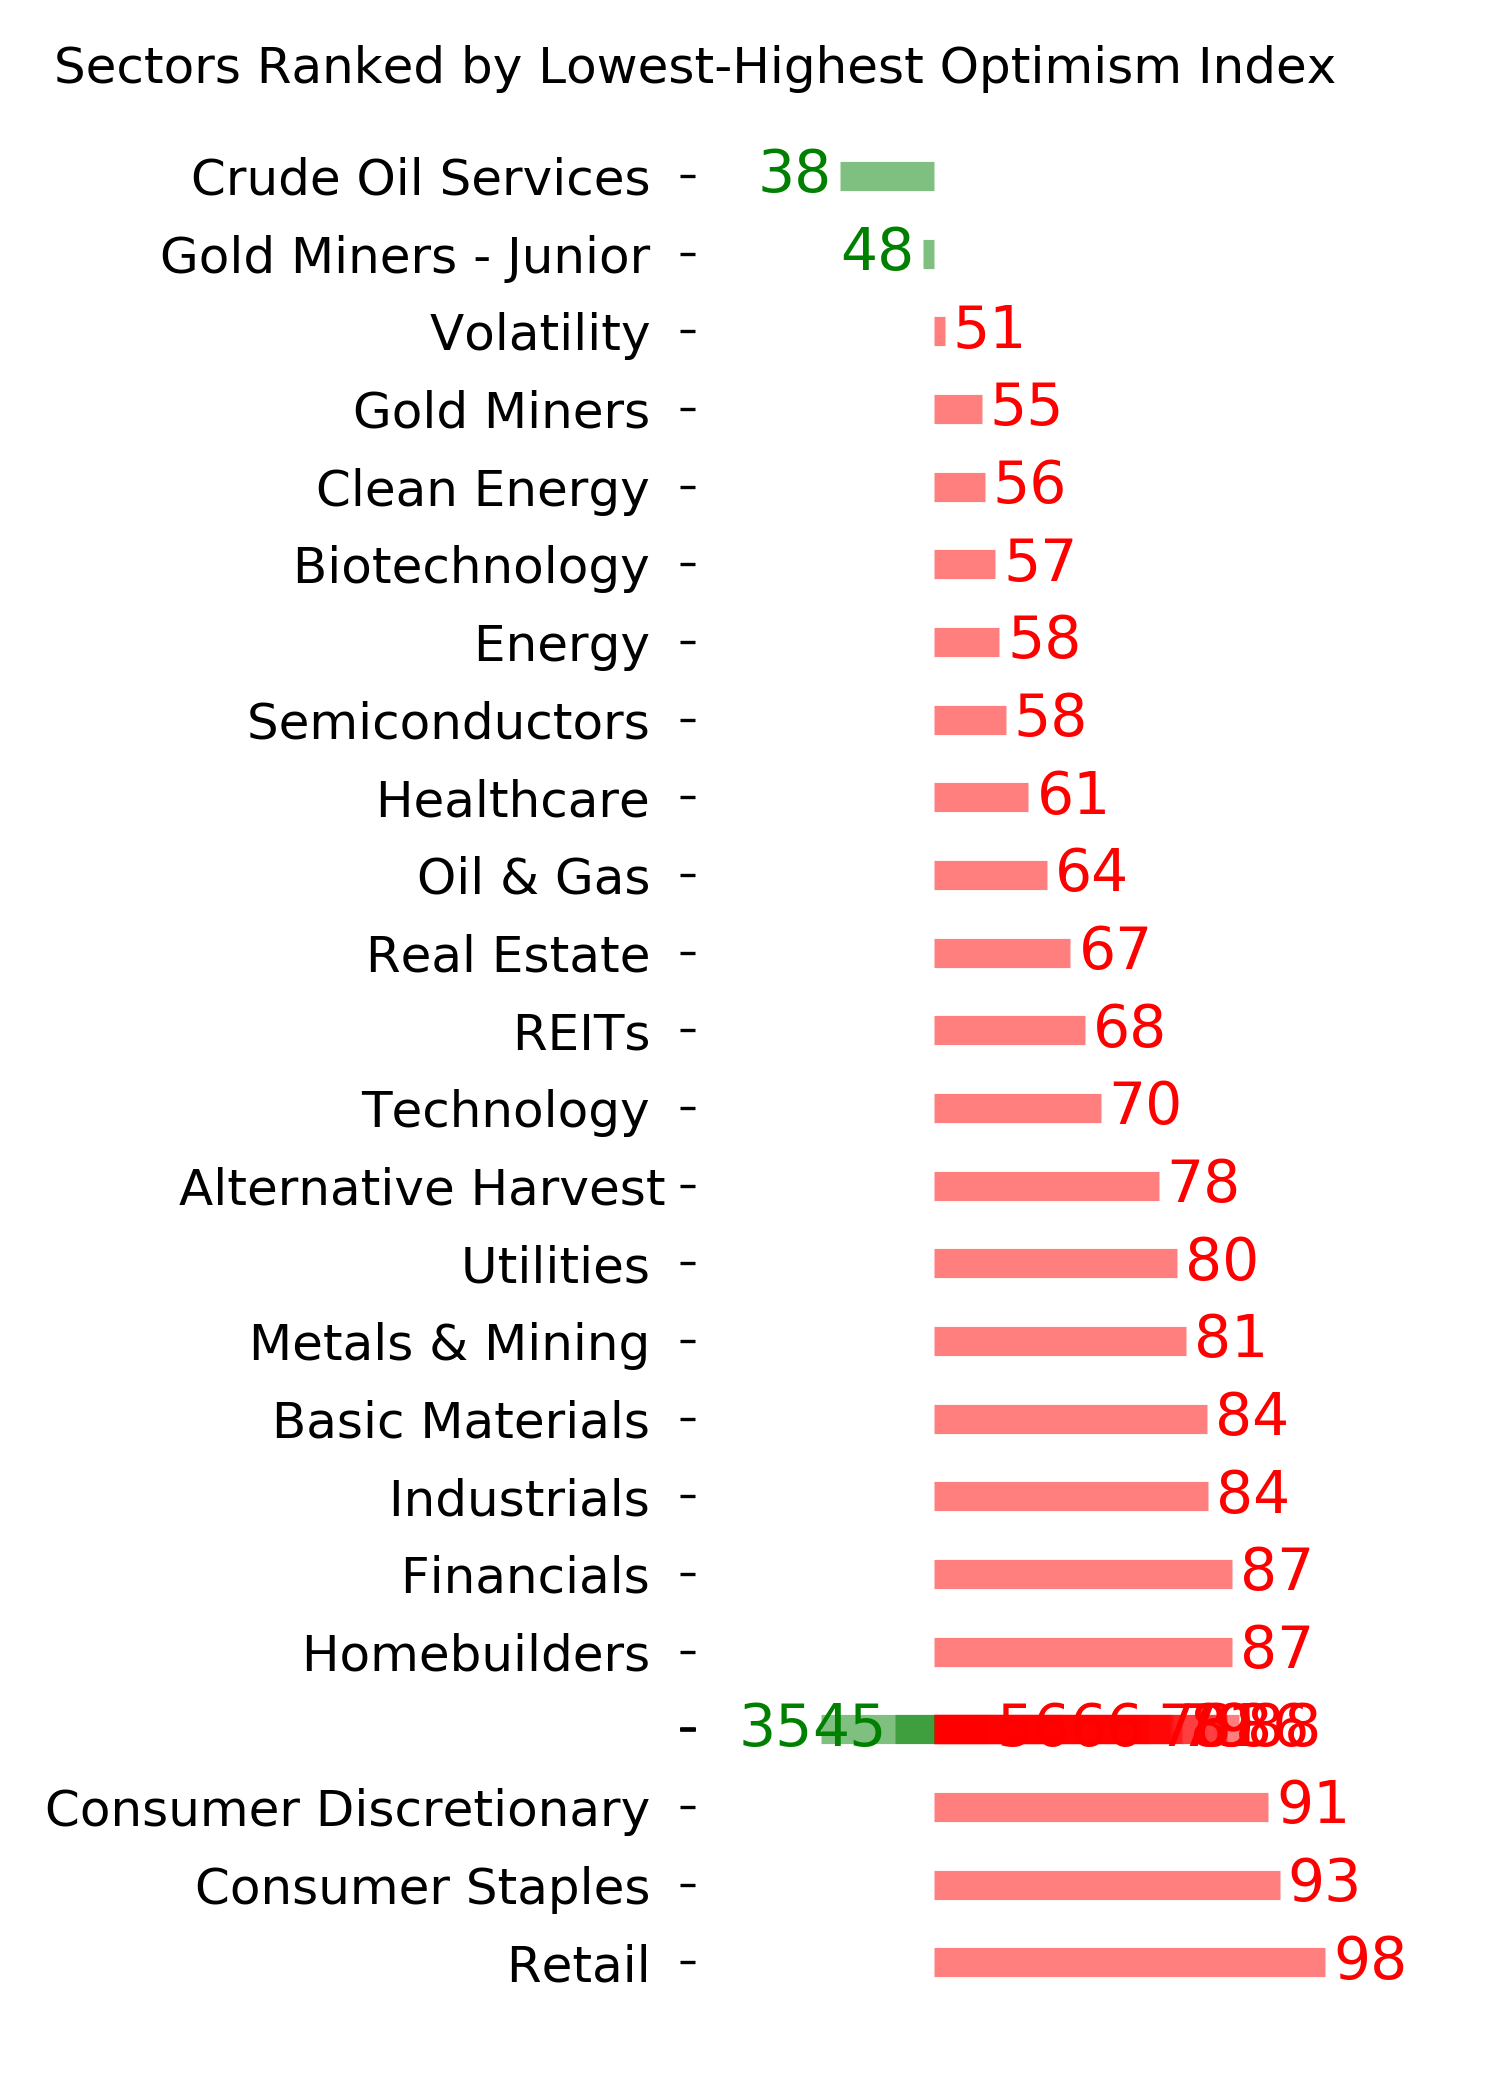
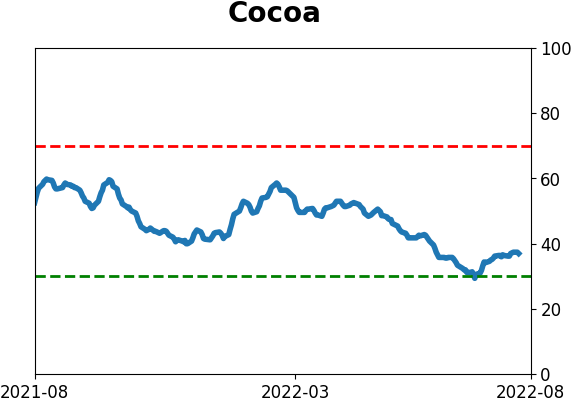
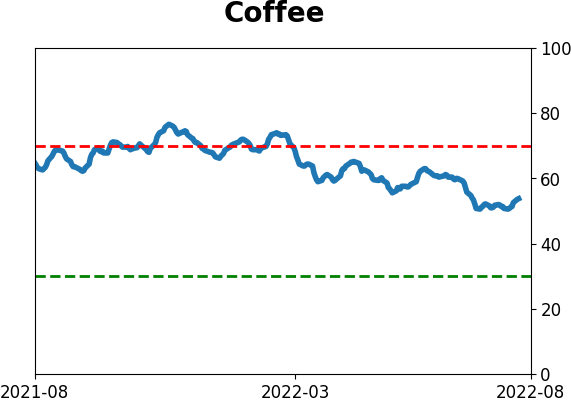
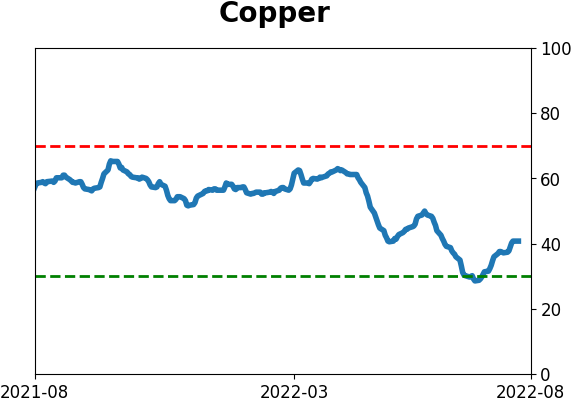
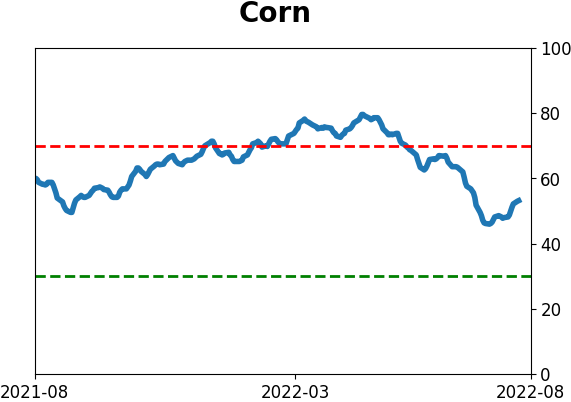
Optimism Index Thumbnails
|
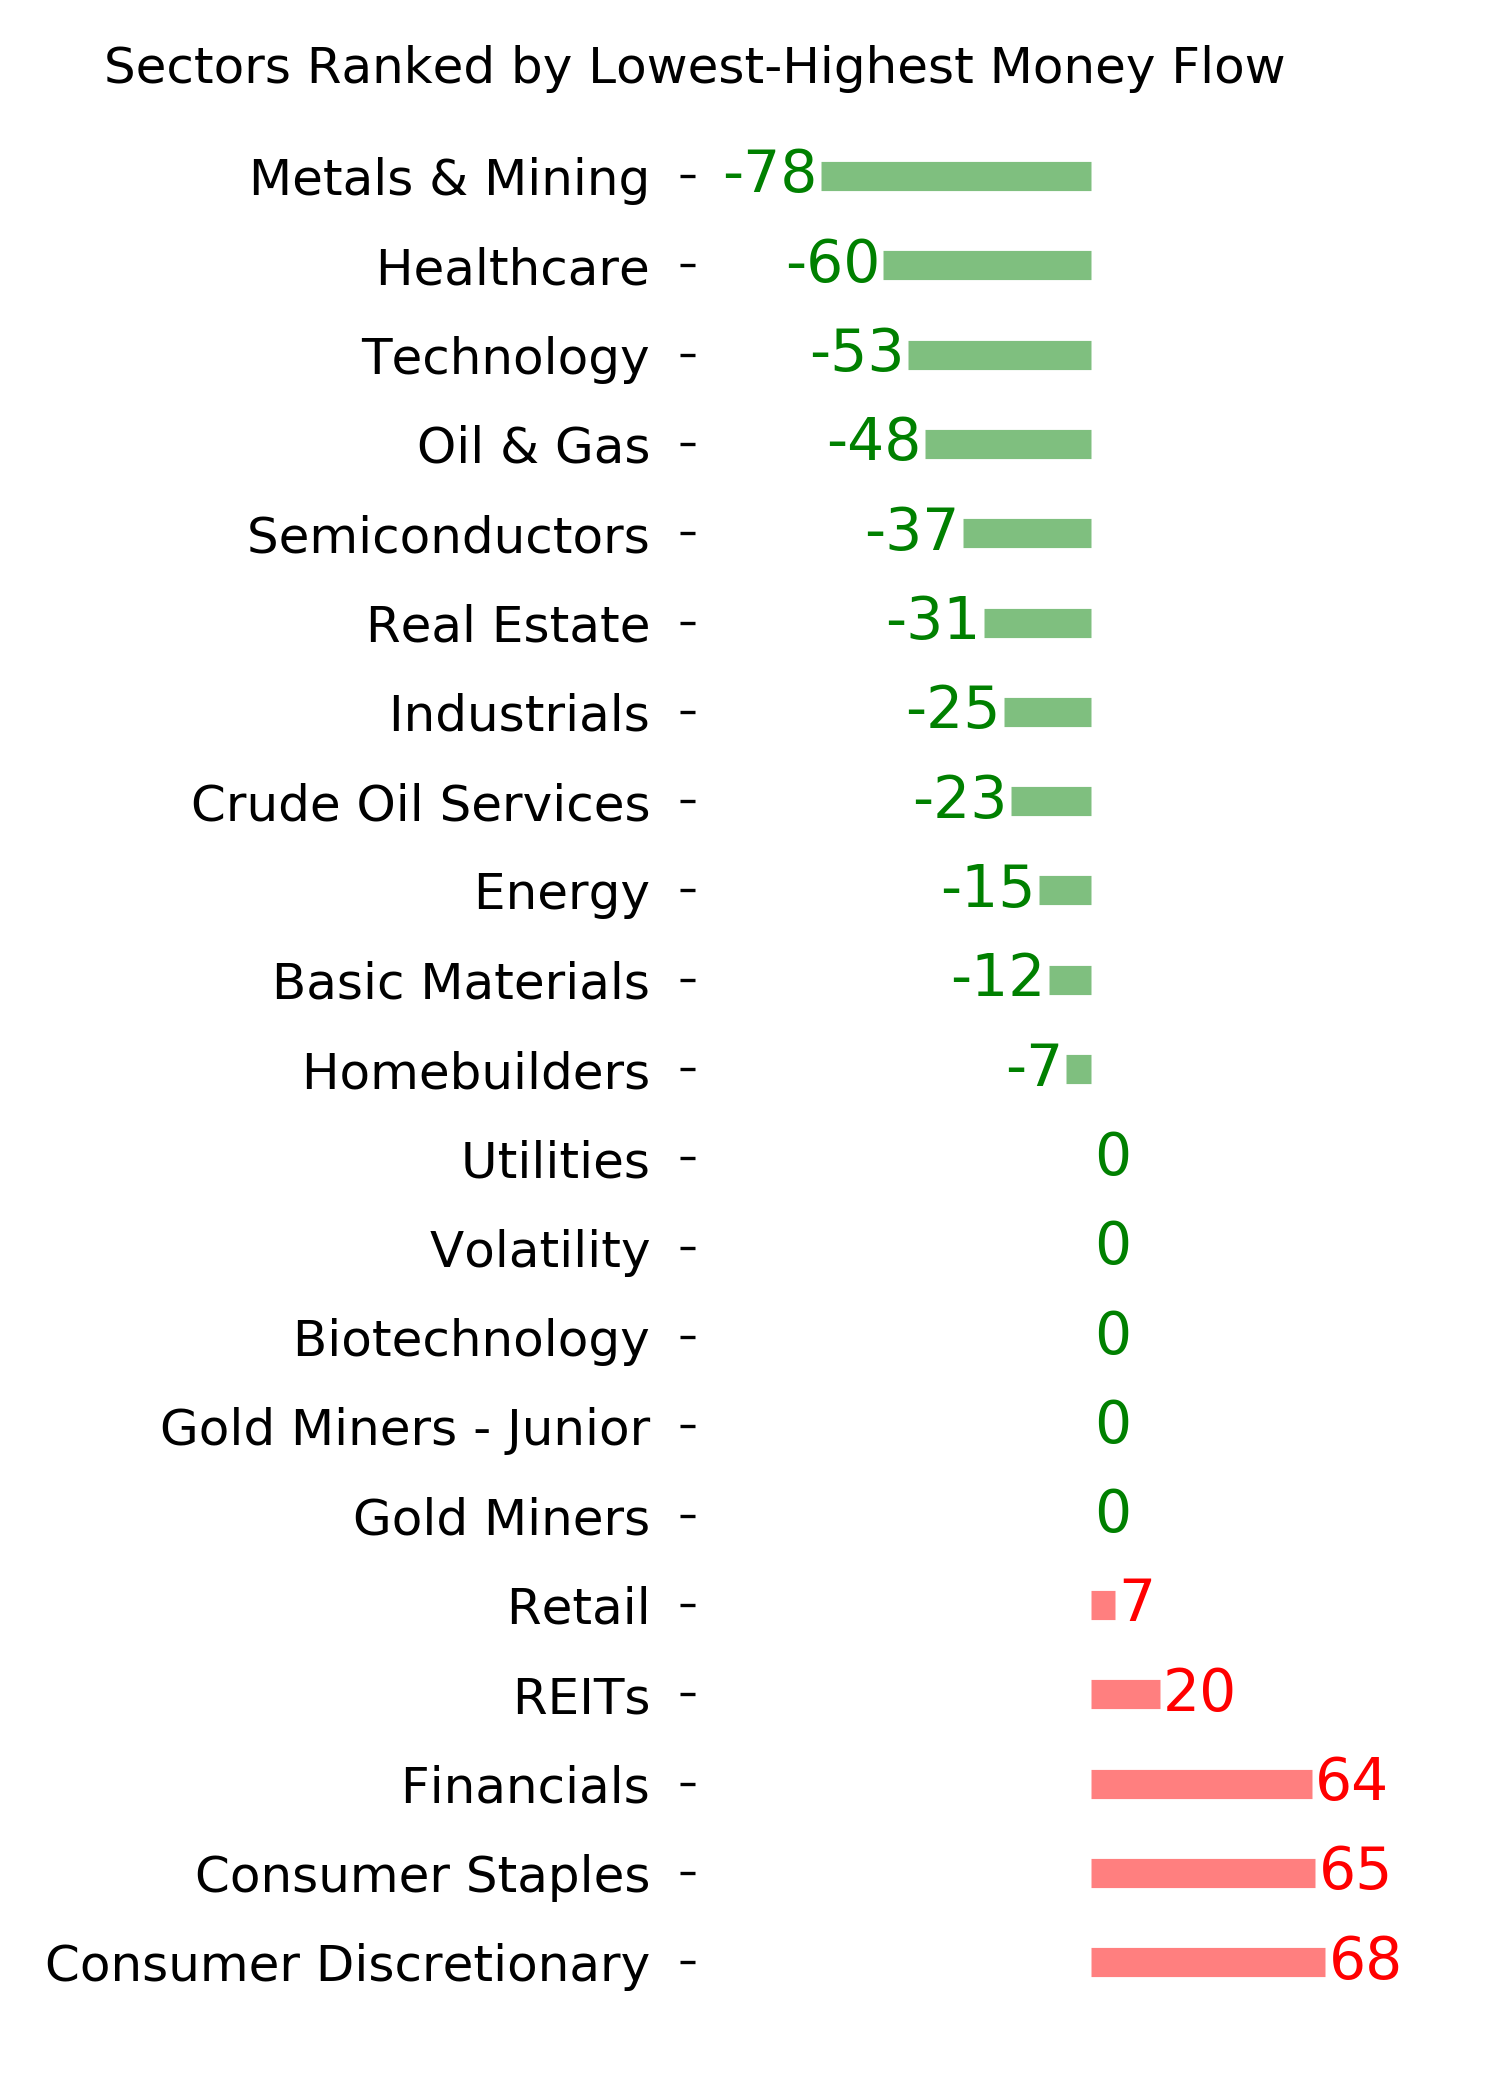
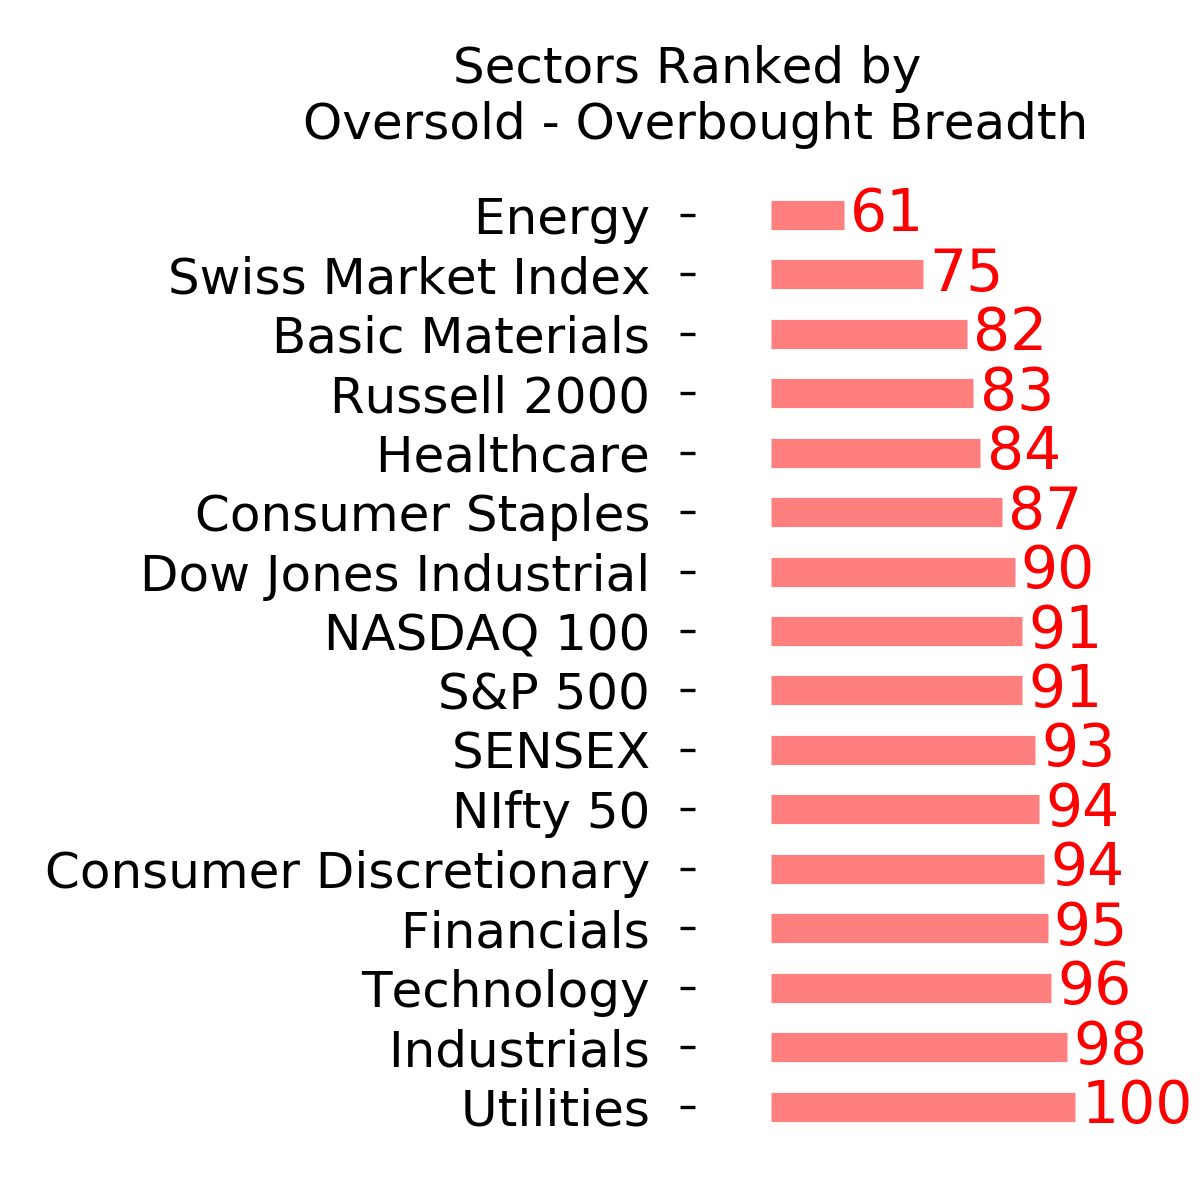
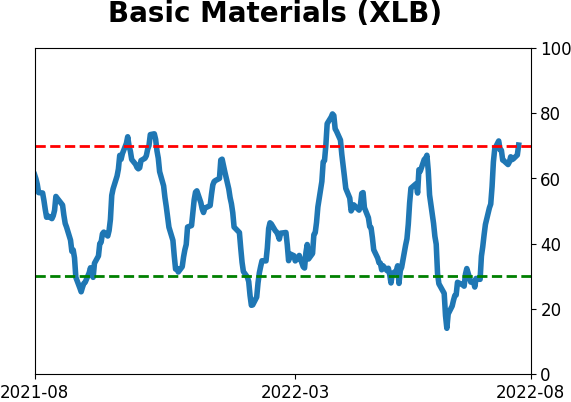
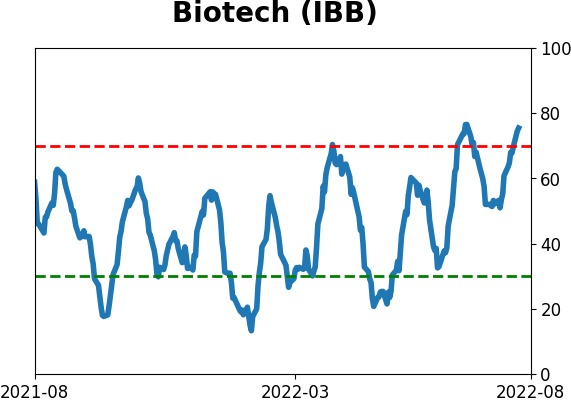
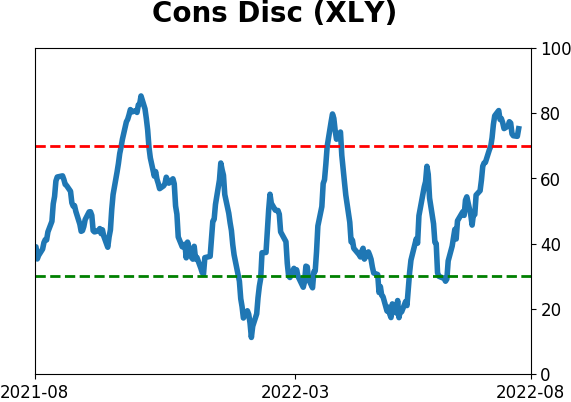
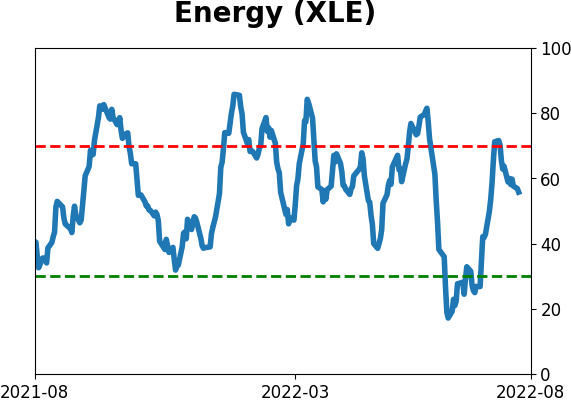
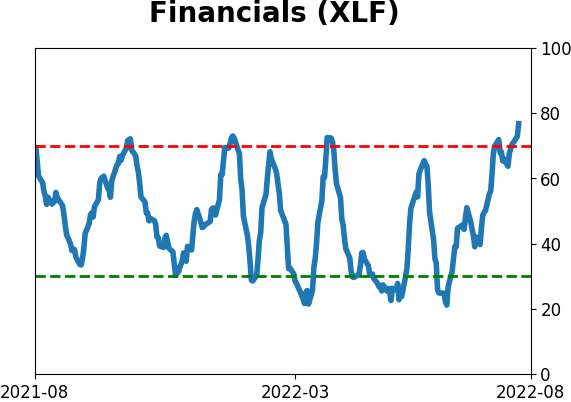
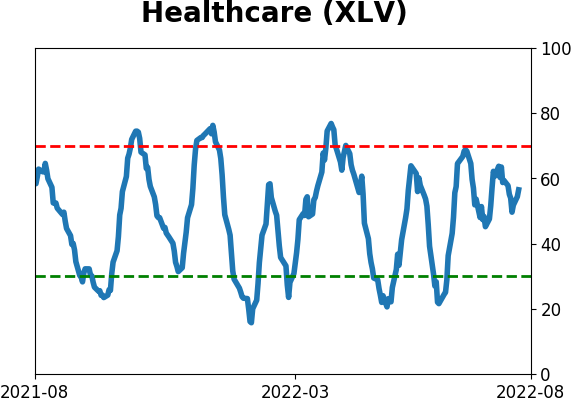
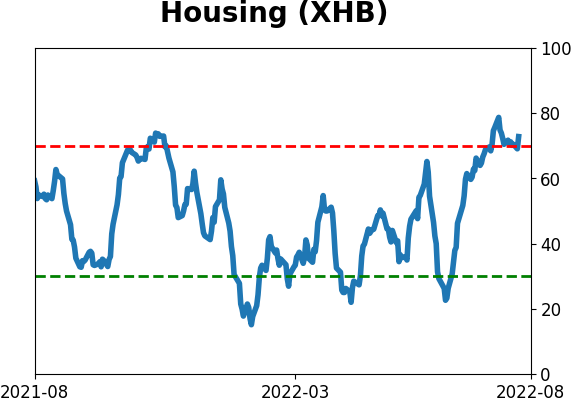
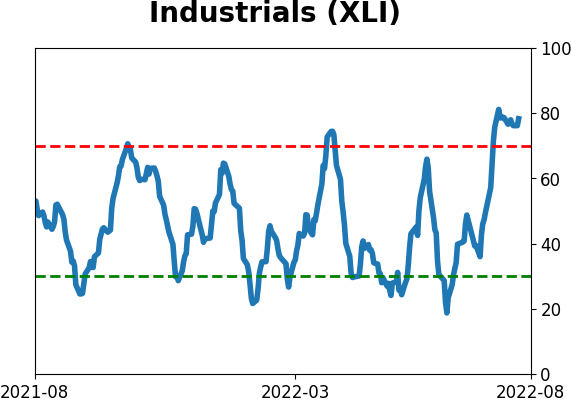
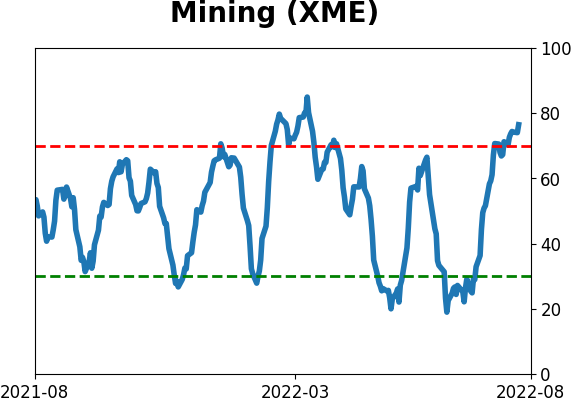
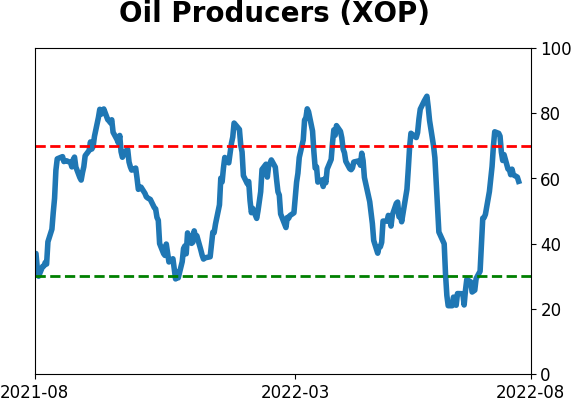
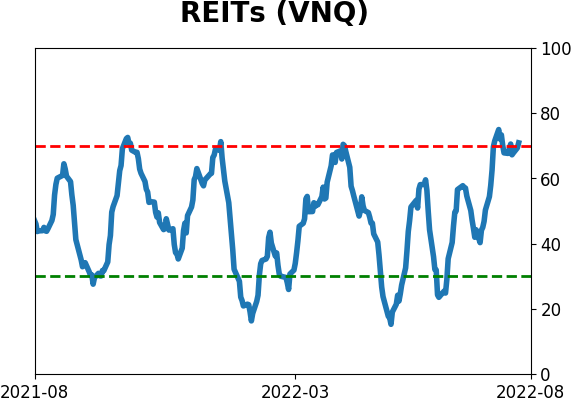
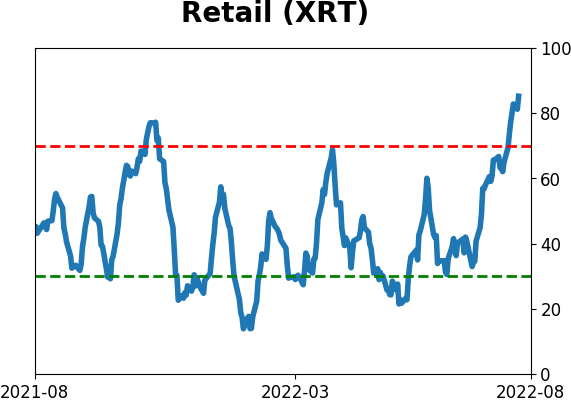
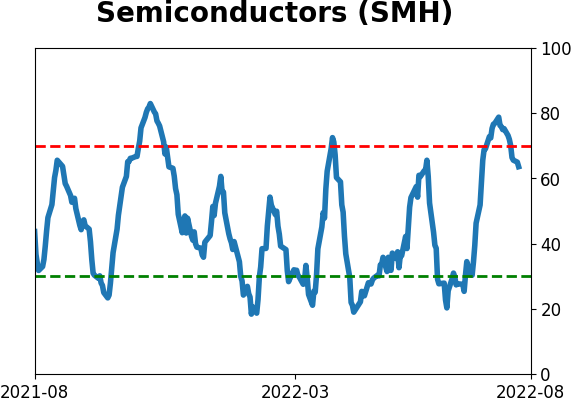
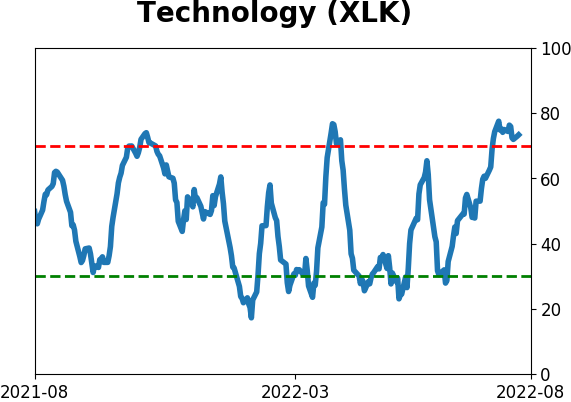
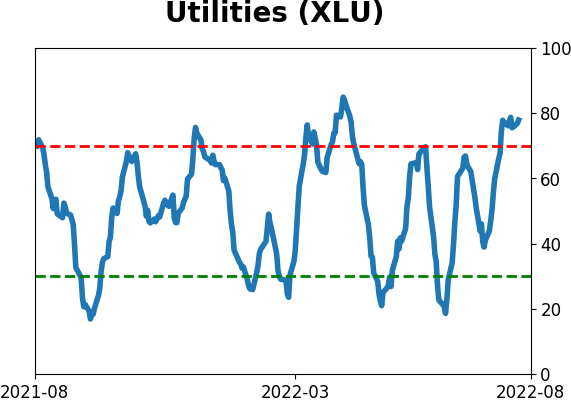
Sector ETF's - 10-Day Moving Average
|
|
|
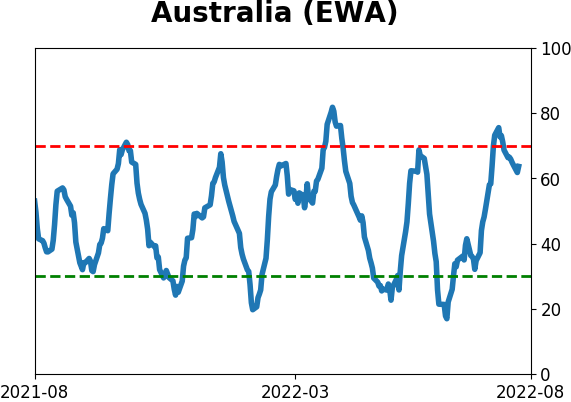
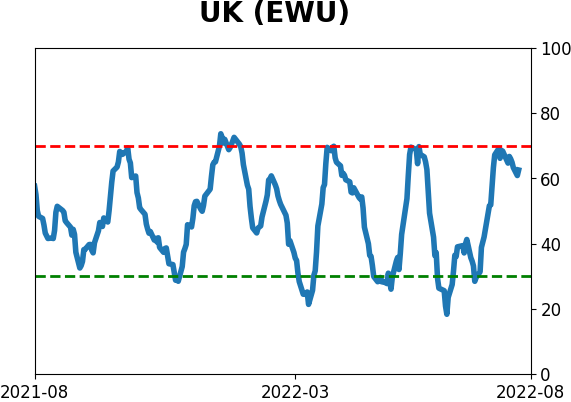
Country ETF's - 10-Day Moving Average
|
|
|
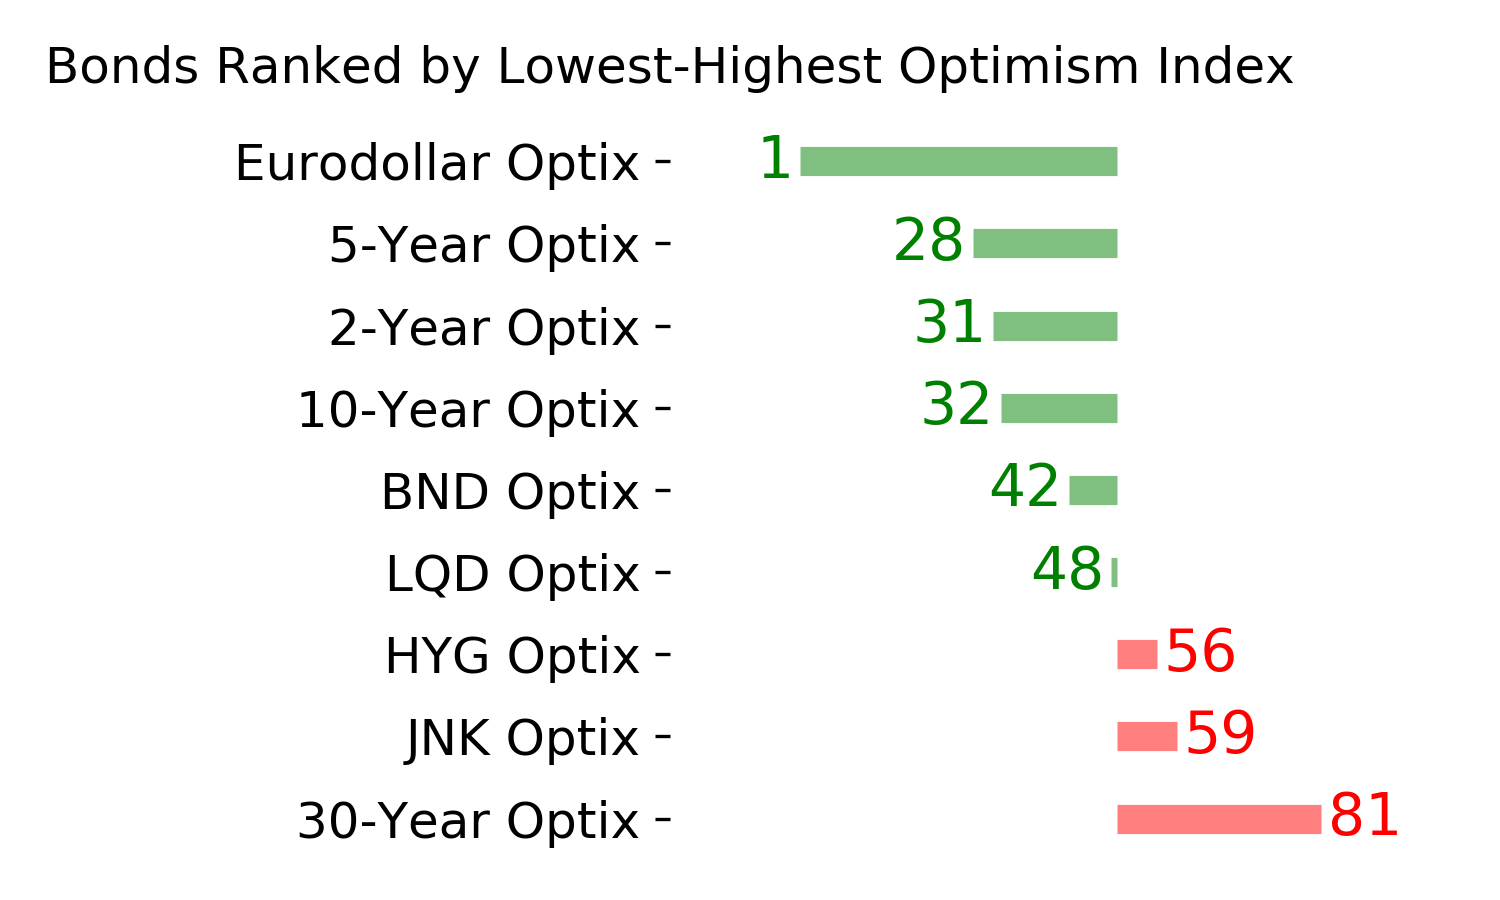
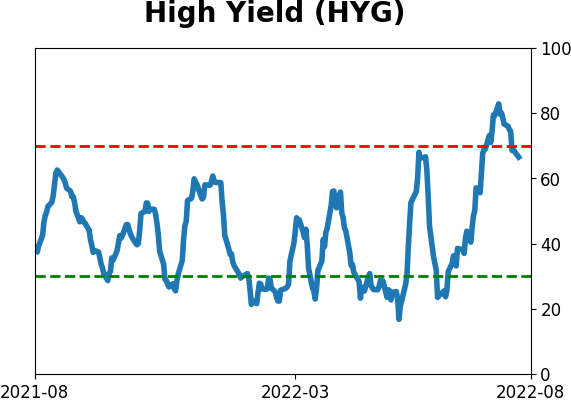
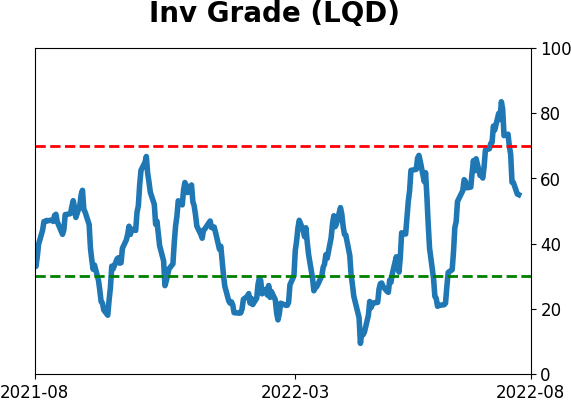
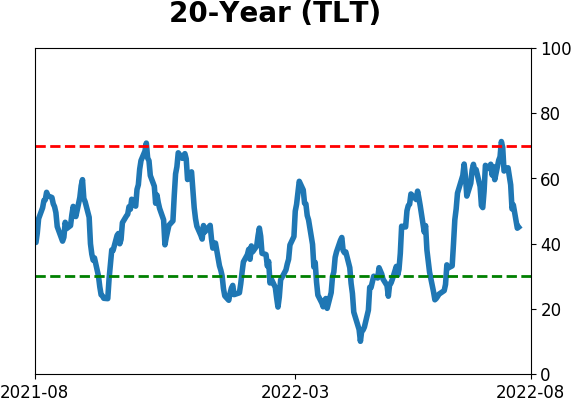
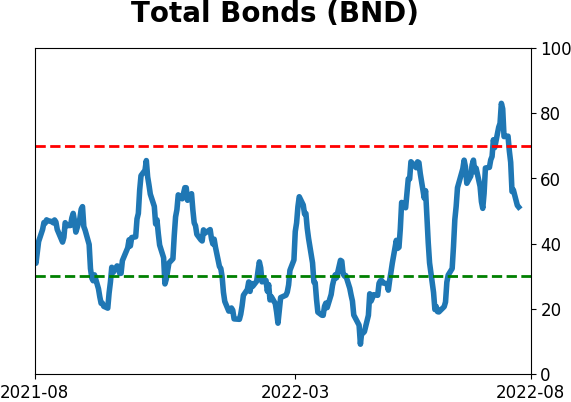
Bond ETF's - 10-Day Moving Average
|
|
|
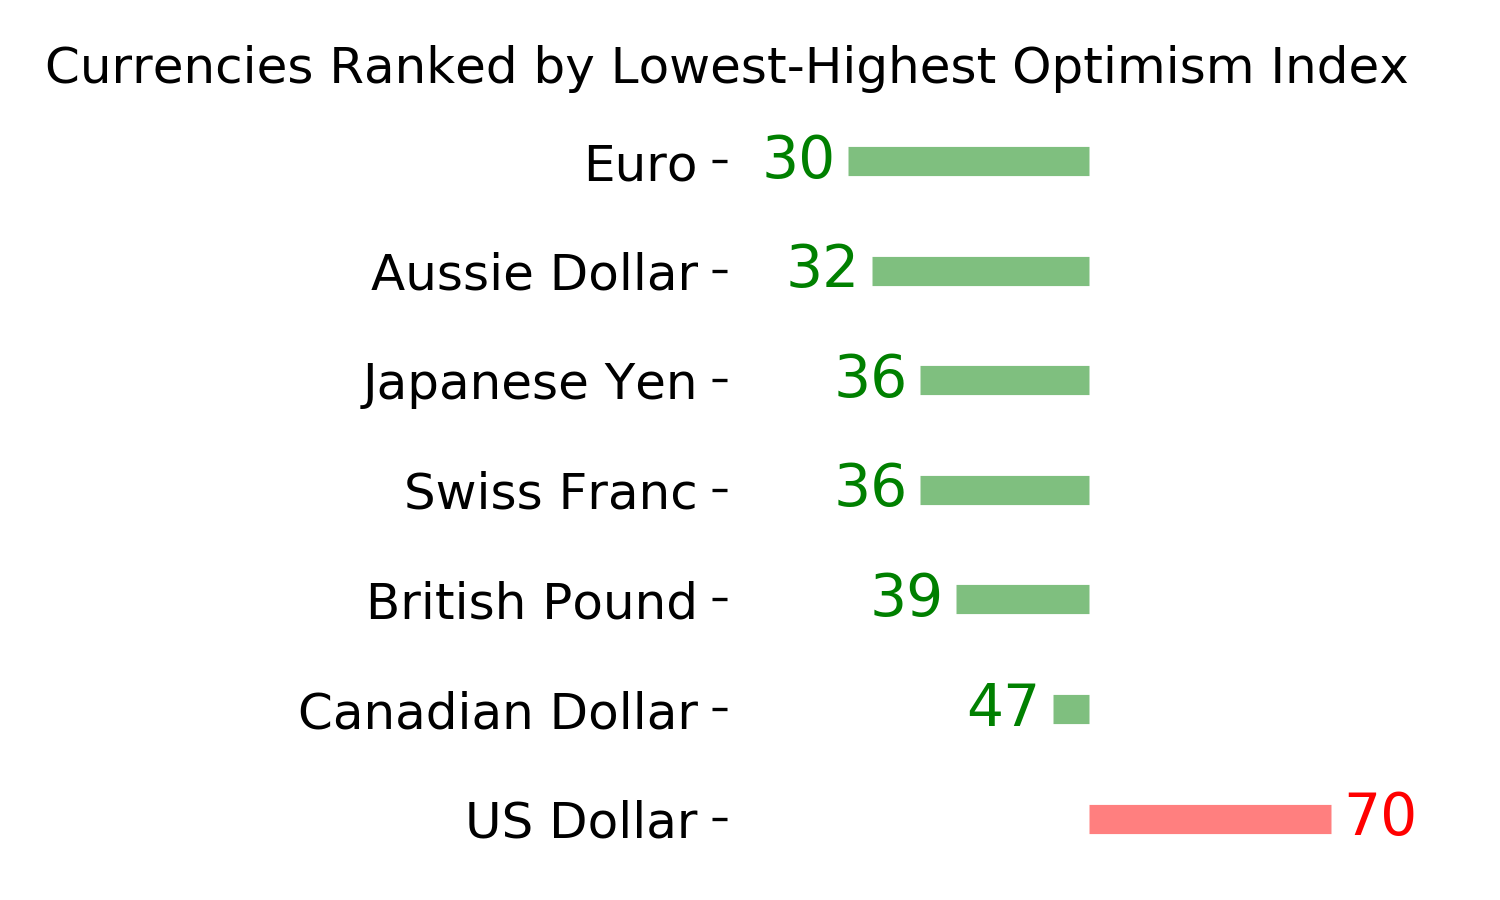
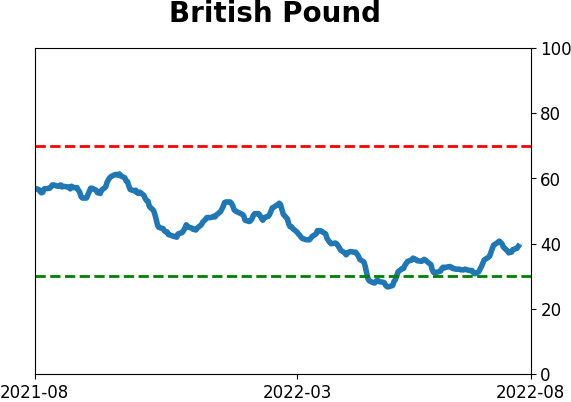
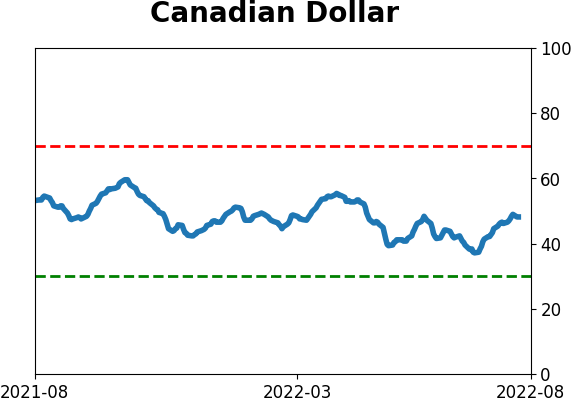
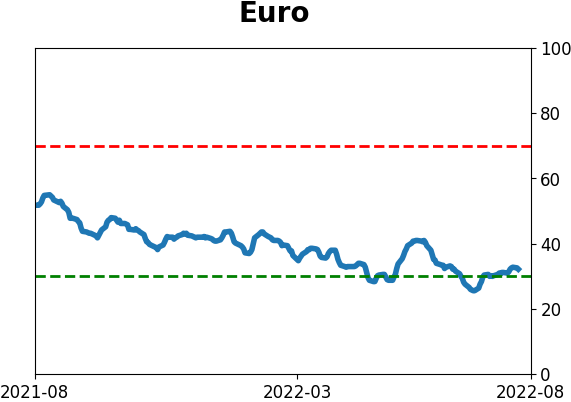
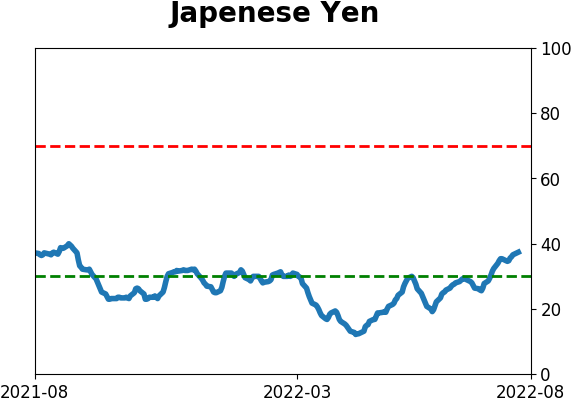
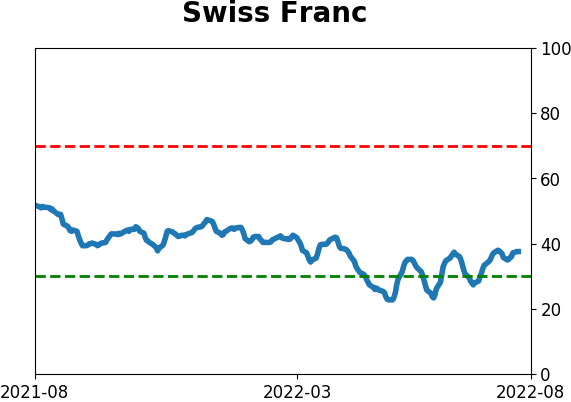
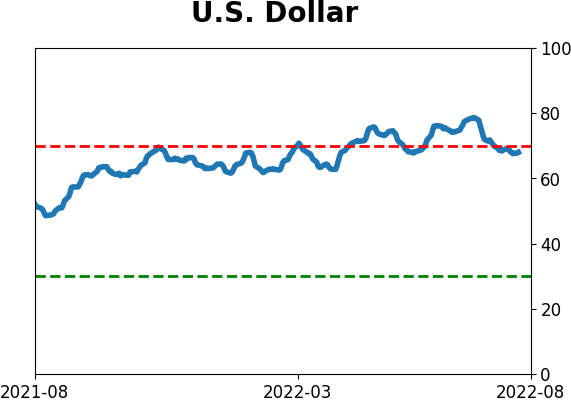
Currency ETF's - 5-Day Moving Average
|
|
|
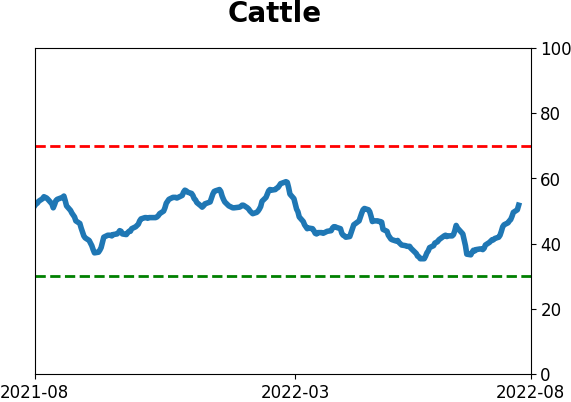
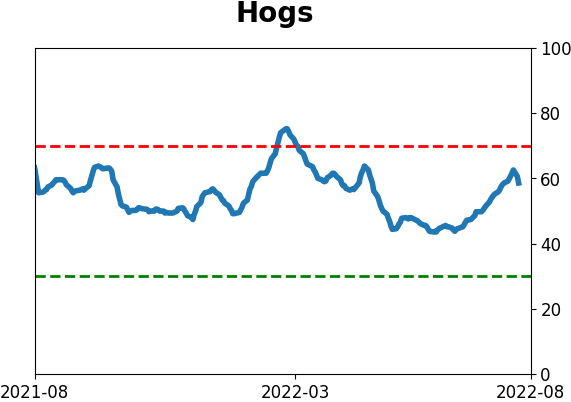
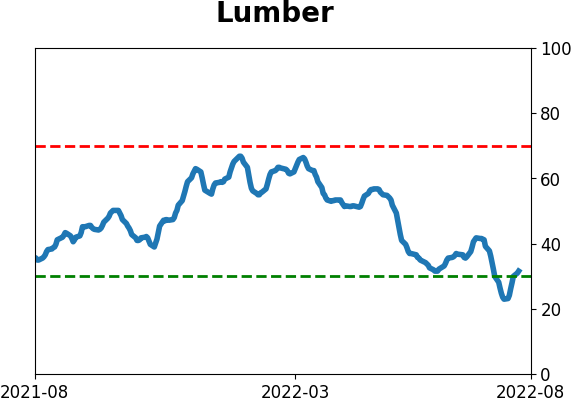
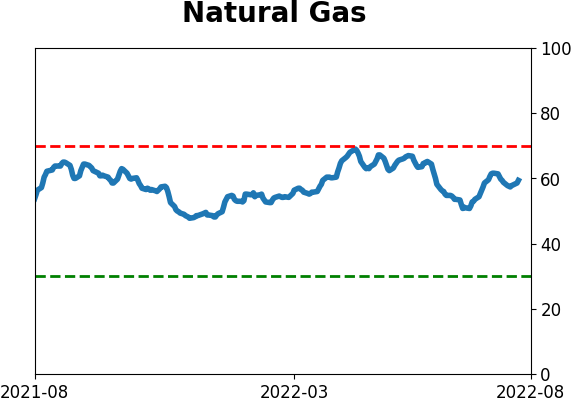
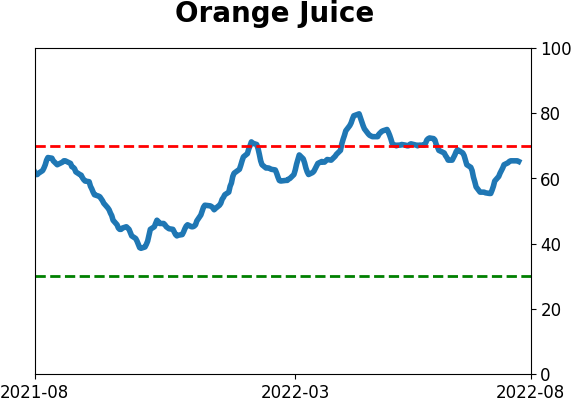
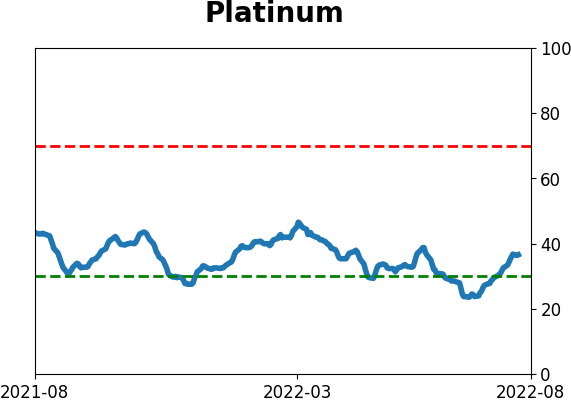
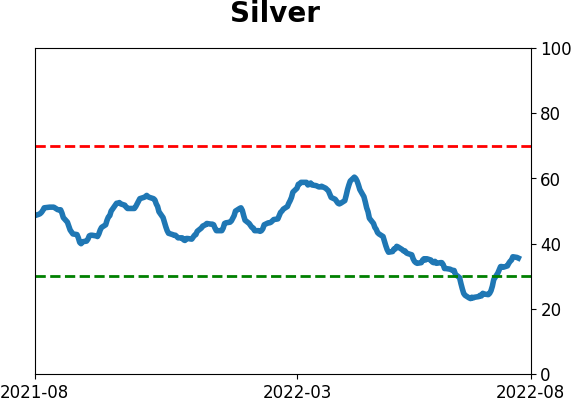
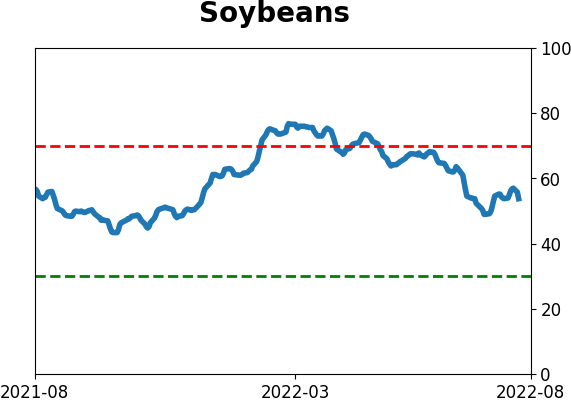
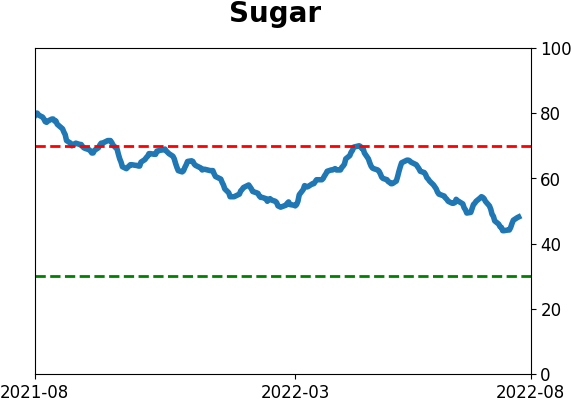
Commodity ETF's - 5-Day Moving Average
|
|