Headlines
|
|
As Stocks Creep Higher, No New Highs in Cumulative Breadth:
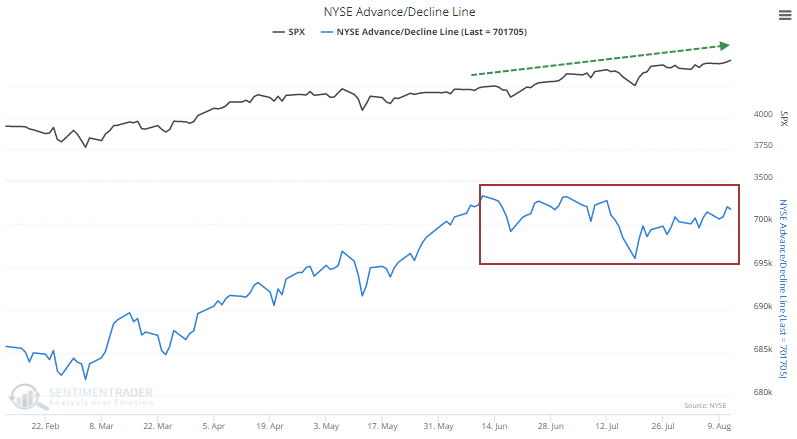
Over the past 2 months, the S&P 500 has recorded 18 new closing highs. During that same stretch, the NYSE Cumulative Advance/Decline Line has not made a single new high. That's one of the longest divergences since 1928.
Bottom Line:
See the Outlook & Allocations page for more details on these summaries STOCKS: Hold
The speculative frenzy in February is wrung out. Internal dynamics have mostly held up, with some exceptions. Many of our studies still show a mixed to poor short-term view, with medium- and long-term ones turning more positive. BONDS: Hold
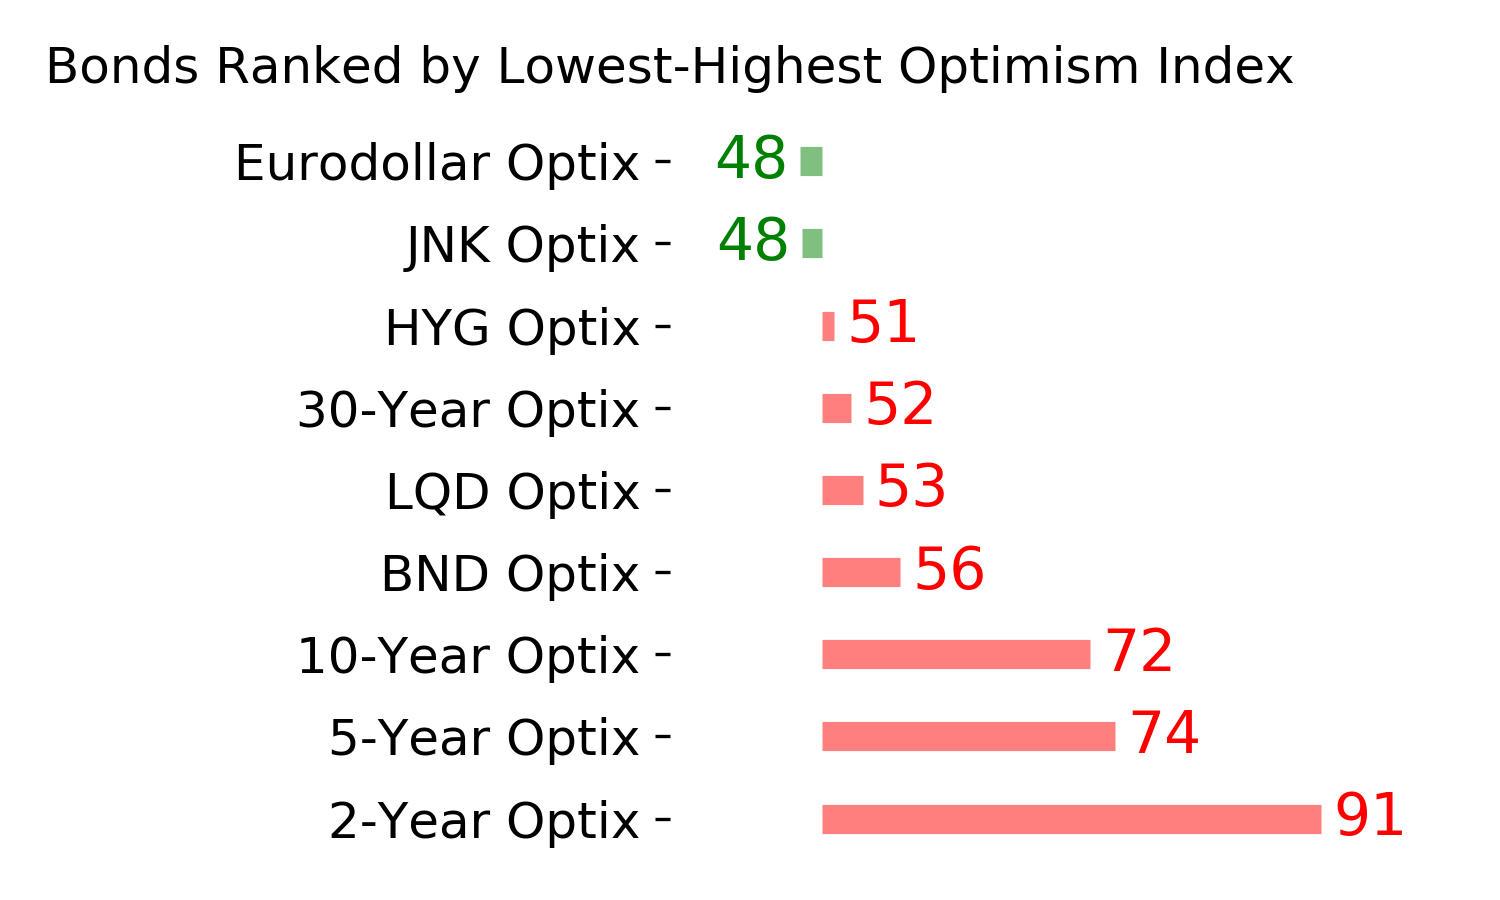
Various parts of the market got hit in March, with the lowest Bond Optimism Index we usually see during healthy environments. After a shaky couple of weeks, the broad bond market has modestly recovered. Not a big edge here either way. GOLD: Hold
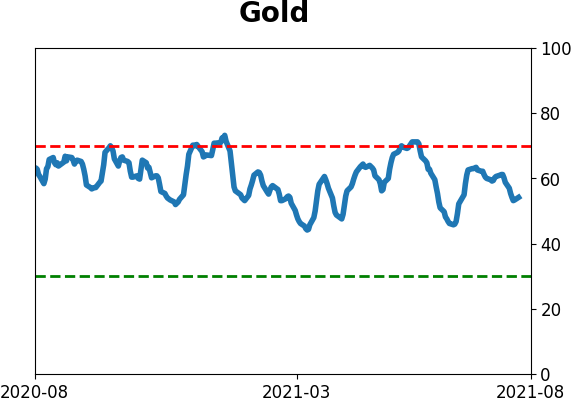
Gold and miners have done very well, recovering above long-term trend lines. The issue is that both have tended to perform poorly after similar situations - will have to wait and see how it plays out.
|
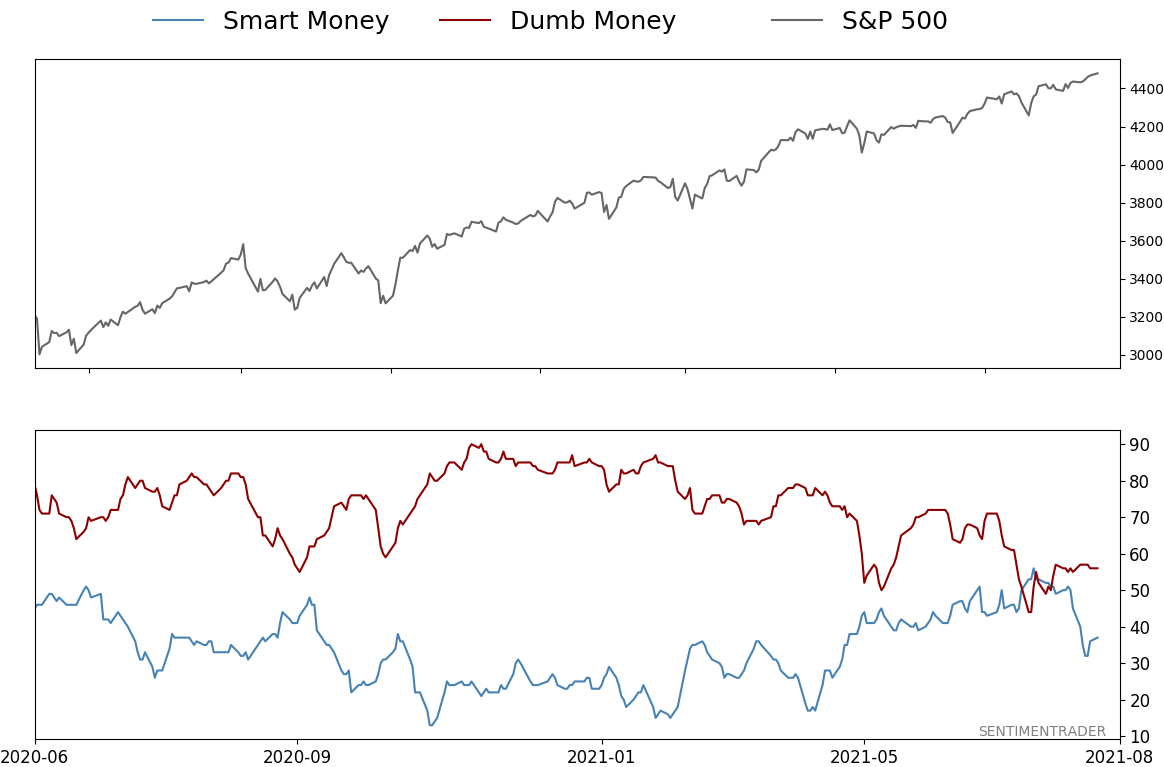
Smart / Dumb Money Confidence
|
Smart Money Confidence: 37%
Dumb Money Confidence: 56%
|
|
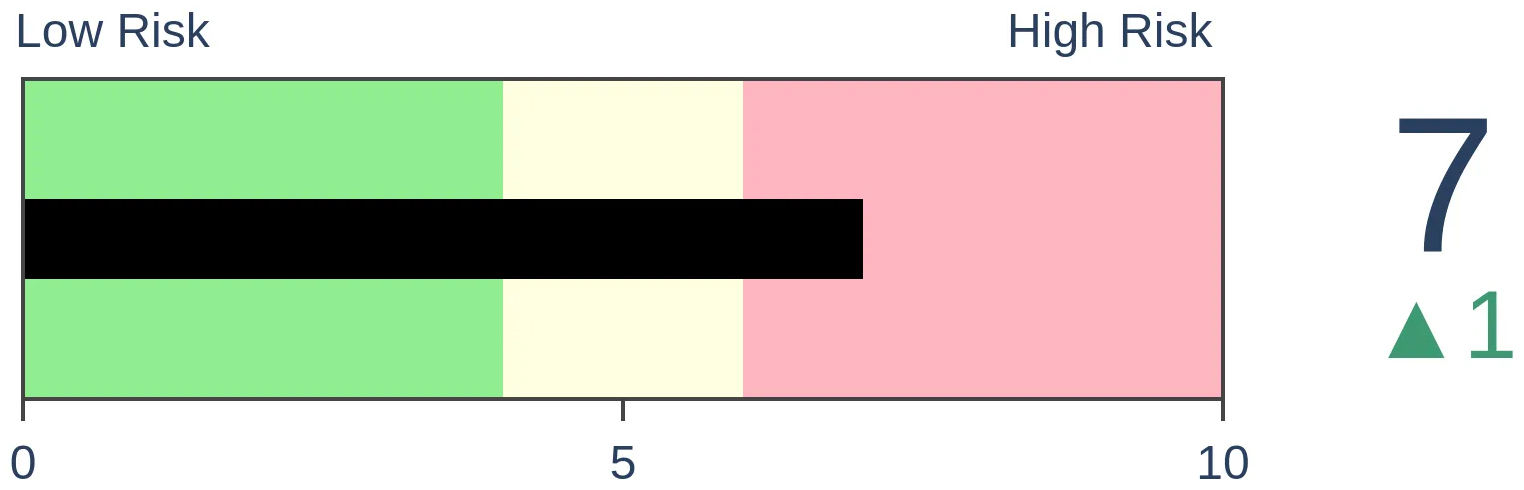
Risk Levels
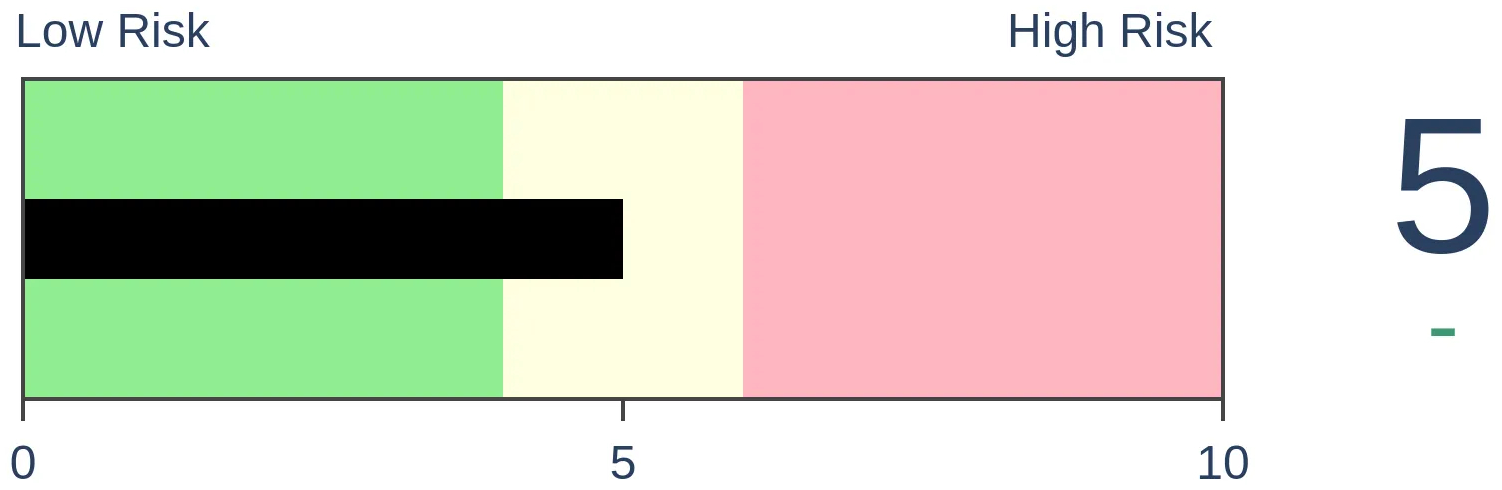
Stocks Short-Term
|
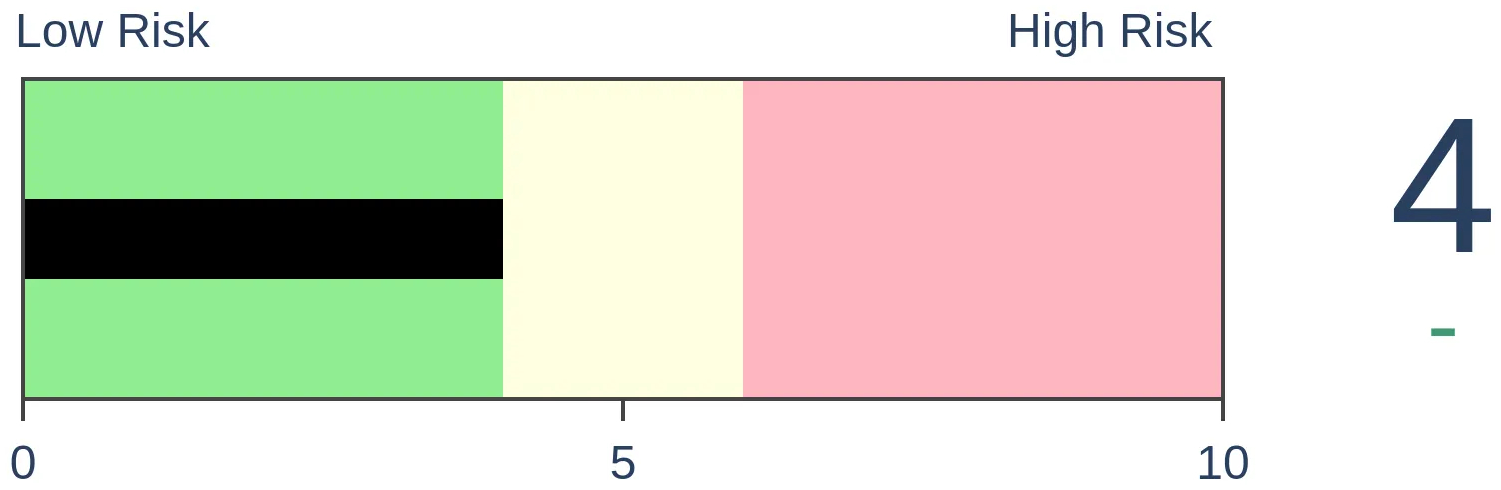
Stocks Medium-Term
|
|
Bonds

|
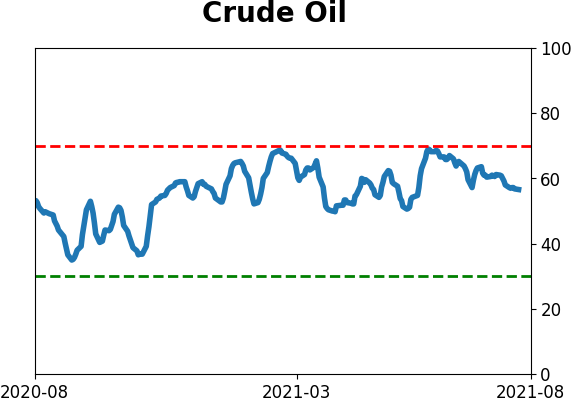
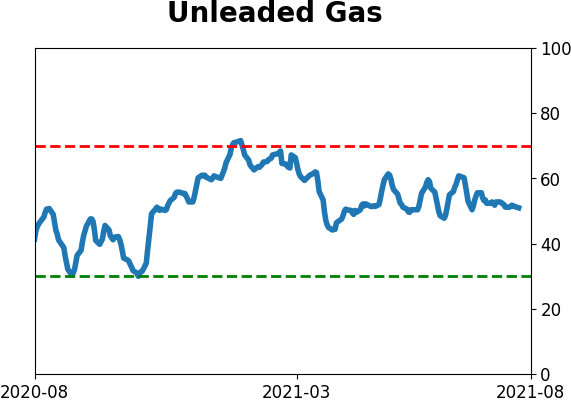
Crude Oil

|
|
Gold

|
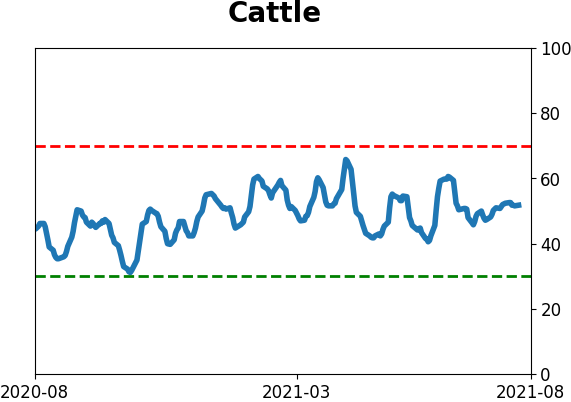
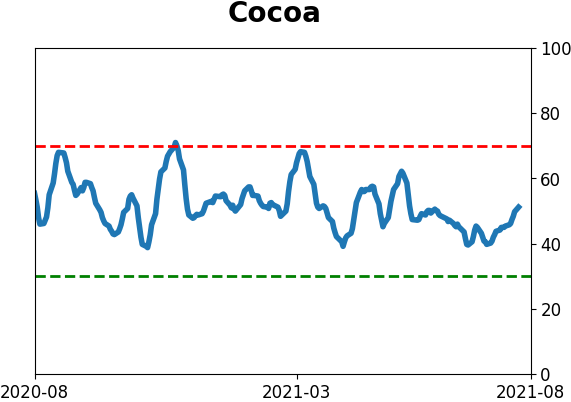
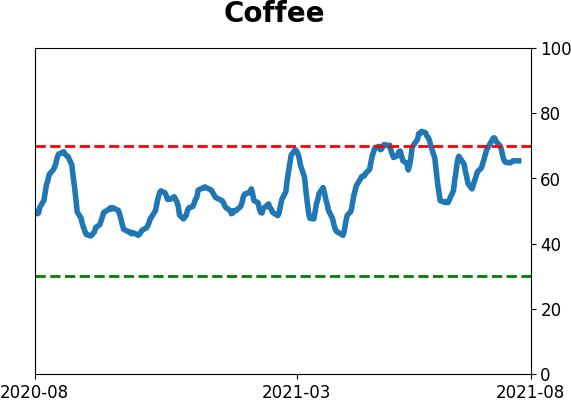
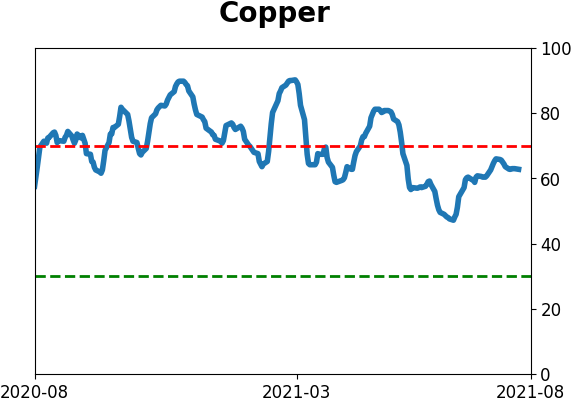
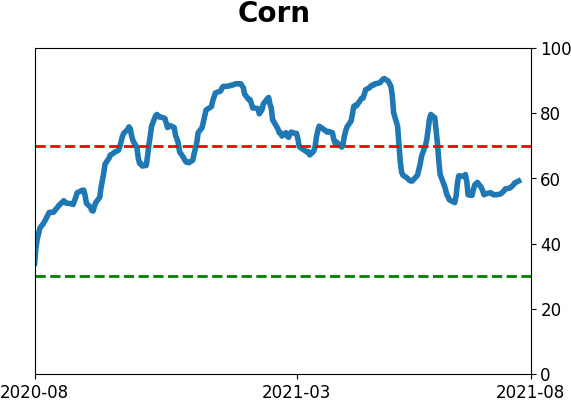
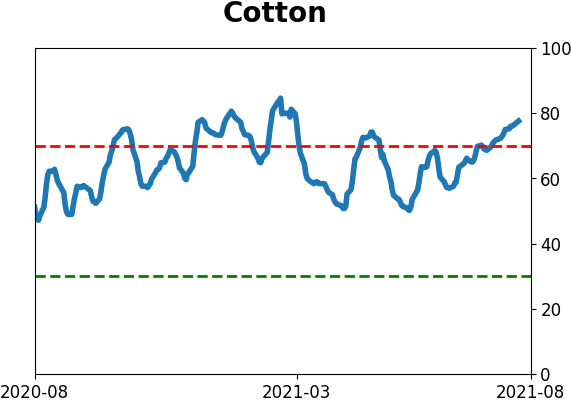
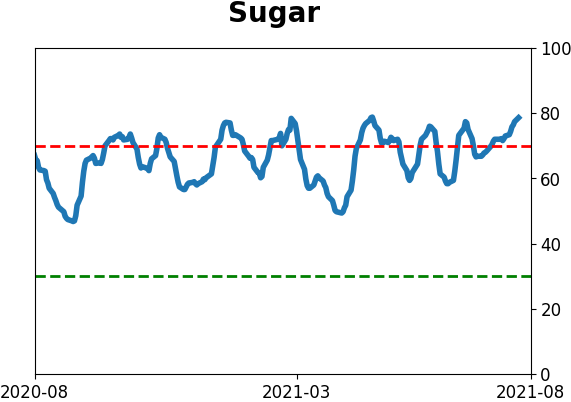
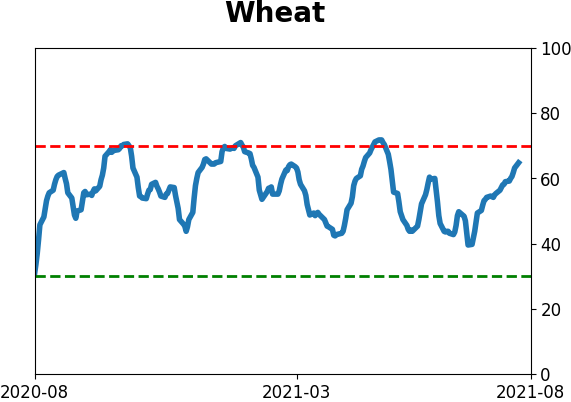
Agriculture
|
|
Research
By Jason Goepfert
BOTTOM LINE
Over the past 2 months, the S&P 500 has recorded 18 new closing highs. During that same stretch, the NYSE Cumulative Advance/Decline Line has not made a single new high. That's one of the longest divergences since 1928.
FORECAST / TIMEFRAME
None
|
In decades past, it used to be easy to feel like we had a grasp on what breadth was doing under the major market indexes. Simply ask whether the NYSE Cumulative Advance/Decline Line was hitting new highs or not.
If it was, along with the Dow Industrials or S&P 500, then everything was kosher. If not, well, then there could be trouble.
A while back, analysts started getting more sophisticated and rolled out a version of the A/D Line that only included common stocks, believing that divergences would be more useful (they're not). In recent years, computing power has expanded and access to data is unlike any period in history, so there are a bewildering number of choices to determine what "breadth" means.
KEEPING IT OLD SCHOOL
If we stick to the old school and simply look at the NYSE A/D Line, then things don't look too bad. It's hanging in there along with the major indexes. About the only potential negative is that it hasn't reached a new high for a couple of months. The S&P 500, meanwhile, has closed at a new high 18 times.
When we look at two-month windows (42 trading days) and tabulate how many 52-week highs the S&P 500 scored without any concurrent new highs in the A/D Line, this is the widest divergence in 25 years.
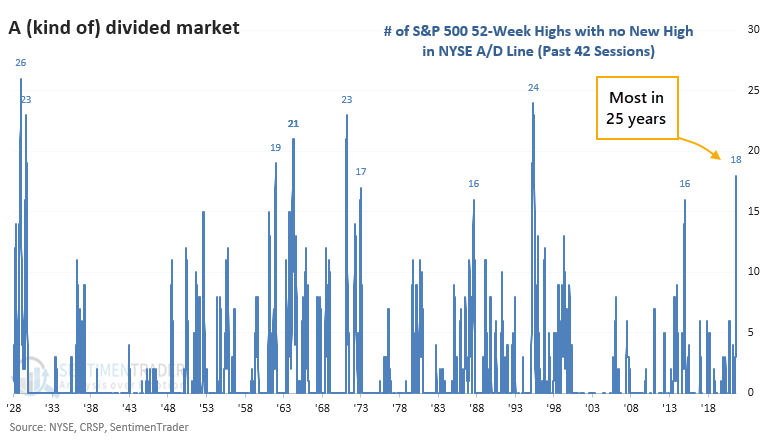
NOT A GREAT SIGN, WITH A MAJOR EXCEPTION
The last time the S&P scored so many new highs without a new high in the A/D Line was in 1995, which preceded one of the greatest runs in stock market history. It also triggered before a nice rally in 1964 (which ultimately failed). The other precedents, though, were not nearly as kind.
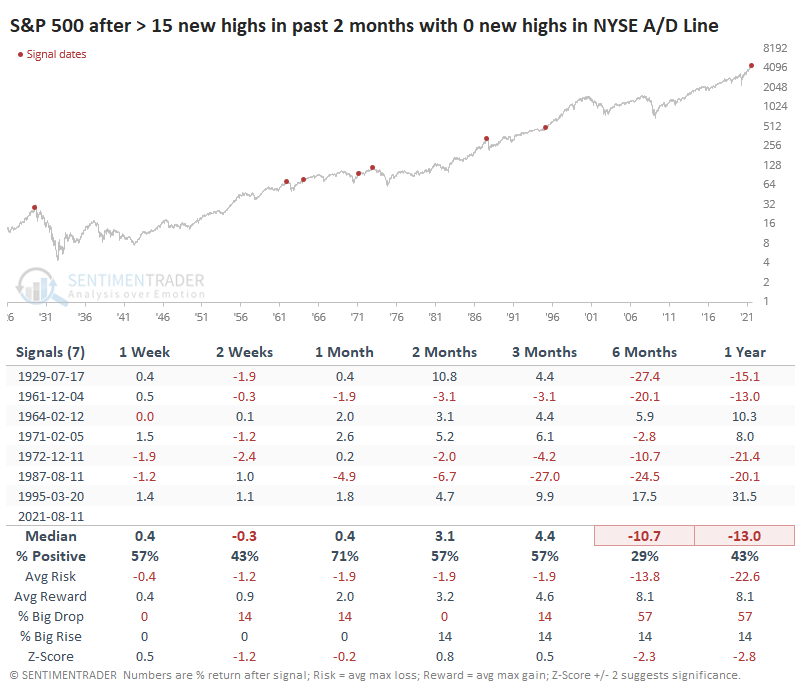
While the S&P managed to hold up most of the time over the medium-term, it ran into trouble over the next 6-12 months after 5 of the 7 signals.
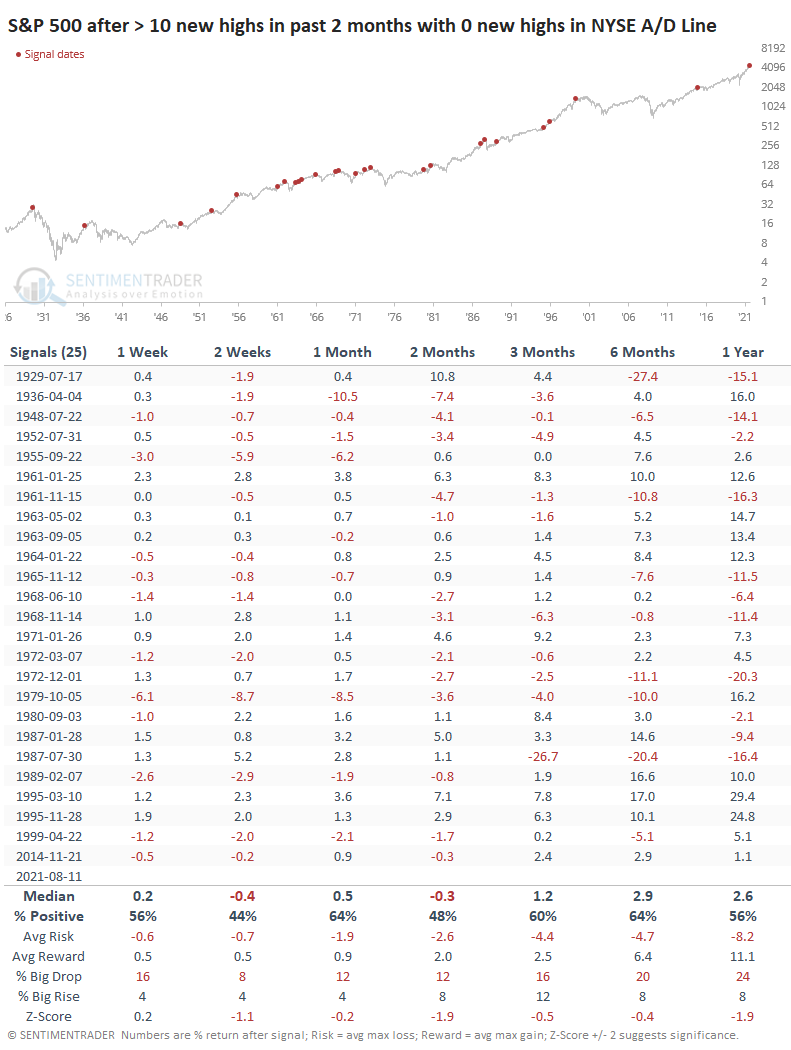
If we relax the parameters to generate a larger sample size, then lesser divergences showed weak returns across all time frames, with tepid average returns, risk/reward ratios, and probabilities of a big drop vs. a big rise.
This is in direct contrast to the momentum-based price action we looked at several times last week. Nobody said markets were easy, and this is one of the more difficult periods we've witnessed in the past 20 years, with some wild cross-currents.
It would be better if the pure price momentum in the indexes was being accompanied by similar momentum in many of the breadth metrics. It's not ridiculously egregious like it was in 2000 or even 2015, but it's enough to cast a wary eye over the short- to medium-term as stocks creep higher with seemingly no repercussions.
Also, keep an eye on the (slightly) diverging Cumulative A/D Line for high-yield bonds, often a leading indicator for the stock market. And the weakening net percentage of bonds hitting 52 highs - 52 lows. When that's negative, stocks don't do great.
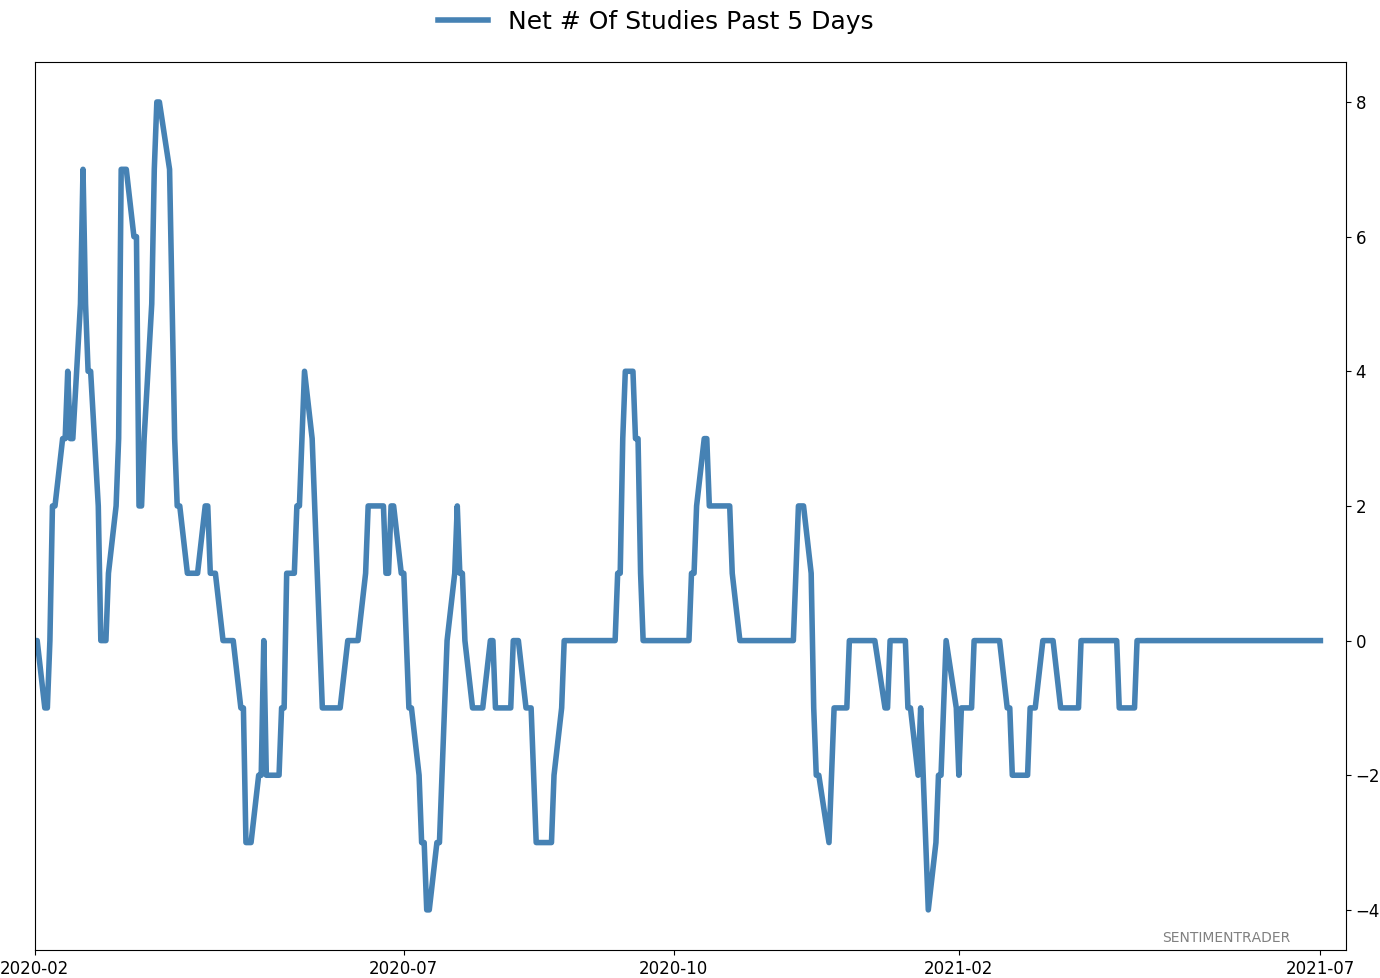
Active Studies
| Time Frame | Bullish | Bearish | | Short-Term | 0 | 4 | | Medium-Term | 4 | 3 | | Long-Term | 10 | 5 |
|
Indicators at Extremes
Portfolio
| Position | Description | Weight % | Added / Reduced | Date | | Stocks | RSP | 4.1 | Added 4.1% | 2021-05-19 | | Bonds | 23.9% BND, 6.9% SCHP | 30.7 | Reduced 7.1% | 2021-05-19 | | Commodities | GCC | 2.6 | Reduced 2.1%
| 2020-09-04 | | Precious Metals | GDX | 5.6 | Reduced 4.2% | 2021-05-19 | | Special Situations | 4.3% XLE, 2.2% PSCE | 7.6 | Reduced 5.6% | 2021-04-22 | | Cash | | 49.4 | | |
|
Updates (Changes made today are underlined)
Much of our momentum and trend work has remained positive for several months, with some scattered exceptions. Almost all sentiment-related work has shown a poor risk/reward ratio for stocks, especially as speculation drove to record highs in exuberance in February. Much of that has worn off, and most of our models are back toward neutral levels. There isn't much to be excited about here. The same goes for bonds and even gold. Gold has been performing well lately and is back above long-term trend lines. The issue is that it has a poor record of holding onto gains when attempting a long-term trend change like this, so we'll take a wait-and-see approach. RETURN YTD: 8.4% 2020: 8.1%, 2019: 12.6%, 2018: 0.6%, 2017: 3.8%, 2016: 17.1%, 2015: 9.2%, 2014: 14.5%, 2013: 2.2%, 2012: 10.8%, 2011: 16.5%, 2010: 15.3%, 2009: 23.9%, 2008: 16.2%, 2007: 7.8%
|
|
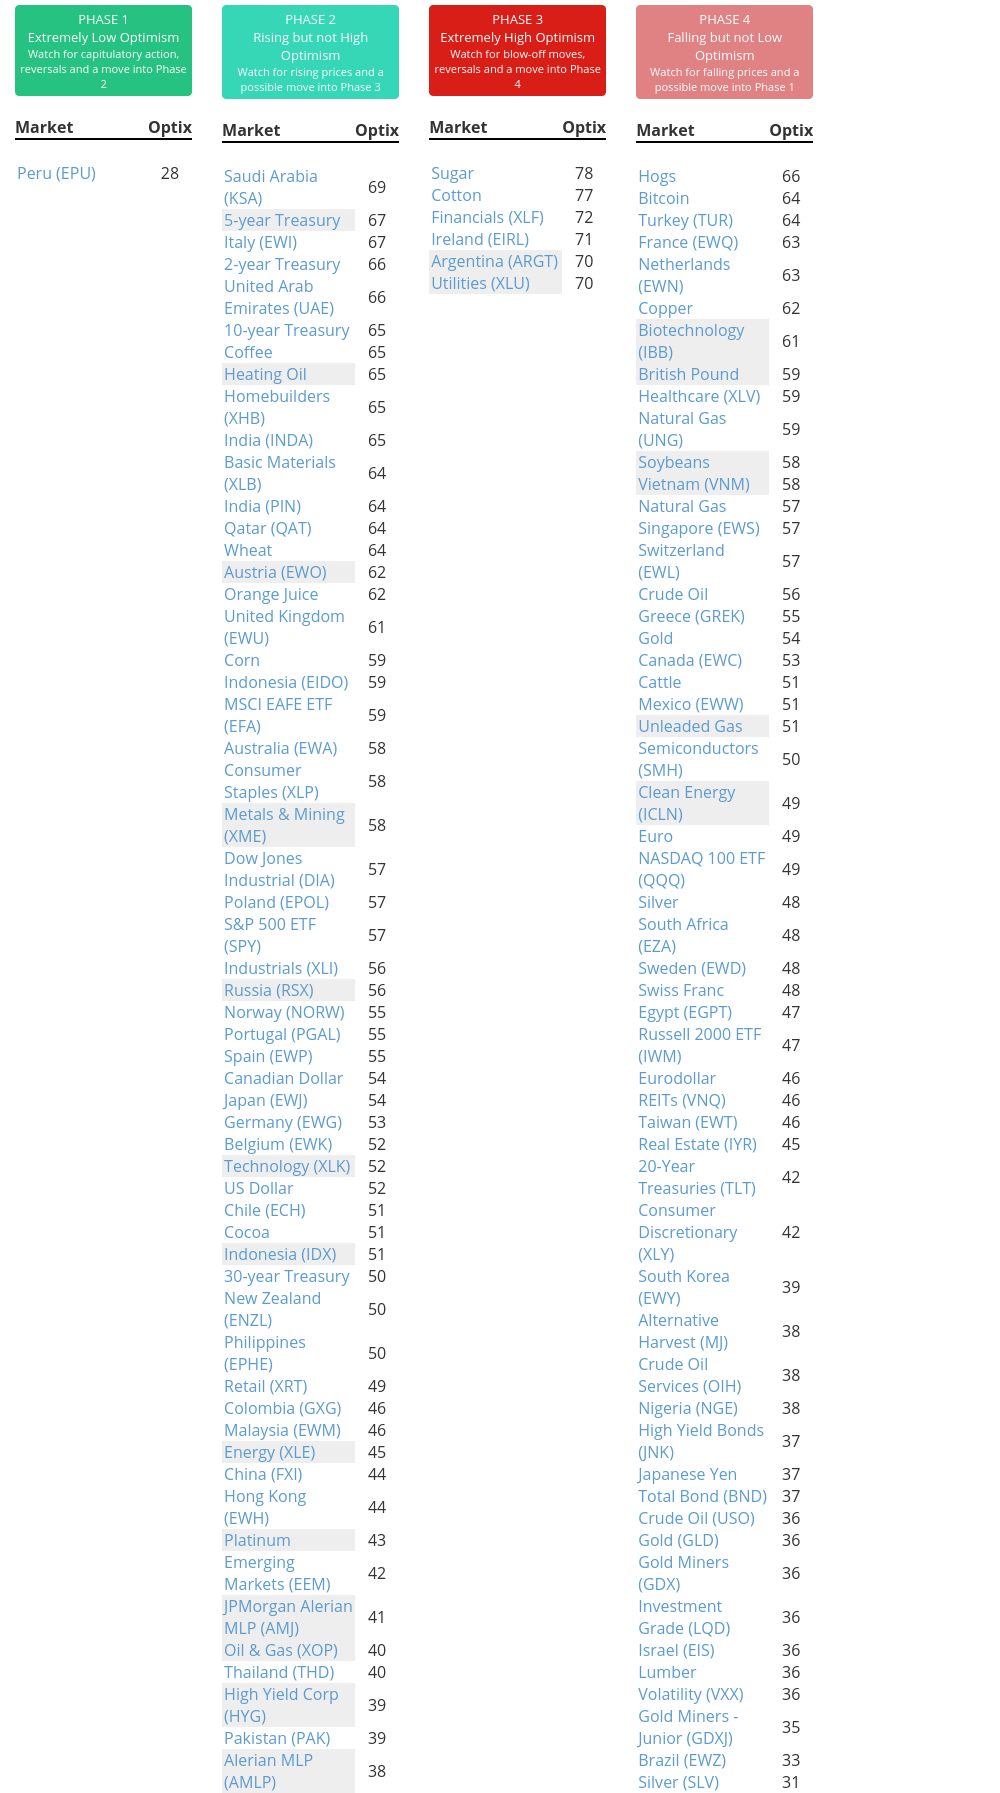
Phase Table
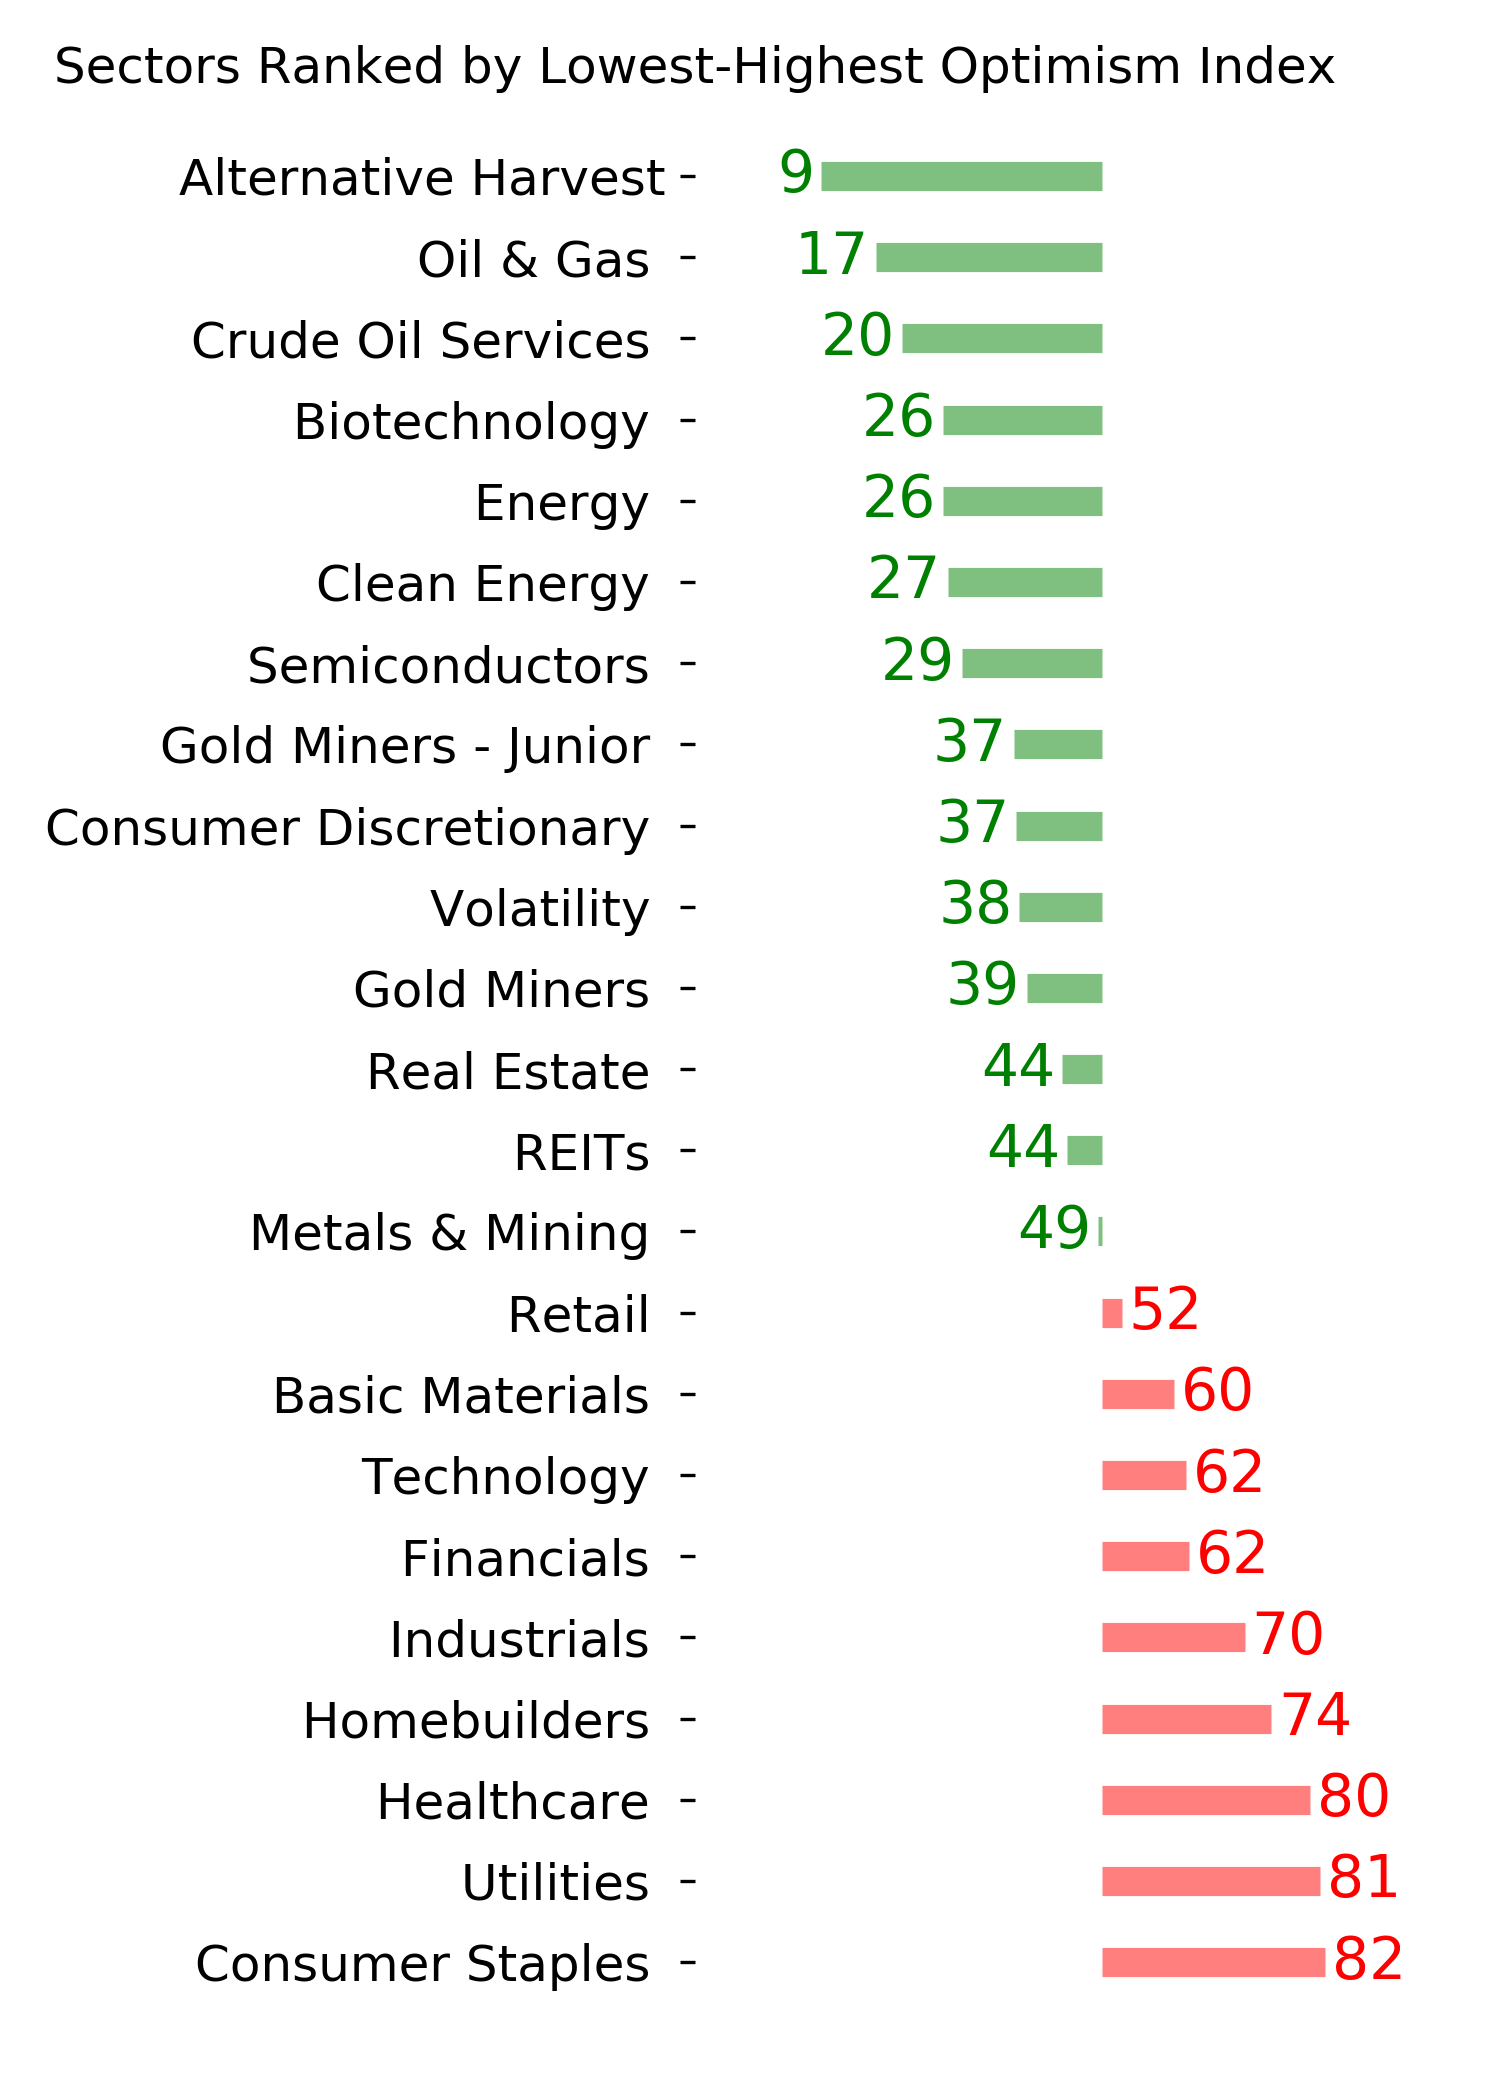
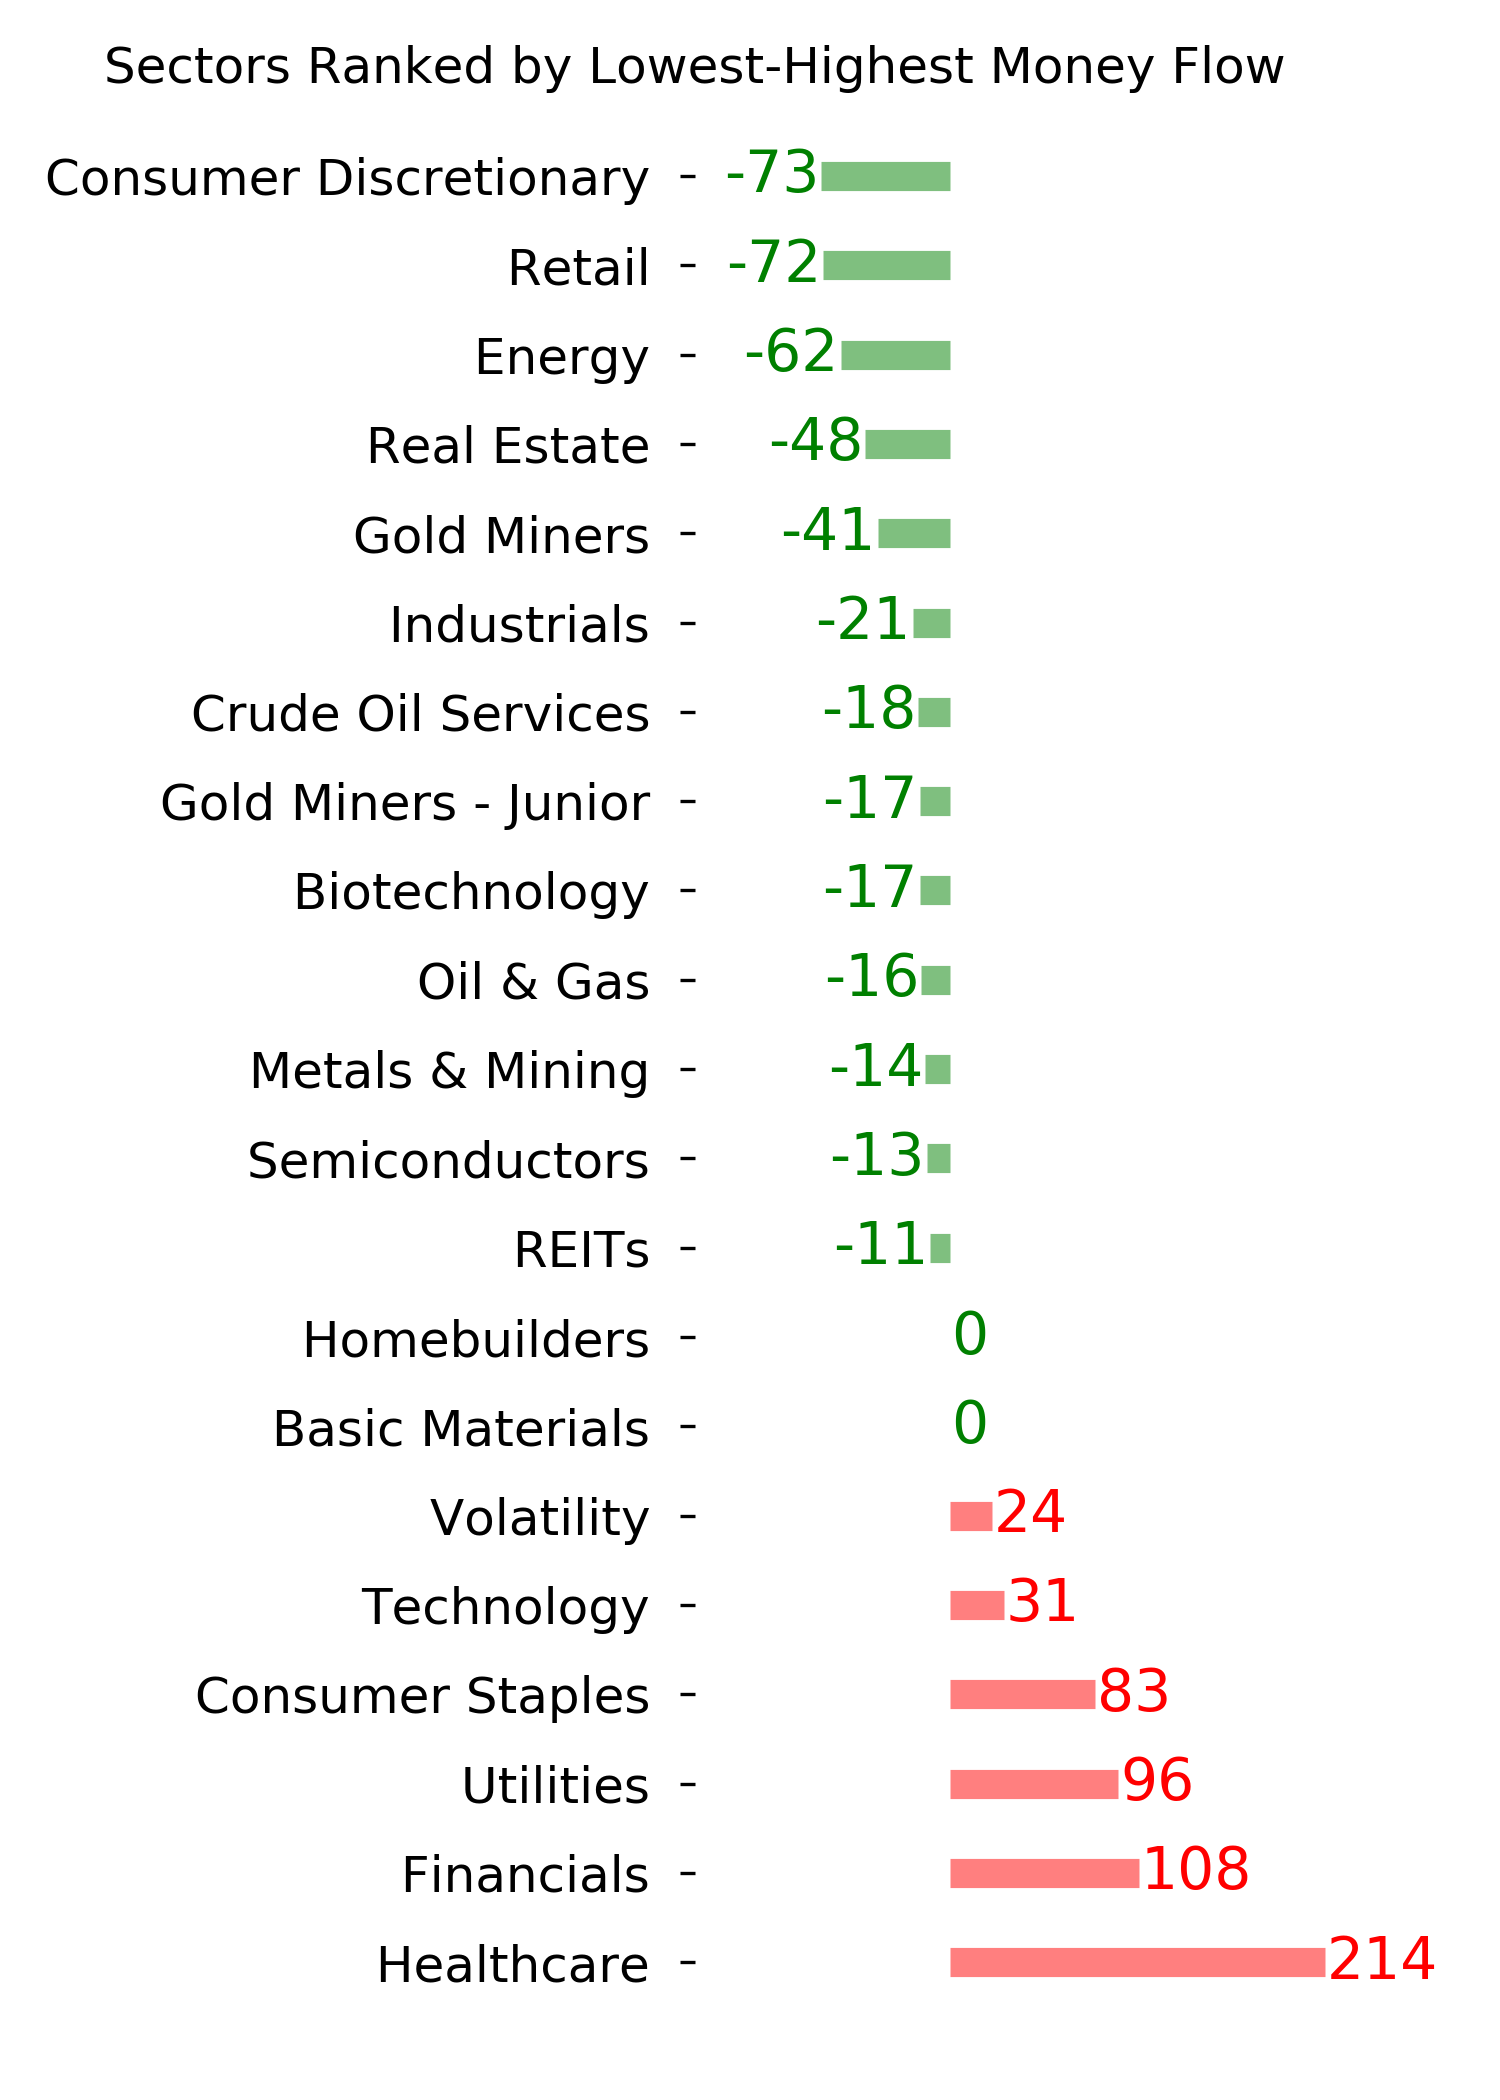
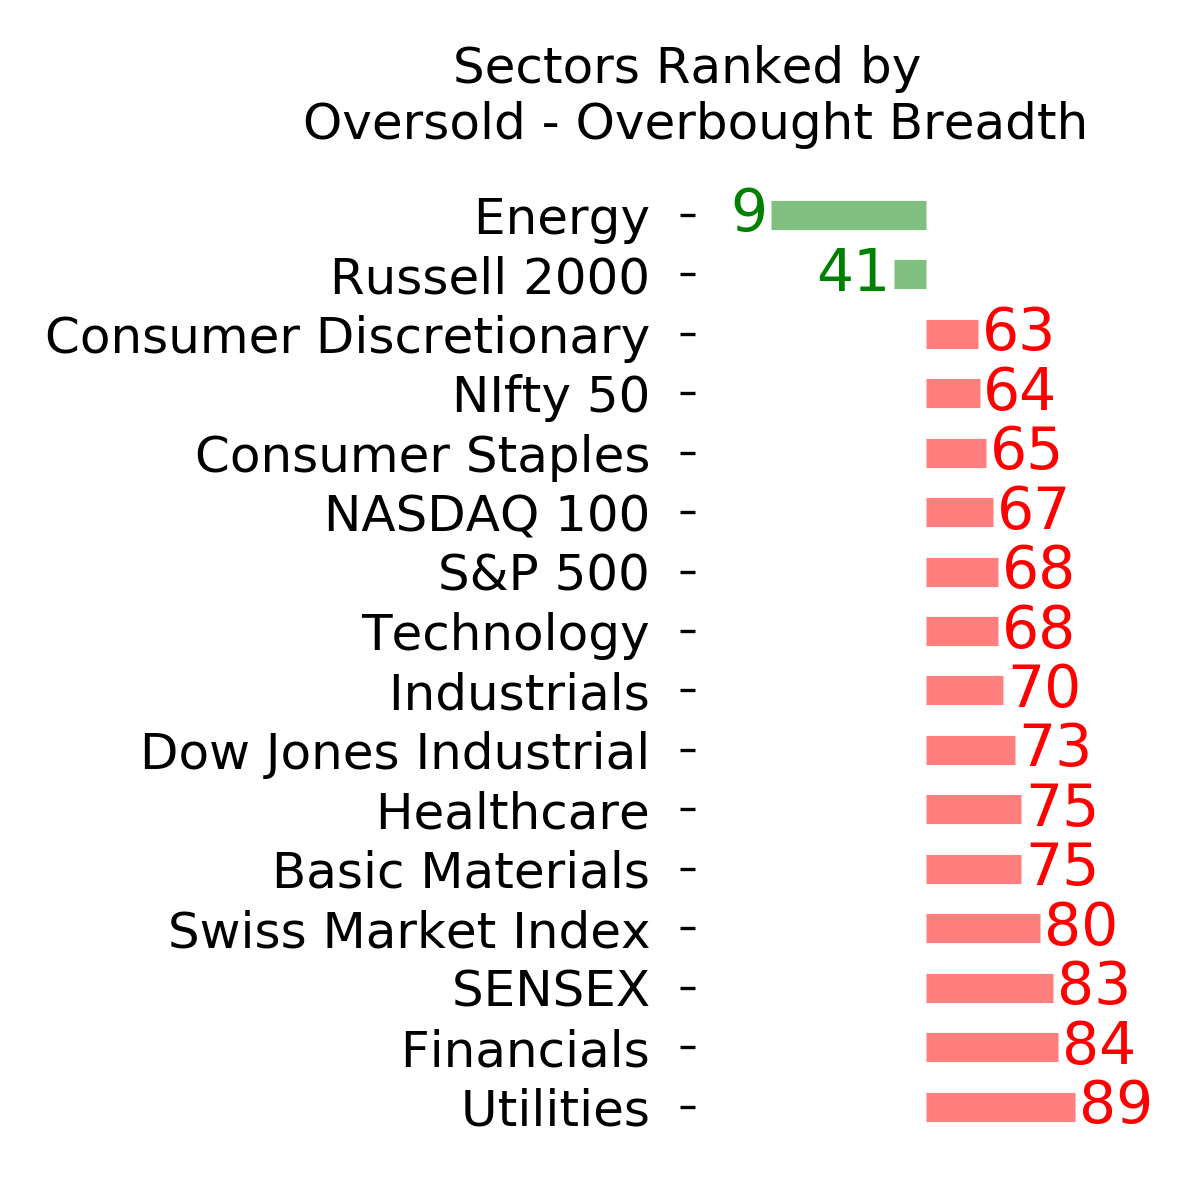
Ranks
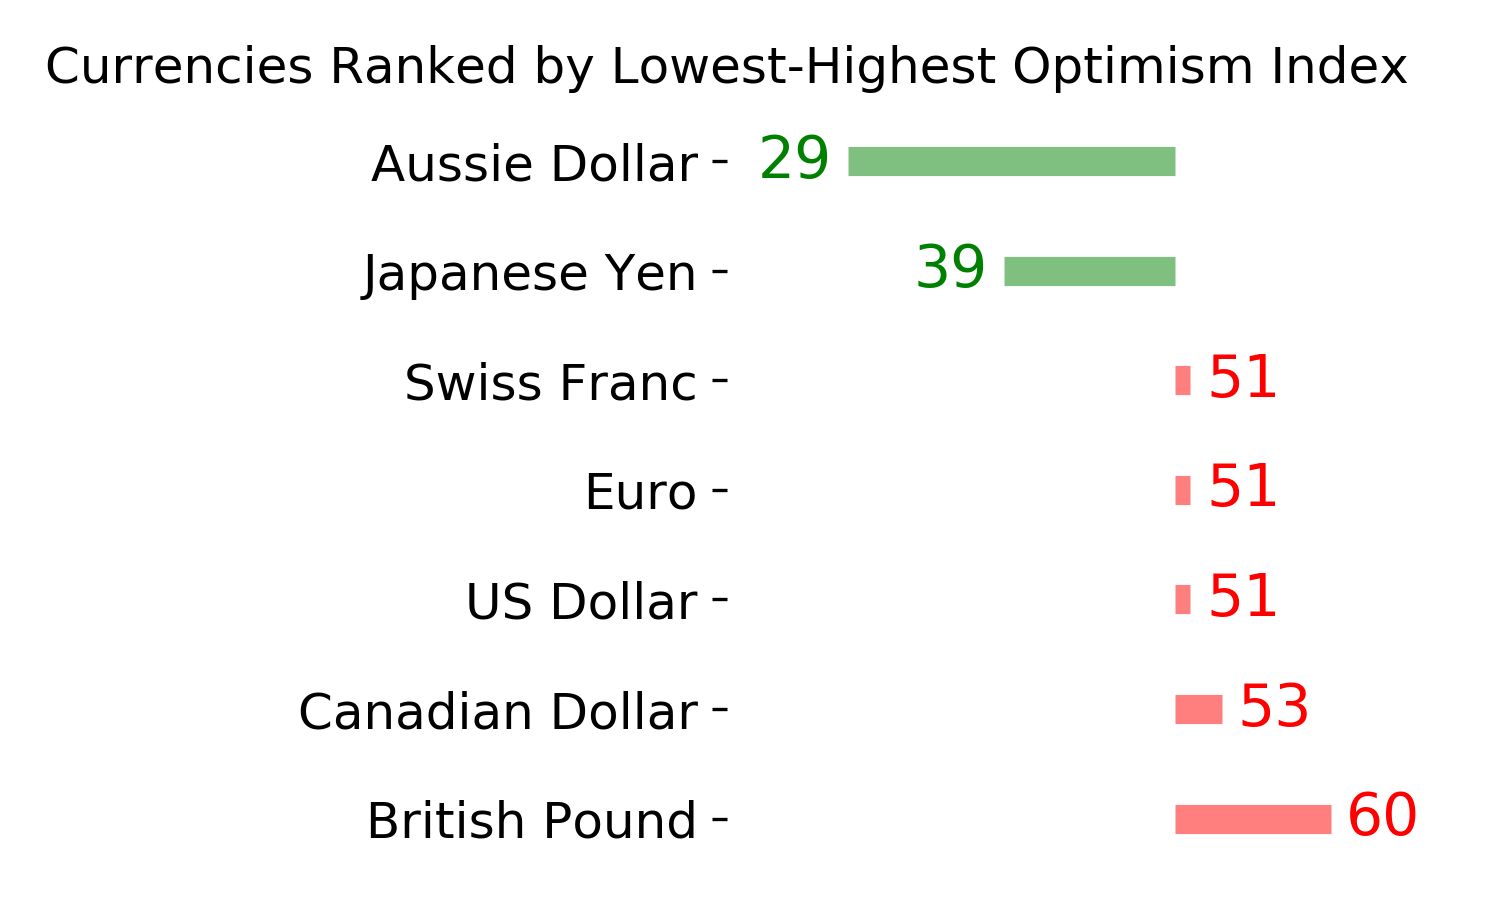
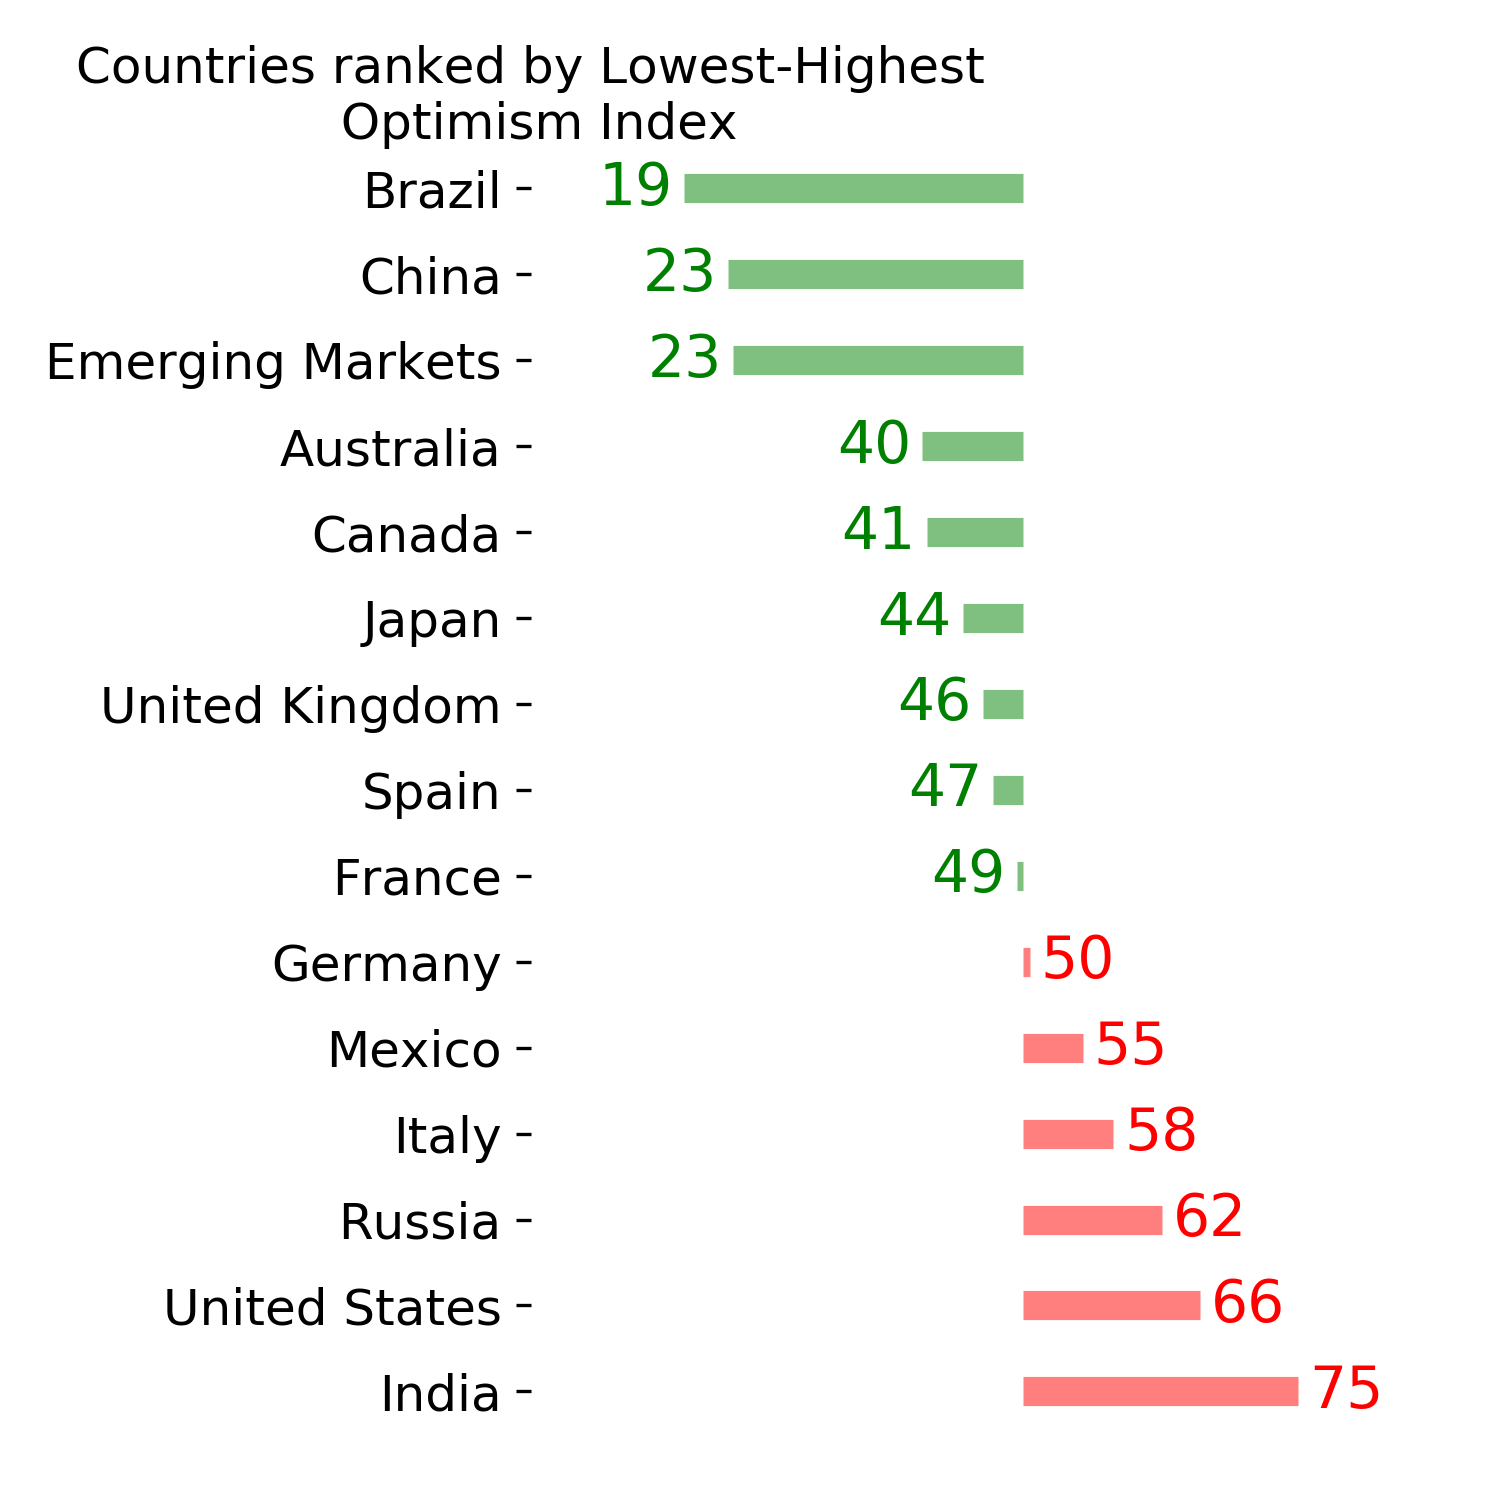
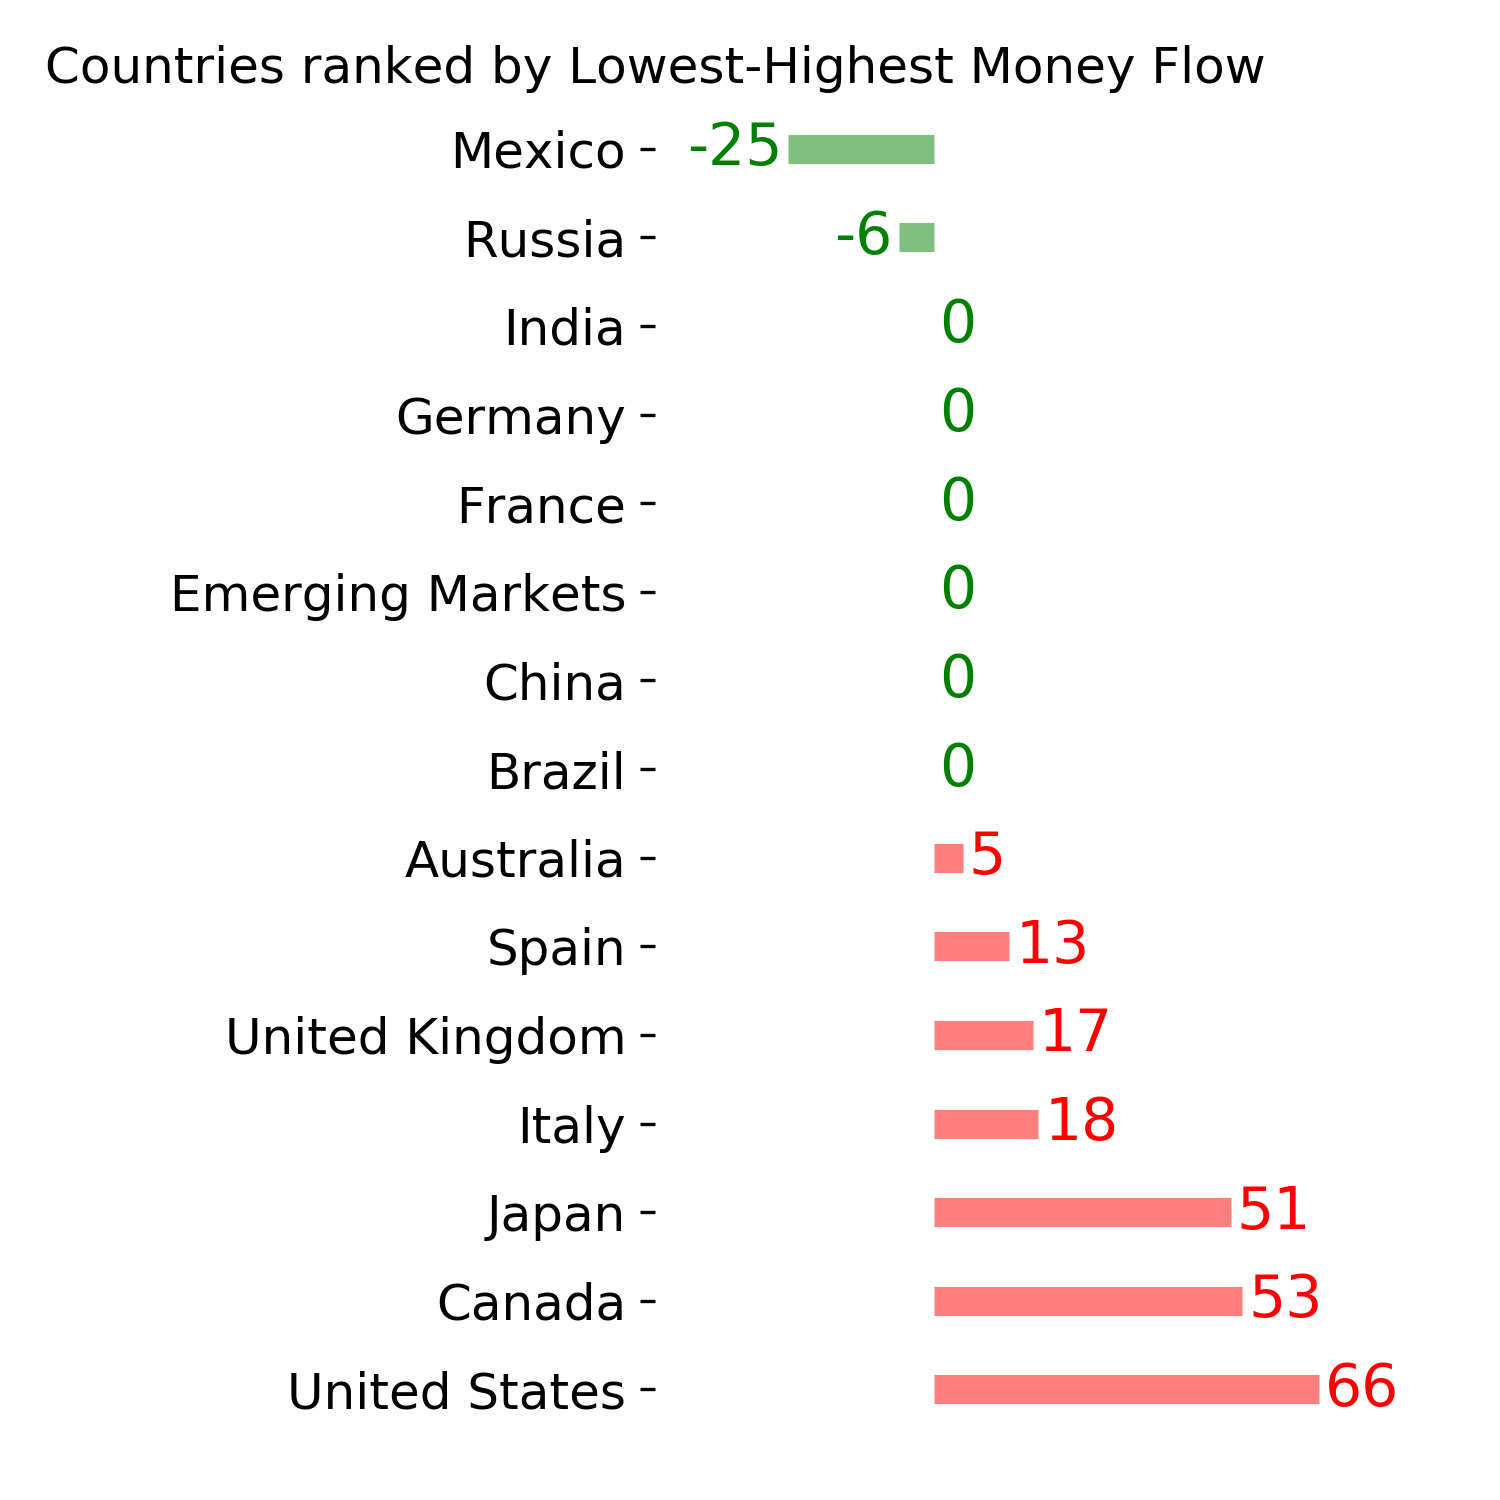
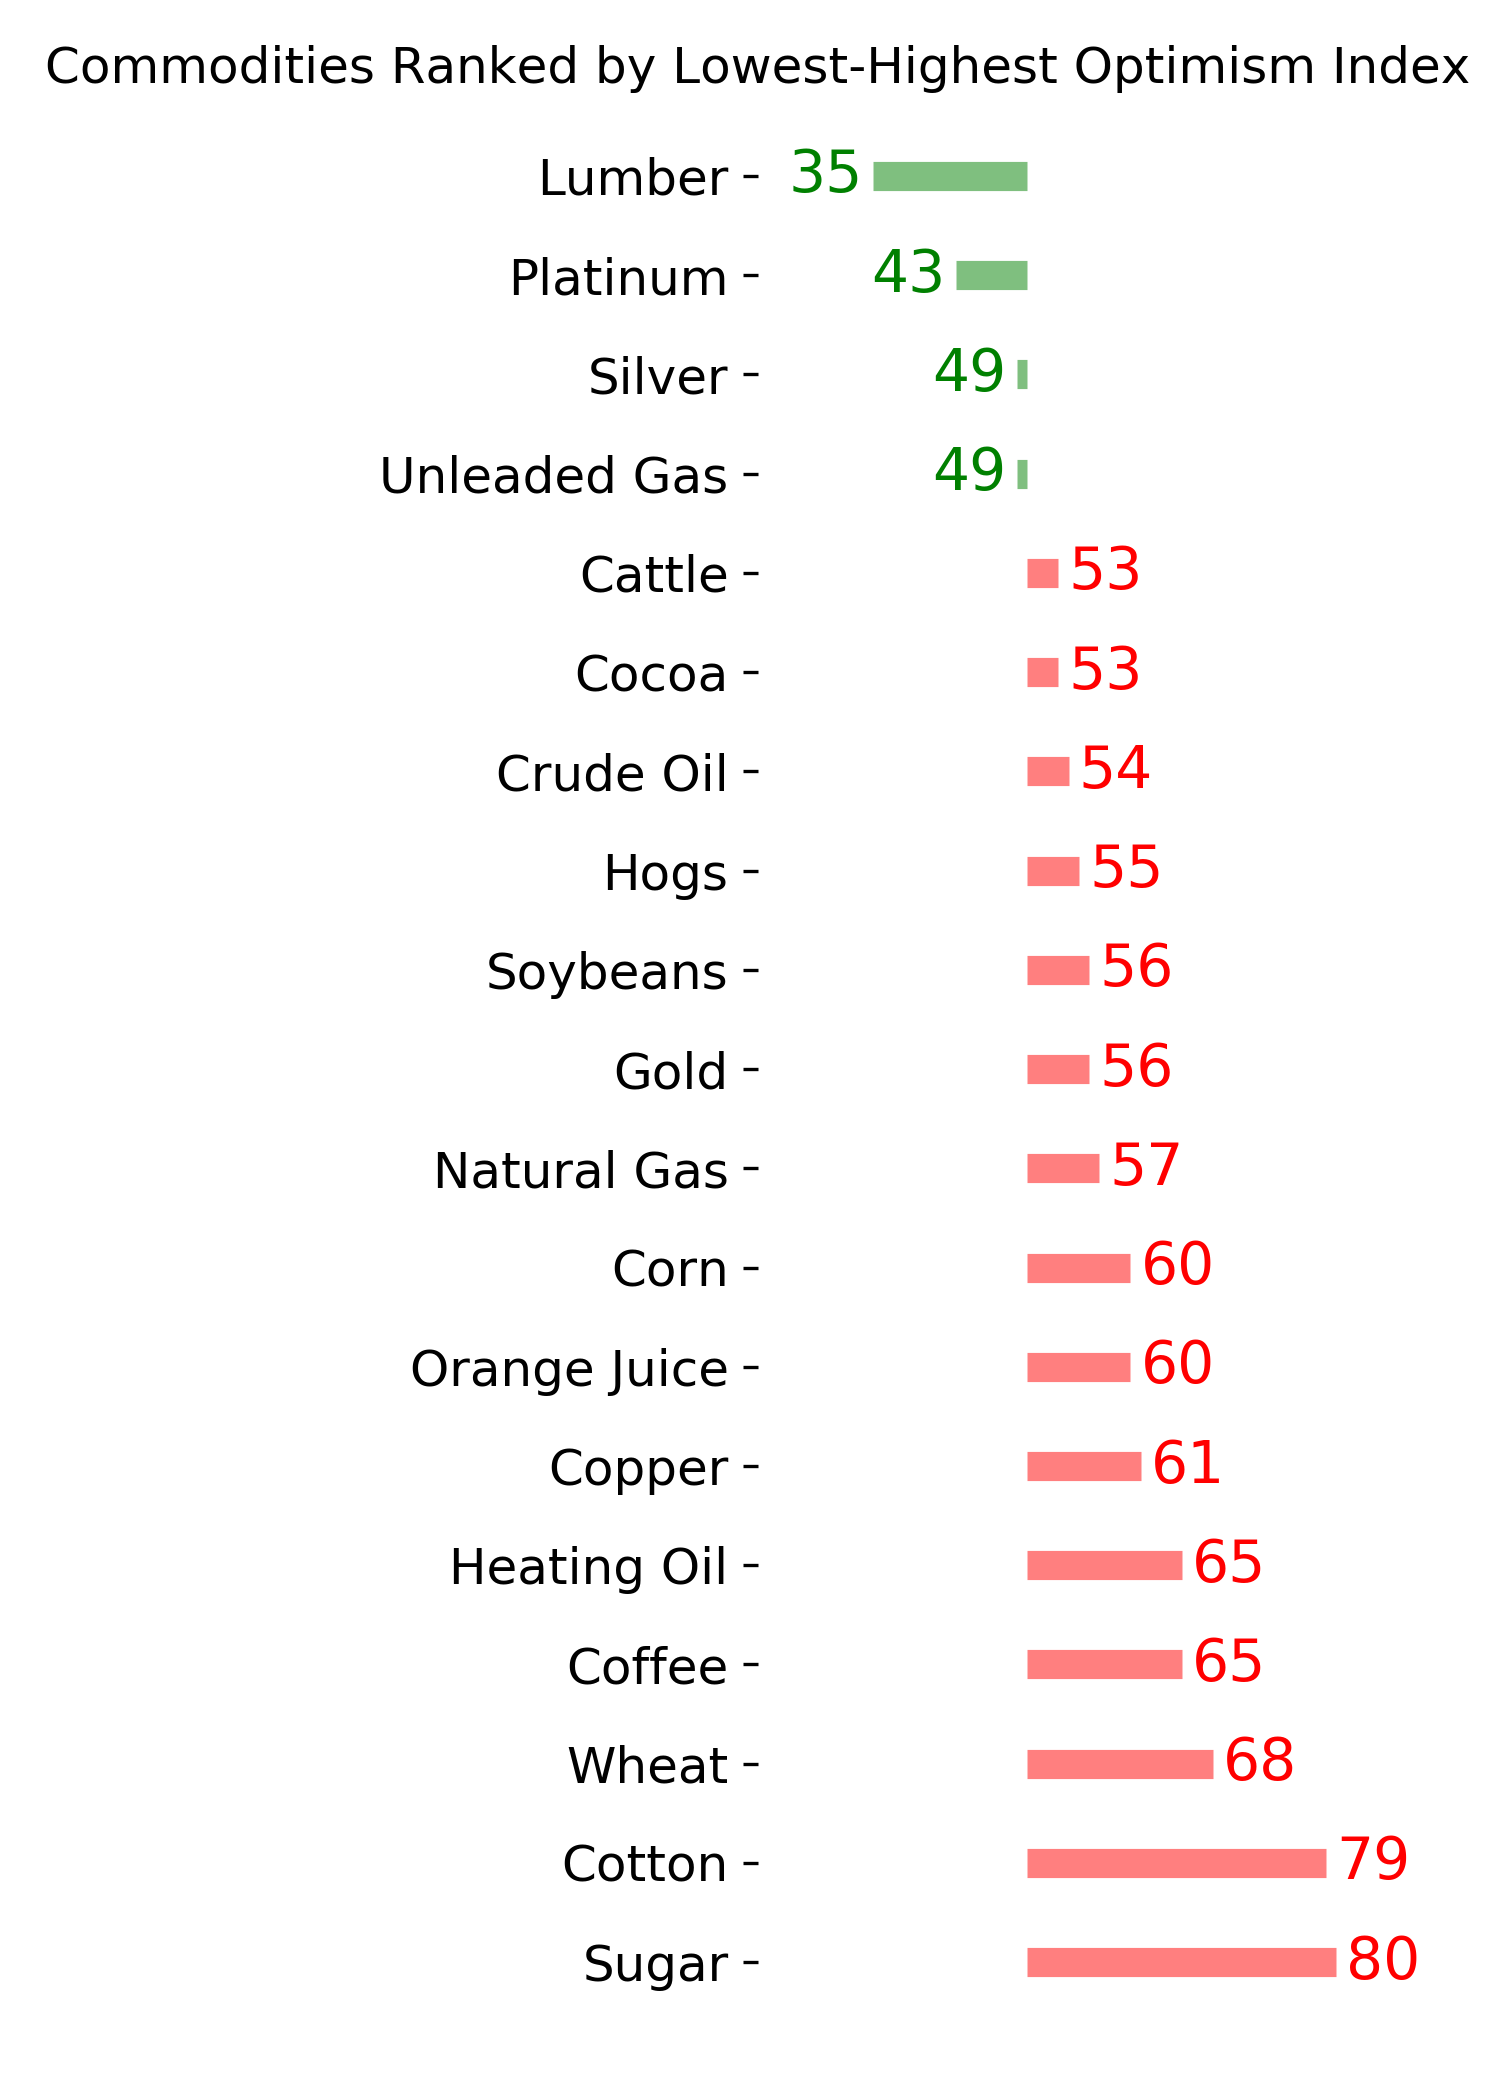
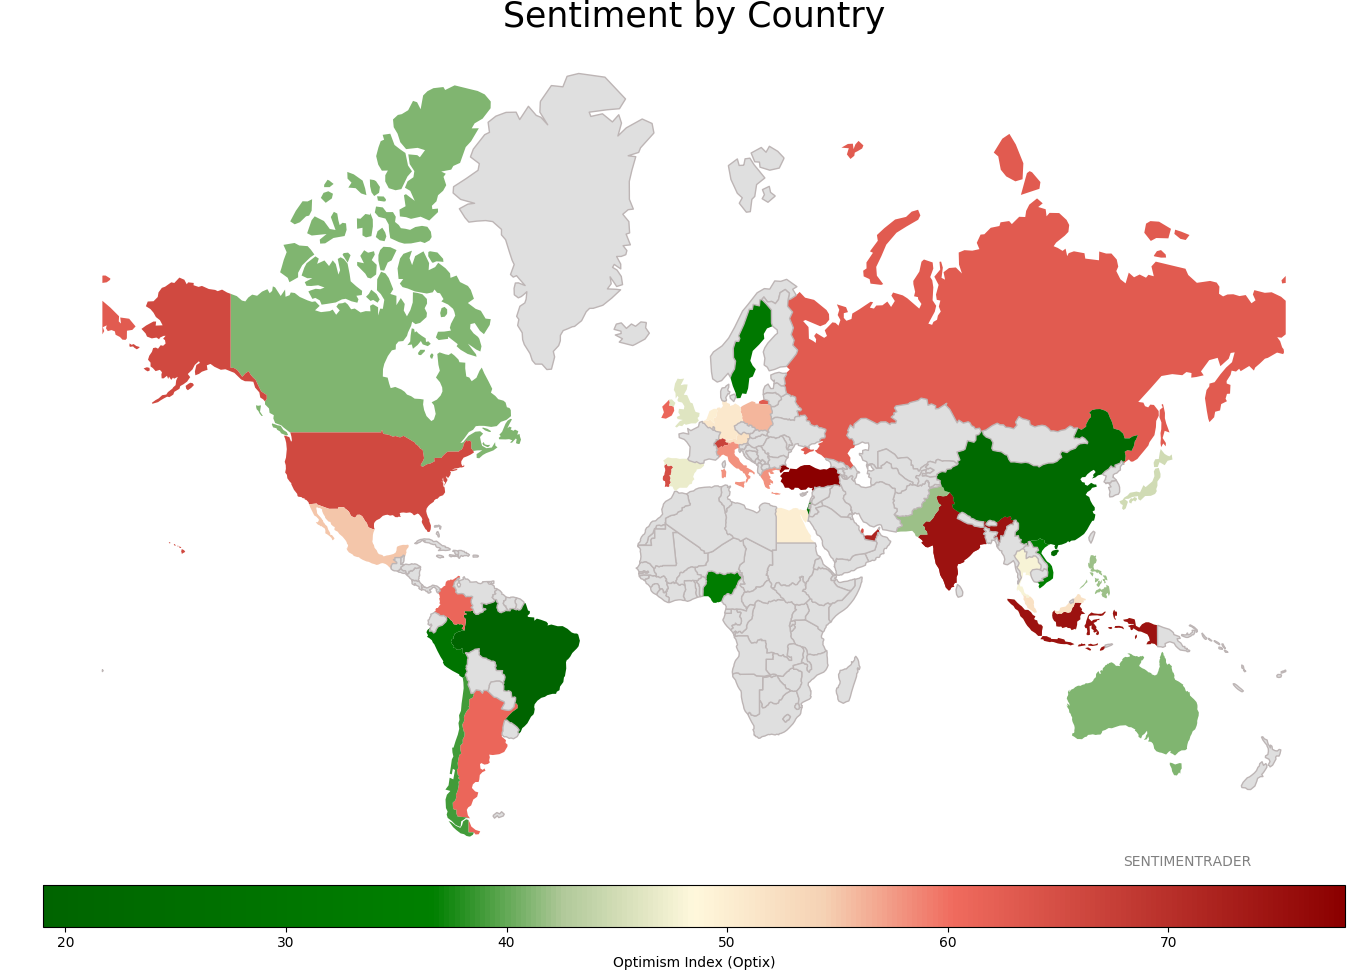
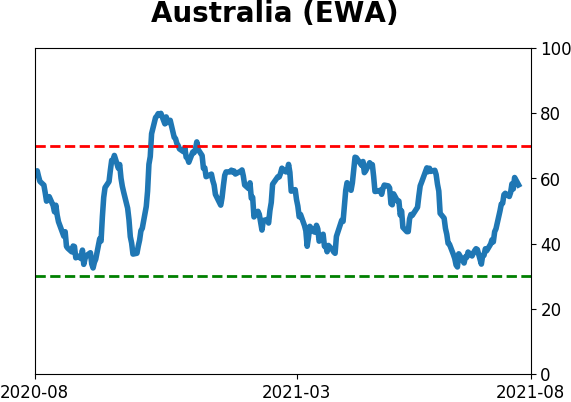
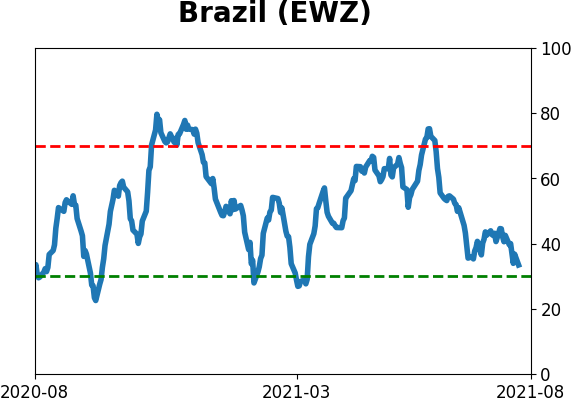
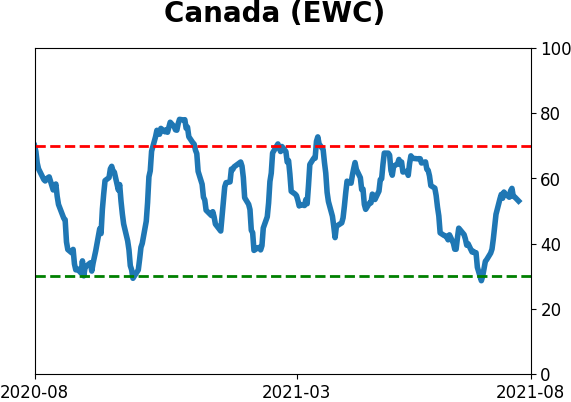
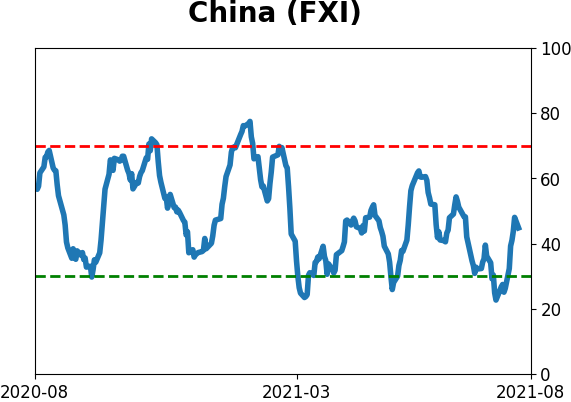
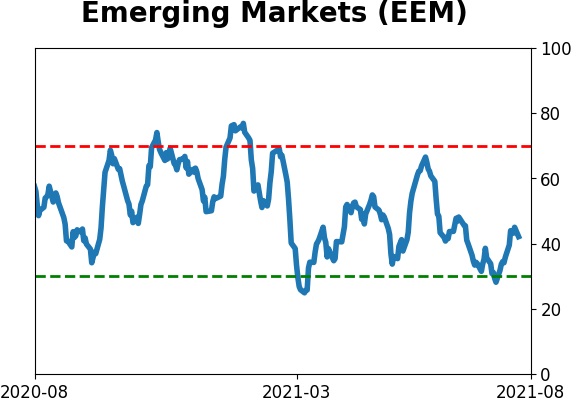
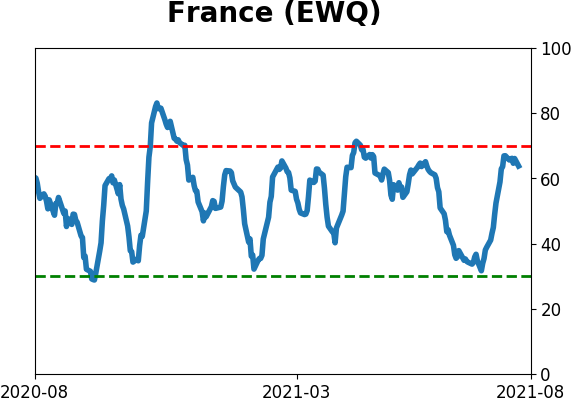
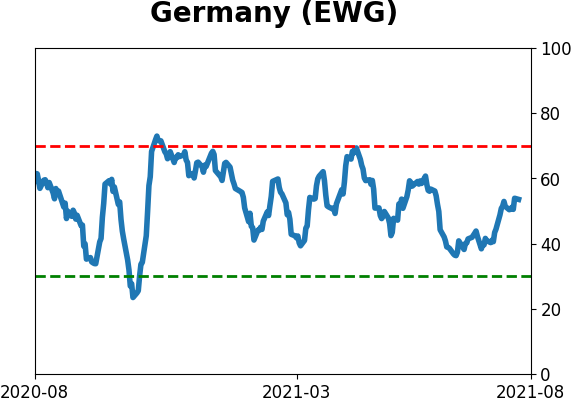
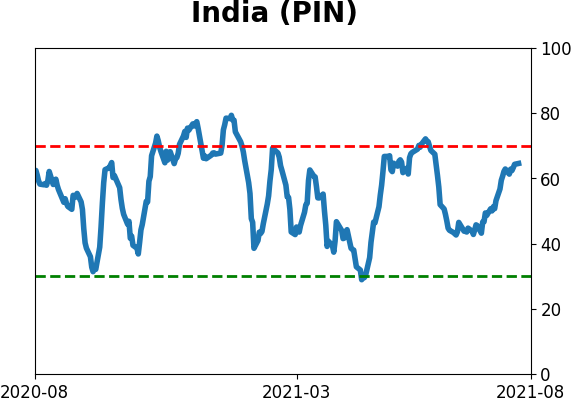
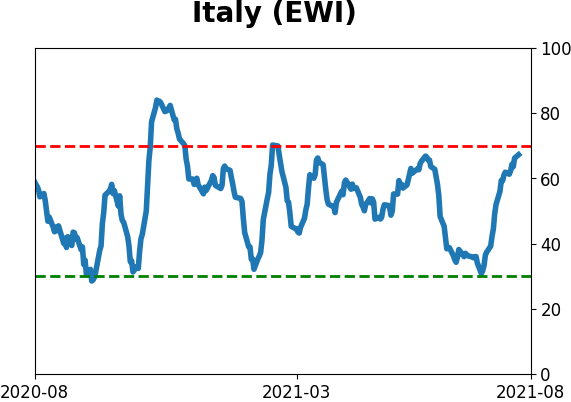
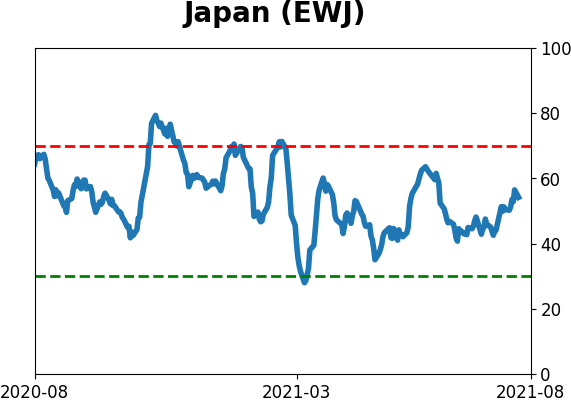
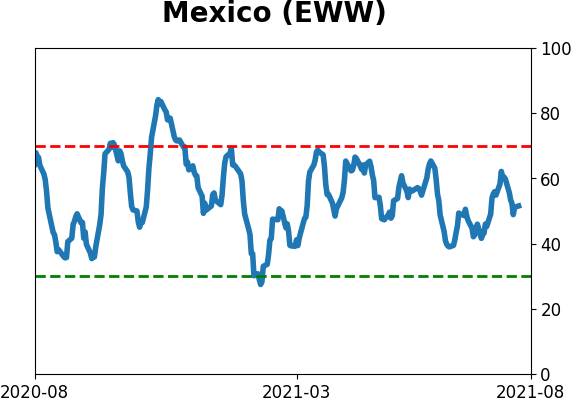
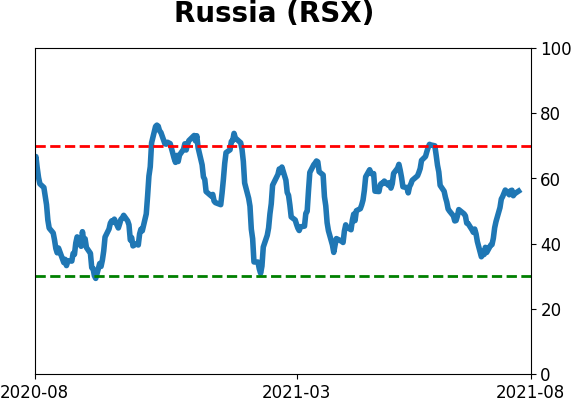
Sentiment Around The World
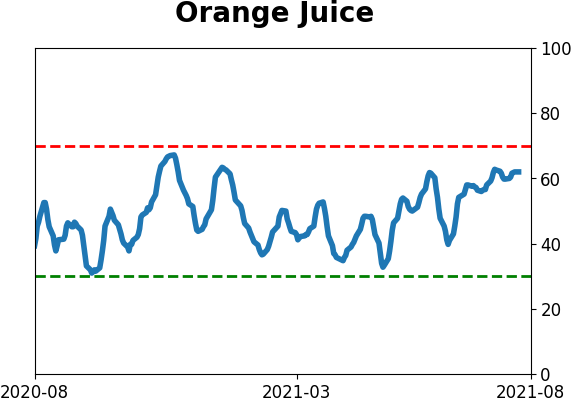
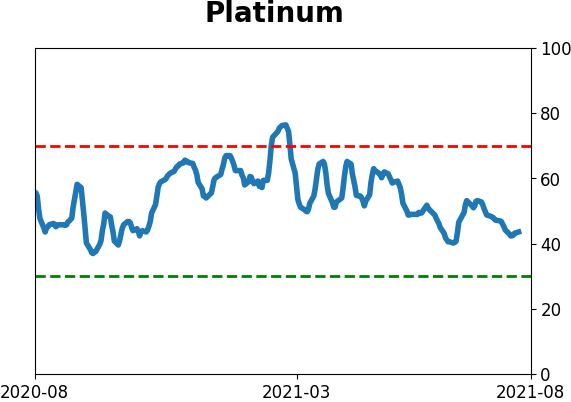
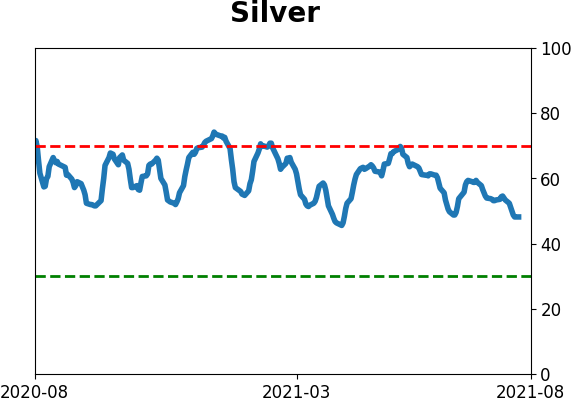
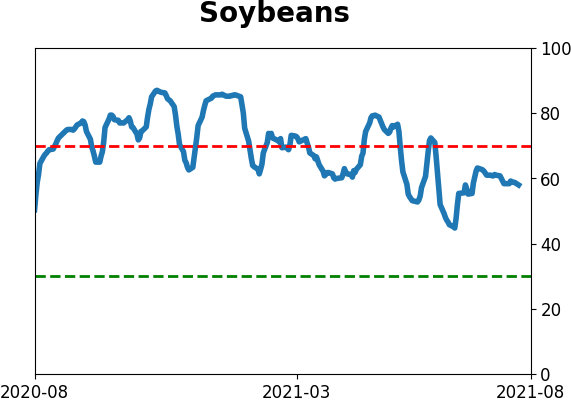
Optimism Index Thumbnails
|
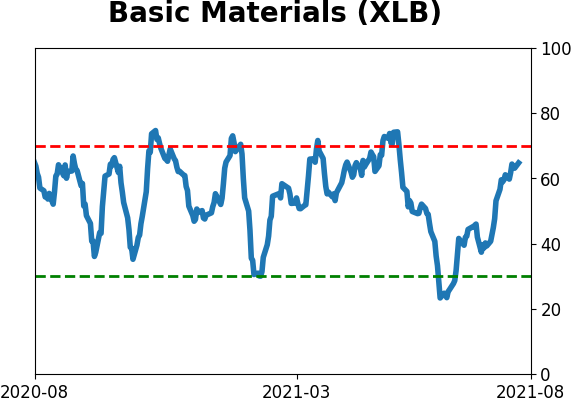
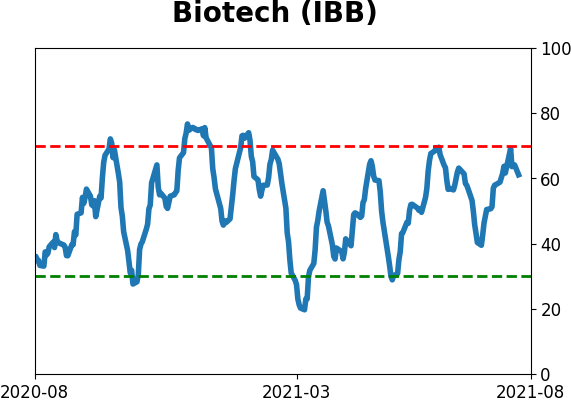
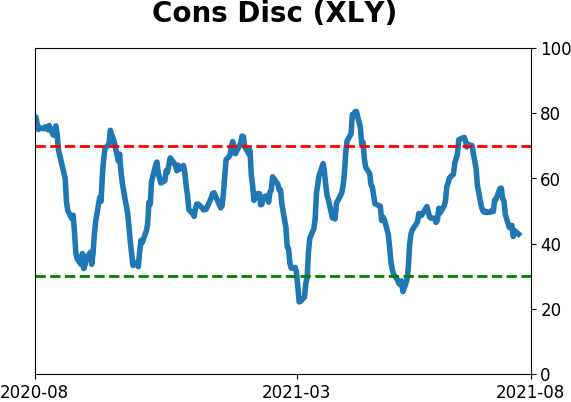
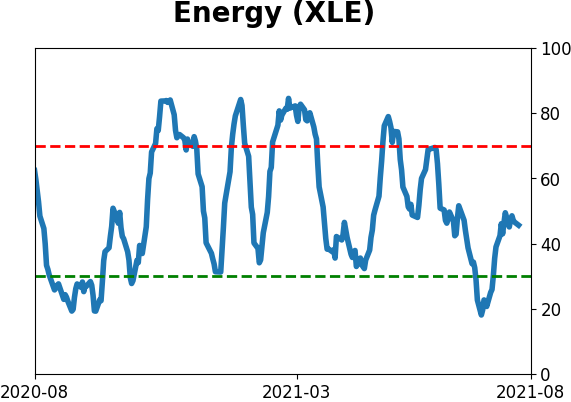
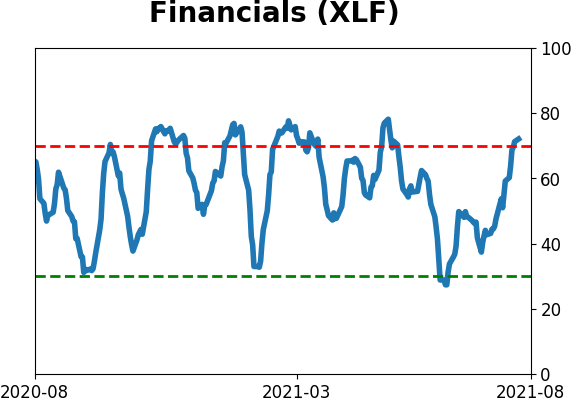
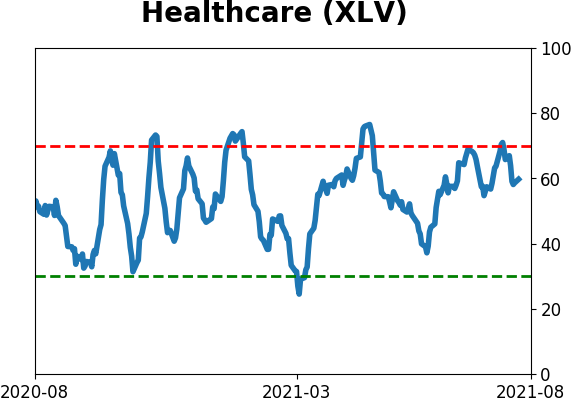
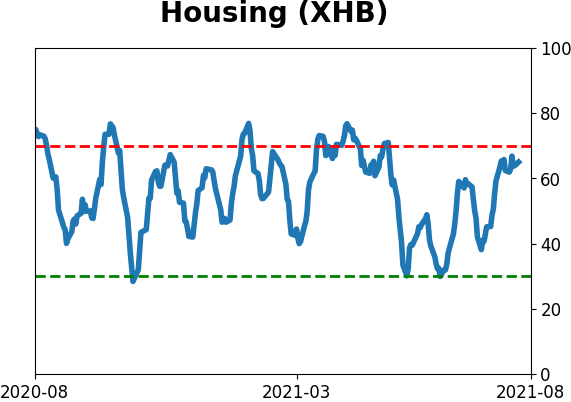
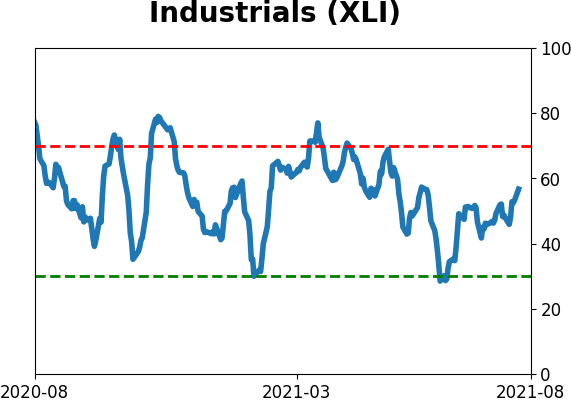
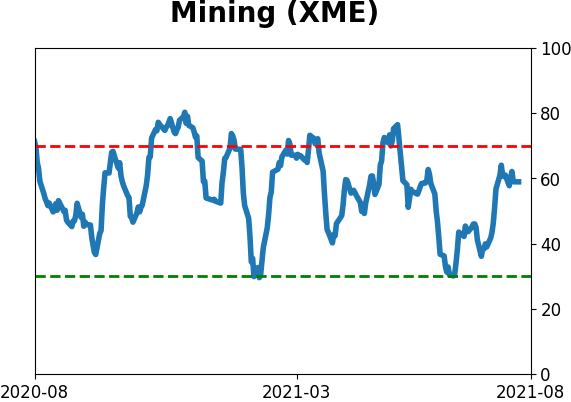
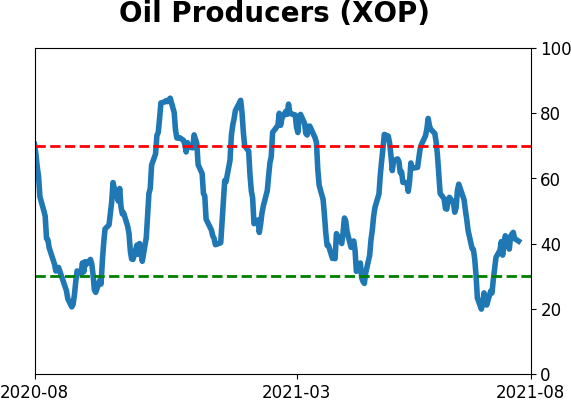
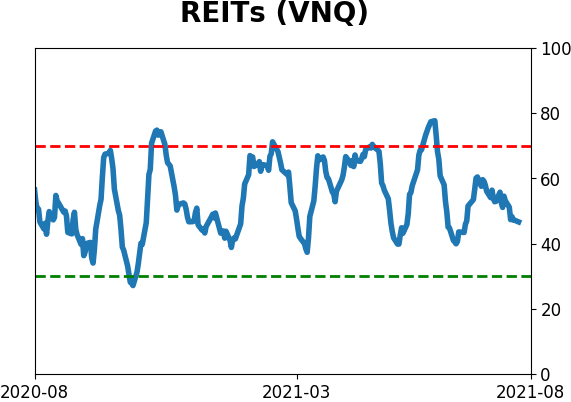
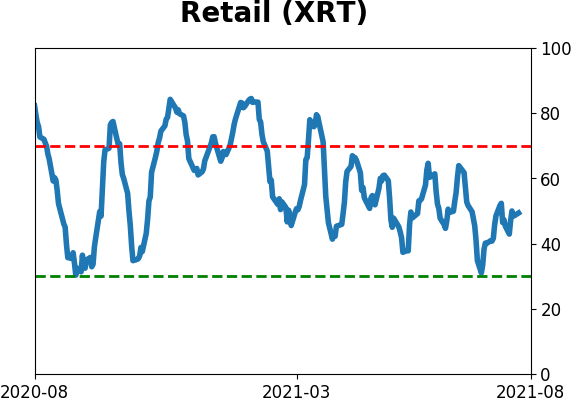
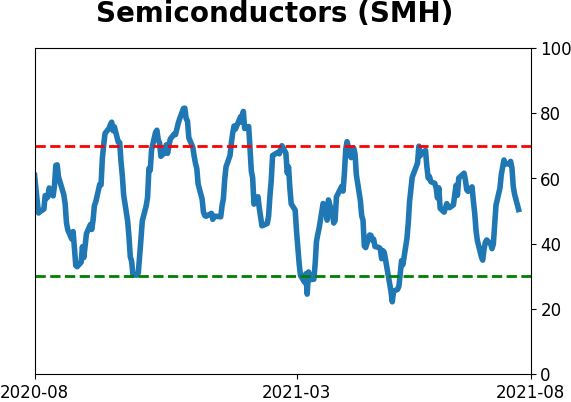
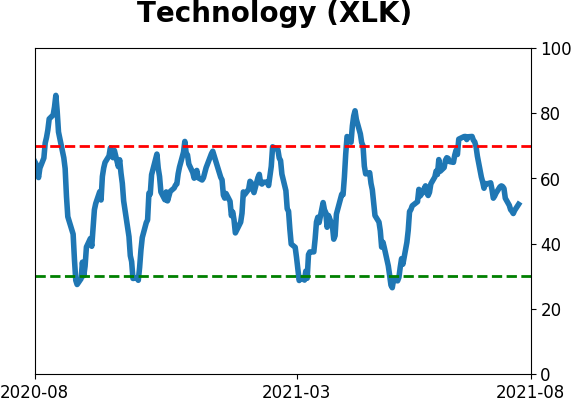
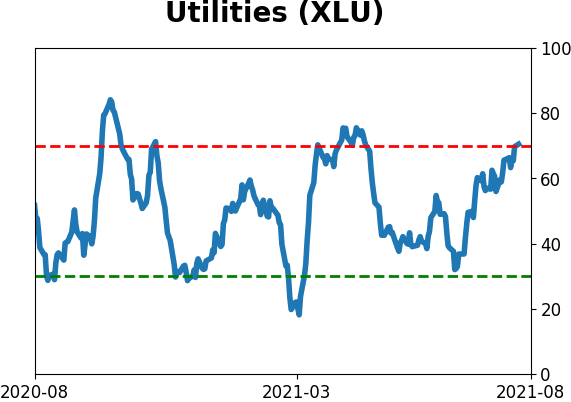
Sector ETF's - 10-Day Moving Average
|
|
|
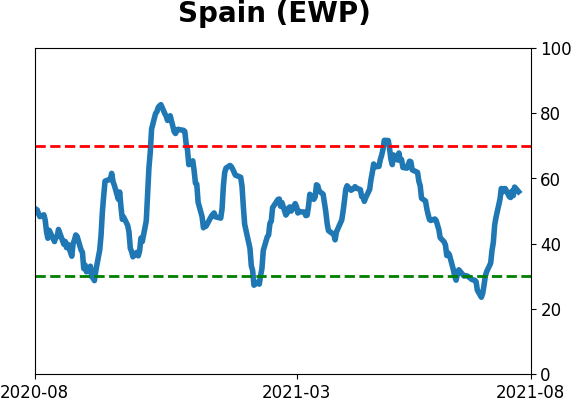
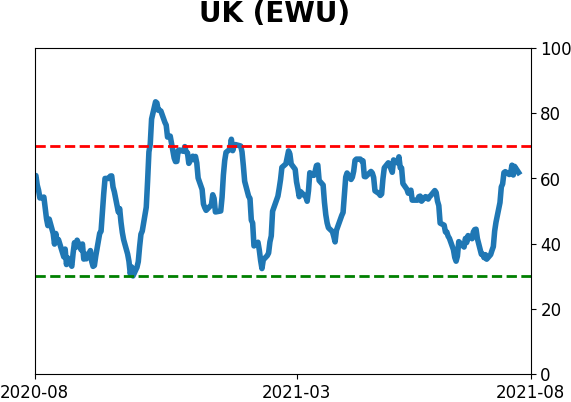
Country ETF's - 10-Day Moving Average
|
|
|
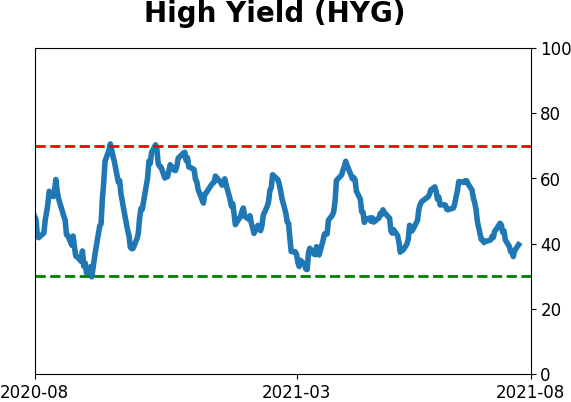
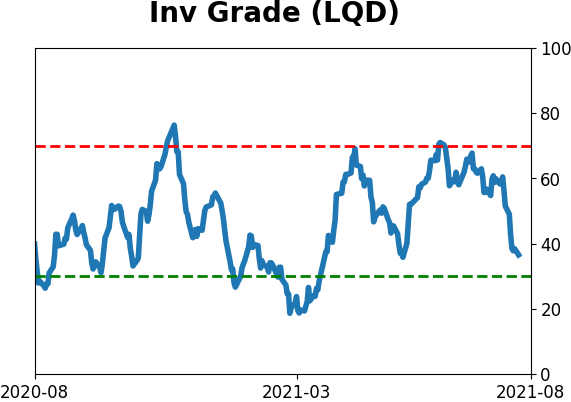
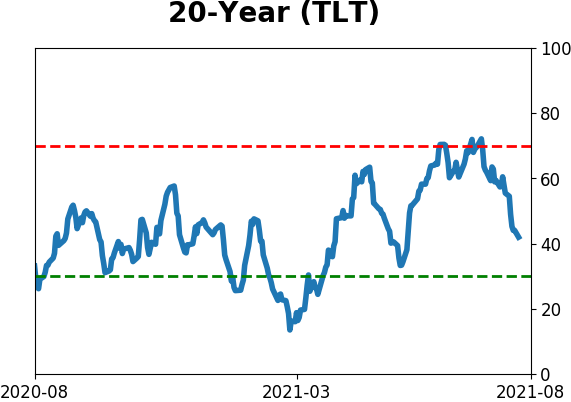
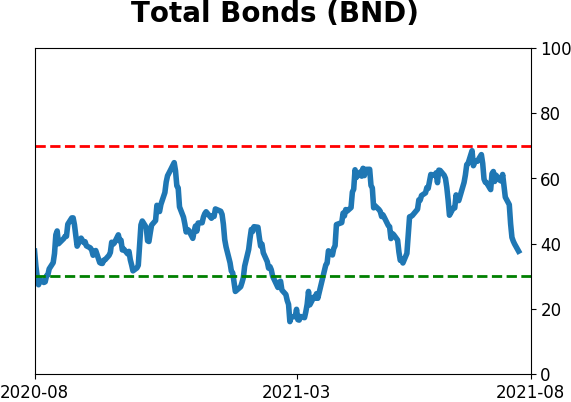
Bond ETF's - 10-Day Moving Average
|
|
|
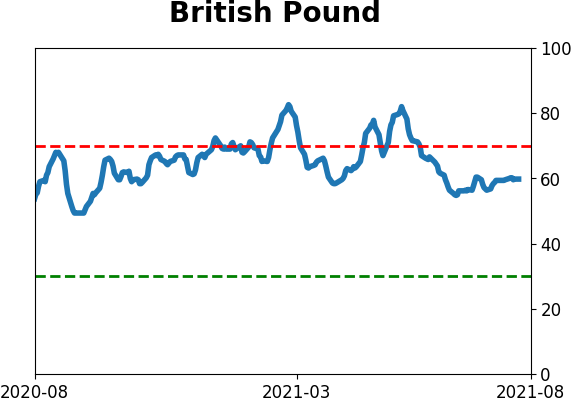
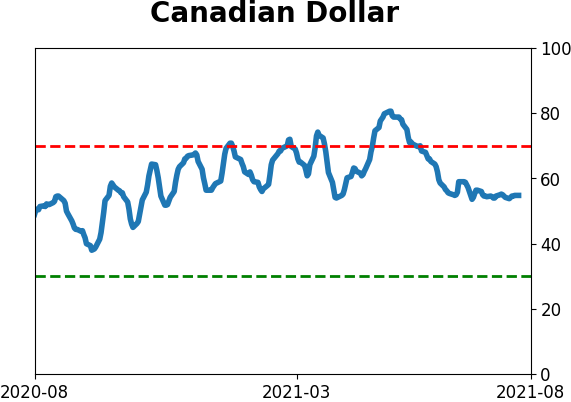
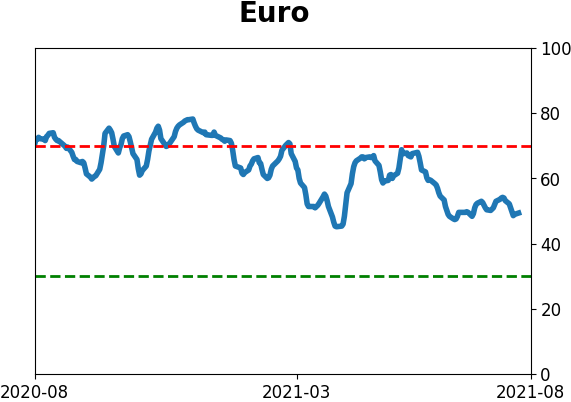
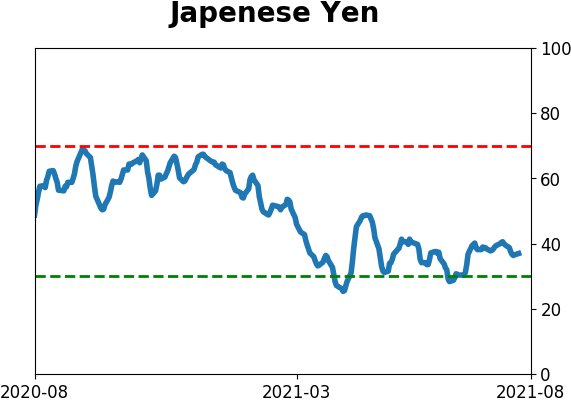
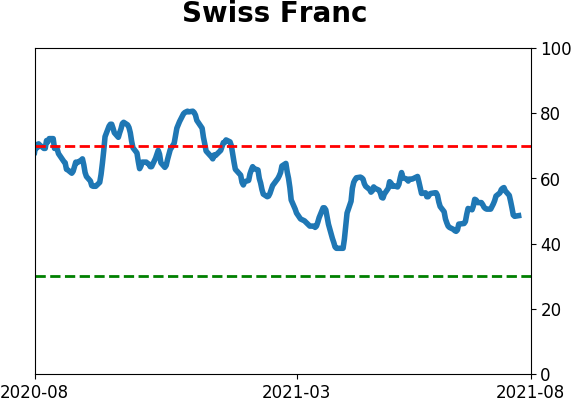
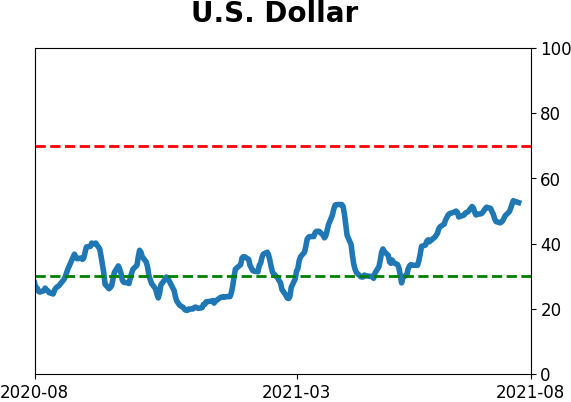
Currency ETF's - 5-Day Moving Average
|
|
|
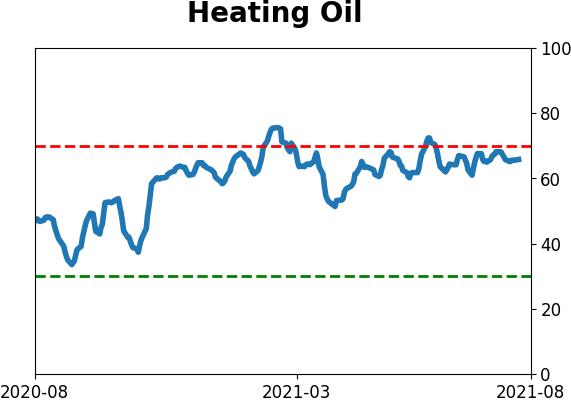
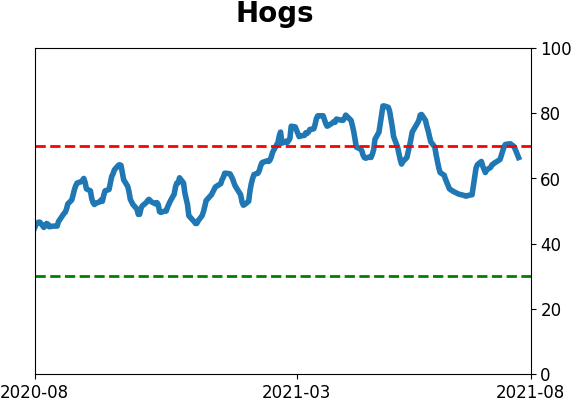
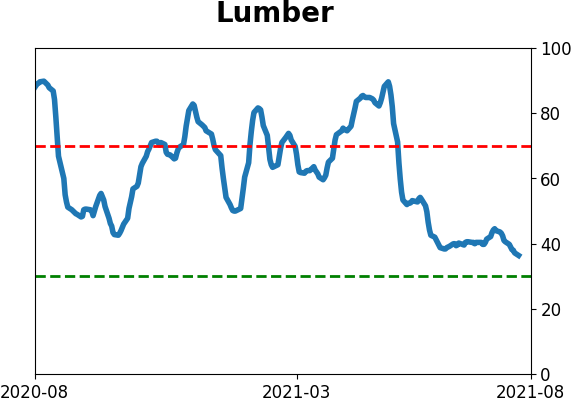
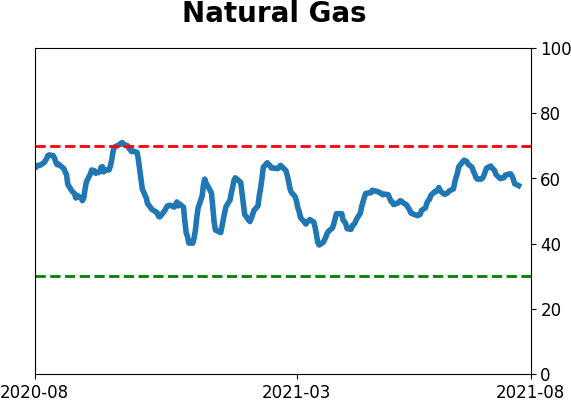
Commodity ETF's - 5-Day Moving Average
|
|