Headlines
|
|
Stocks in Shanghai are struggling after historic reversal:
In the Shanghai Composite index, there was a brief bout of optimism a couple of weeks ago, pushing more than 15% of stocks into overbought territory. That has reversed in historic fashion. Most markets see a rebound after behavior like this, but the Chinese market does not act like most others.
|
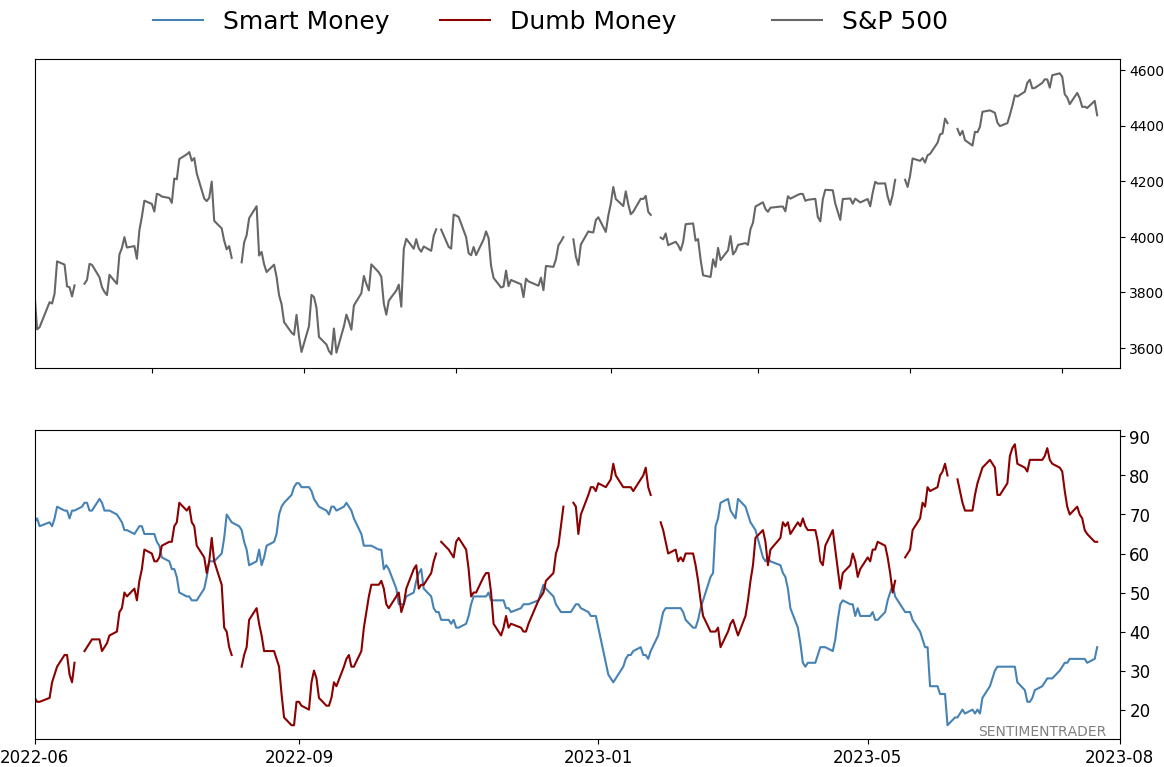
Smart / Dumb Money Confidence
|
Smart Money Confidence: 36%
Dumb Money Confidence: 63%
|
|
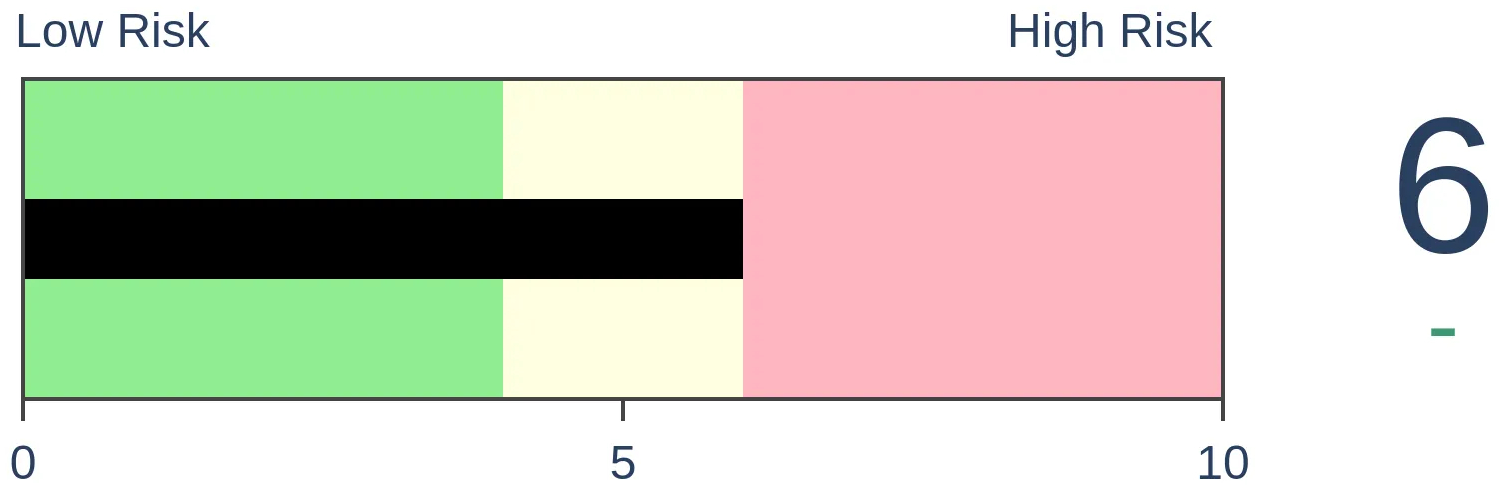
Risk Levels
Stocks Short-Term
|
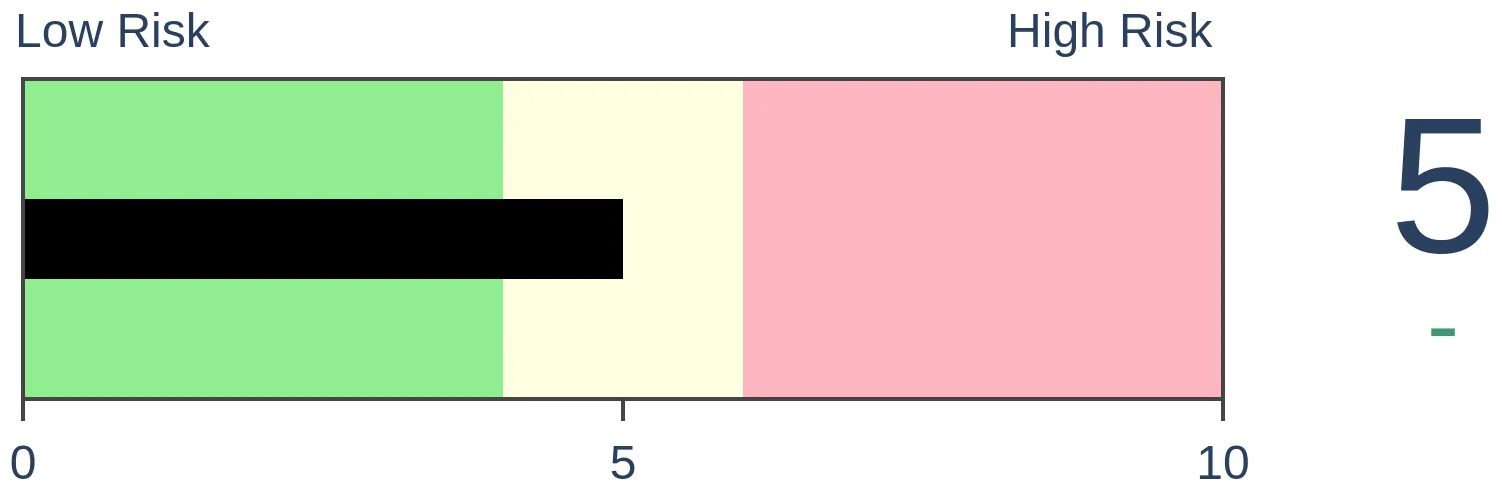
Stocks Medium-Term
|
|
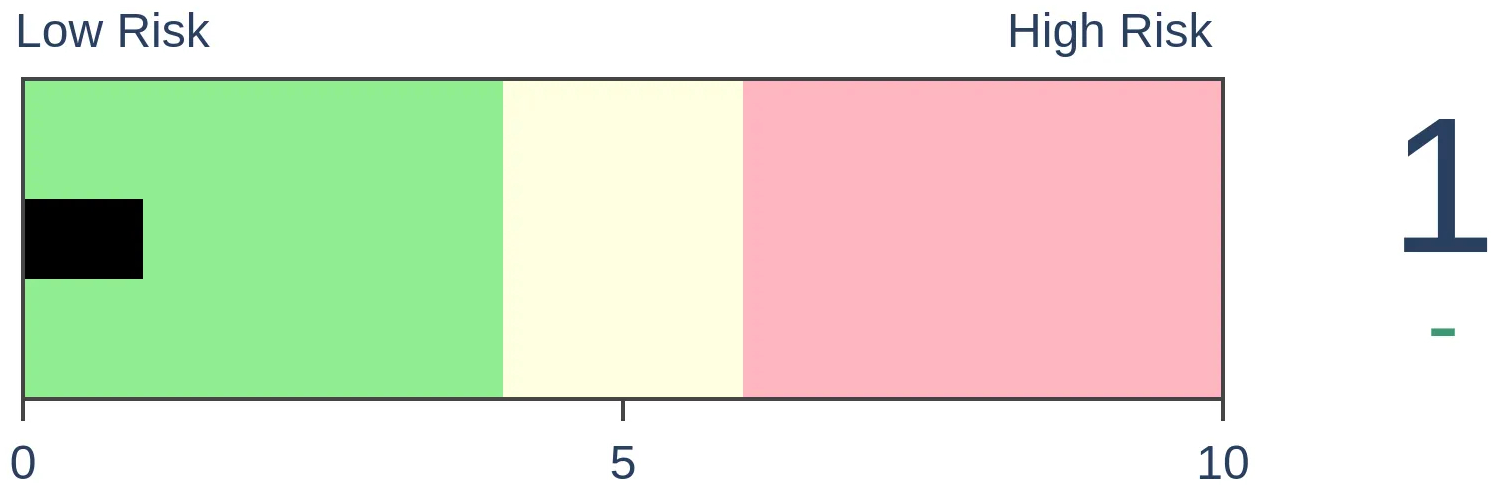
Bonds
|
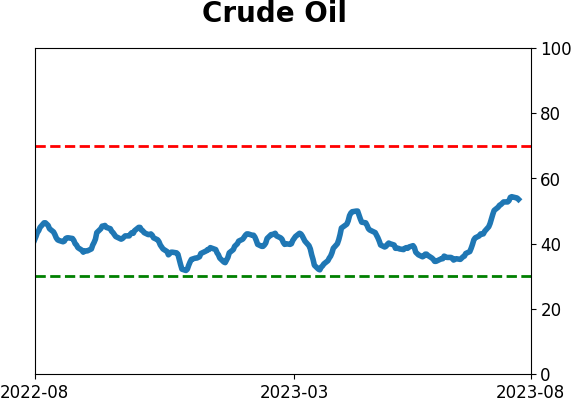
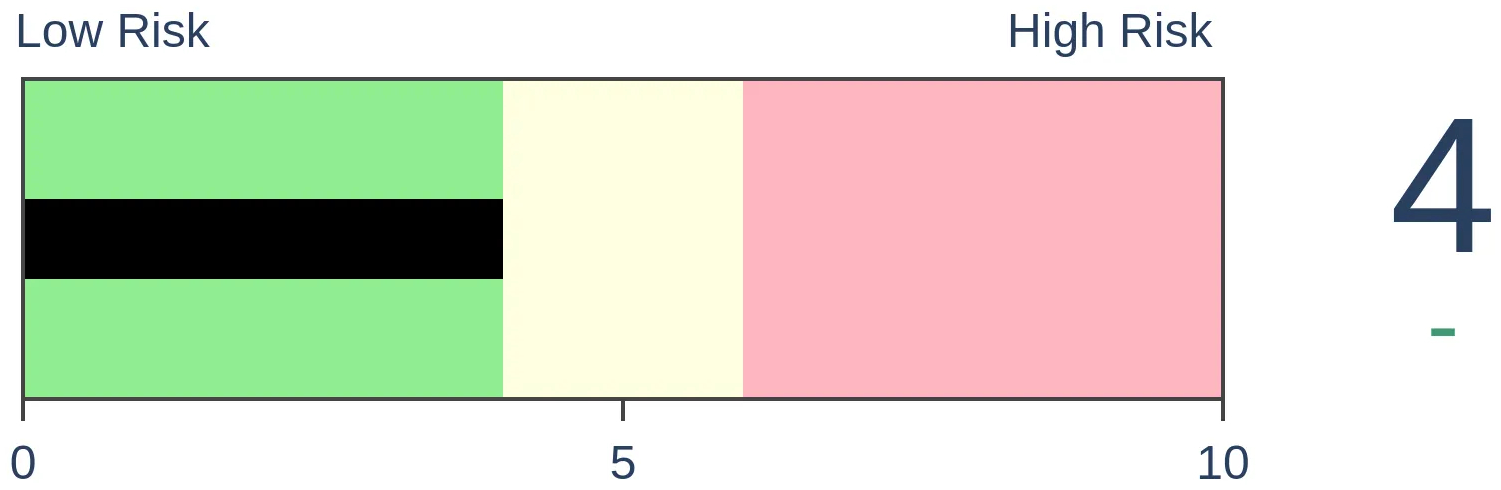
Crude Oil
|
|
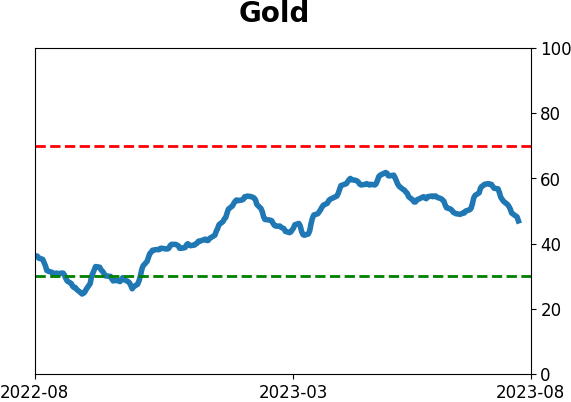
Gold
|
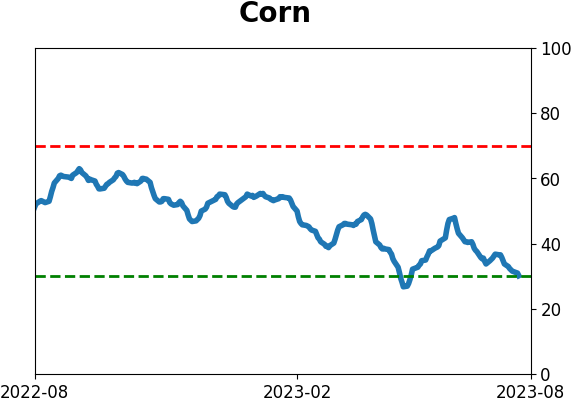
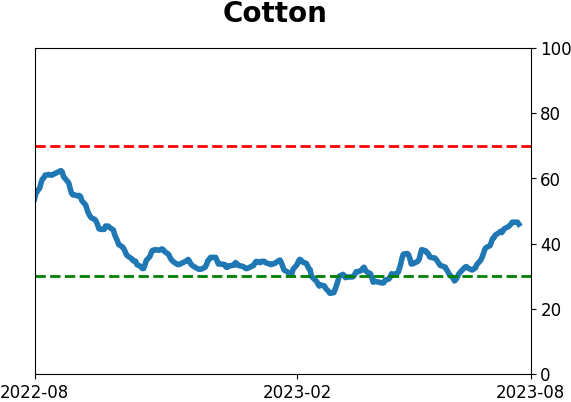
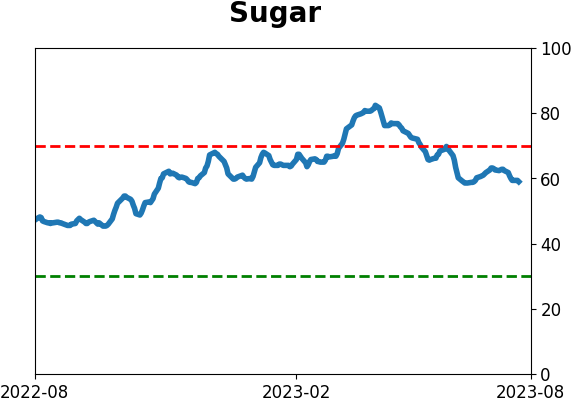
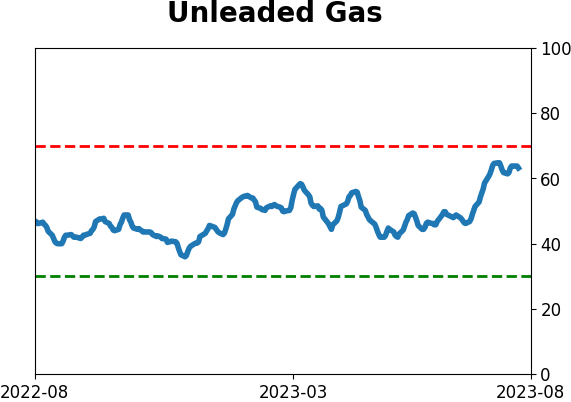
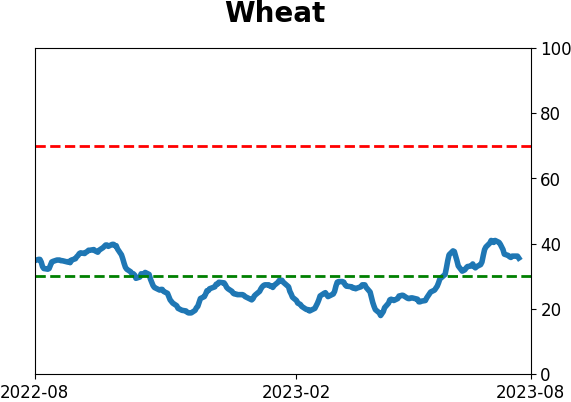
Agriculture

|
|
Research
By Jason Goepfert
BOTTOM LINE
In the Shanghai Composite index, there was a brief bout of optimism a couple of weeks ago, pushing more than 15% of stocks into overbought territory. That has reversed in historic fashion. Most markets see a rebound after behavior like this, but the Chinese market does not act like most others.
FORECAST / TIMEFRAME
None
|
Key points:
- Overbought members in China's Shanghai Composite index have plunged
- Only a couple of weeks ago, a large number of stocks were stretched, now almost none are
- Unlike most other developed or developing markets, the Shanghai tends to see more losses after similar behavior
A historically rapid reversal in a disappointing market
A few markets continually disappoint investors. They never seem to fulfill their potential. They are popular topics of discussion but only reward investors once in a generation. Gold is like that. Another is *in mocking Trump voice*, China.
Fundamental worries about that market are well-worn and not worth repeating. Most indicators we track for Chinese stocks are either neutral or modestly oversold, with nothing of particular interest.
What is interesting, however, is how quickly the stocks in the Shanghai Composite reversed from their bout of optimism. The percentage of stocks in that index that were overbought briefly exceeded 15%, enough to be considered extreme. However, that plunged to fewer than 1% of stocks in under two weeks.
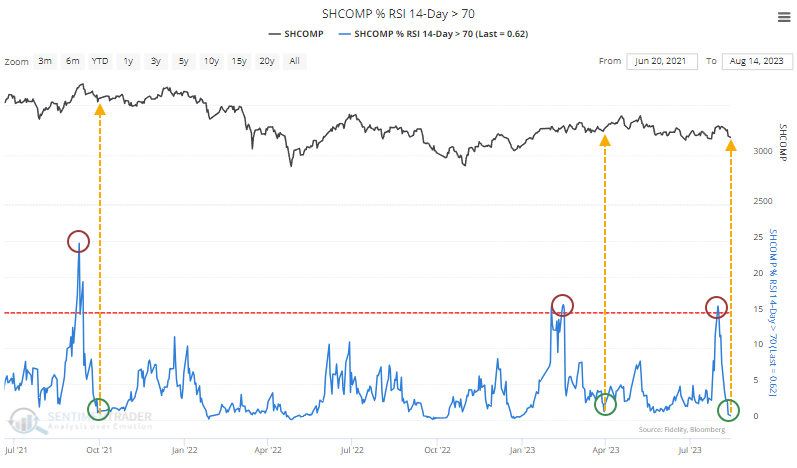
We've noted before that sentiment in the Chinese market is dominated by retail investors, and unlike markets such as the U.S., they are not prone to quick and protracted reversals; when sentiment becomes sour, it tends to stay that way.
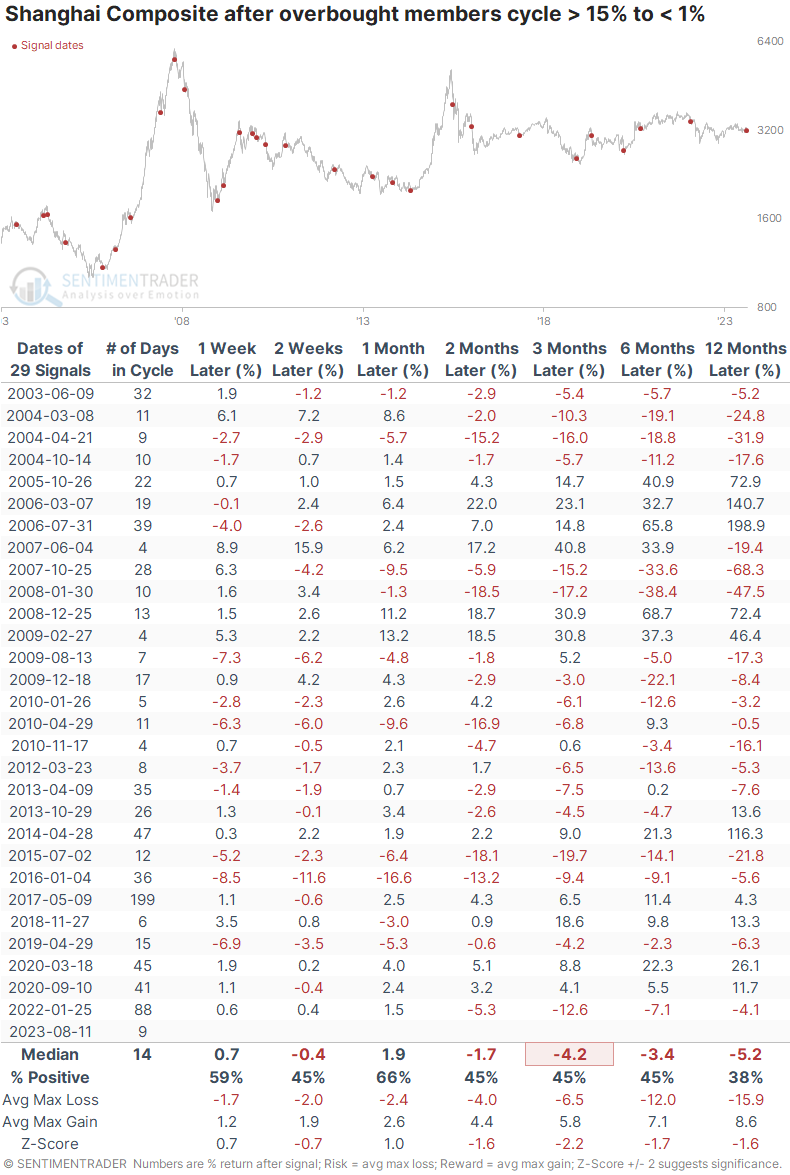
The table below shows that the Shanghai Composite tended to suffer poor returns after its percentage of overbought members cycled from more than 15% to fewer than 1%. There was a modest bounce over the next month, but by three months later, the average return was a horrid -4.2% with more average risk than reward.
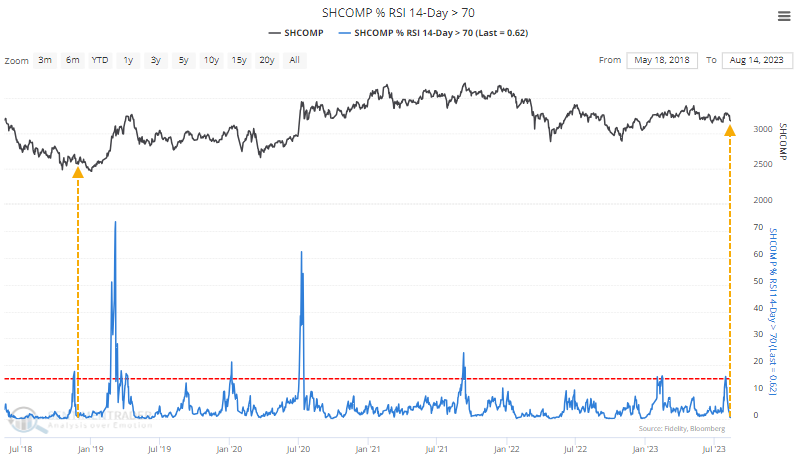
What makes the current situation unique is how quickly the overbought conditions reversed. Almost no members are currently overbought, while it wasn't even two weeks ago when more than 15% of them were. The last time the condition reversed this quickly was in 2018.
In some markets, quick reversals tend to highlight periods of brief investor panic from what had been an impressive recovery. More often than not, it leads to above-average returns.
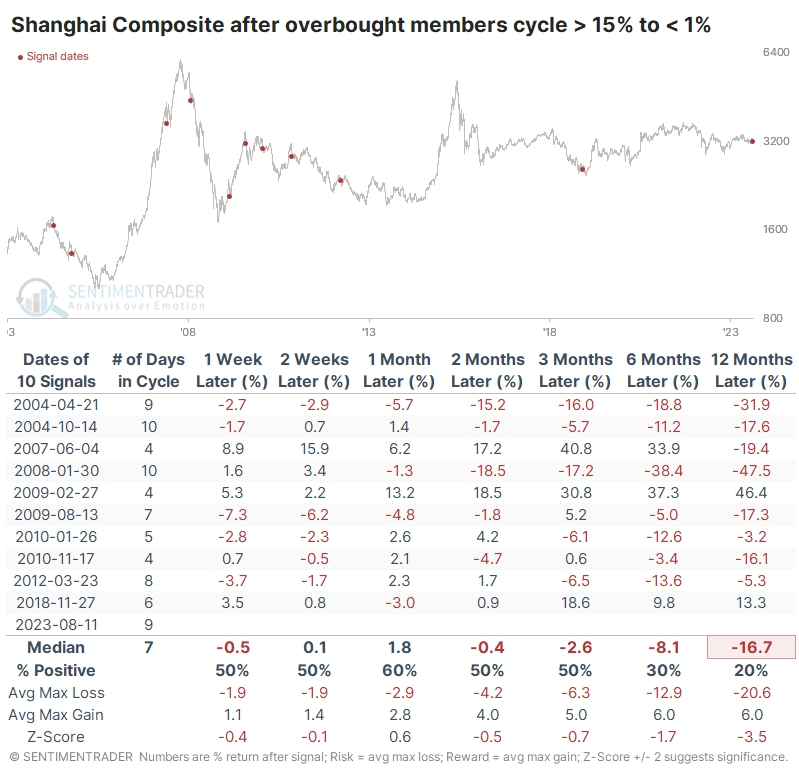
But again, this is a market that has a history of disappointing investors. It doesn't play by the same rules as most other global markets. Even after rapid reversals of overbought conditions - those that cycled within a couple of weeks - forward returns were poor. Again, a month later, more than half the signals showed a positive return, but only three preceded double-digit gains. All but two occurred during what turned out to be structural declines, and the one in 2018 suffered a couple more months of losses before reversing strongly.
What the research tells us...
It's nearly impossible, maybe even literally impossible, to find a positive story about China in the media at the moment, especially in the U.S. Searching for "China" in The Wall Street Journal, here are keywords from the results: spillover, deflation, syndrome, problem, fraying, hurt, warning, uninsurable, weaken, struggles, worsening. And Bloomberg: fall, gloom, tough, alarm, contagion, losses, slumping, negative.
Similar bouts of "China is uninvestable" over the past two years have usually been good for intermediate bottoms in those stocks, but we're not seeing comparable levels of a washed-out market now that we saw then. Mostly, indicators are showing what we saw above - a surge into overbought territory and a quick reversal. In other markets, that would usually be a decent buy signal; not so in Shanghai. For those on the sidelines, behavior like this has typically been a sign to stay put and wait for either a stabilized market, which can take months, or yet another round of truly horrid conditions and across-the-board selling.
Indicators at Extremes
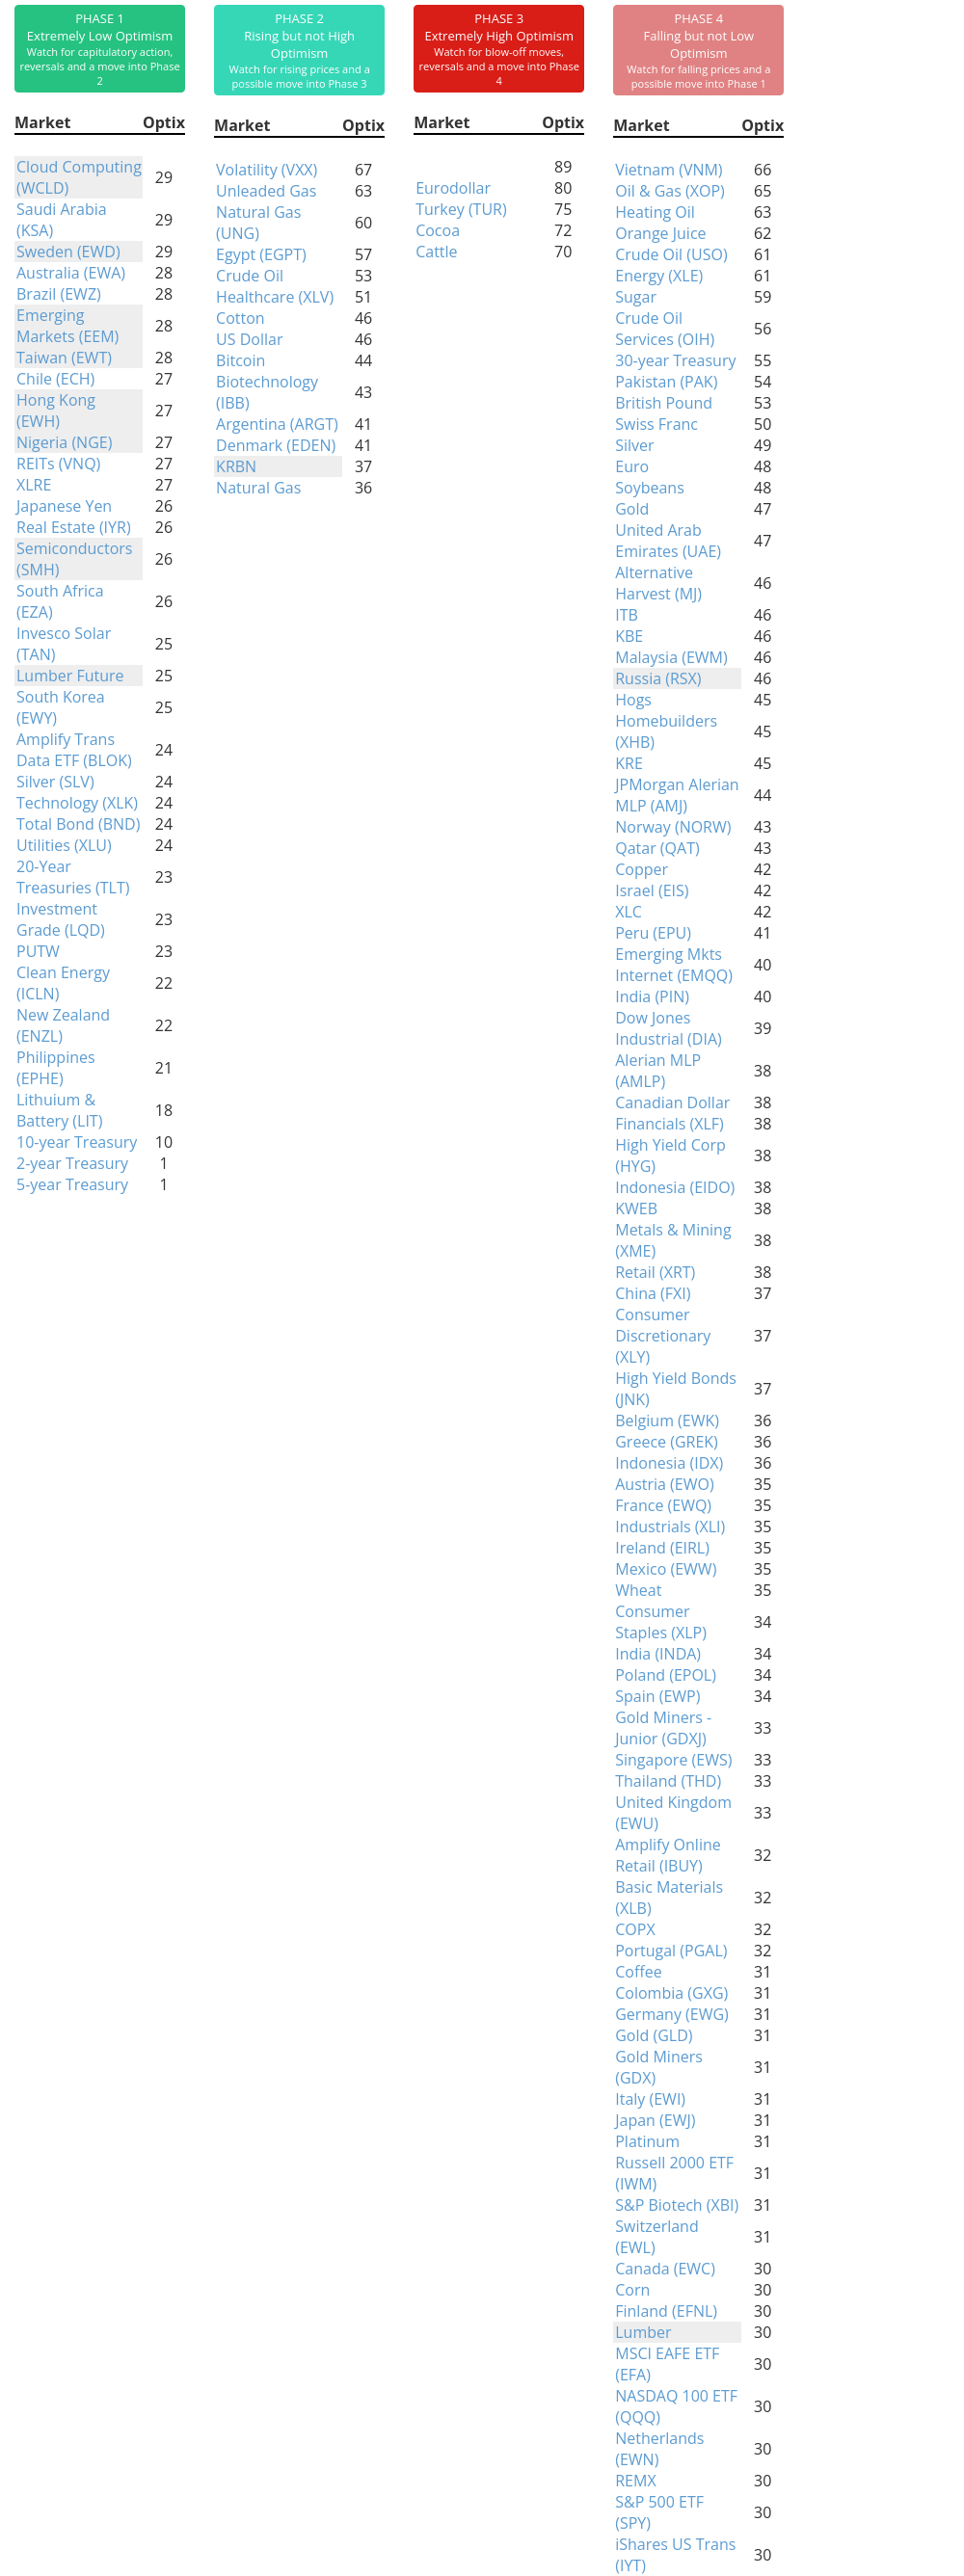
Phase Table
Ranks
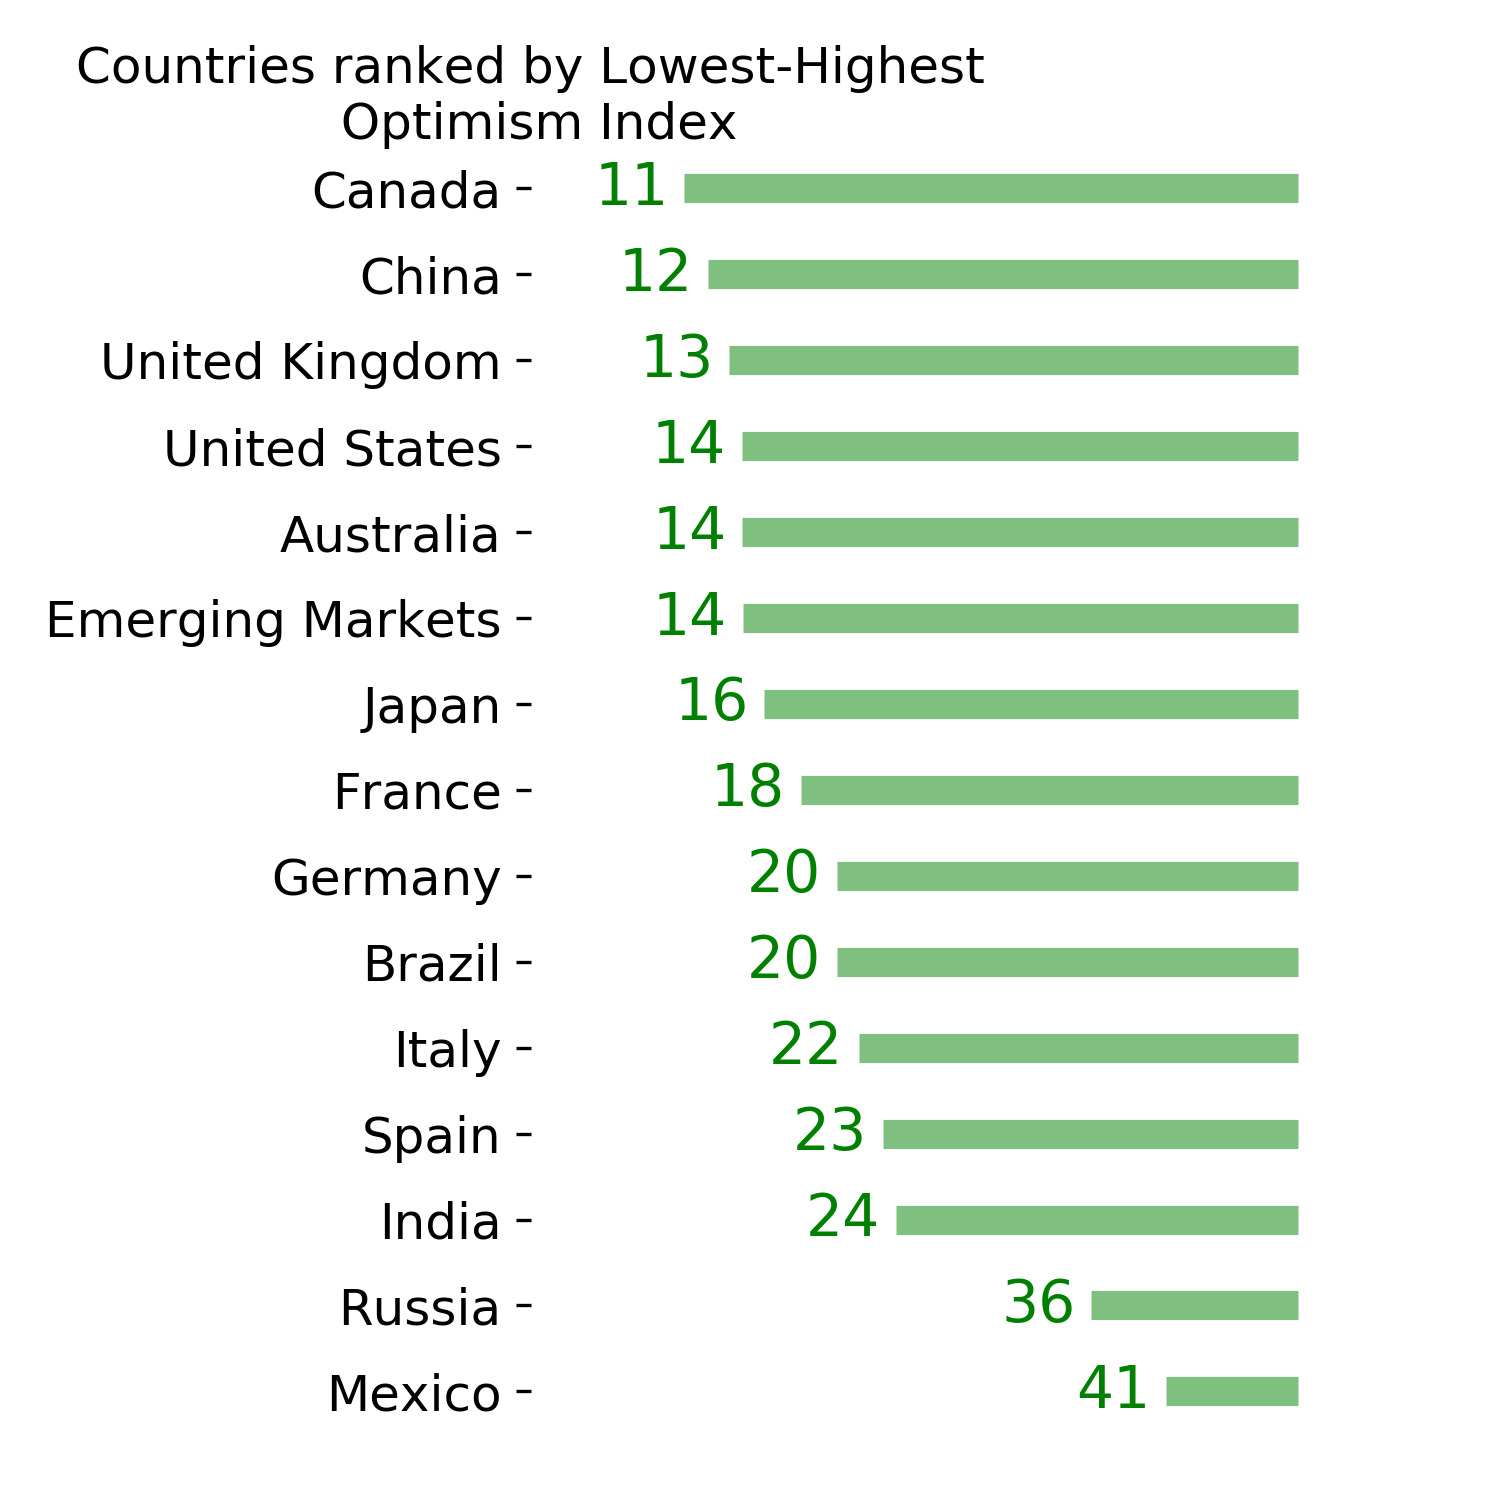
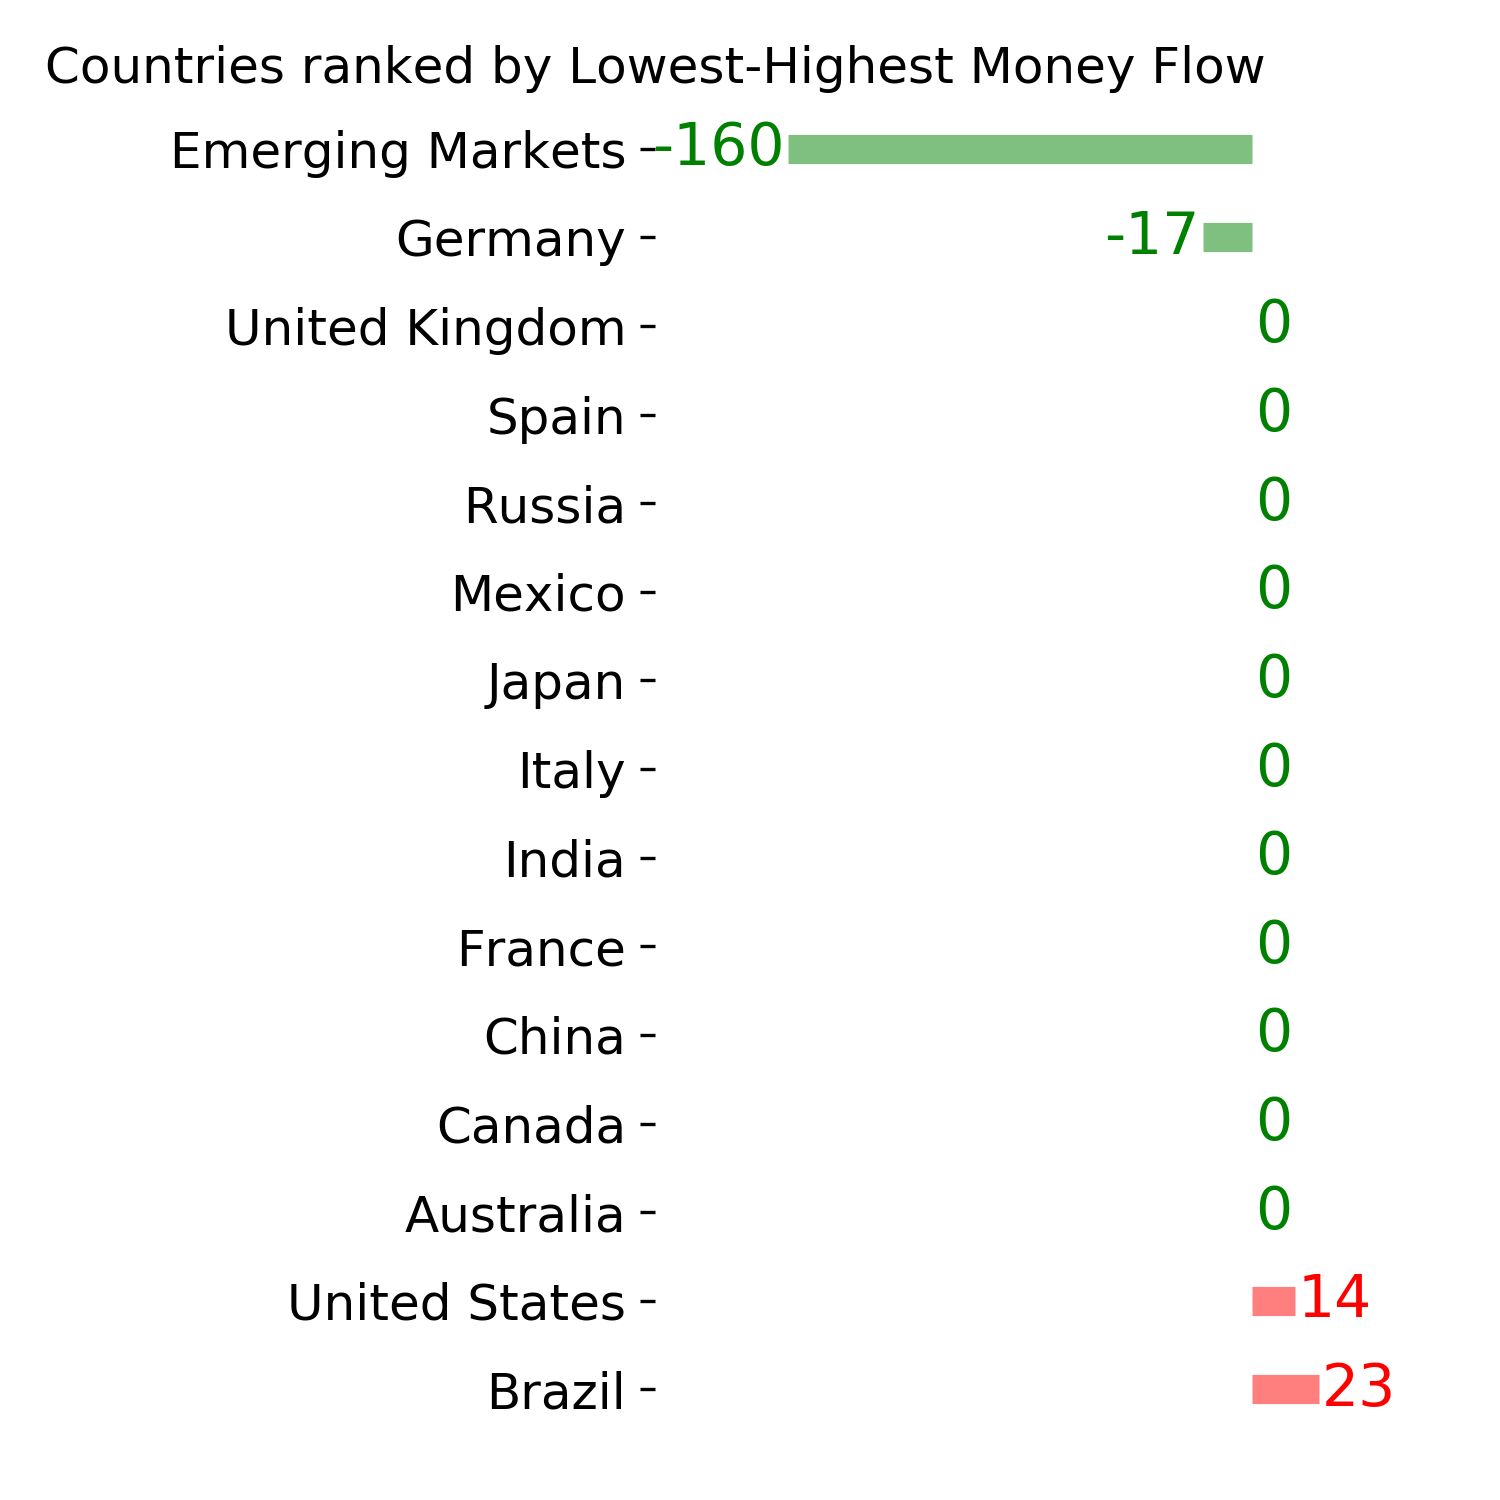
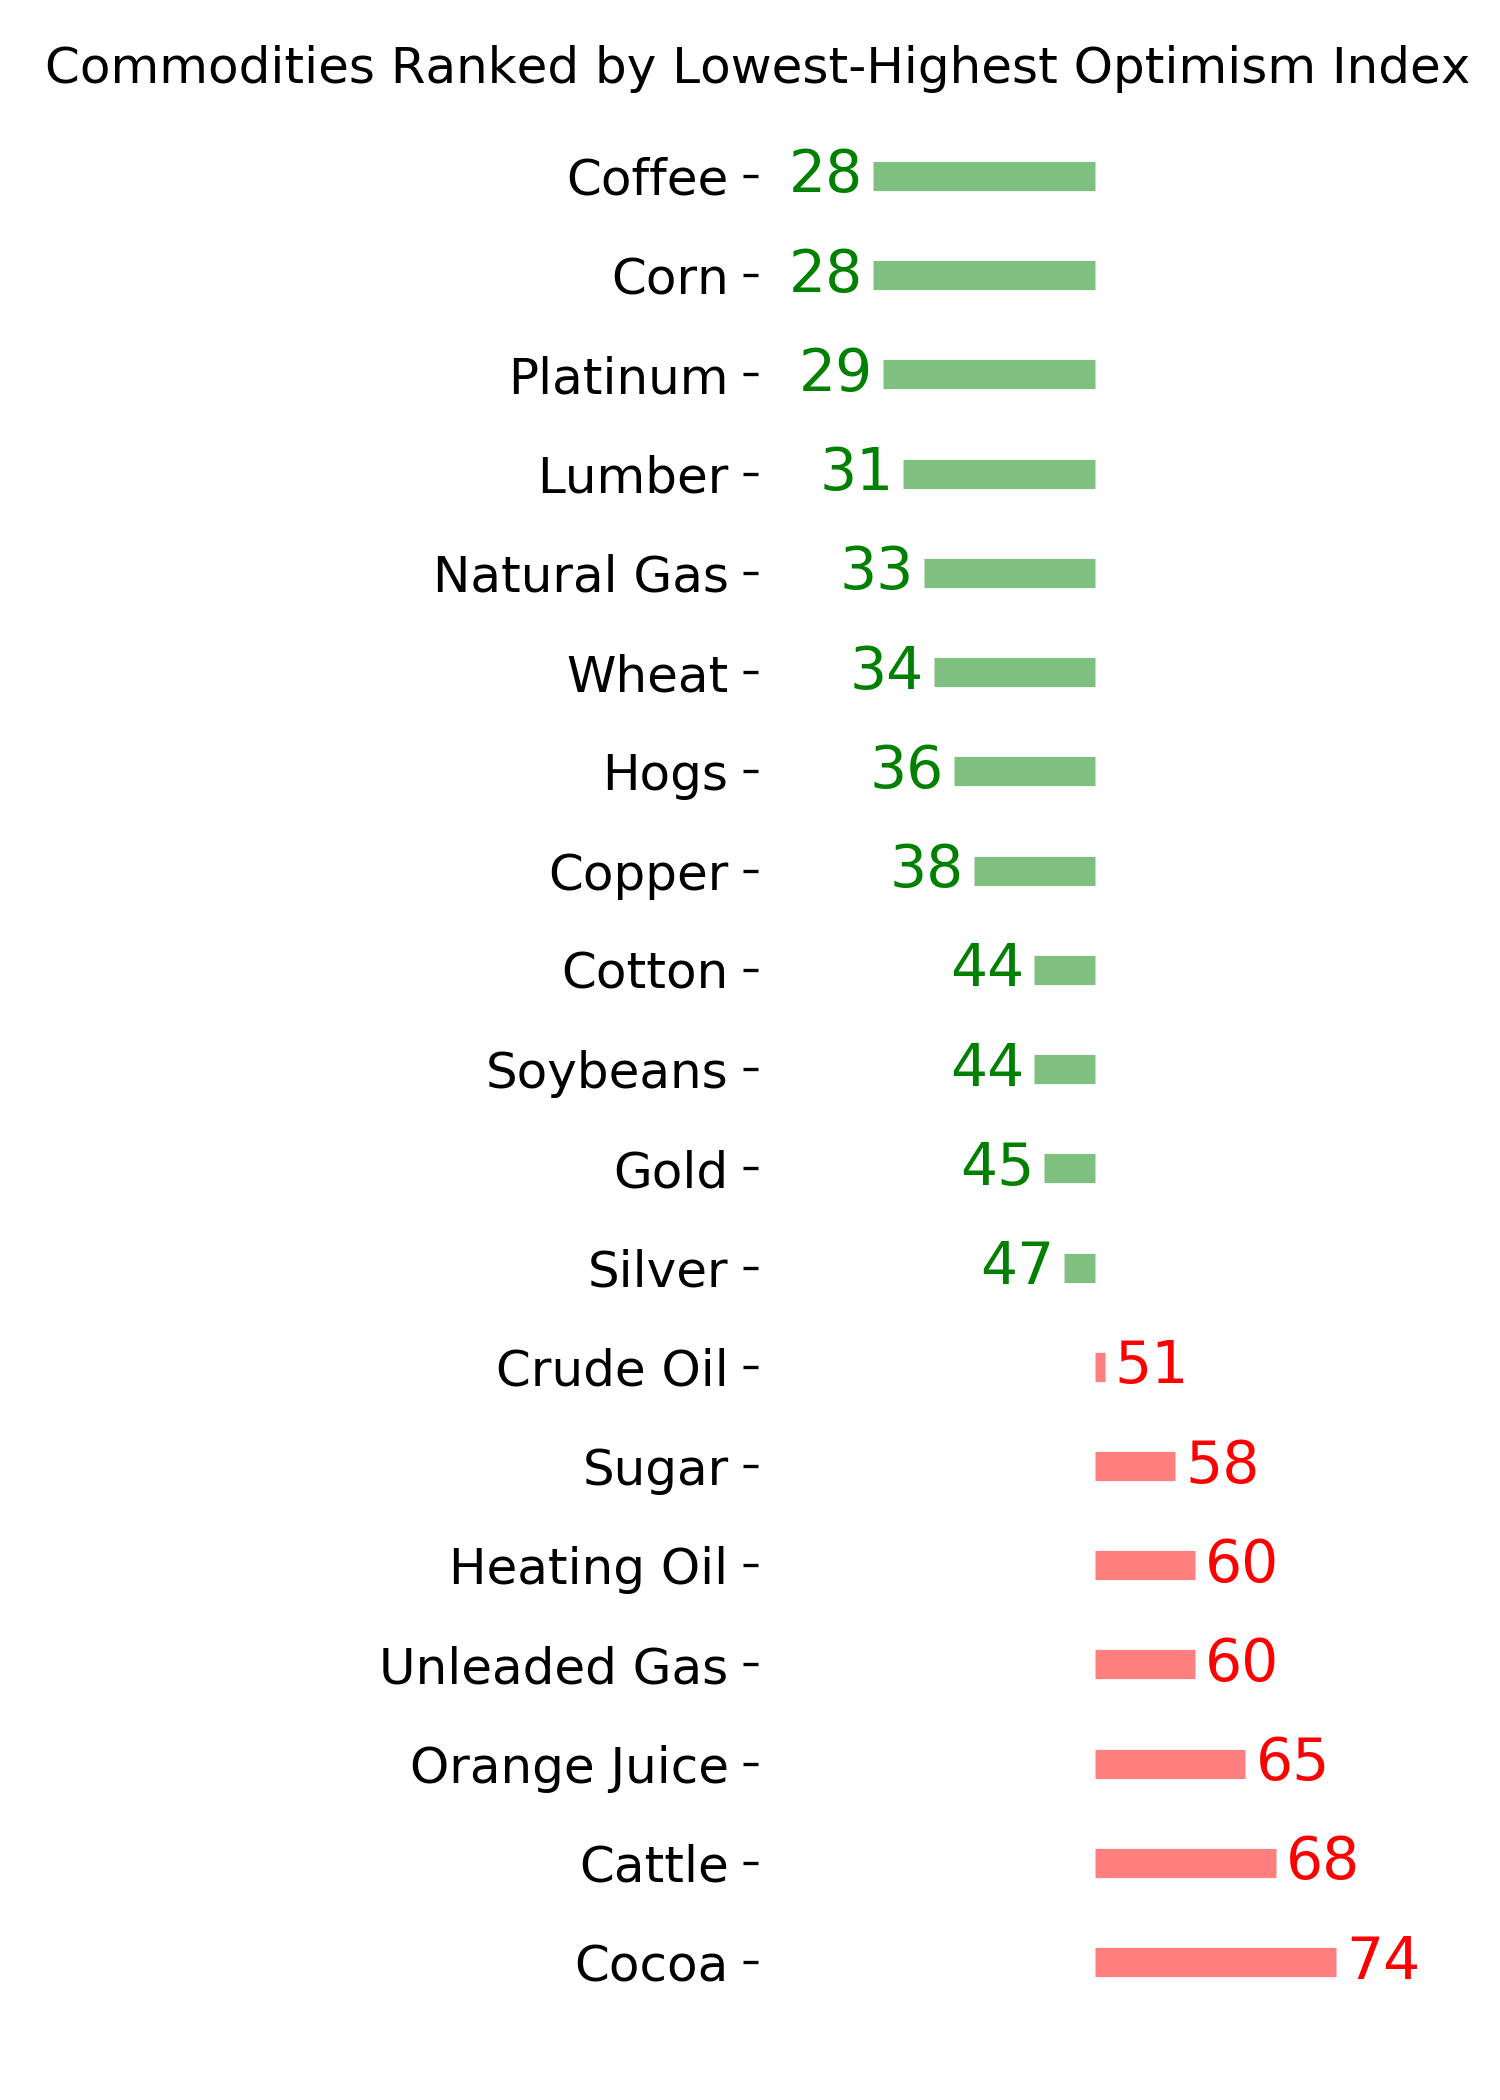
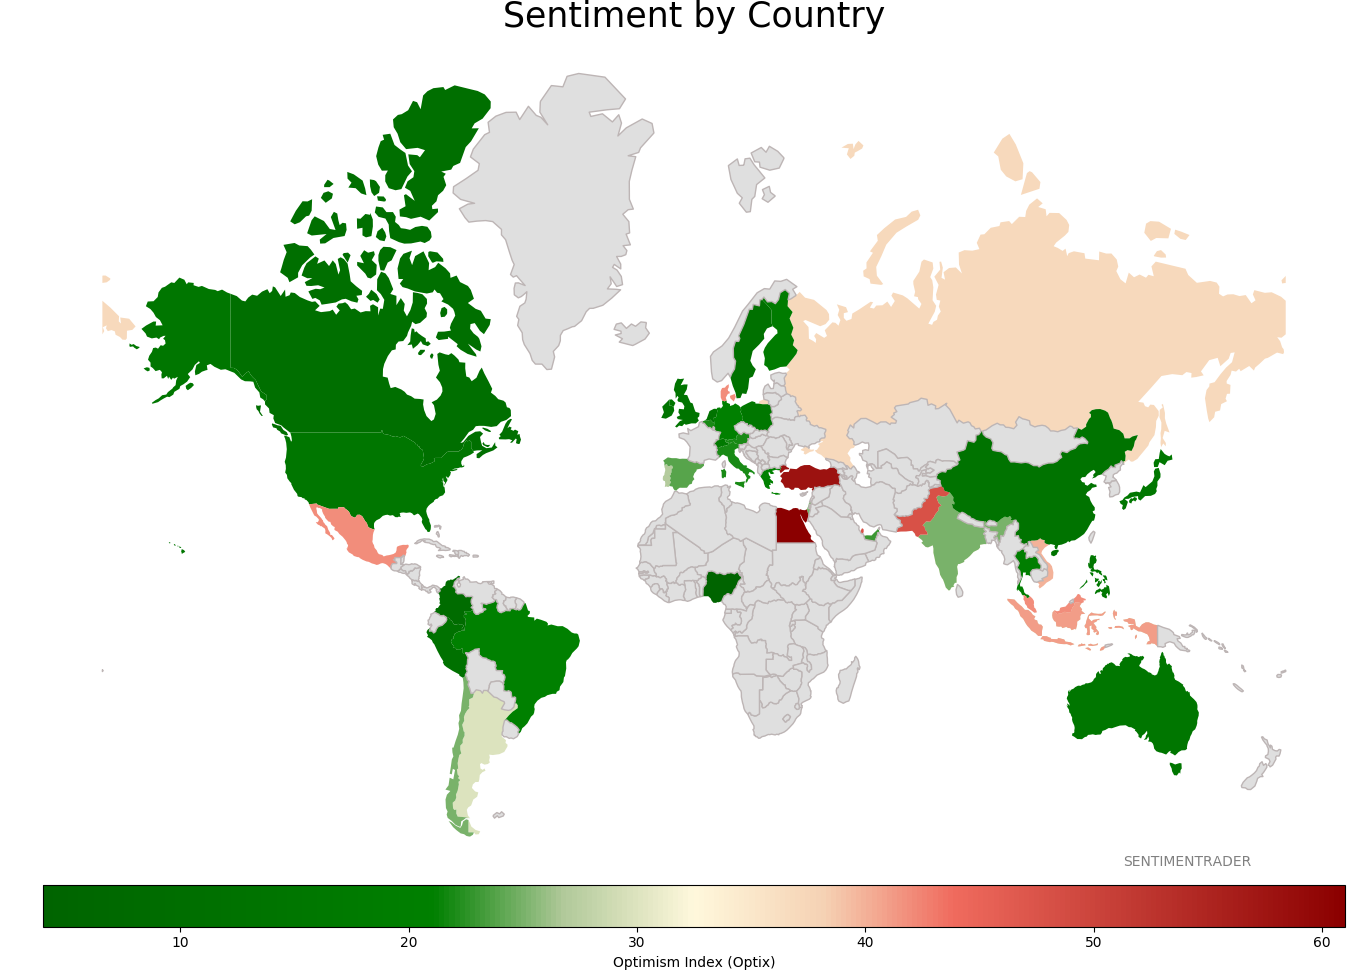
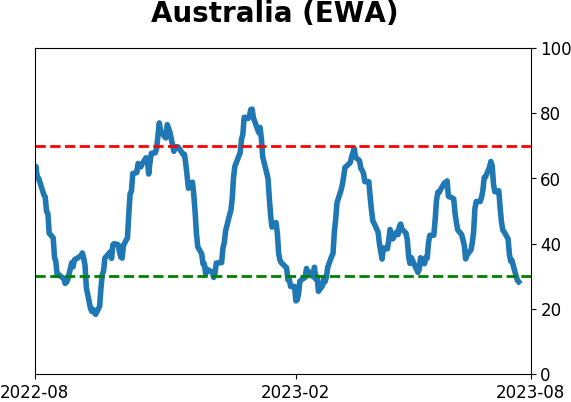
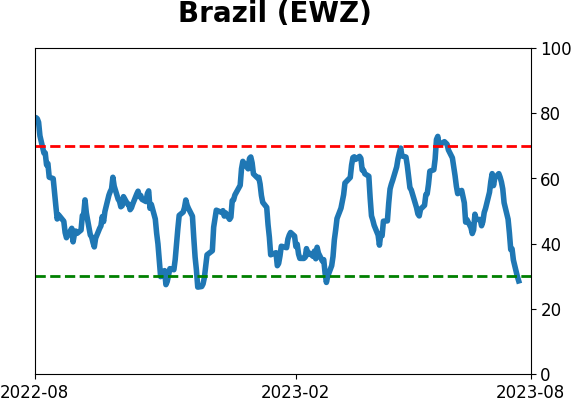
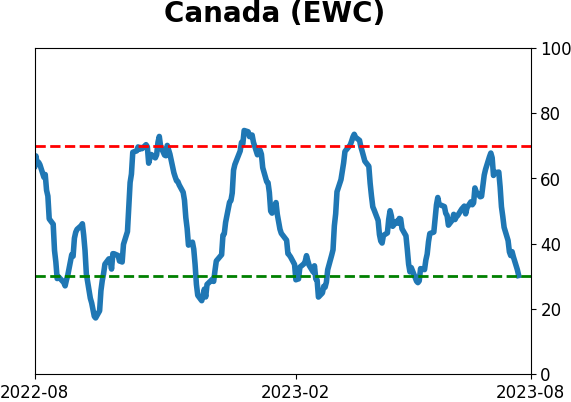
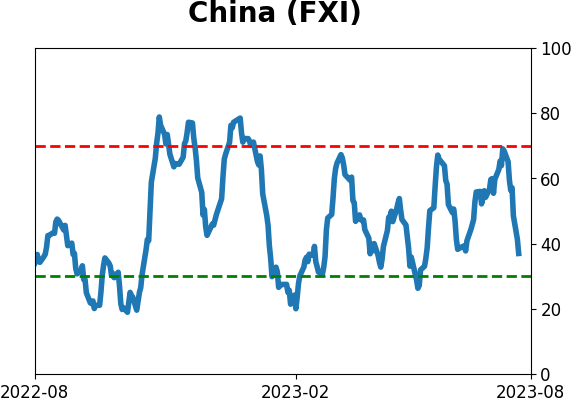
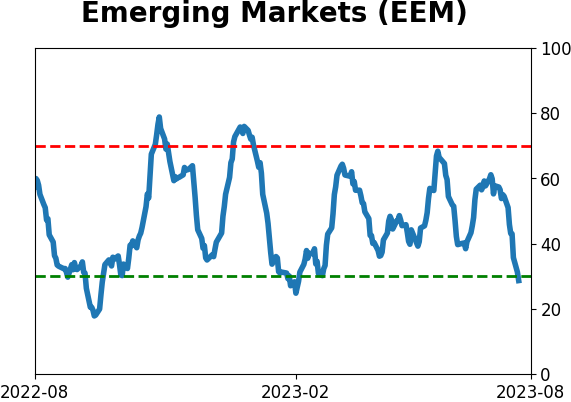
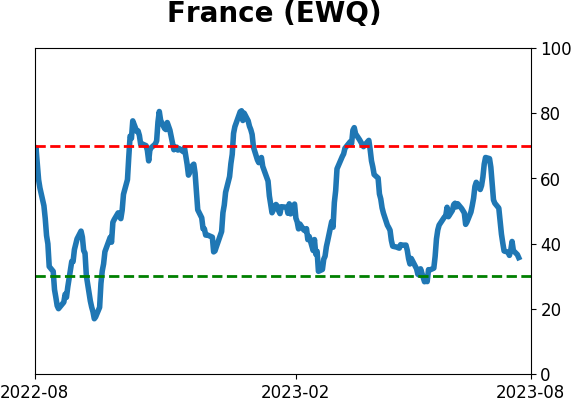
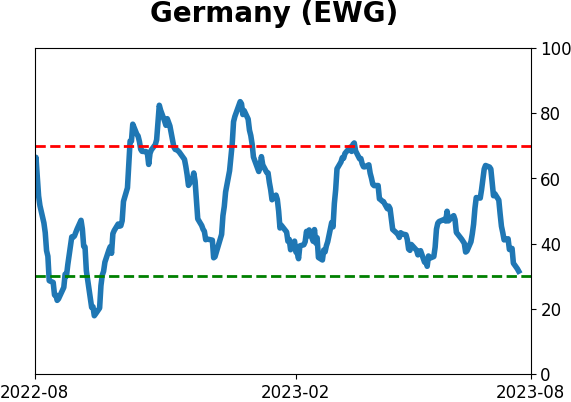
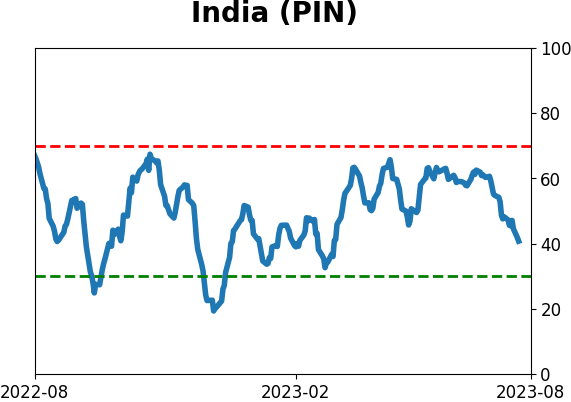
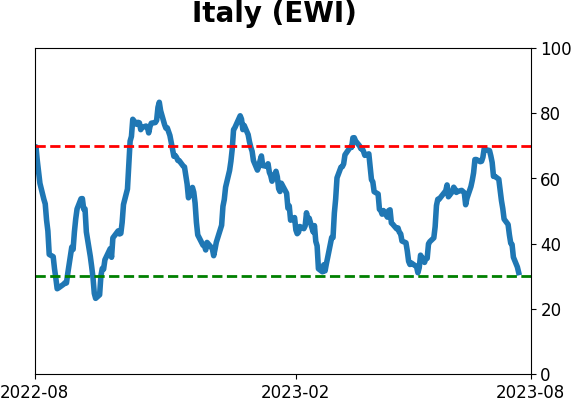
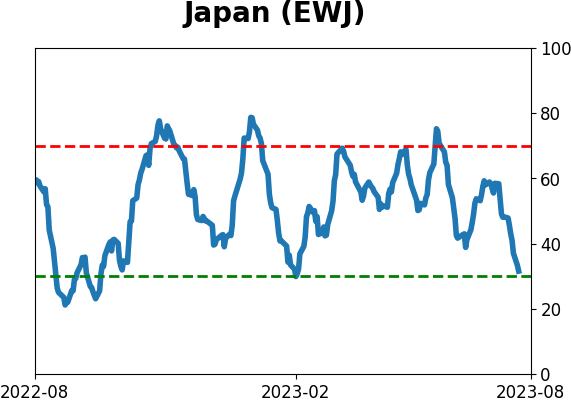
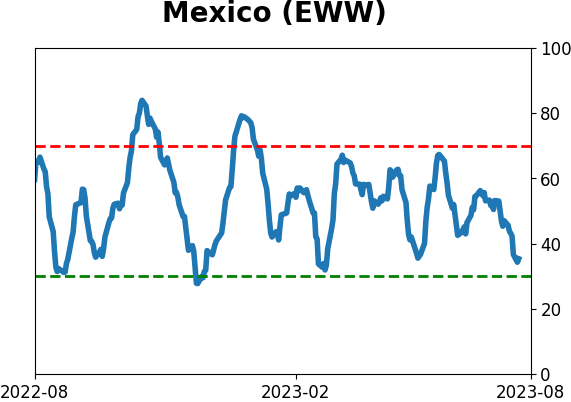
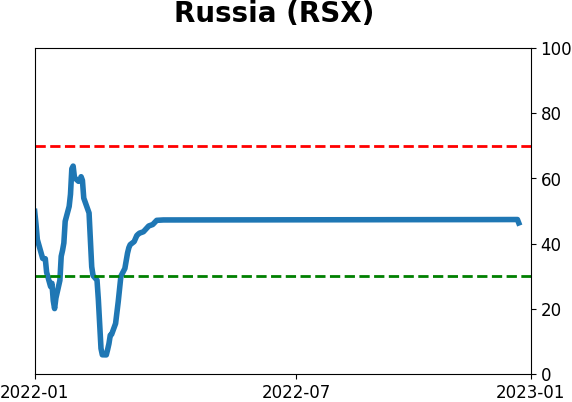
Sentiment Around The World
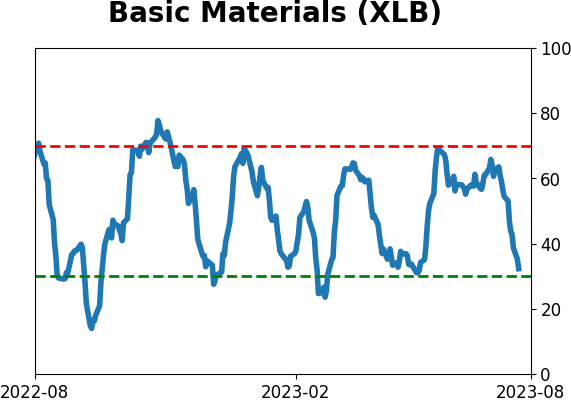
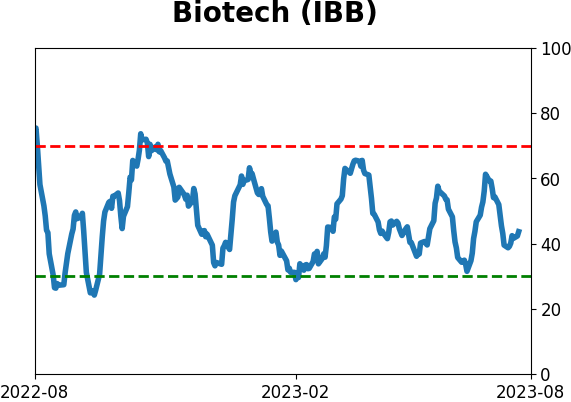
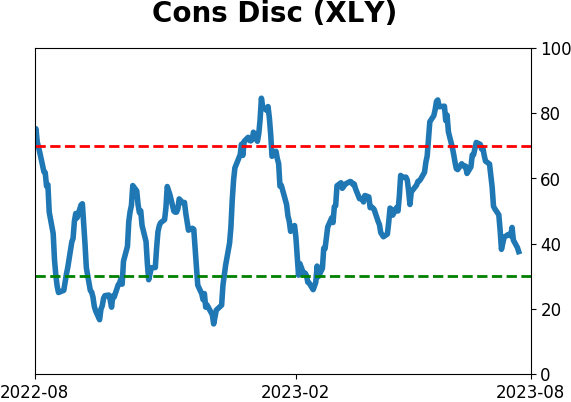
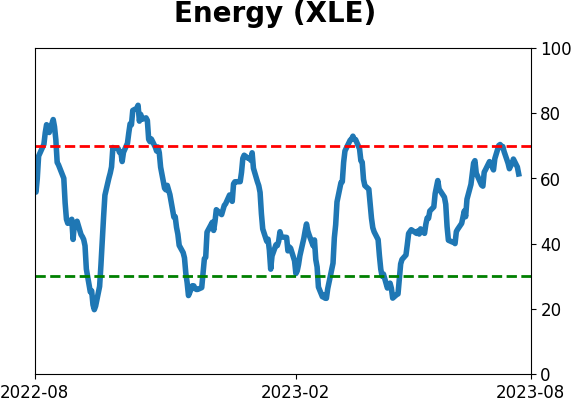
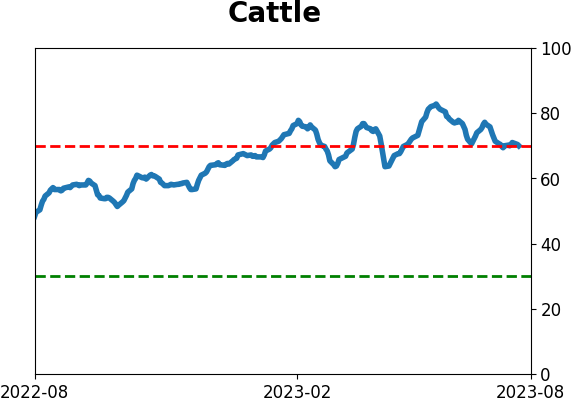
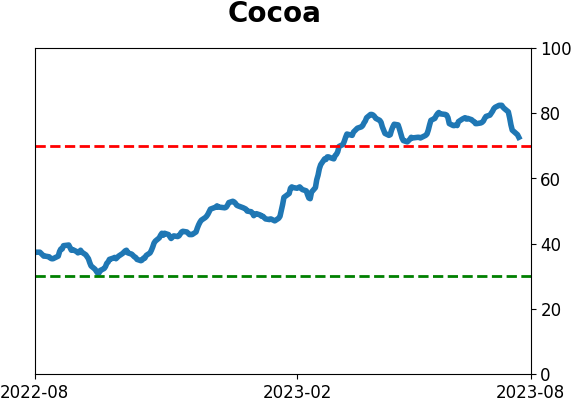
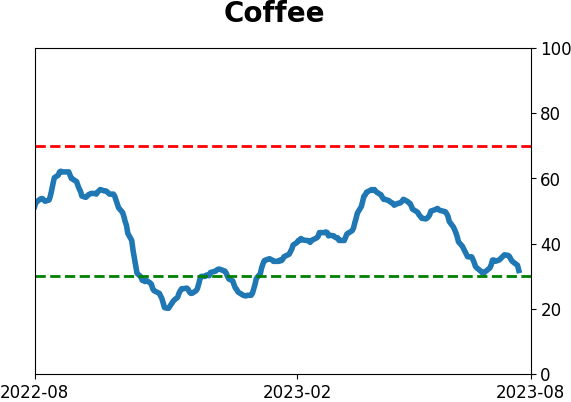
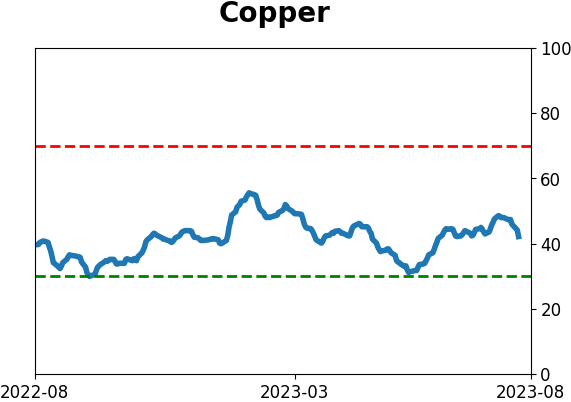
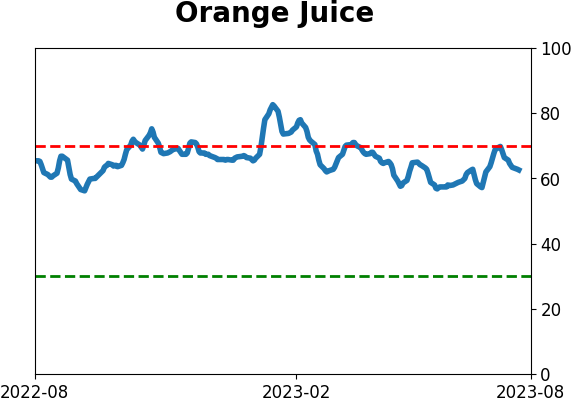
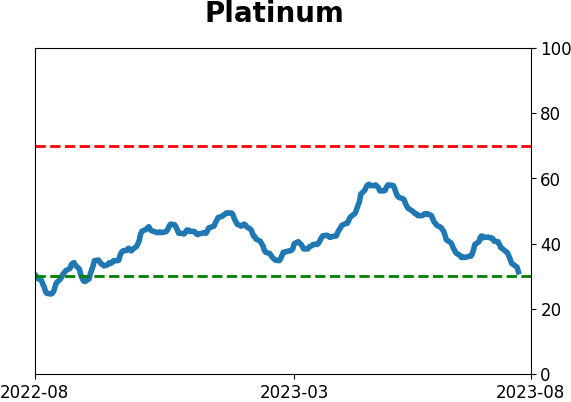
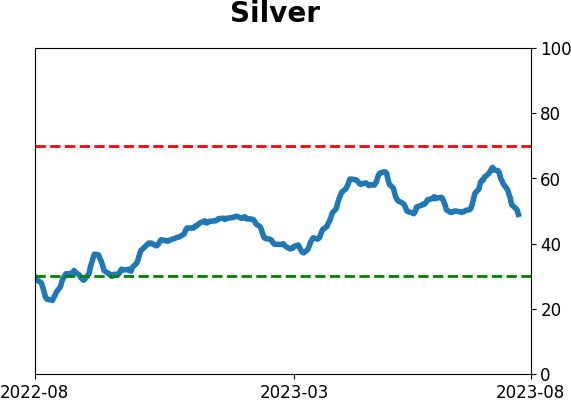
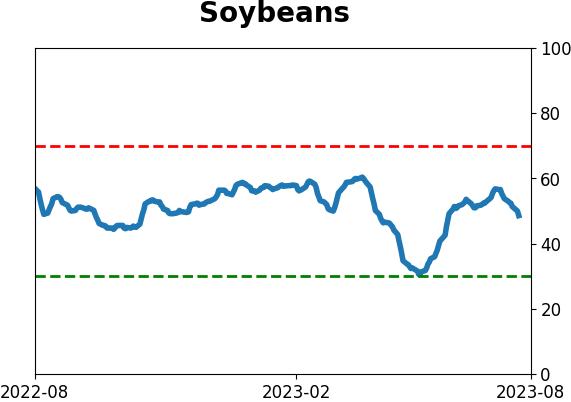
Optimism Index Thumbnails
|
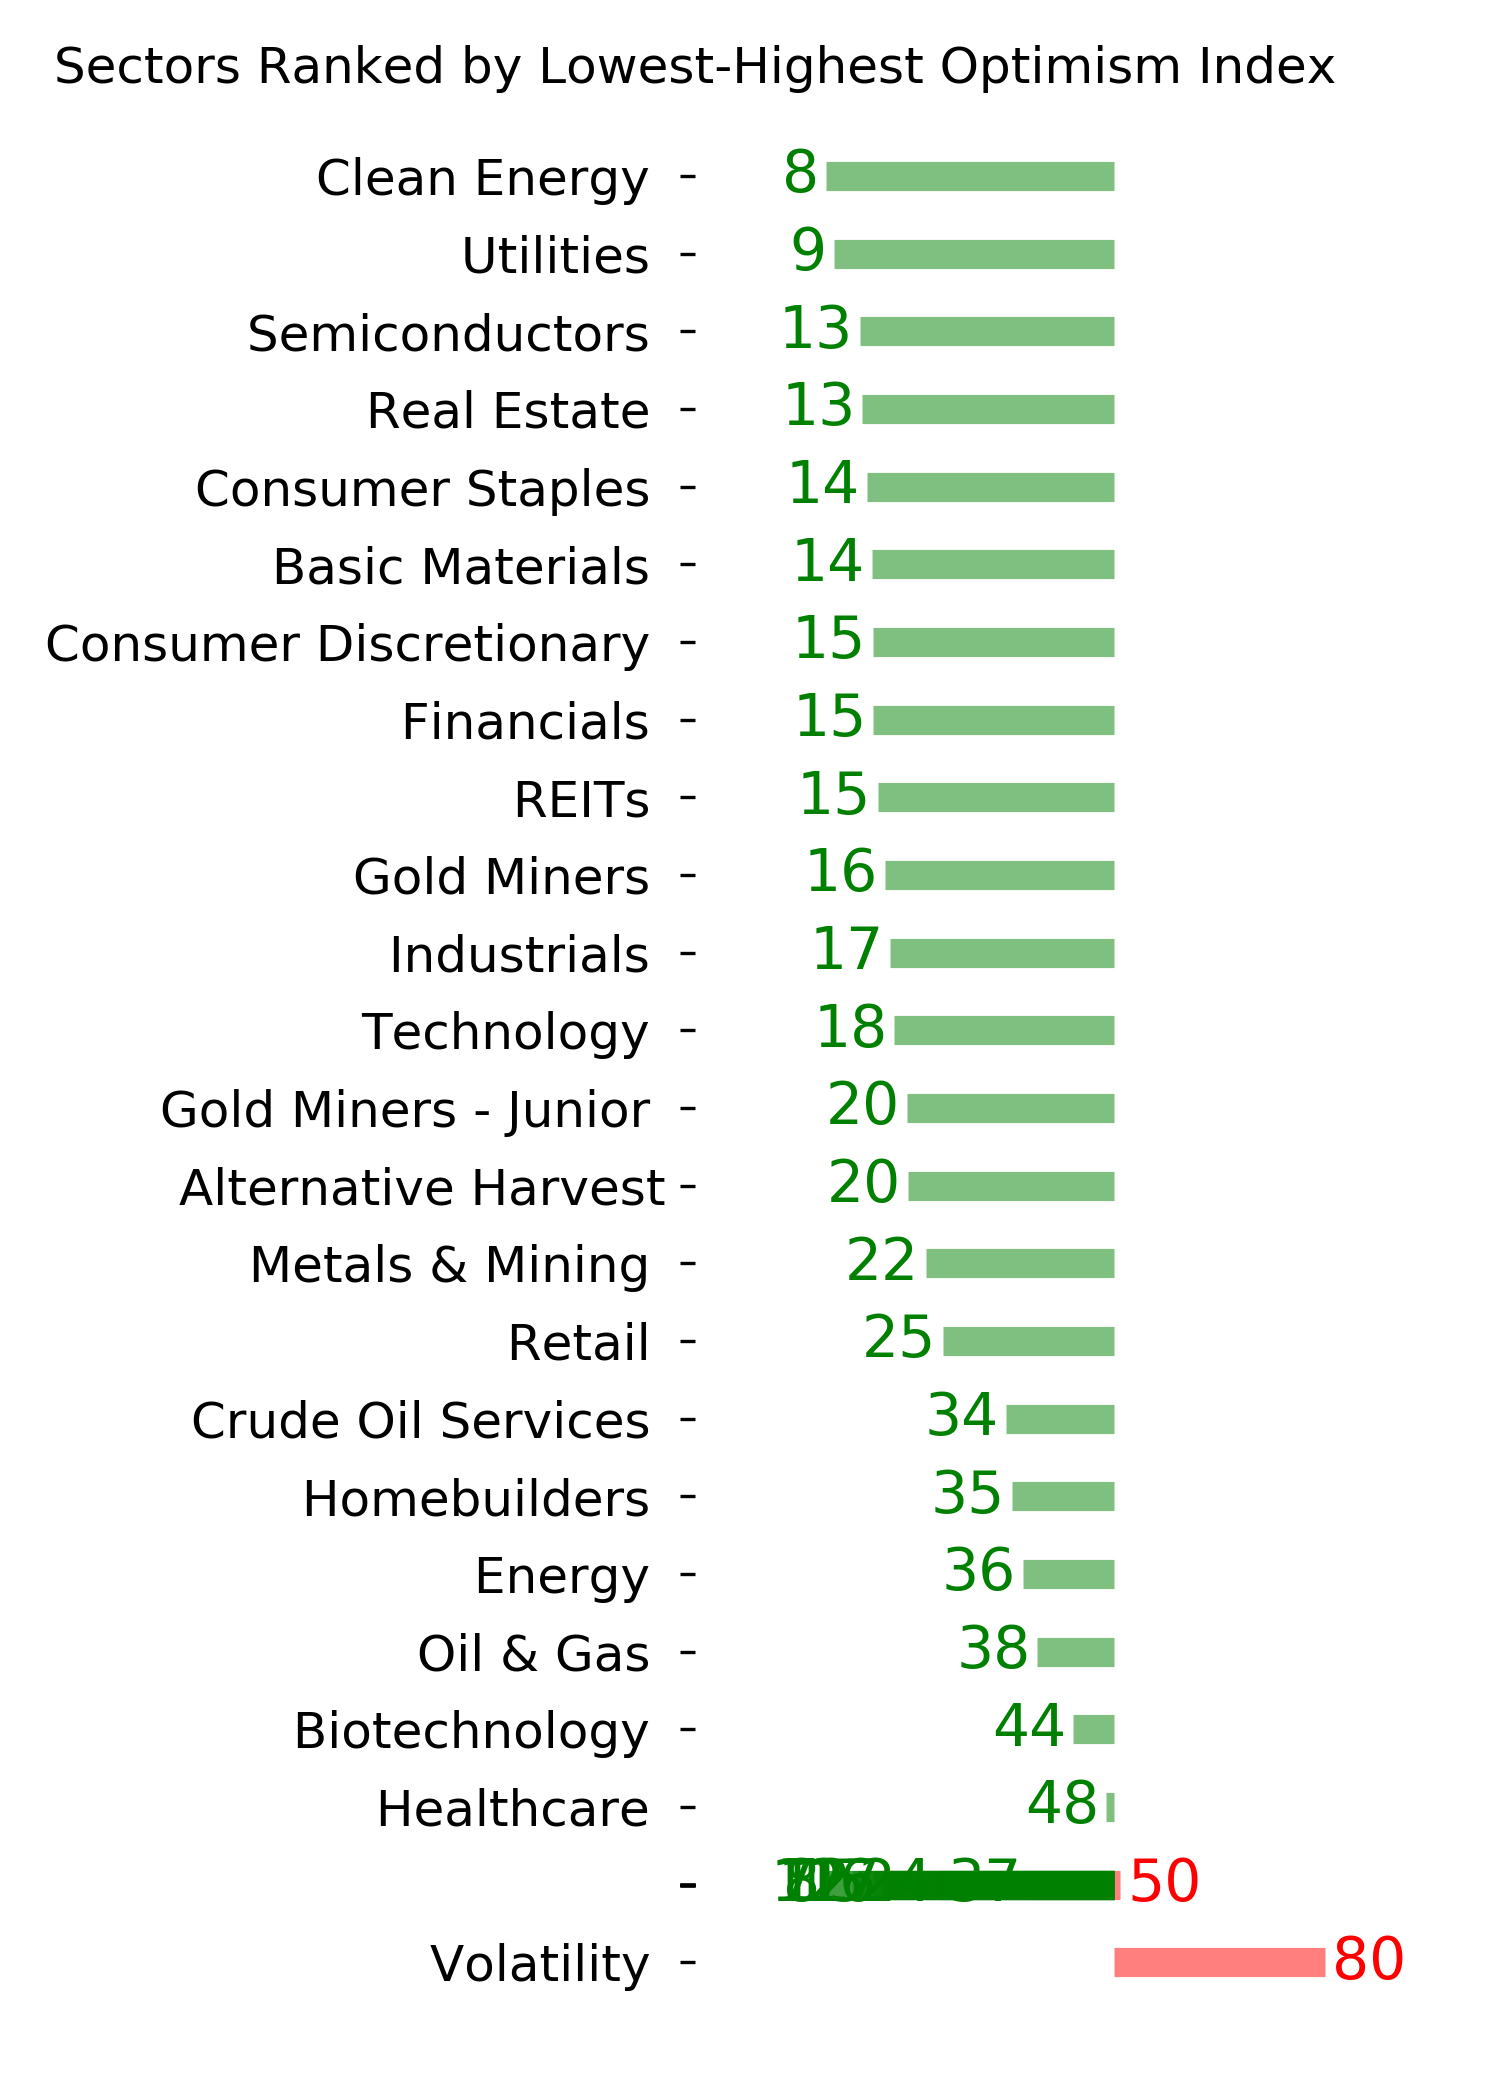
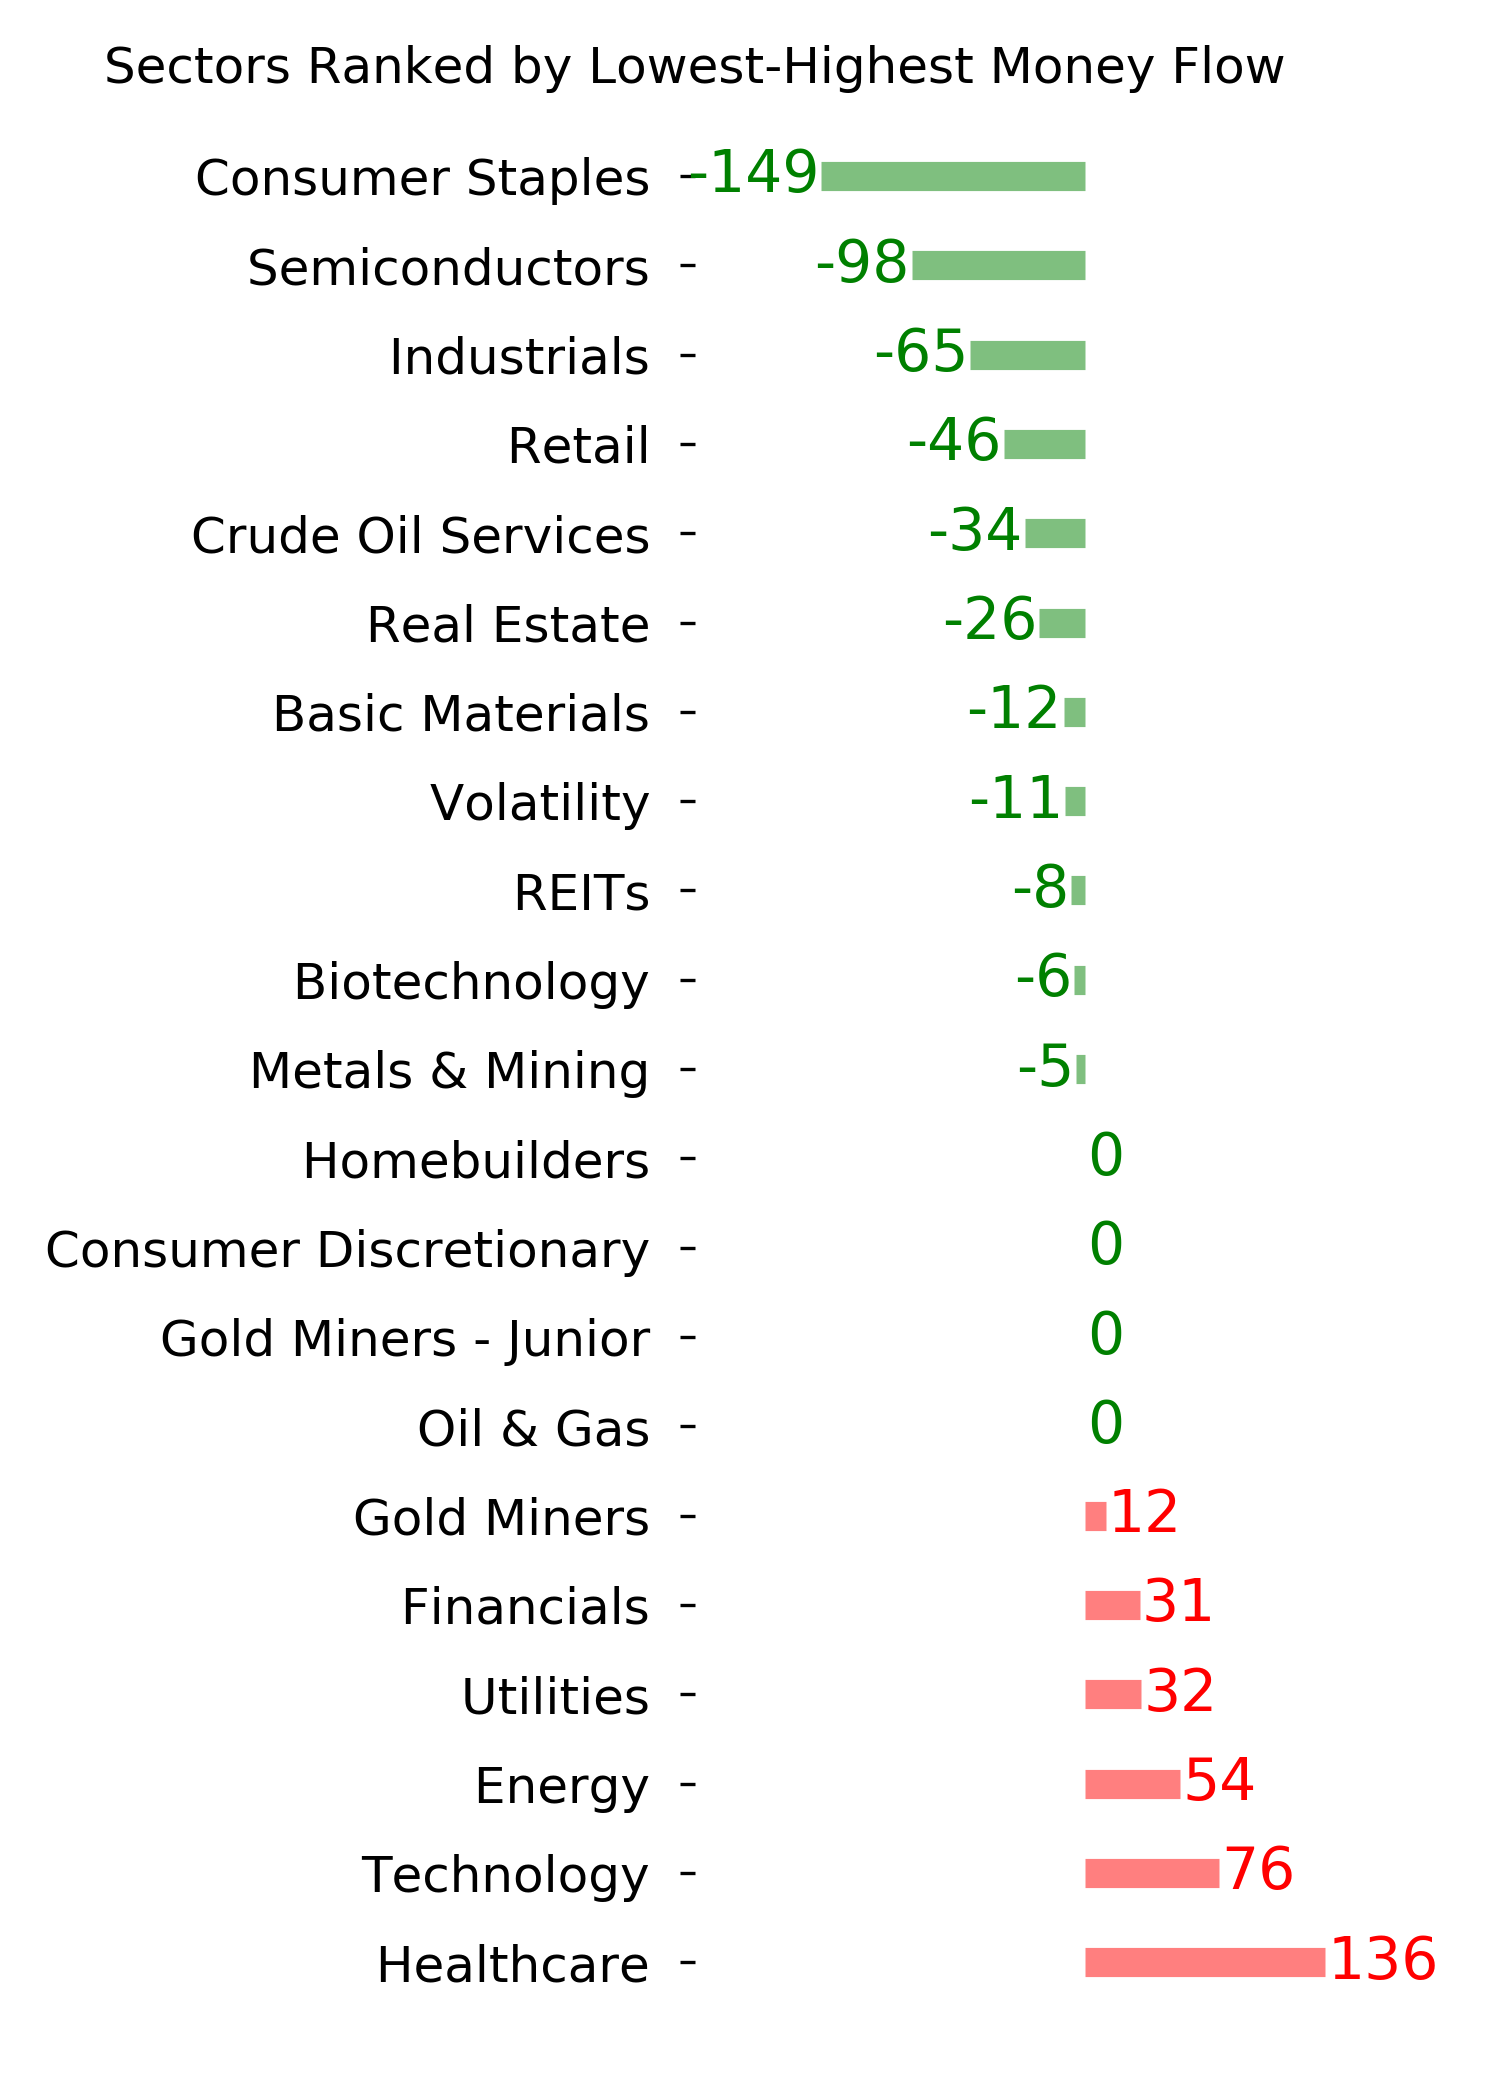
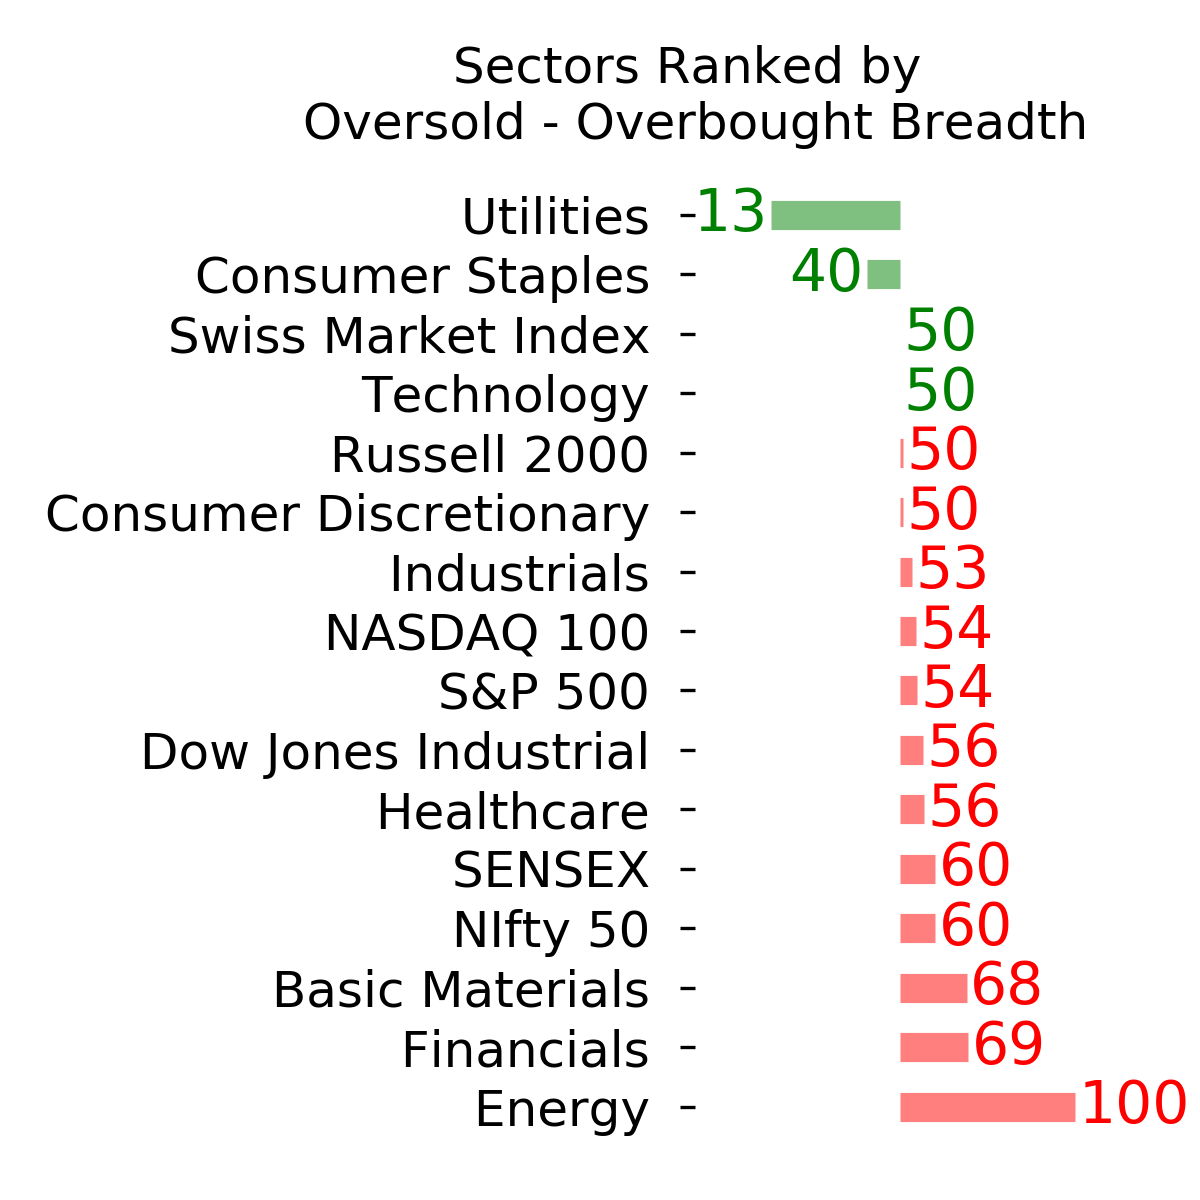
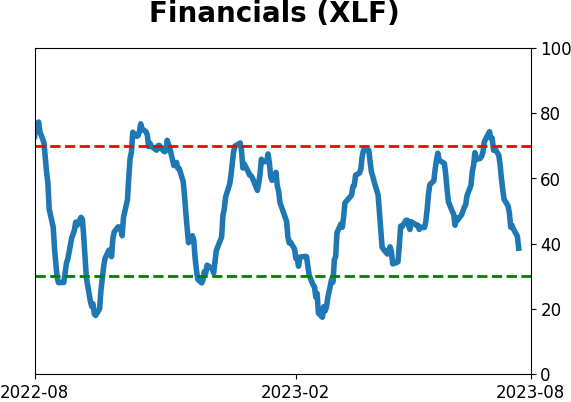
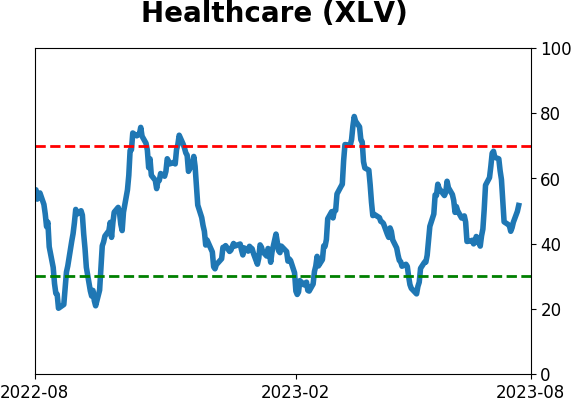
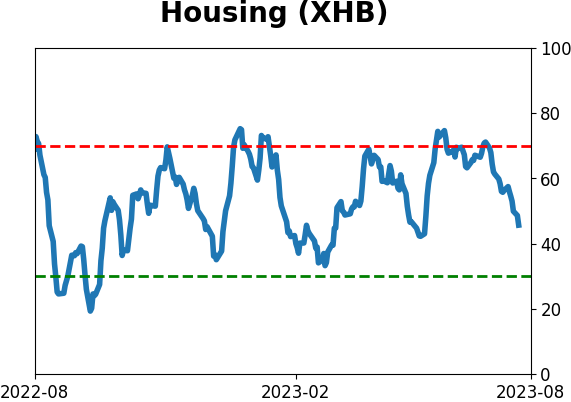
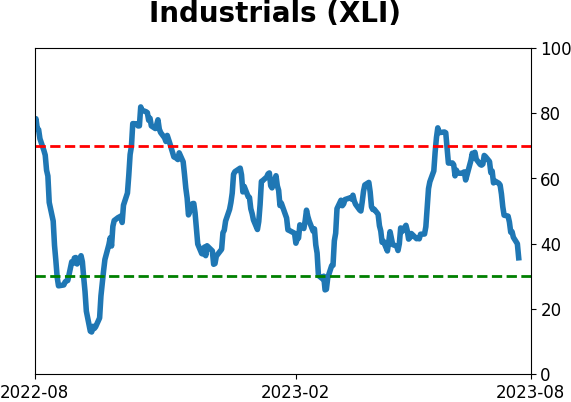
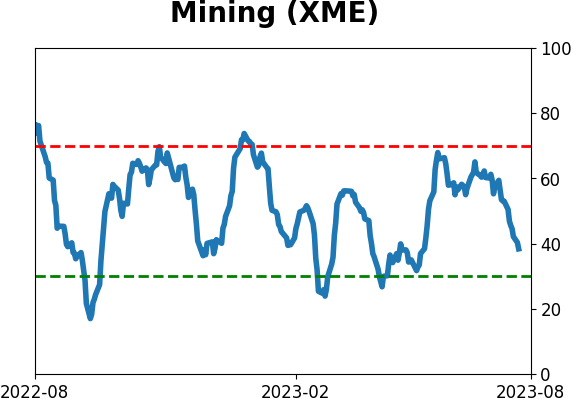
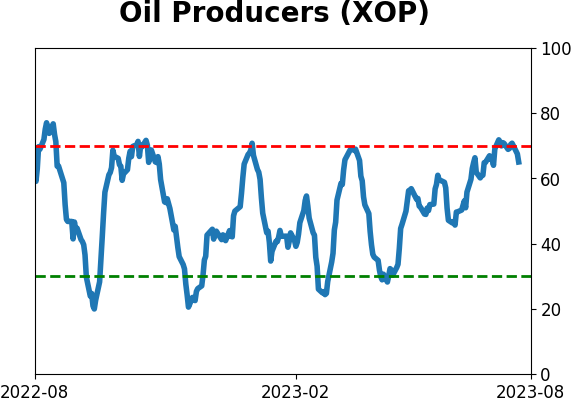
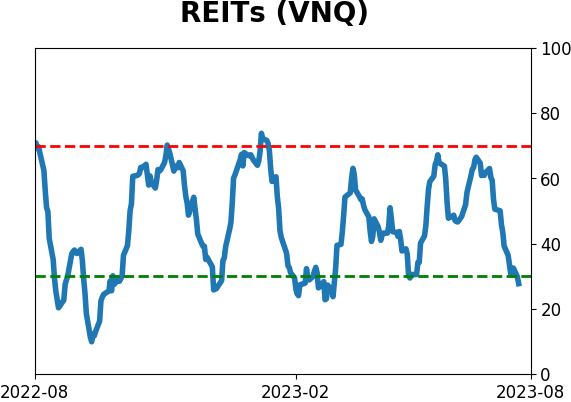
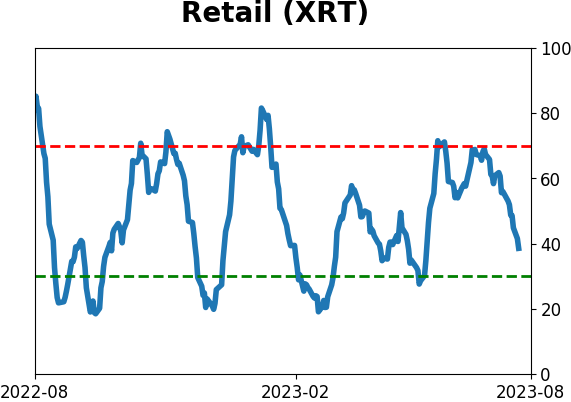
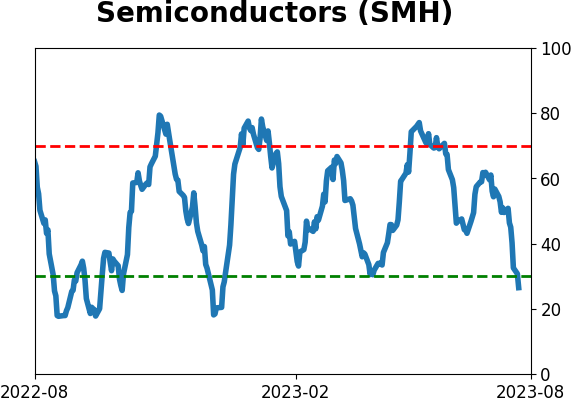
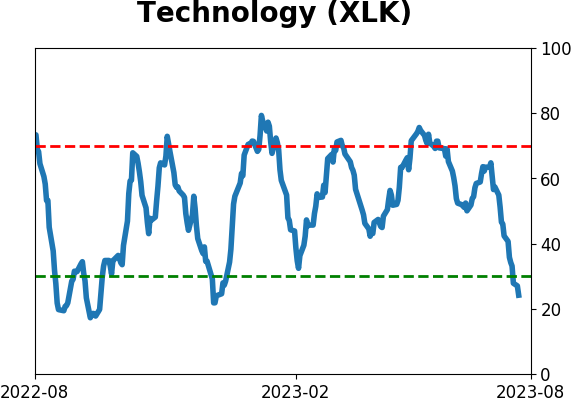
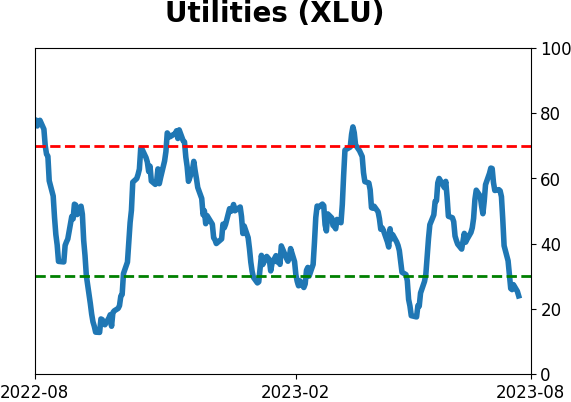
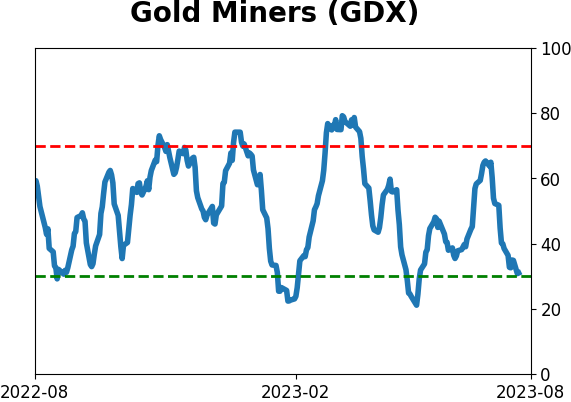
Sector ETF's - 10-Day Moving Average
|
|
|
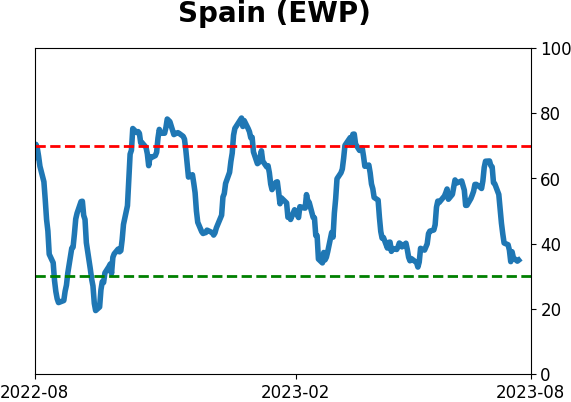
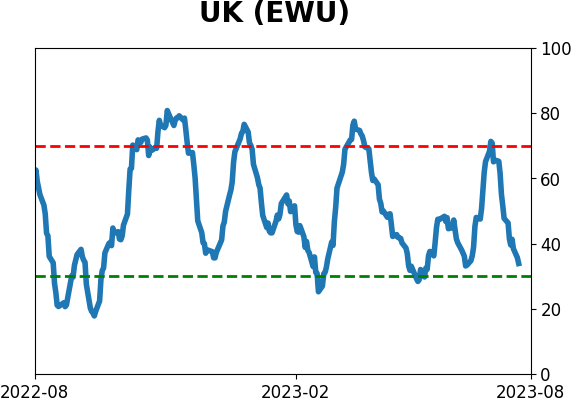
Country ETF's - 10-Day Moving Average
|
|
|
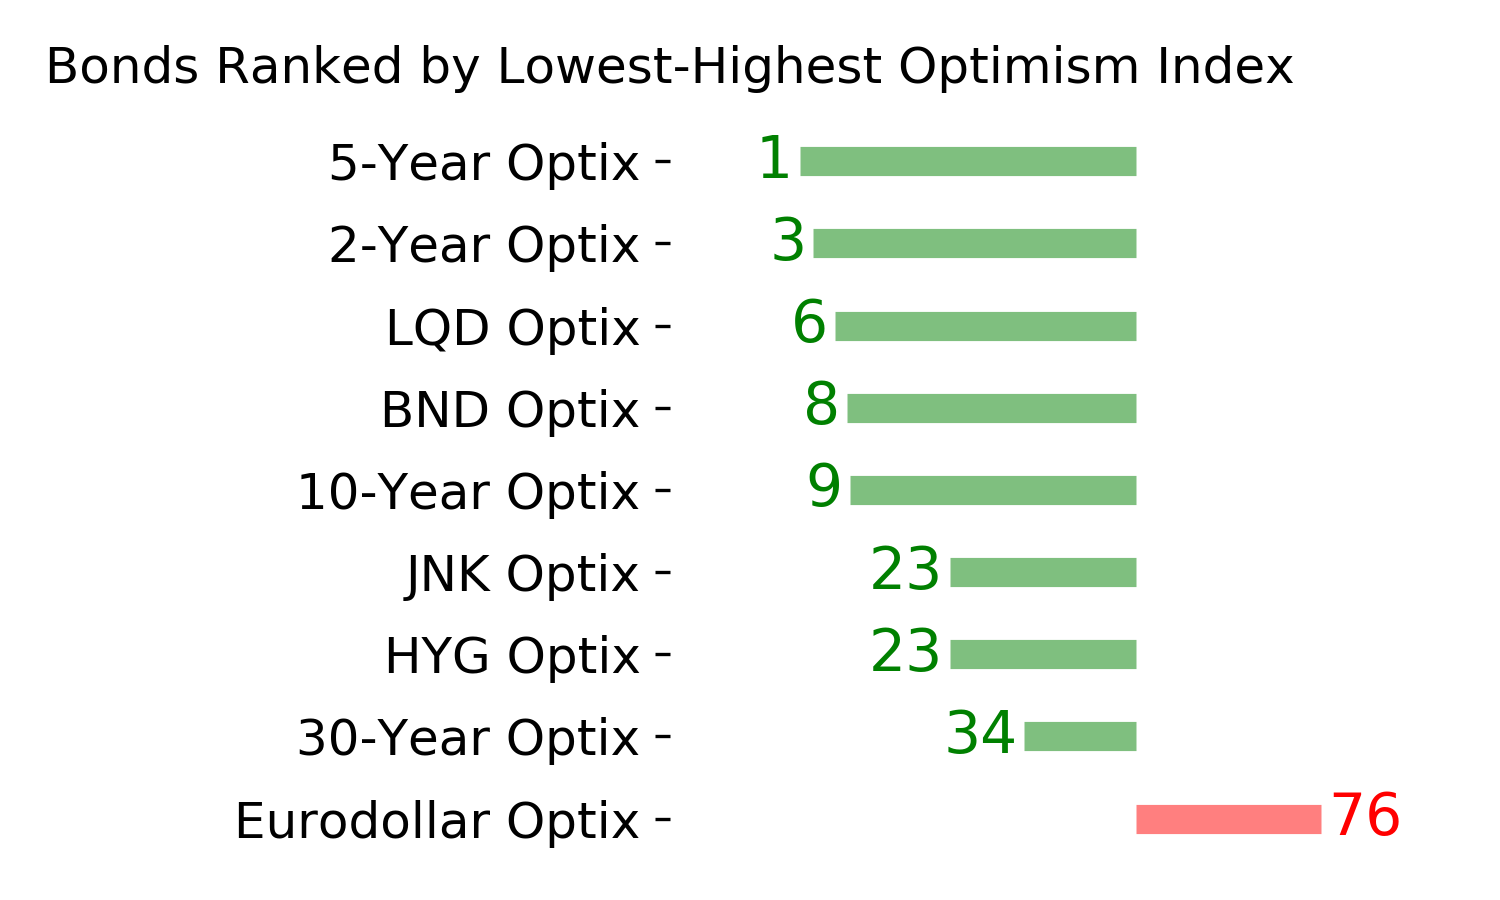
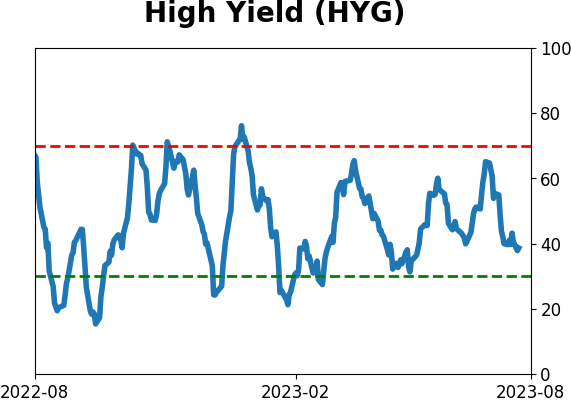
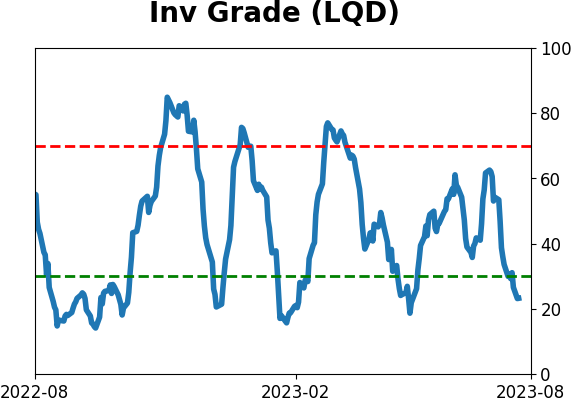
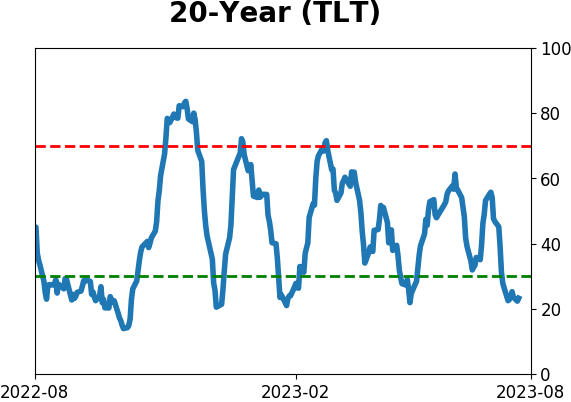
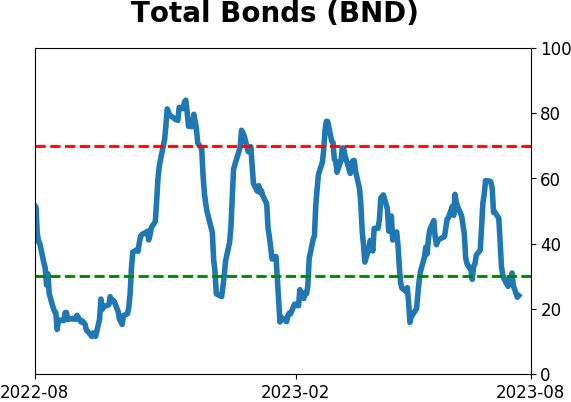
Bond ETF's - 10-Day Moving Average
|
|
|
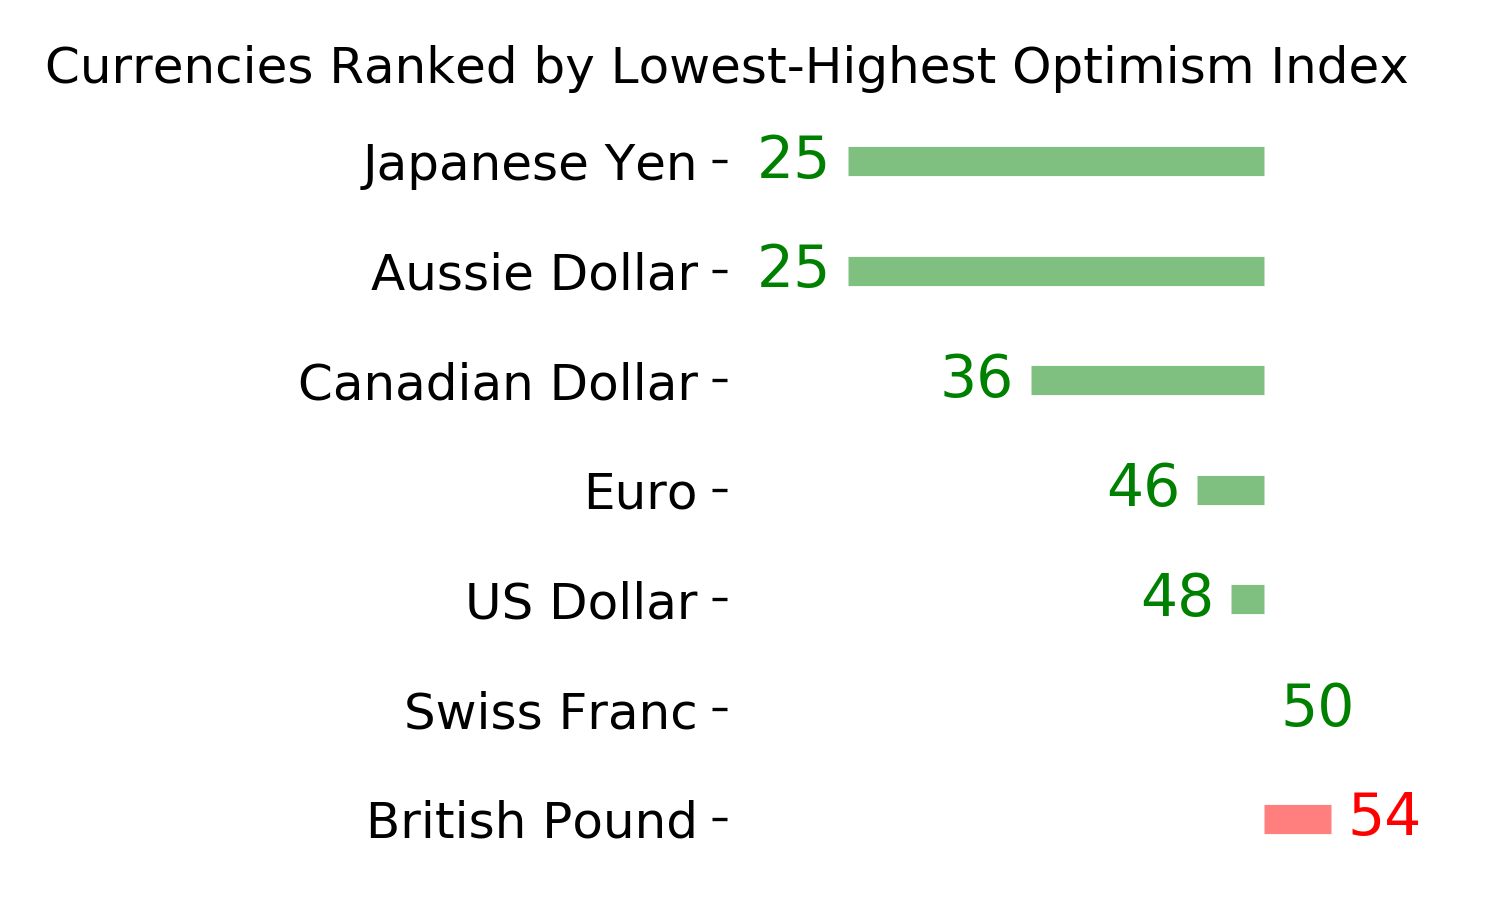
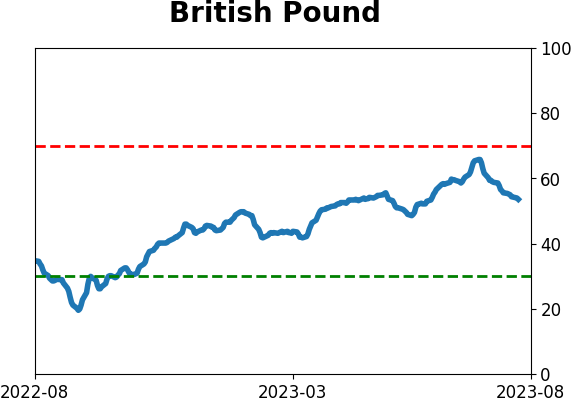
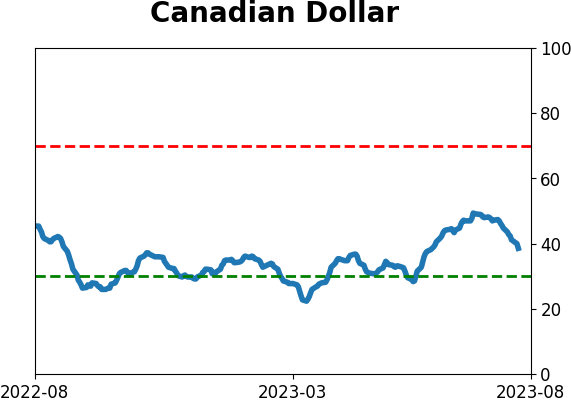
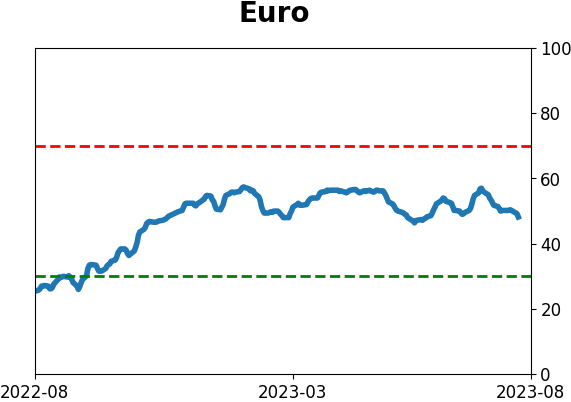
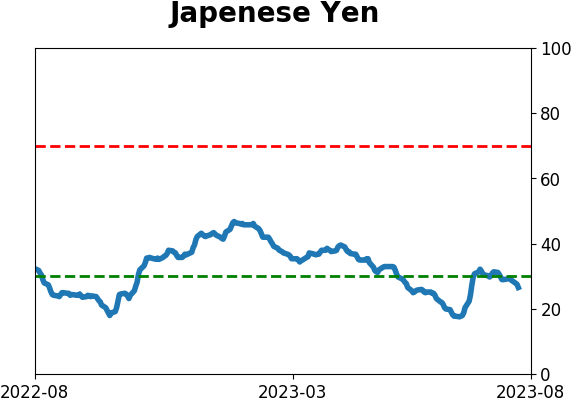
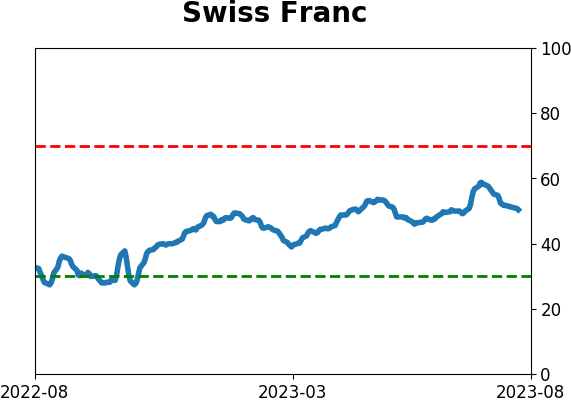
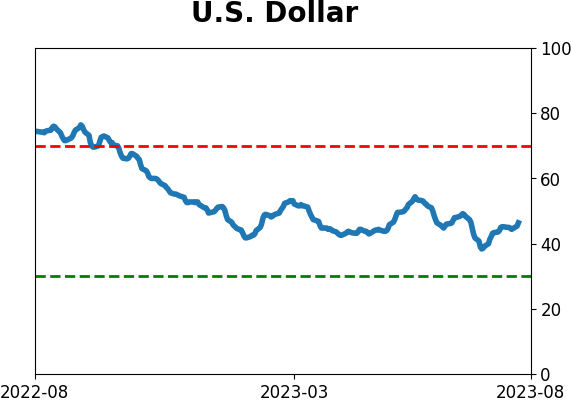
Currency ETF's - 5-Day Moving Average
|
|
|
Commodity ETF's - 5-Day Moving Average
|
|