Headlines
|
|
Small options traders bet against a new high in S&P 500 breadth:
For the first time almost all year, the S&P 500's Cumulative Advance/Decline Line closed at an all-time high on Friday. This is curious because the index itself is still in a drawdown. Breakouts in the A/D Line have preceded gains most of the time, and when the S&P was in a drawdown, it led to one-year gains every time. Even so, small options traders bought more puts last week.
|
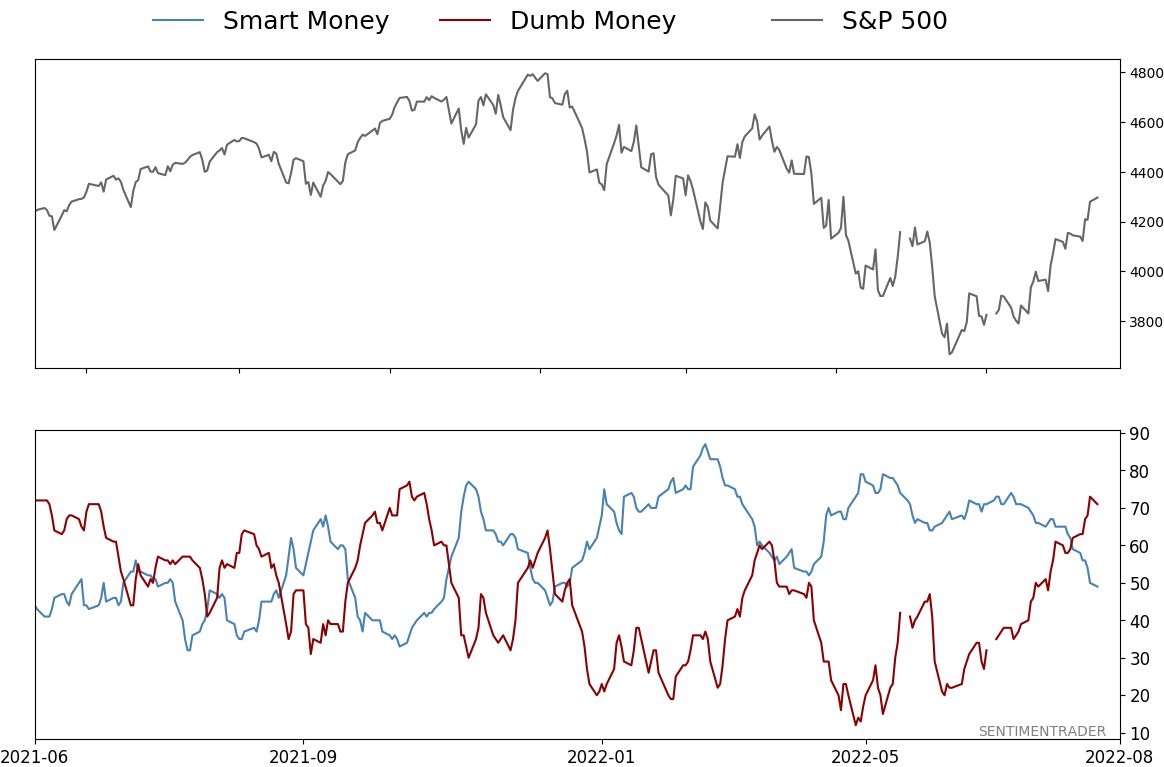
Smart / Dumb Money Confidence
|
Smart Money Confidence: 49%
Dumb Money Confidence: 71%
|
|
Risk Levels
Stocks Short-Term

|
Stocks Medium-Term
|
|
Bonds
|
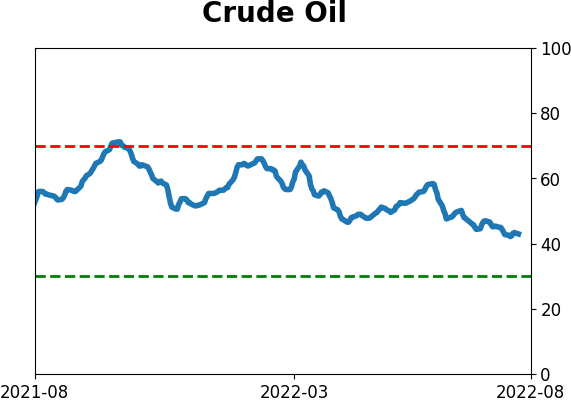
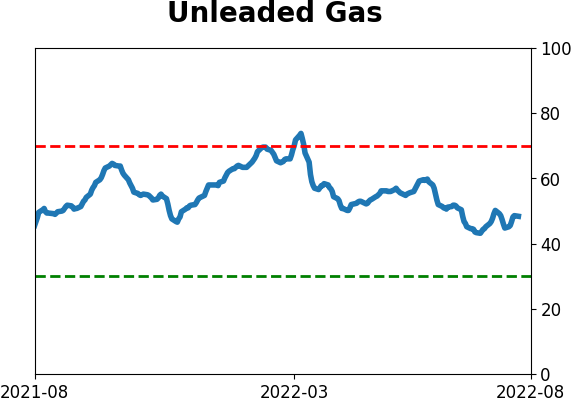
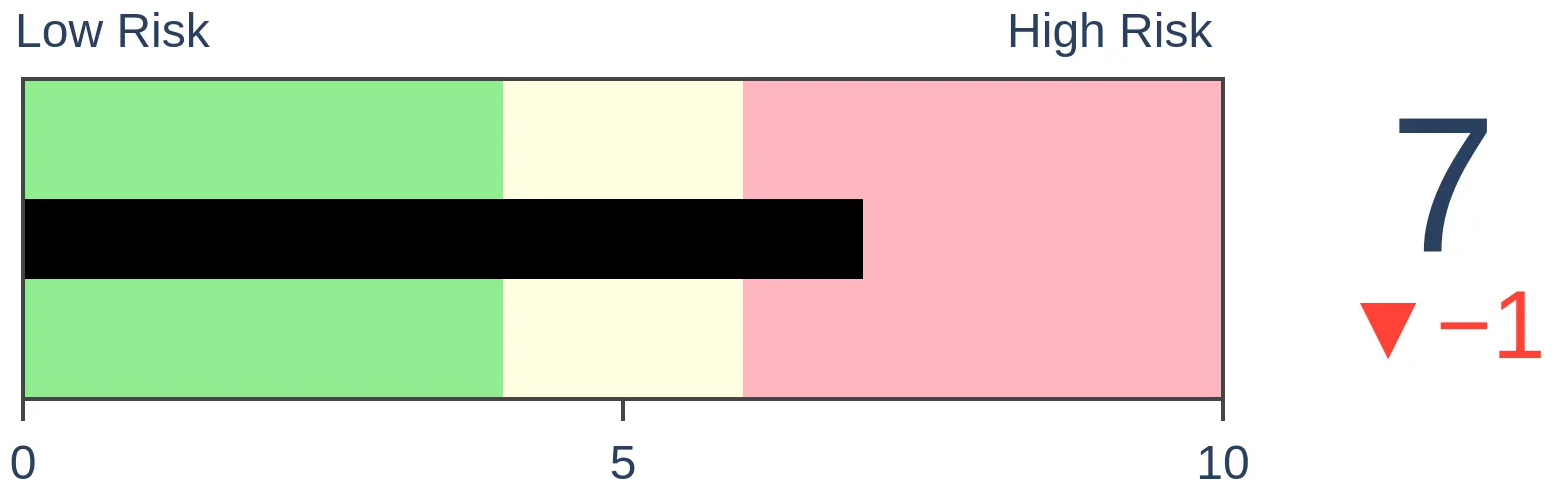
Crude Oil
|
|
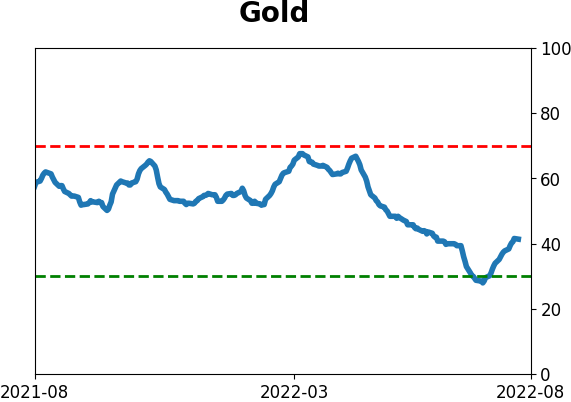
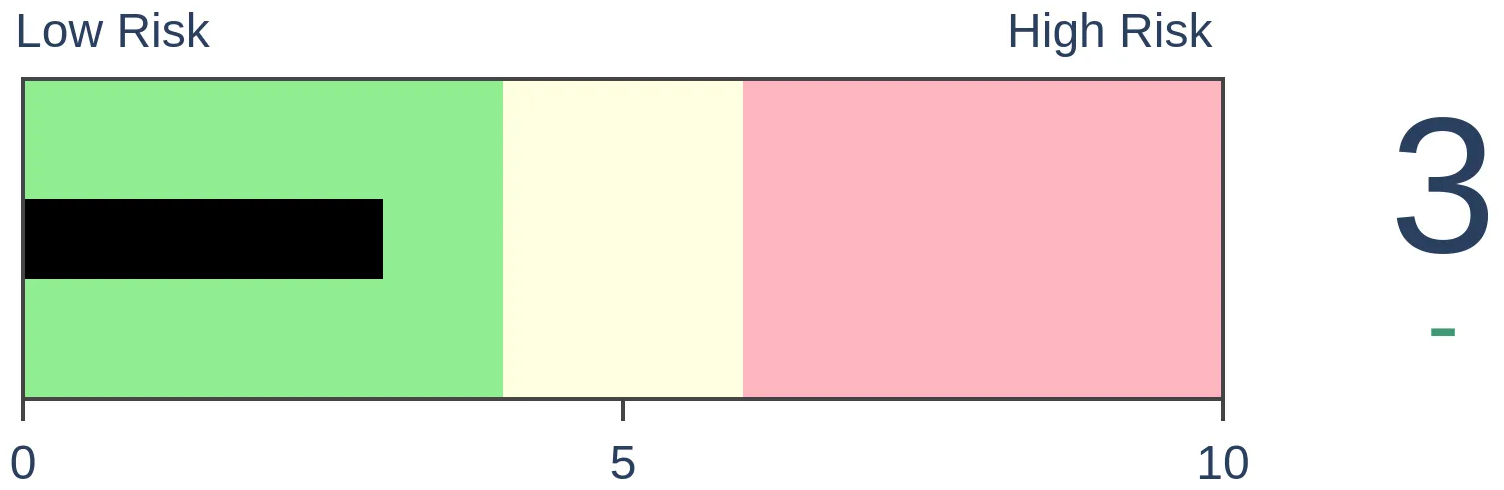
Gold
|
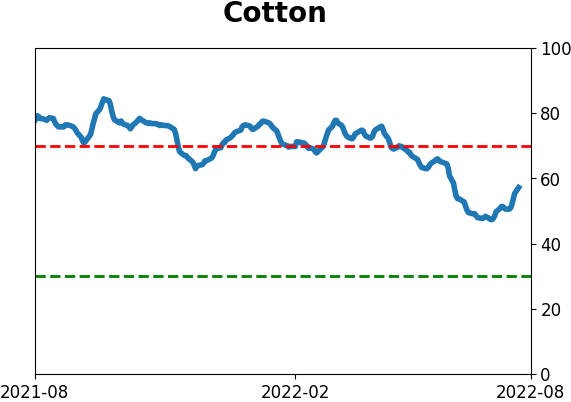
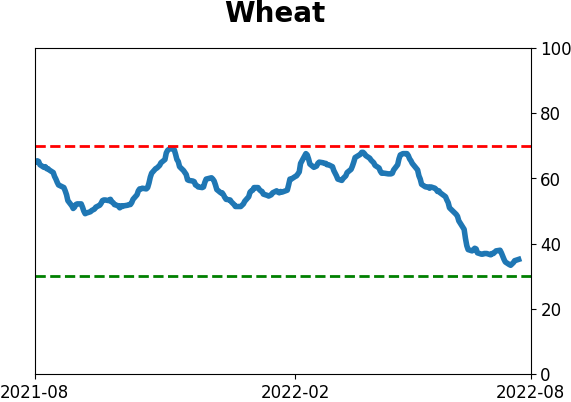
Agriculture

|
|
Research
By Jason Goepfert
BOTTOM LINE
For the first time almost all year, the S&P 500's Cumulative Advance/Decline Line closed at an all-time high on Friday. This is curious because the index itself is still in a drawdown. Breakouts in the A/D Line have preceded gains most of the time, and when the S&P was in a drawdown, it led to one-year gains every time. Even so, small options traders bought more puts last week.
FORECAST / TIMEFRAME
SPY -- Up, Long-Term
|
Key points:
- The Cumulative Advance/Decline Line for the S&P 500 has hit a new all-time high
- Multi-year highs in the A/D Line have preceded long-term gains for the index
- When the S&P 500 was in a drawdown at the time, breakouts led to one-year gains every time
- Small options traders bought more puts last week, despite the rally
For the first time in months, breadth breaks out
Sometimes, there is a definite benefit in betting on the average stock rather than some arbitrarily or rules-based version of an index. For the S&P 500, that has been the case for a while now.
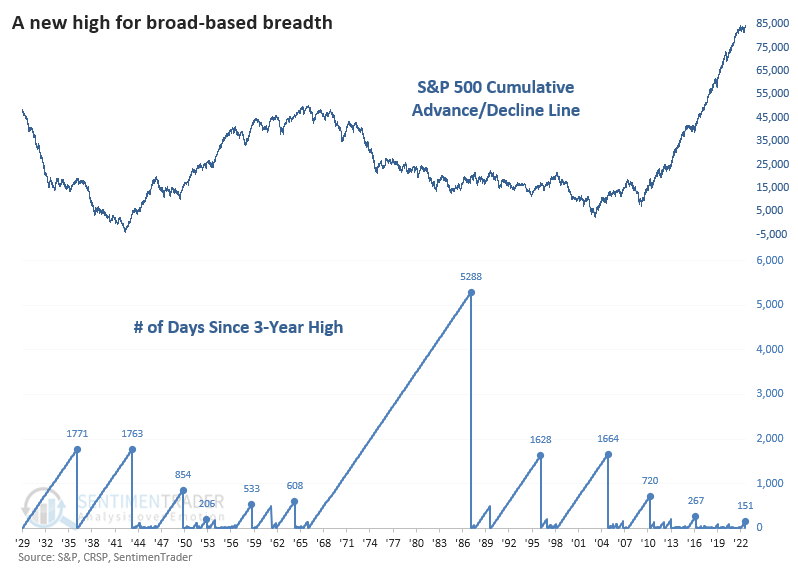
With an impressive and broad-based rally over the past month, the Cumulative Advance/Decline Line for the S&P just reached a new all-time high. The index itself is capitalization-weighted, and weakness in some of its big component stocks has left it more than 10% below its own high.
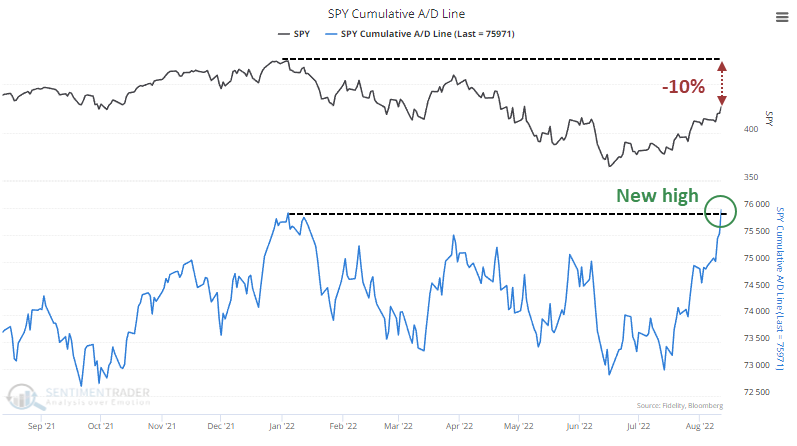
The new high in the A/D Line is the first in more than 100 days. From its start, however, the index has certainly gone through much longer periods without a new high in breadth. The current streak was the 3rd-longest of the past decade.
Breakouts in breadth have led to long-term gains
When the A/D Line reached a new high for the first time in years, it was a good sign for the index in the weeks and months ahead. Failures tended to be muted, with only one loss of more than -5% over the next two months.
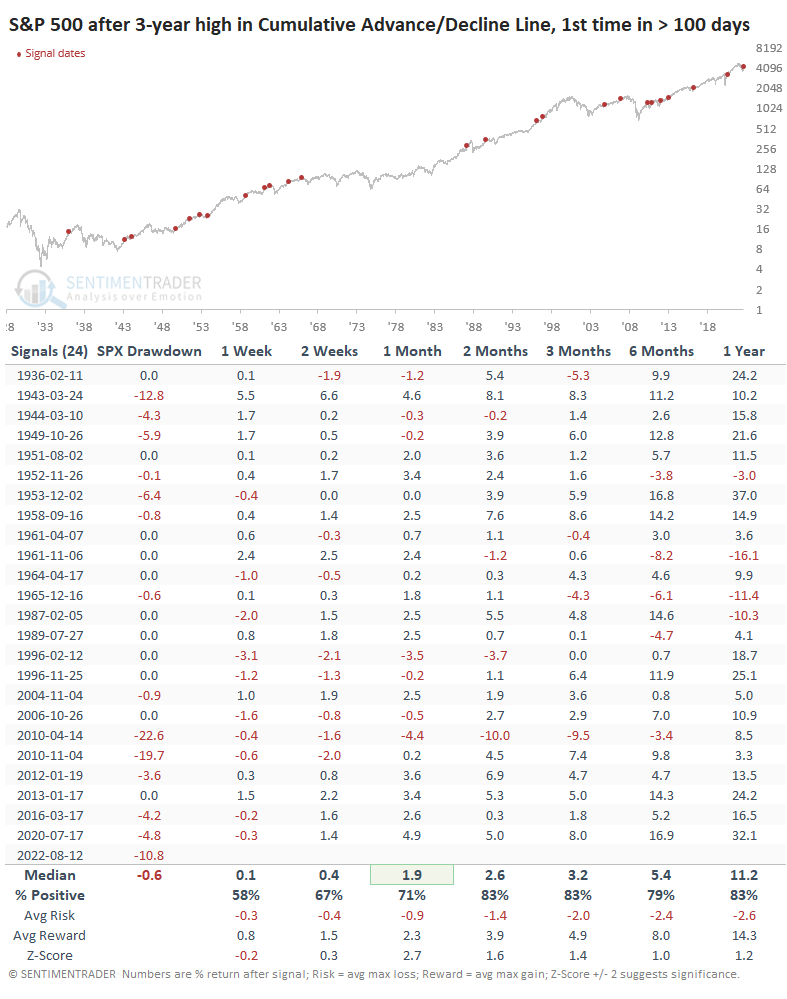
The "SPX Drawdown" column in the chart shows that, on average, the S&P 500 index was only 0.6% below its 3-year high when the A/D Line broke out. There aren't many red numbers in that column, meaning that the index and its A/D Line usually made new highs simultaneously.
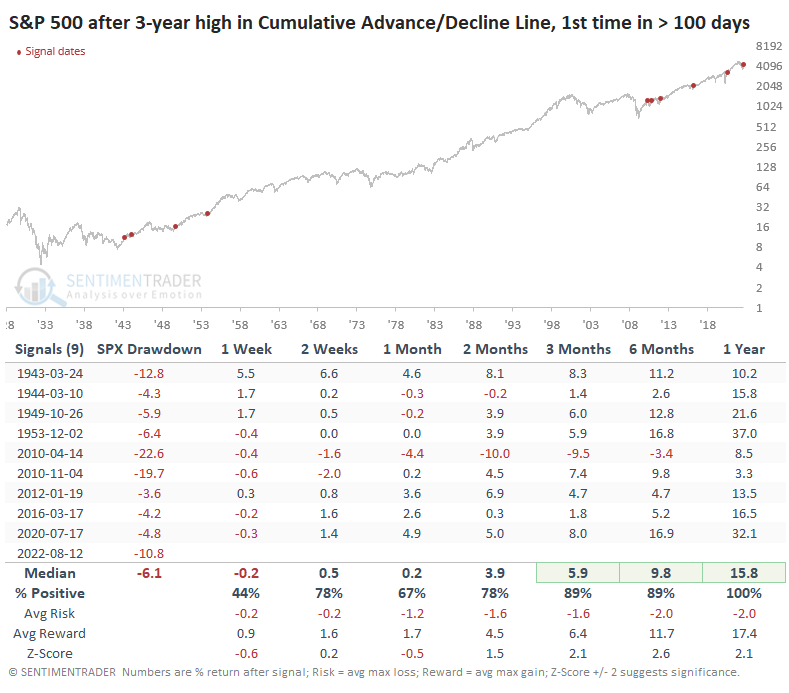
The current breakout is only the fourth time in history when the index was more than 10% below its high. The others saw the S&P 500 make decent gains over the next year. In fact, any time the index was more than 1% below its high, it showed gains.
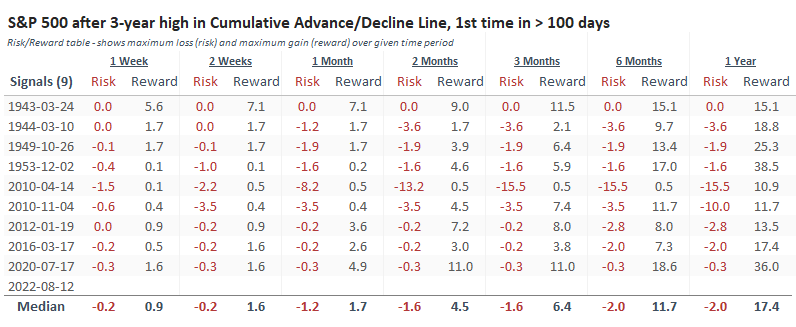
The Risk/Reward Table shows that over the next six months, only one signal saw the index lose more than -4% at any point. That's a pretty remarkable amount of consistency.
Small traders ain't buying it
We've touched on the behavior of small options traders several times in recent weeks, as they've behaved oddly. They have been relatively pessimistic (exceptionally so in June) and then apparently decided the rally was real two weeks ago when prices barely budged.
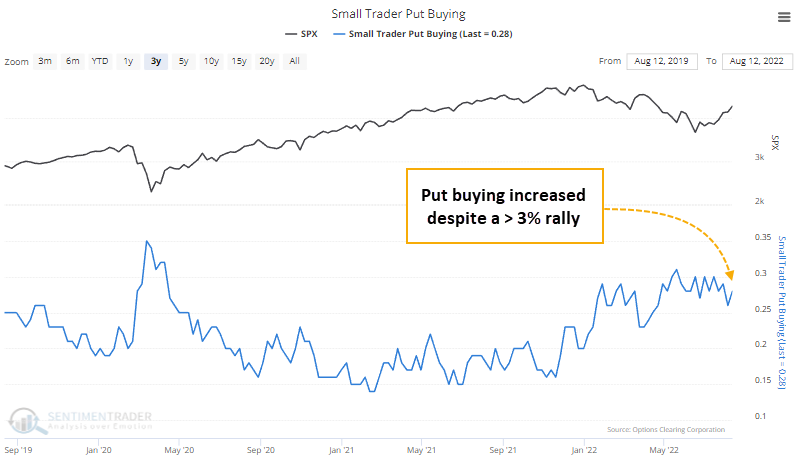
That's what makes last week so odd. Stocks resumed their rally forcefully, and we should have seen retail traders become even more excited. After all, if they got optimistic after less than a 1% weekly rise, surely they'd become even more enthusiastic after the S&P jumped more than 3%.
But they didn't.
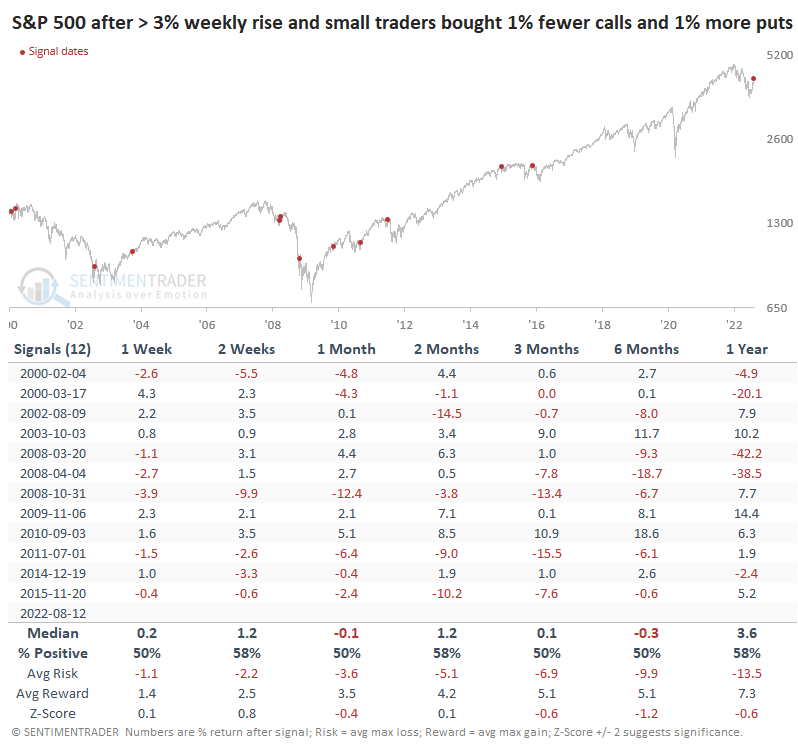
Despite the jump in stocks, small traders bought fewer call options to open and bought more put options. This is the first time since August 2020 when the S&P rose at least 3%, and small traders bought 5% more put options than the week prior. And it's the first time since 2009 when the S&P rose so much, put buying increased, AND call buying decreased.
We've noted forever that bull markets need rising optimism to be sustained, so this isn't automatically a good sign. Small traders are among the most consistent contrary indicators extant, but not for every week and not for every wiggle.
The table below shows future S&P 500 returns after similar behavior by small traders. Those returns were mostly positive but inconsistent and below random.
It's possible to read too much into any indicator, and this is one of them. We can't glean stocks' prospects from weekly gyrations in options (or any other) data. It's more important to watch larger patterns and true extremes.
Given their historic pessimism in June, we're more concerned now with watching for the opposite extreme. If they become too optimistic and buy an excessive amount of calls, then we should be more worried about future concerns.
Based on their behavior last week, it's going to be a while before we need to worry about that.
What the research tells us...
Investors were historically pessimistic in June, then stormed back in July and so far in August, triggering a bevy of breadth thrusts. The retracement of the decline has exceeded what most bear markets witness. All of those factors taken together have significantly increased the probability that this is not likely just another bear market rally, and stocks should be able to sustain the gains. A breakout in the A/D Line for the most benchmarked index in the world is another mark in that column.
Indicators at Extremes
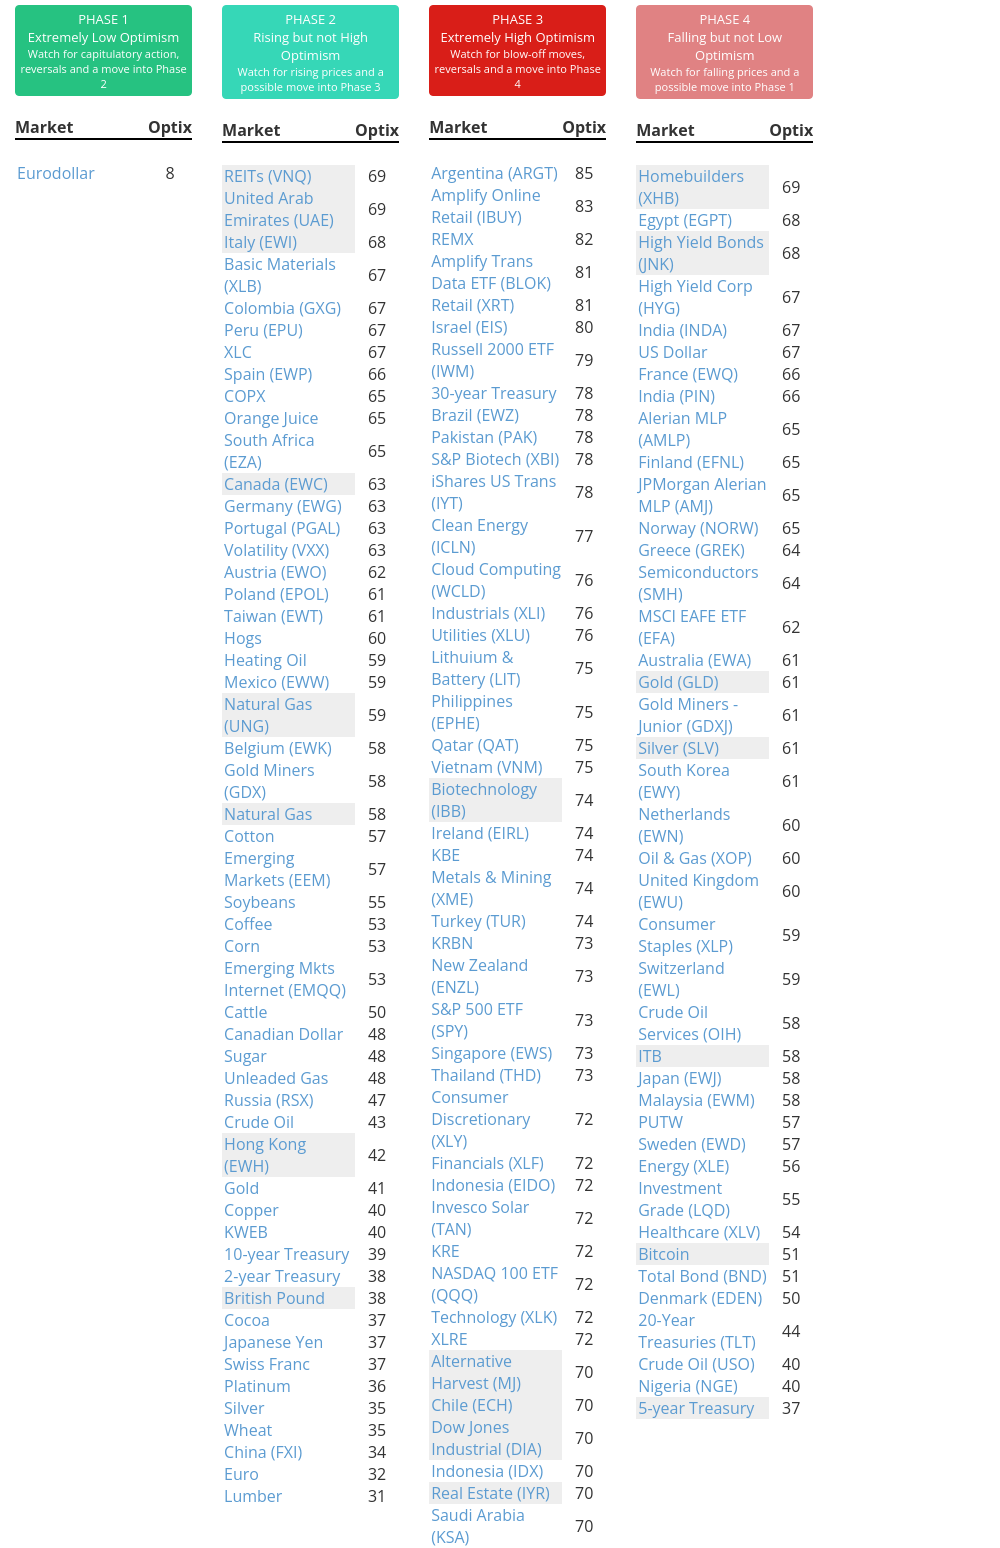
Phase Table
Ranks
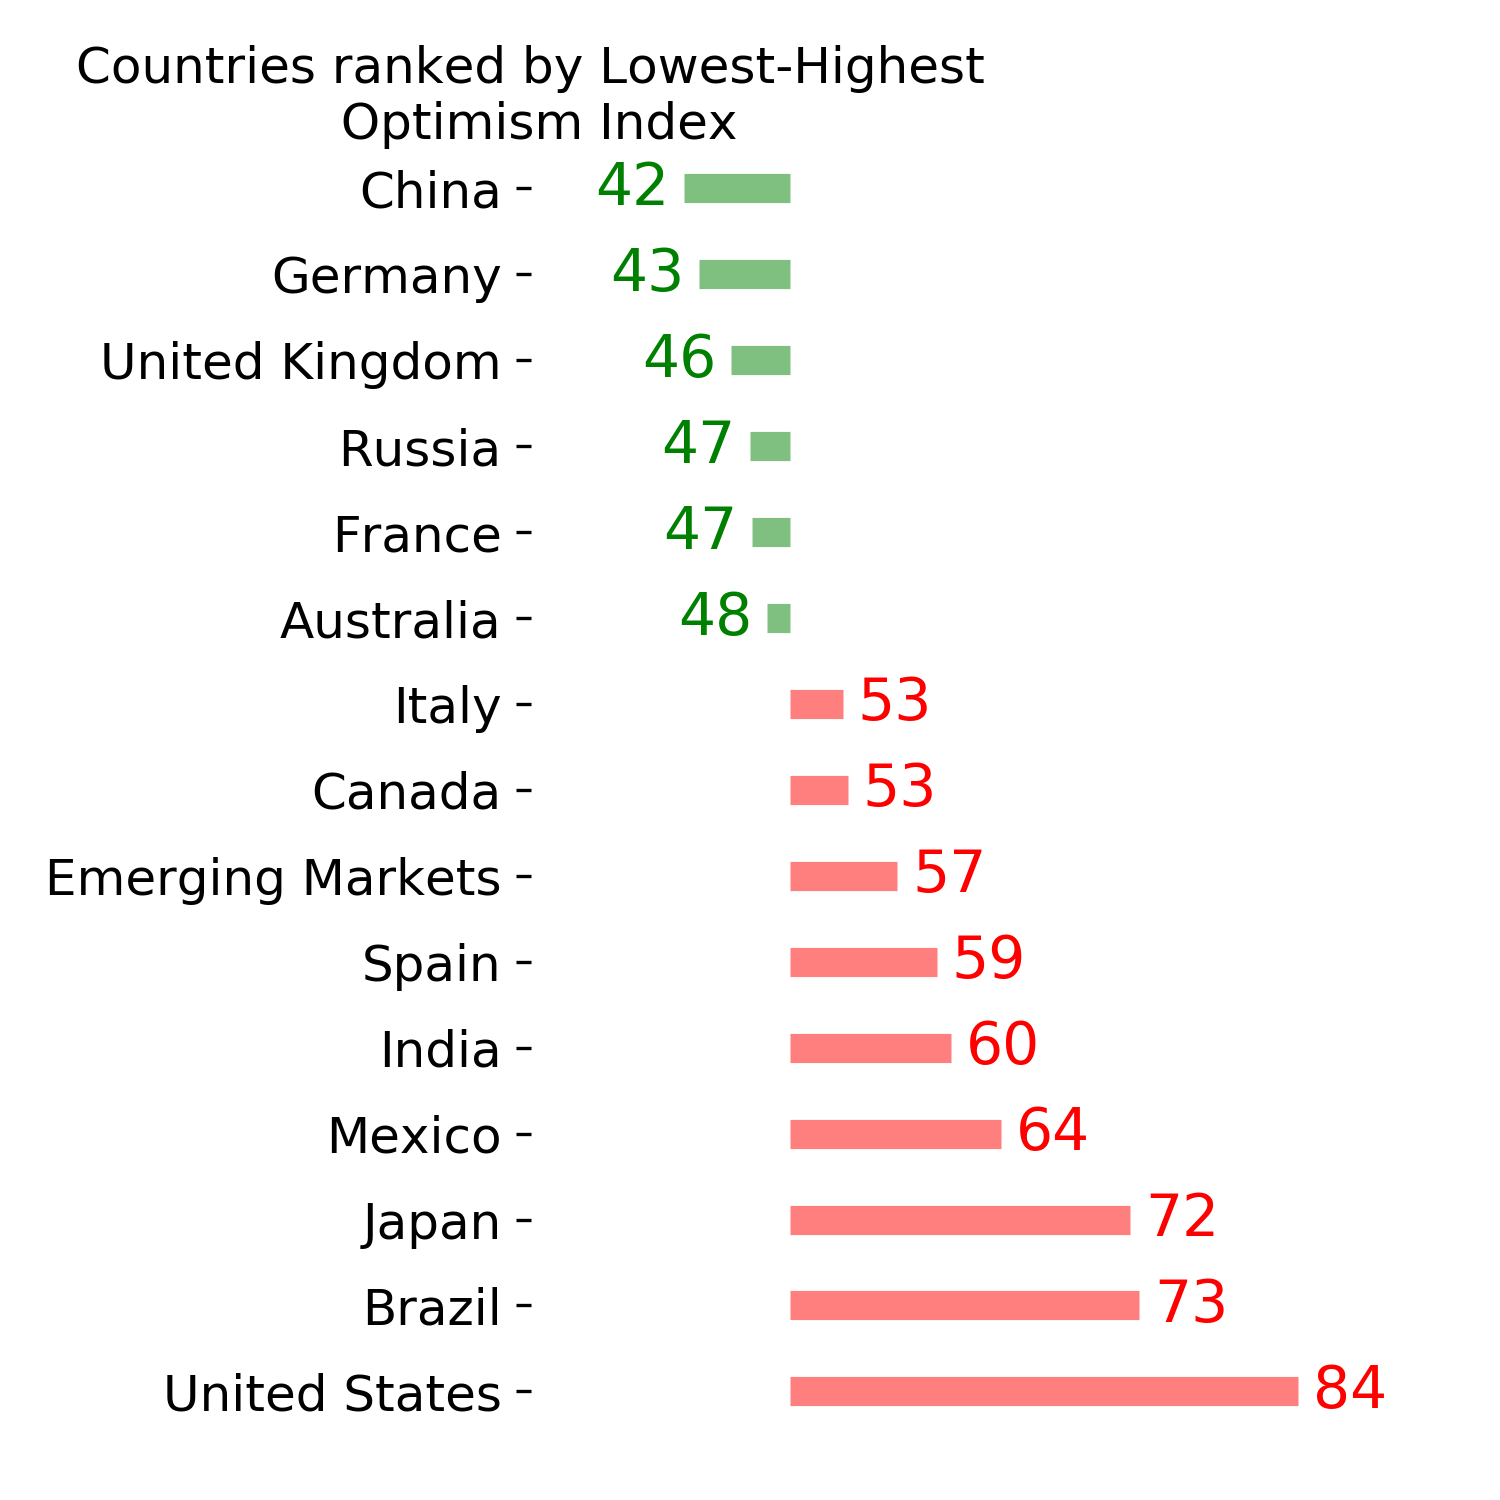
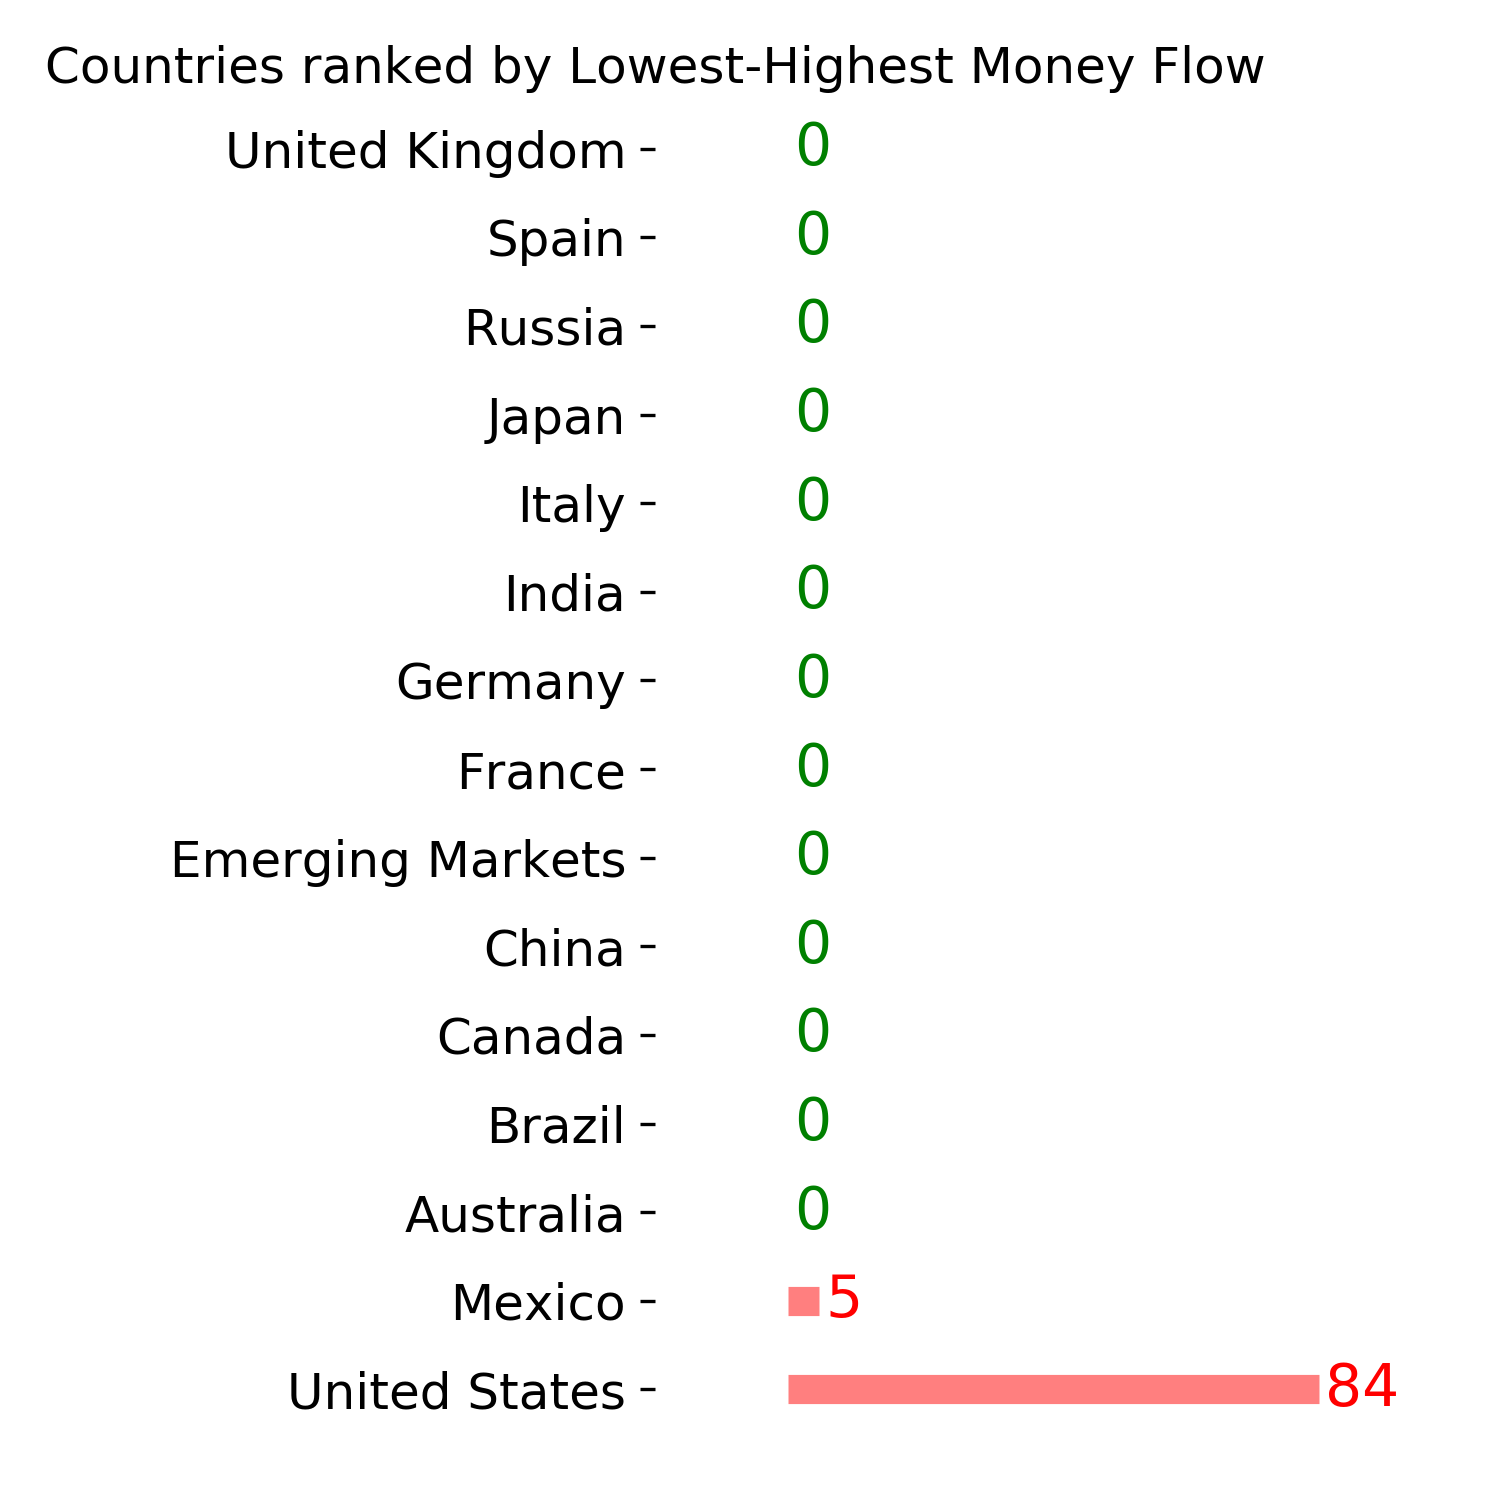
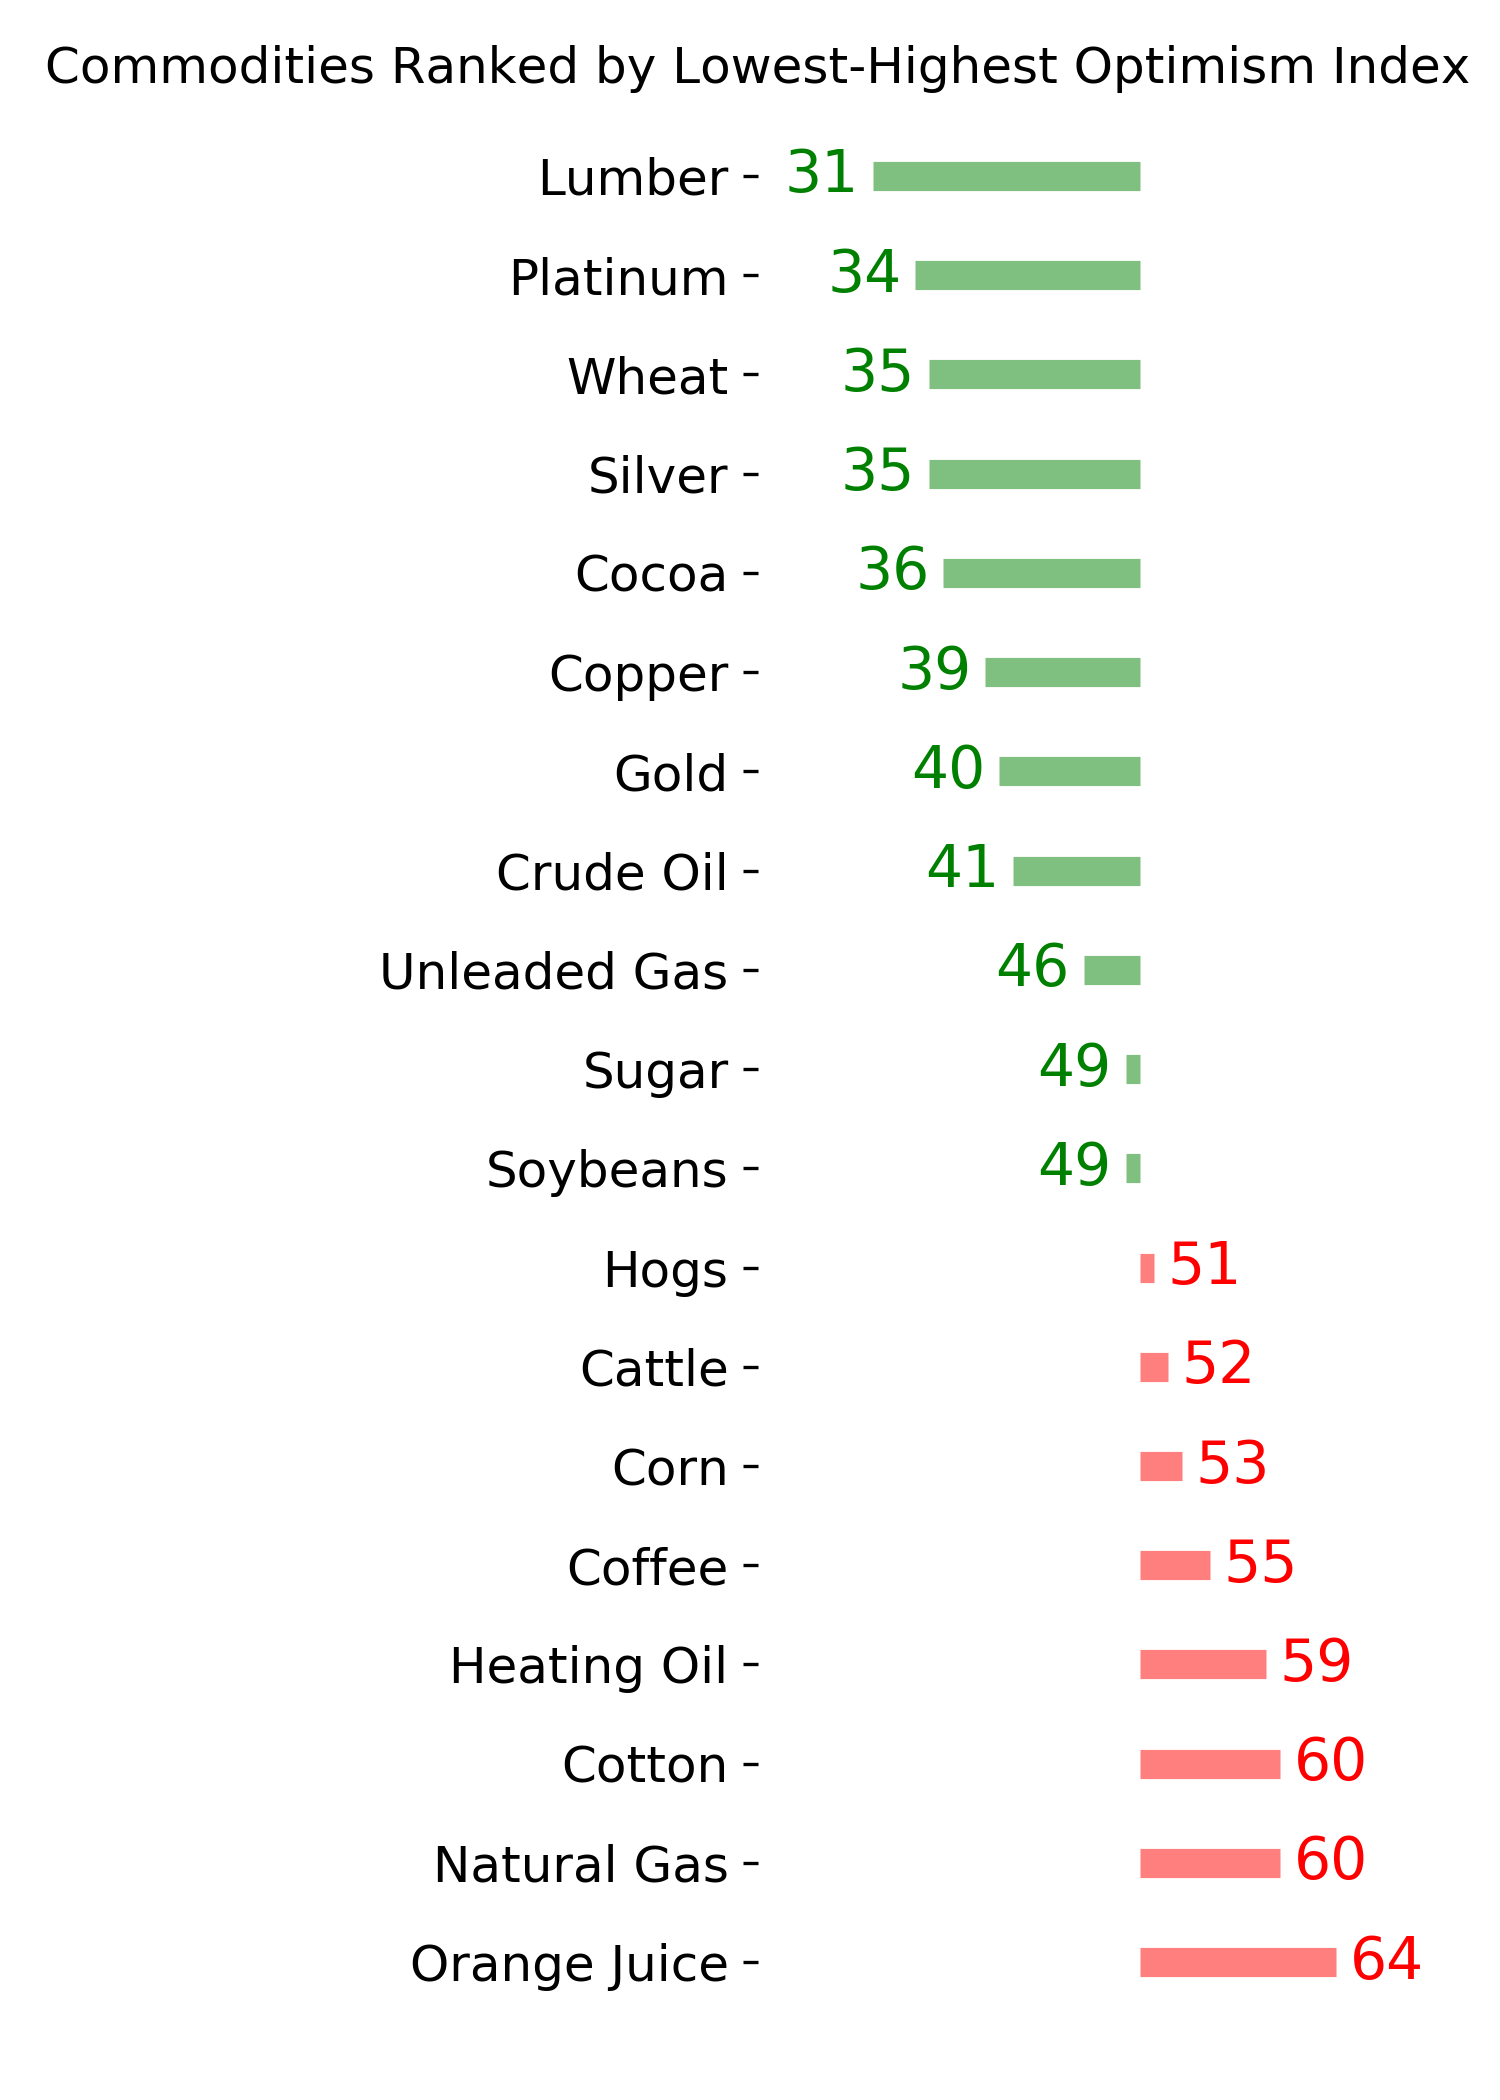
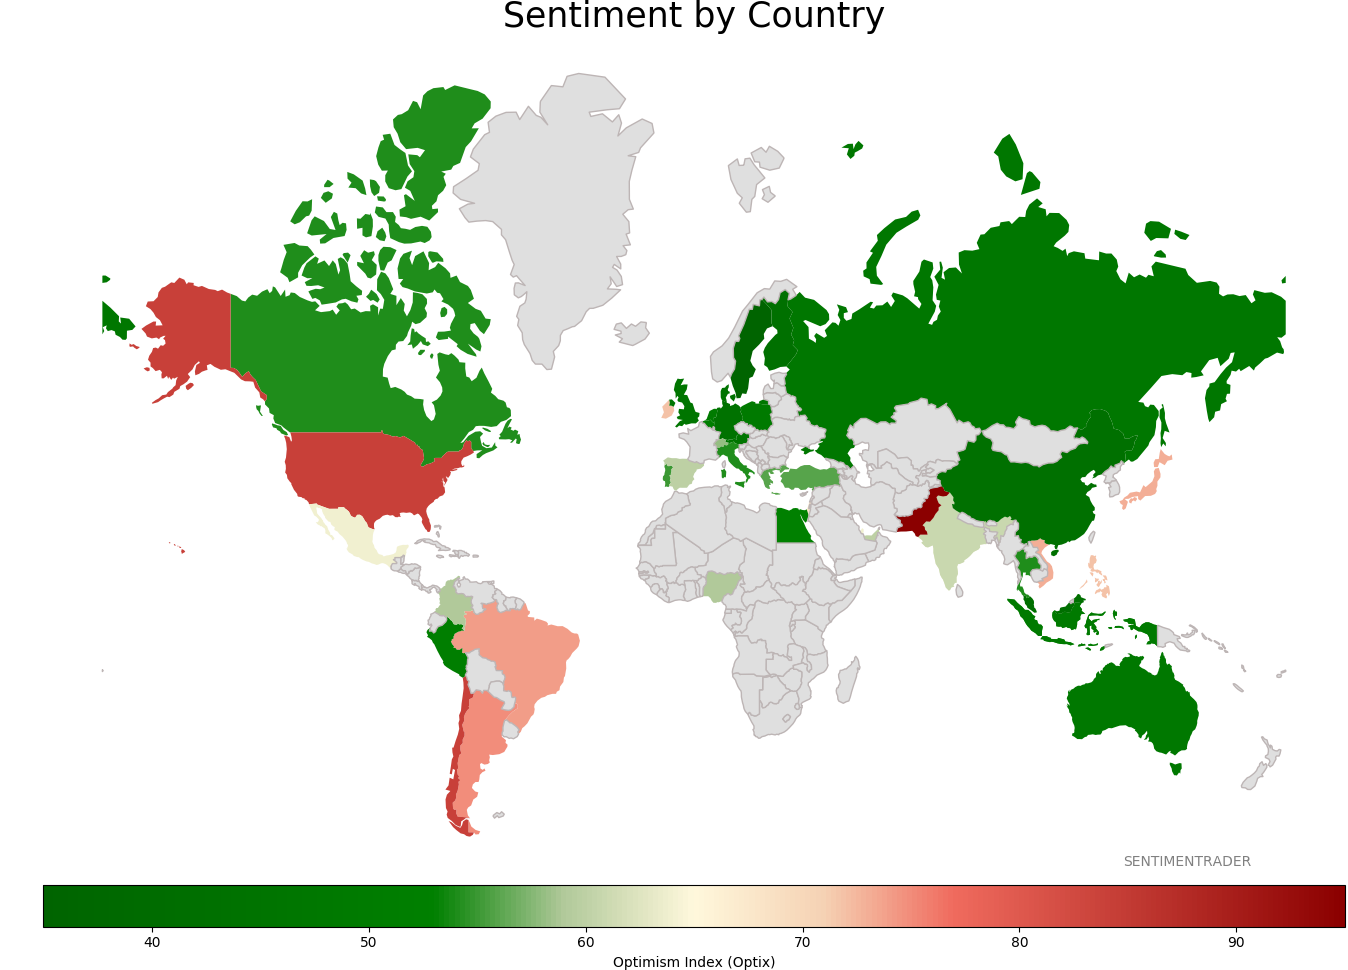
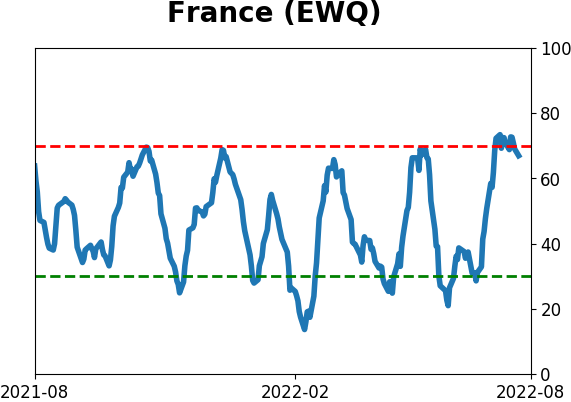
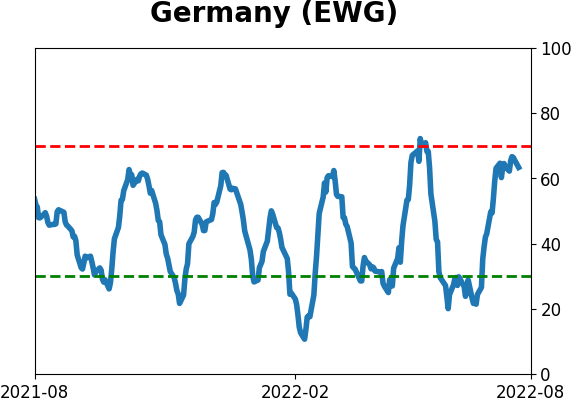
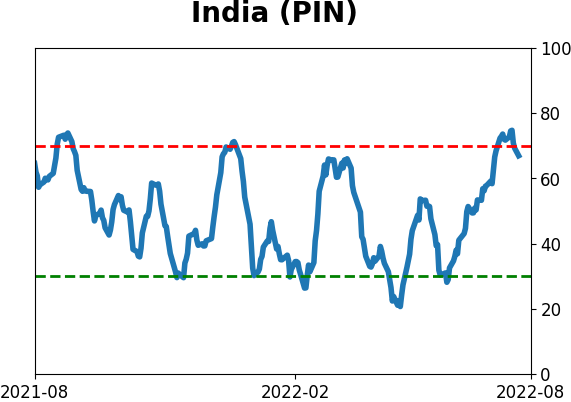
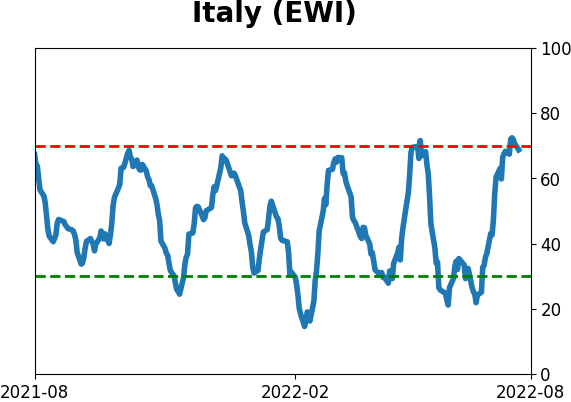
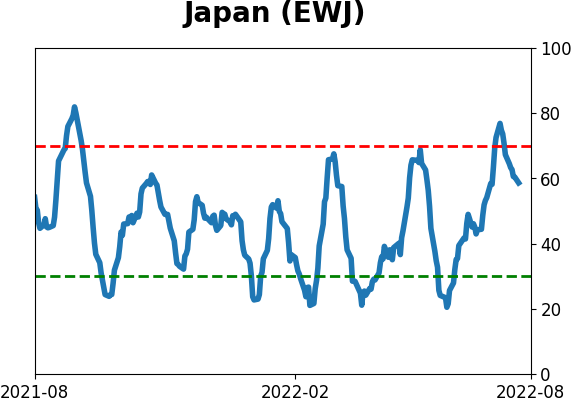
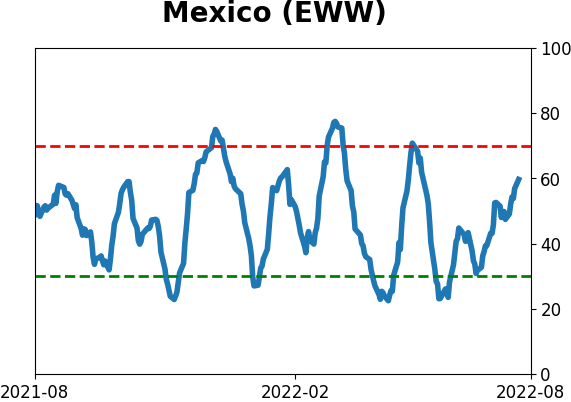
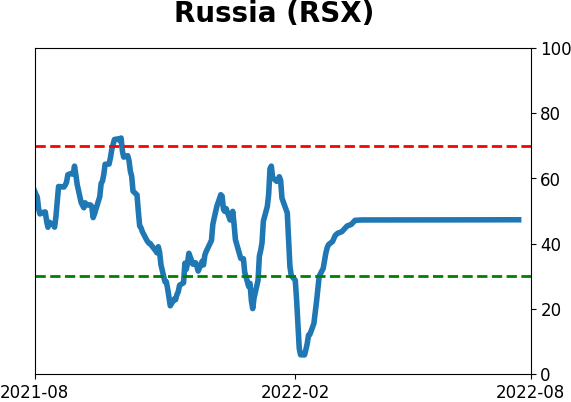
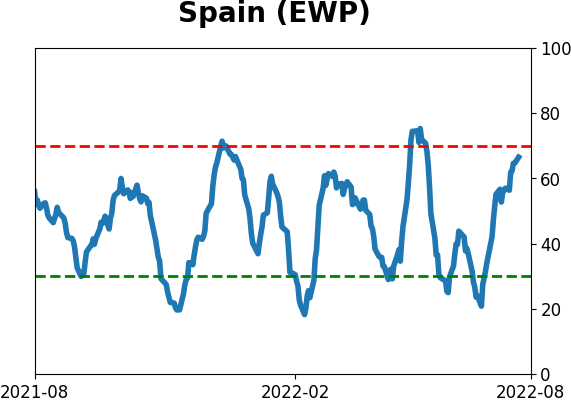
Sentiment Around The World
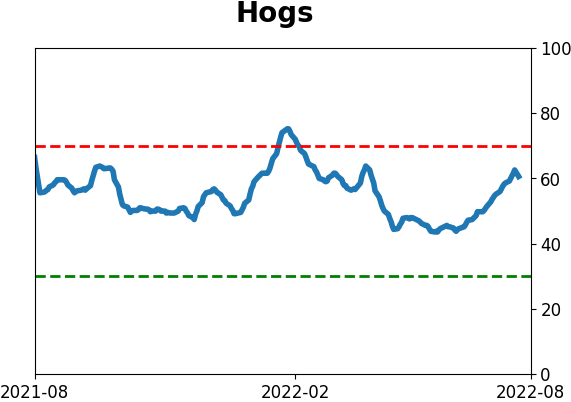
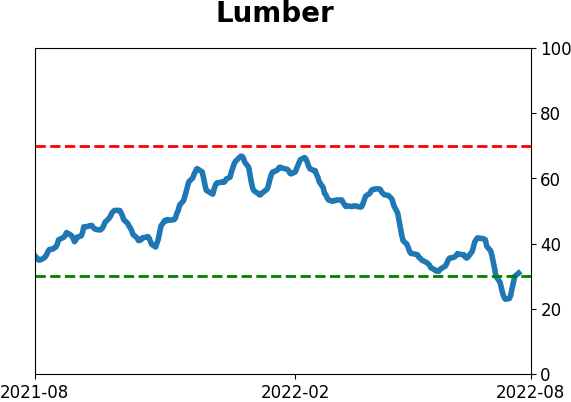
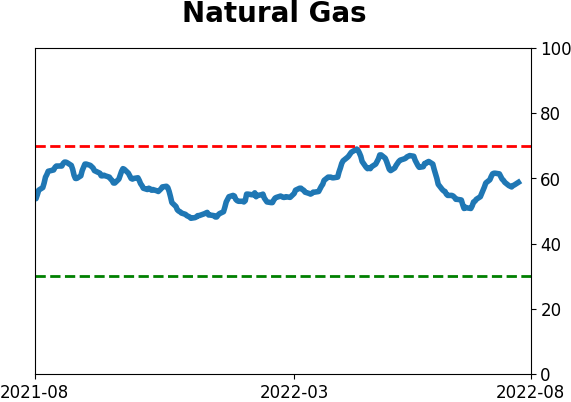
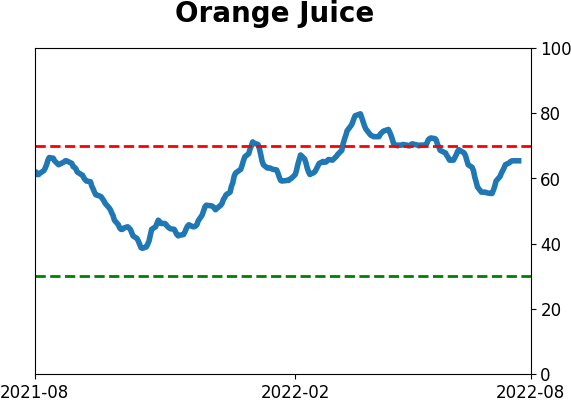
Optimism Index Thumbnails
|
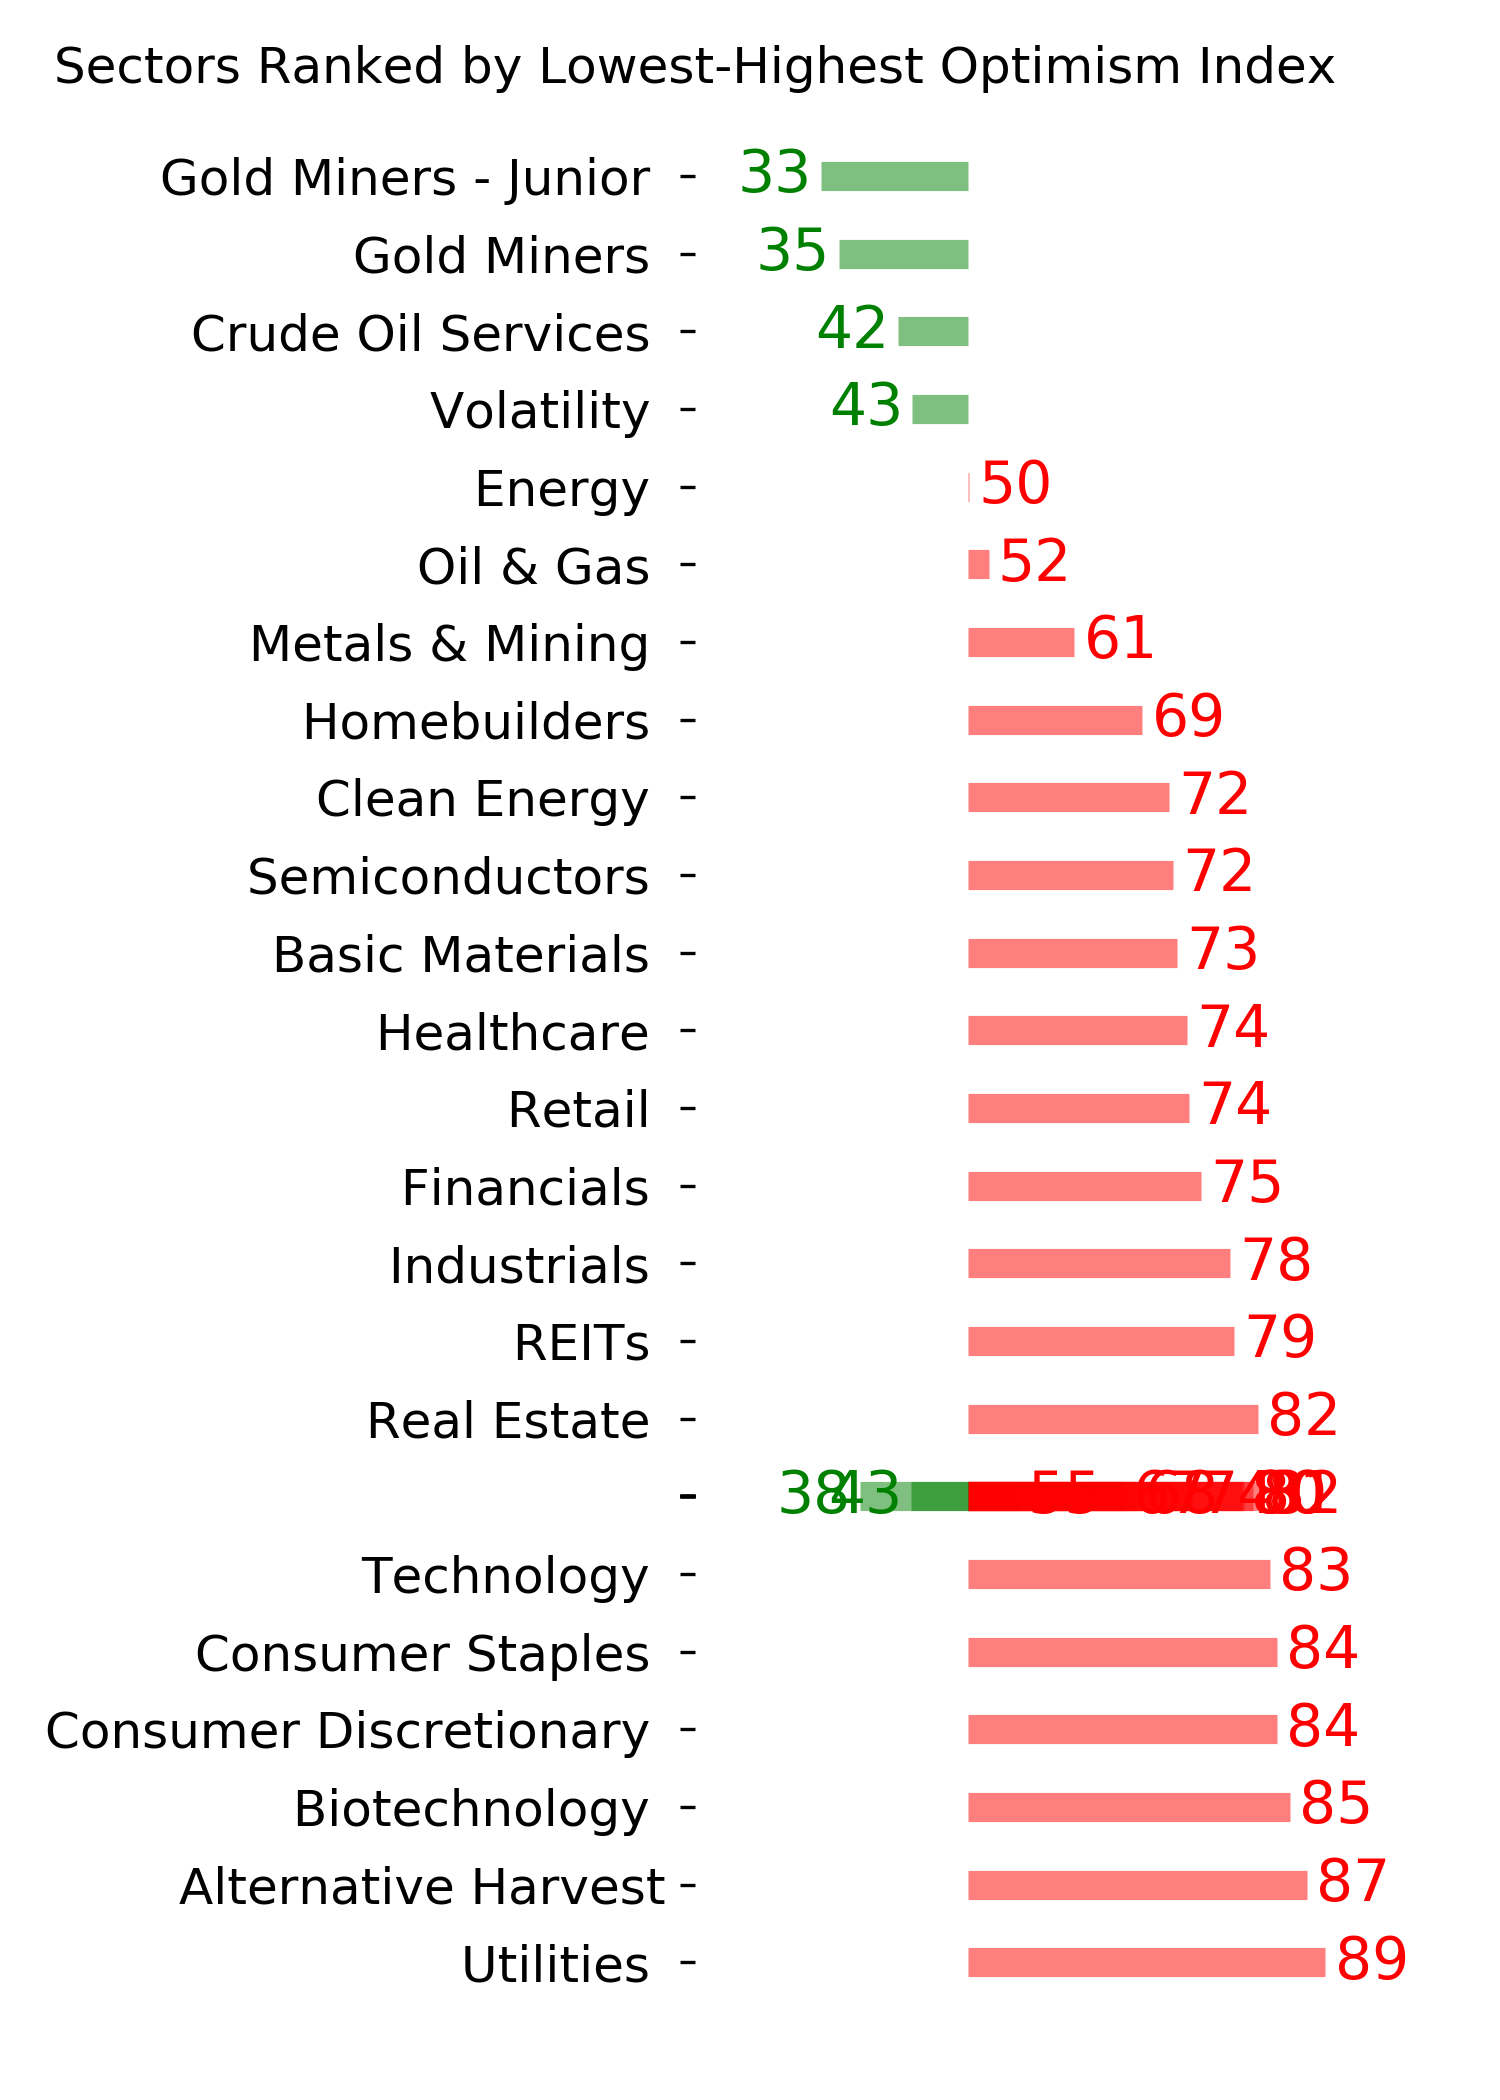
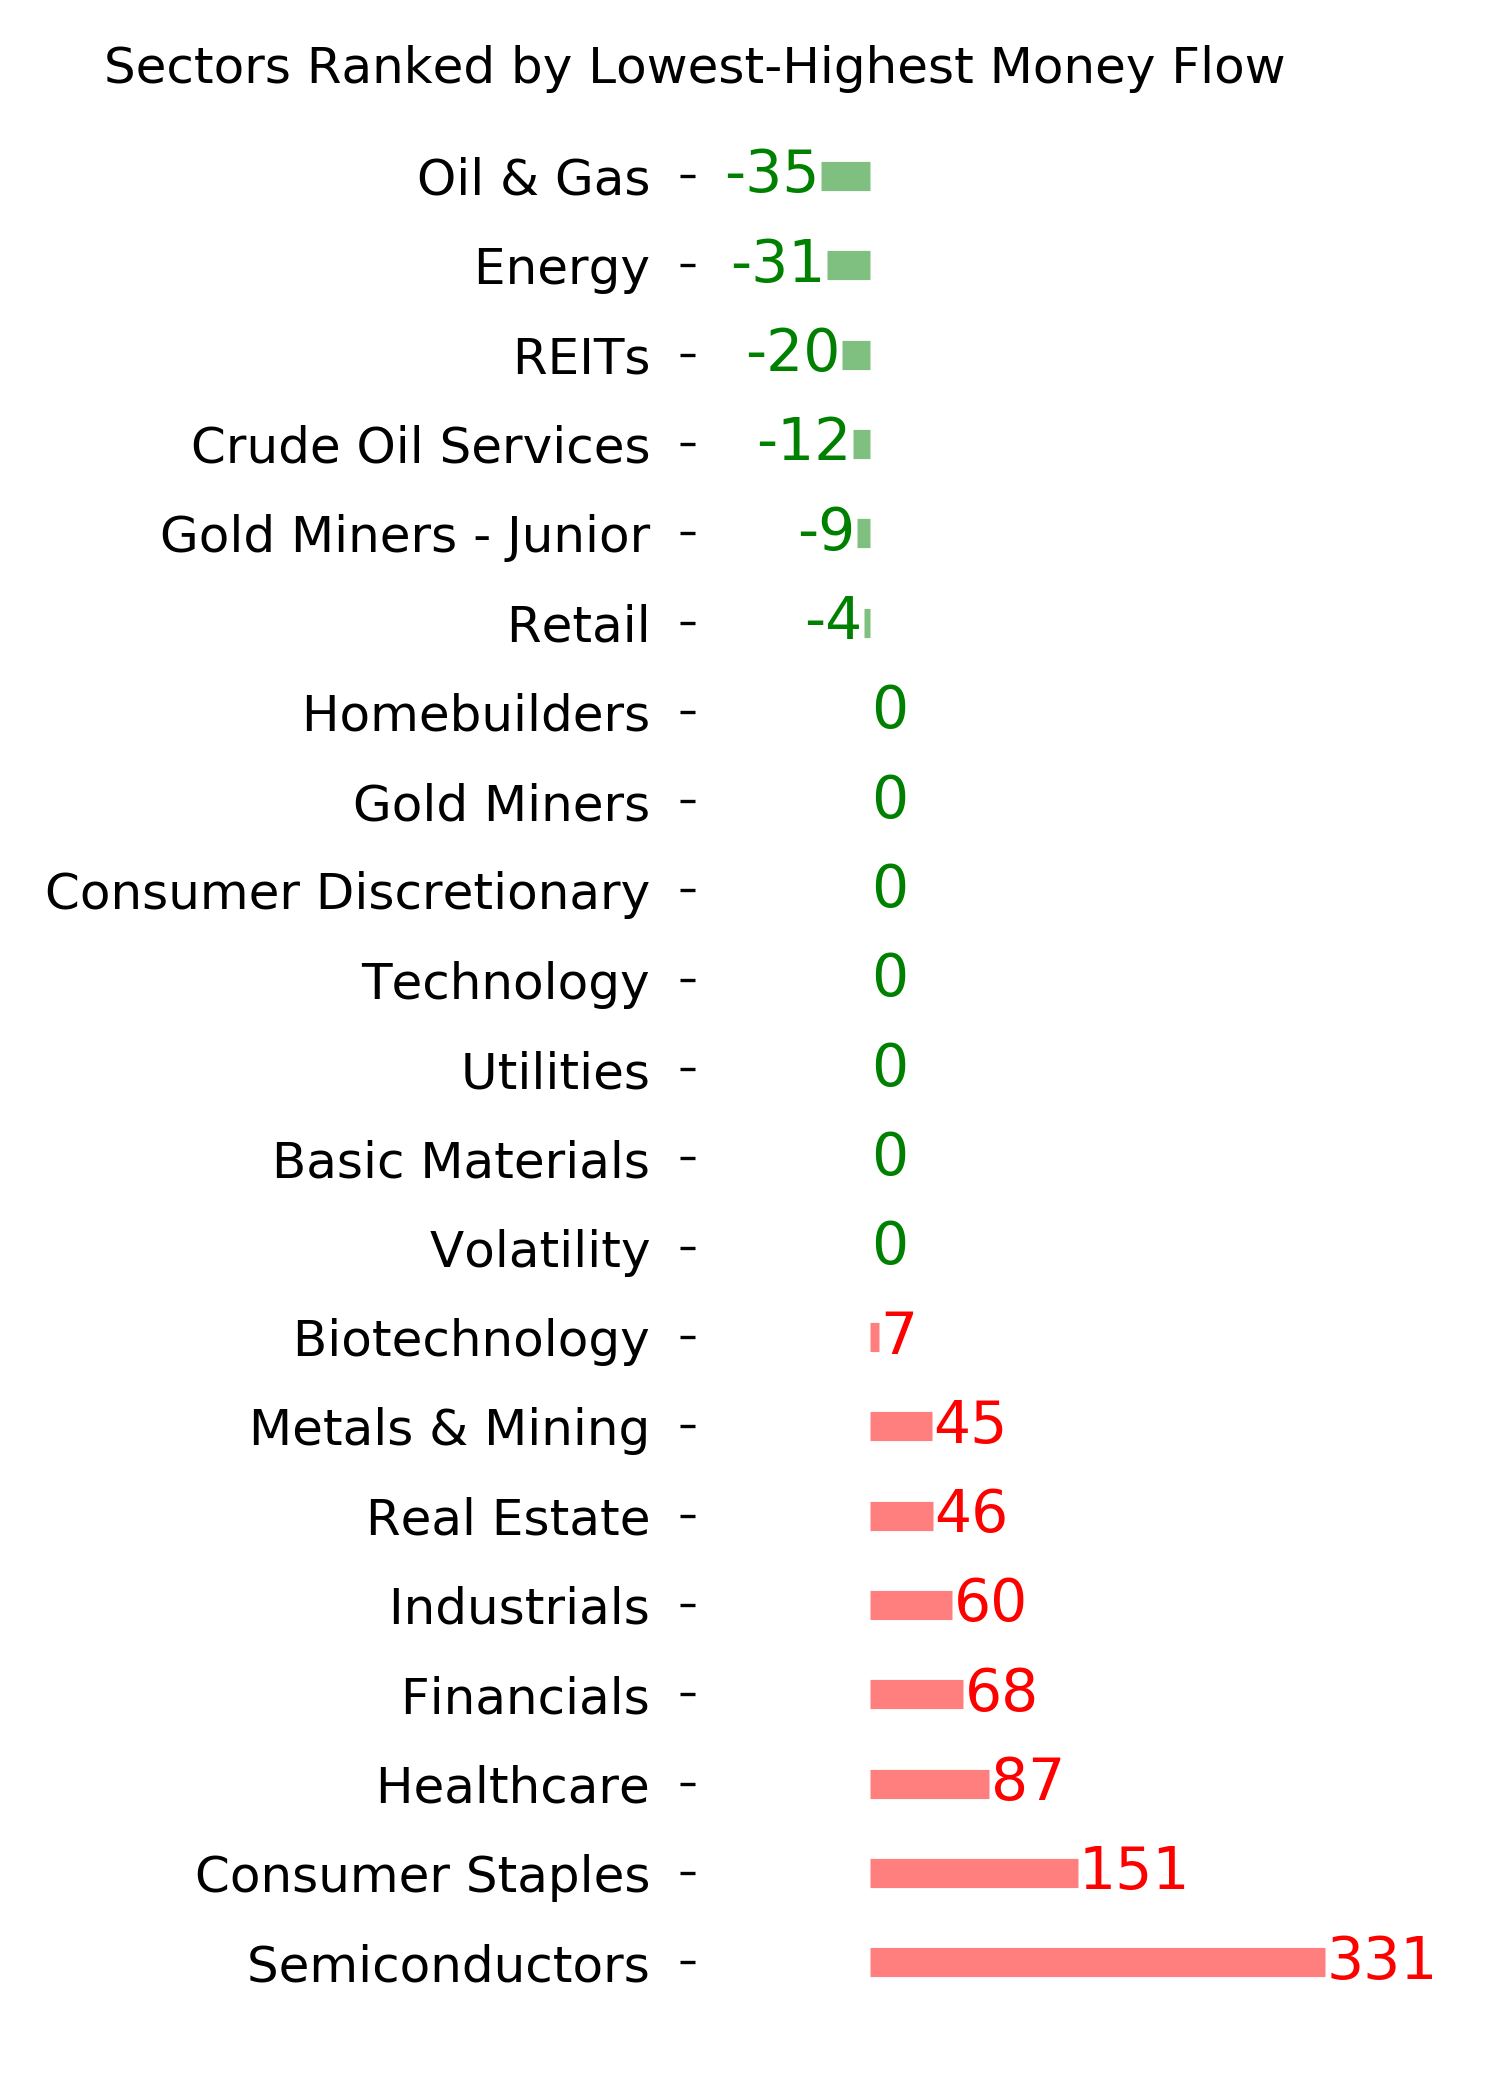
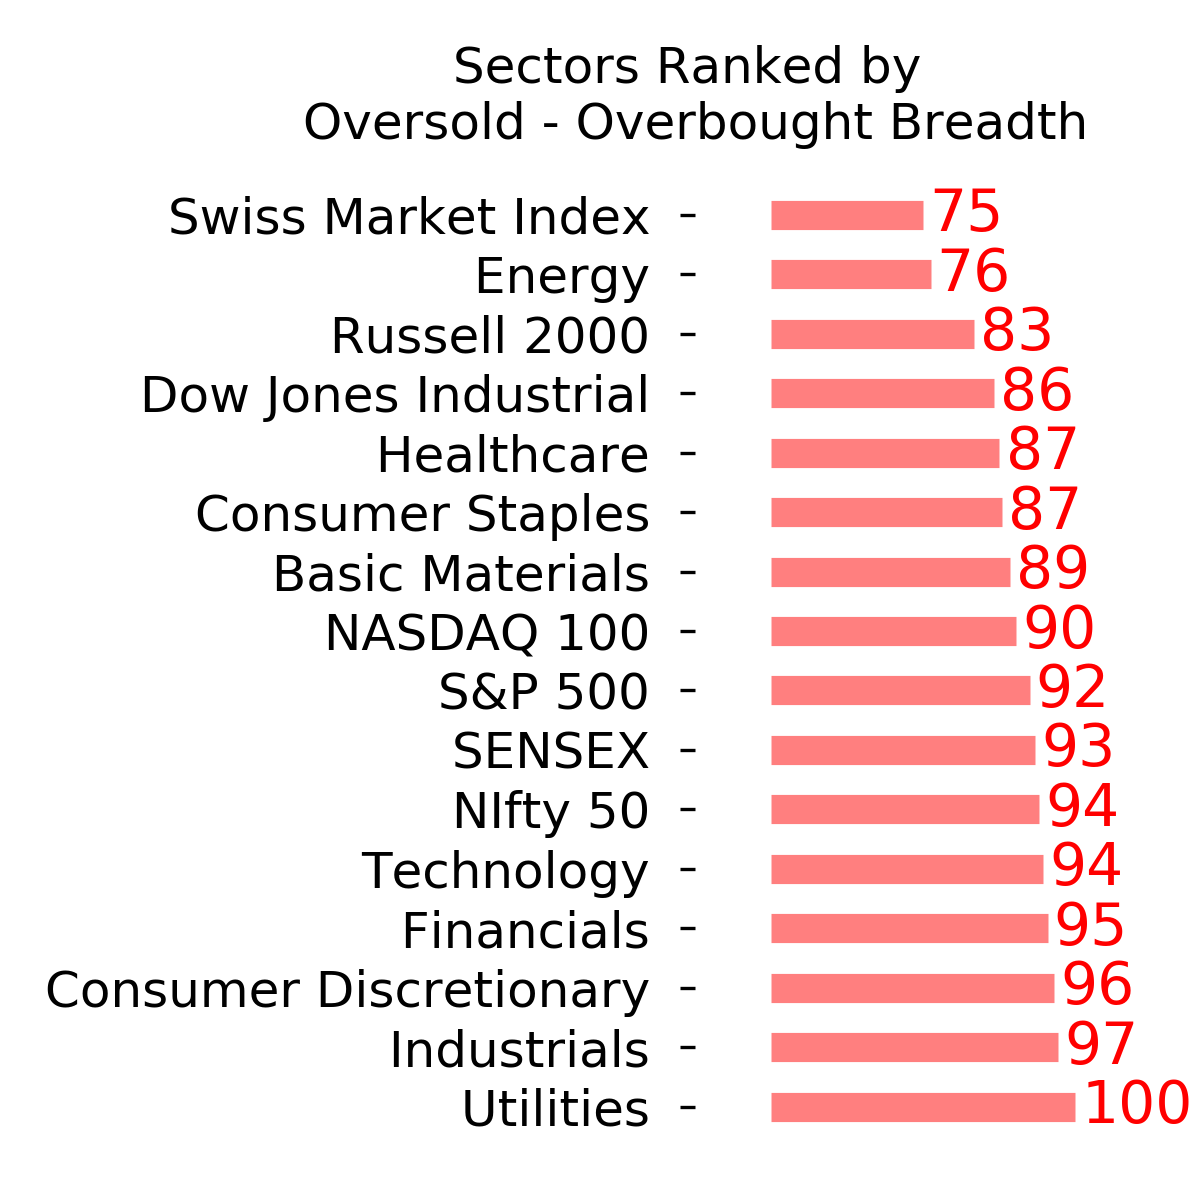
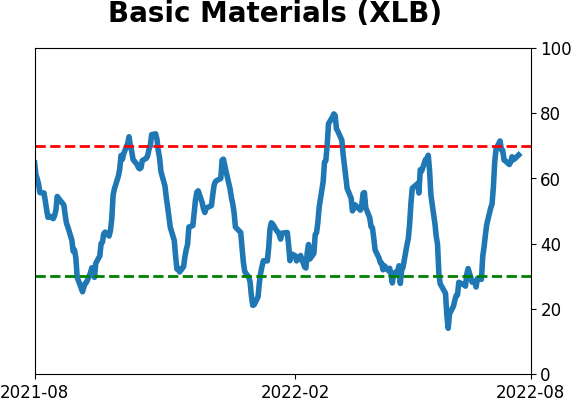
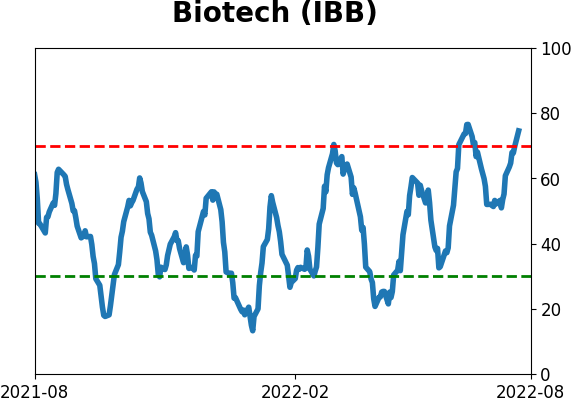
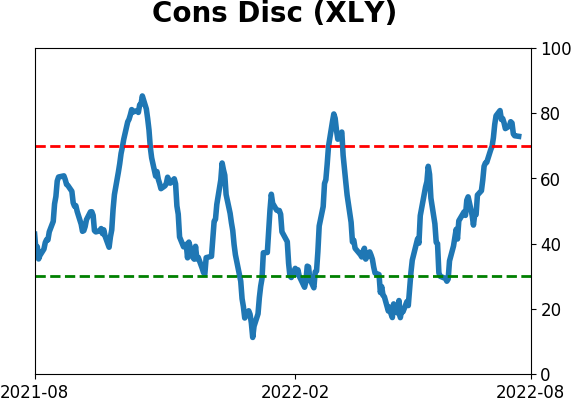
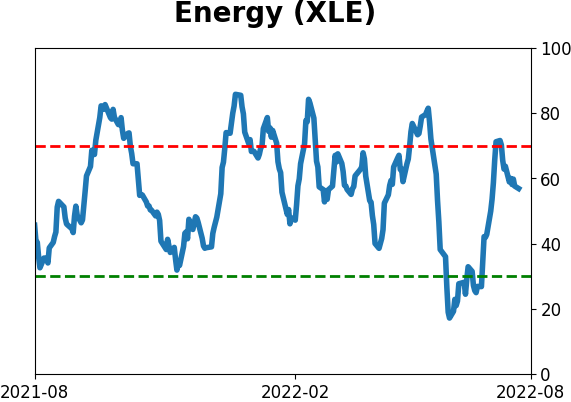
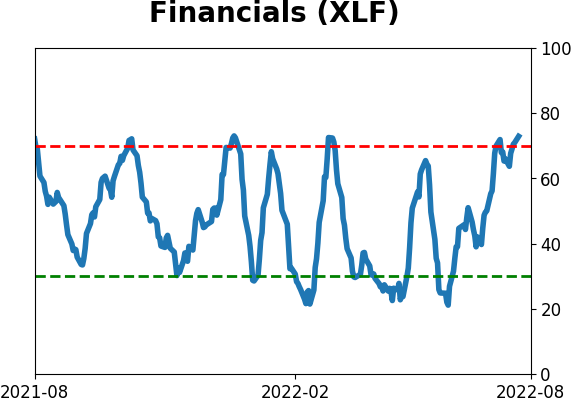
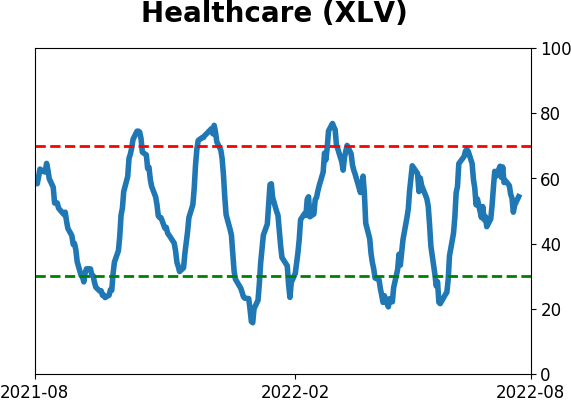
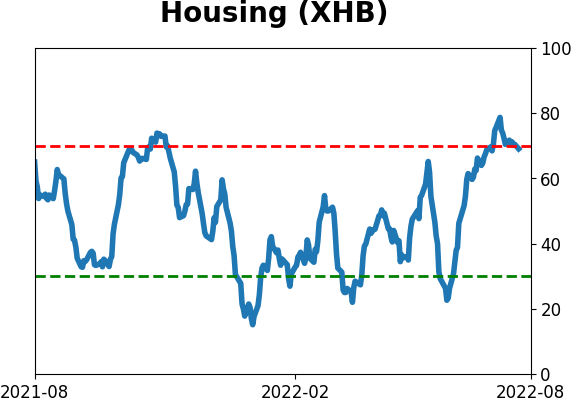
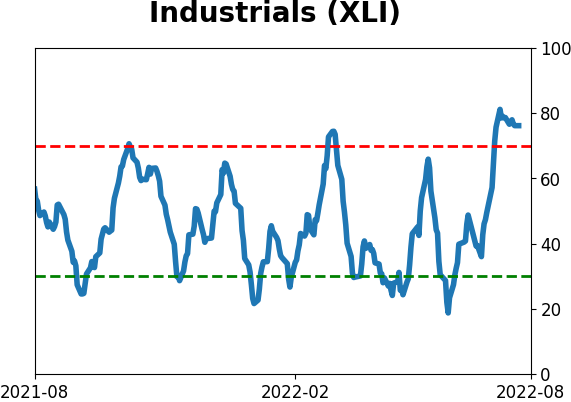
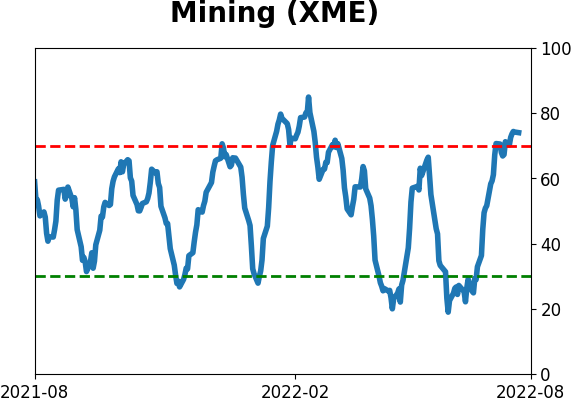
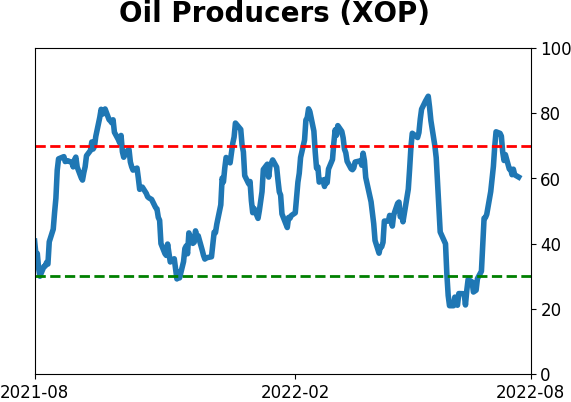
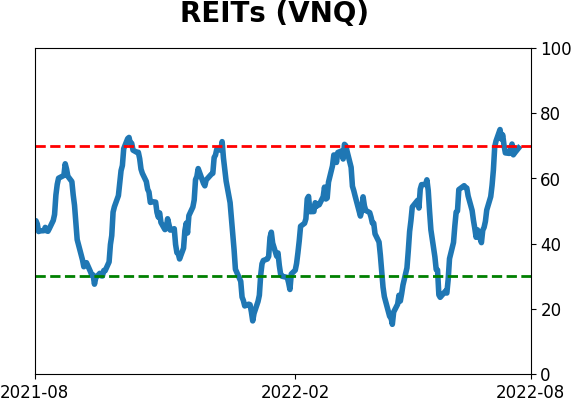
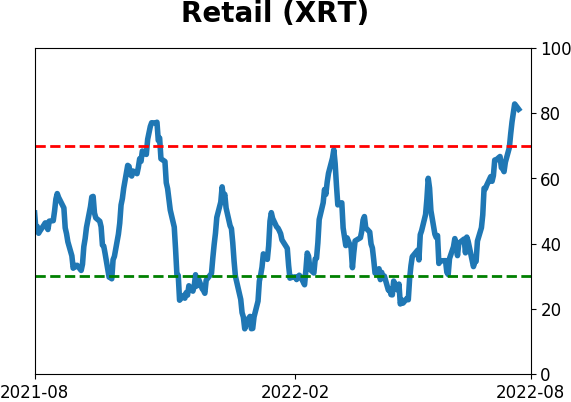
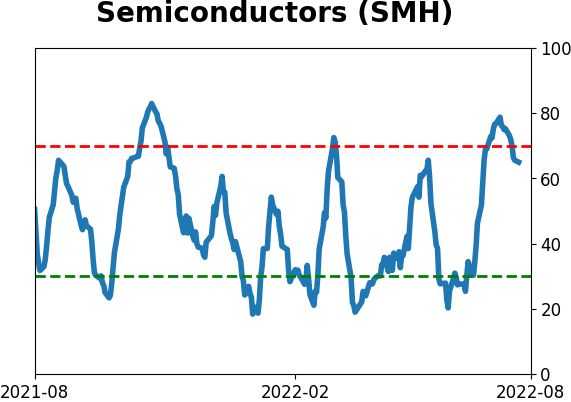
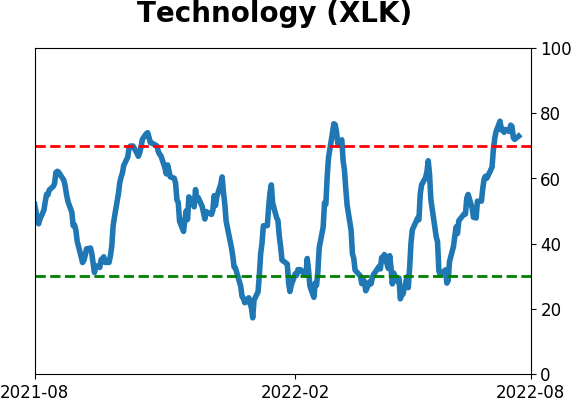
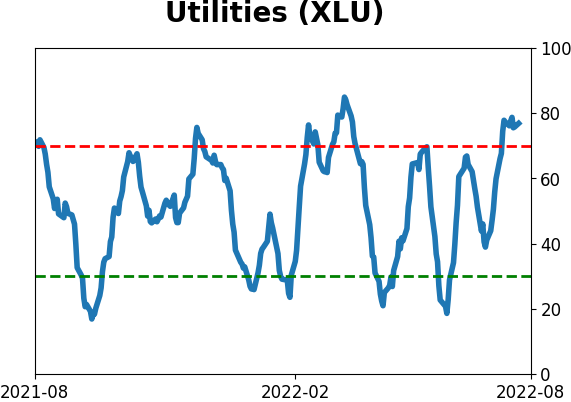
Sector ETF's - 10-Day Moving Average
|
|
|
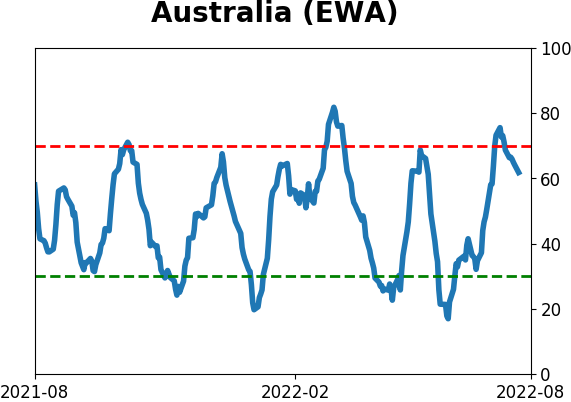
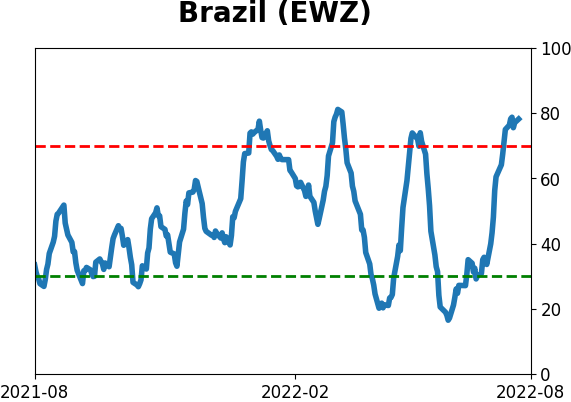
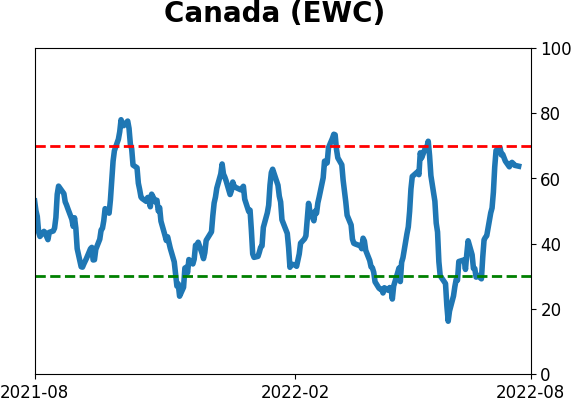
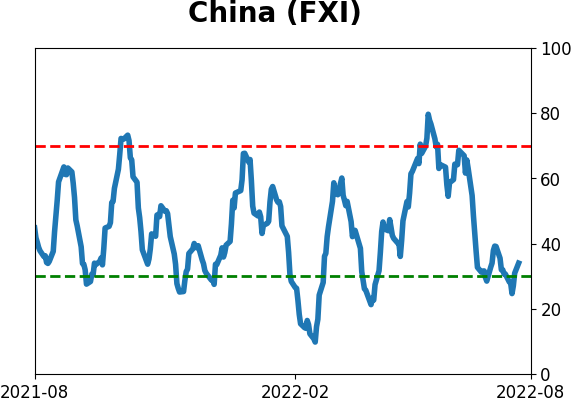
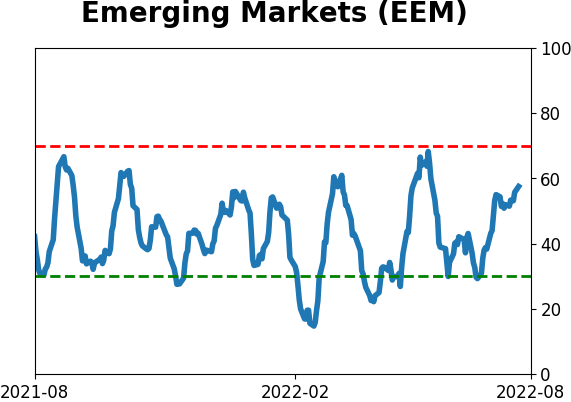
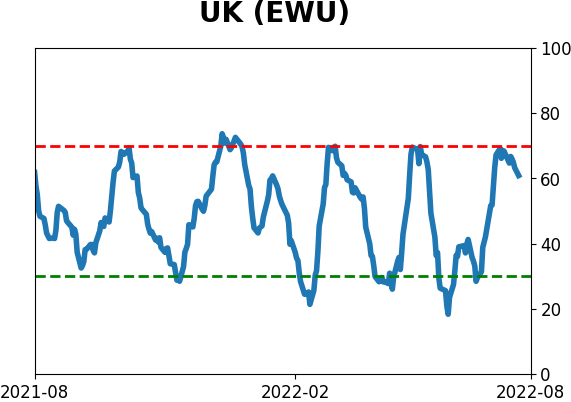
Country ETF's - 10-Day Moving Average
|
|
|
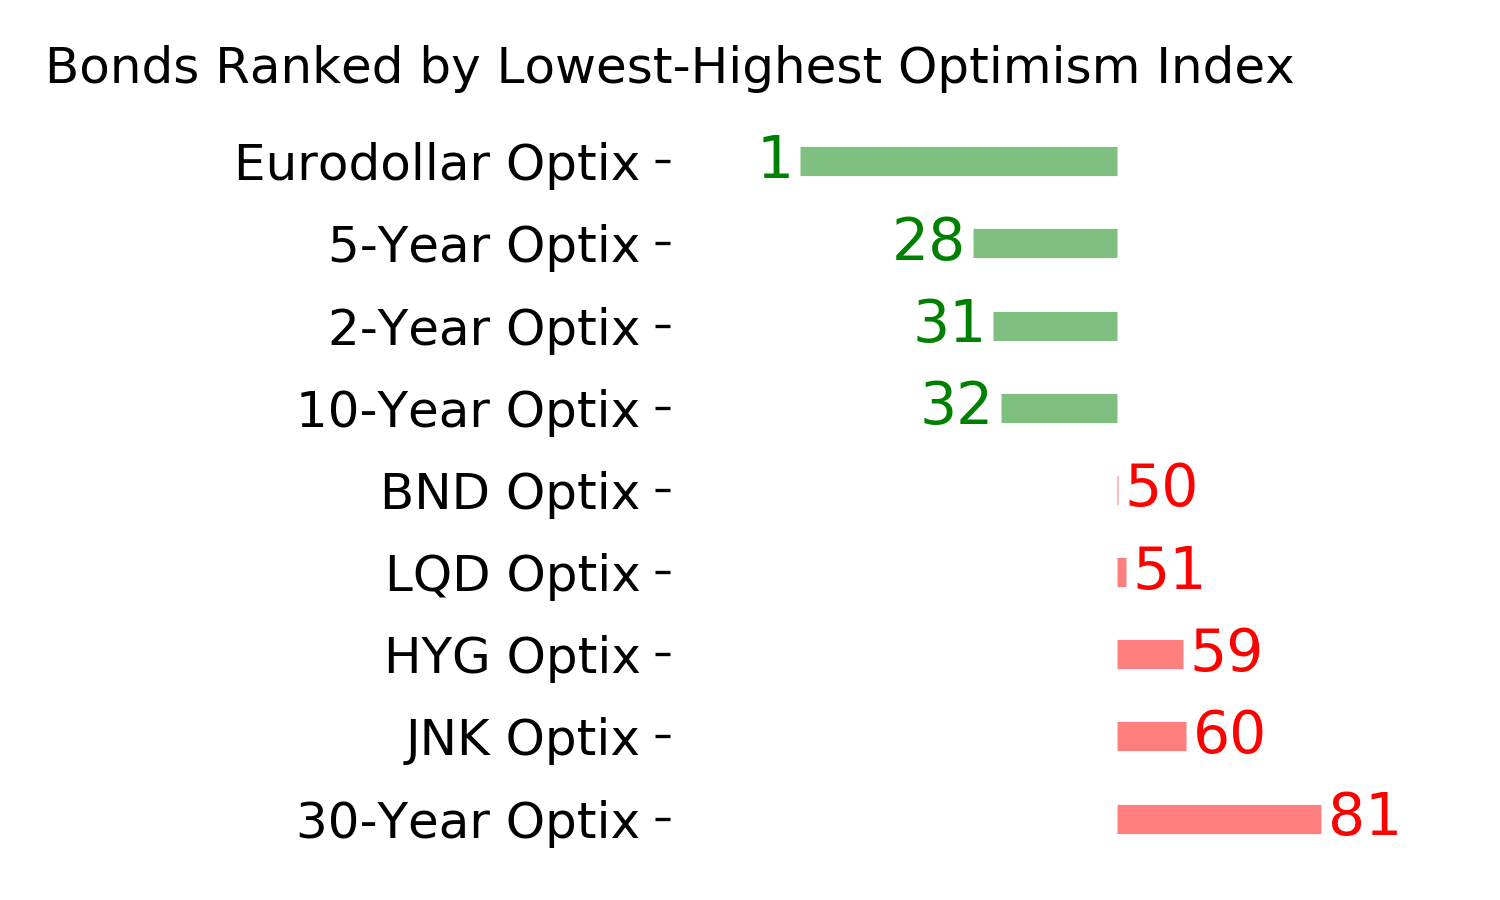
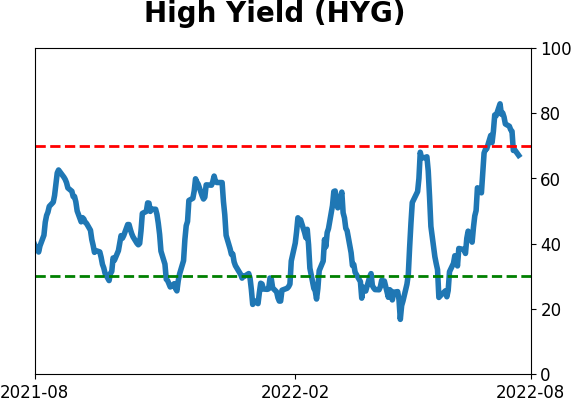
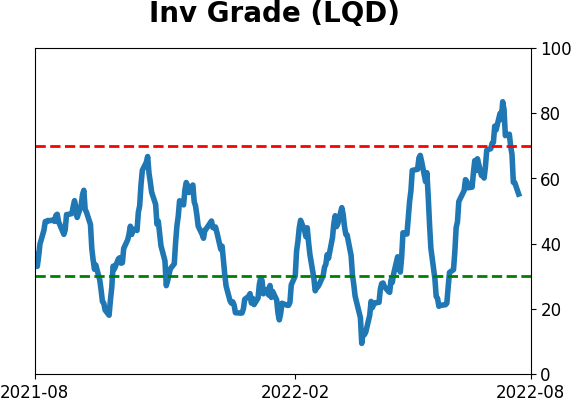
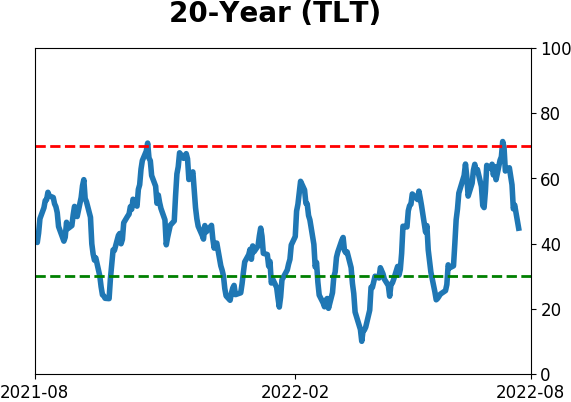
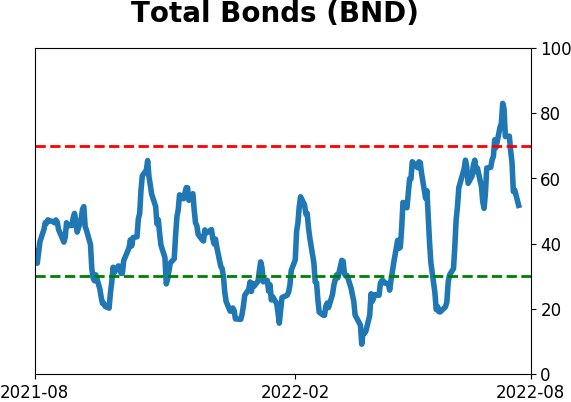
Bond ETF's - 10-Day Moving Average
|
|
|
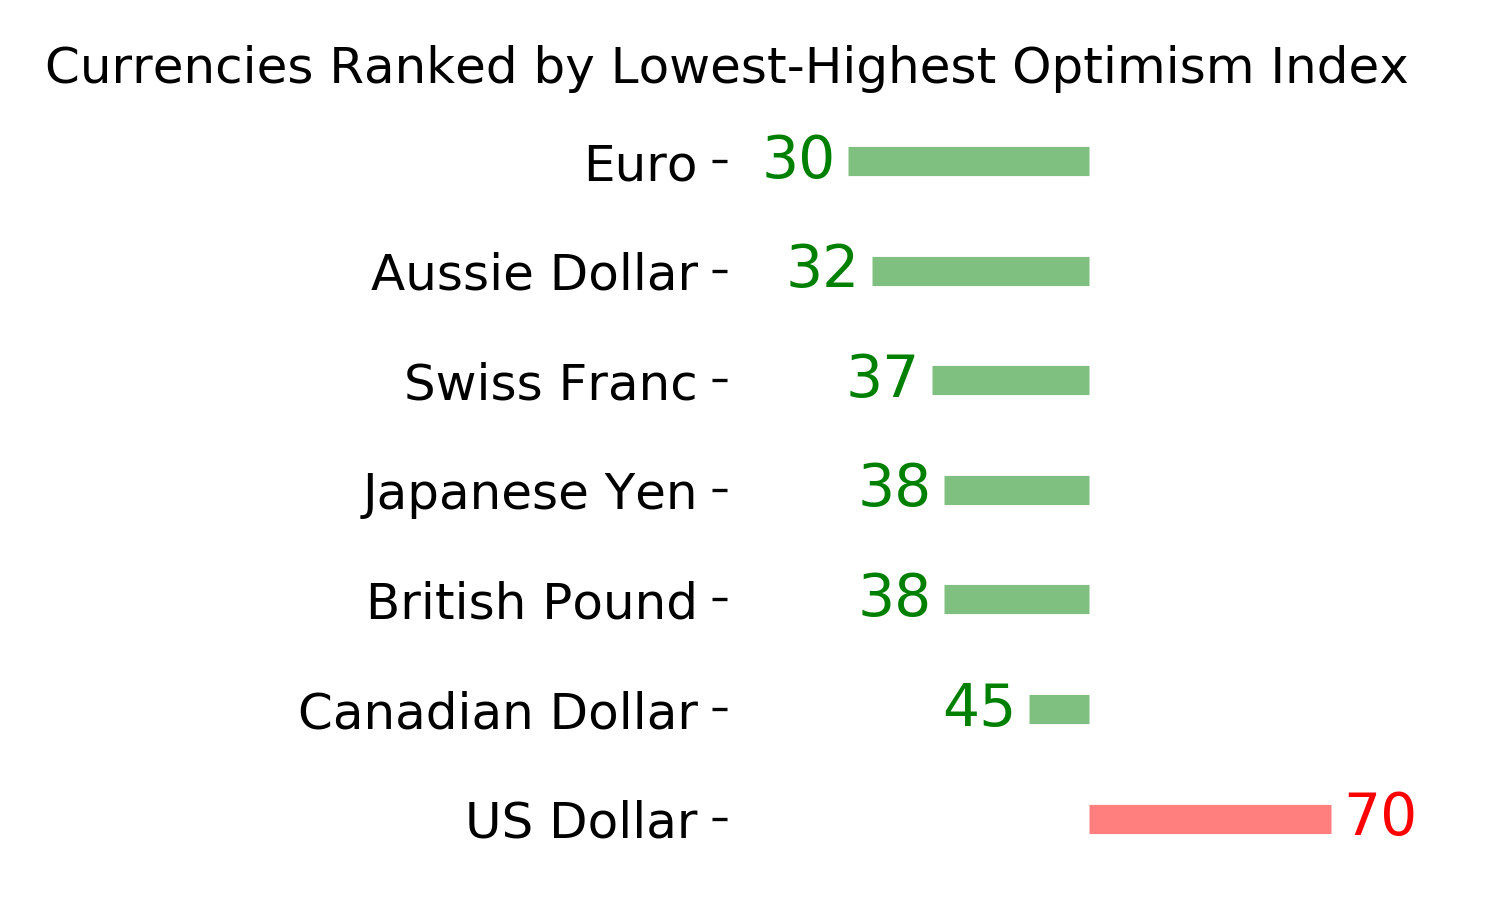
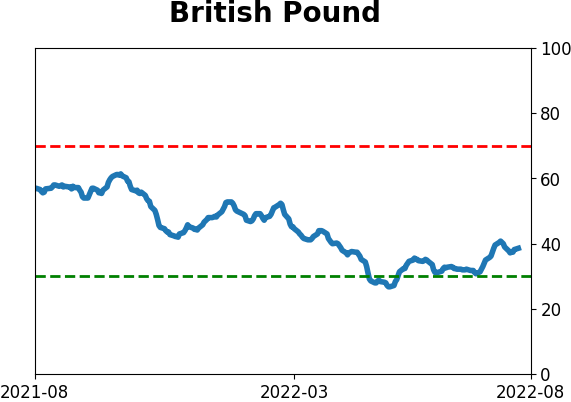
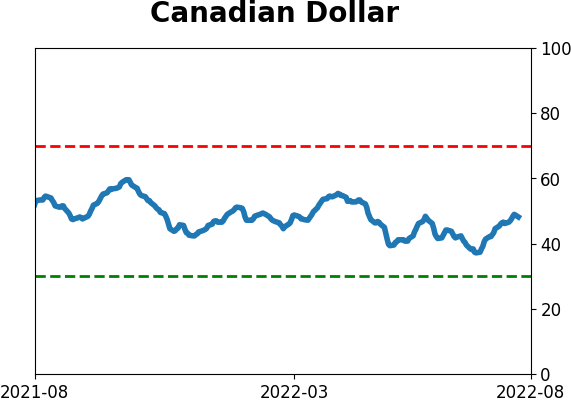
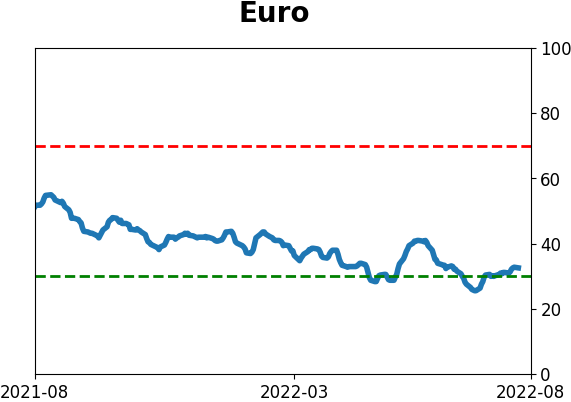
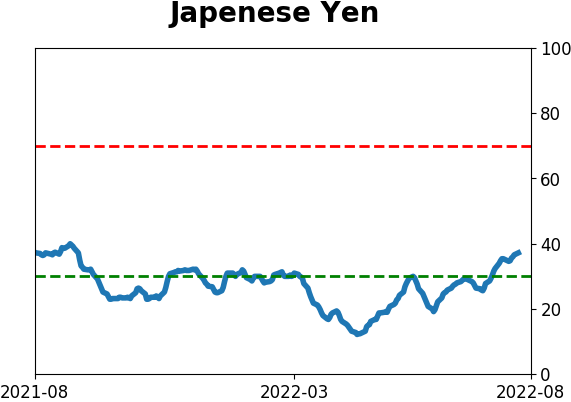
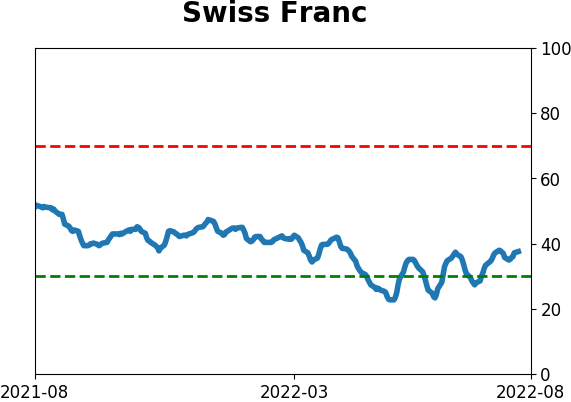
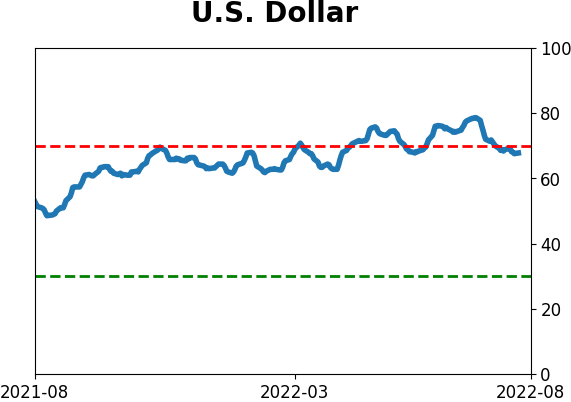
Currency ETF's - 5-Day Moving Average
|
|
|
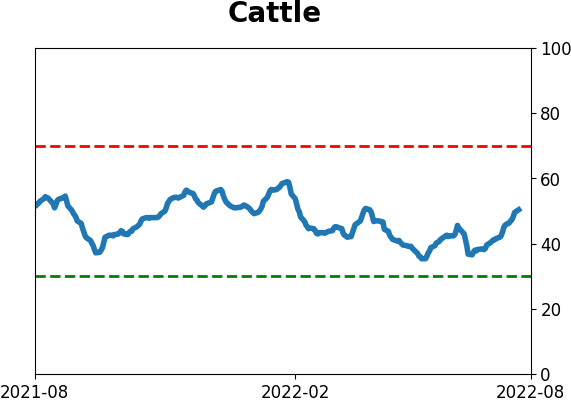
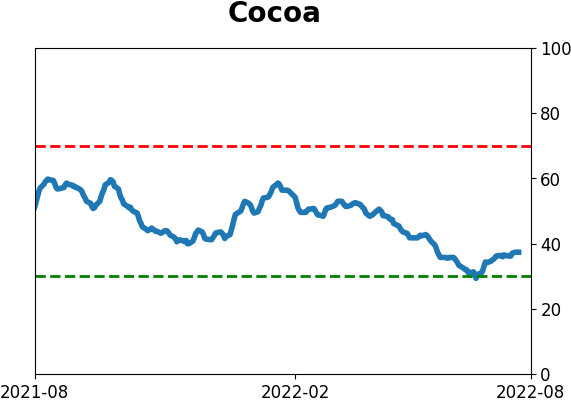
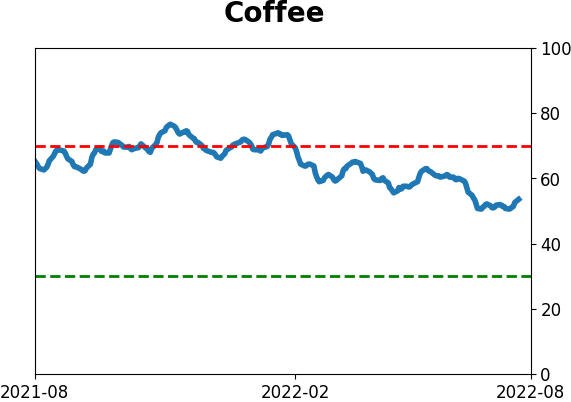
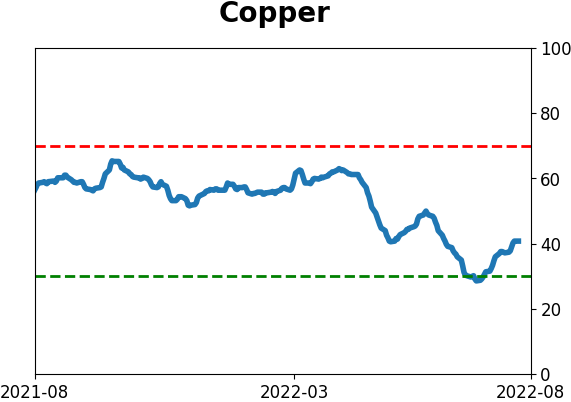
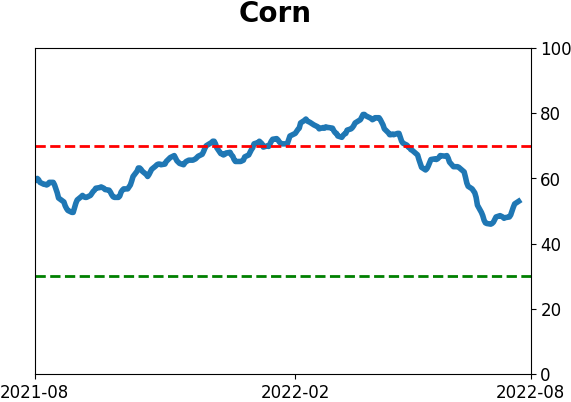
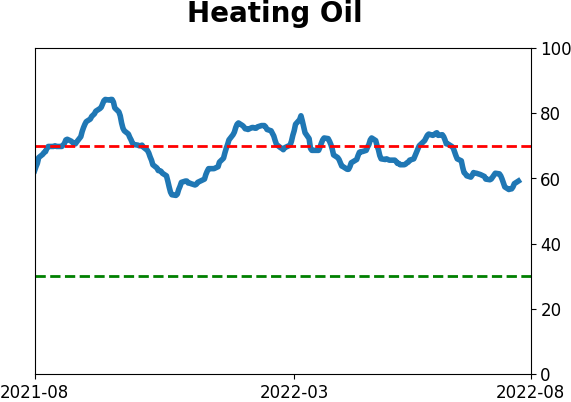
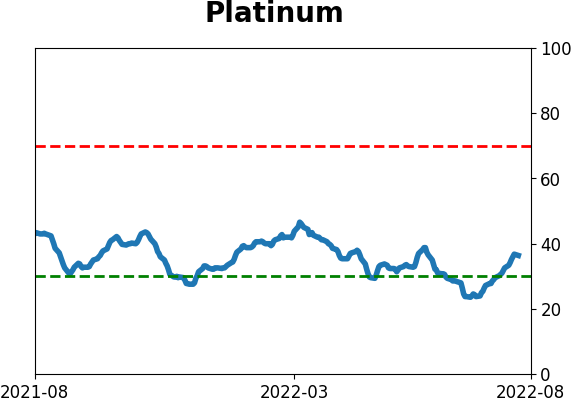
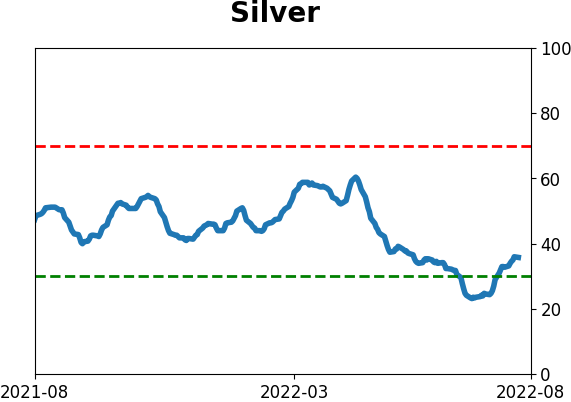
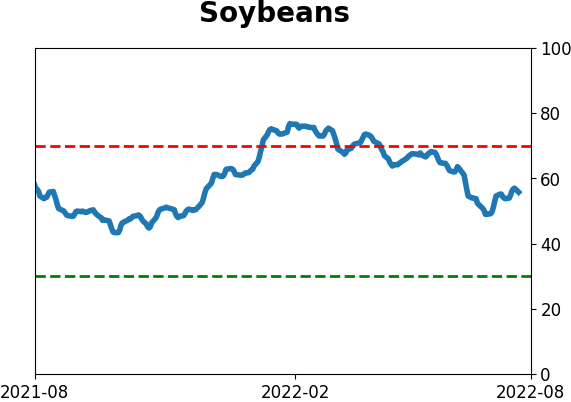
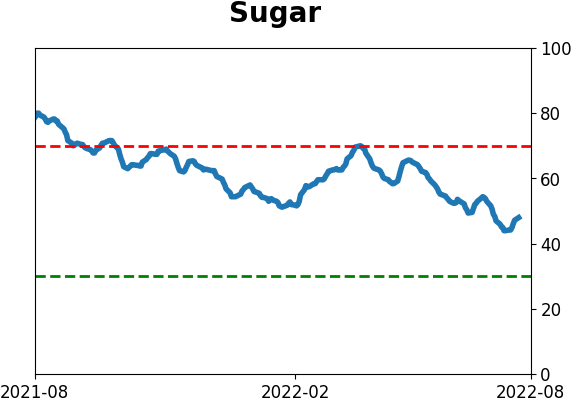
Commodity ETF's - 5-Day Moving Average
|
|