Headlines
|
|
Investors ignore the call from leading indicators:
The Leading Economic Index has dropped substantially over the past year, suggesting a tough patch for the U.S. But investors have shrugged that off, and the S&P has soared. While that may suggest that investors are ignoring fundamental warnings, similar conditions preceded consistent and impressive long-term gains for stocks.
|
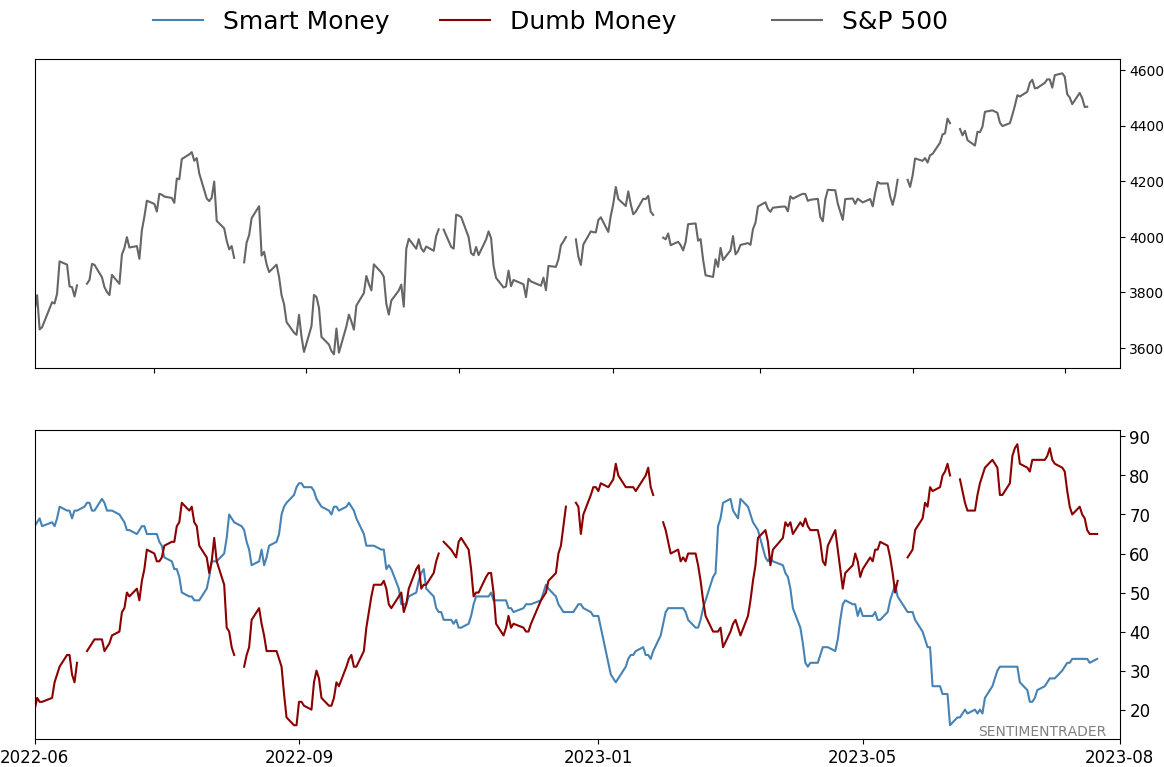
Smart / Dumb Money Confidence
|
Smart Money Confidence: 33%
Dumb Money Confidence: 65%
|
|
Risk Levels
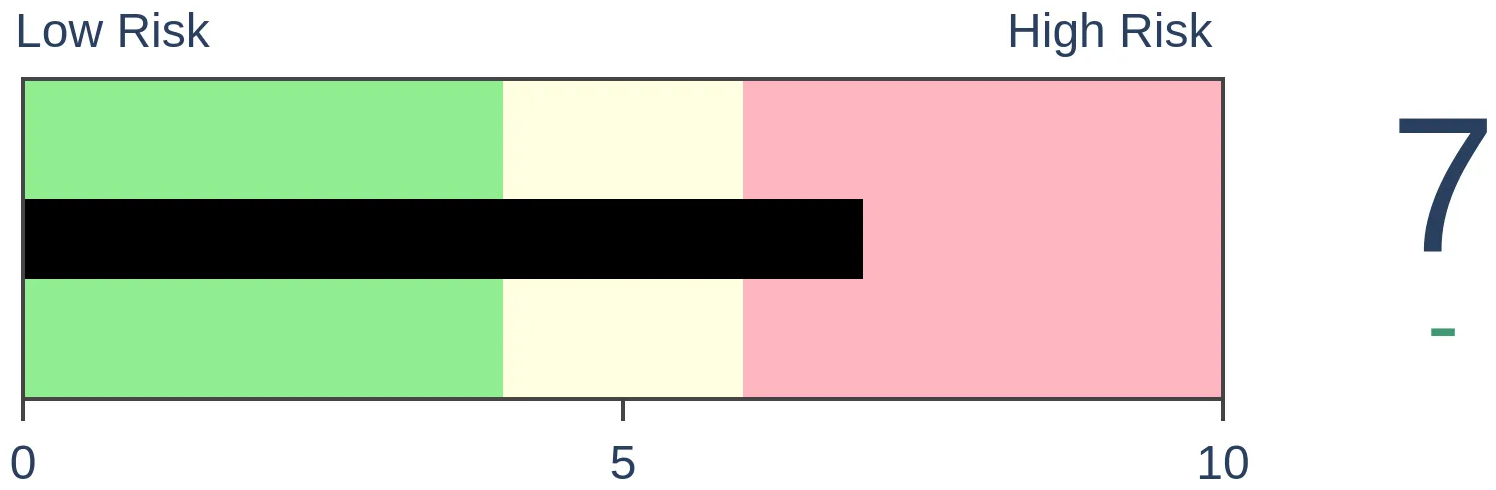
Stocks Short-Term
|
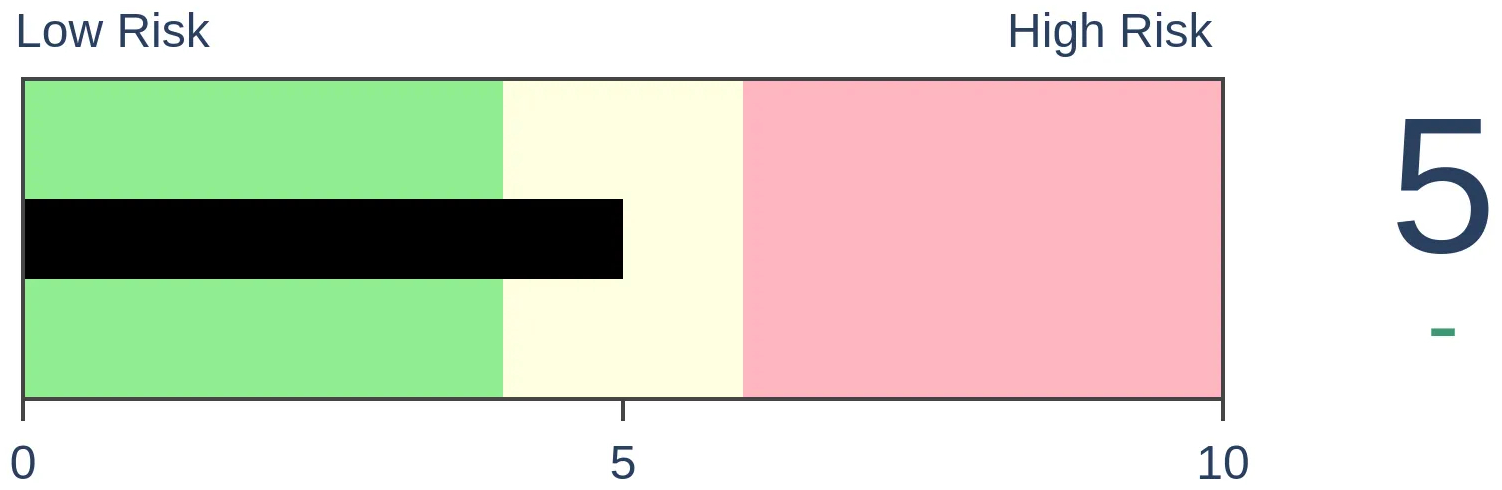
Stocks Medium-Term
|
|
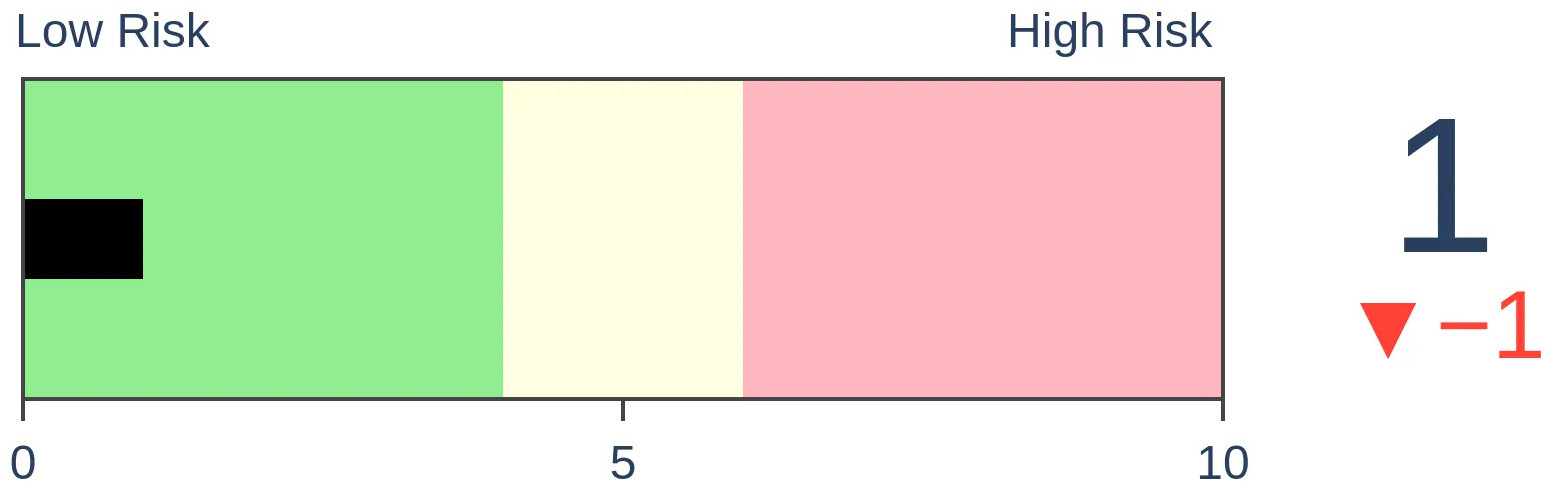
Bonds
|
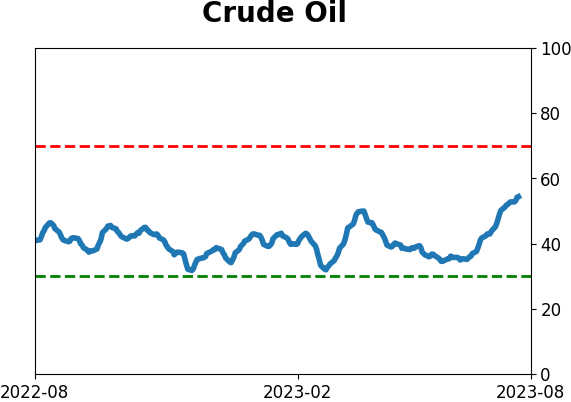
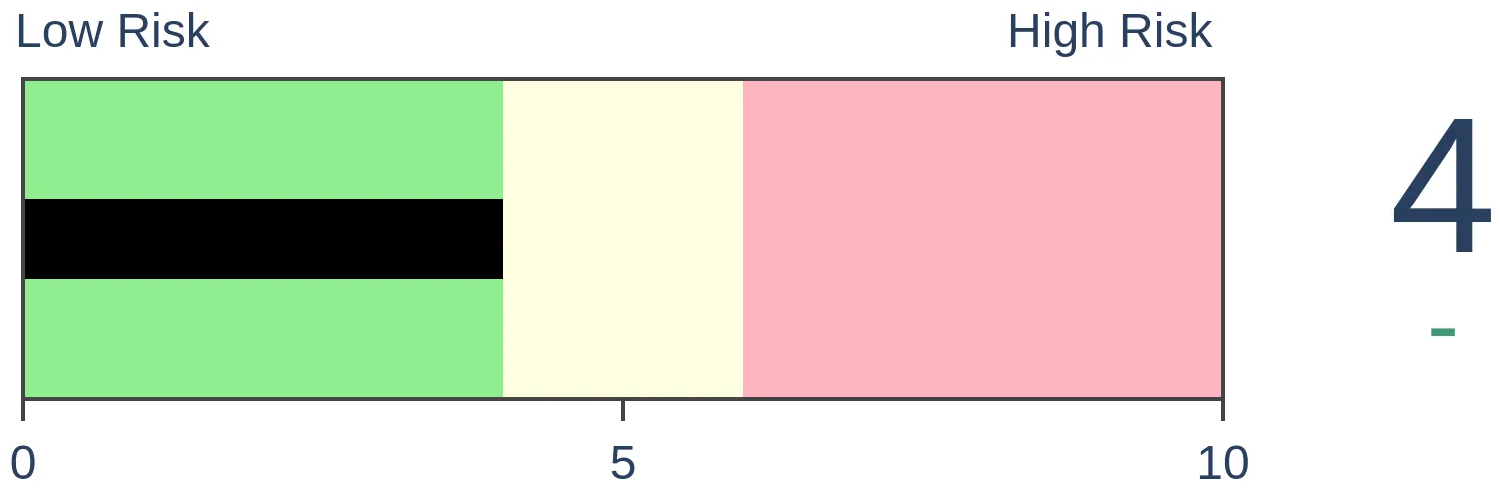
Crude Oil

|
|
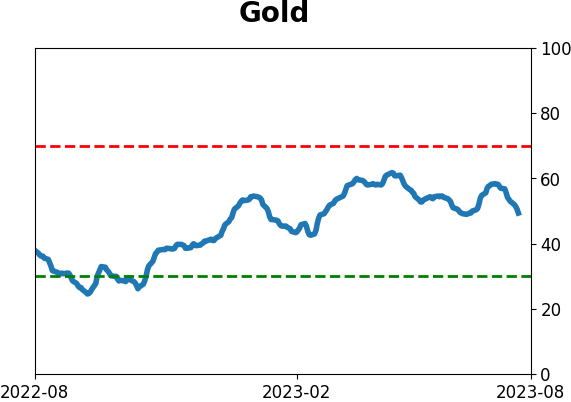
Gold
|
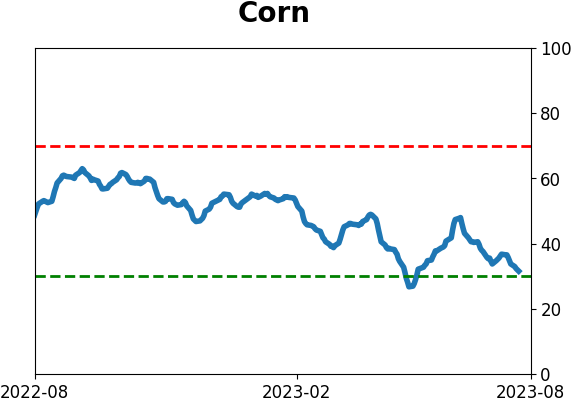
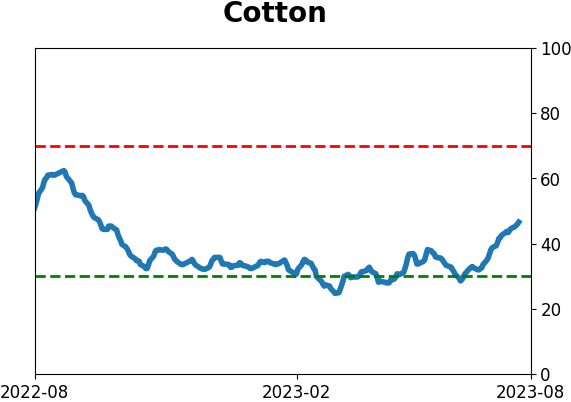
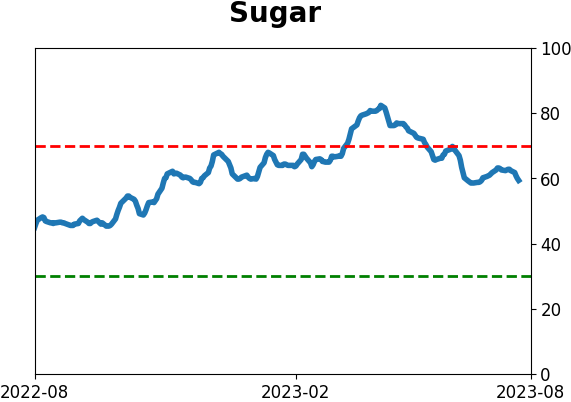
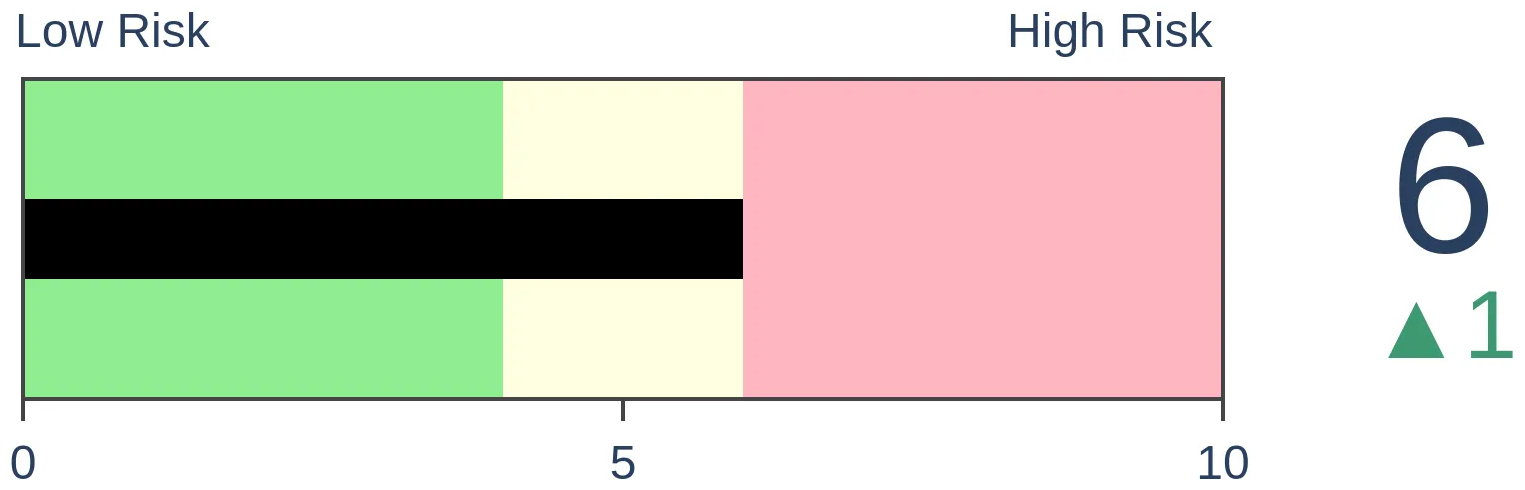
Agriculture
|
|
Research
By Jason Goepfert
BOTTOM LINE
The Leading Economic Index has dropped substantially over the past year, suggesting a tough patch for the U.S. But investors have shrugged that off, and the S&P has soared. While that may suggest that investors are ignoring fundamental warnings, similar conditions preceded consistent and impressive long-term gains for stocks.
FORECAST / TIMEFRAME
None
|
Key points:
- Over the past year, an index of leading economic indicators has declined
- In an unusual twist, stocks have rallied strongly despite the waning indicators
- Similar conditions preceded a couple of stock declines, but mostly strong long-term returns
Investors have gotten ahead of economic indicators
Over the past six months, we've looked at various indicators that were getting a lot of attention. Because of the devastation of financial assets in 2022, investors were looking for any excuse to bail out of the rally off the lows. Seemingly every week, some new indicator would make the rounds, signaling doom directly ahead.
Sometimes the indicators work, and those cherry-picked examples get attention. We try hard to ignore that and instead look at as long of a history as possible, objectively weighing empirical evidence. The downside of that approach is that it's not exciting, can still suffer from tiny sample sizes, and doesn't guarantee that the future will look like the past. Still, we feel it's better than willy-nilly running from one sensational idea to the next.
One indication that investors have gotten ahead of the economy comes from the Conference Board's Leading Economic Index. It has stayed persistently weak even as stocks have rallied, which is unusual. Over the past 63 years, a strong positive correlation exists between the year-over-year change in LEI versus the S&P 500. The narrative from macro analysts is that investors are too far over their skis and stocks will crash as a result...because of course.
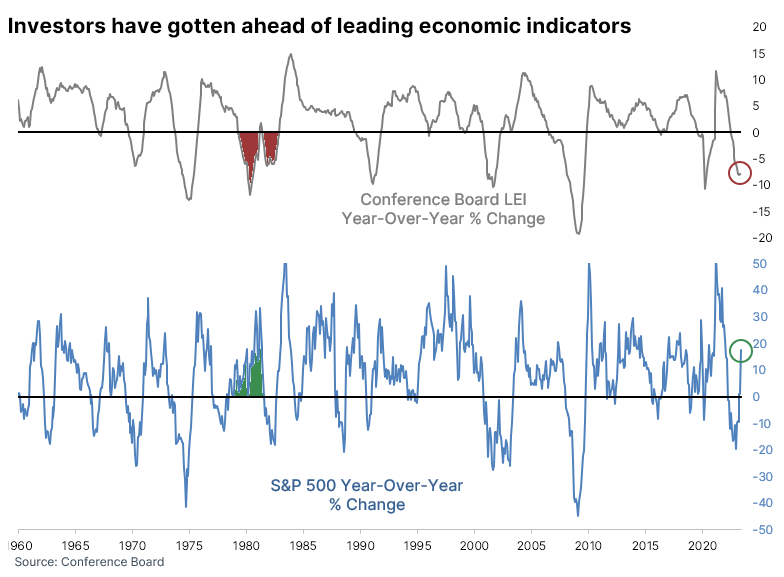
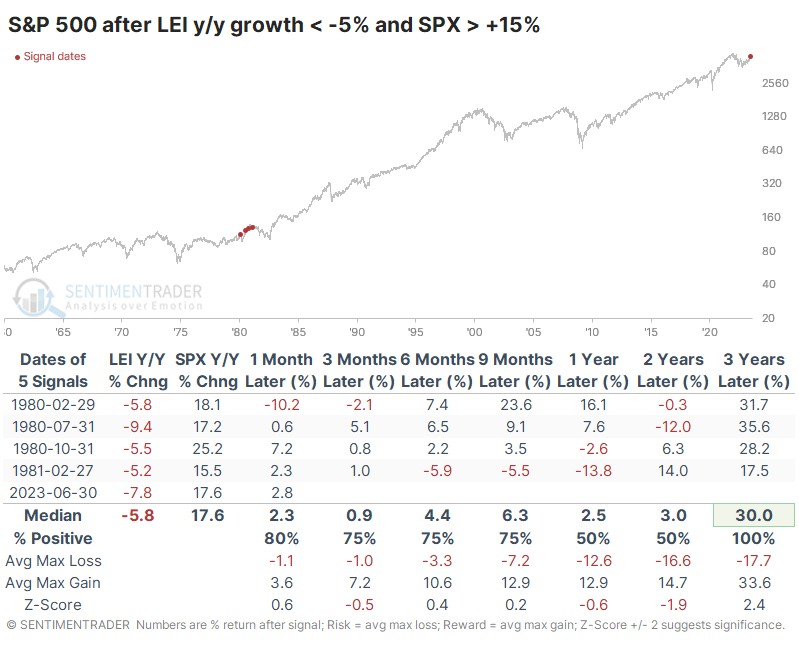
The only time since 1960 when the LEI declined by more than 5% over the past year, while the S&P 500 rallied more than 15%, was in 1980, extending into 1981. That did precede a rocky market, though multi-year returns were significantly better than average.
When stocks rallied, and leading indicators declined, it's been good for stocks
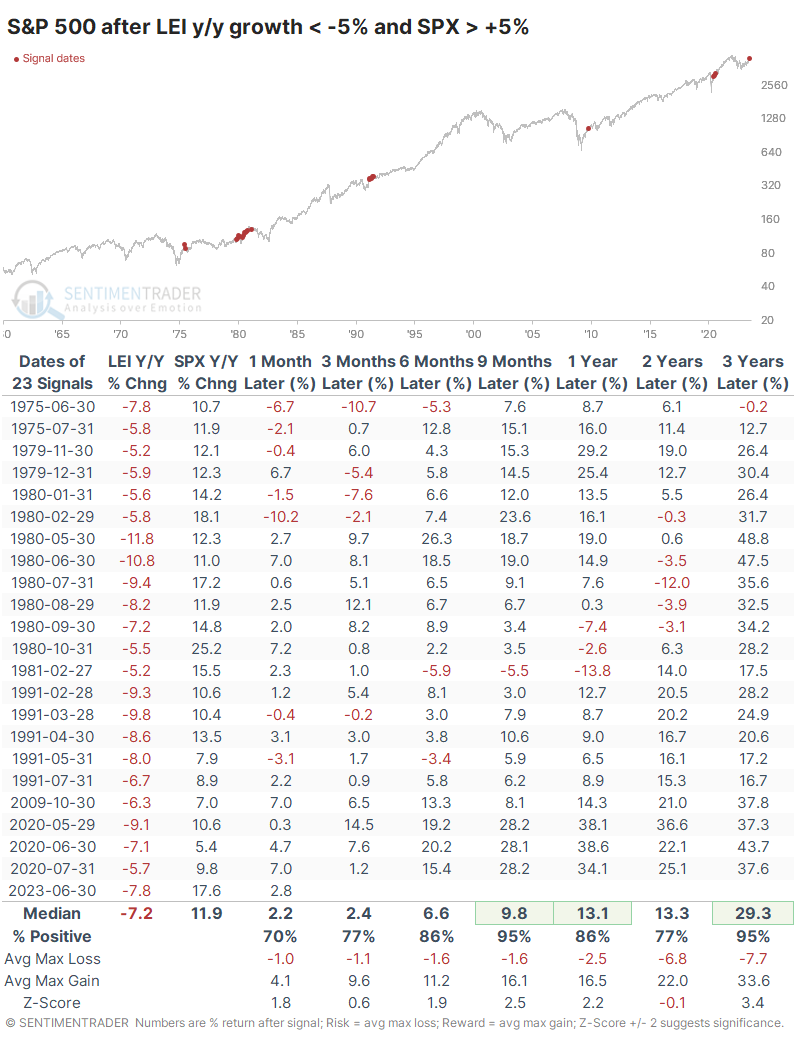
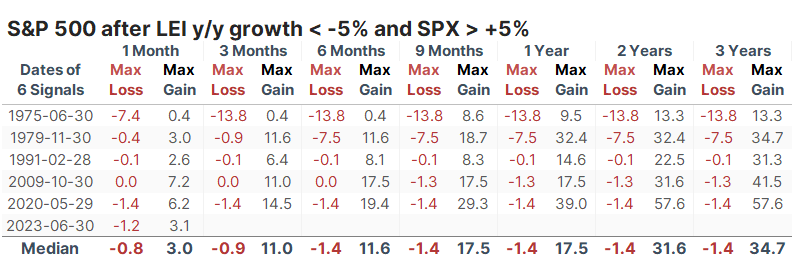
That's basically a sample size of one, so let's broaden the parameters. The table below shows future returns in the S&P after the LEI dropped by more than -5% while the S&P rallied by more than +5%. Over the following nine months, the S&P sported a positive return after 22 of the 23 signals. Same for three years later, with one tiny loss and most others showing greater than 20% gains.
If we focus only on the first instance in at least a year, returns still held up well. Every single one occurred as stocks were thrusting out of a significant decline or period of flat returns, and every single one led to gains over the next 9-24 months.
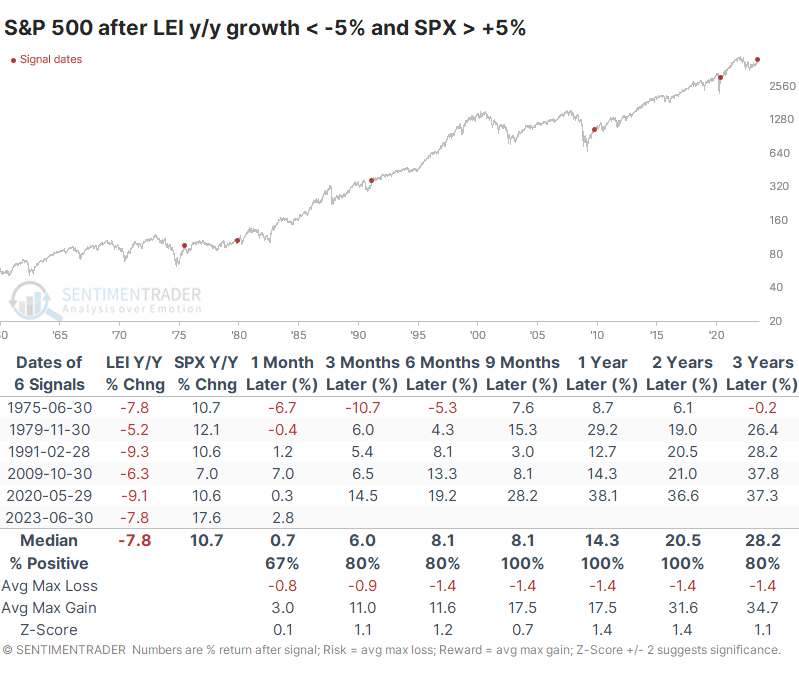
A table of maximum gains and losses across time frames shows that the former were substantial while the latter were limited. Up to three years later, the only one that showed more than a -10% pullback was in 1975.
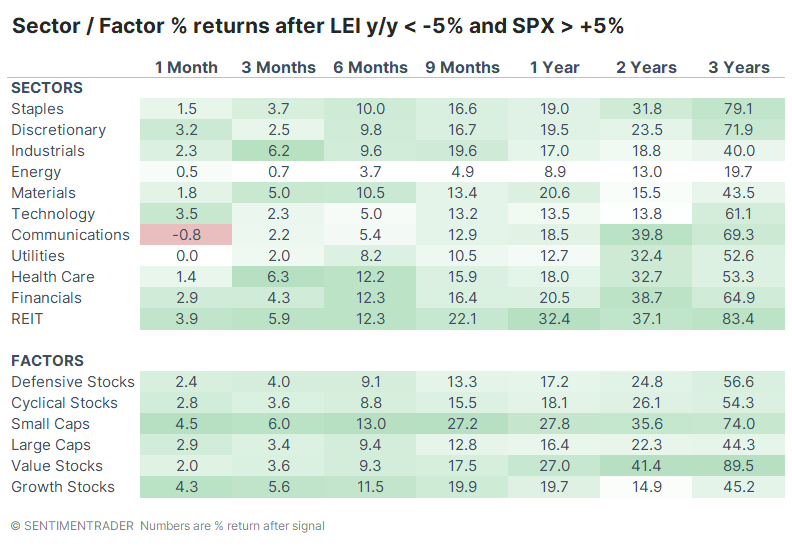
Using all the months when this condition was triggered, not just the first one in a year, we can see that Small-caps enjoyed some of the most robust forward returns while Value stocks shone over the long term. Energy was one of the few sectors where returns were tepid.
What the research tells us...
A core tenet upon which this company was founded more than two decades ago is that while every moment in history is unique, human behavior rarely changes. Our approach is to monitor that behavior, determine what factors other investors are using for their buy or sell decisions, and use as much history as we can muster faithfully to see whether they might be onto something.
Because we're dealing with humans, and because most of us are afraid (either of losing the mortgage payment money or getting jealous of the neighbor's new boat), we tend to glom onto sensational indicators that stocks will either crash or soar. Most of the time, they don't do either. Macro doomers have newsletters to sell, so they necessarily gravitate toward the former. We've looked at many popular "warning signs" over the past six months, including the diverging Leading Economic Indicators. We still can't find much support that they've actually been effective.
Indicators at Extremes
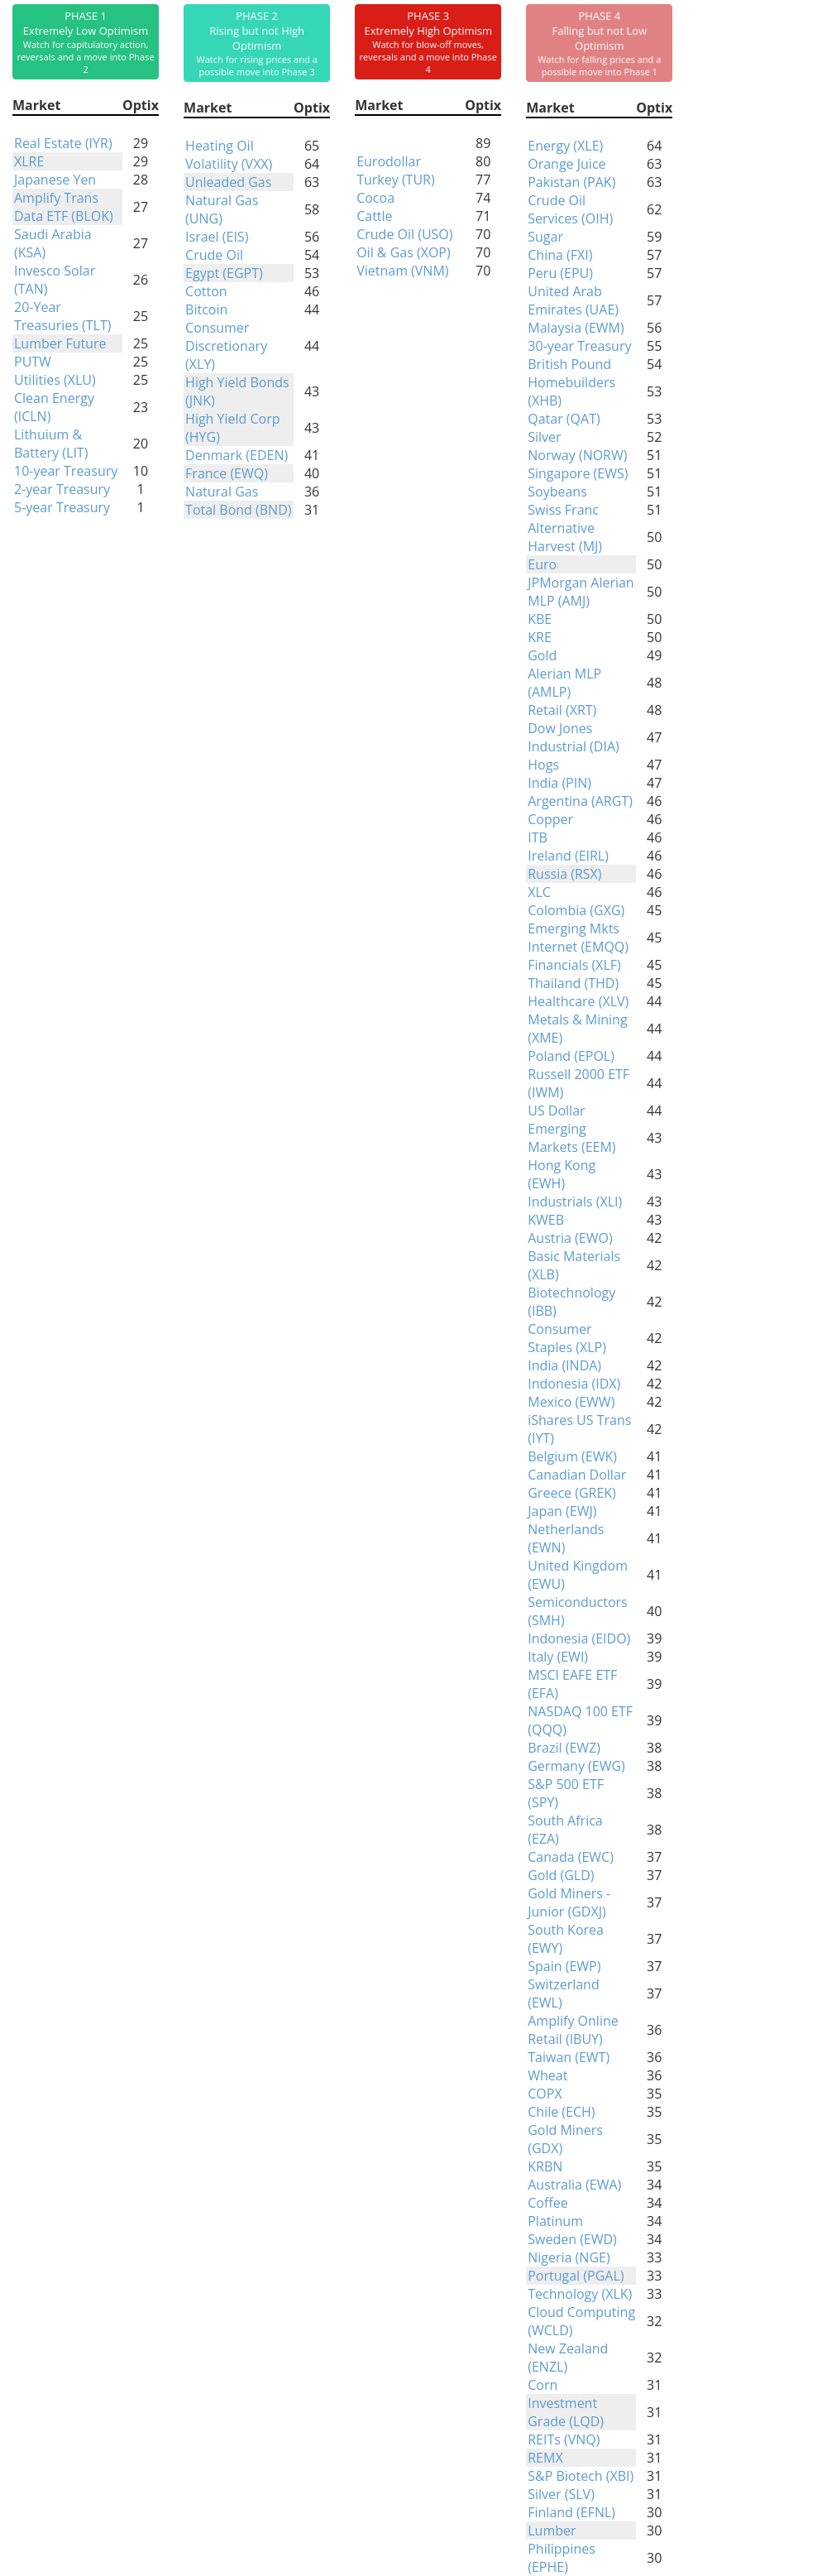
Phase Table
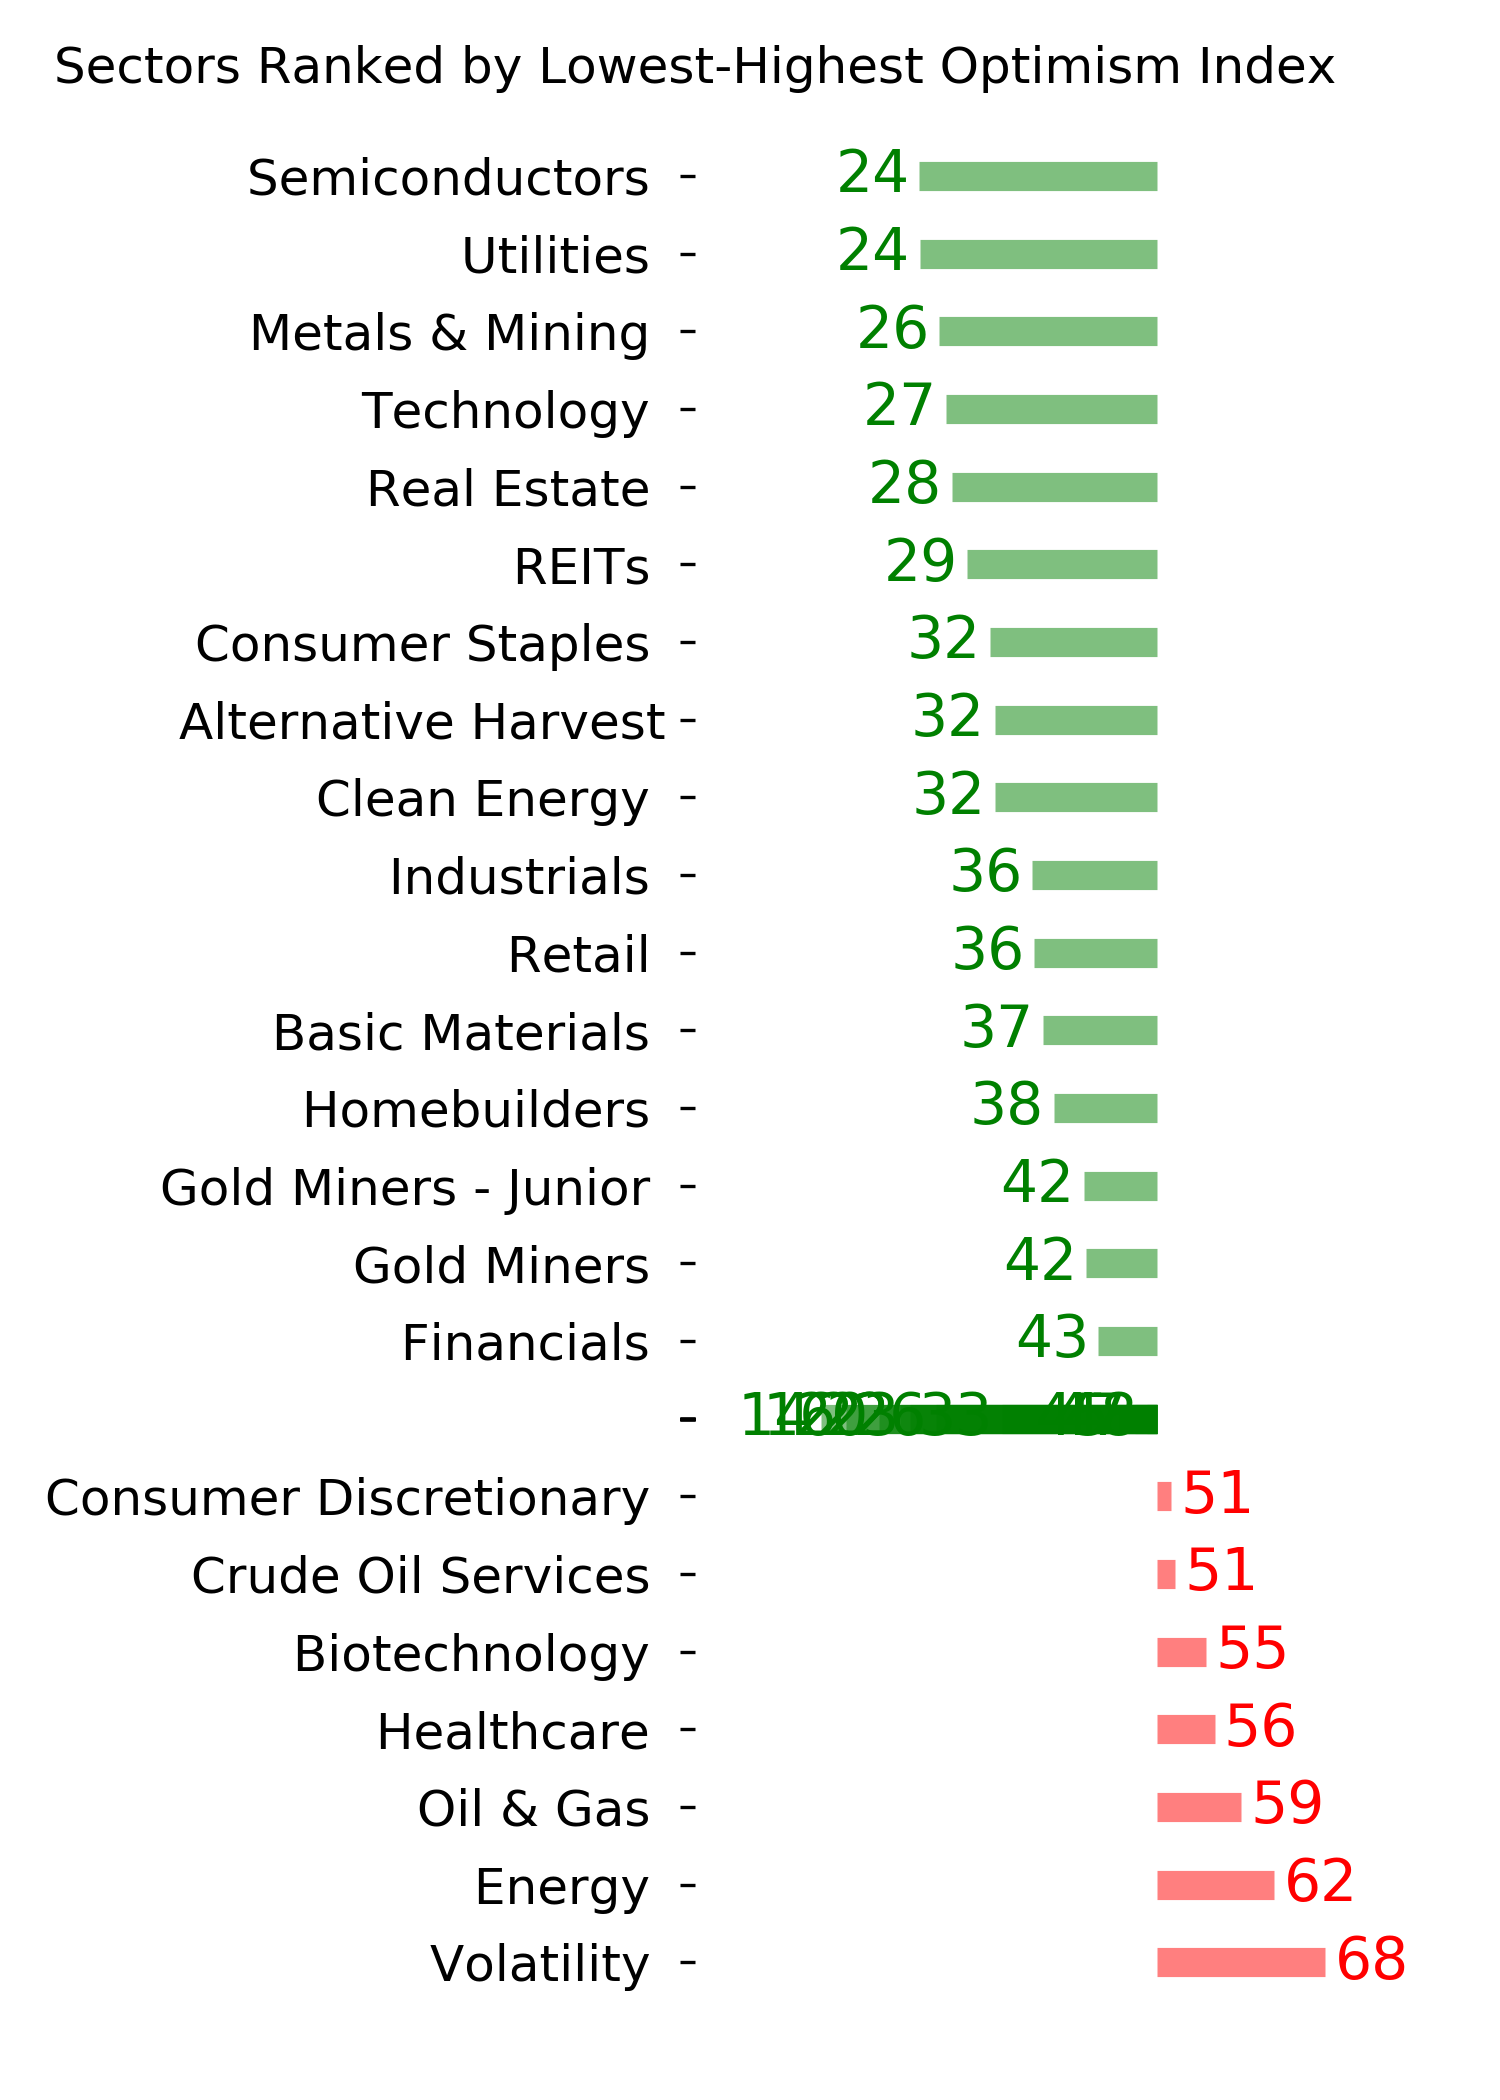
Ranks
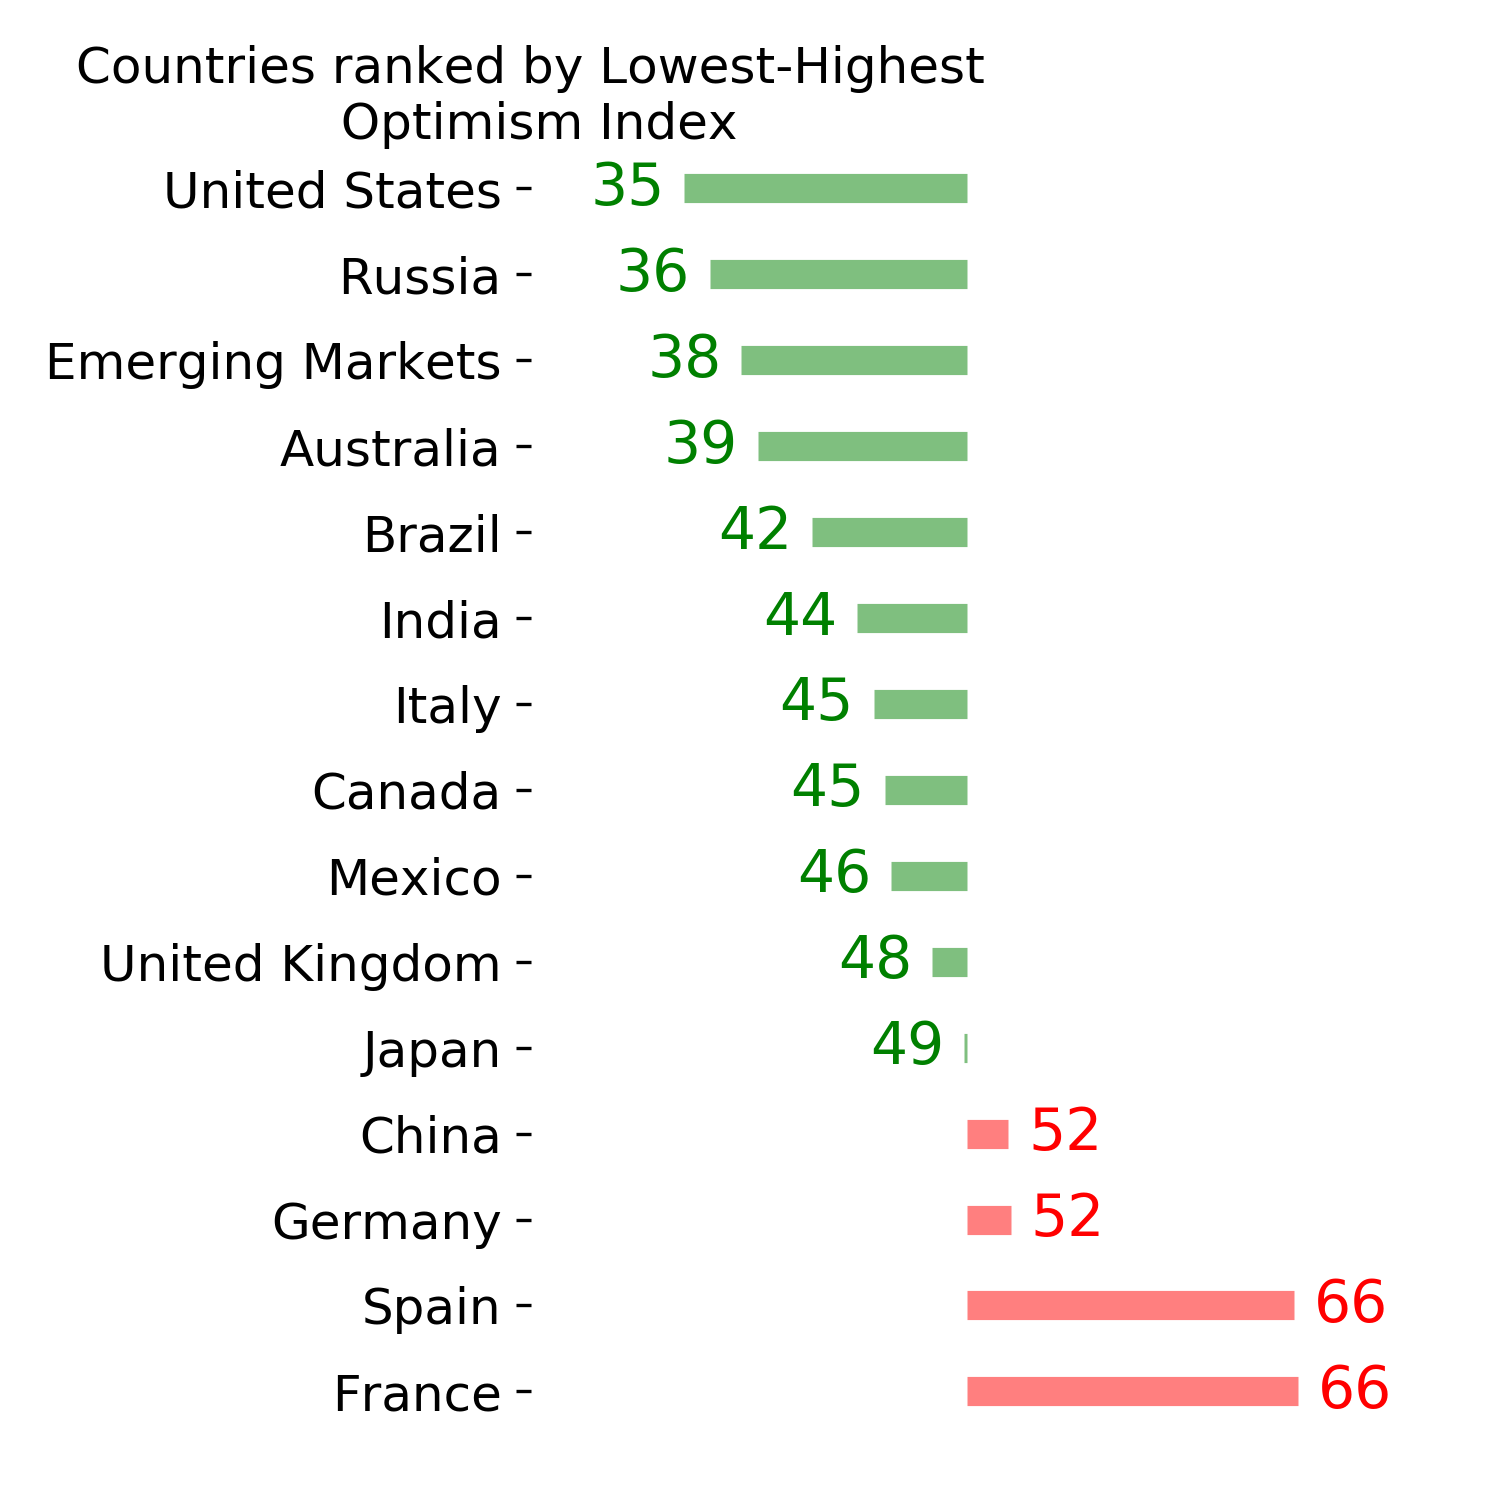
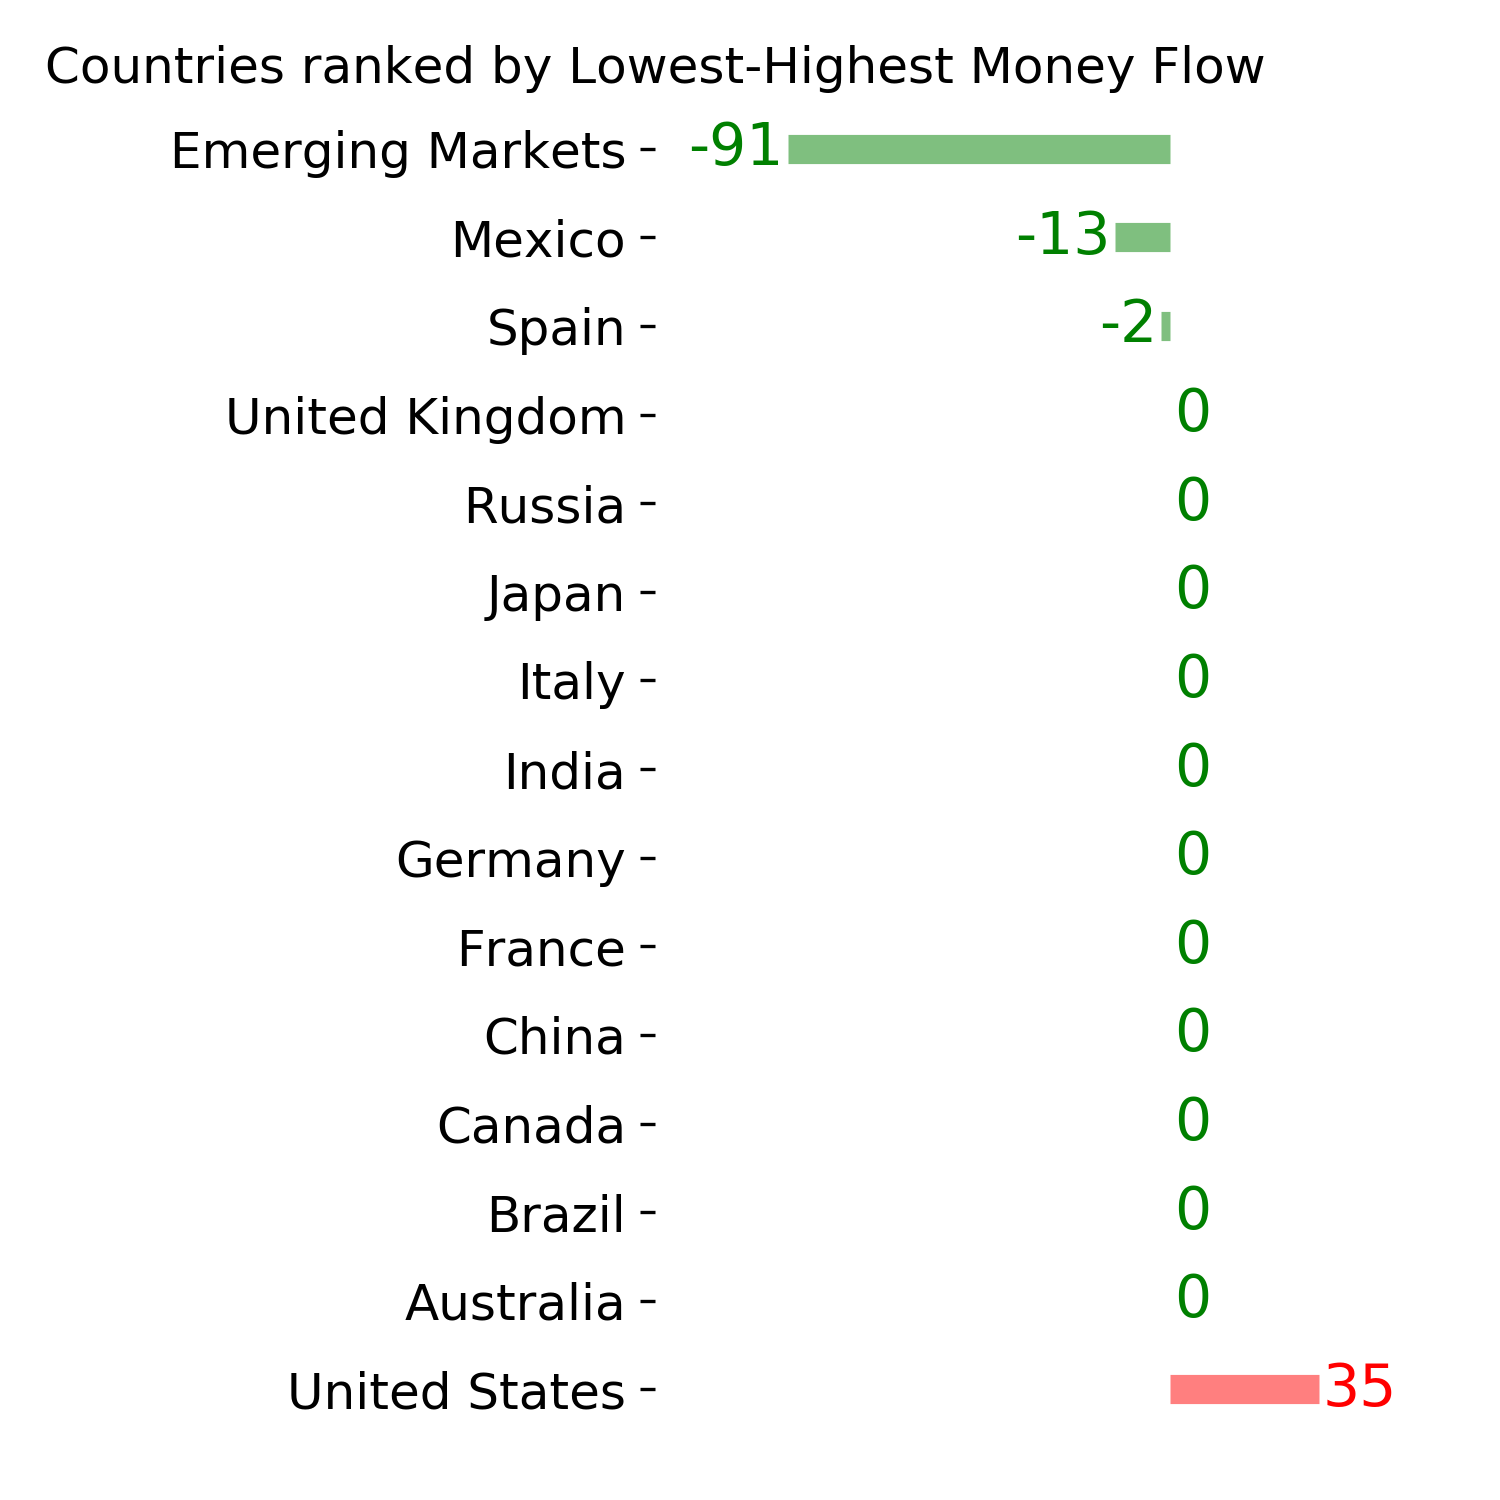
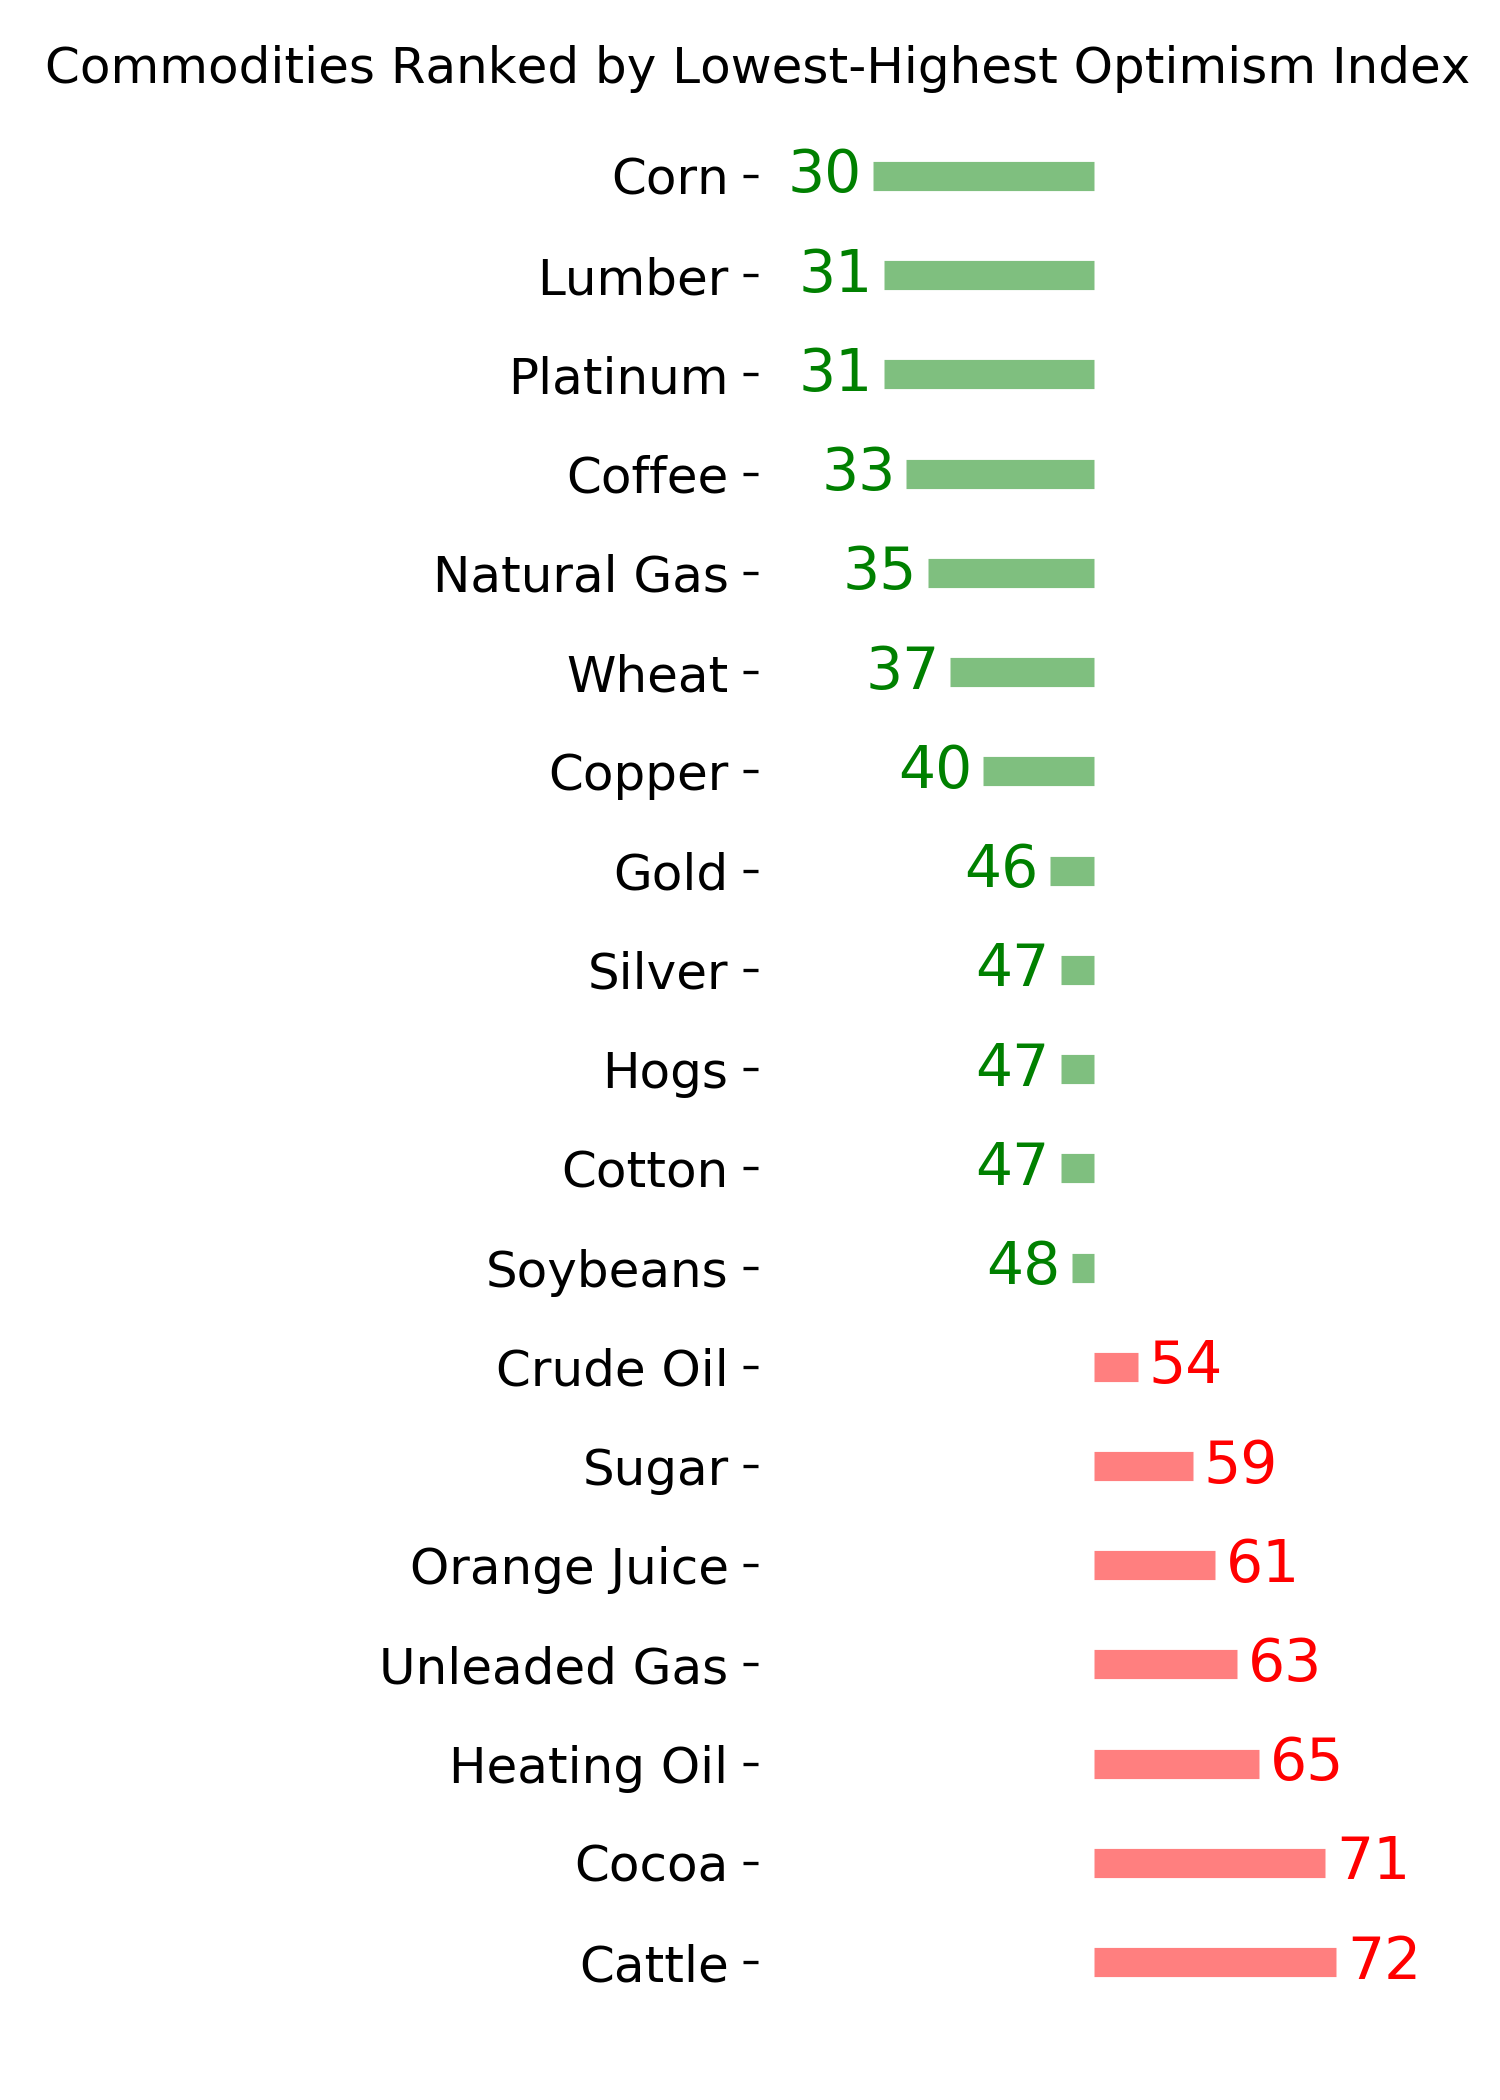
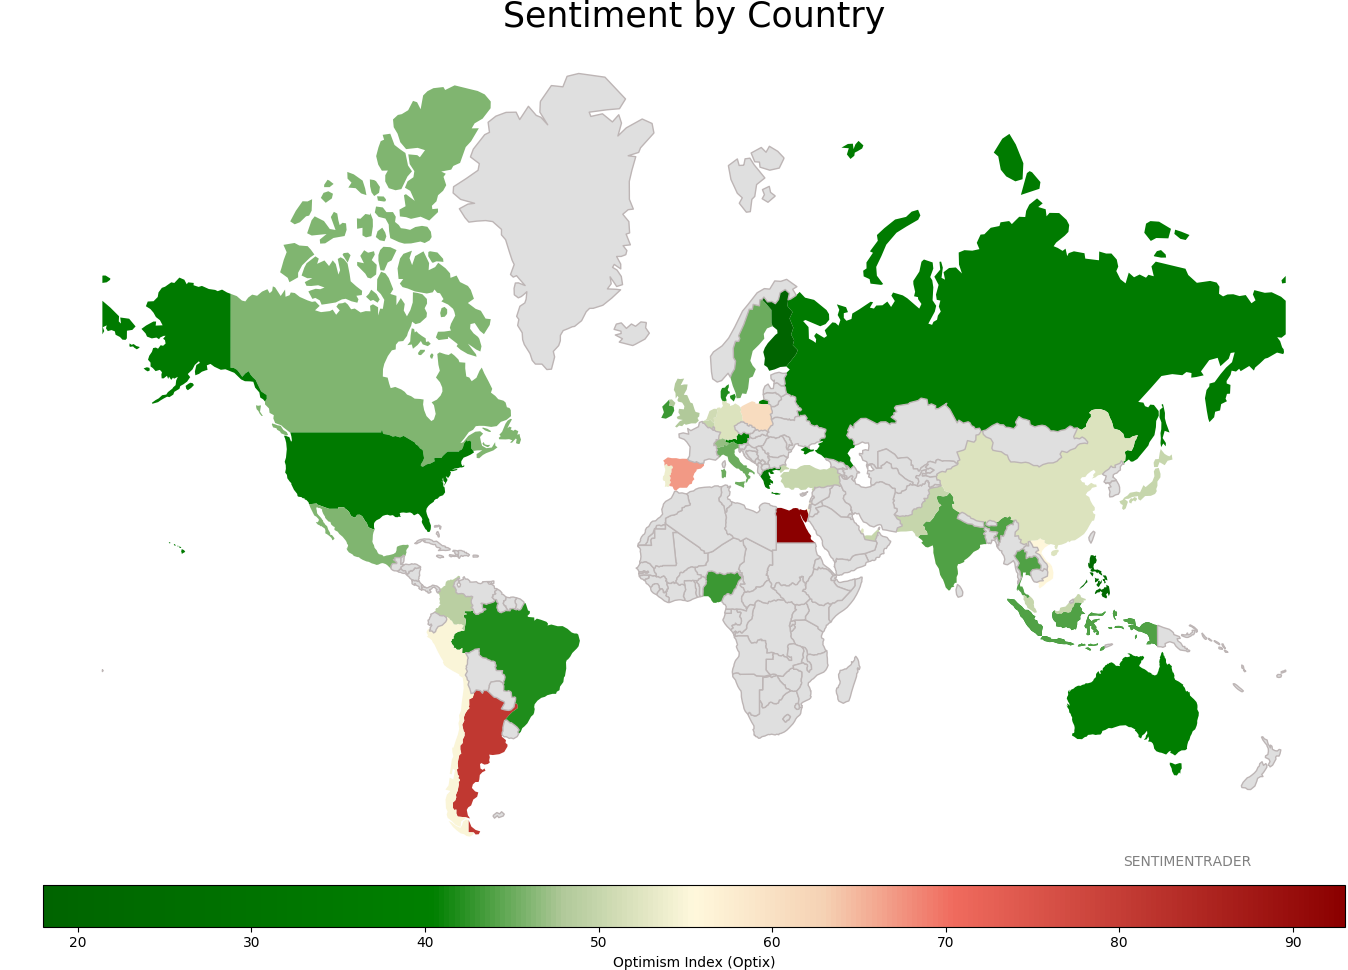
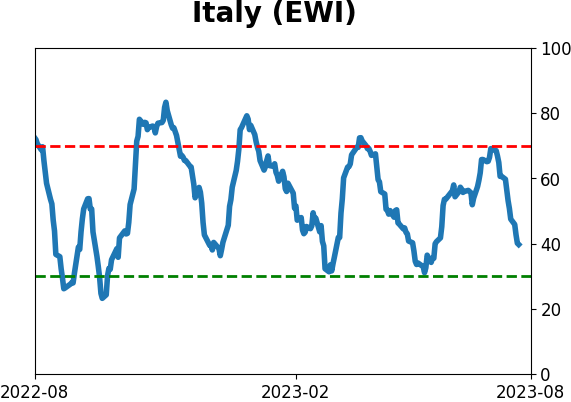
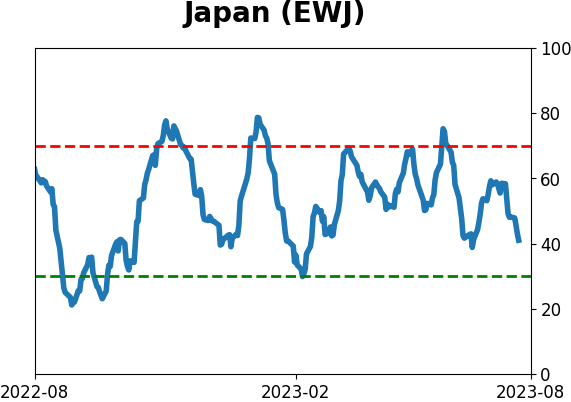
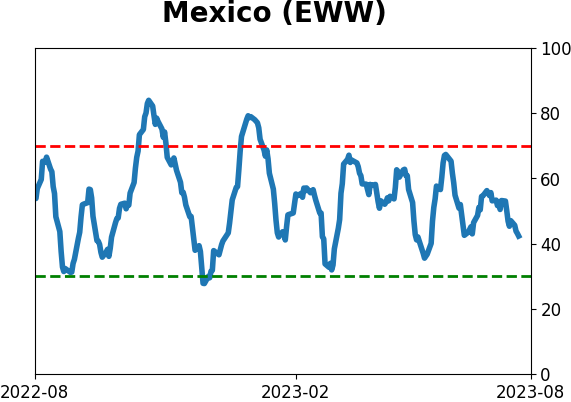
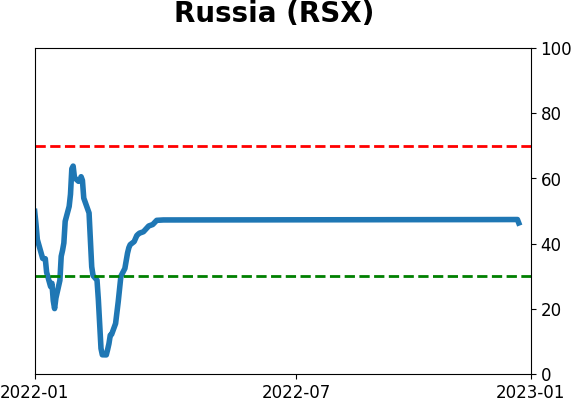
Sentiment Around The World
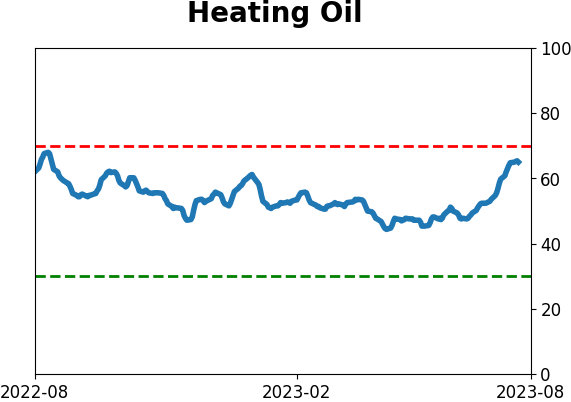
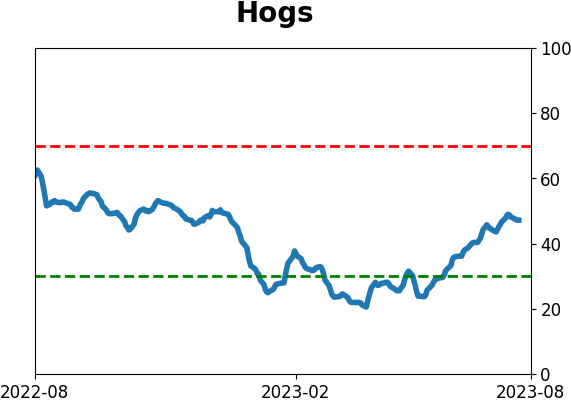
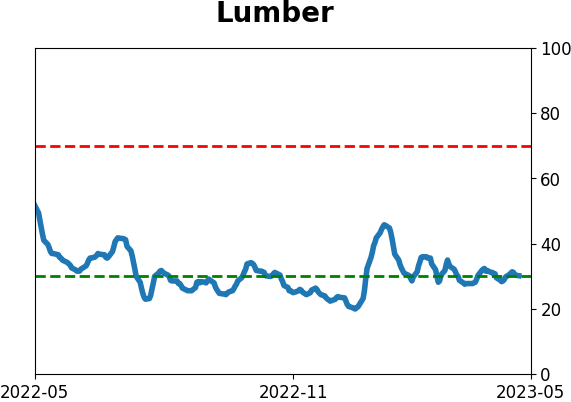
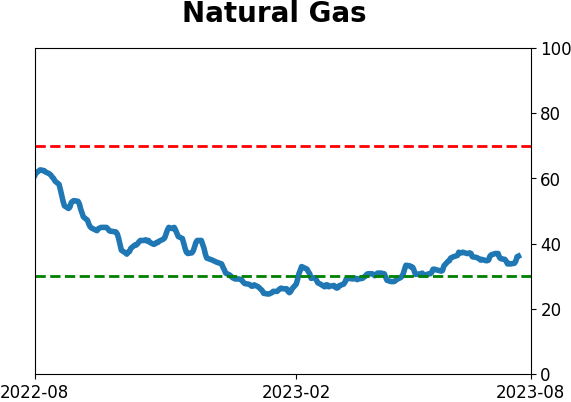
Optimism Index Thumbnails
|
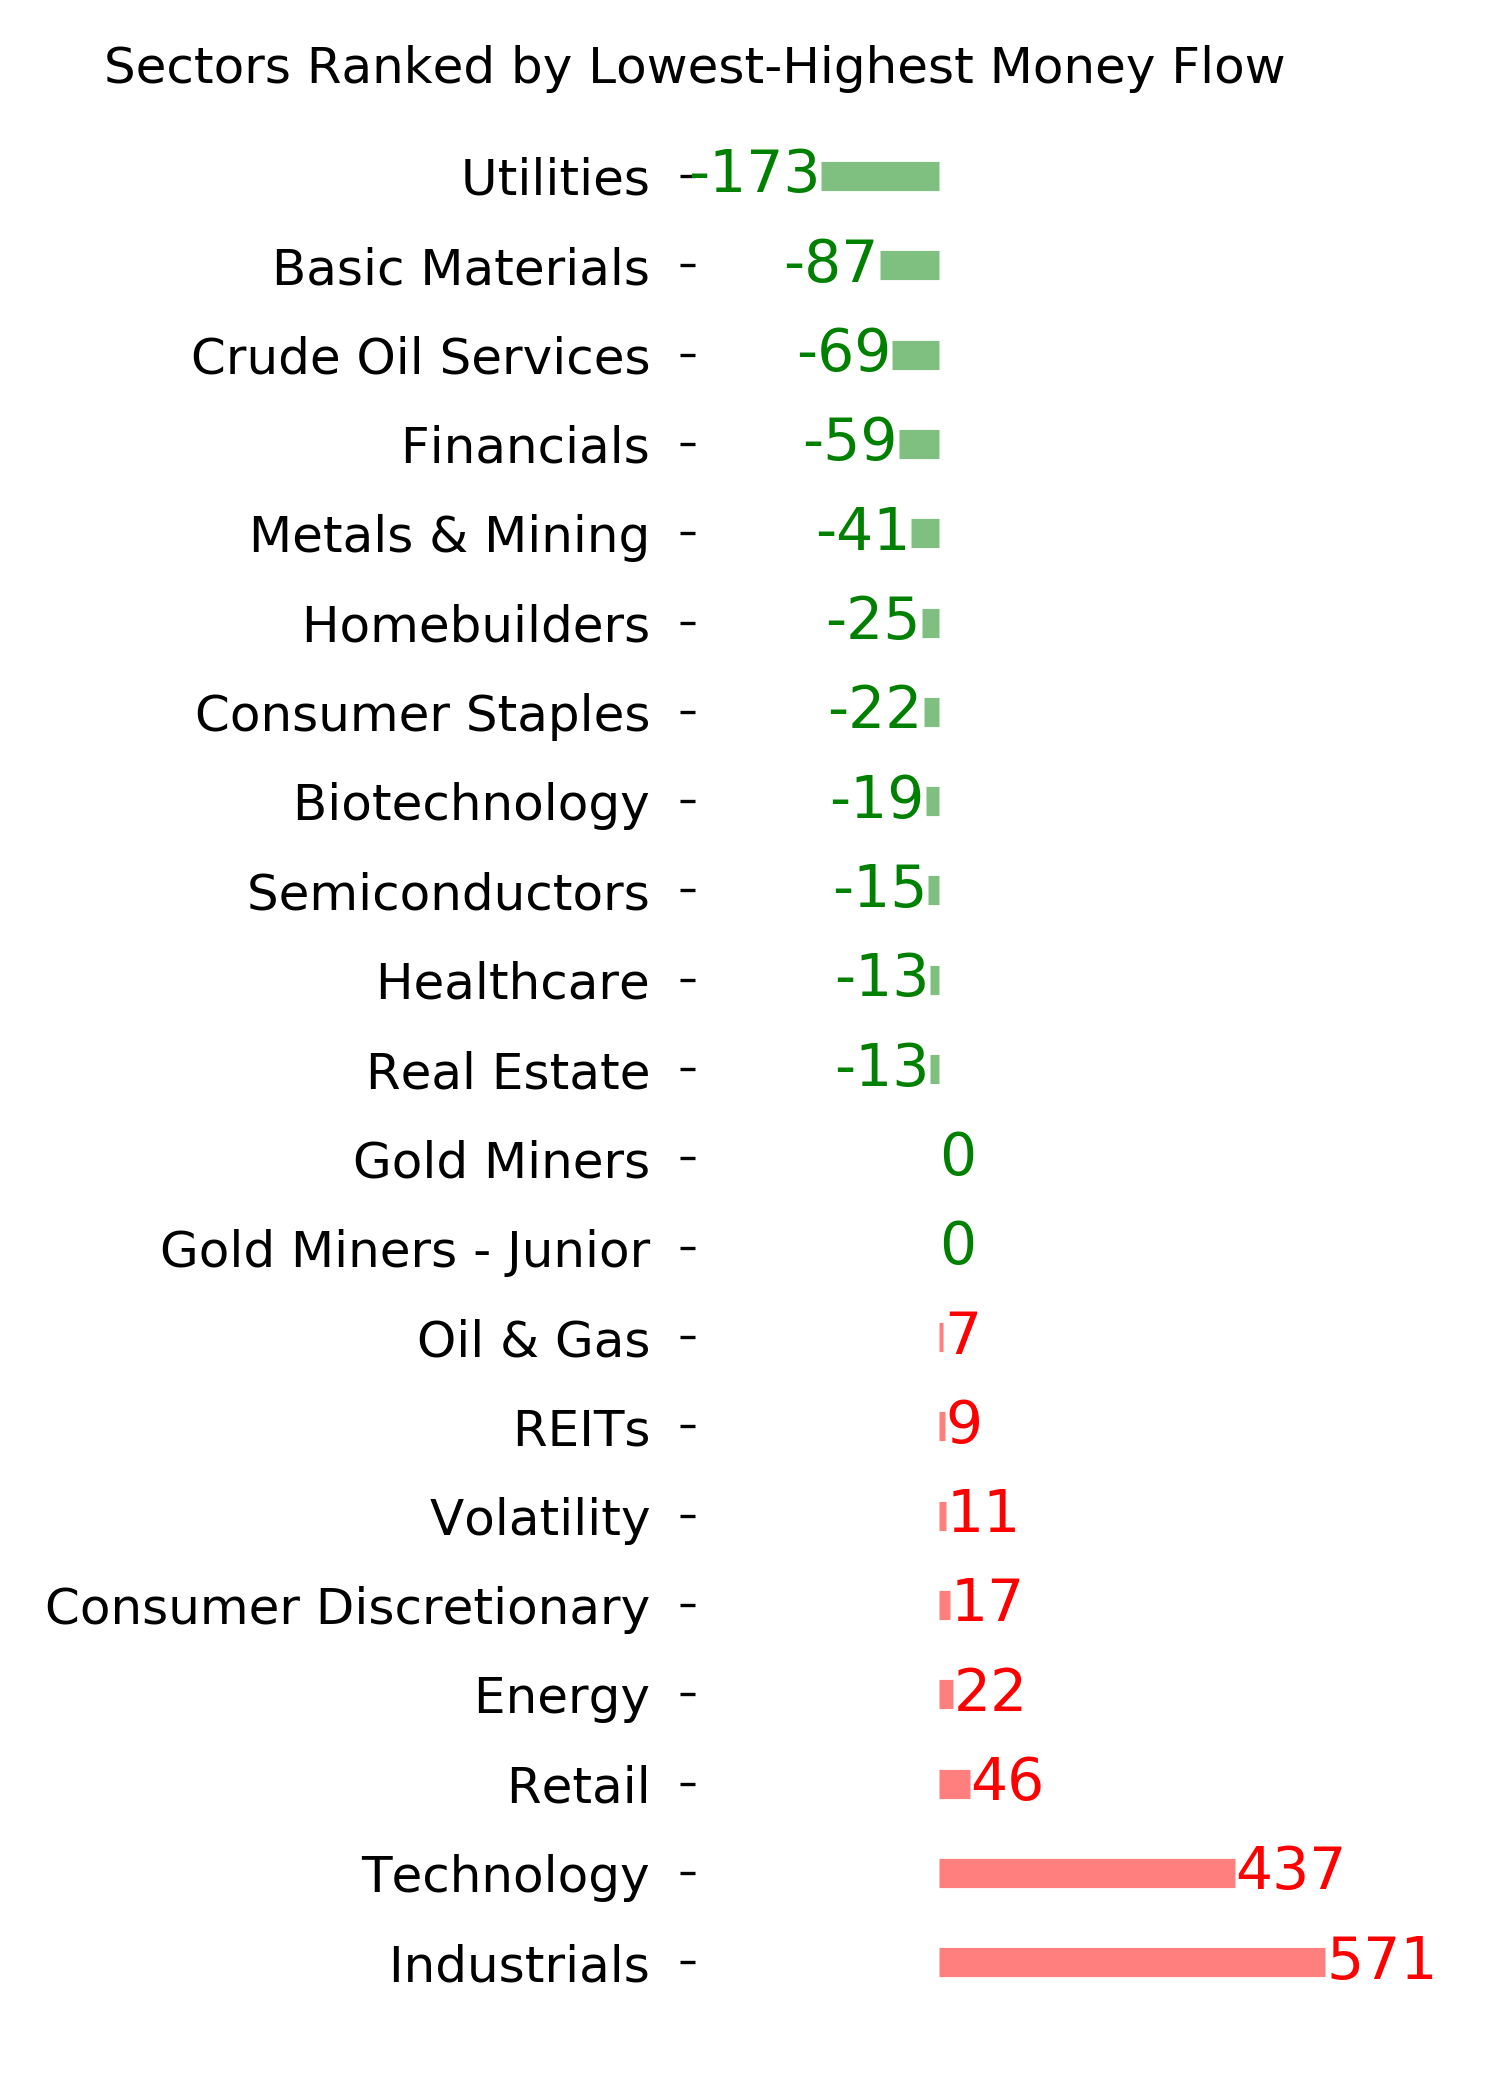
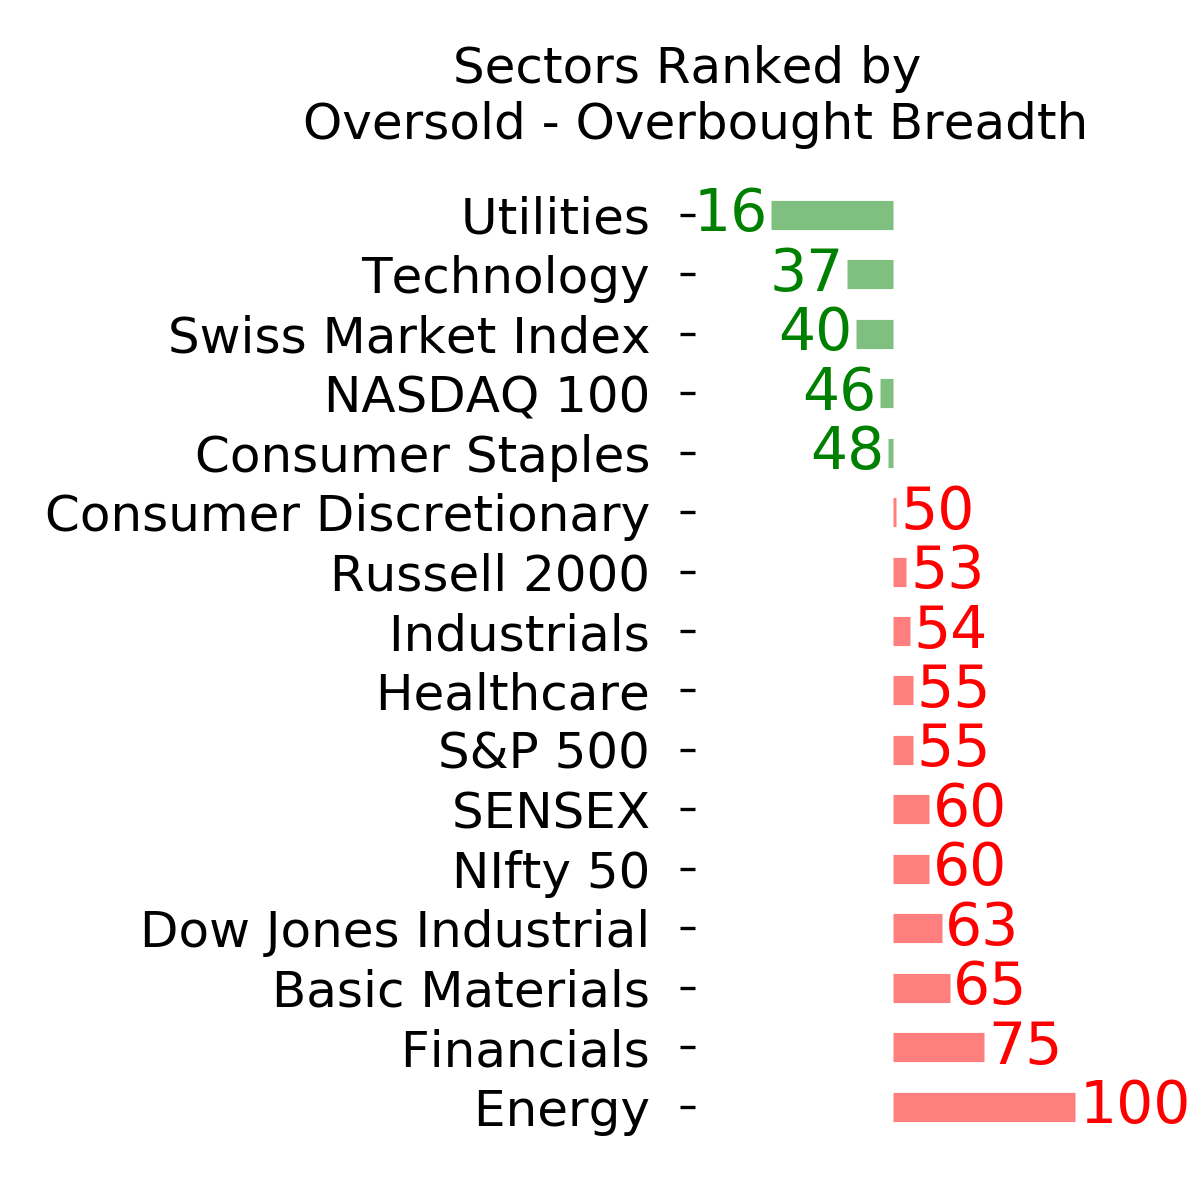
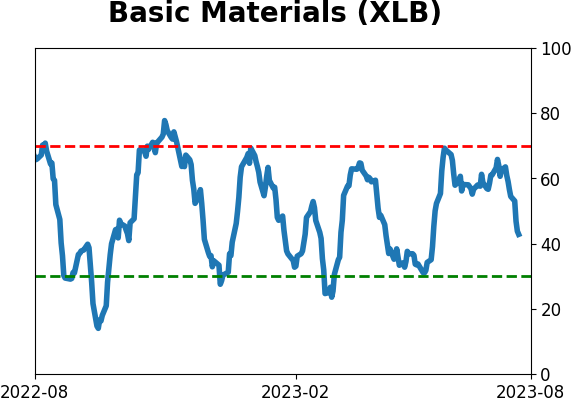
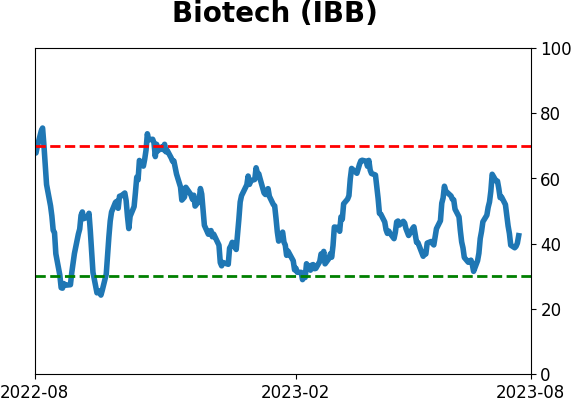
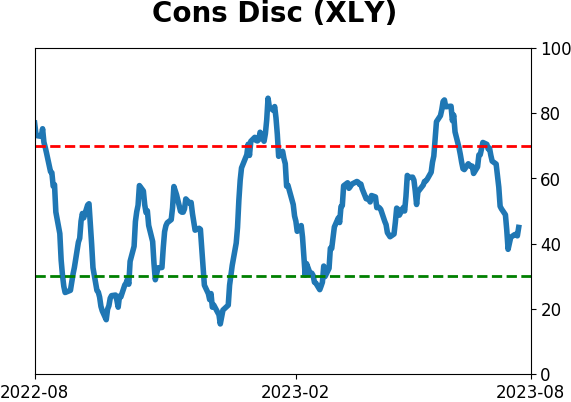
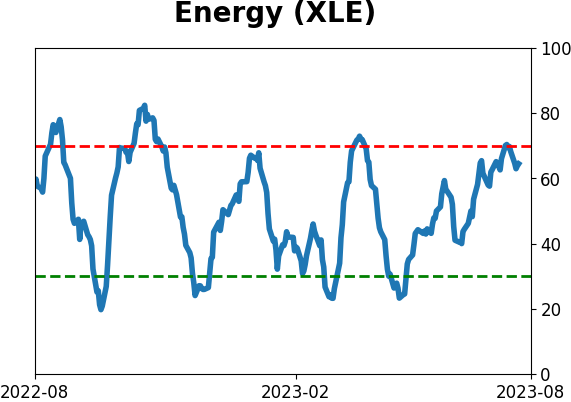
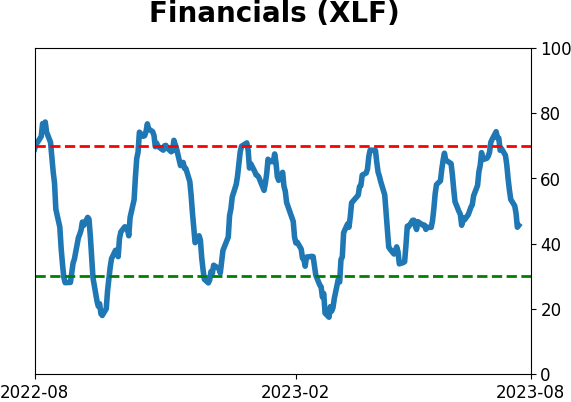
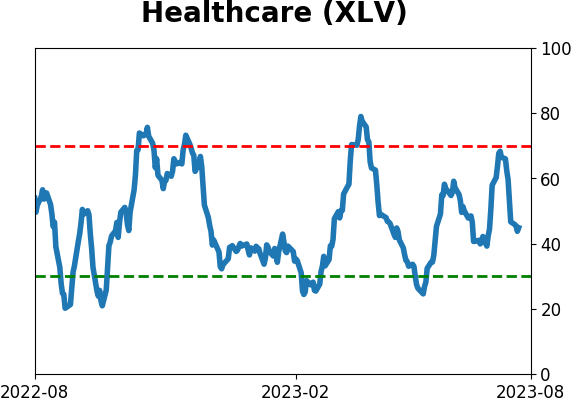
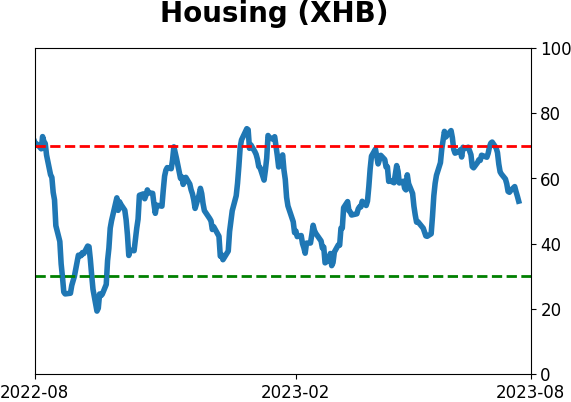
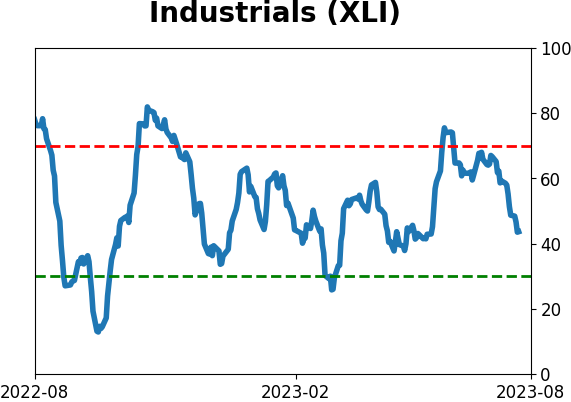
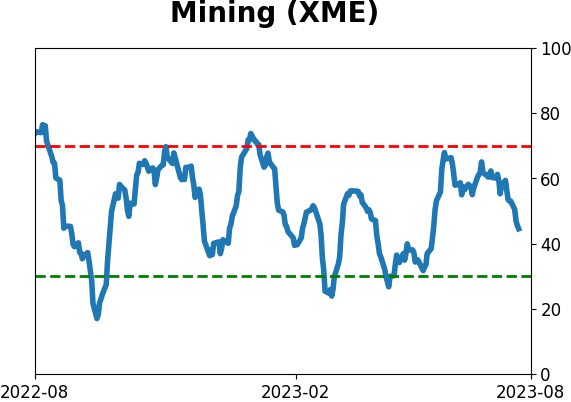
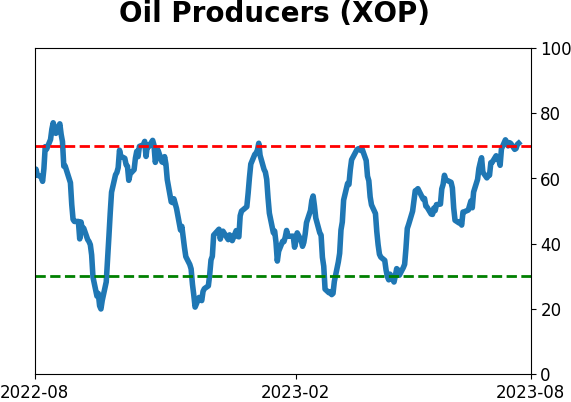
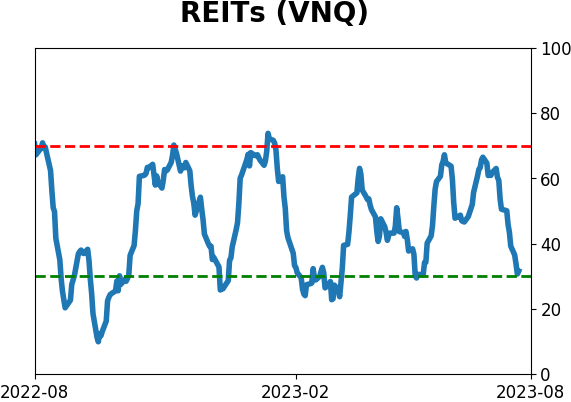
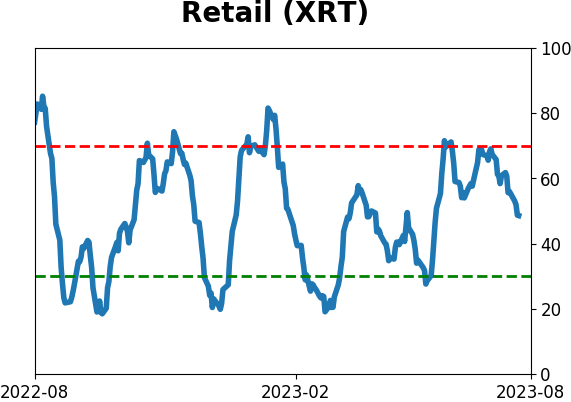
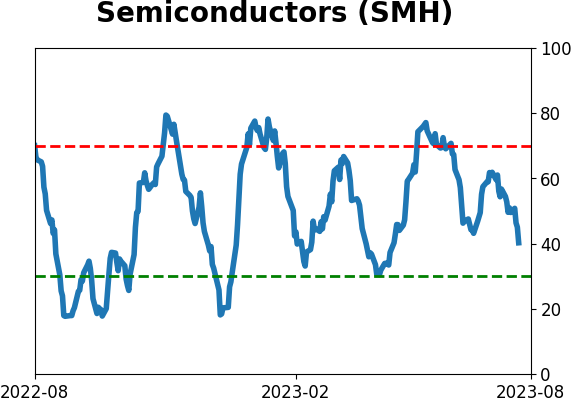
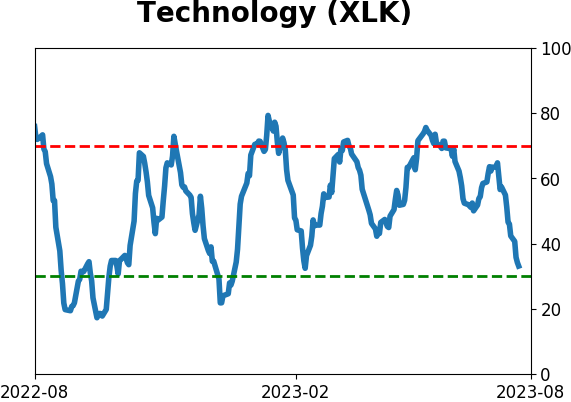
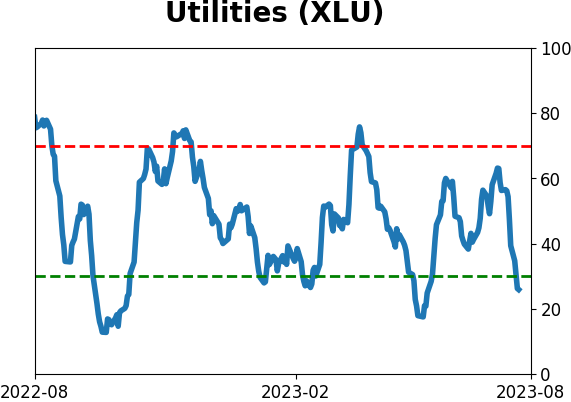
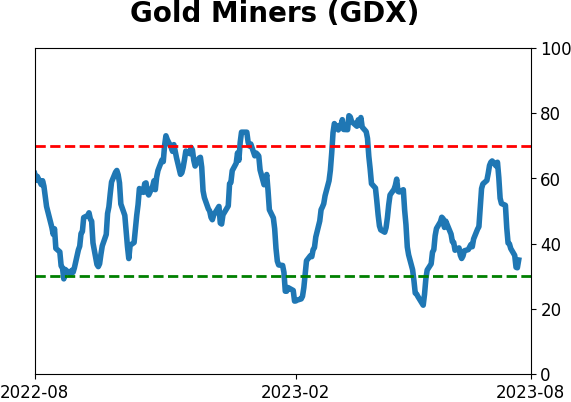
Sector ETF's - 10-Day Moving Average
|
|
|
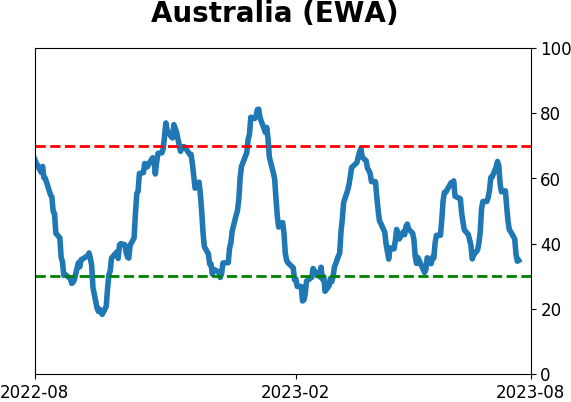
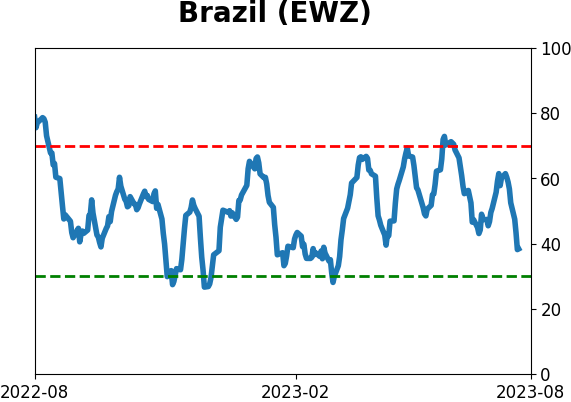
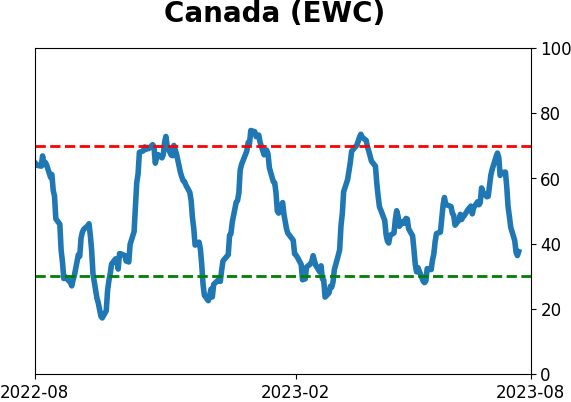
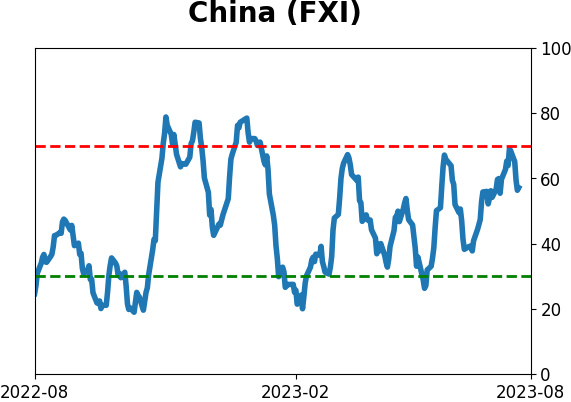
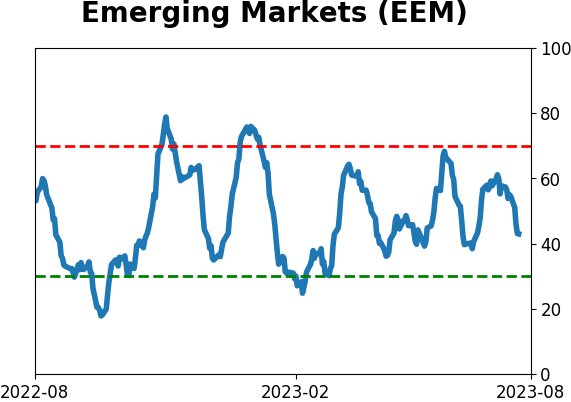
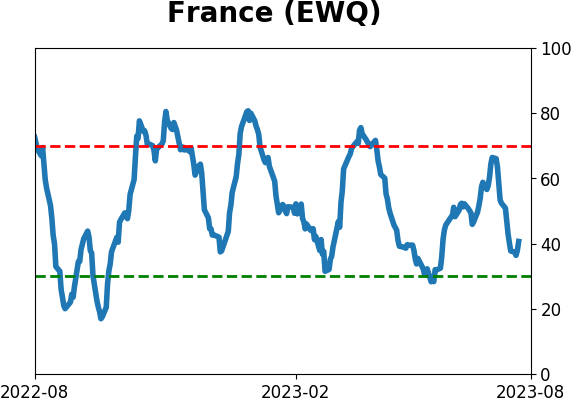
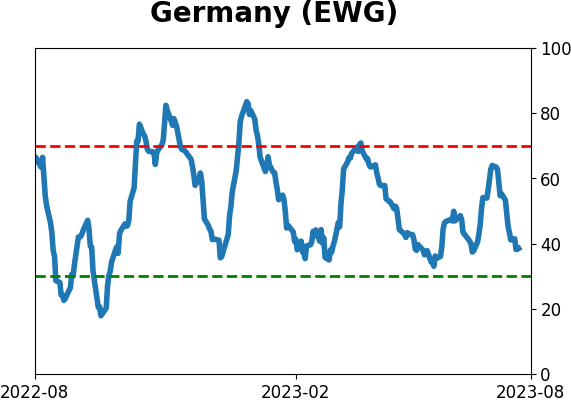
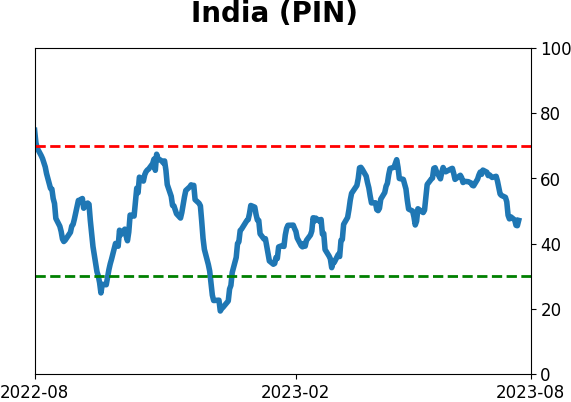
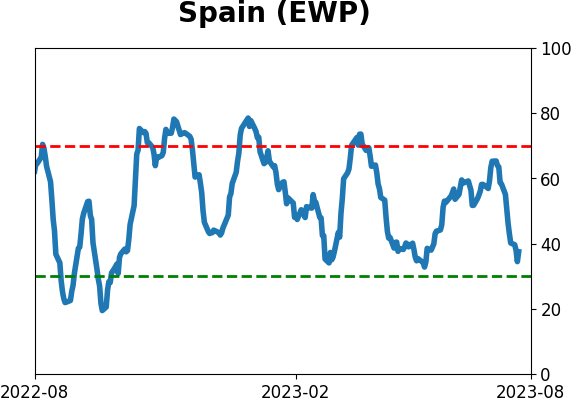
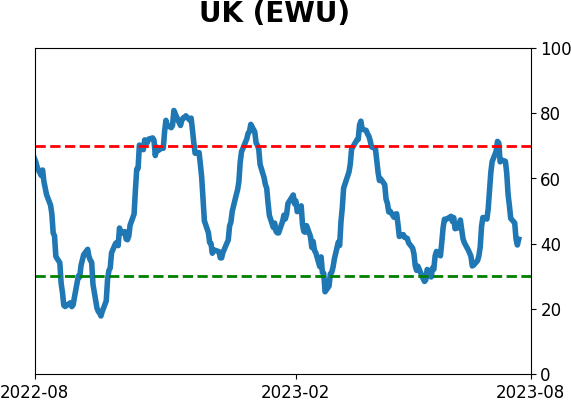
Country ETF's - 10-Day Moving Average
|
|
|
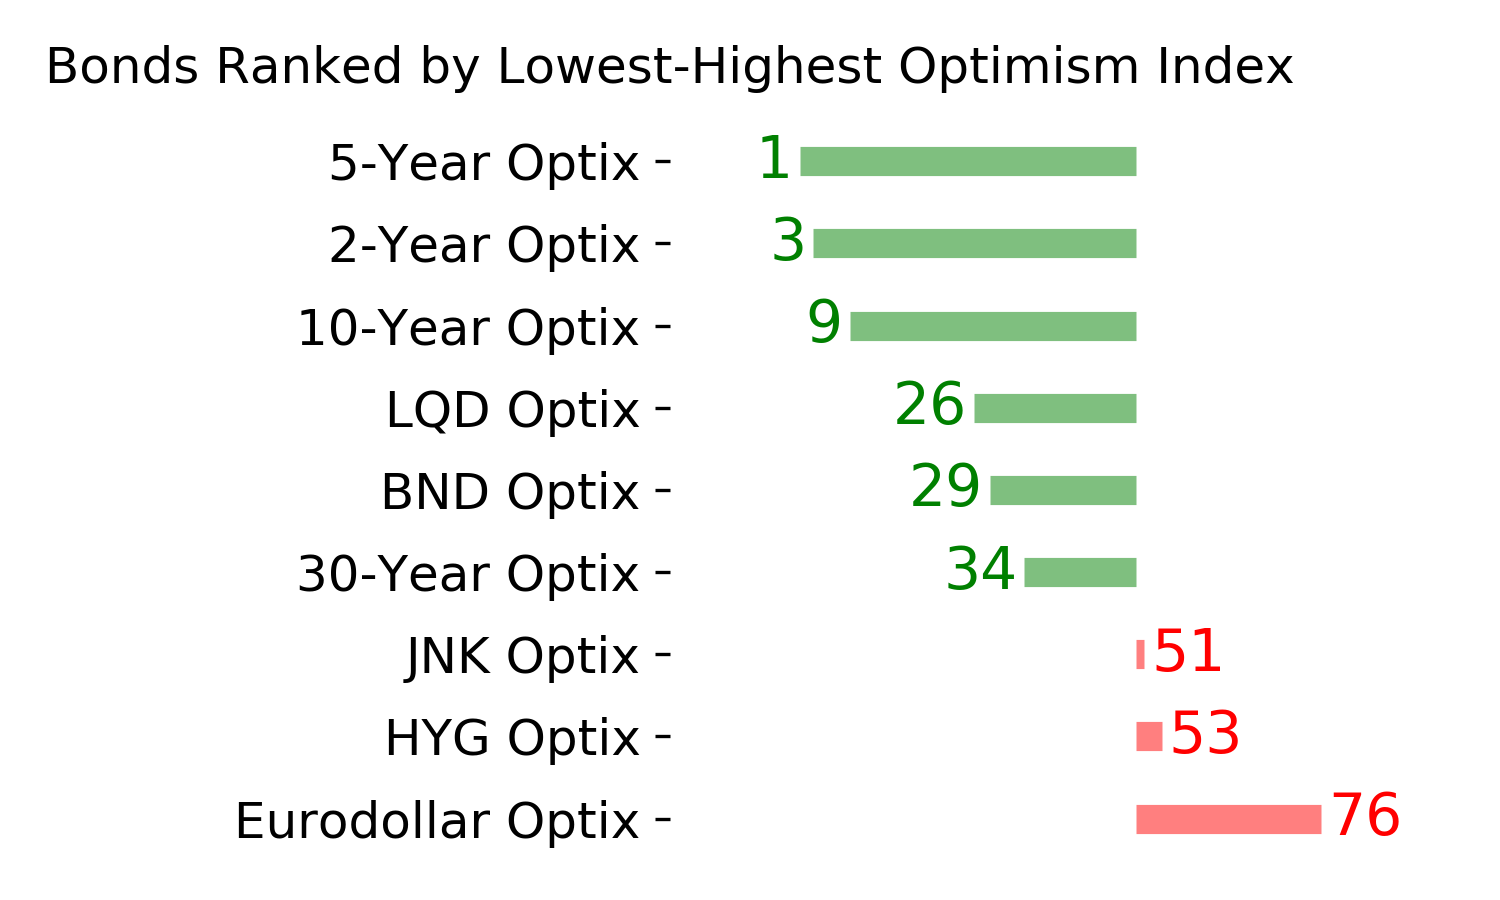
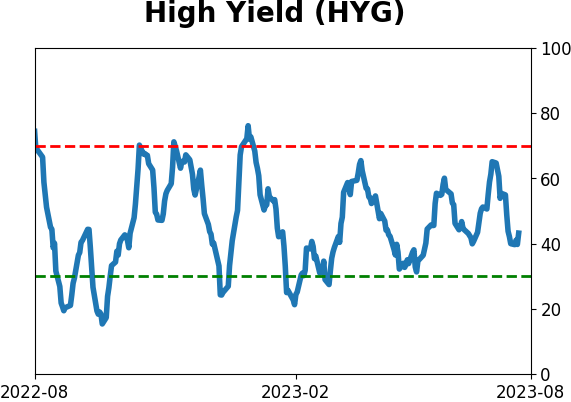
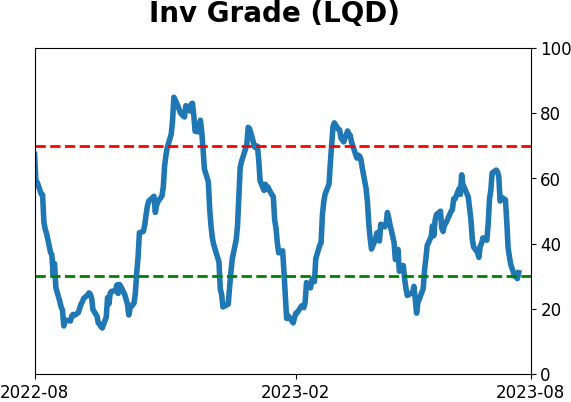
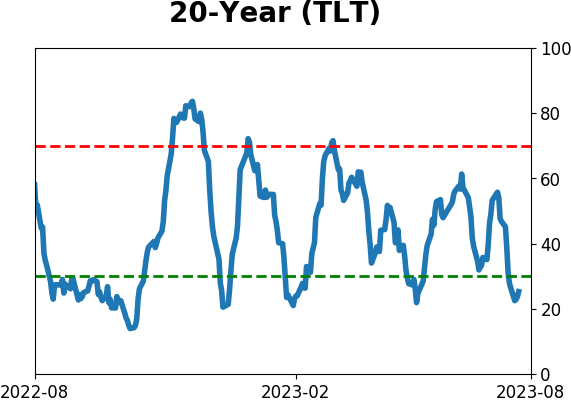
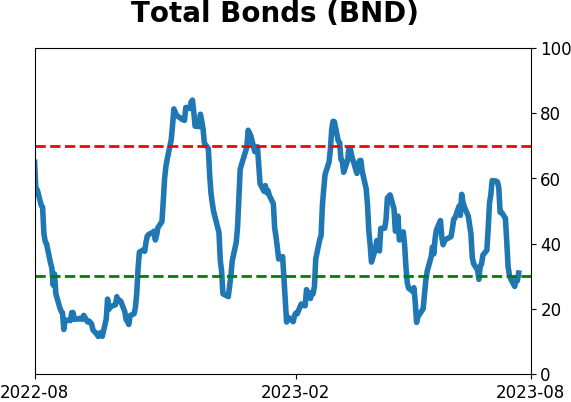
Bond ETF's - 10-Day Moving Average
|
|
|
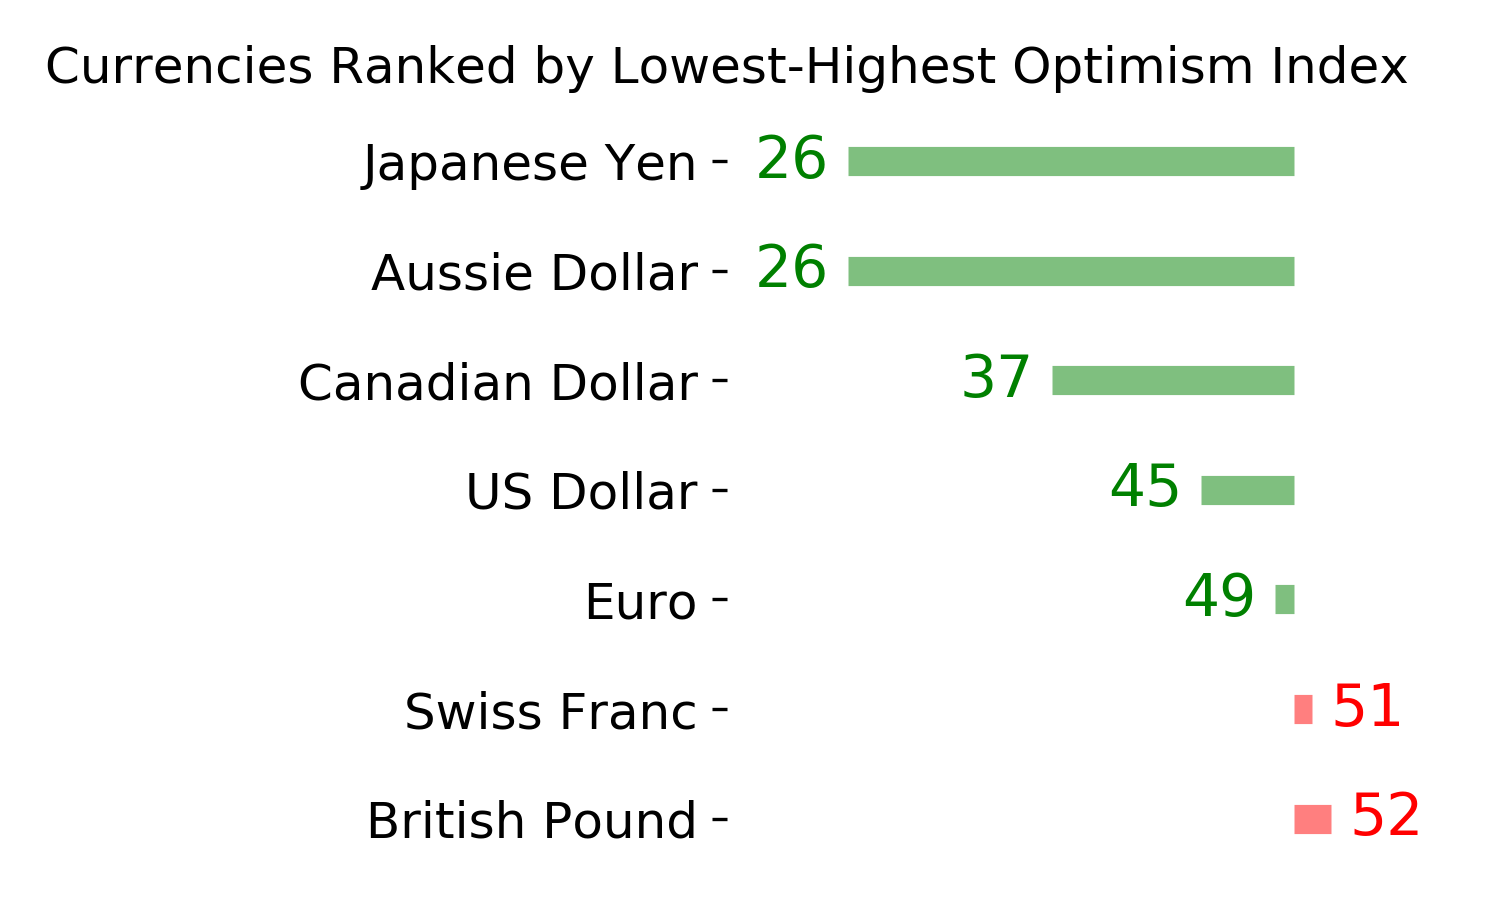
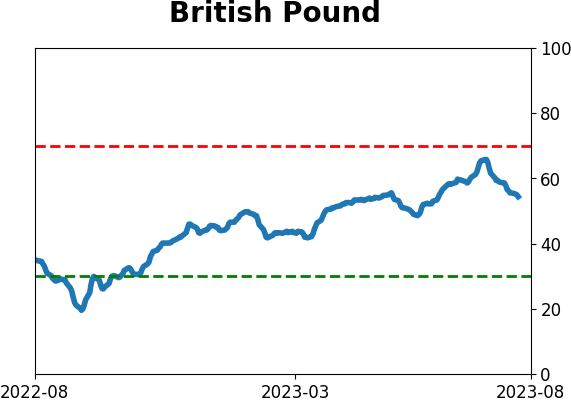
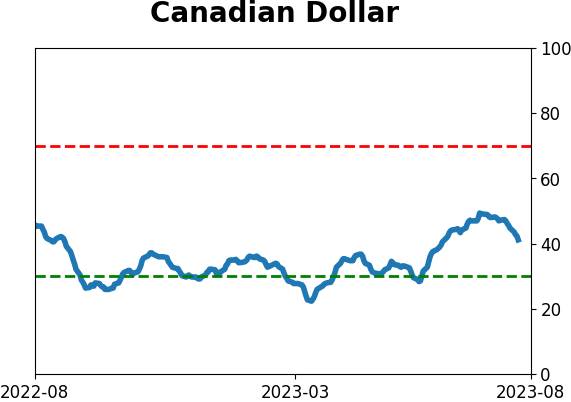
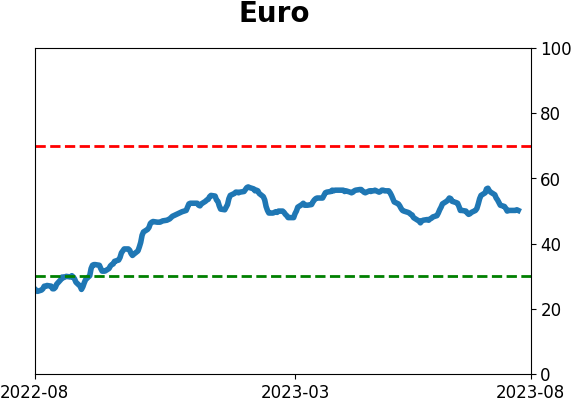
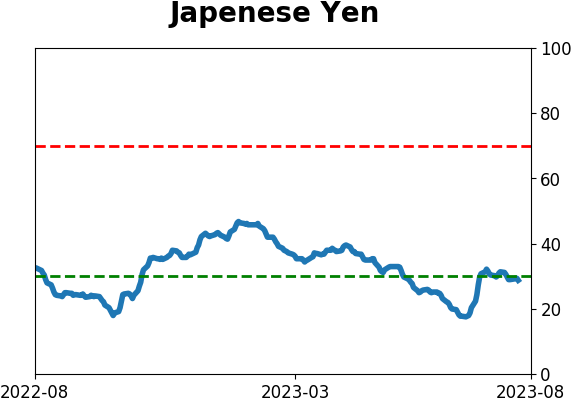
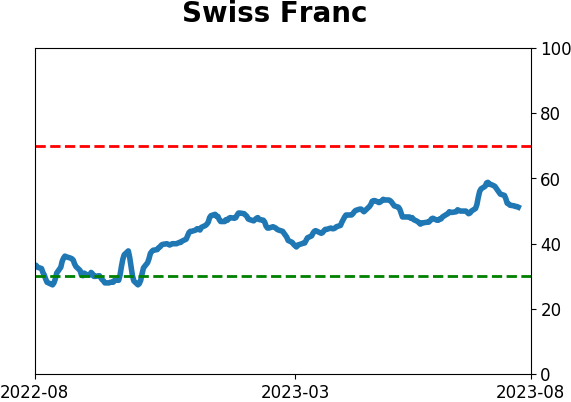
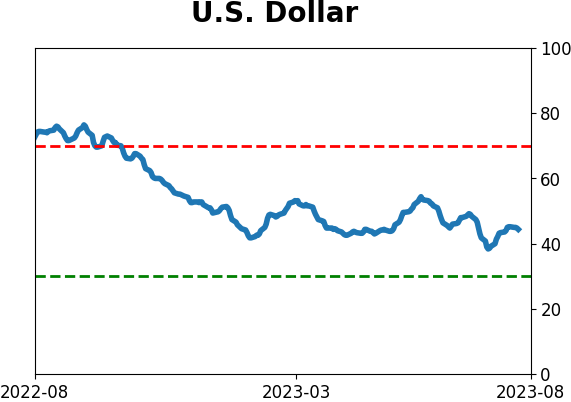
Currency ETF's - 5-Day Moving Average
|
|
|
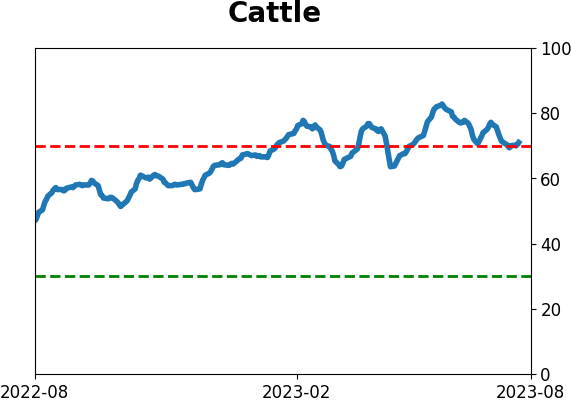
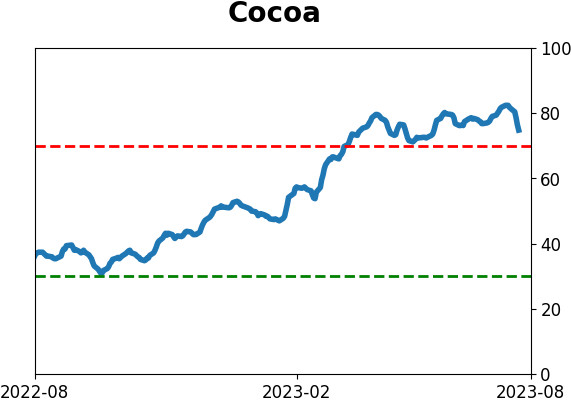
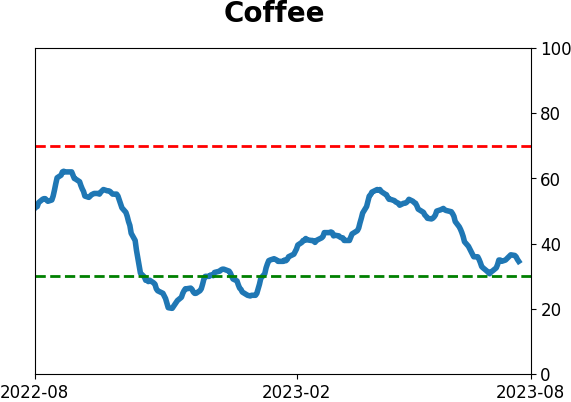
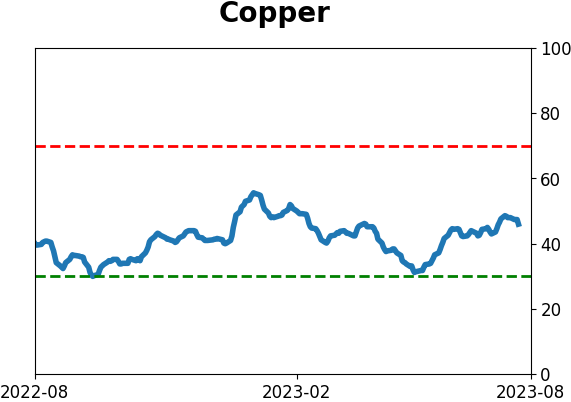
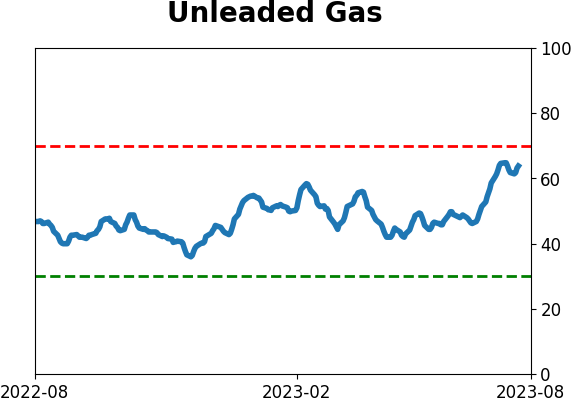
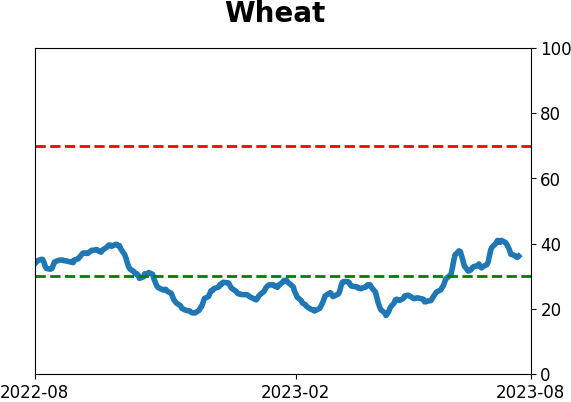
Commodity ETF's - 5-Day Moving Average
|
|