Headlines
|
|
The S&P 500 reminds investors what volatility looks like:
Investors have been reminded of what volatility looks like, as the S&P 500 swings more than 2% intraday. After the ending of other long streaks of abnormally calm conditions, sentiment often shifted over longer time frames. During the past 25 years, these shifts have ushered in markets with poor risk relative to reward, except for defensive stocks.
|
Smart / Dumb Money Confidence
|
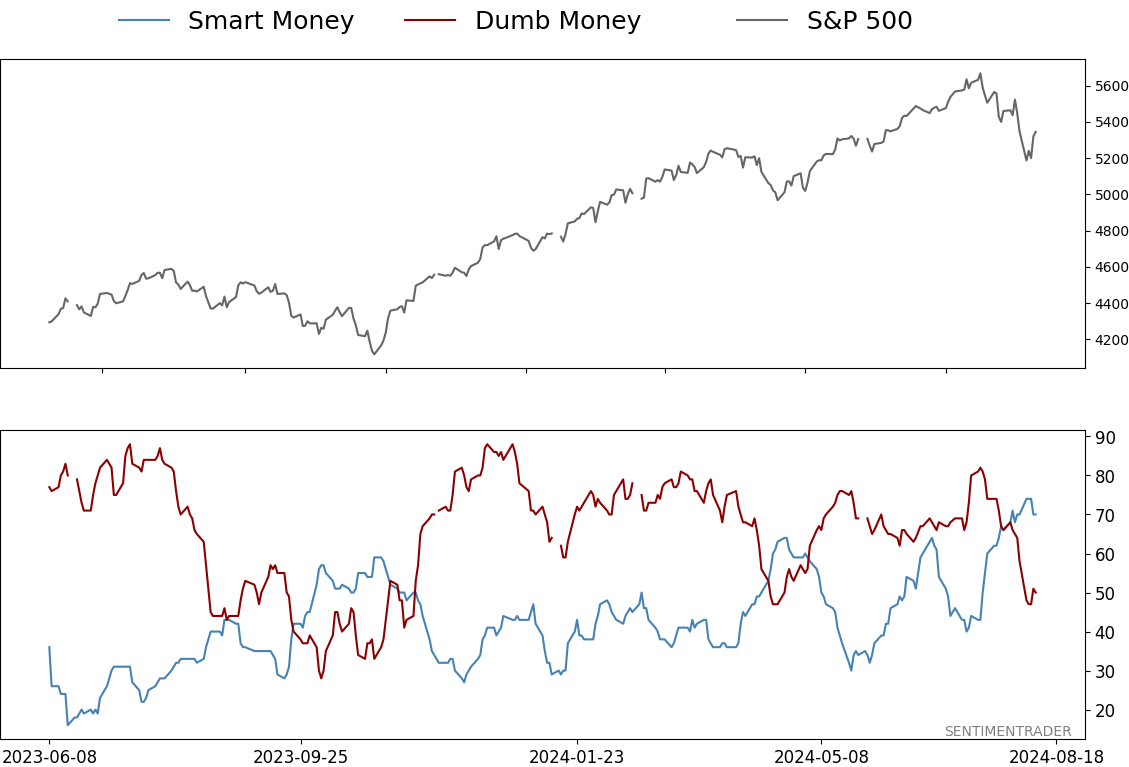
Smart Money Confidence: 70%
Dumb Money Confidence: 50%
|
|
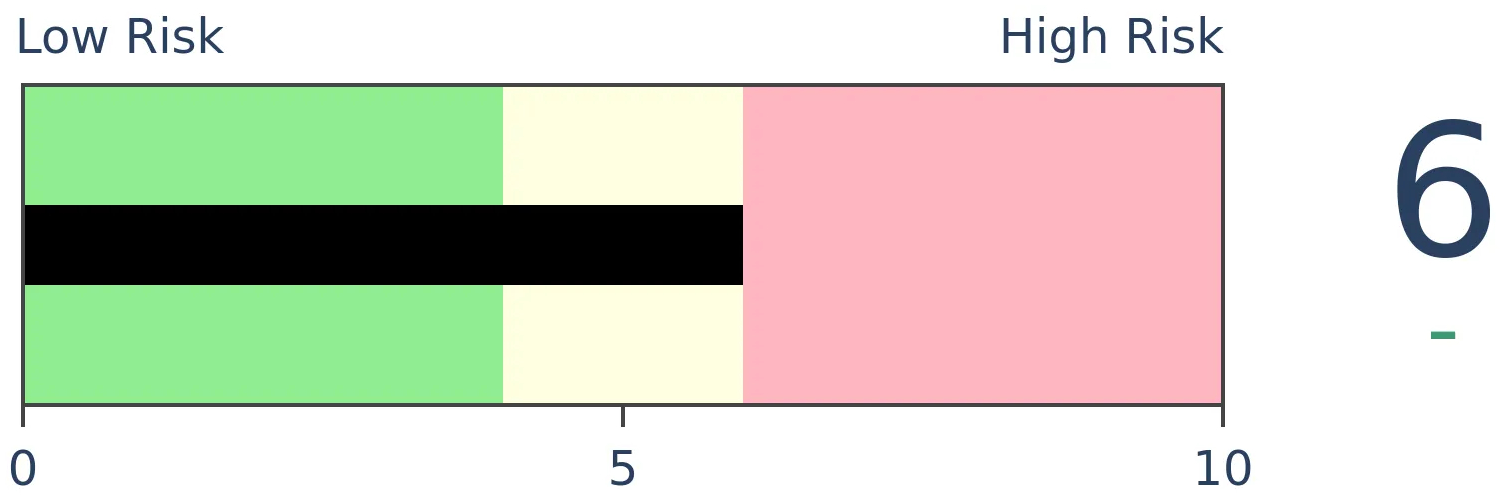
Risk Levels
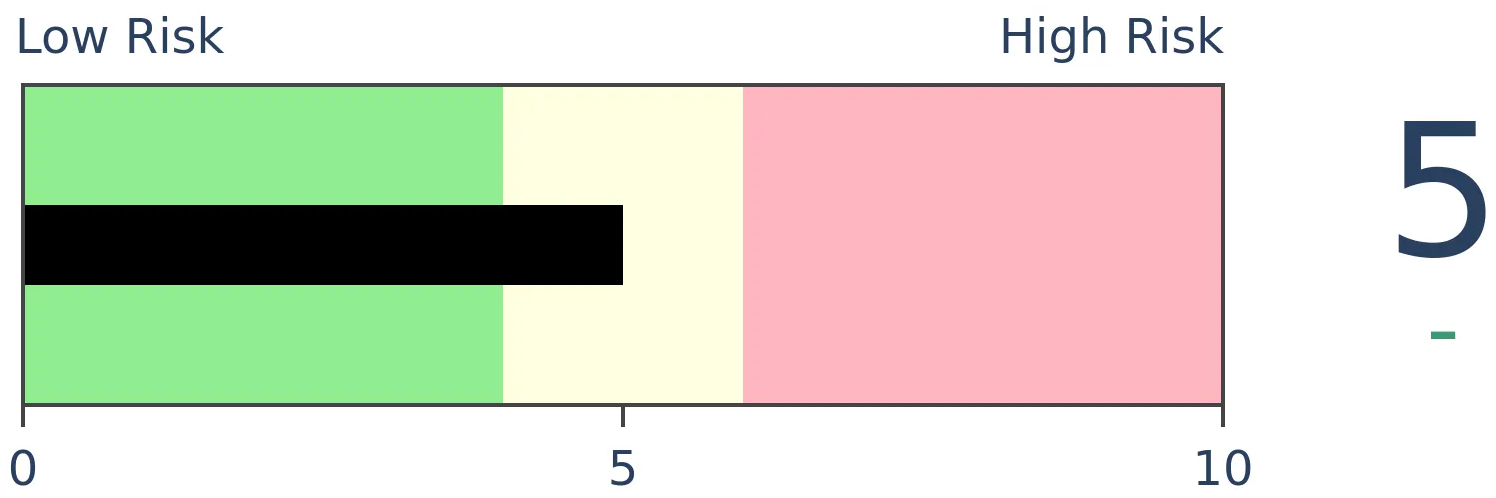
Stocks Short-Term
|
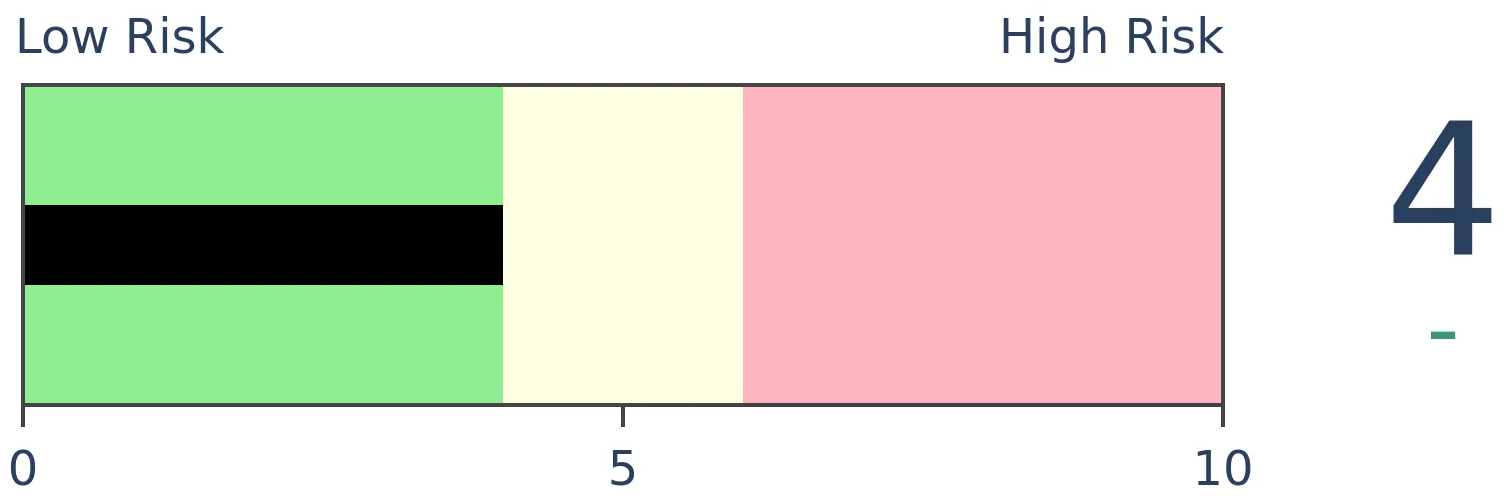
Stocks Medium-Term
|
|
Bonds
|
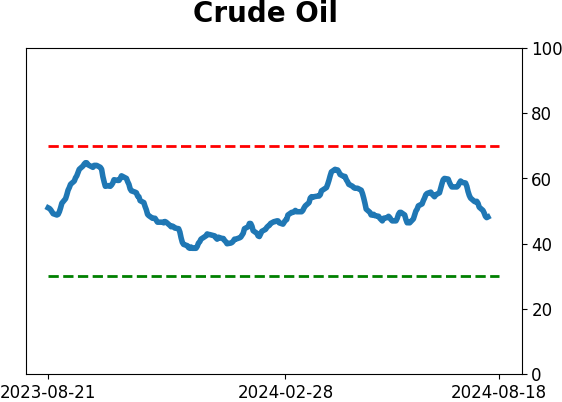
Crude Oil

|
|
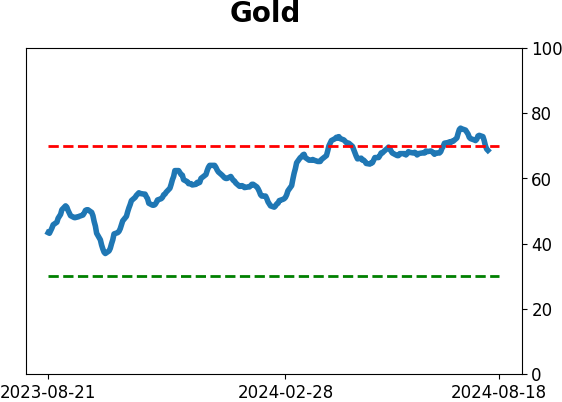
Gold

|
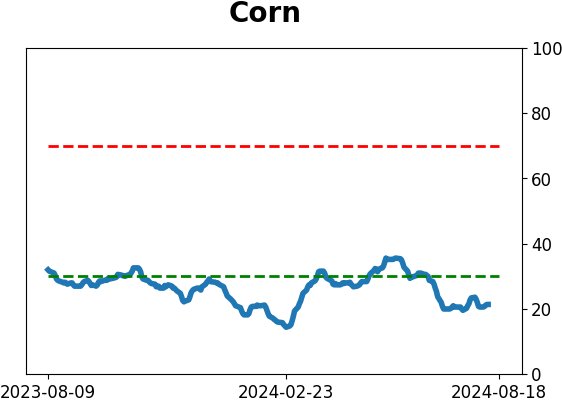
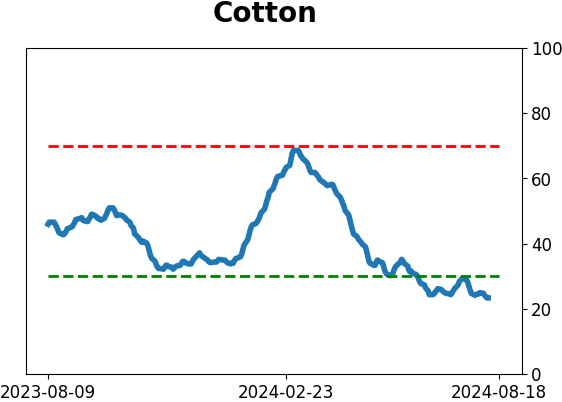
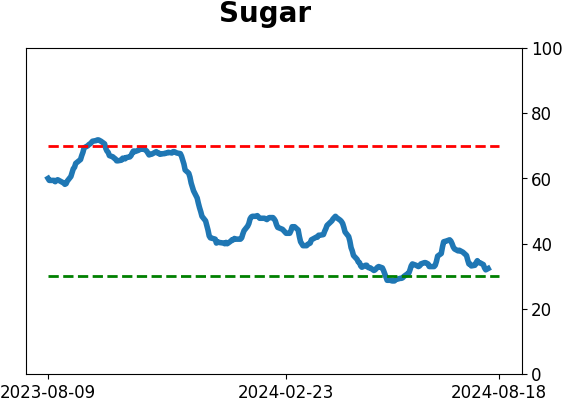
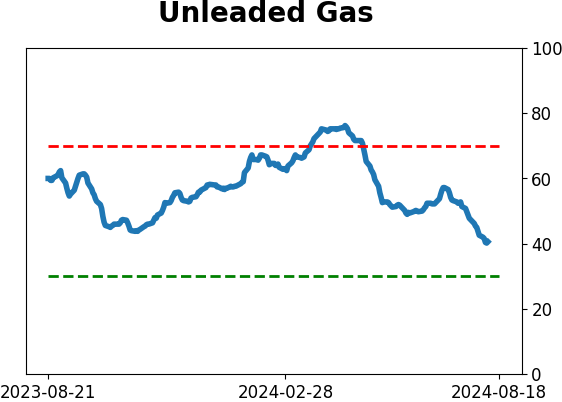
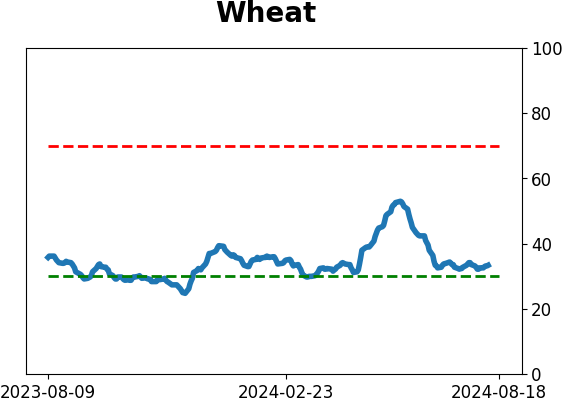
Agriculture

|
|
Research
By Jason Goepfert
BOTTOM LINE
Investors have been reminded of what volatility looks like, as the S&P 500 swings more than 2% intraday. After the ending of other long streaks of abnormally calm conditions, sentiment often shifted over longer time frames. During the past 25 years, these shifts have ushered in markets with poor risk relative to reward, except for defensive stocks.
FORECAST / TIMEFRAME
None
|
Key points:
- The S&P 500 has averaged a 2% intraday range over the past two weeks, the widest in over a year
- This has ended a historically long streak without a 2% average range, increasing the potential for a sentiment shift
- Over the past 25 years, the ending of long periods of calm has ushered in troubling precedents
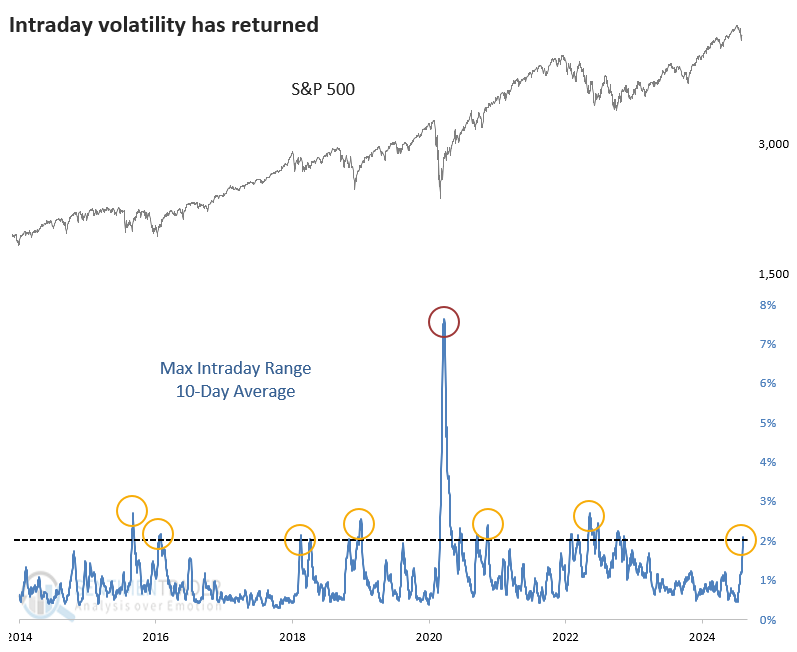
This is what volatility looks like
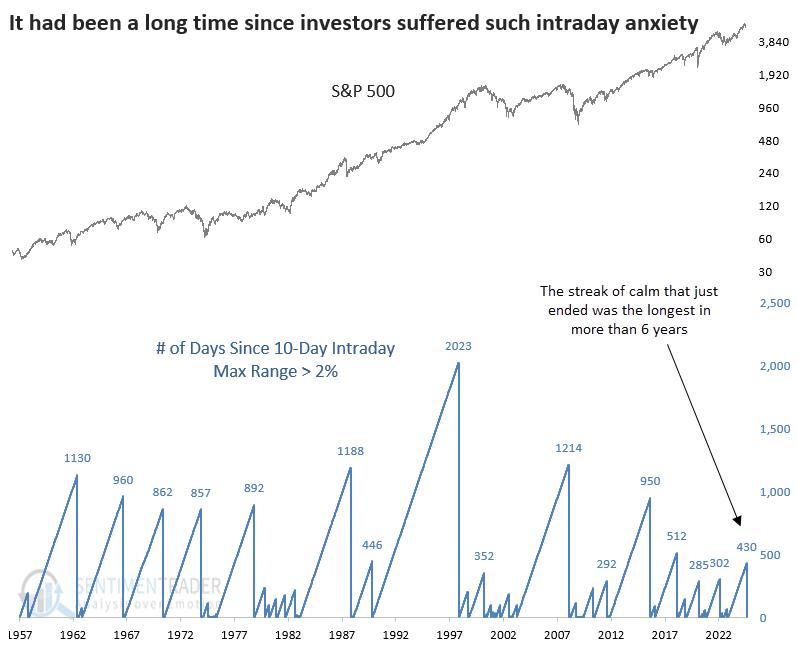
After a historic stretch of calm conditions, investors have been reminded of what volatility looks like. The world's most benchmarked index enjoyed a remarkable run without so much as a 2% intraday move or even 1% for a while there.
Until a relatively uneventful day on Friday, the S&P 500 had moved at least 1% intraday for eight straight sessions, the most prolonged bout of large moves in well over a year; over the past ten sessions, the S&P has averaged a maximum intraday range of at least 2%.
During the last decade, that's been about the most the index has swung before calming down. The pandemic exceeded that by about 4x, but that was essentially the only exception.
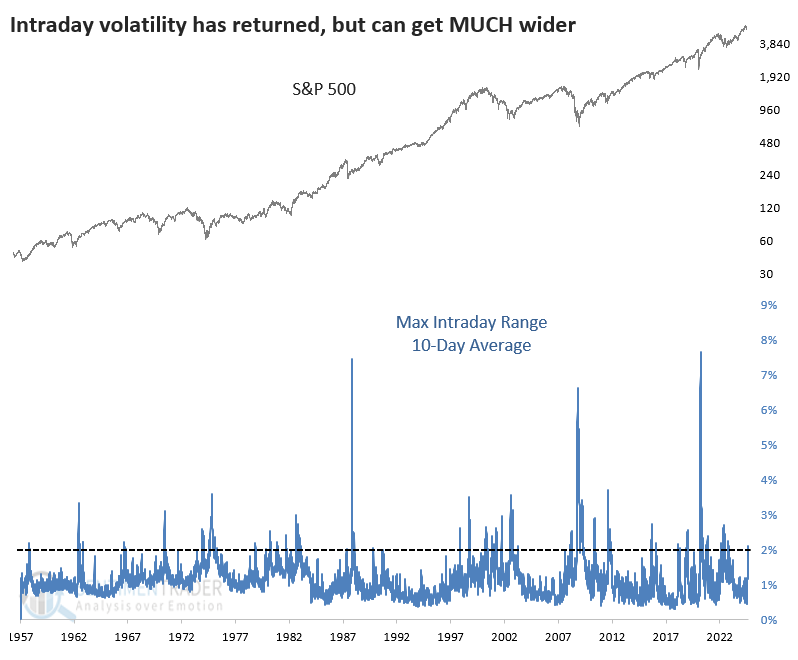
If we zoom out and look at the S&P's maximum intraday range since 1957, we can see that the 2% threshold has contained most of the "normal" moves. The 10-day range went beyond 3% a handful of times, and all-out blow-out moves only occurred three times.
A change like this can potentially trigger a regime change in sentiment. This 2% intraday range is the first time in 430 sessions that investors have experienced something like this, ending the longest stretch in more than a half-decade.
Some troubling precedents
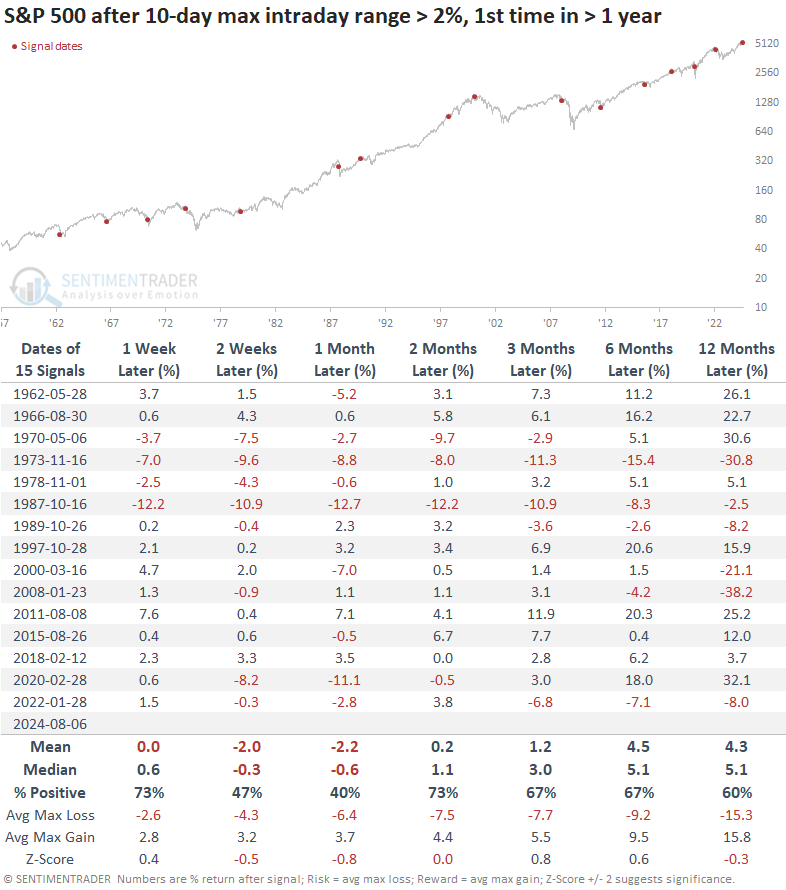
The table below shows how investors responded after being reminded about intraday volatility. It shows S&P 500 returns after it ended a streak of at least a year with a maximum intraday range under 2%.
Once we got past the first month, returns weren't too bad. A month later, the S&P was positive only 40% of the time, with a negative average return and poor risk/reward ratio. But from two to twelve months later, its returns were about in line with any random time, even though the risk/reward skew remained ugly.
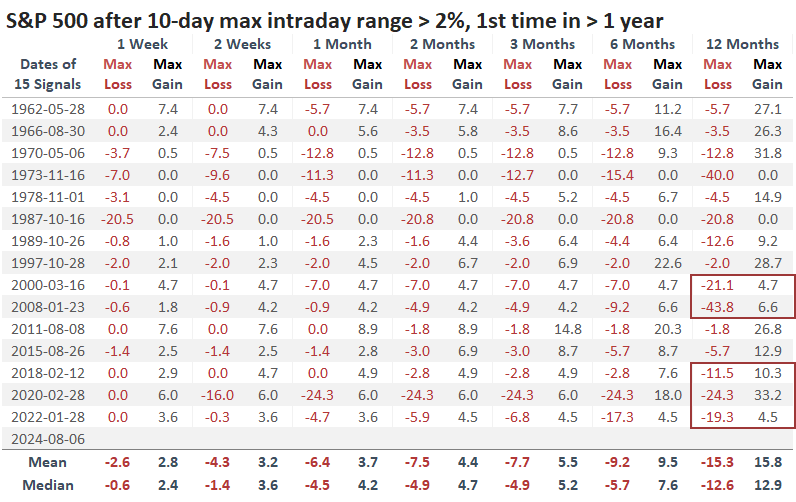
Looking at the table of maximum gains and losses across time frames, we can see that the past 25 years have been especially troublesome. The spike in intraday volatility served as a good entry point for long-term investors in 2011 and 2015, but other than that, not so much. The other signals witnessed more risk than reward up to a year later.
A case for defensive stocks
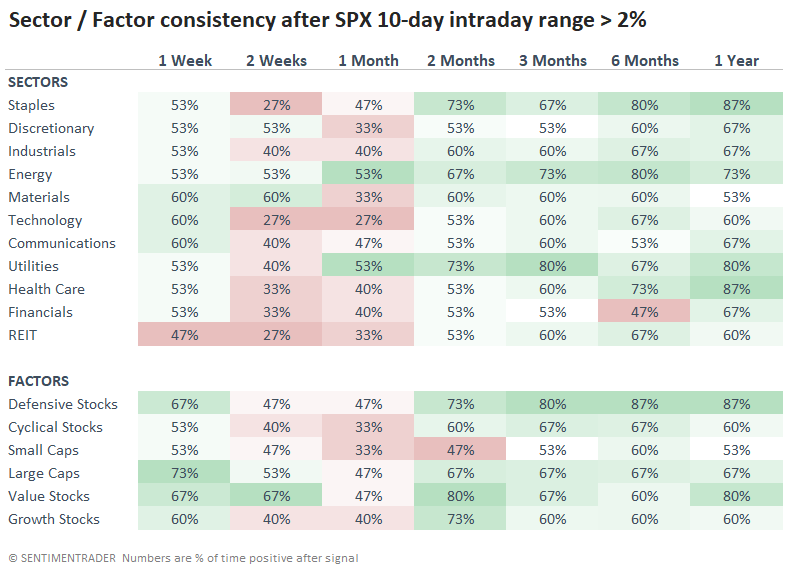
A return of volatility in the S&P 500 often prompted investors to shift their allocations to more defensive sectors. Energy stocks were the biggest beneficiary (not that that's considered a defensive sector), along with staples, utilities, and health care.
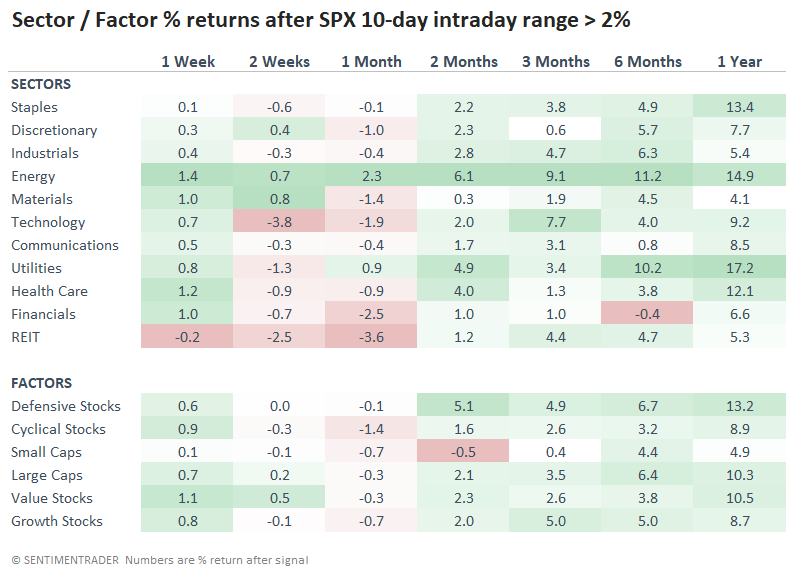
We can see this play out even more when looking at the win rates. Over the next year, the defensive factor gained 87% of the time, compared to only 60% for cyclical stocks. Small caps rallied only 53% of the time, while value stocks were winners 80% of the time.
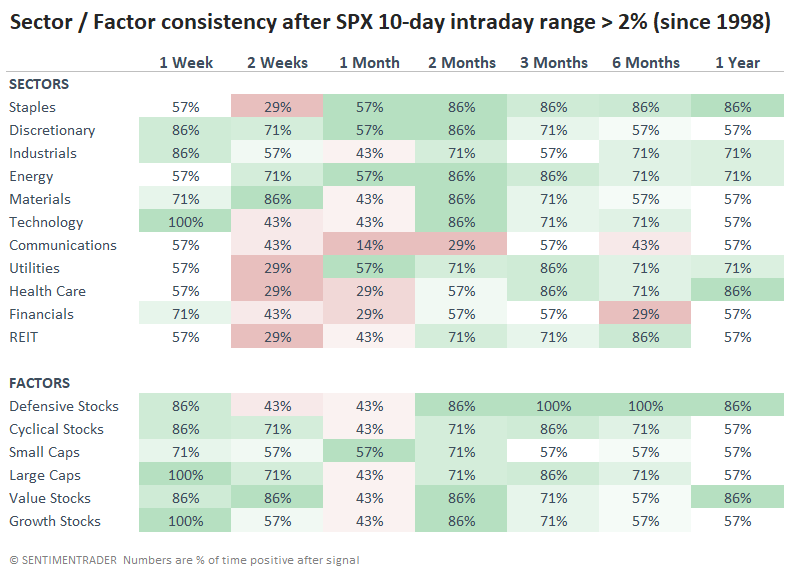
Over the past 25 years, defensive stocks have stood out even more. Three to twelve months later, that factor rallied every time, which is remarkable given some significant losses in other sectors and factors. Each of the defensive sectors-staples, utilities, and health care-showed good consistency over the medium-to long-term.
What the research tells us...
When investors are reminded of volatility, it stops becoming theoretical. All of a sudden, earning 5% in short-term Treasuries looks pretty darn good because the certainty of being able to pay off the mortgage or a boat or the kids' college with equity gains looks much more shaky.
These reminders have often occurred near troughs in panic. Many times over the past 70 years, a big spike in intraday ranges has indicated a temporary shakeout of weak holders, and after a few weeks of back-and-forth action, the uptrend resumes. The biggest trouble with that is that recent history has been less supportive of that argument. It did occur twice, in 2011 and 2015, so there's that. But twice as often, this was only the start of a much more difficult stretch. We should watch how investors react to this recent conniption fit; if we see lower lows in the S&P 500, we should be on guard, with a shift toward defensive stocks a real possibility.
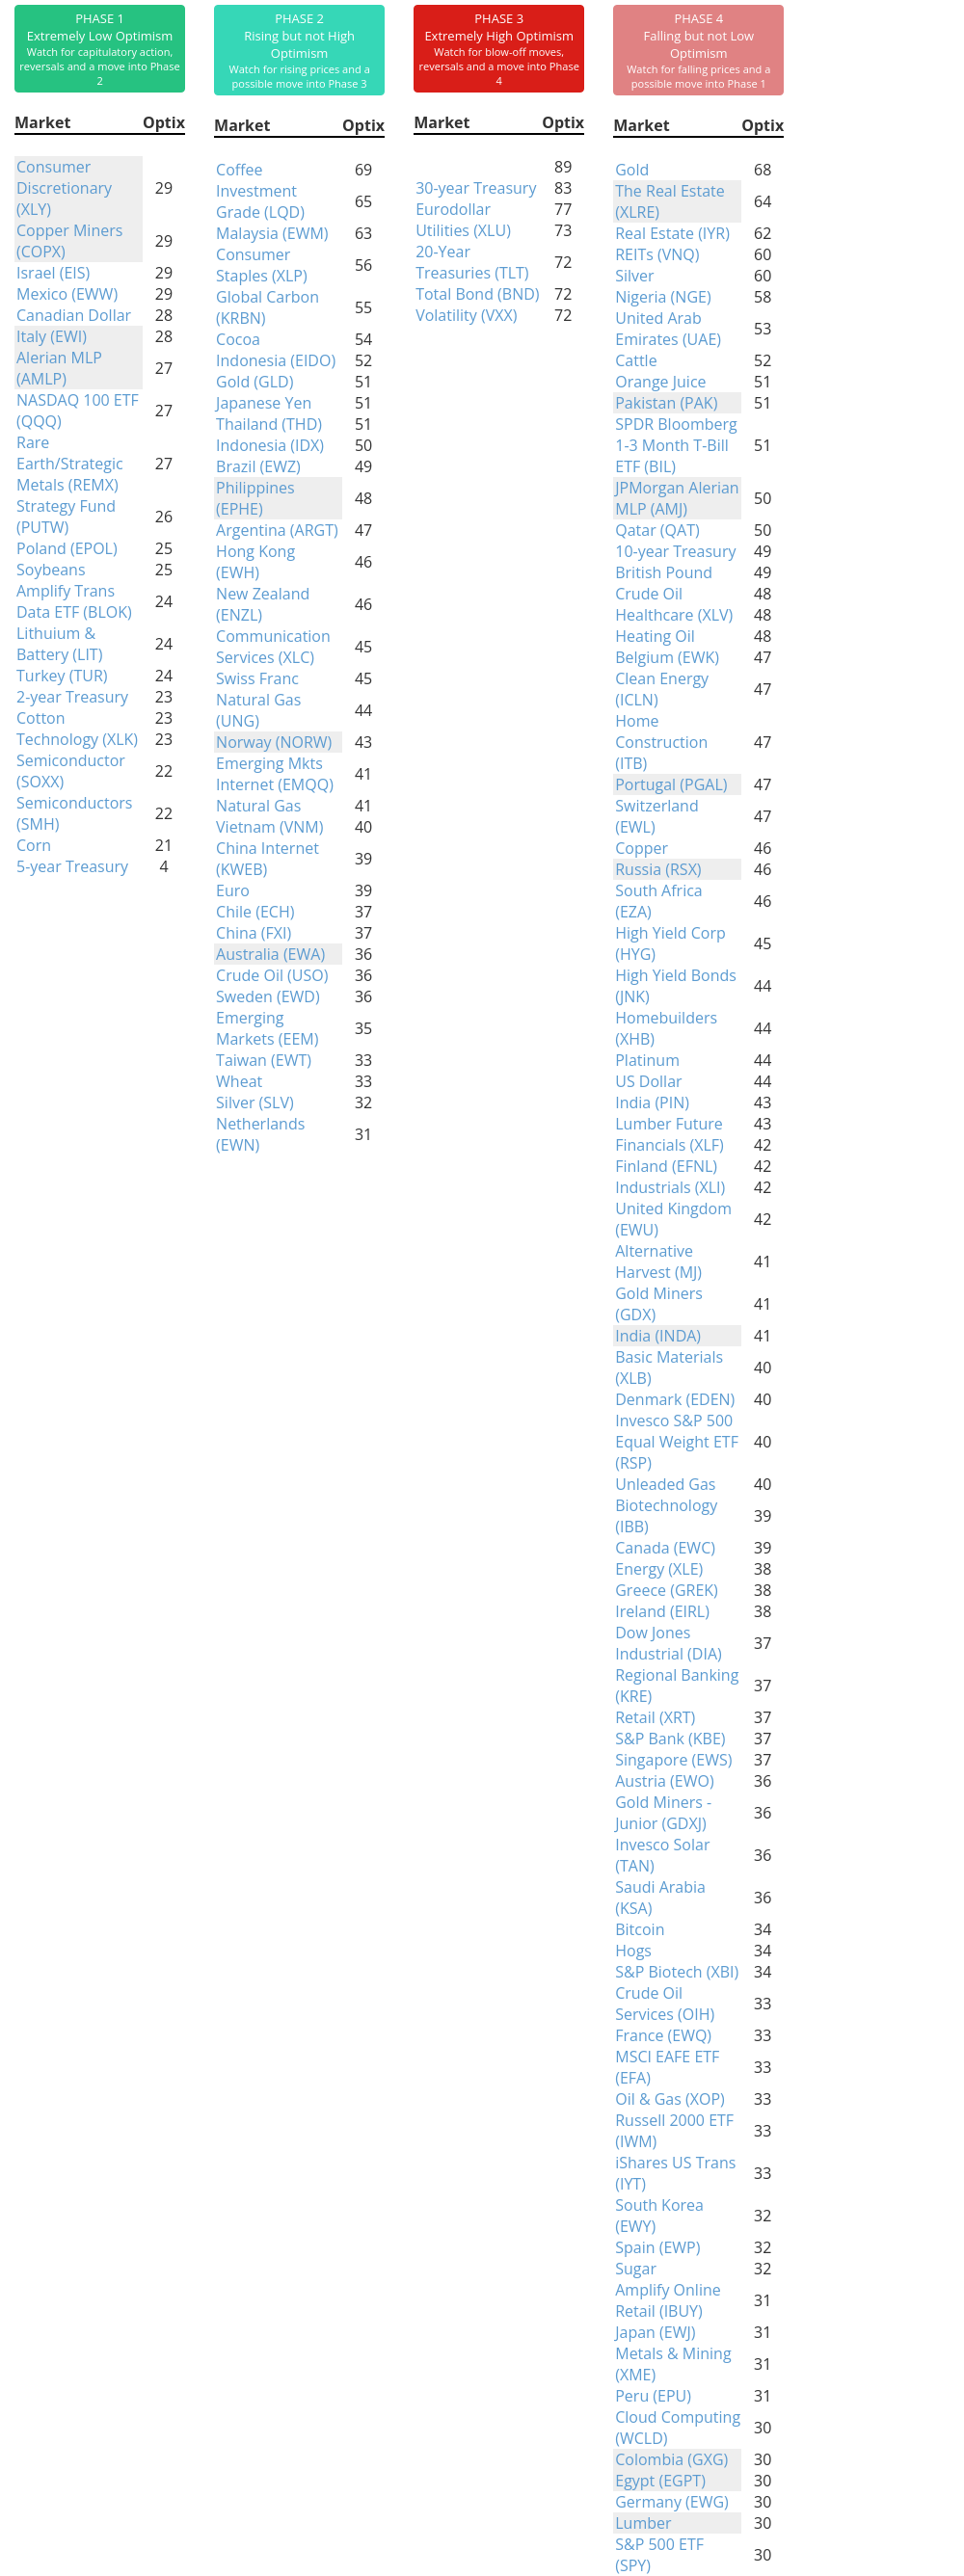
Indicators at Extremes
Phase Table
Ranks
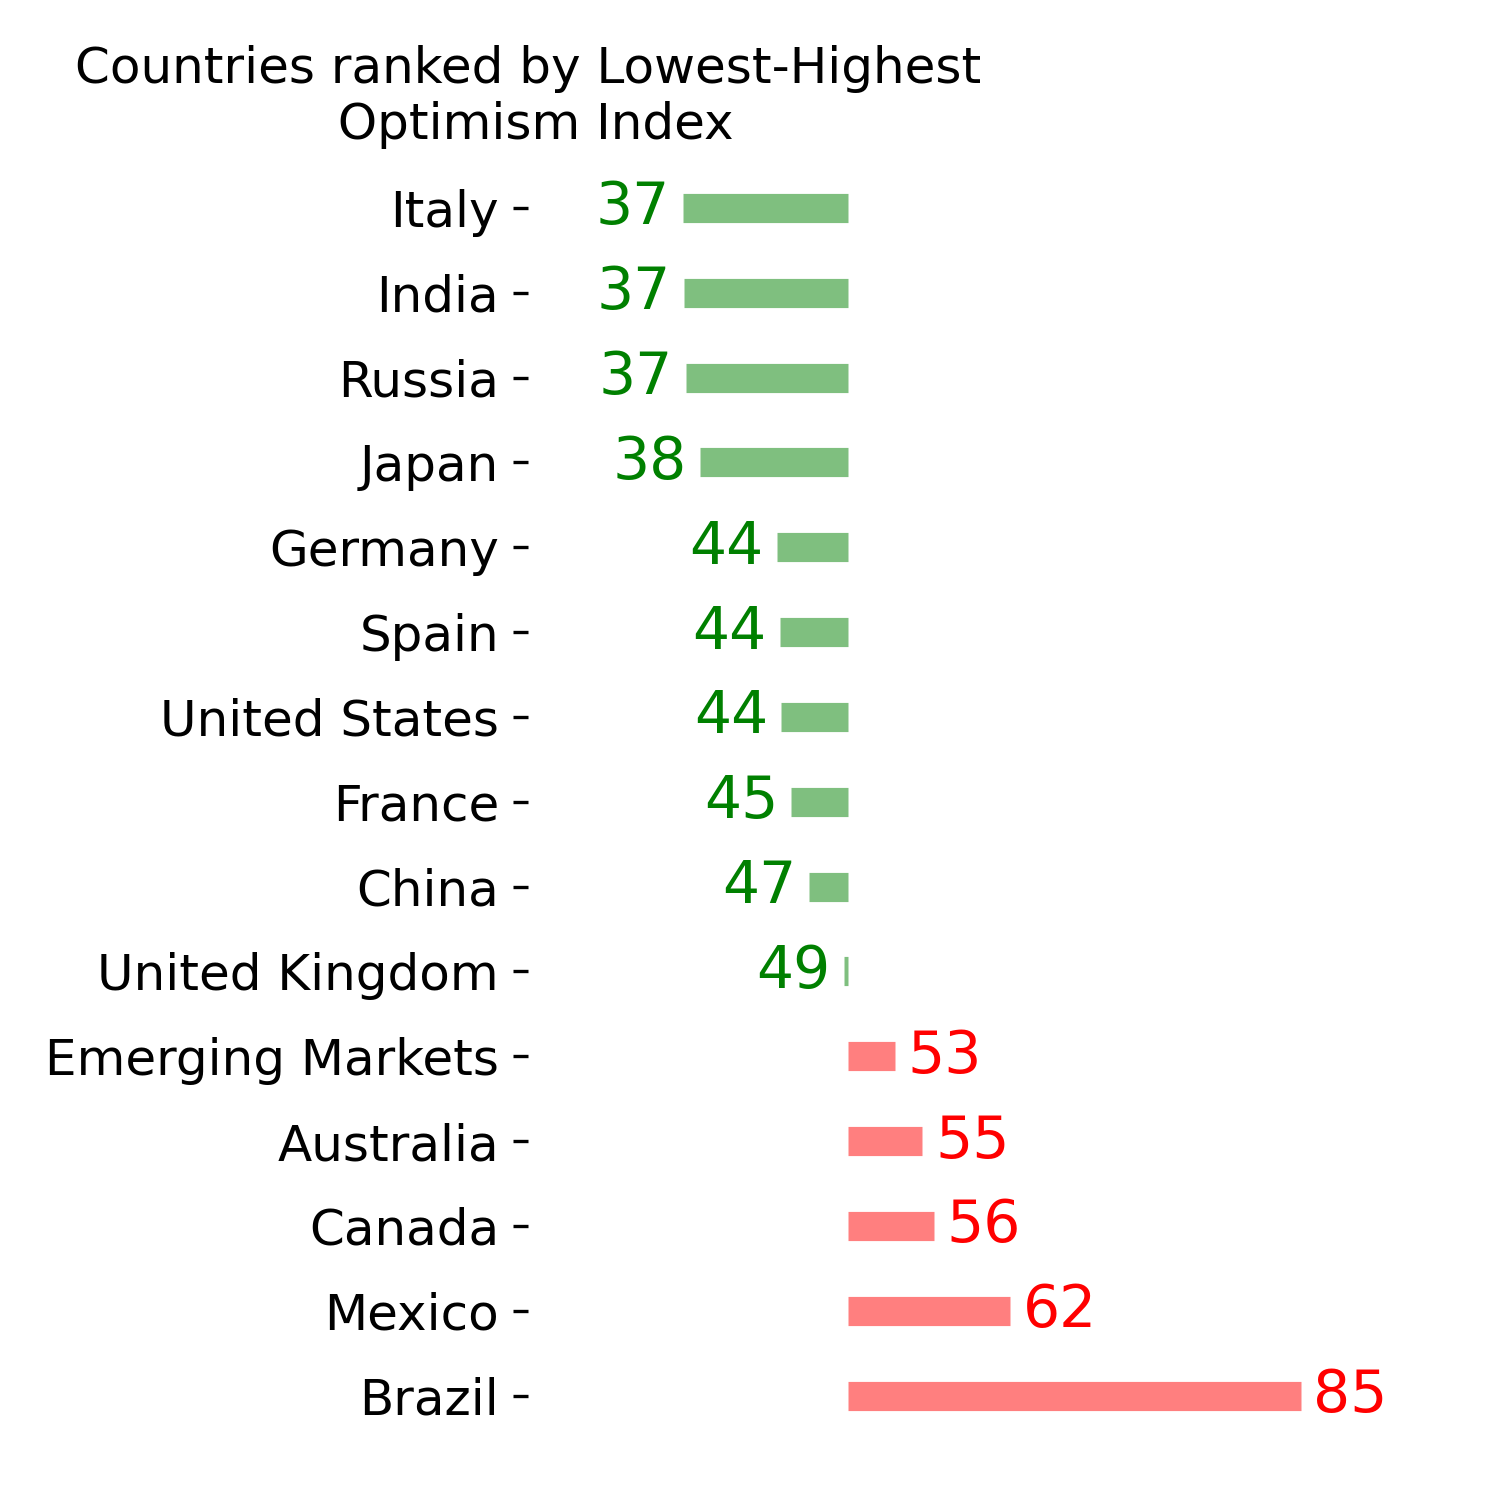
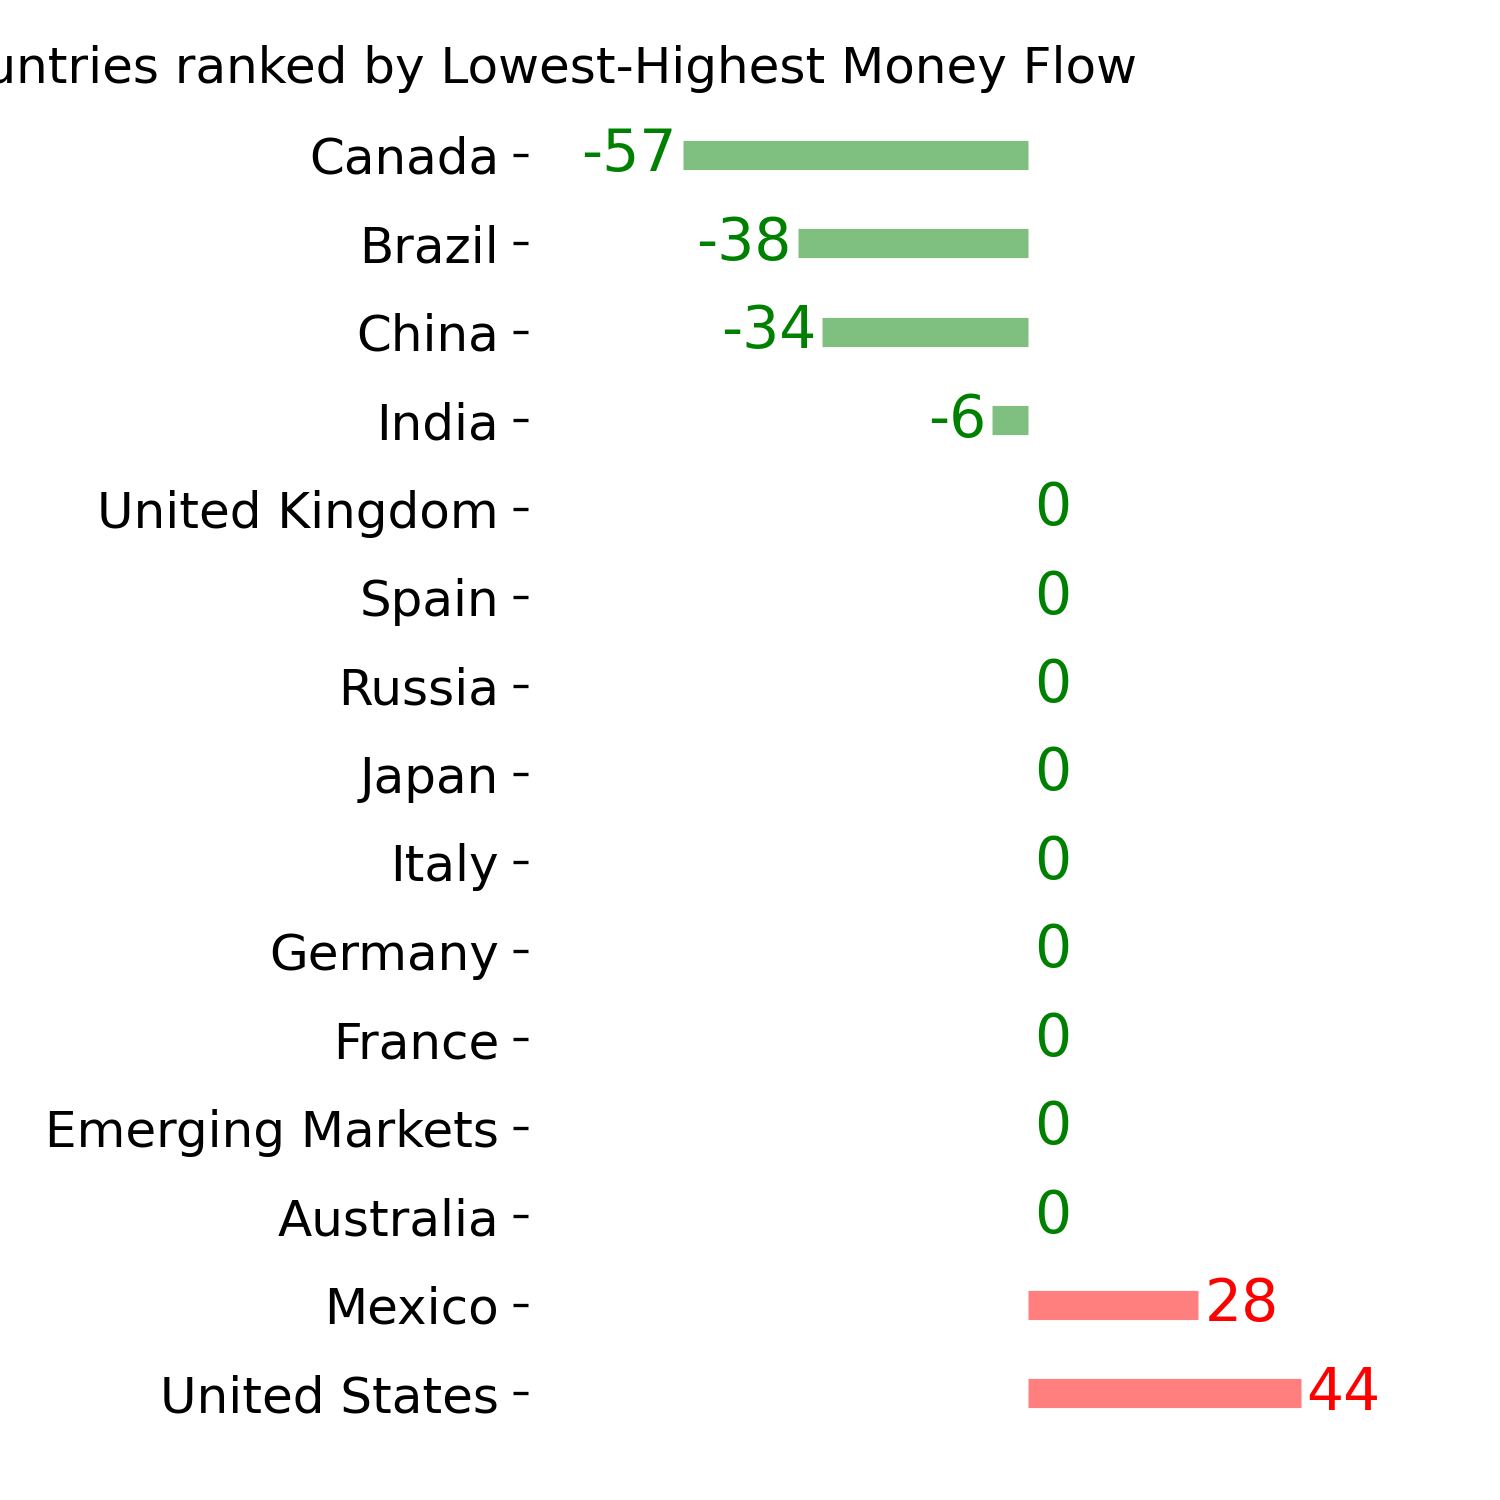
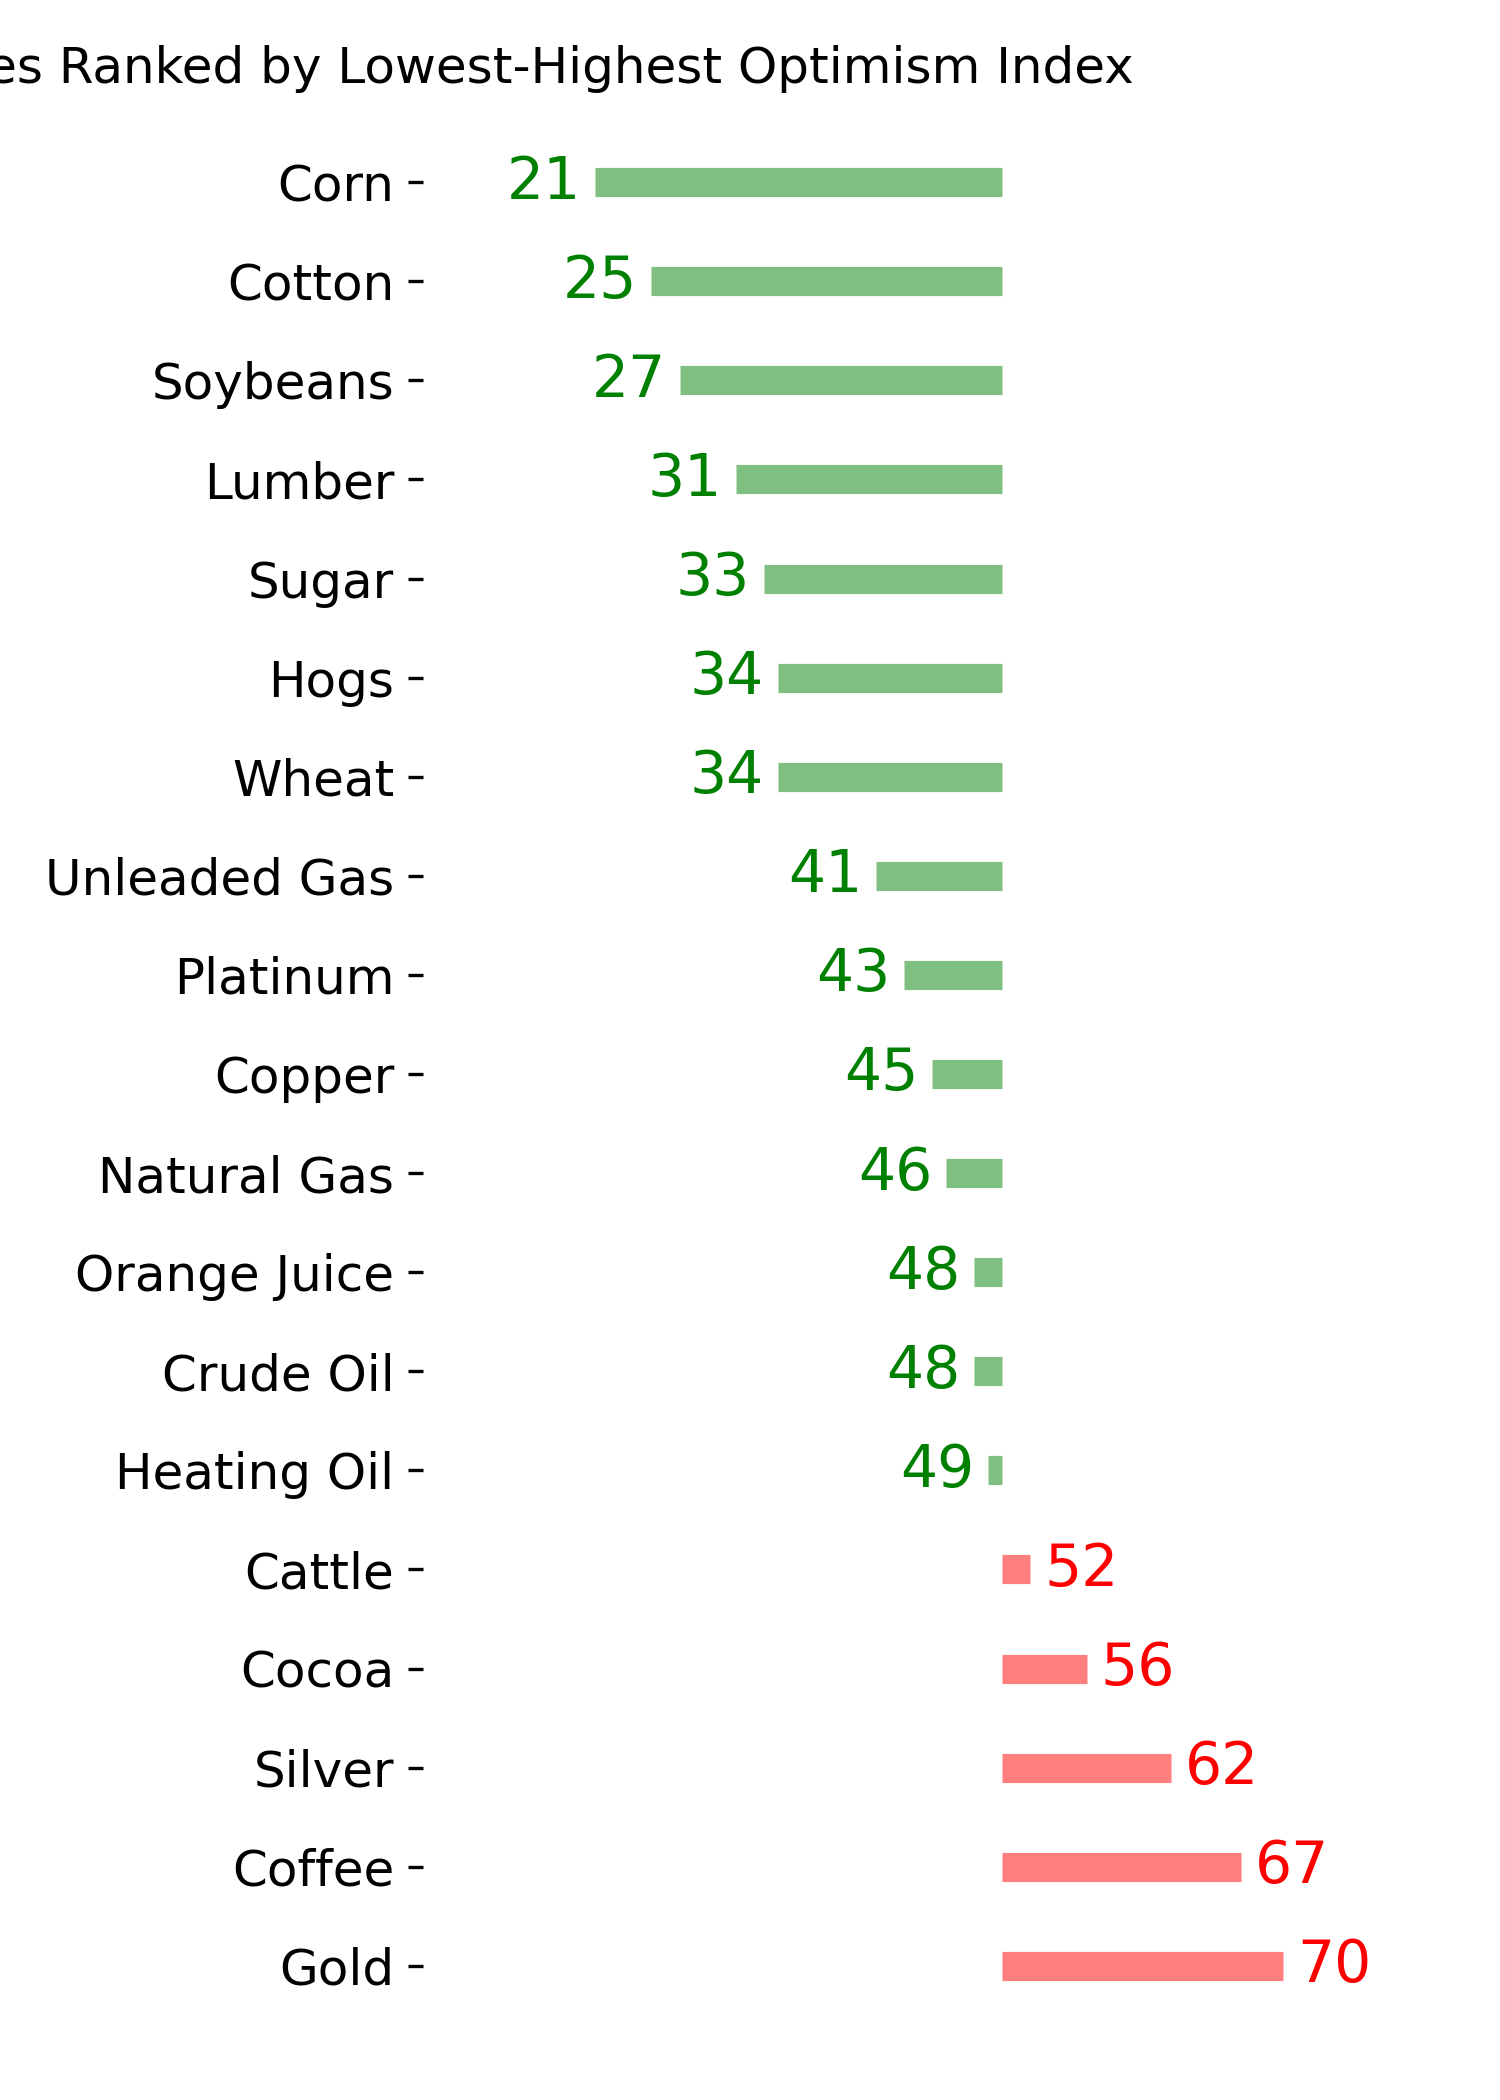
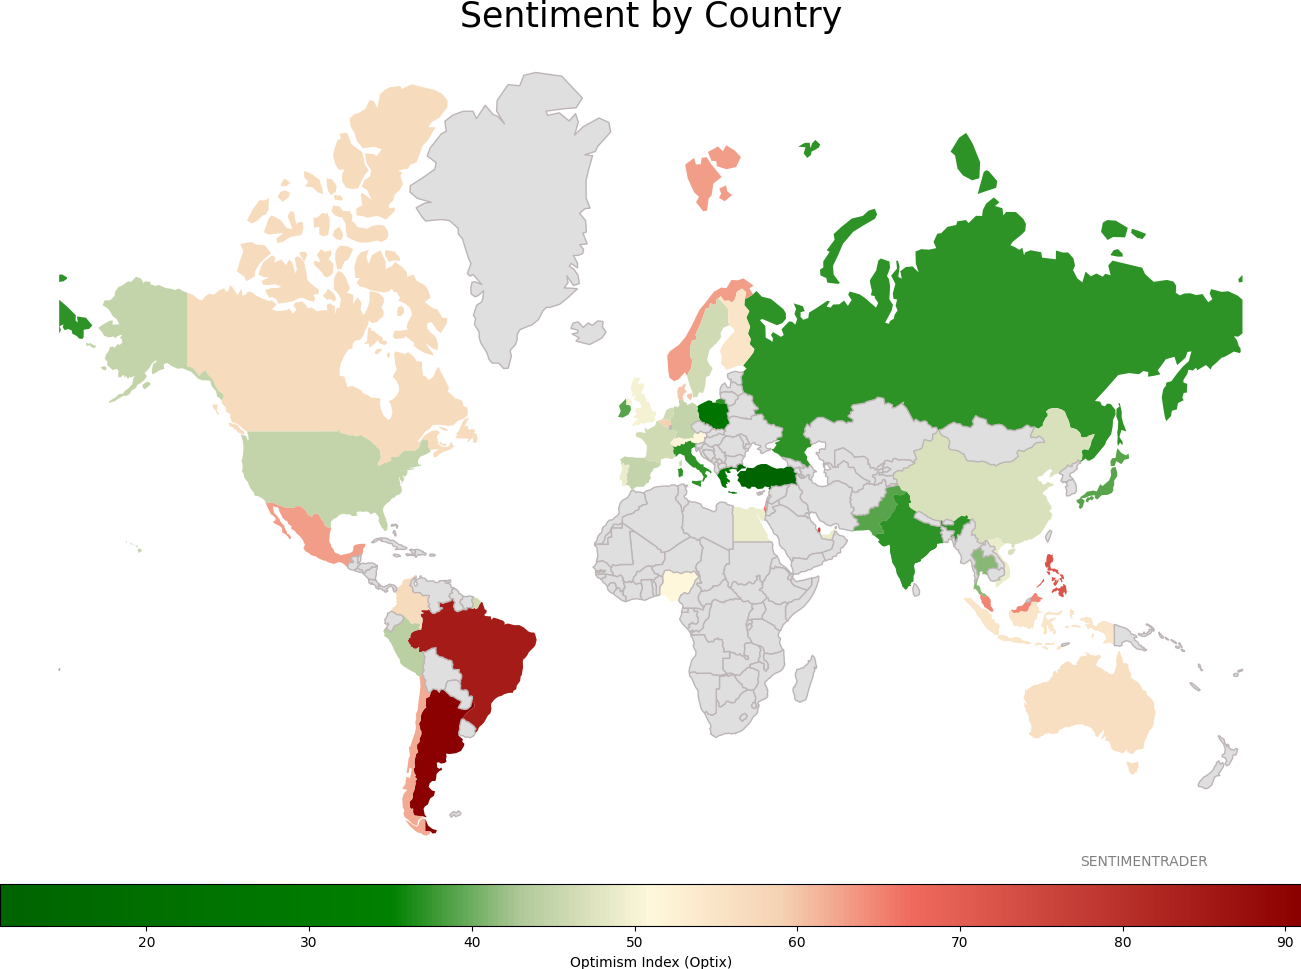
Sentiment Around The World
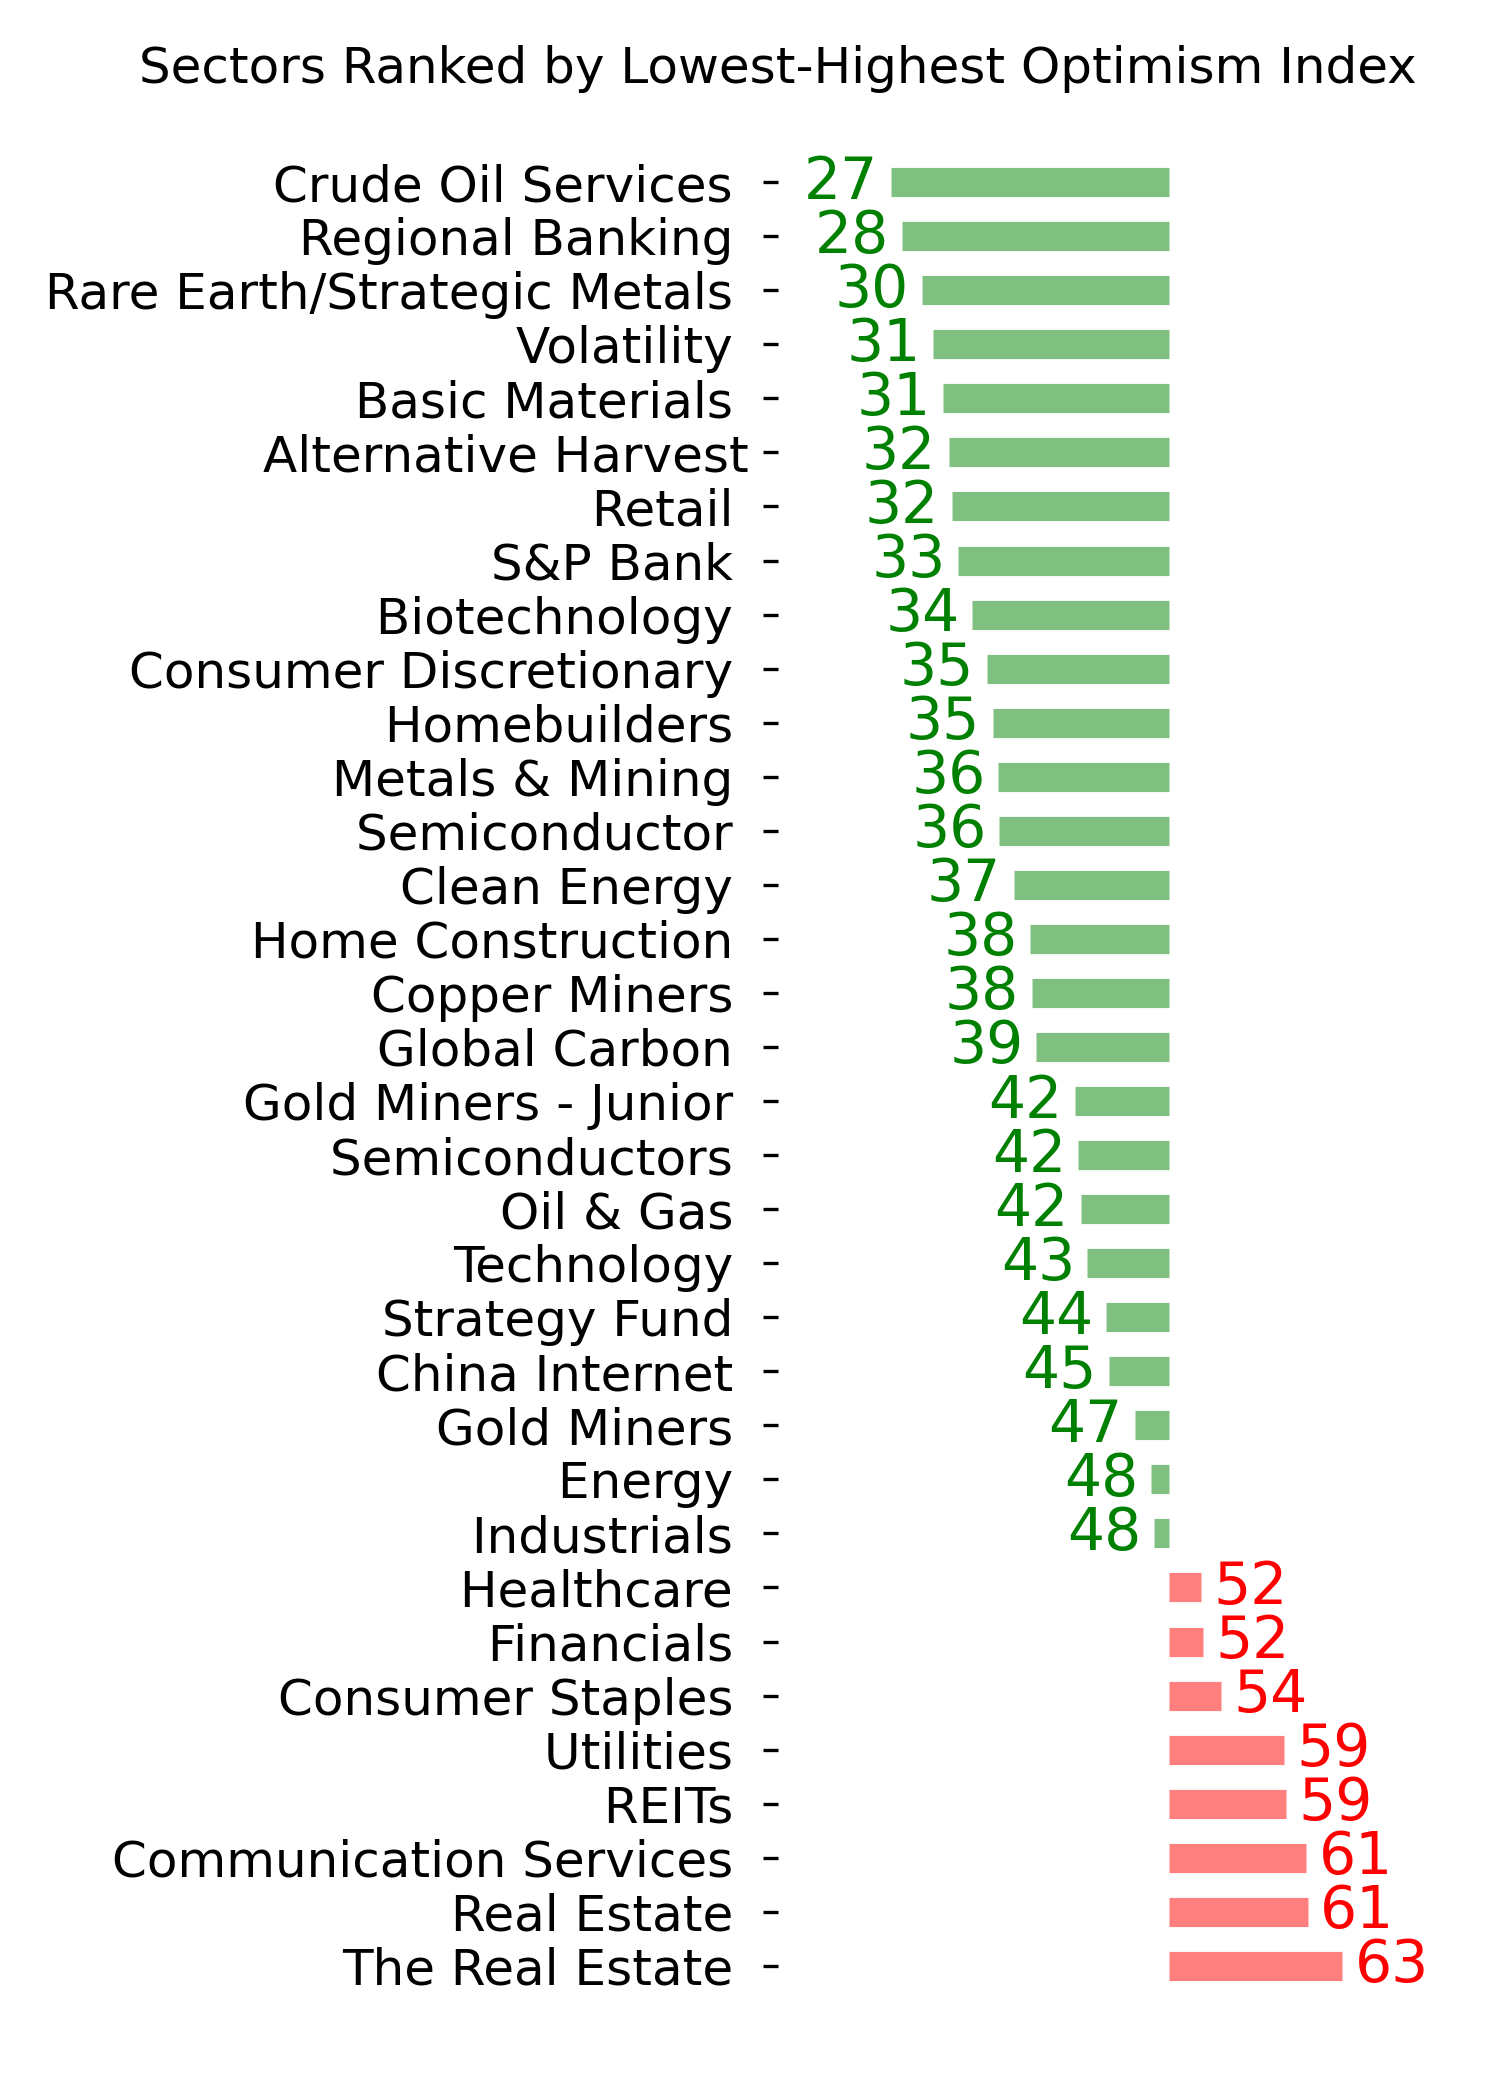
Optimism Index Thumbnails
|
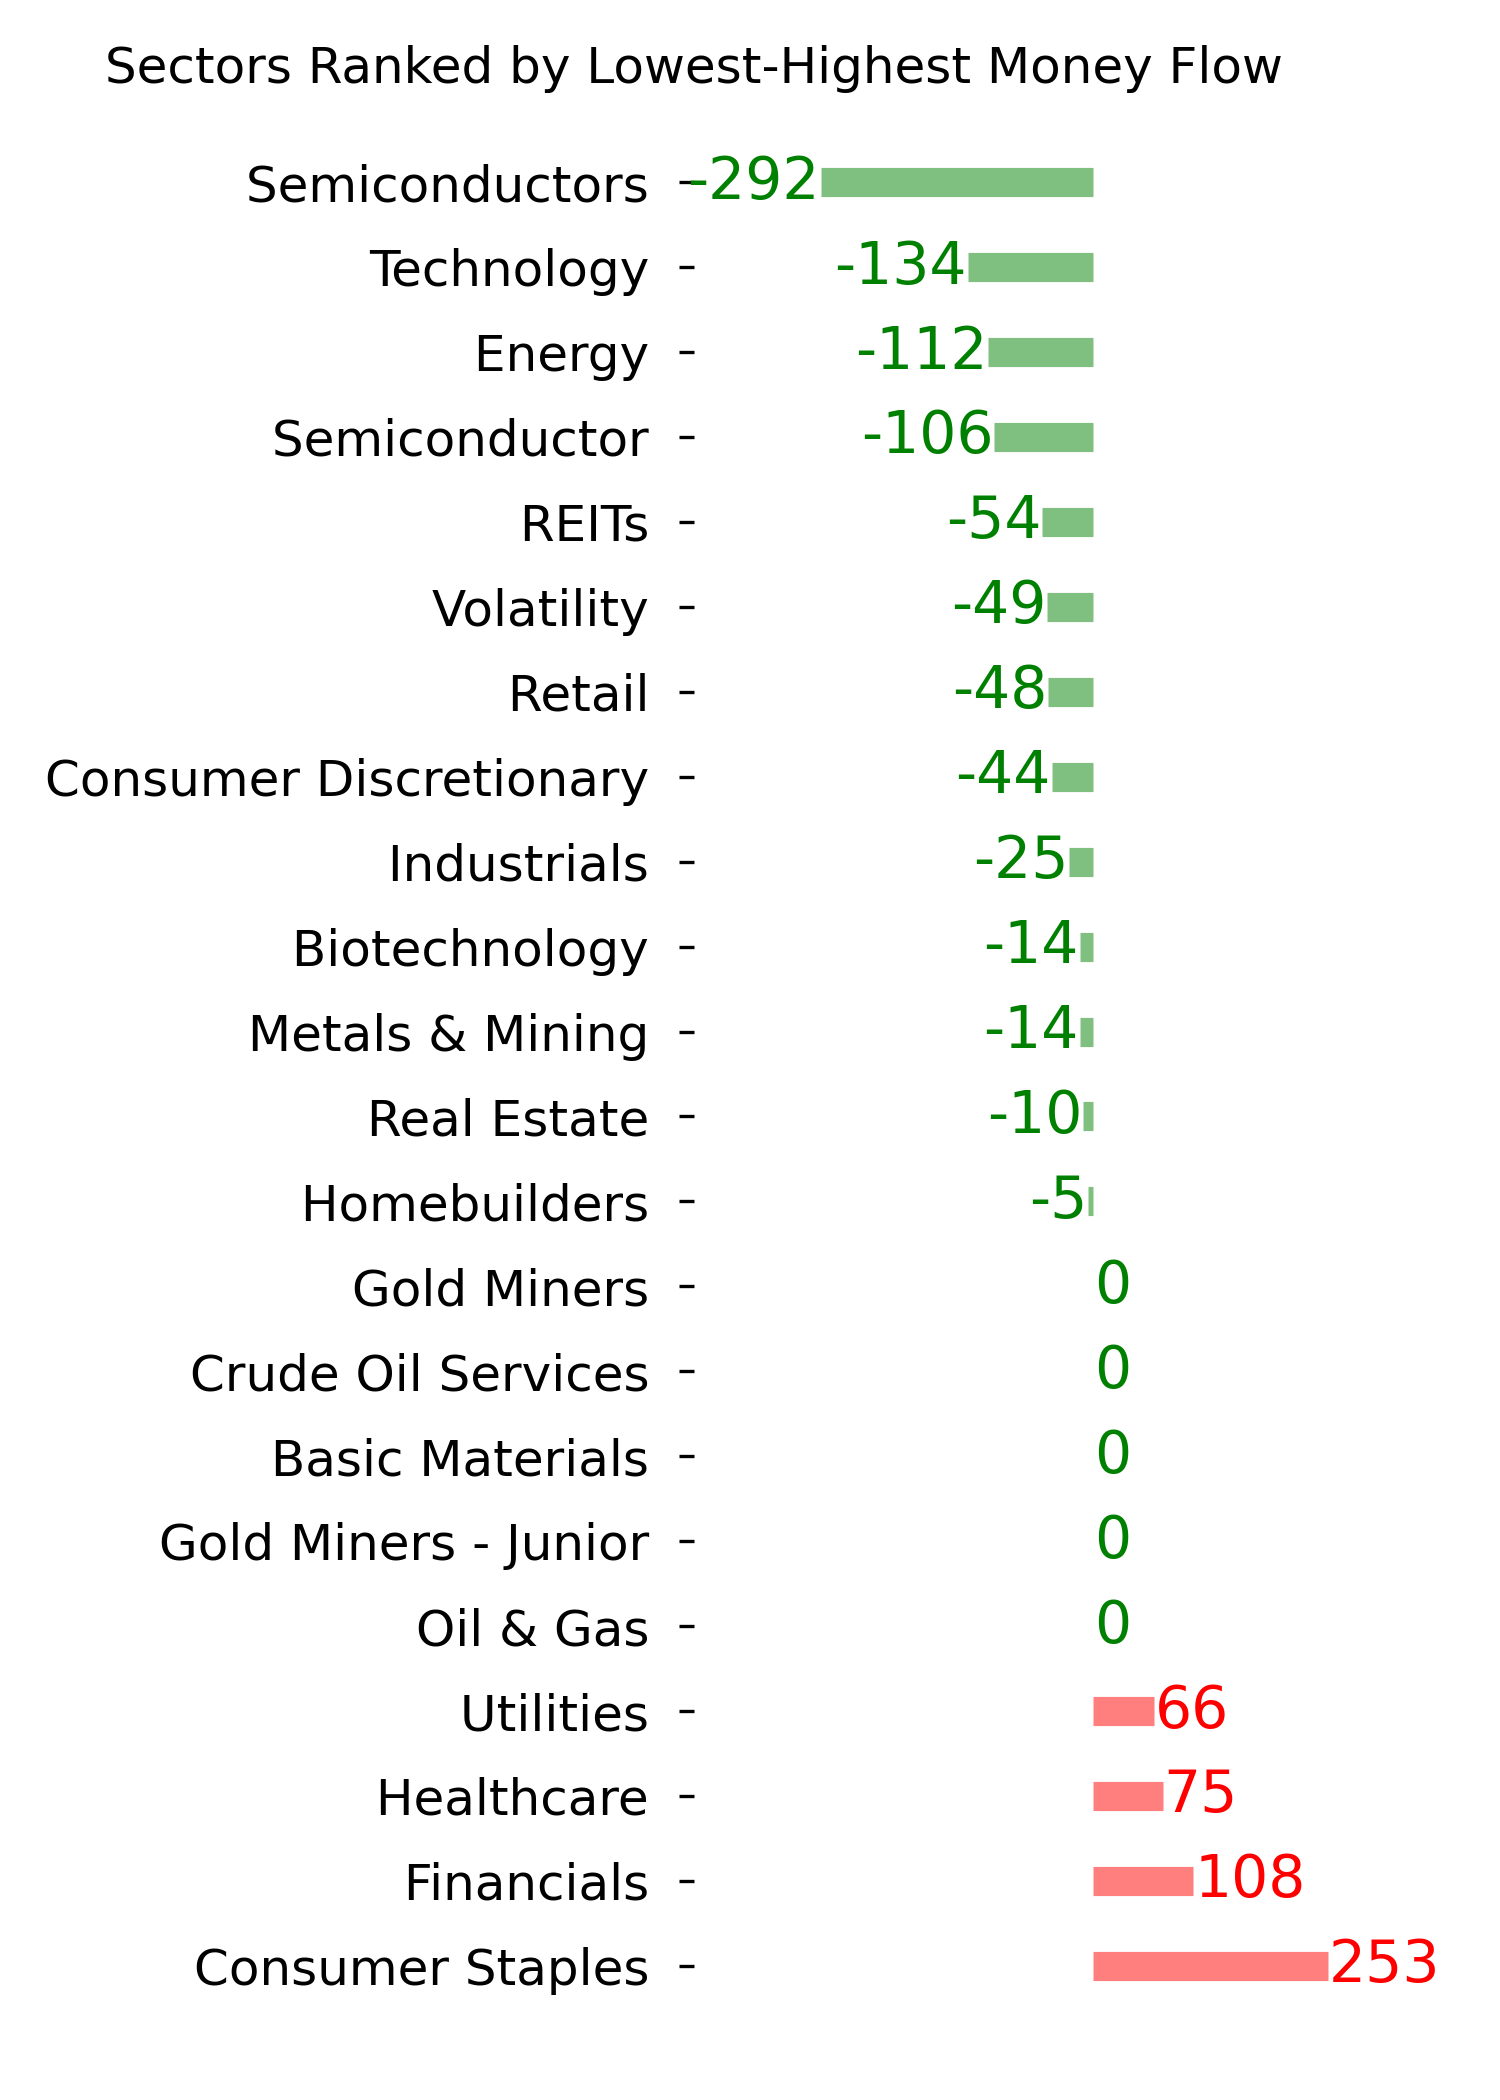
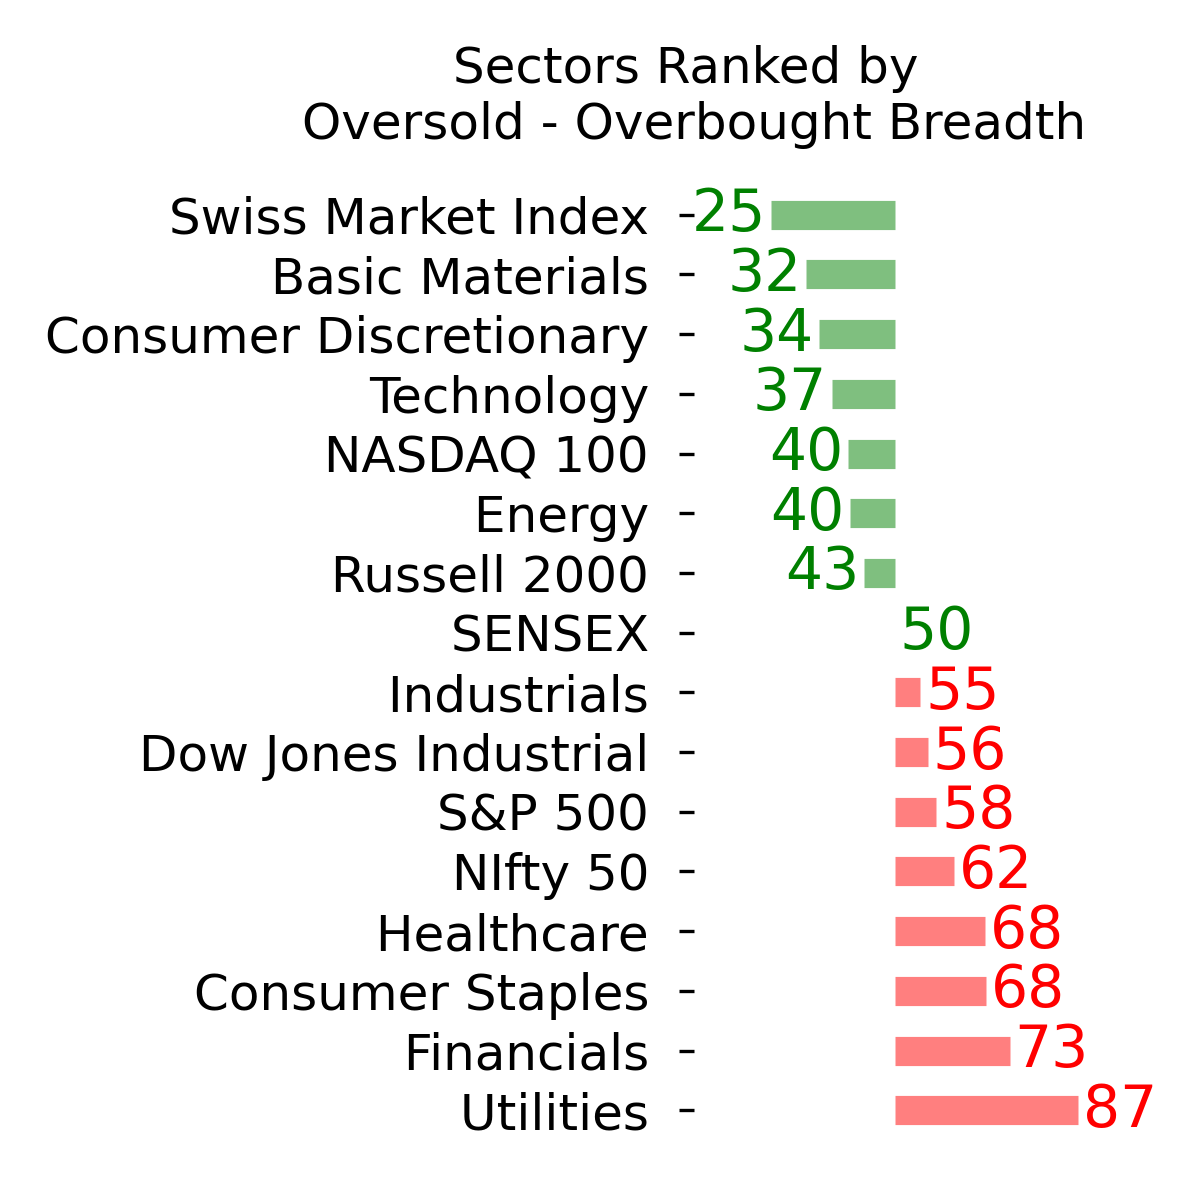
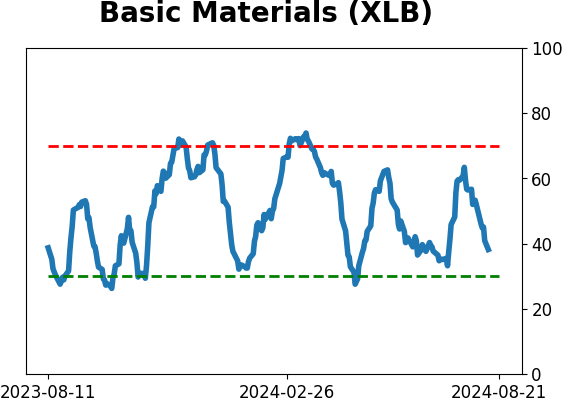
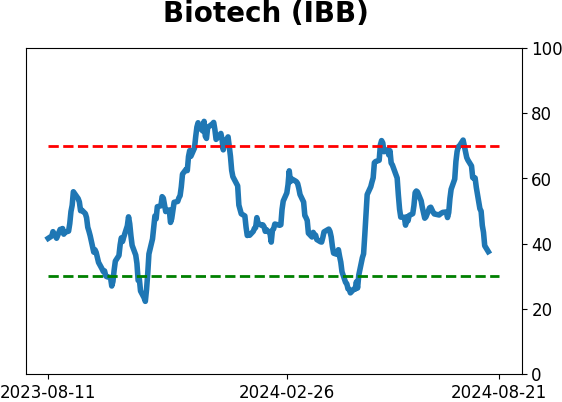
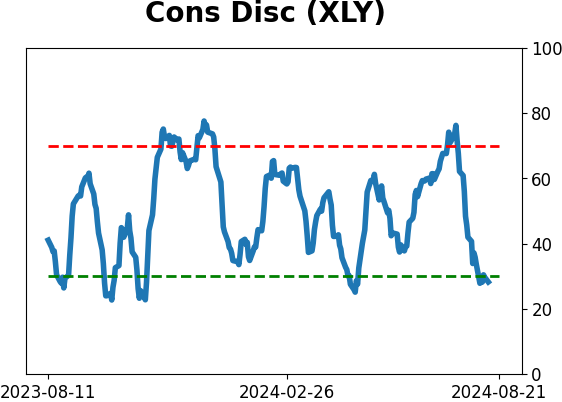
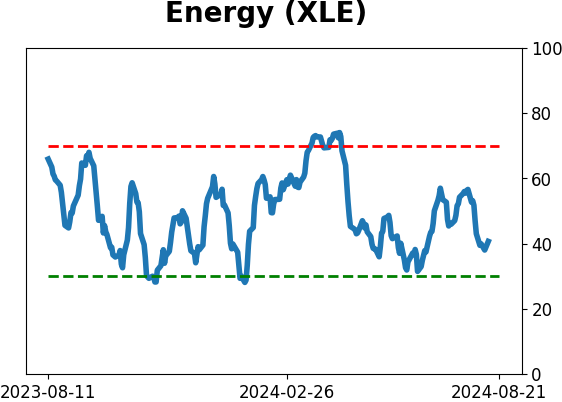
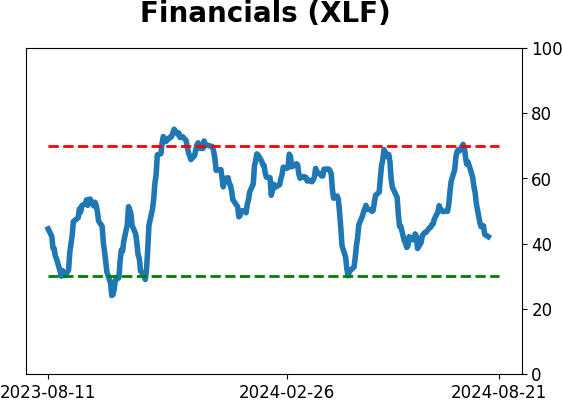
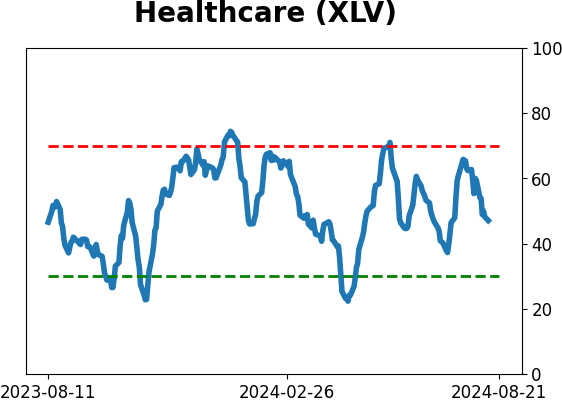
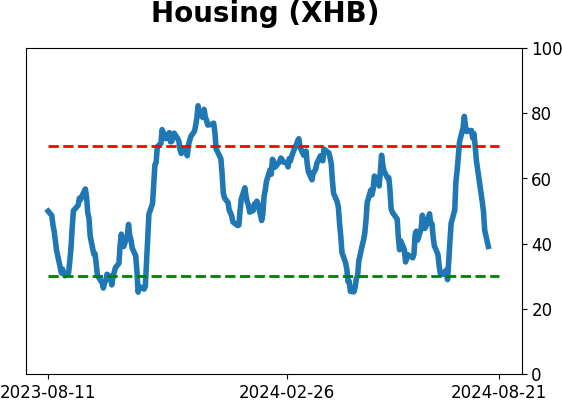
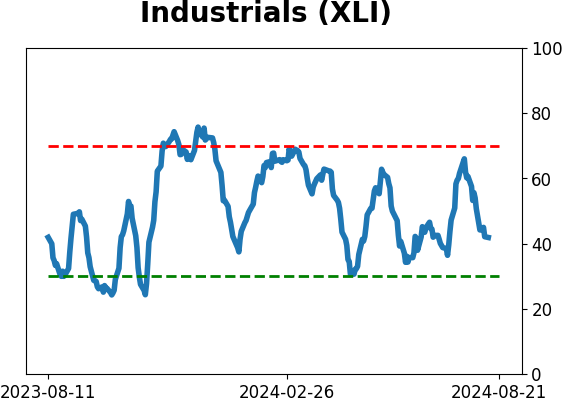
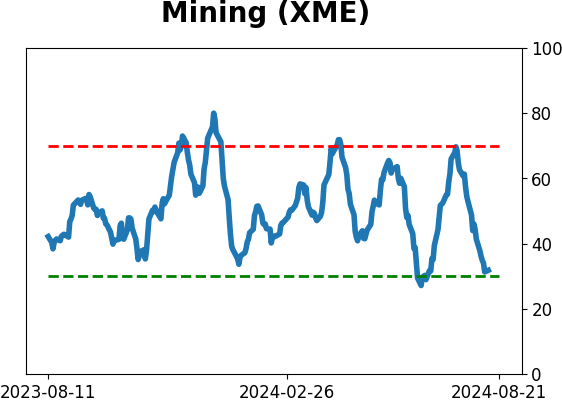
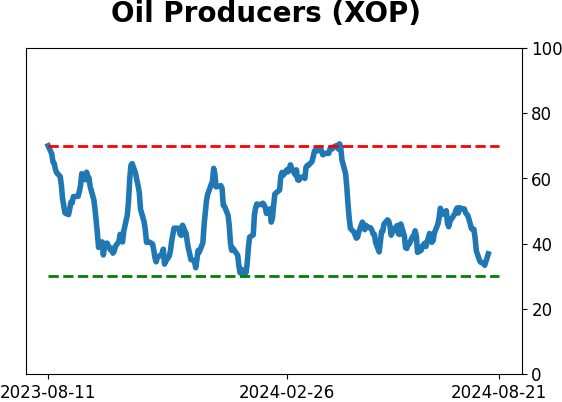
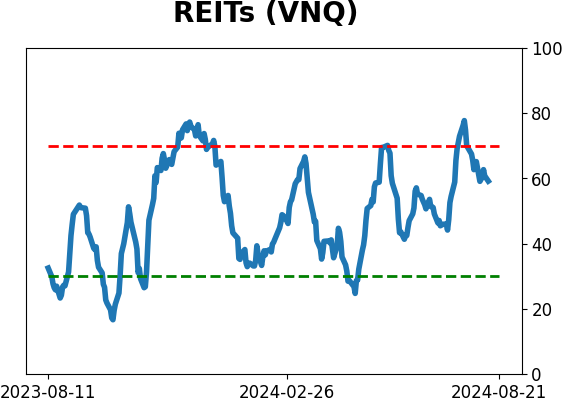
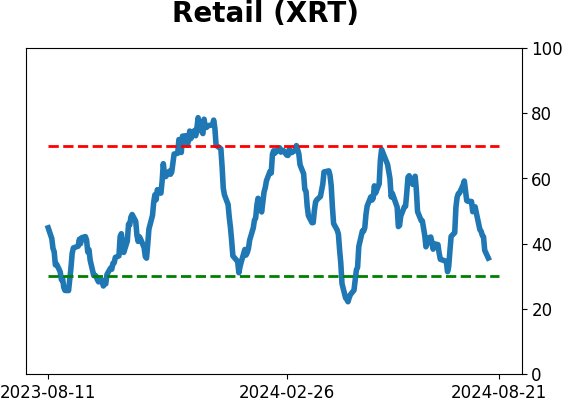
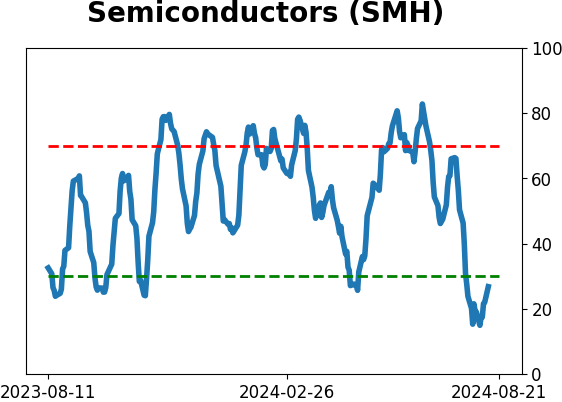
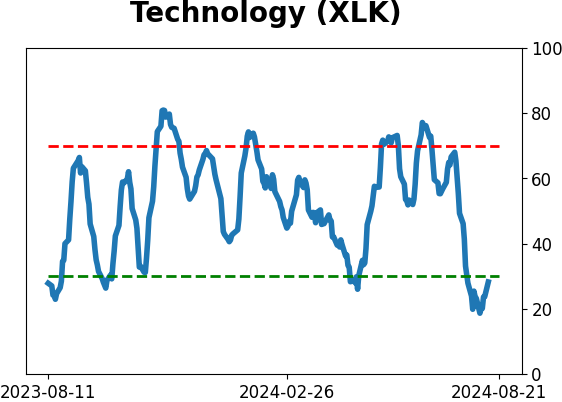
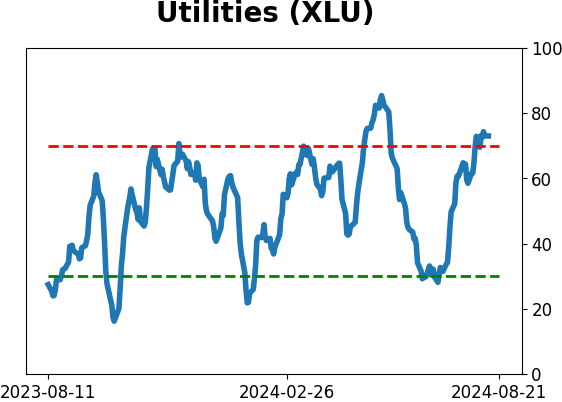
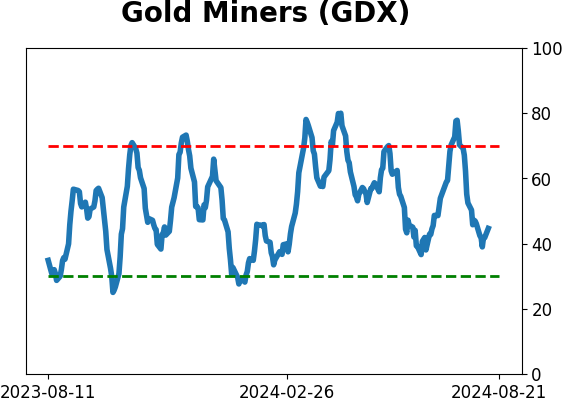
Sector ETF's - 10-Day Moving Average
|
|
|
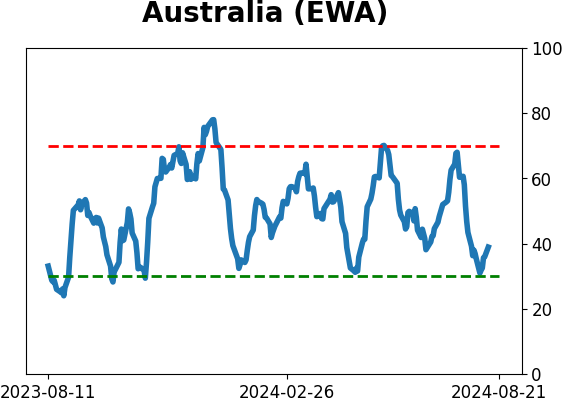
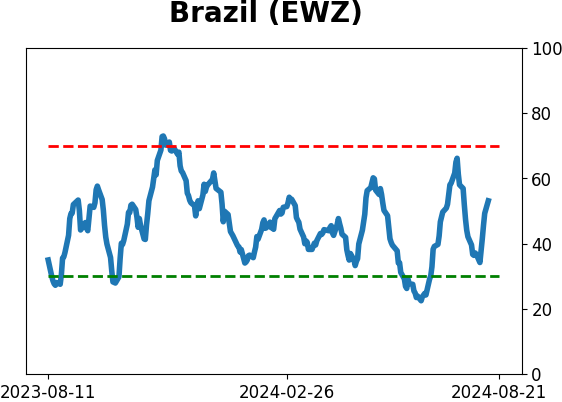
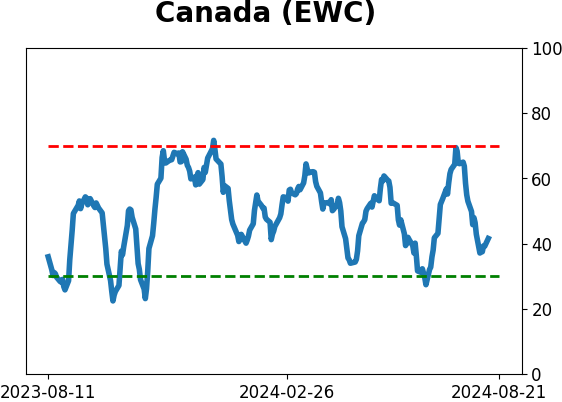
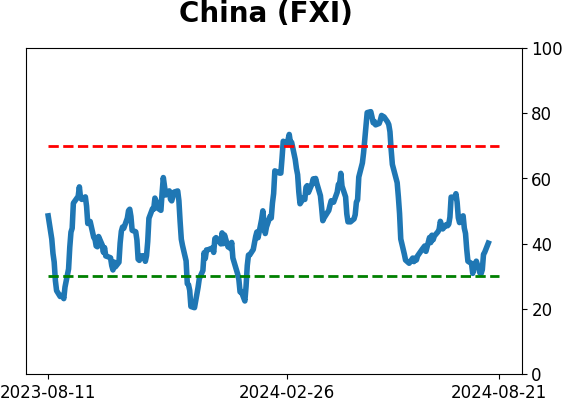
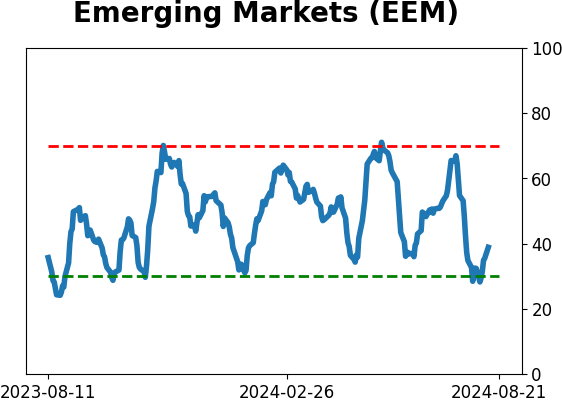
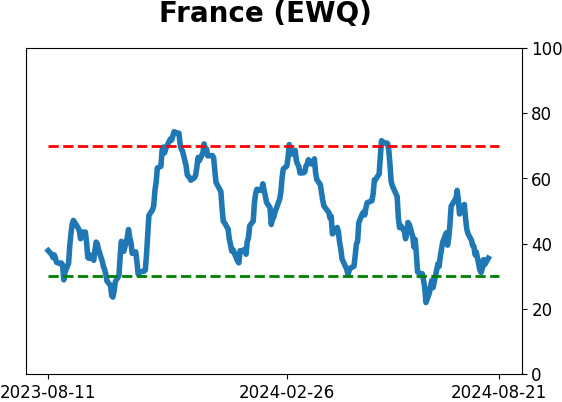
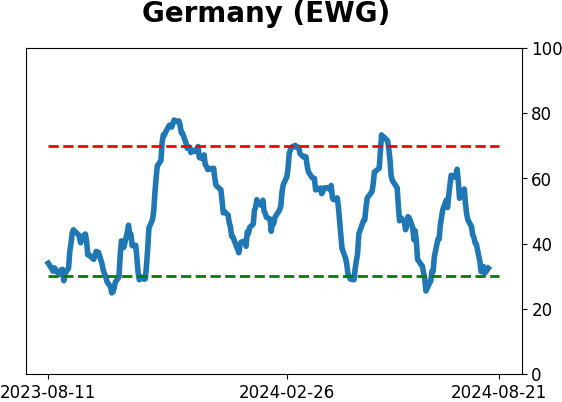
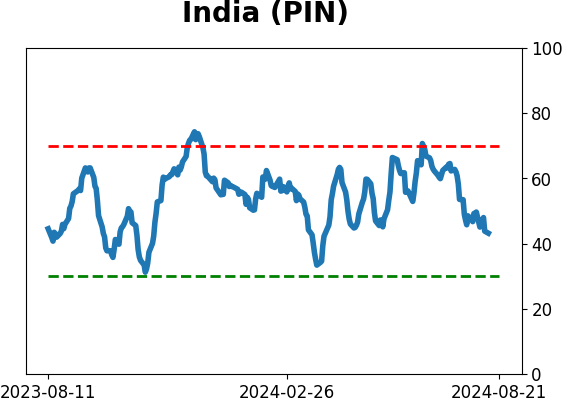
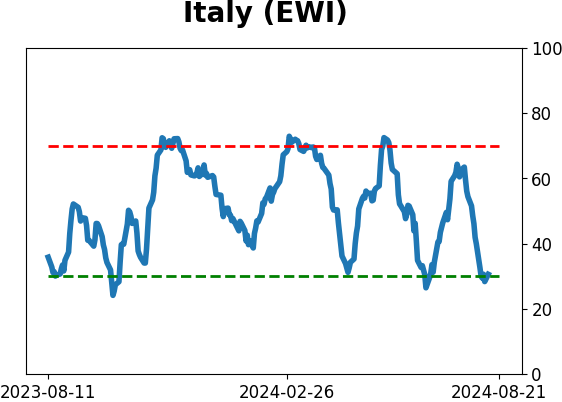
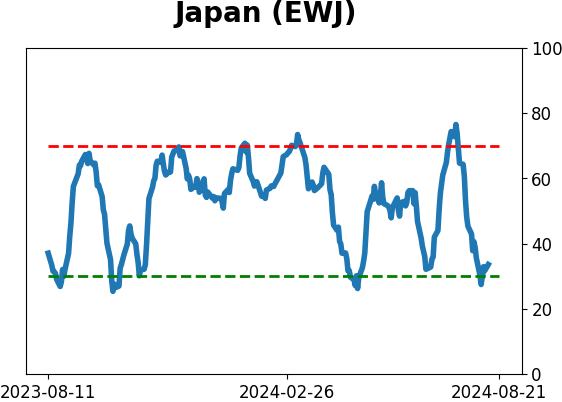
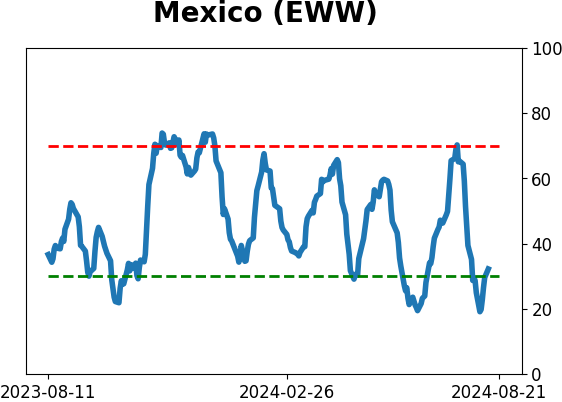
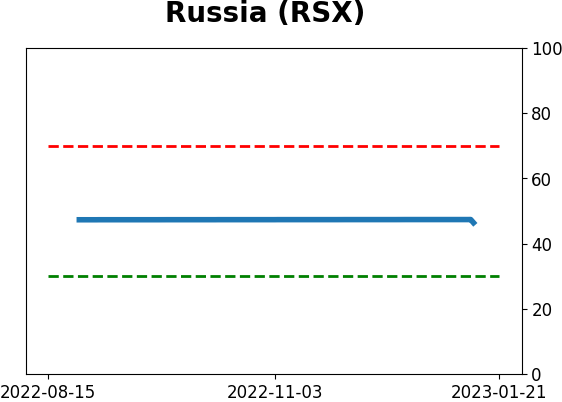
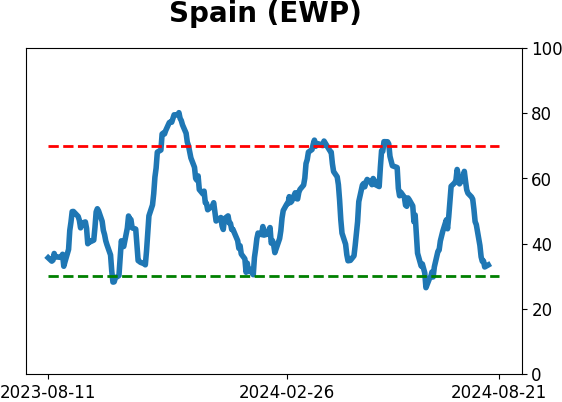
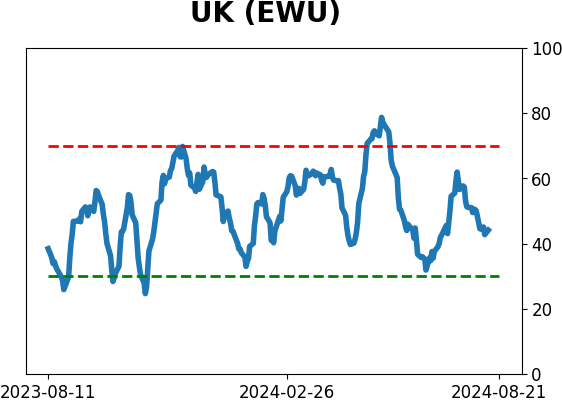
Country ETF's - 10-Day Moving Average
|
|
|
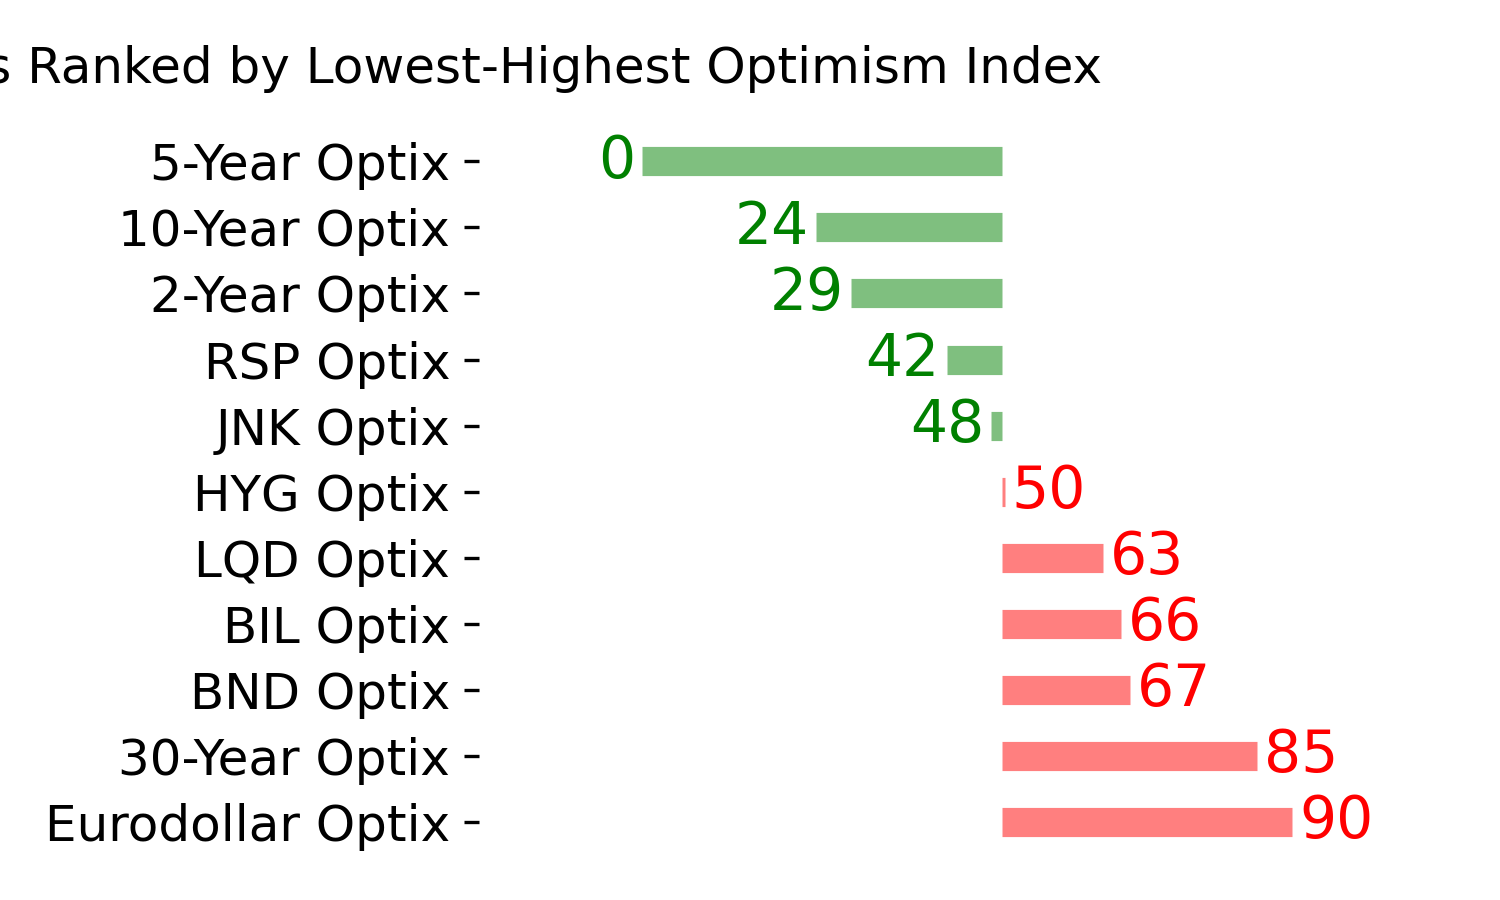
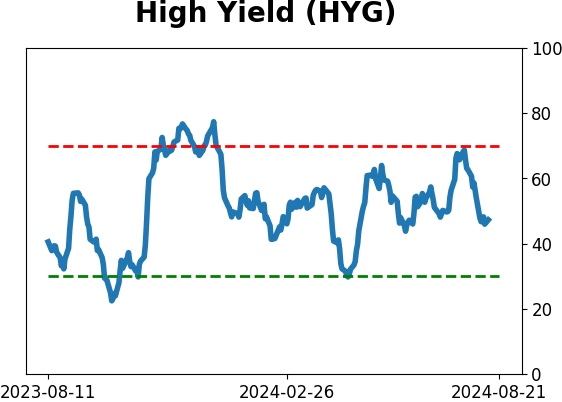
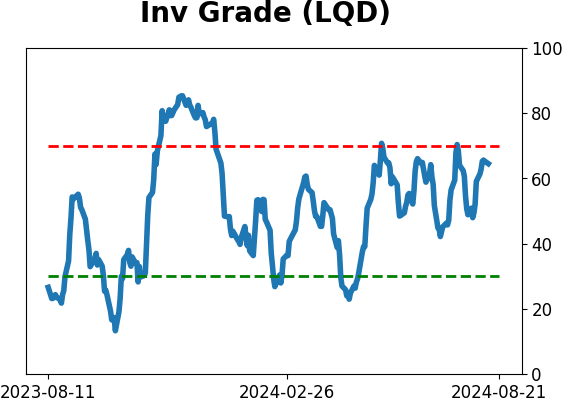
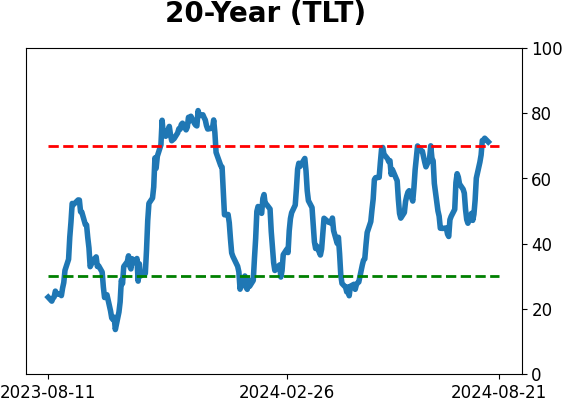
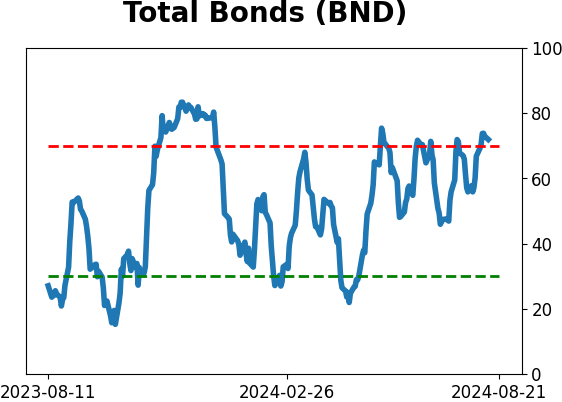
Bond ETF's - 10-Day Moving Average
|
|
|
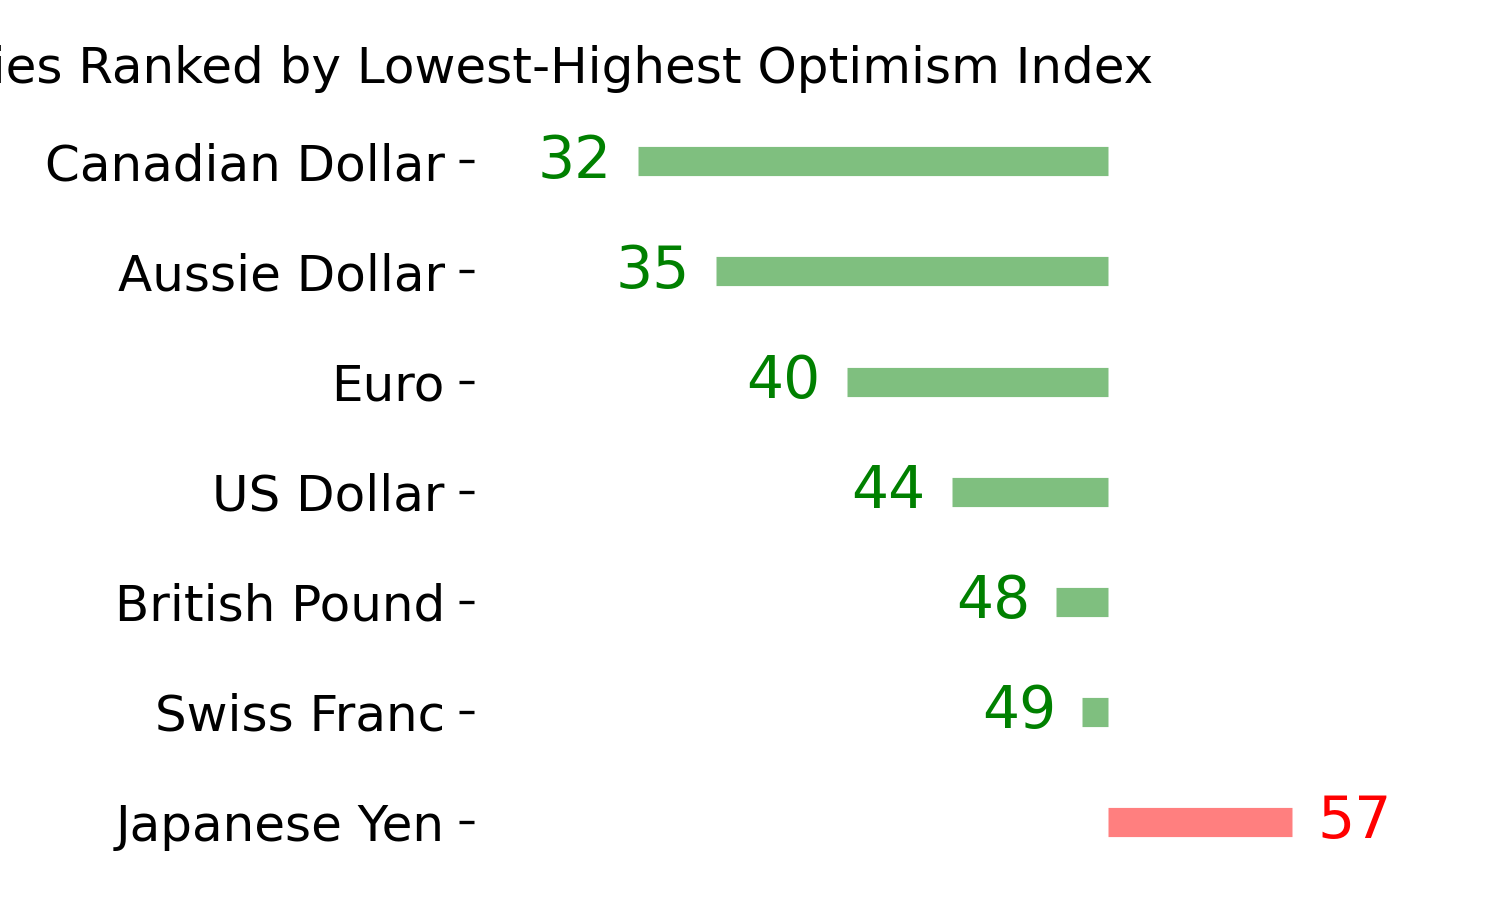
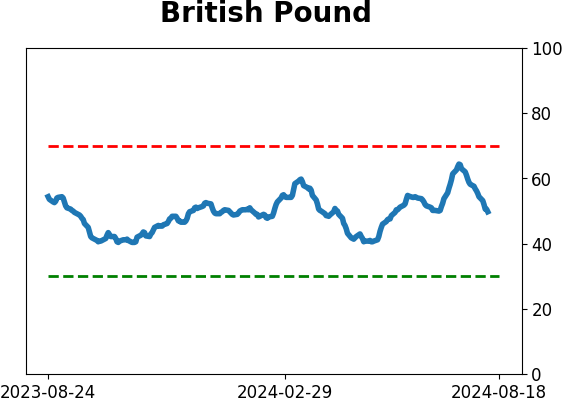
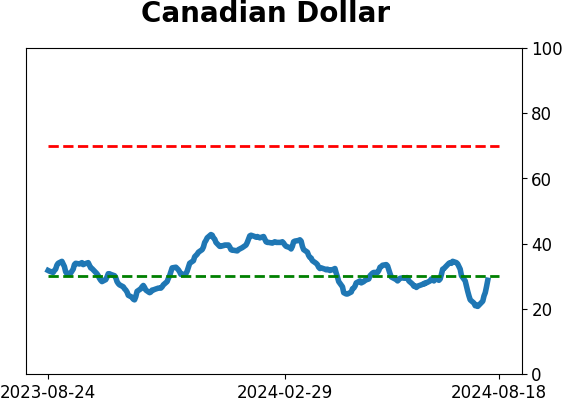
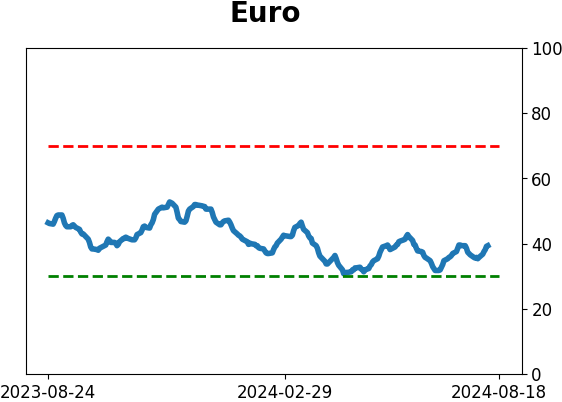
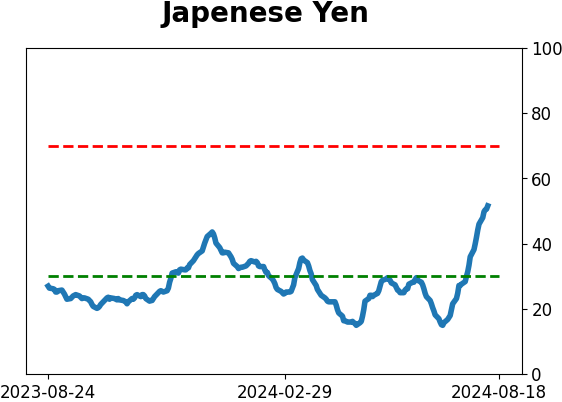
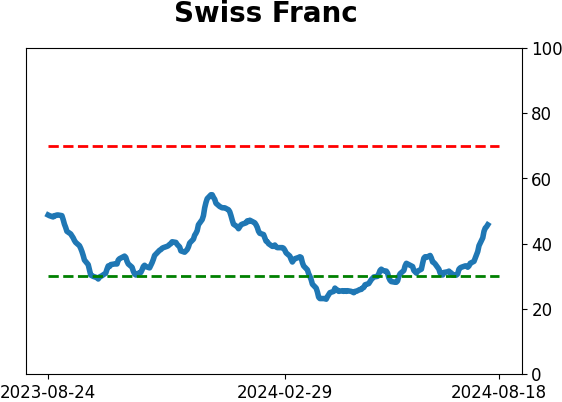
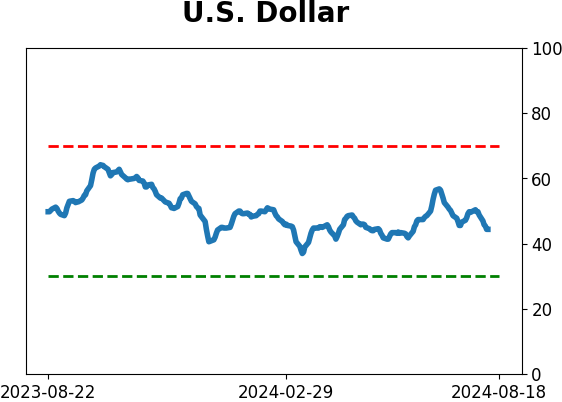
Currency ETF's - 5-Day Moving Average
|
|
|
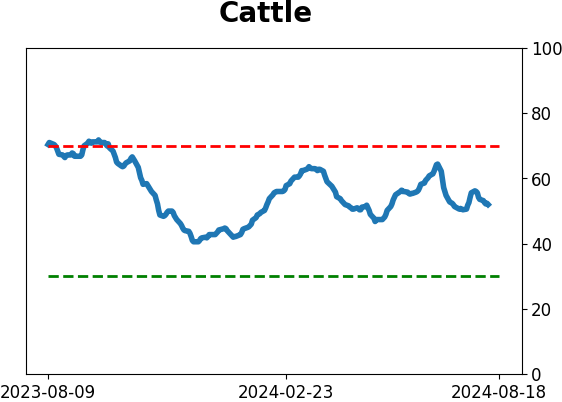
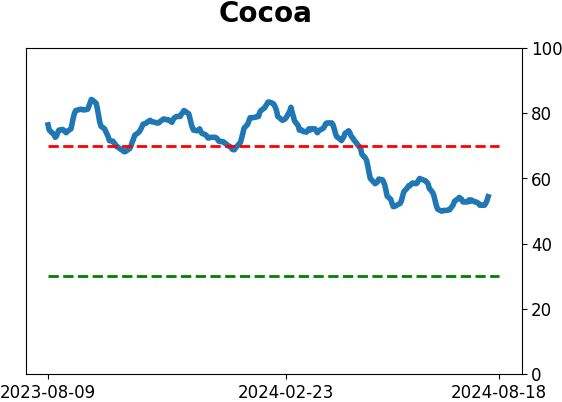
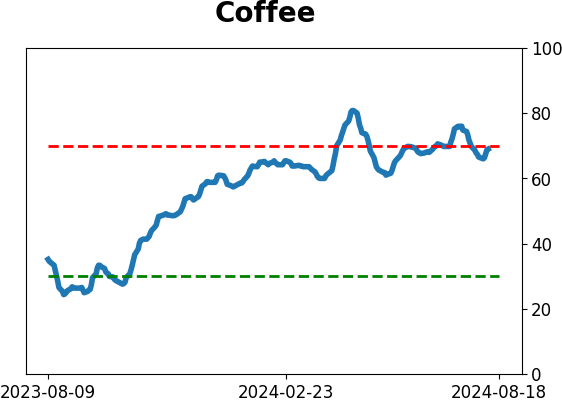
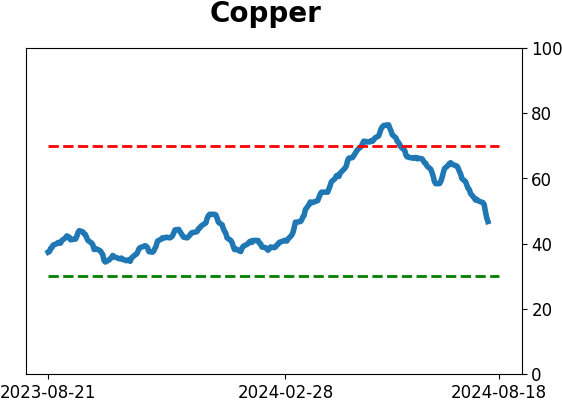
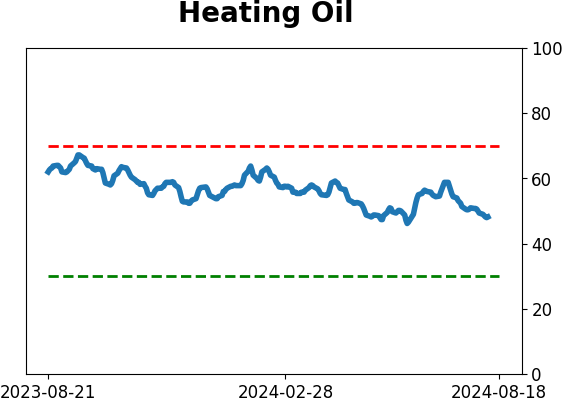
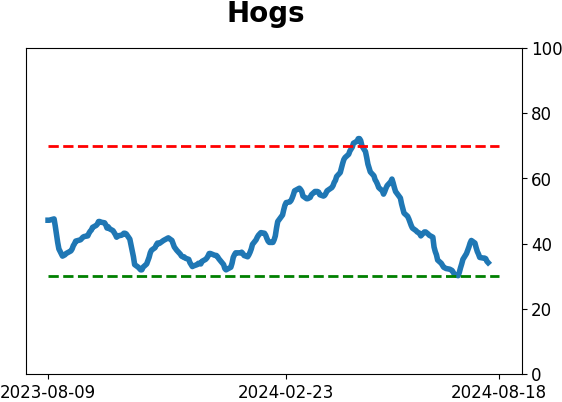
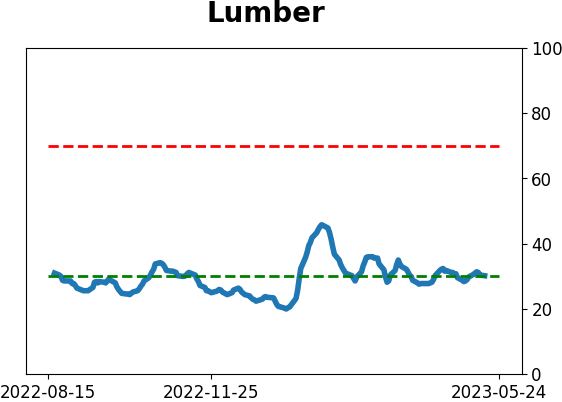
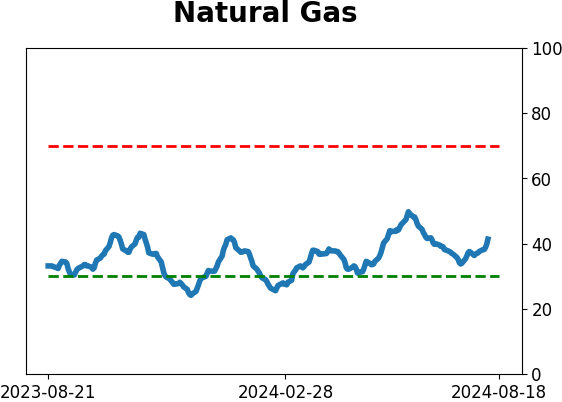
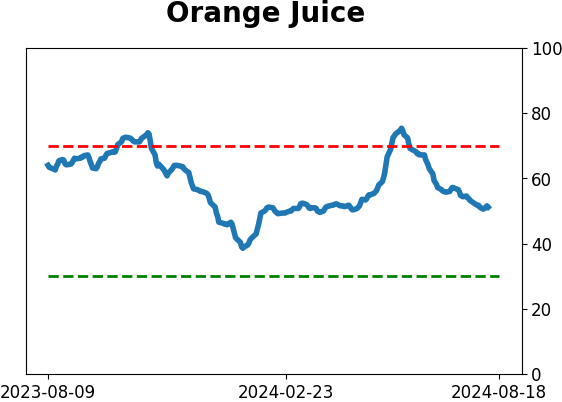
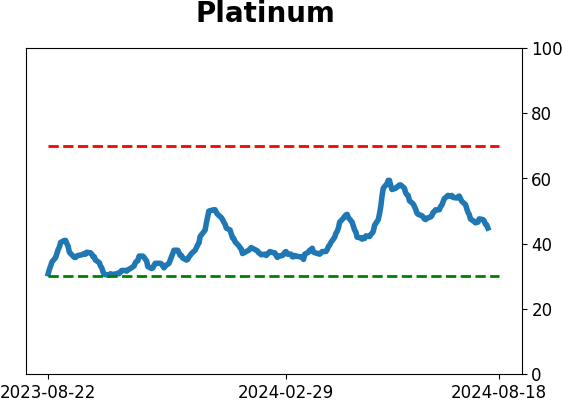
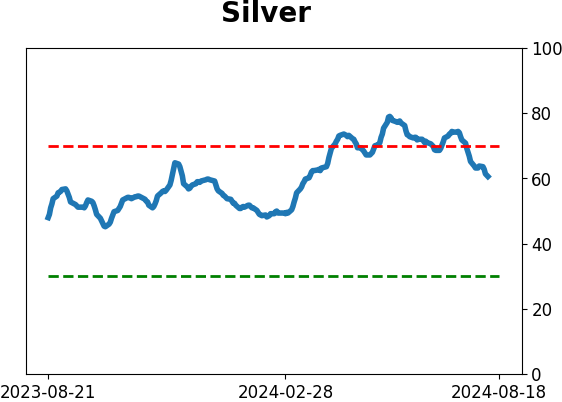
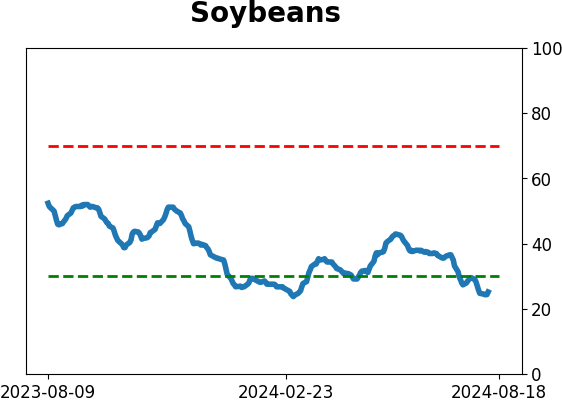
Commodity ETF's - 5-Day Moving Average
|
|