Daily Report : TradingEdge Weekly for Aug 11 - Long-term improvements, short-term worries, an "experience" breakout; A bullish policy shift in Brazil

| View/Print a PDF version of this Report |
Headlines
|
TradingEdge Weekly for Aug 11 - Long-term improvements, short-term worries, an "experience" breakout: This week, we saw that long-term breadth and sentiment are improving, but short-term there are some headwinds. Seasonality is turning negative, with high valuations and competition from fixed income. Stocks have been mired in an earnings recession, with declining earnings for 3 straight quarters. Crude oil is on a win streak. "Experience" stocks just broke out of a massive base. A bullish policy shift in Brazil: The central bank for Brazil cut its target rate for the first time after a tightening cycle, triggering a bullish backdrop for the Ibovespa Index. Similar shifts in monetary policy led to gains 86% of the time for the Brazilian benchmark over the next three and six months. |
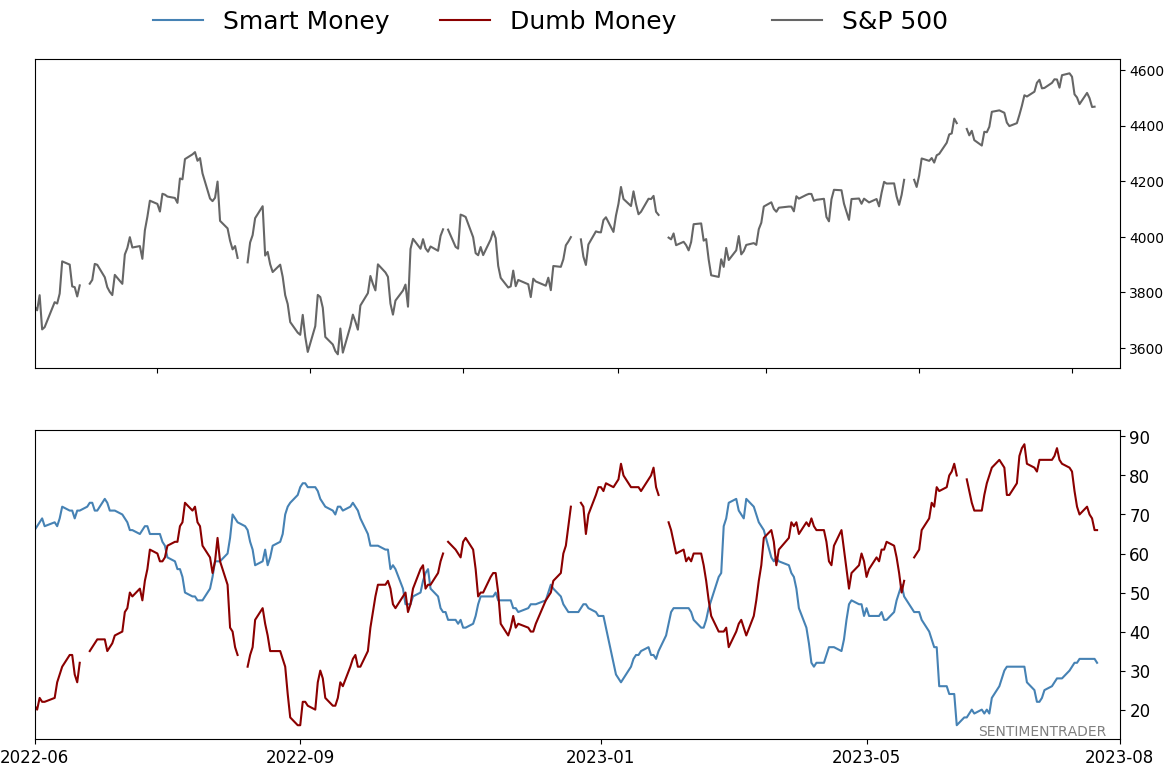
Smart / Dumb Money Confidence
|
|
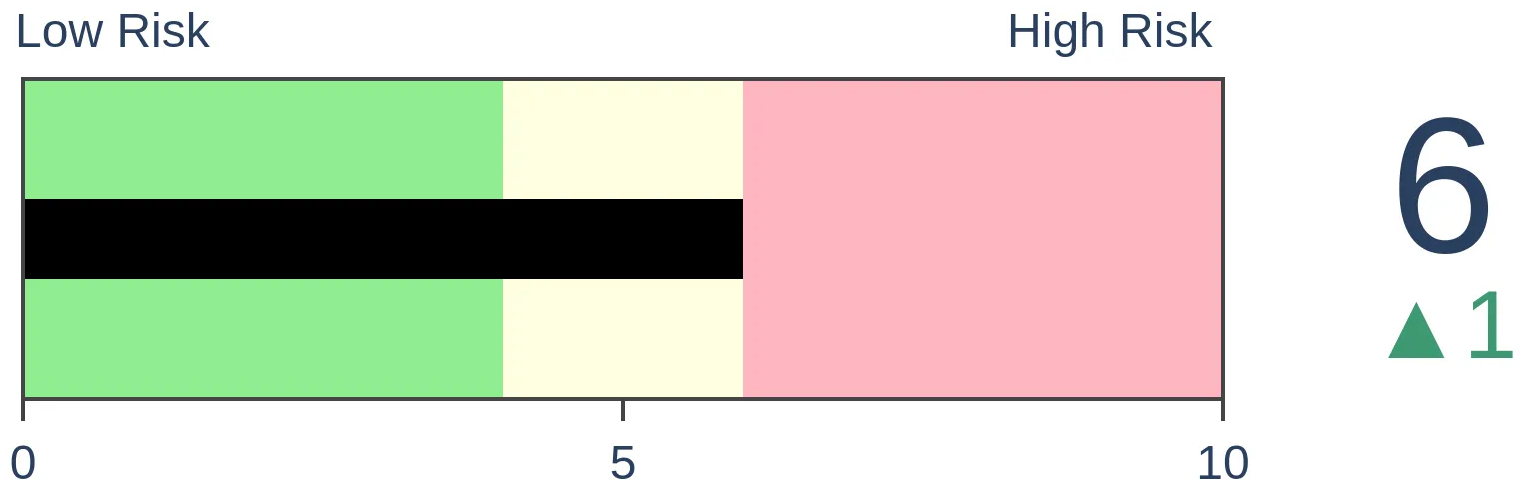
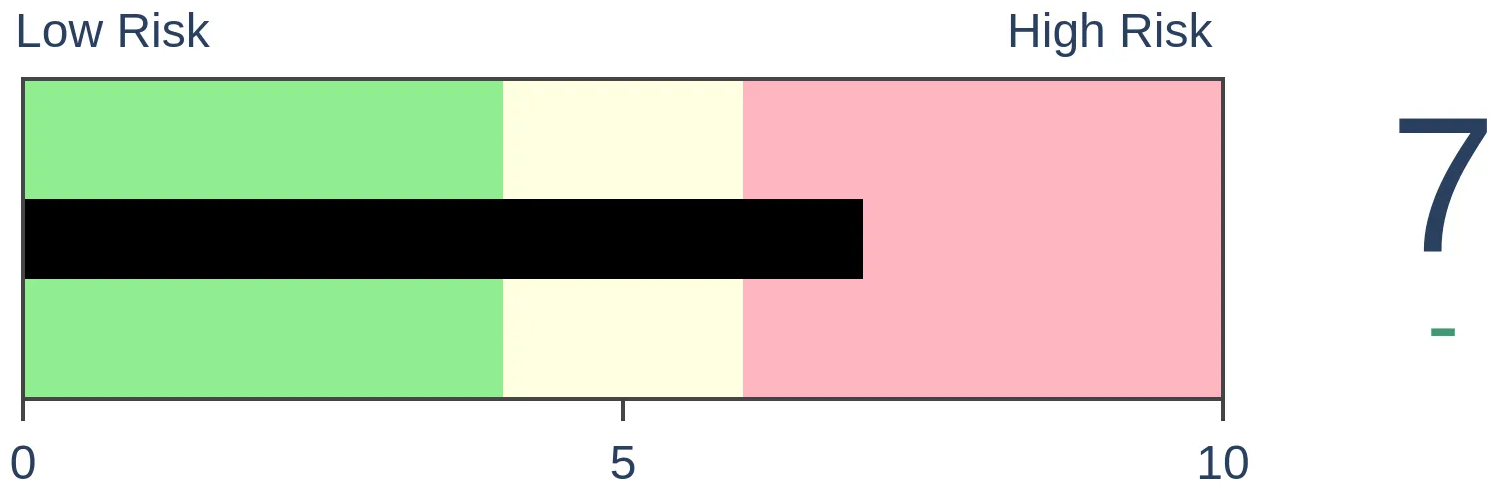
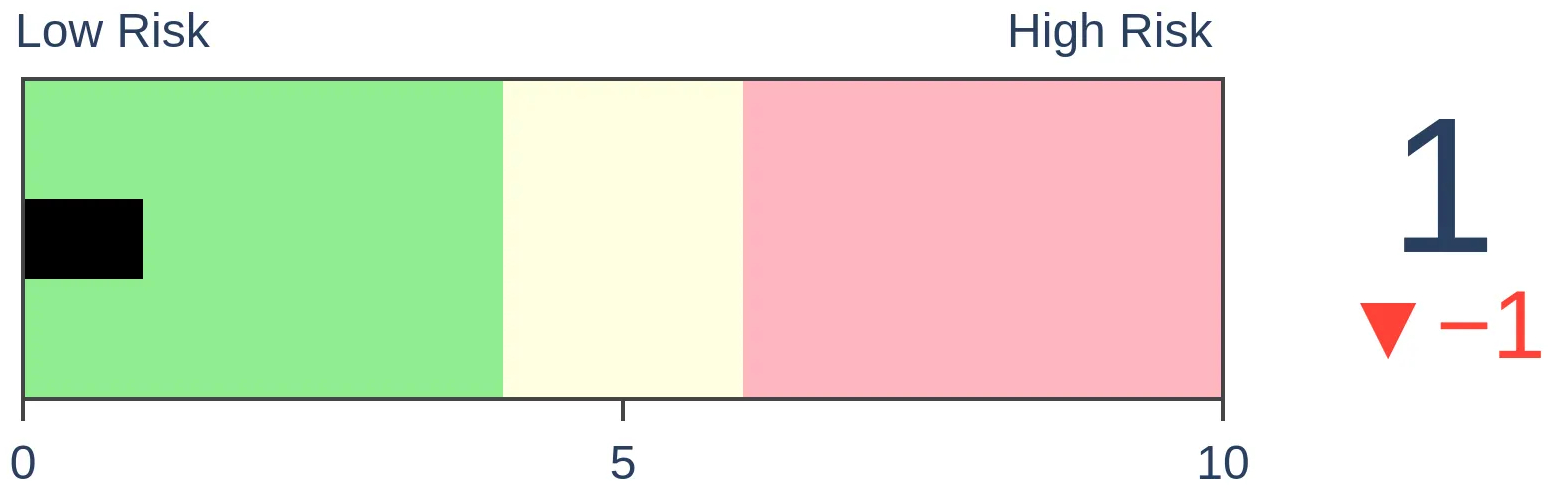
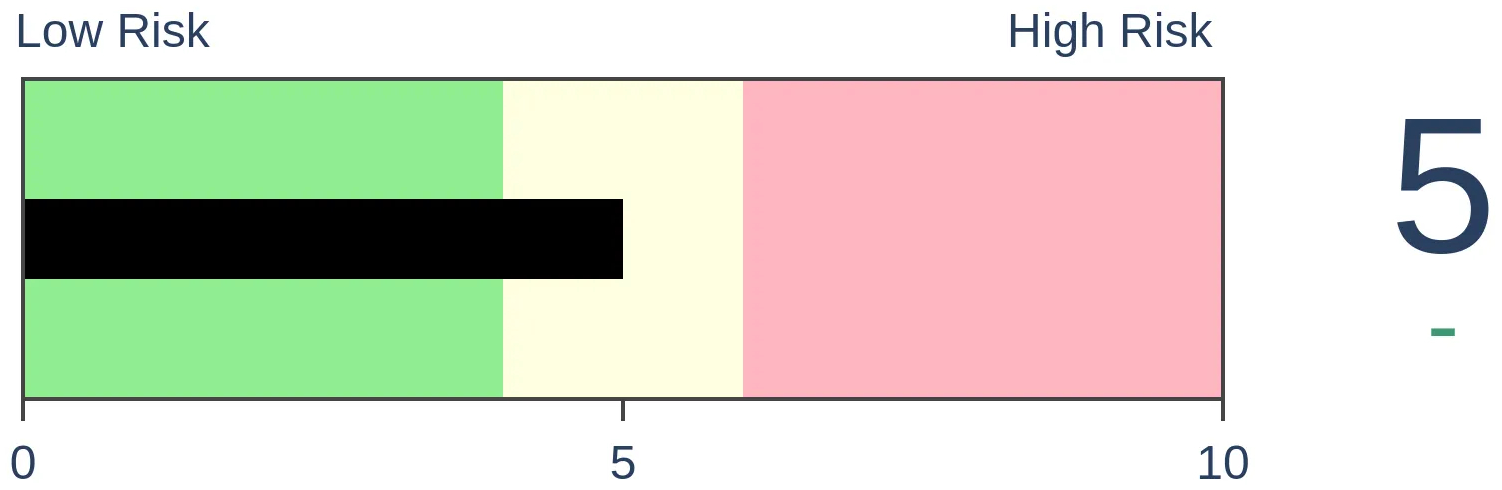
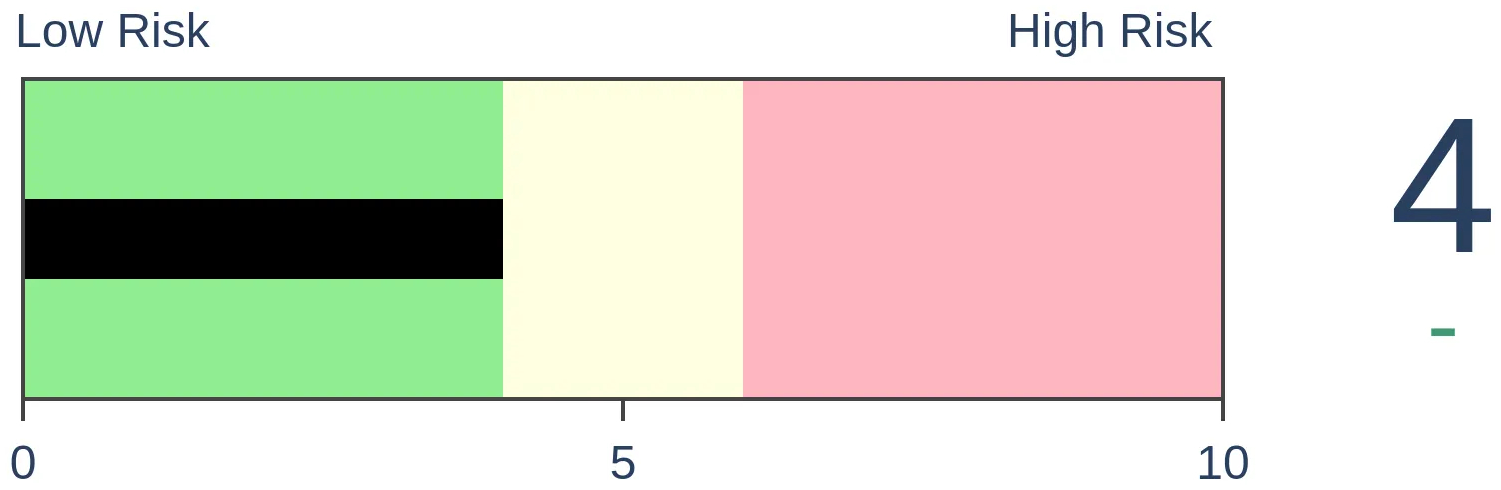
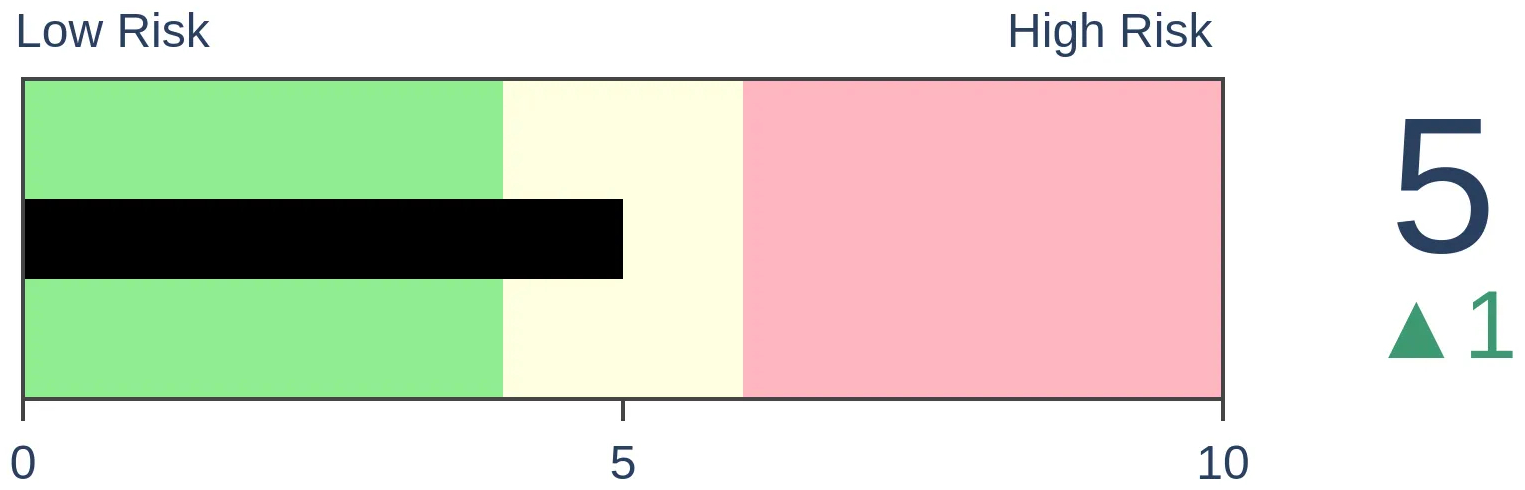
Risk Levels
|
|
|
Research
TradingEdge Weekly for Aug 11 - Long-term improvements, short-term worries, an "experience" breakoutBy Jason GoepfertBOTTOM LINEThis week, we saw that long-term breadth and sentiment are improving, but short-term there are some headwinds. Seasonality is turning negative, with high valuations and competition from fixed income. Stocks have been mired in an earnings recession, with declining earnings for 3 straight quarters. Crude oil is on a win streak. "Experience" stocks just broke out of a massive base. FORECAST / TIMEFRAME |
Key points:
- Improving long-term breadth and sentiment
- On a shorter time frame, sentiment has cycled from extreme greed back to neutral
- Seasonal factors for stocks are quickly turning negative
- Short-term returns have been poor during this time of year when valuations and interest rates were high
- S&P 500 stocks have been mired in an earnings recession
- The equity risk premium has plunged
- "Experience" stocks just enjoyed a massive base breakout
- Lower interest rates in Brazil
- Crude oil is on a winning streak and every energy stock is outperforming the S&P 500
Improving long-term breadth and sentiment
Jay showed that industry Breadth recently flashed a favorable trend-following signal, as did the AAII Bull Ratio.
One of the unique breadth measures we calculate is the percentage of 23 industries trading above their 200-day moving averages. A recent upward spike in the indicator value has many shouting "overbought" warnings. The chart below displays those times when the 50-day average of the indicator crossed above 70 for the first time in twelve months. The most recent signal occurred on 2023-08-03.
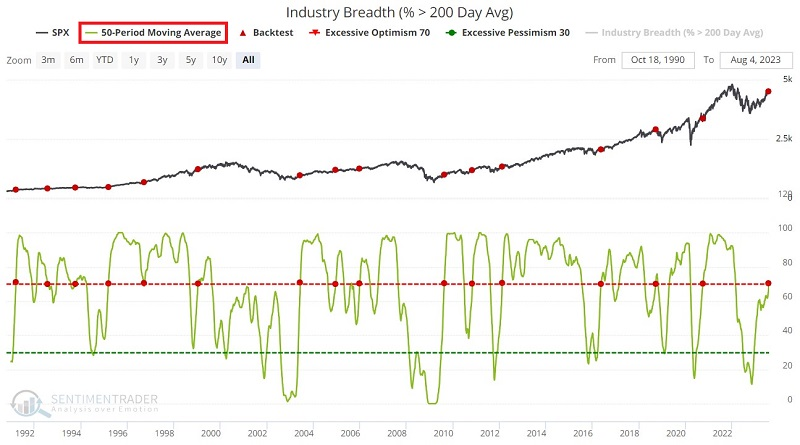
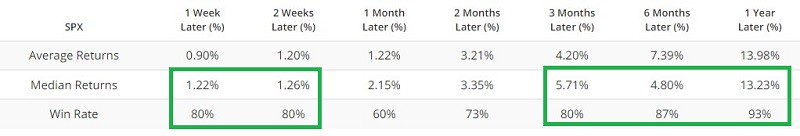
While there are never any guarantees, the results are encouraging for investors hoping for a continuation of the rally in the first half of 2023. Following the previous 14 signals, the only subsequent 12-month loss occurred following the 1993-10-11 signal and saw the S&P 500 close down -0.40% twelve months later. Not enjoyable, but also hardly disastrous.
The AAII sentiment survey is a weekly poll conducted by that organization that intends to gauge the overall sentiment of their membership. They ask their membership where they think the market will be in six months and group the responses into bullish, bearish, or neutral categories.
This recent spike in this indicator's reading has triggered the usual dire "Bullish sentiment is getting overdone" warnings from many market pundits. The chart below displays those times when the 20-week average of the indicator crossed above 48 for the first time in 26 weeks. The most recent signal occurred on 2023-07-26.
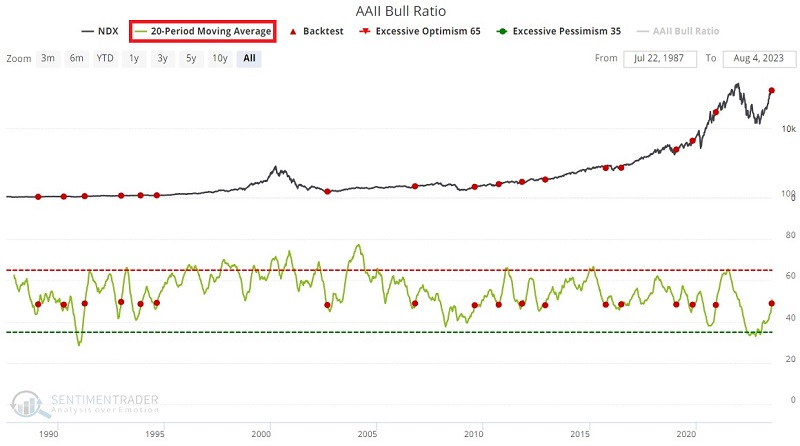
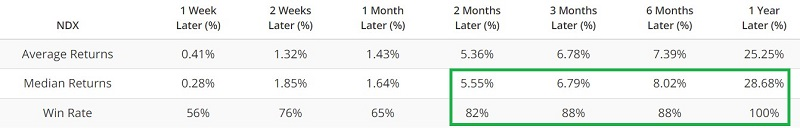
As it turns out, a rising trend that follows a reversal from a low level has generally been a good thing for the market. This reminds us that "former bears turning into bulls" is necessary to sustain a bull market.
You can watch an interview with Jay as he discusses these and other topics here.
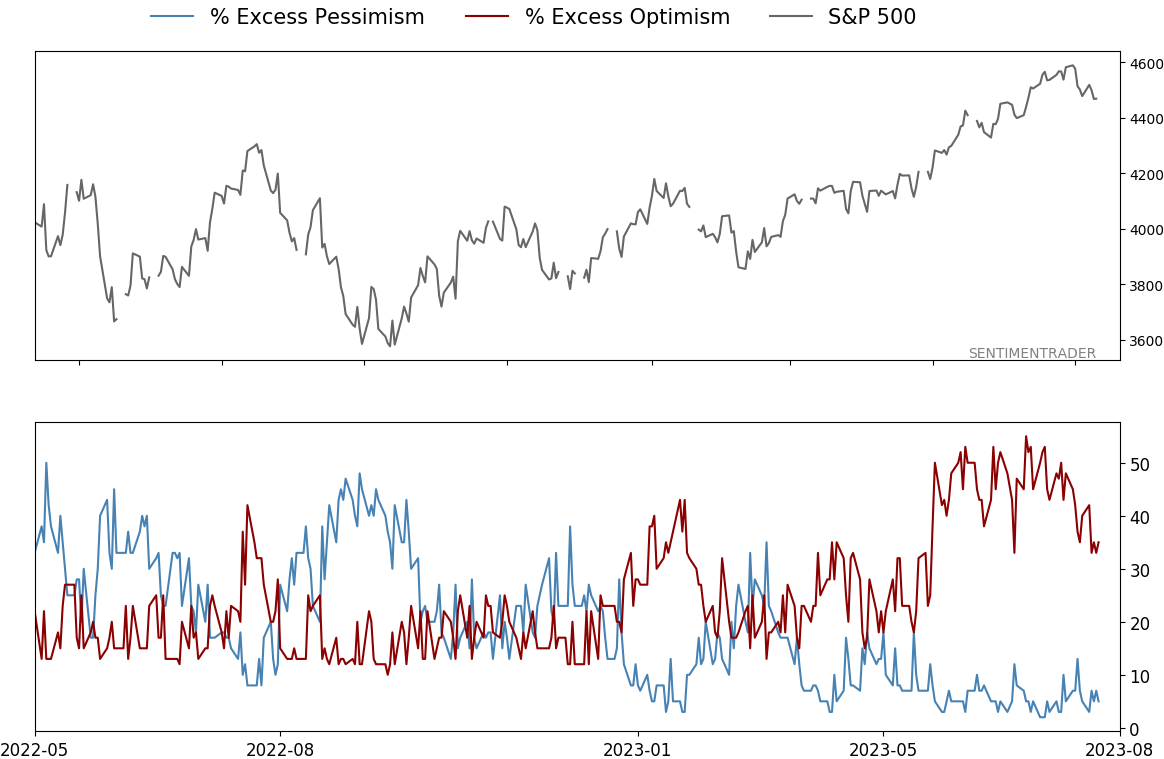
Greed is gone
Well, at least investors aren't greedy anymore.
Sentiment had been absurdly optimistic for a while. We've seen that similar conditions typically preceded below-average annualized returns but were poor predictors of significant and protracted declines. That was particularly the case when sentiment became exceptionally extreme and when it was the first signal after a bout of depression. Both were the cases this time.
The Fear & Greed model has moved aggressively out of the greed zone and is back in neutral territory.
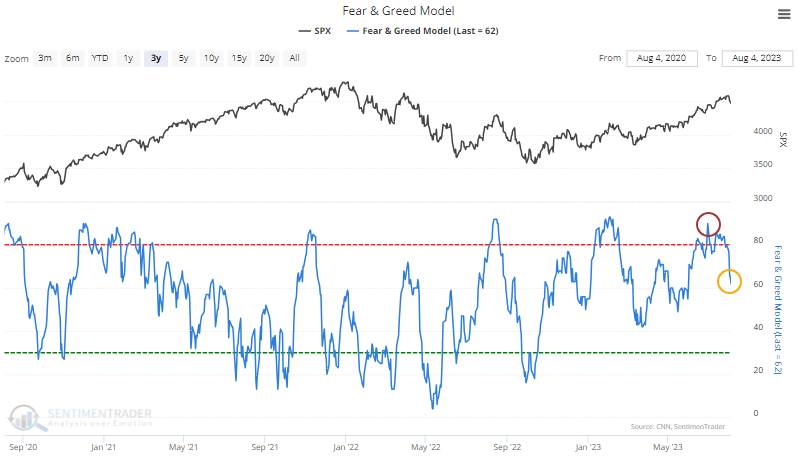
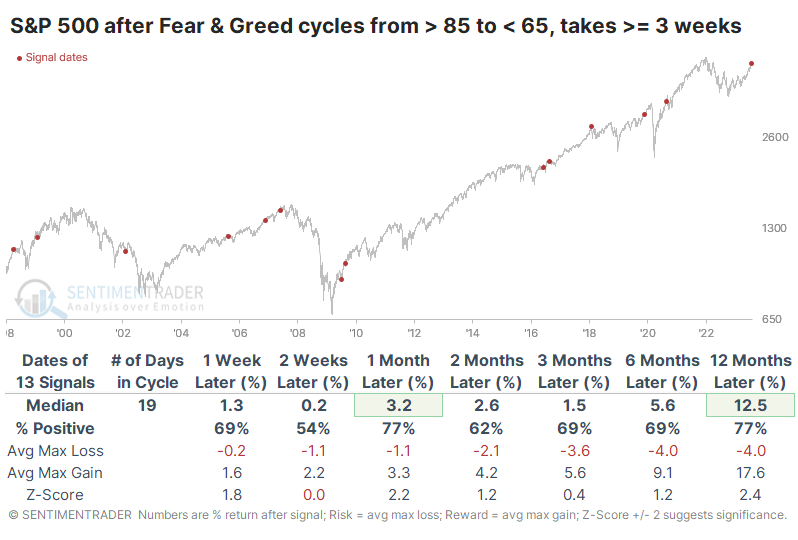
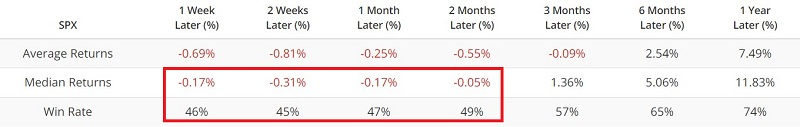
The table below shows other times when Fear & Greed cycled from extreme greed back to neutral conditions. This cycle is unusual because it has taken quite a while to reverse, about twice as long as it usually does. The table filters the signals only to include those that took three weeks or longer to play out. There was only one loss greater than -3.8% over the next three months.
Jay also touched on this but looked at when the 10-day average first crossed into excessive optimism territory, which it did in late July. The chart below displays when the 10-period average of our Fear & Greed Model crossed above 83%.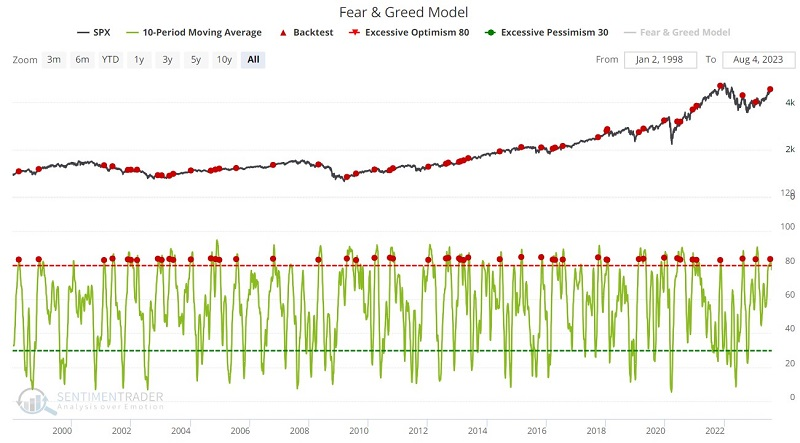
Looming seasonal weakness for stocks
Jay showed that the stock market tends to experience weakness during the August-October period though results can vary widely on a year-to-year basis.
The chart below displays the annual seasonal trend for the S&P 500 Index. A period of typical seasonal weakness is highlighted in red.
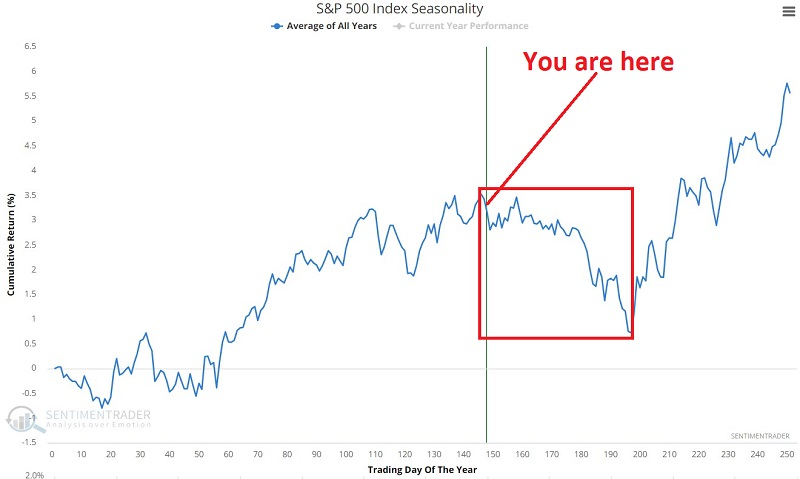
Our test will look at S&P 500 performance between Trading Day of the Year (TDY) #146 and #197 since 1953, a period that starts roughly in early August and ends in mid-October. The table below displays S&P 500 performance during this window depending on where we are in the presidential election cycle. For 2023, this period began at the close on 2023-08-02 and extends through 2023-10-13.
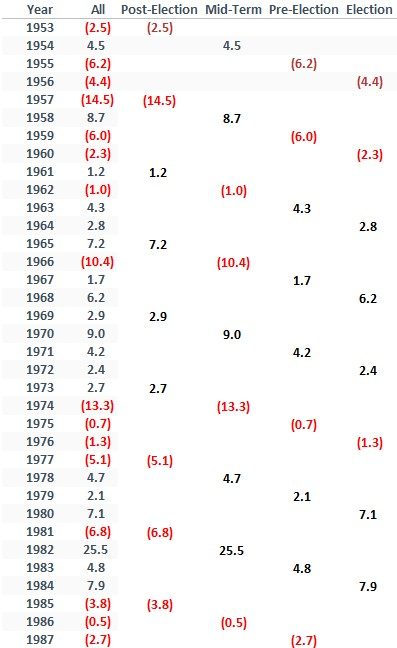
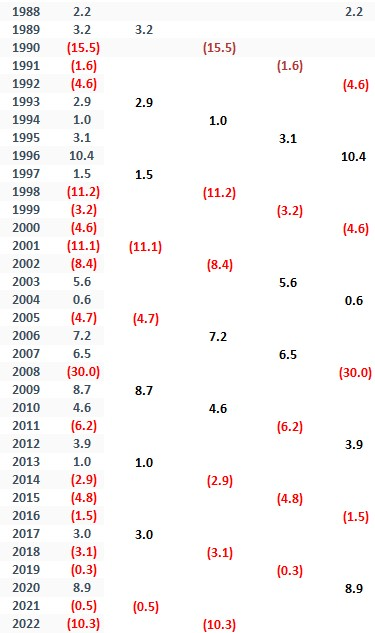
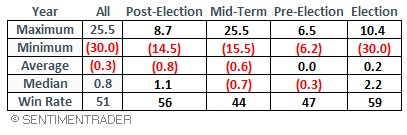
The good news is that this period has actually shown a gain more often than a loss (36 times up, 34 times down). The bad news is that the average and median losses are more significant than the average and median gains. Likewise, if we look at the best and worst performances, the S&P has shown a gain of over +10% two times (1982 and 1996) but also a loss of over -10% eight times. Essentially, "When it's good, it's pretty good, but when it's bad, it's very bad."
Adding to the seasonal worry - high valuations and competing investments
Because prices have held up in recent months while earnings have declined (see below), the widely-watched price/earnings valuation measure has increased. That's happened even though bond prices have declined, so investors have a reasonable alternative in ultra-safe Treasuries-all this as we careen toward the oft-cited volatility of September and October.
There is little debating the facts: 1) September has been historically weak for stocks, 2) valuation measures are on the upper ends of their ranges, and 3) rising bond yields offer a reasonable alternative for investors.
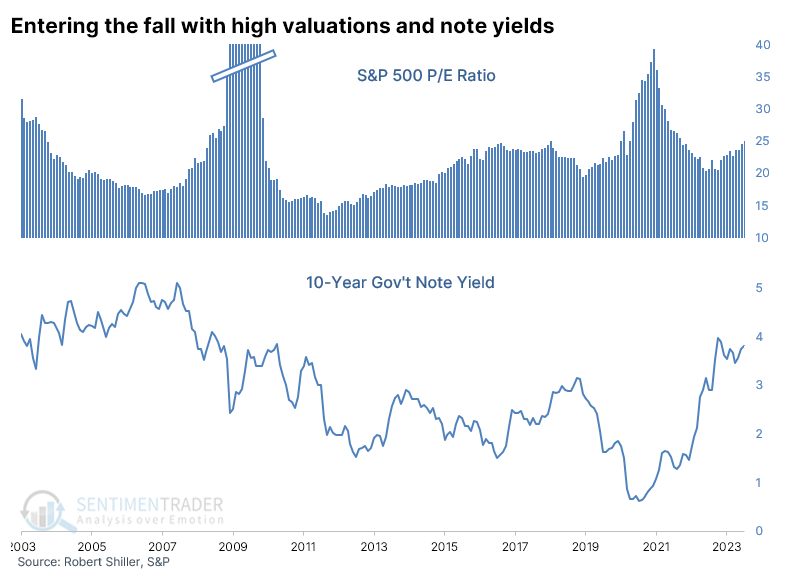
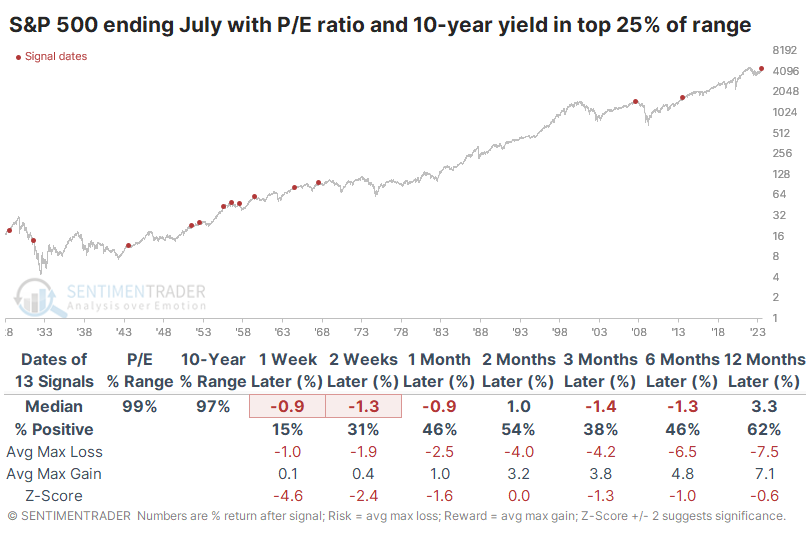
The table below shows when we ended July with the S&P's P/E ratio in the top 25% of its 2-year range. The yield on 10-year Treasuries also needed to be in the top 25% of its range. We added a week to month-end to better equate with our current situation.
There was some reason to worry. After other late summers with high valuations and note yields, the S&P struggled during August and into September. Even its three- and six-month returns were lacking. Its average return underperformed a random return across all time frames.
Across sectors and factors, there weren't many places to hide, especially during August. Small-caps held up the best, but oddly, the Defensive factor and sectors didn't provide much solace.
To have more confidence in the idea that high valuations and competing yields at the end of July is a reason to worry, two other things should be true:
- Low valuations and yields should lead to better returns
- High valuations and yields in other months should lead to better returns
Both of those things are true. When the S&P ended July with valuations and yields in the bottom half of their 2-year ranges, its returns in the months ahead were pretty good. The next couple of weeks were still weak, but not like the above. When the S&P ended months other than July (or August) with high valuations and yields, its returns in the weeks and months ahead were fine and mostly above average.
An ongoing earnings recession
Earnings are dropping, and there is no letup in sight. That has unnerved investors and may explain part of the recent retreat from the months-long rally.
While sources vary on the exact makeup and level of earnings for stocks within the S&P 500, the trend is universal - it's down. According to data from Standard & Poors and Robert Shiller, earnings for the S&P have, indeed, declined for three consecutive quarters. By "decline," we mean lower than the same quarter for the prior year.
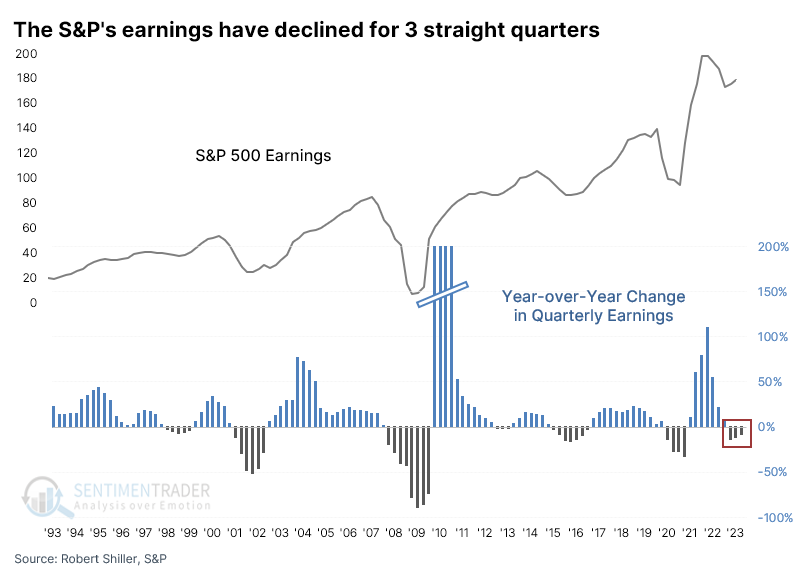
It's relatively rare to see a streak of three consecutive year-over-year earnings declines. Since 1928, it has happened 19 times, including the current streak. The streaks haven't typically gone much longer; only eight of them lasted for five or more consecutive quarters.
S&P 500 returns after three consecutive quarters with an earnings decline weren't too bad and were actually quite impressive over the following quarter.
The table below filters the instances to only include those consecutive earnings declines which also triggered when the S&P was within 10% of its prior 3-year high (using quarterly closes). Even though investors might have worried that stocks were rising without fundamental justification, the S&P tended to keep rising. When it lost, it lost small with only a single exception (and that was reversed relatively quickly).
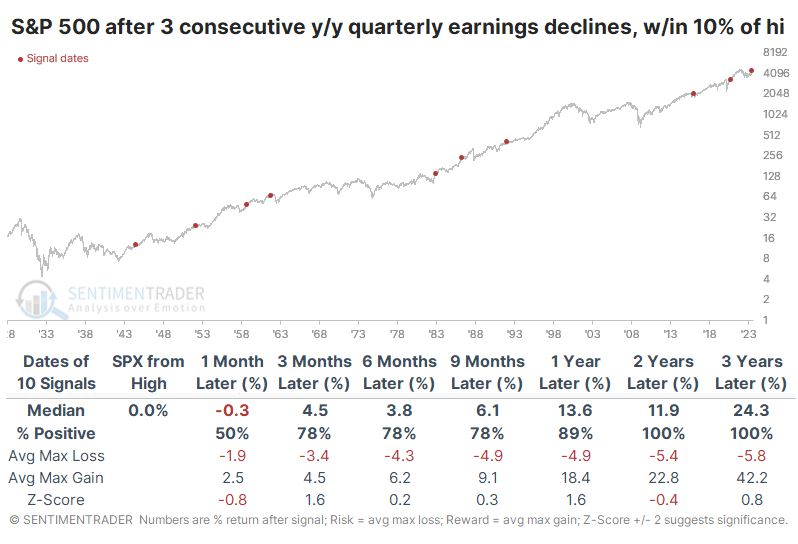
Contrast that to times when earnings were declining, and the S&P was more than 10% below its peak. While investors would have anticipated that the worst was over, returns were significantly worse than when the S&P rose.
About that equity risk premium...
Jay noted that the Equity Risk Premium has fallen to a multi-year low, setting off a lot of dire warnings on social media websites. As usual, the masses appear to be getting it wrong.
The Equity Risk Premium (ERP) indicator measures the difference between the earnings yield (100/PE Ratio) on the S&P 500 minus the current yield on 10-year Treasury notes. The higher the risk premium, the more attractive stocks are relative to bonds.
At first glance, it does appear in the chart above that ERP is extremely low. However, if we go back and draw the entire history of ERP readings
It is correct to state that the higher ERP, the more undervalued stocks are relative to bonds. And at the extreme, it can signal a very bullish opportunity for stock investors.
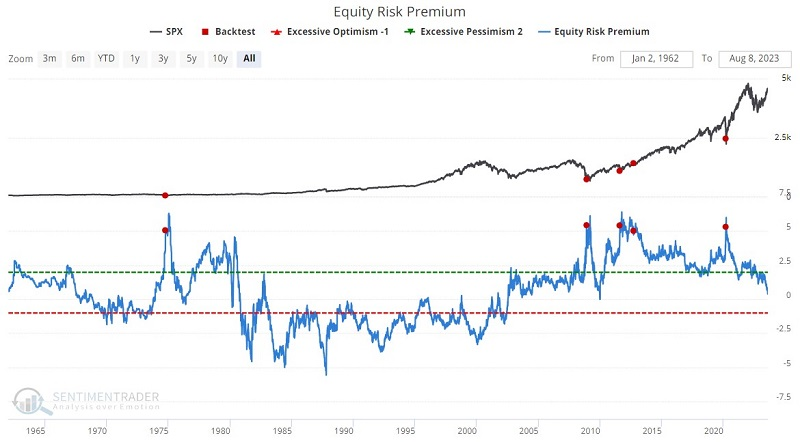
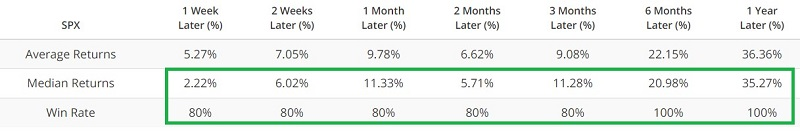
The good news is that historical results have been spectacular. The bad news is that this signal happens very infrequently. Far from crossing above 5.0, the EPR recently crossed below 0.50. If high readings are bullish, then human nature dictates that sharp declines to multi-year lows MUST be bearish. The chart below displays all times EPR crossed below 0.50, and the table summarizes subsequent S&P 500 performance.
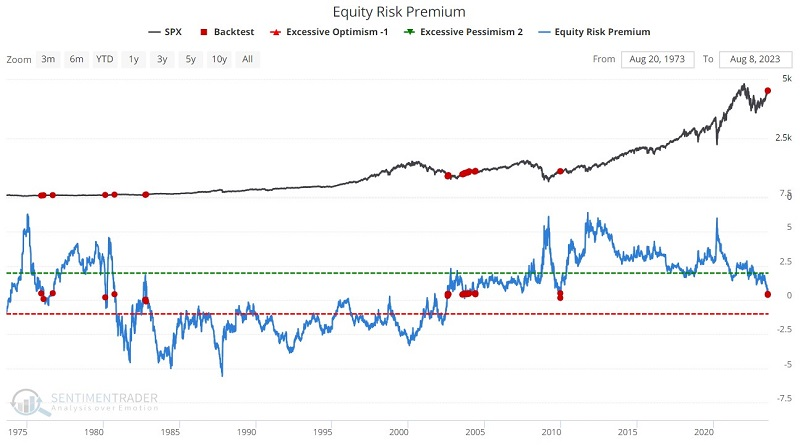
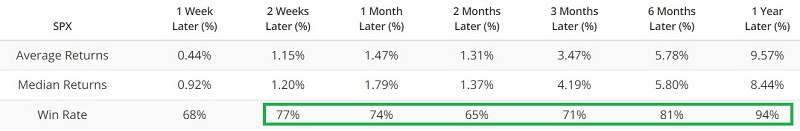
The average and median returns are not spectacular. However, the Win Rates are pretty solid at 81% after six months and 94% after 12 months. So to state that the recent action of ERP is bearish appears to have little historical justification.
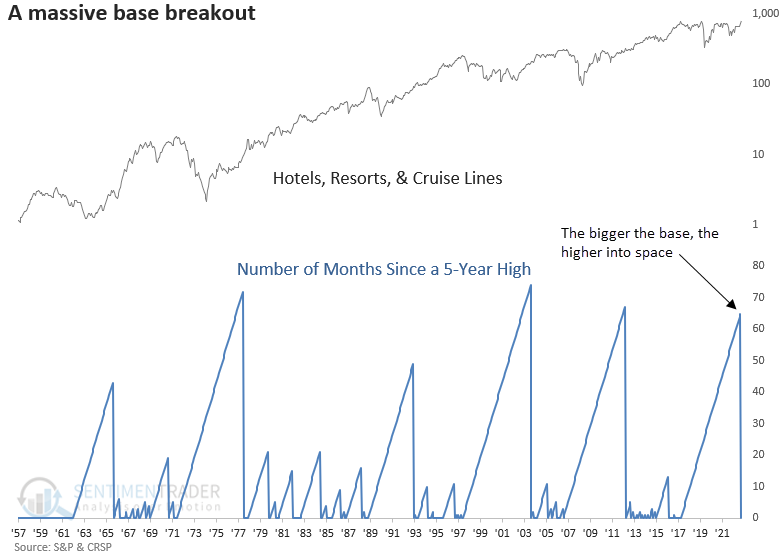
A massive breakout for "experience" stocks
Dean noted that Hotels, Resorts, and Cruise Lines closed at a new all-time high after consolidating for more than five years. Similar base breakouts led to further gains 100% of the time over the next one and two years.
In the wake of COVID-19, two dominant themes materialized within consumer behavior. The aspiration for homeownership gained significant momentum, and consumers wanted to travel again. While housing momentum has slowed due to higher mortgage rates, the emphasis on prioritizing experiences over belongings remains prevalent among consumers.
The Hotels, Resorts, and Cruise Lines sub-industry group broke out to a new all-time high, representing the first instance after a 5-year low.
When the Hotels, Resorts, and Cruise Lines sub-industry broke out to a new all-time high for the first time after a 5-year low, the group was higher one and two years later every time.
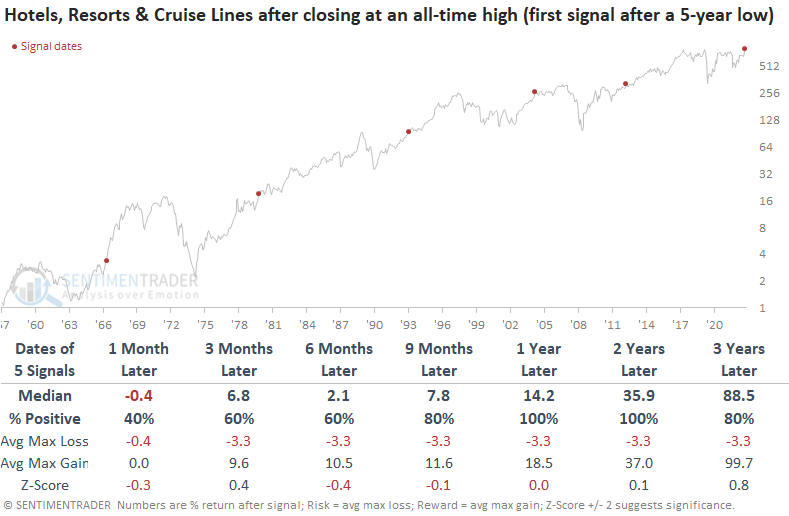
Given that a single stock can dictate performance in market-cap-weighted indexes, it's always essential to drill down under the surface to see what's driving returns at the index level. Within the Hotels, Resorts, and Cruise Lines sub-industry group, there are three clear leaders with perfect absolute and relative strength trend scores.
To illustrate the experiences-over-things phenomenon, the following chart contains a relative ratio comparing Hotels, Resorts, and Cruise lines to the Apparel, Accessories, and Luxury Goods sub-industry. While extended, the ratio has broken out to an all-time high.
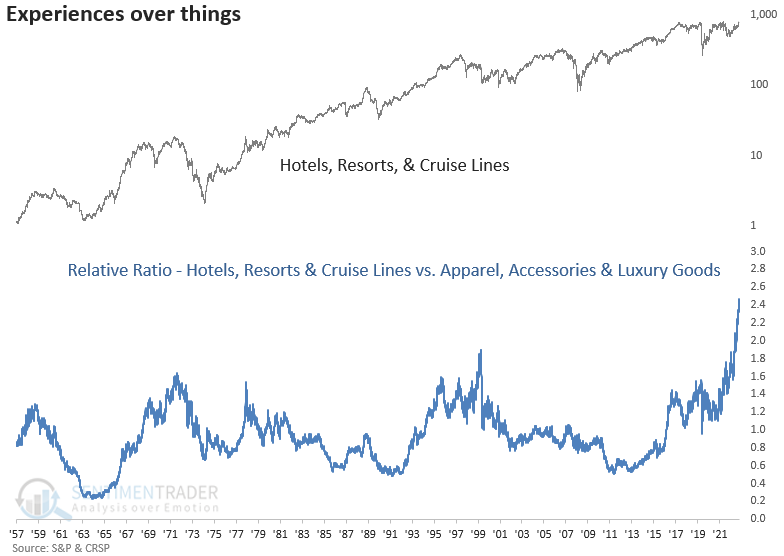
Consumers are more confident about the outlook for the economy with lower inflation and a resilient job market. With big-ticket items like a home or a car on hold due to higher interest rates, consumers' desire for experiences over things looks compelling, especially since Hotels, Resorts, and Cruise Lines registered a new all-time high.
Lower rates in Brazil
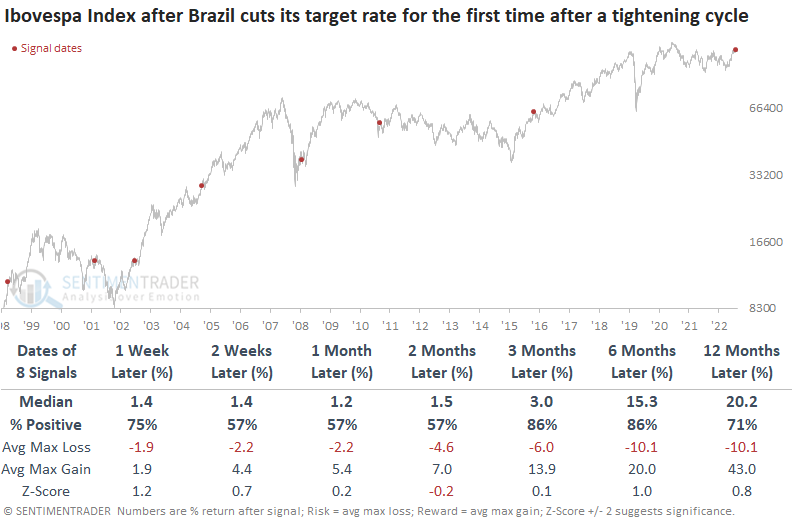
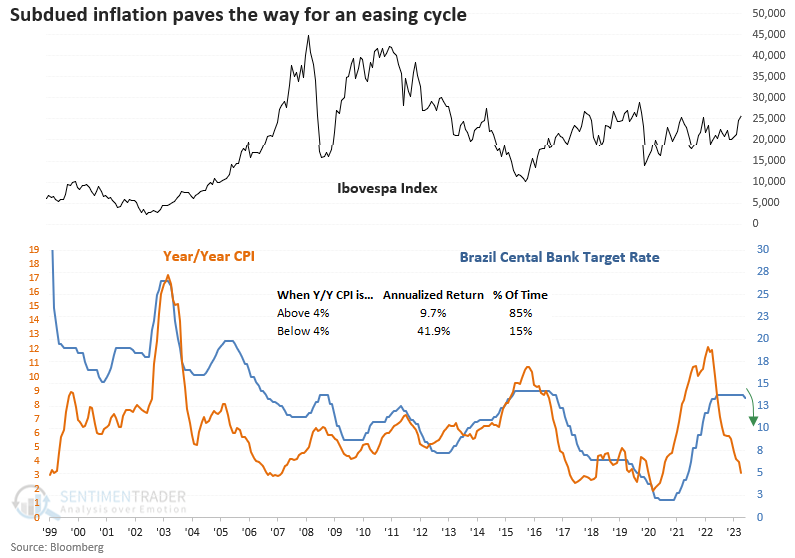
The Brazilian Central Bank lowered its target rate for the first time after a tightening cycle. Dean showed that similar shifts in policy led to an 86% win rate for the Ibovespa Index over the next three and six months and it tended to exceed those of the S&P 500 over the next six and twelve months.
Transitions from tightening to easing monetary policy typically generate a favorable response from stocks. When stocks respond negatively, the central bank's actions often come too late, with the economy already reeling from the repercussions of the tightening cycle. Brazil's year-over-year Consumer Price Index dropped to 3%, a threshold reached in just 9% of months since 1999. Annualized returns of 42% are observed for the Ibovespa Index when CPI falls below 4%.

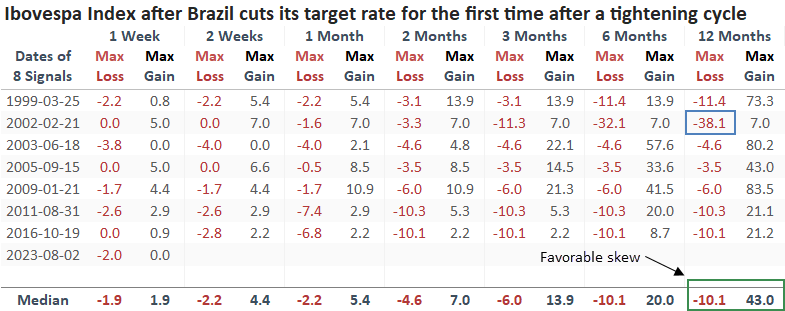
While the sample size is small, the first rate cut after a tightening cycle tends to be bullish for the Ibovespa Index, with an 86% win rate over the next three and six months. The one outlier in 2002 occurred after Brazil's central bank raised rates in 2001, swimming against the tide of other banks around the globe who were easing policy. Except for 2002, the maximum gain exceeded the maximum loss by a significant amount over the next year.
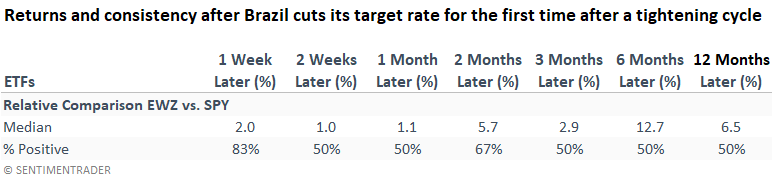
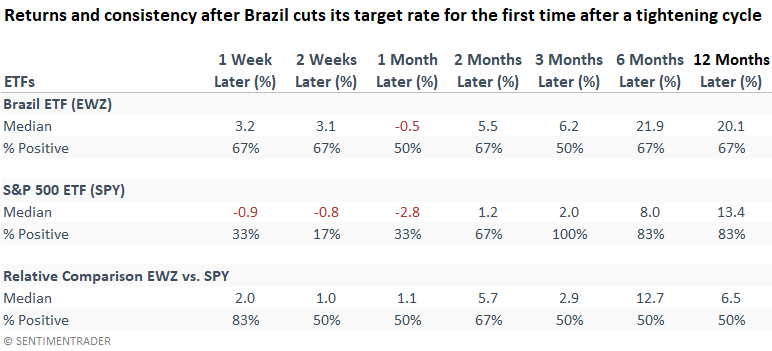
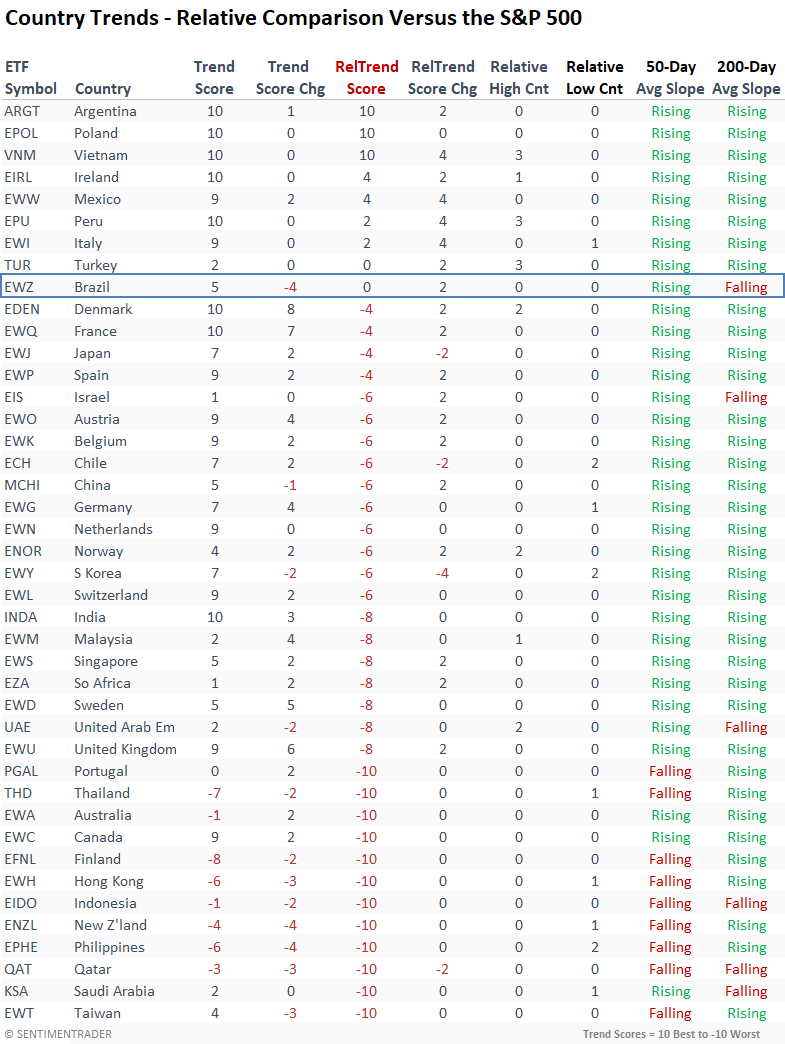
USD-based investors have limited options for accessing Brazilian stocks. One potential vehicle is the ETF (EWZ). While win rates are less favorable when compared to the Ibovespa Index, returns are better across most time frames.
When benchmarked against the S&P 500, the win rate resembles a coin toss in most cases. However, returns show potential for relative outperformance.
Even though historical returns offer a glimpse into potential opportunities, allocating capital based on additional confirmation from other conditions or indicators is a more prudent approach. Although the EWZ ETF looks favorable compared to other country ETFs, its relative trend score does not reflect a bullish status when gauged against the S&P 500. And it's one of a handful of ETFs with a downward sloping 200-day average, an adverse long-term trend condition.
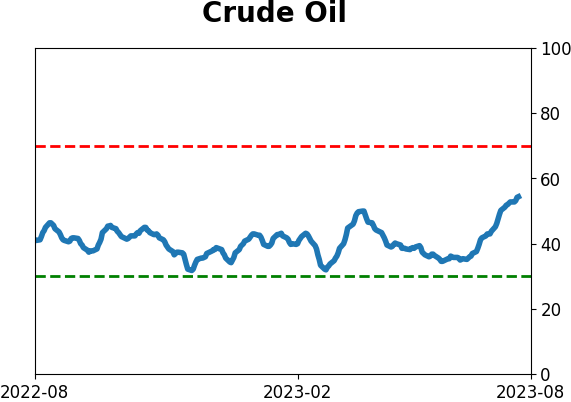
Crude oil win streak
Dean showed that crude oil closed higher for six consecutive weeks from a 3-month low. Similar win streaks foreshadowed additional upside follow-through over the next few months.
Crude oil futures are in a clearly defined downtrend, with its 200-day moving average falling for 190 consecutive days, marking the 10th longest streak in history. However, the commodity closed higher for six straight weeks for only the 27th time since 1983.
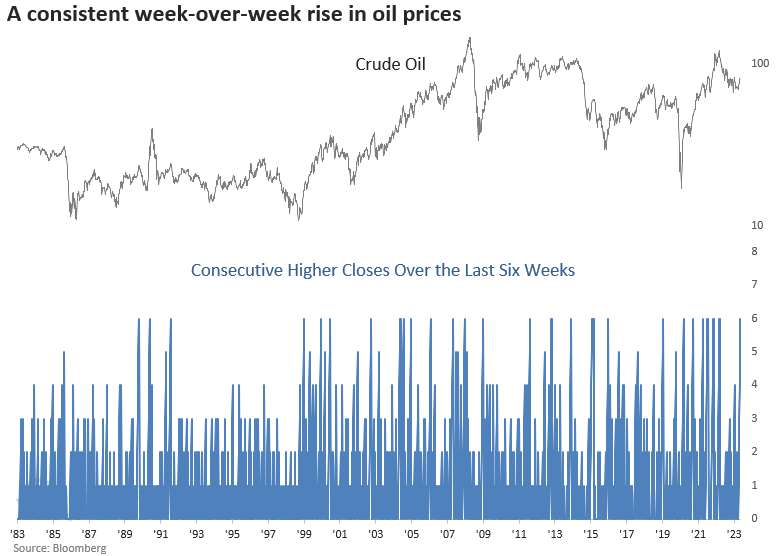
A persistent week-over-week rise in oil results in undesirable outcomes, with returns ranging from negative to stagnant for up to a year afterward.
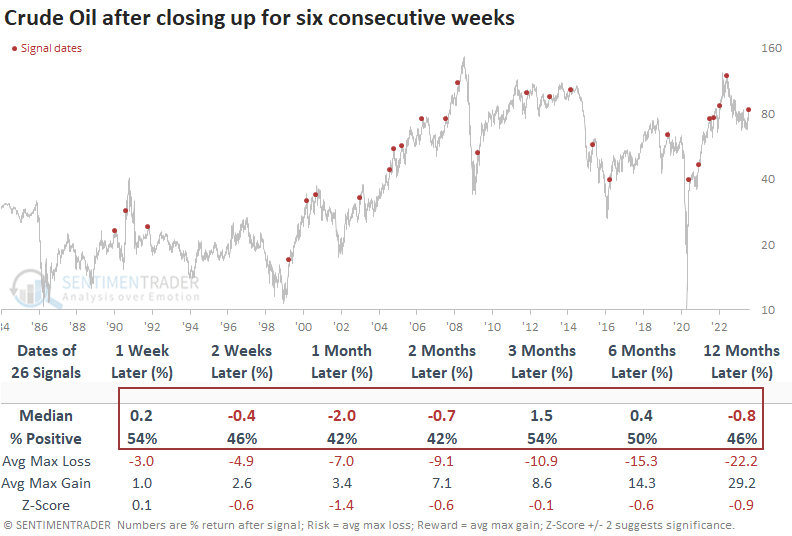
When the 200-day average for crude oil was declining, like now, the commodity was negative at some point over the next three months every time.
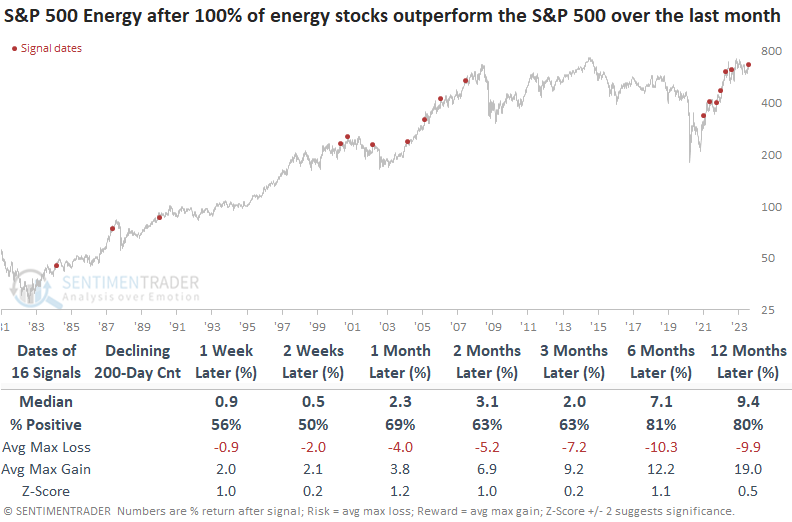
Energy stocks, which have been significant year-to-date laggards, caught a bid from the bounce in oil. For the first time in almost a year, every single S&P 500 Energy stock outperformed the S&P 500 over the last month.
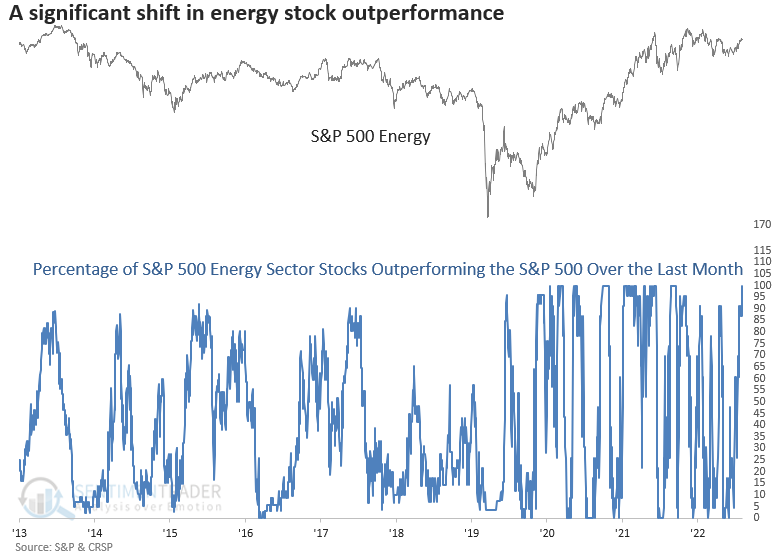
Reversals in the percentage of S&P 500 energy stocks outperforming the S&P 500 tend to exhibit bullish outcomes over most time frames. However, all but two precedents occurred when the 200-day moving average for crude oil was rising, which is not the case now. In the two prior instances when the moving average was falling, the energy sector declined over the next two months.
About TradingEdge Weekly...
The goal of TradingEdge Weekly is to summarize some of the research published to SentimenTrader over the past week. Sometimes there is a lot to digest, and this summary highlights the highest conviction or most compelling ideas we discussed. This is NOT the published research; rather, it pulls out some of the most relevant parts. It includes links to the published research for convenience, and if you don't subscribe to those products, it will present the options for access.
A bullish policy shift in BrazilBy Dean ChristiansBOTTOM LINEThe central bank for Brazil cut its target rate for the first time after a tightening cycle, triggering a bullish backdrop for the Ibovespa Index. Similar shifts in monetary policy led to gains 86% of the time for the Brazilian benchmark over the next three and six months. FORECAST / TIMEFRAME |
Key points:
- The Brazilian Central Bank lowered its target rate for the first time after a tightening cycle
- Similar shifts in policy led to an 86% win rate for the Ibovespa Index over the next three and six months
- Returns for the Brazil ETF (EWZ) tend to exceed those of the S&P 500 over the next six and twelve months
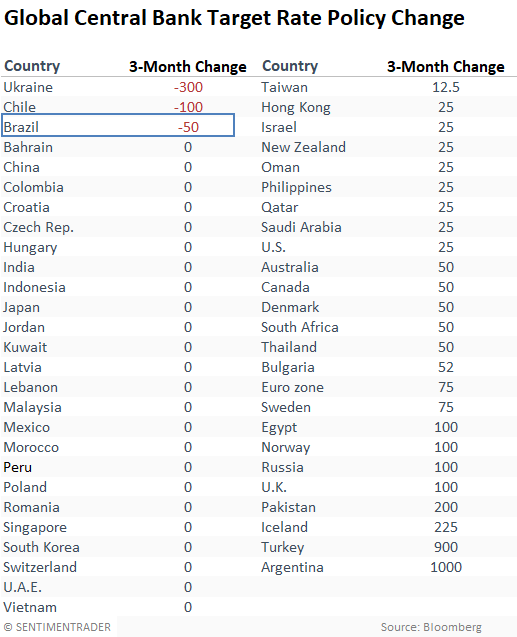
Brazil pivots from its restrictive monetary policy stance
The Brazilian central bank cut its target rate on August 2nd, marking the third country to shift its monetary policy stance from tightening to easing. The accompanying statement emphasized the role of an improved consumer inflation outlook as a driver for the policy change.
Transitions from tightening to easing monetary policy typically generate a favorable response from stocks. When stocks respond negatively, the central bank's actions often come too late, with the economy already reeling from the repercussions of the tightening cycle.
Inflation, central bank policy, and stock returns
Brazil's year-over-year Consumer Price Index dropped to 3%, a threshold reached in just 9% of months since 1999. Annualized returns of 42% are observed for the Ibovespa Index when CPI falls below 4%.
Similar shifts from tightening to easing led to positive returns for the Ibovespa Index
While the sample size is small, the first rate cut after a tightening cycle tends to be bullish for the Ibovespa Index, with an 86% win rate over the next three and six months.
The one outlier in 2002 occurred after Brazil's central bank raised rates in 2001, swimming against the tide of other banks around the globe who were easing policy.
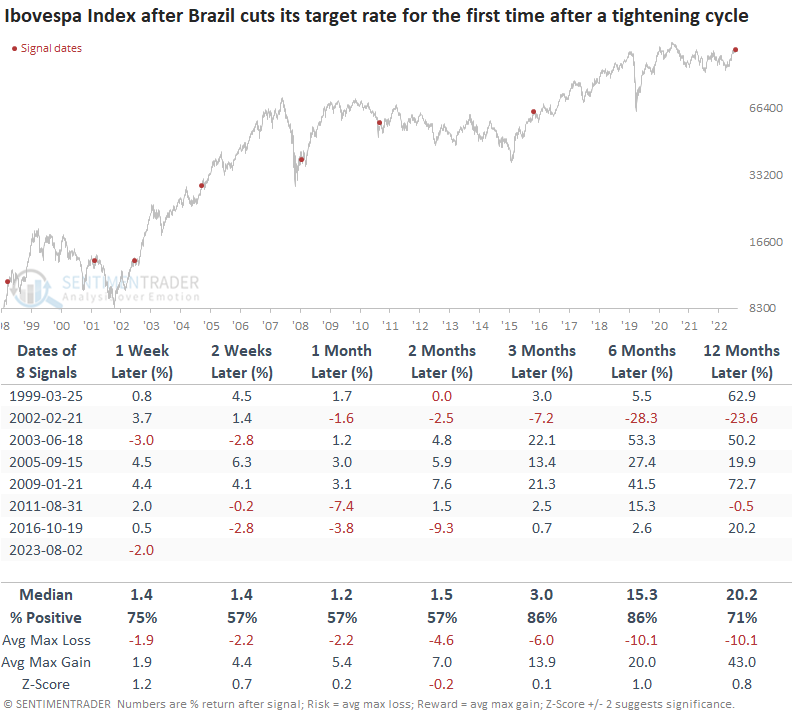
Except for 2002, the maximum gain exceeded the maximum loss by a significant amount over the next year.
Relative comparison between the Brazil ETF (EWZ) and the S&P 500 ETF (SPY)
USD-based investors have limited options for accessing Brazilian stocks. One potential vehicle is the ETF (EWZ). While win rates are less favorable when compared to the Ibovespa Index, returns are better across most time frames.
When benchmarked against the S&P 500, the win rate resembles a coin toss in most cases. However, returns show potential for relative outperformance.
Due to data limitations, the EWZ comparison contains one less signal.
Trust but verify with other indicators
Even though historical returns offer a glimpse into potential opportunities, allocating capital based on additional confirmation from other conditions or indicators is a more prudent approach.
Although the EWZ ETF looks favorable compared to other country ETFs, its relative trend score does not reflect a bullish status when gauged against the S&P 500. And it's one of a handful of ETFs with a downward sloping 200-day average, an adverse long-term trend condition.
What the research tells us...
The Brazilian central bank reduced its target rate for the first time after raising rates 12 times, starting in March 2021. Historically, a shift in monetary policy, like now, has been a bullish development for the Ibovespa Index. USD-based investors can allocate capital to an ETF like EWZ. However, I would wait for absolute and relative trends to improve.
Indicators at Extremes
|
|
|
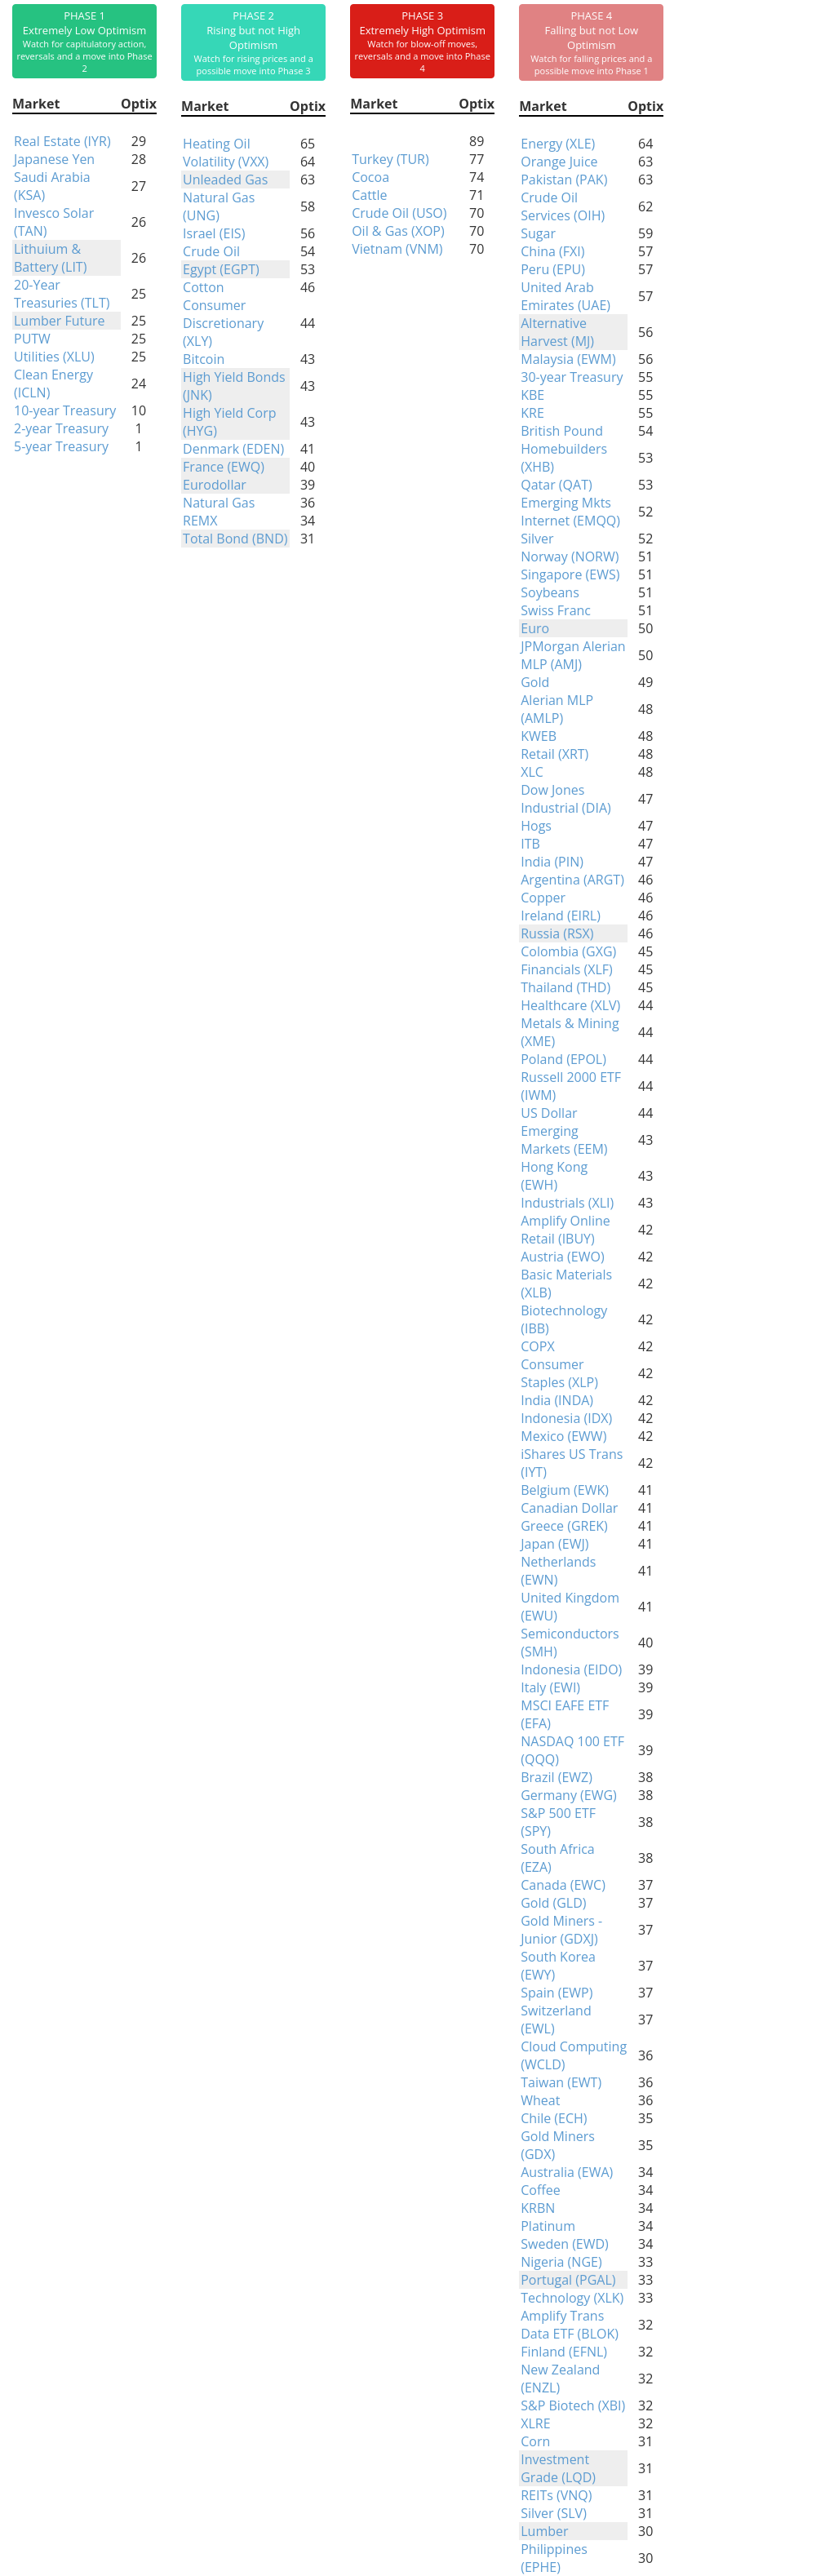
Phase Table
|
|
|
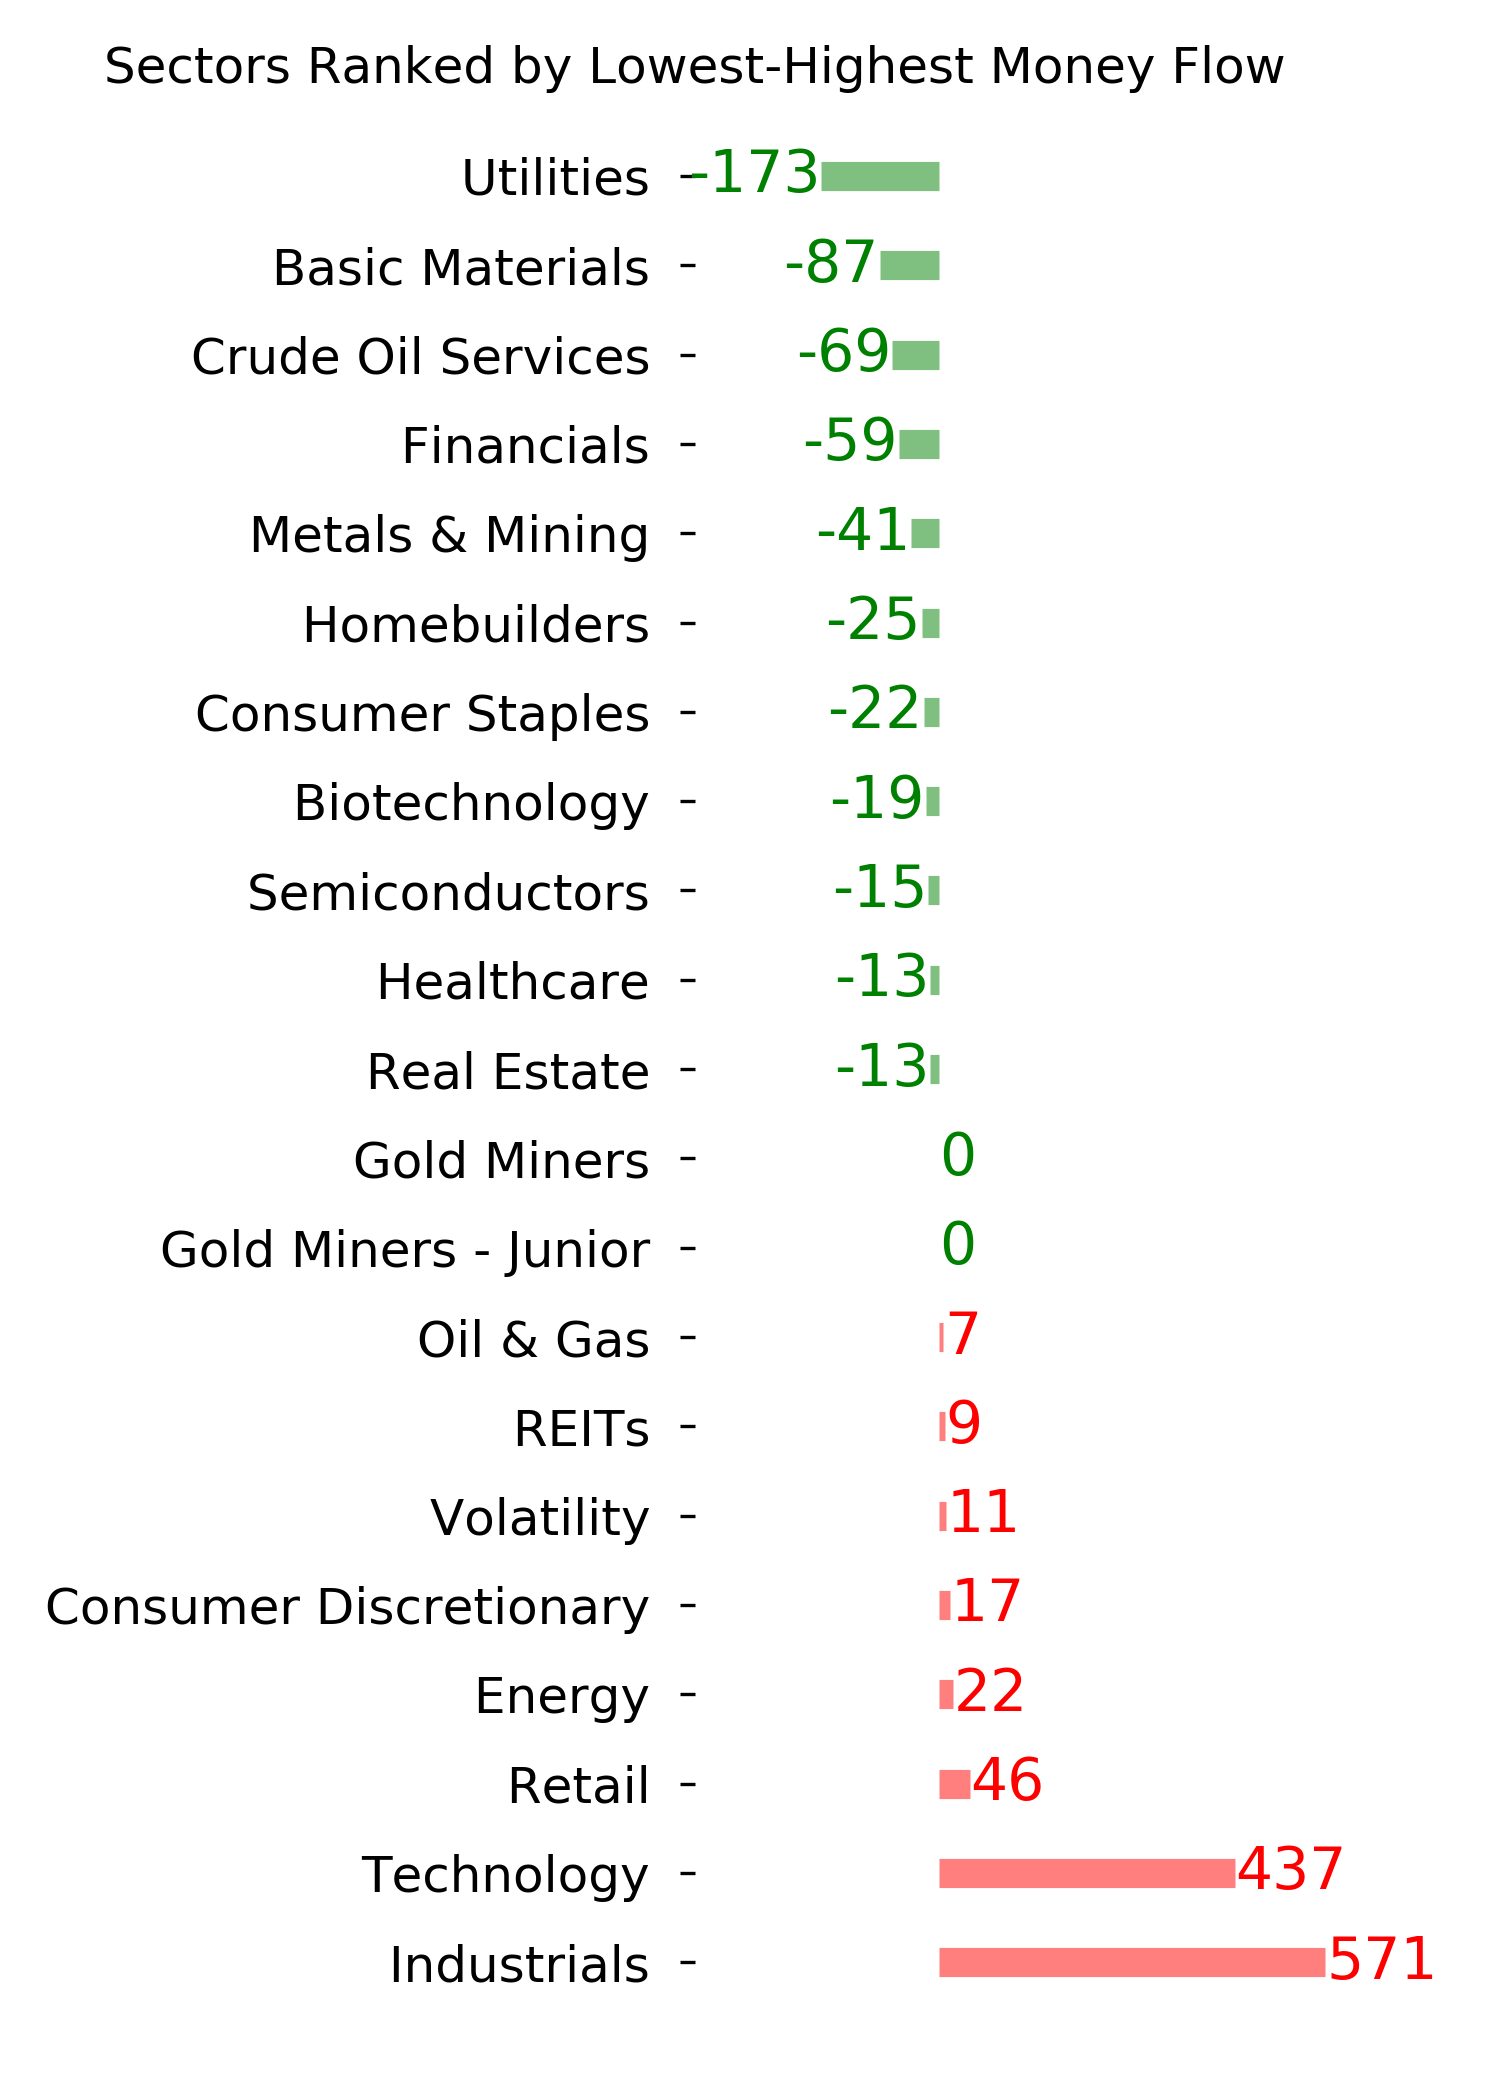
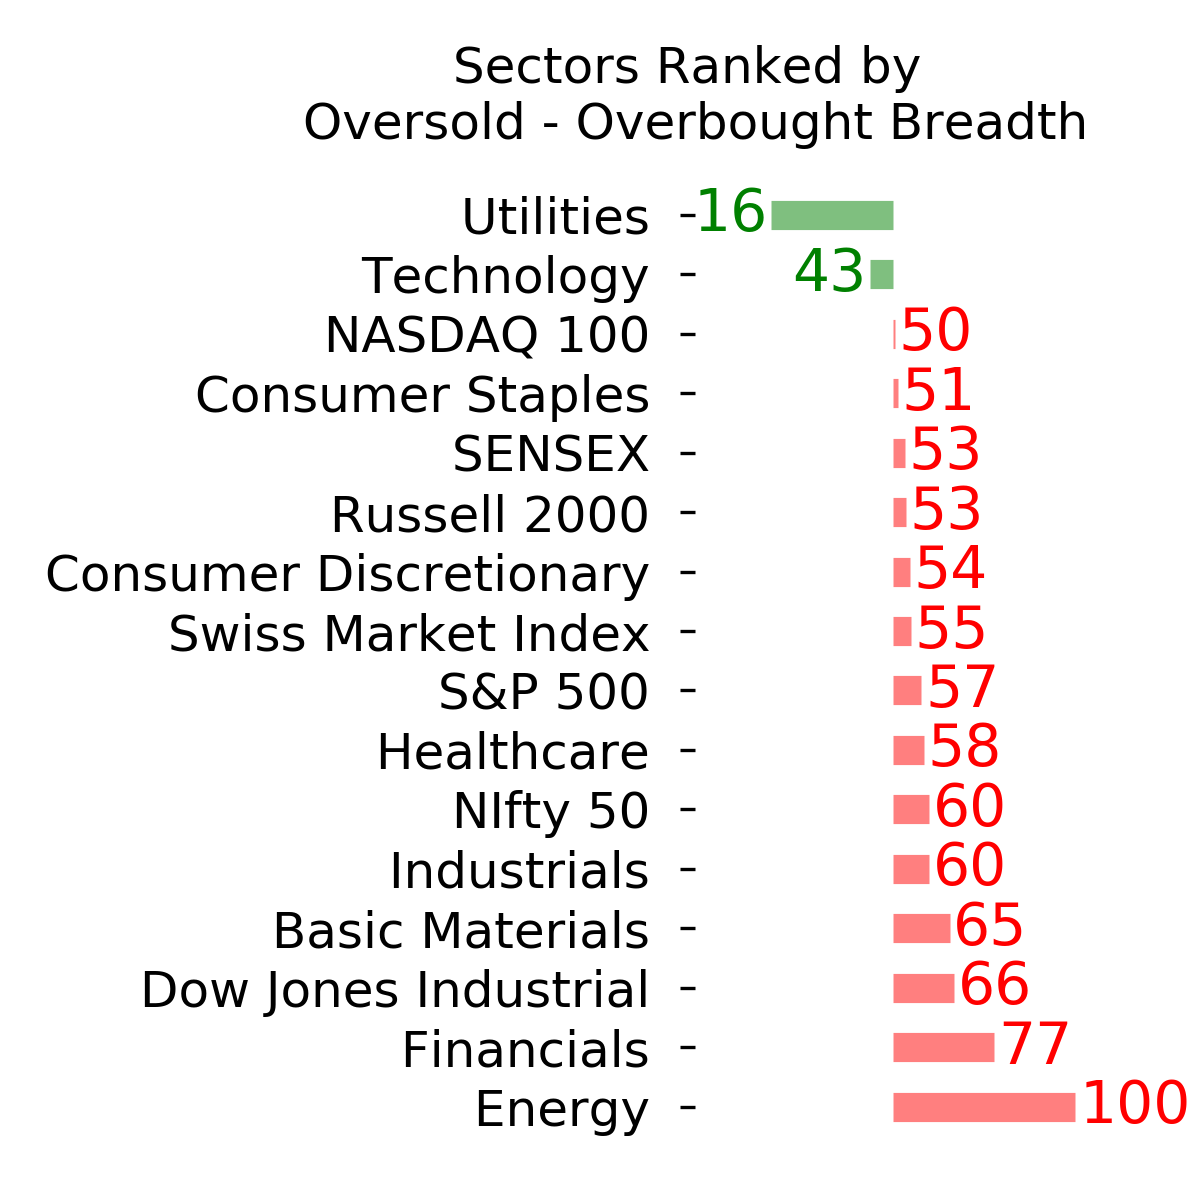
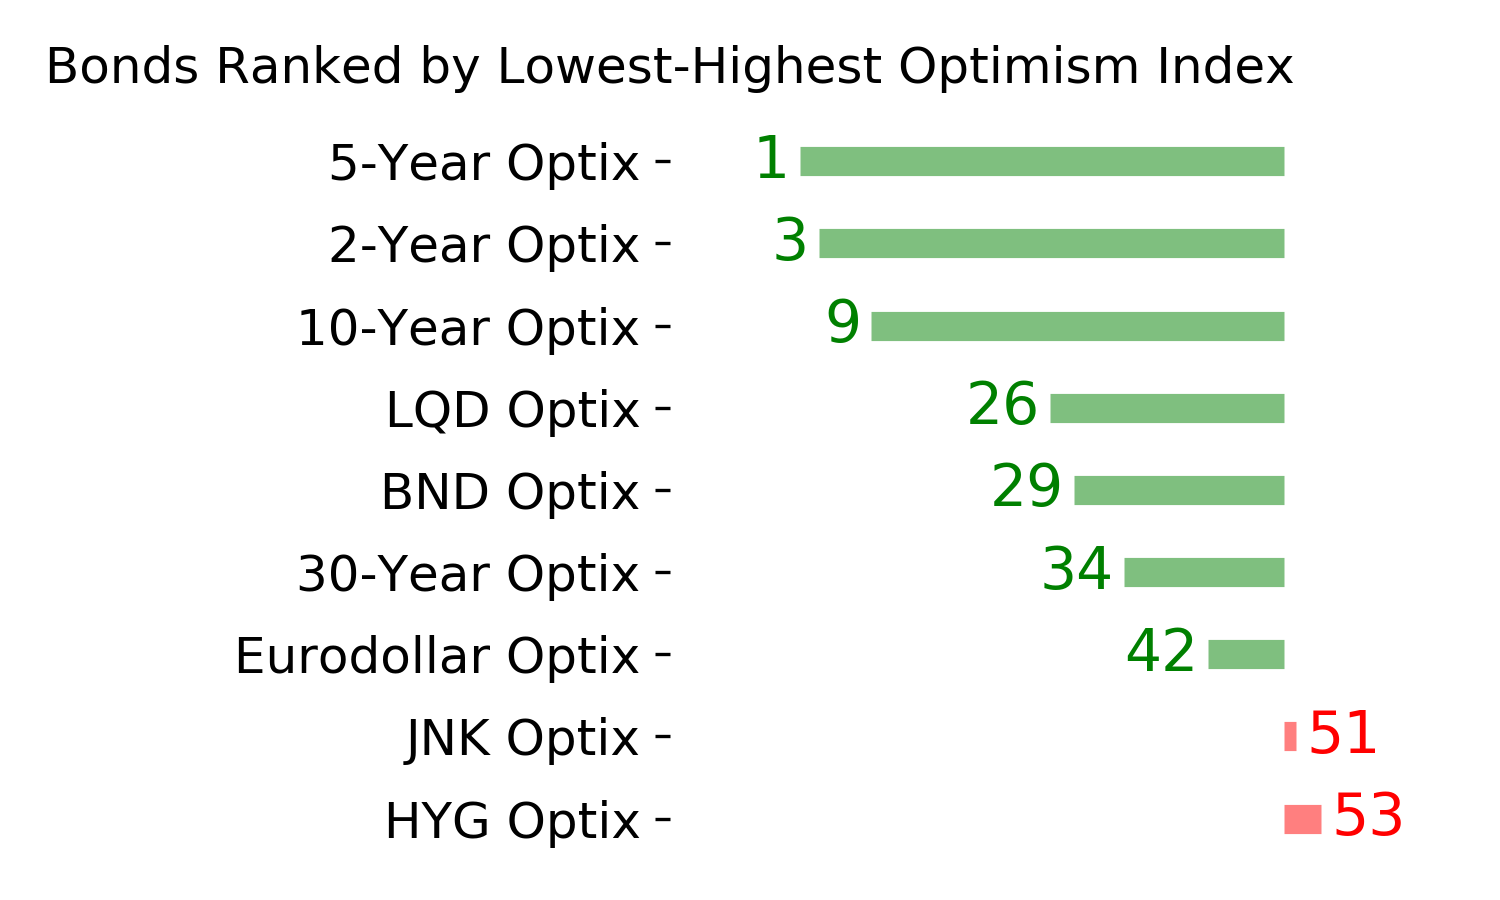
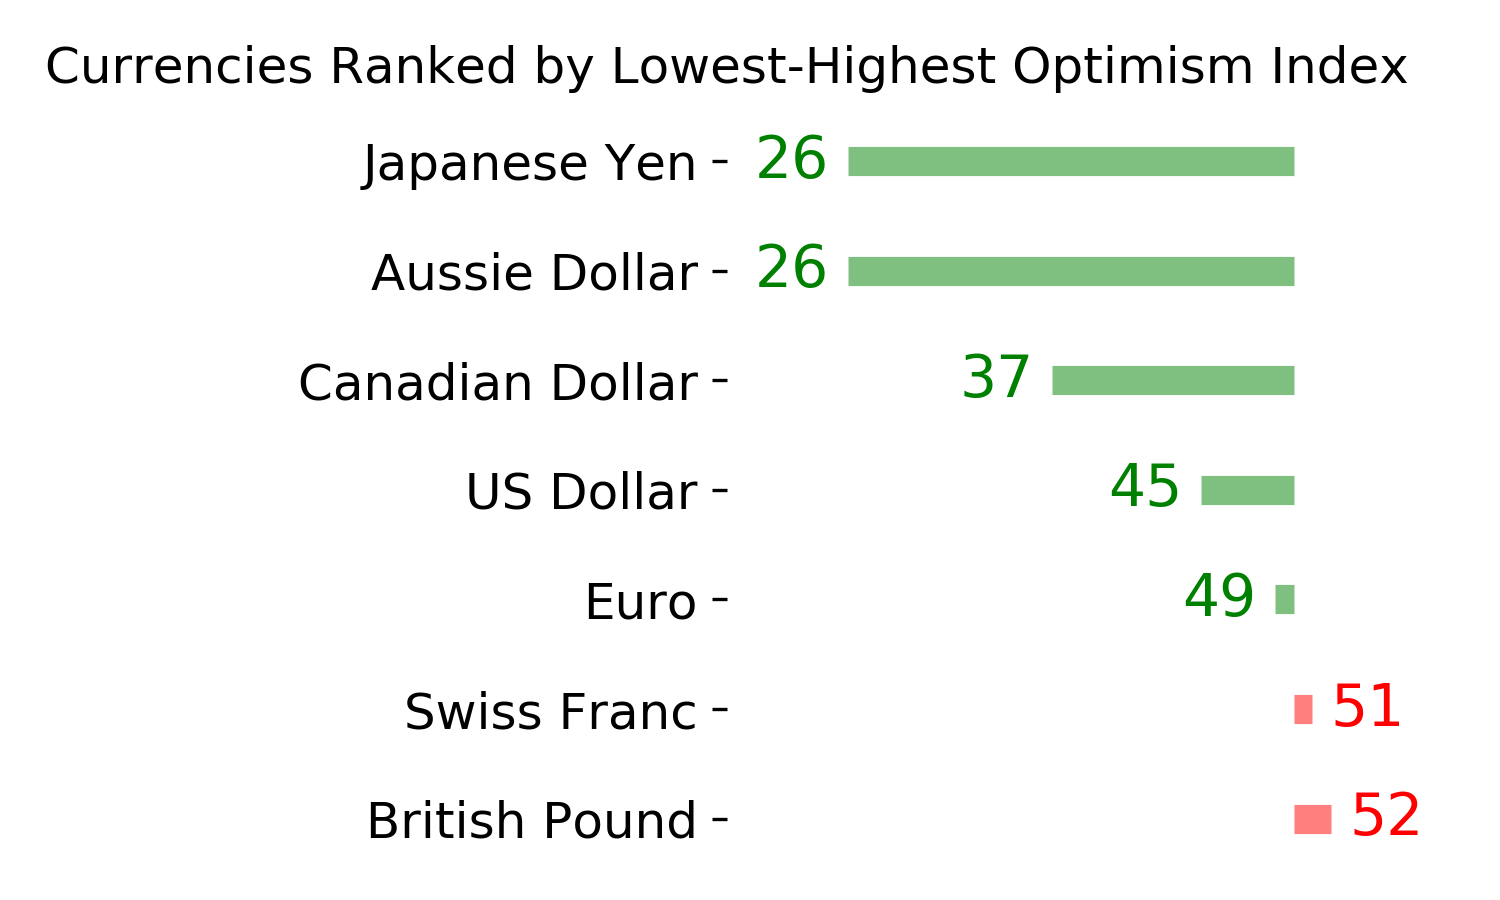
Ranks
|
|
|
|
|
|
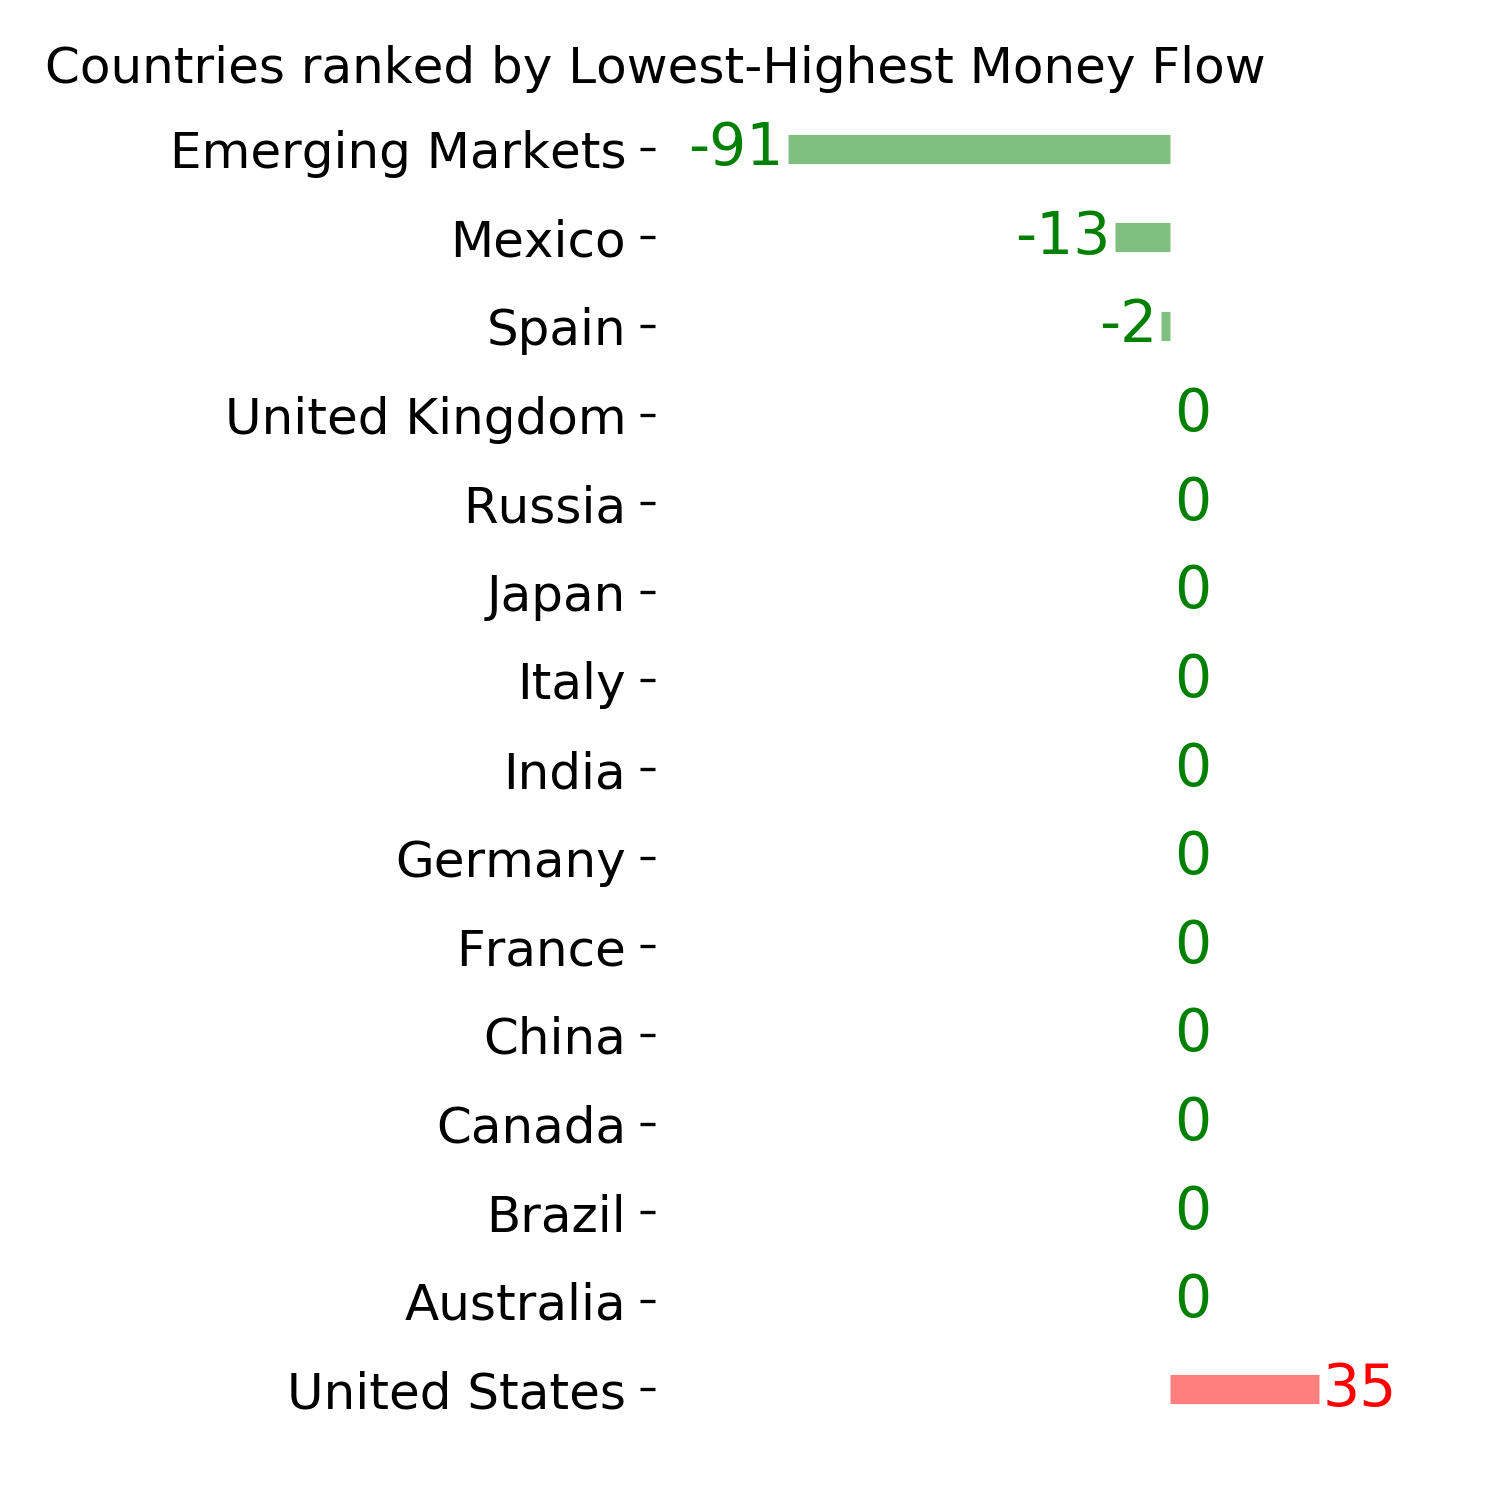
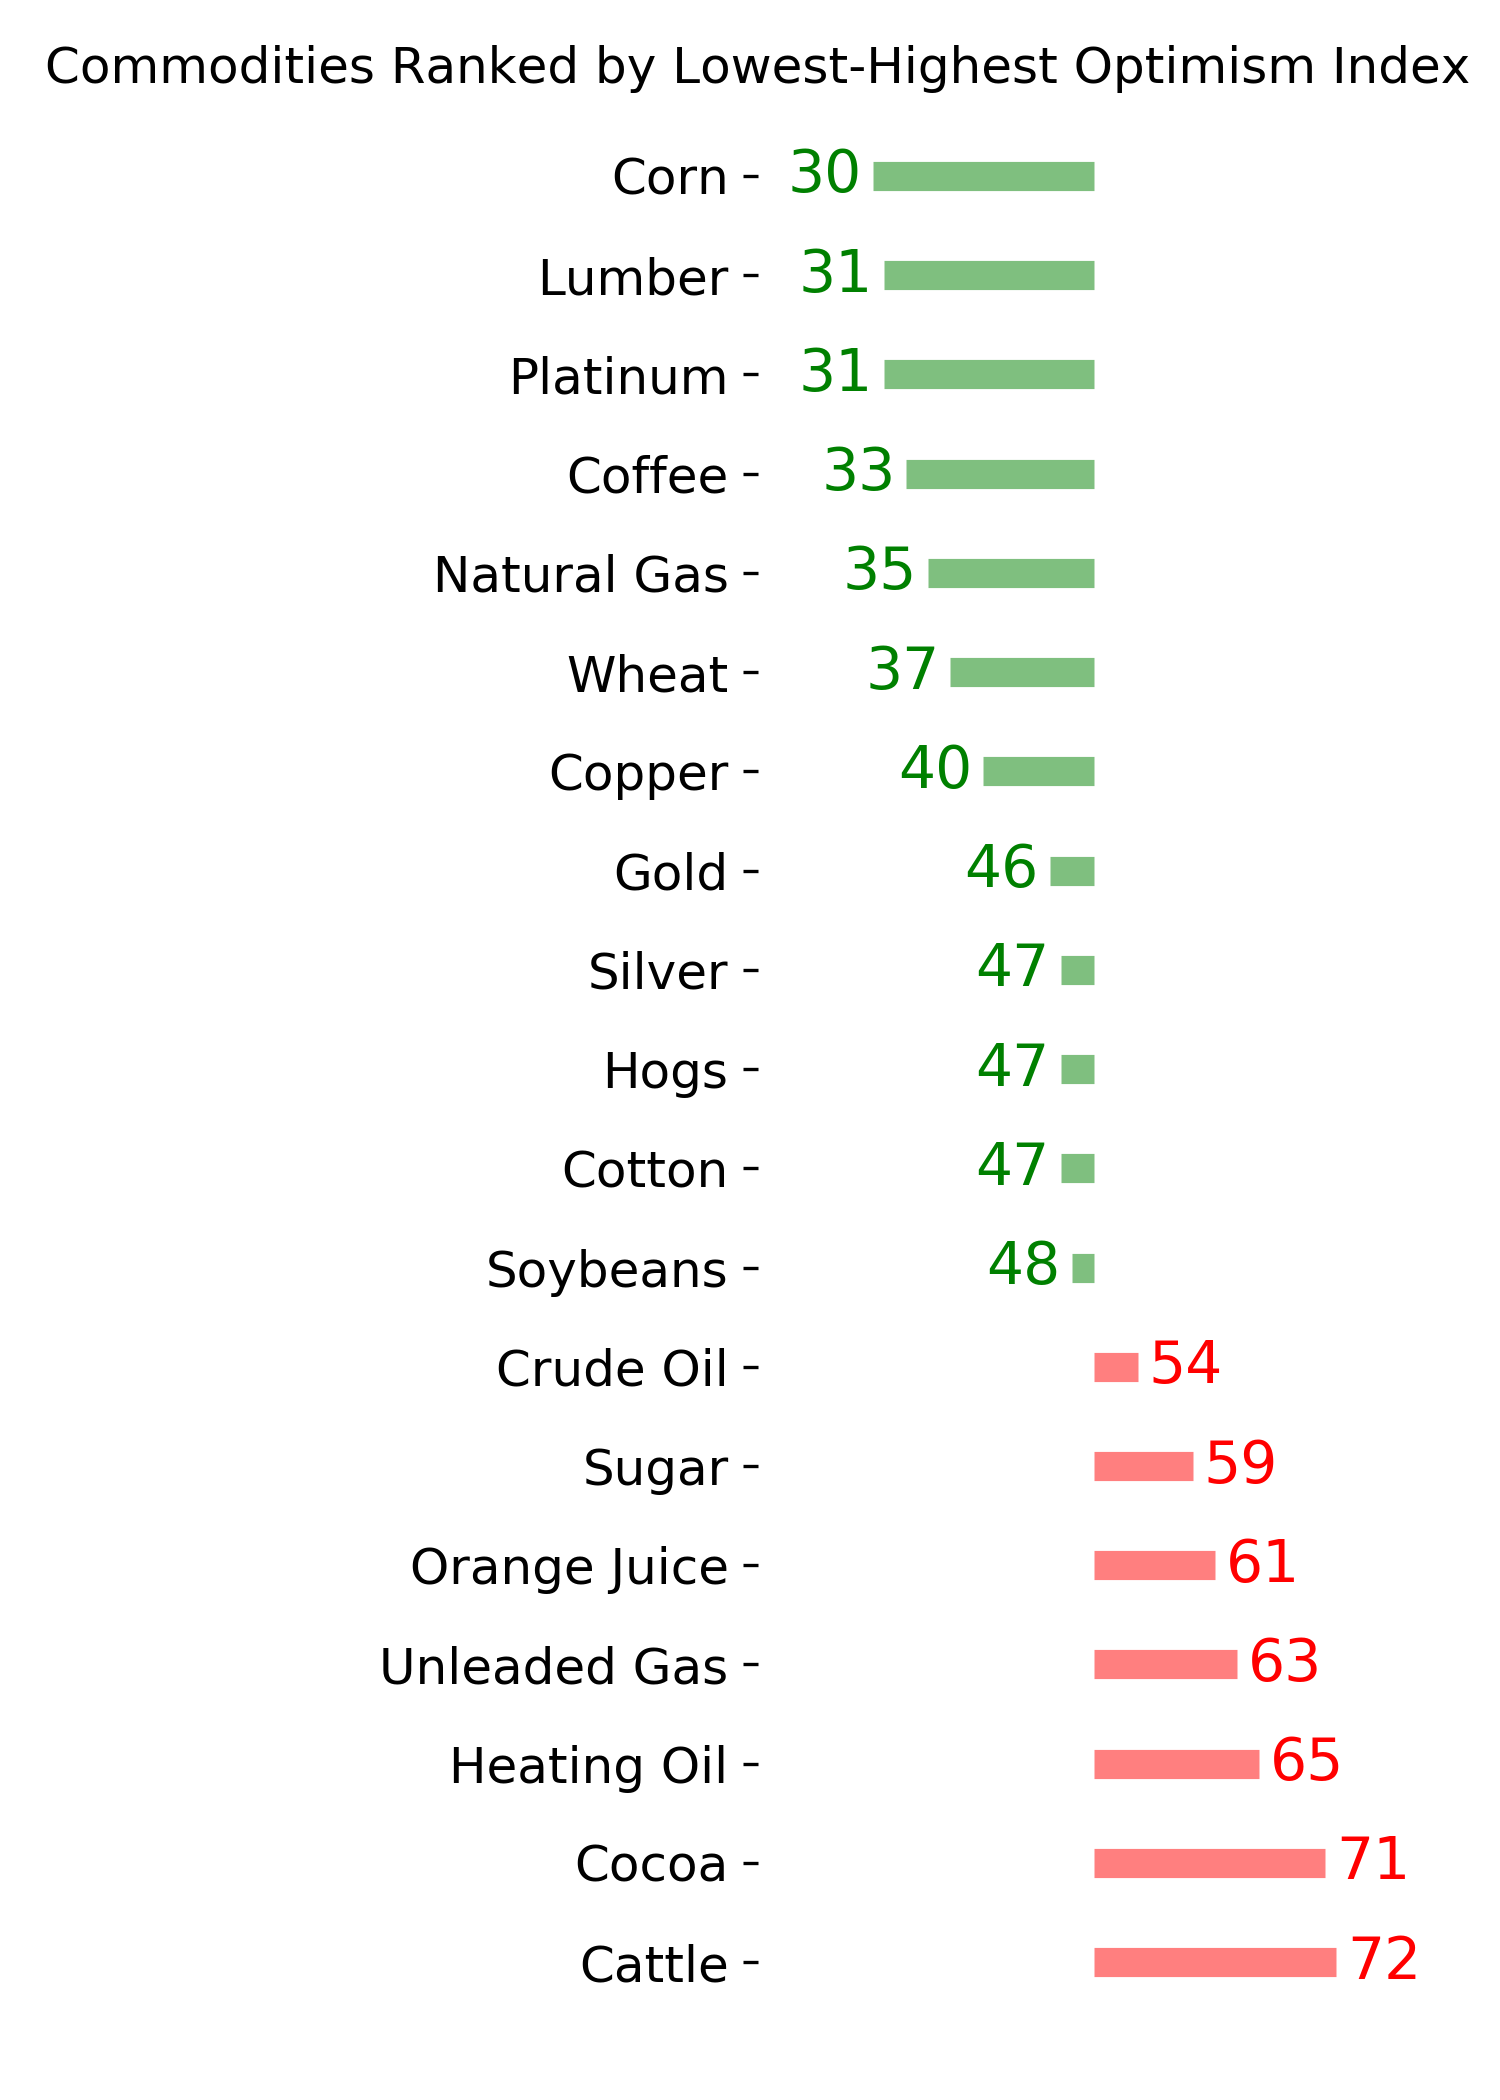
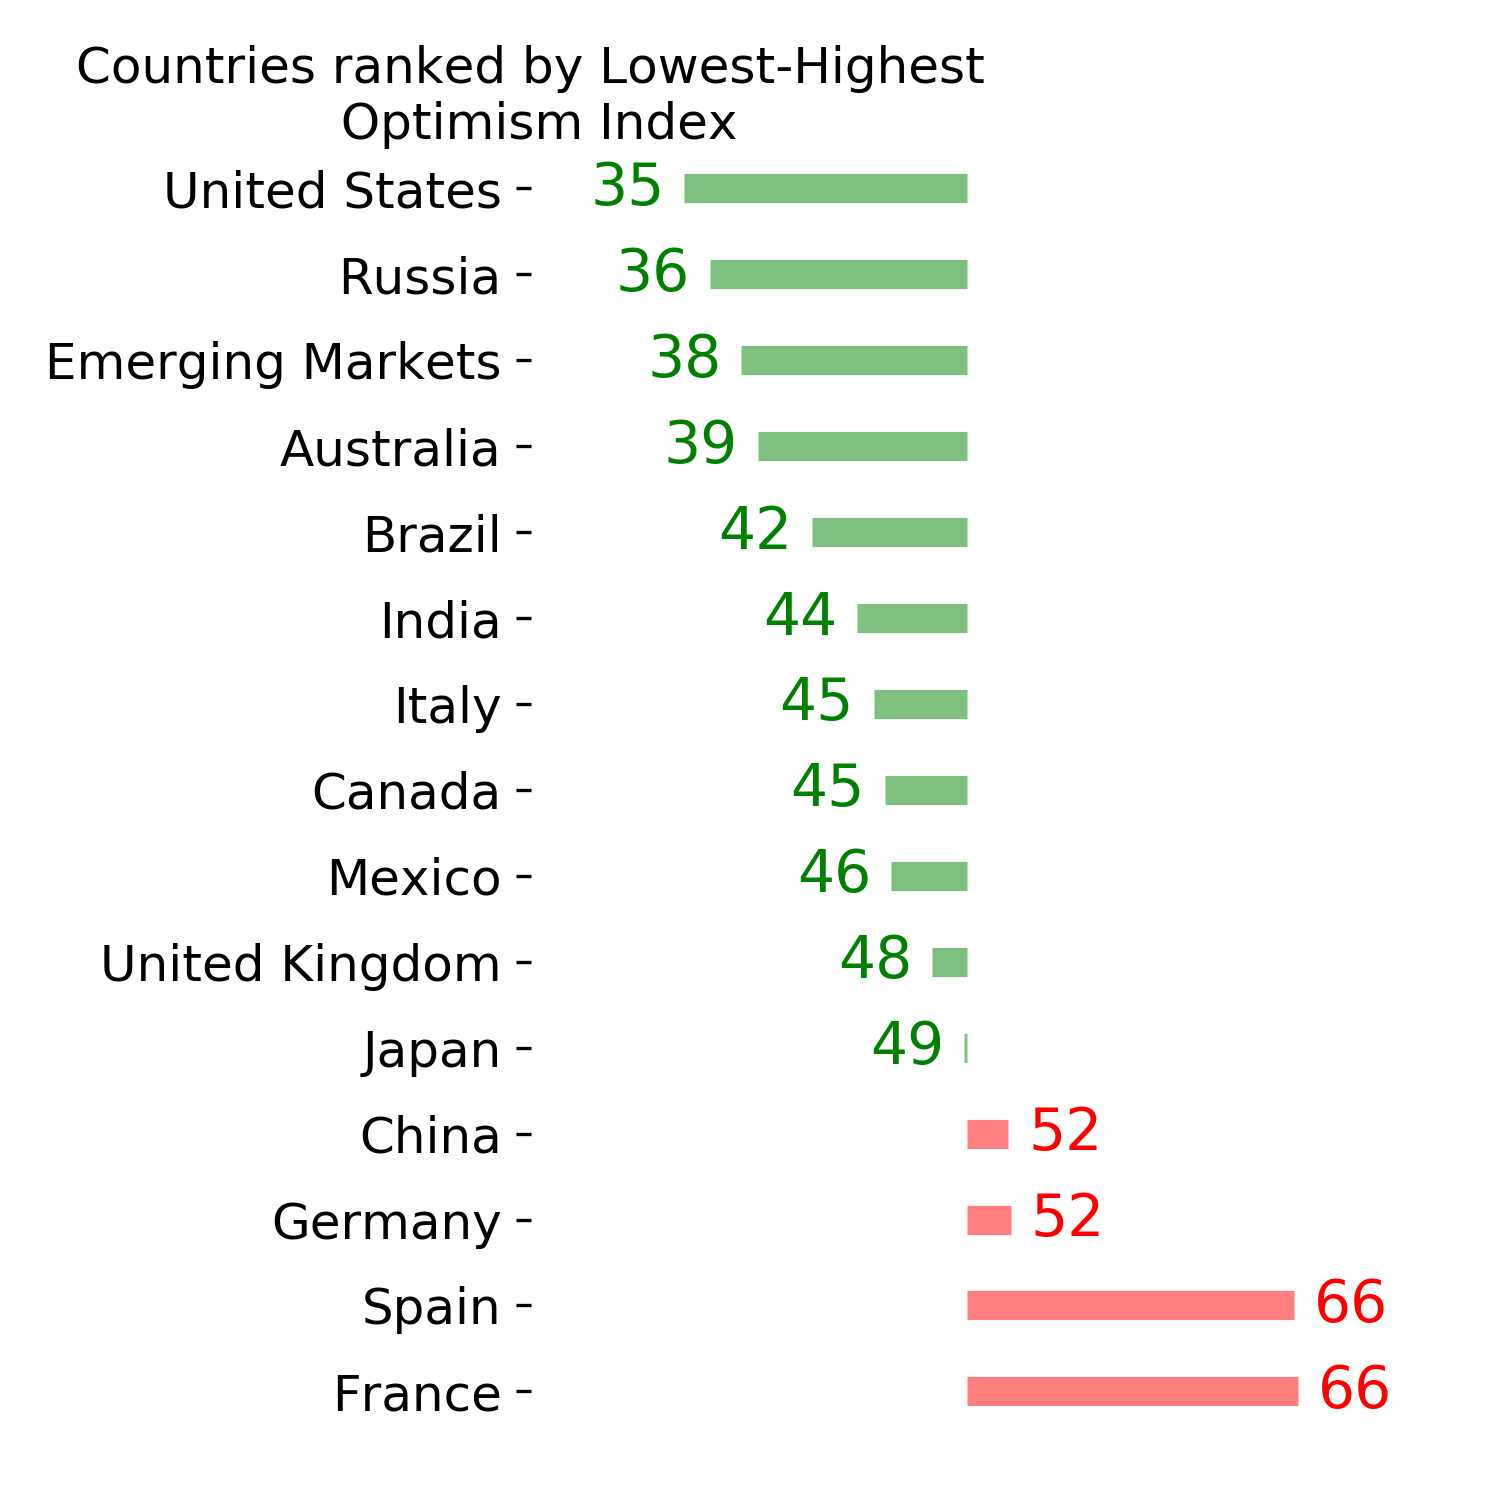
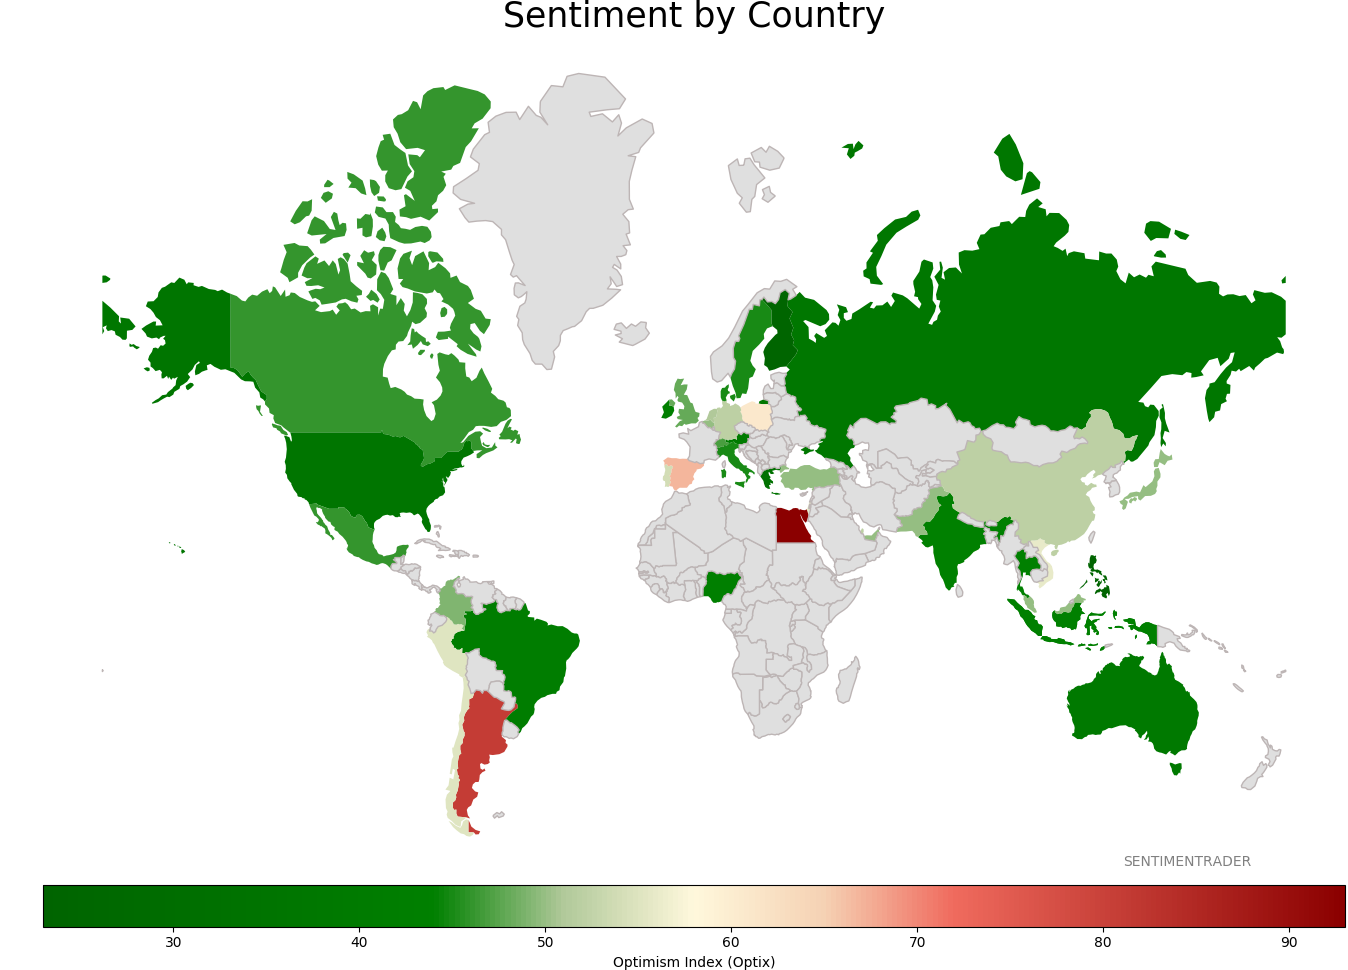
Sentiment Around The World
|
|
|
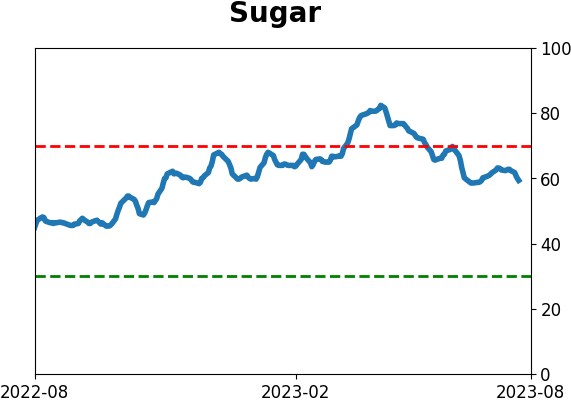
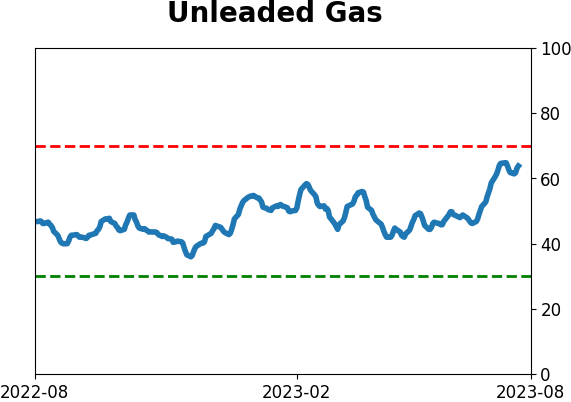
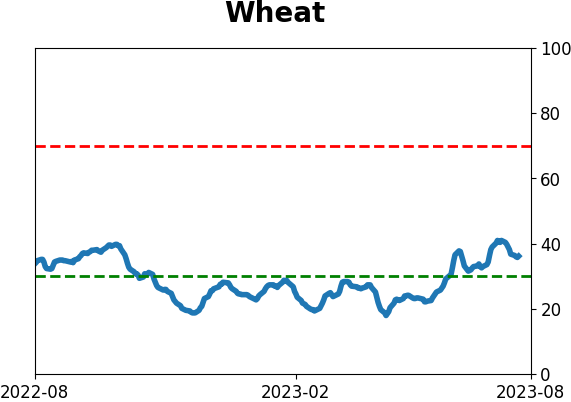
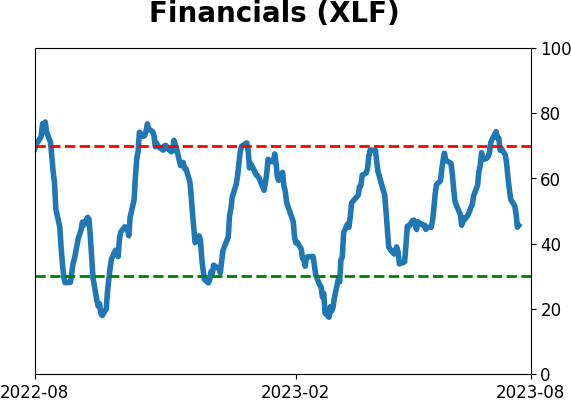
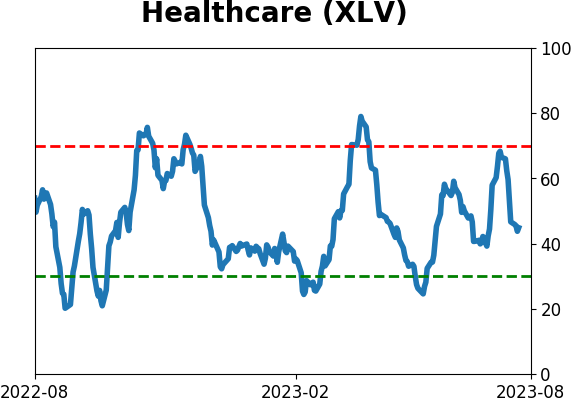
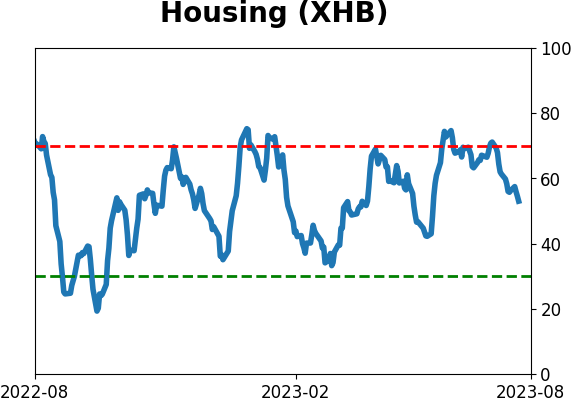
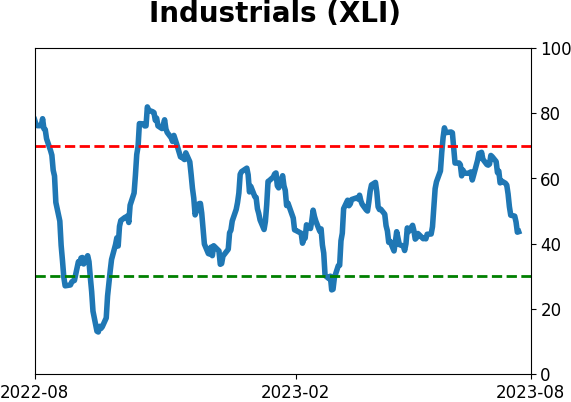
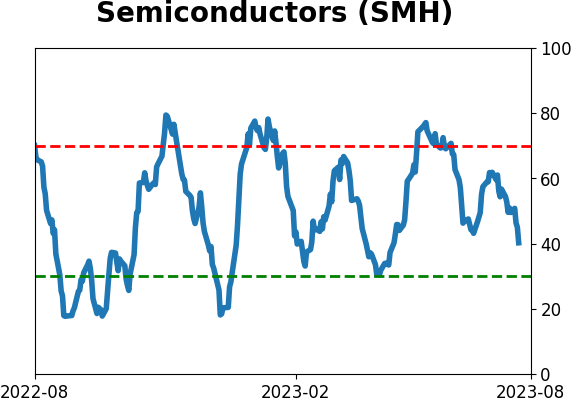
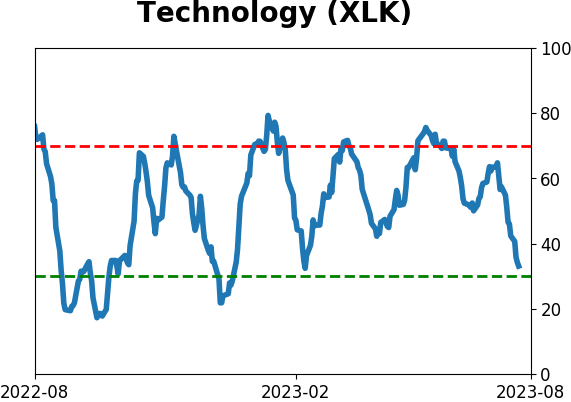
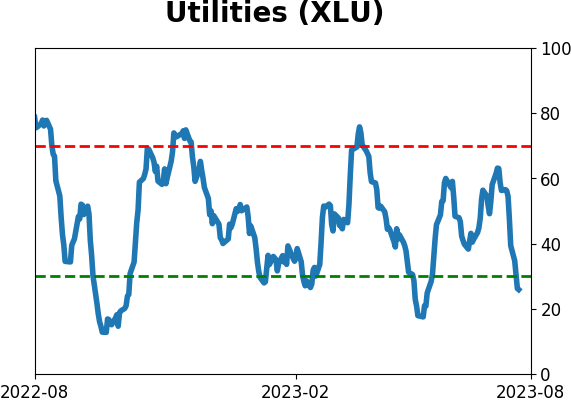
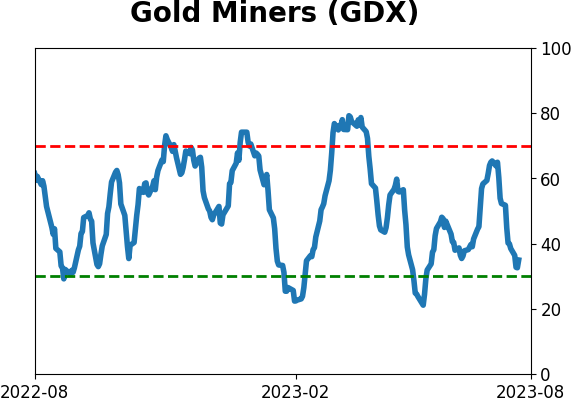
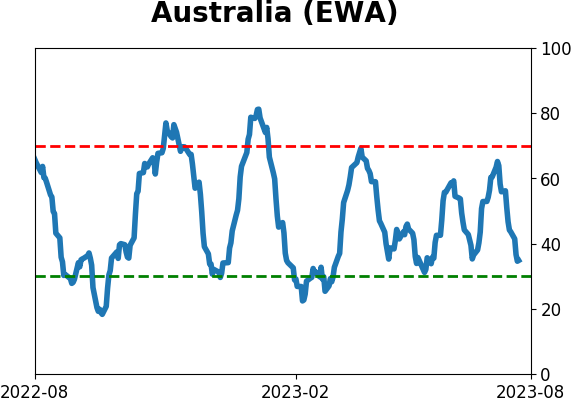
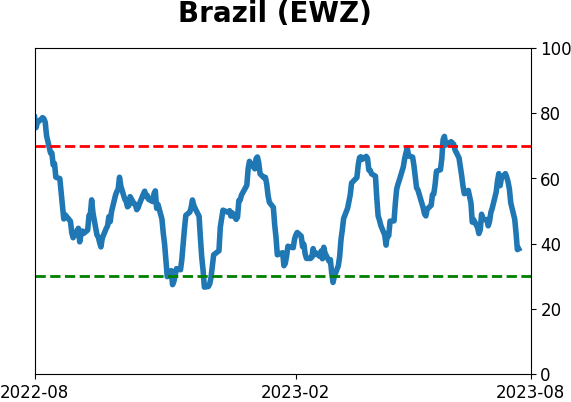
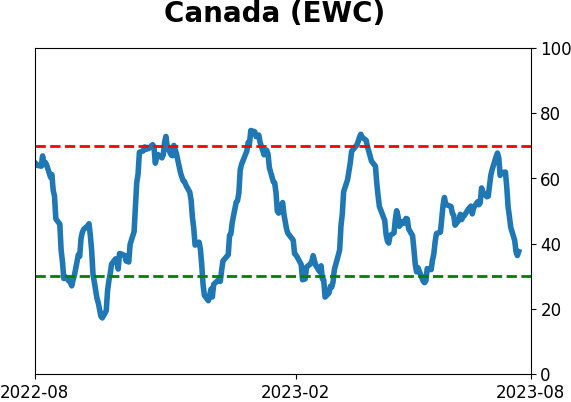
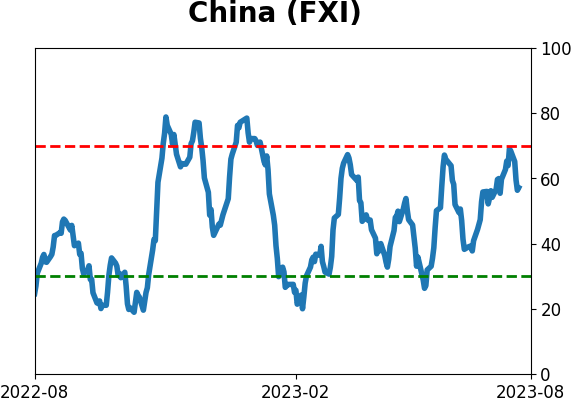
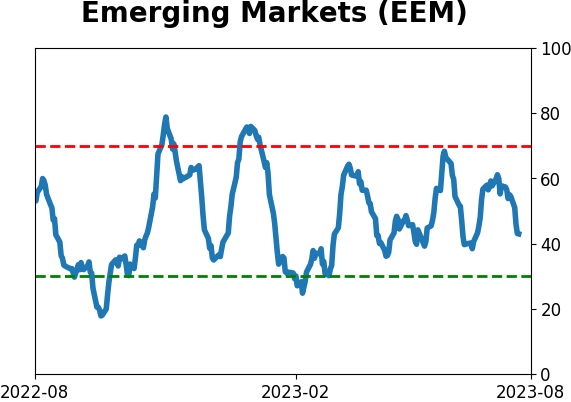
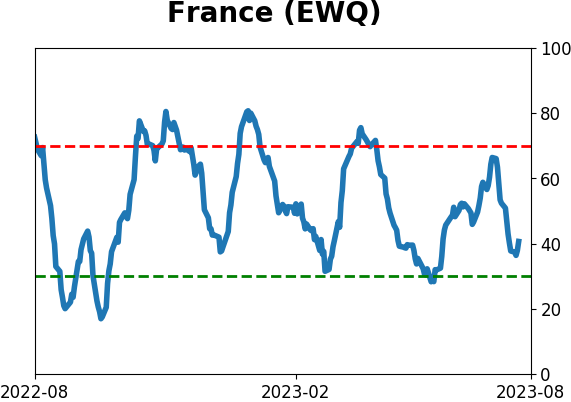
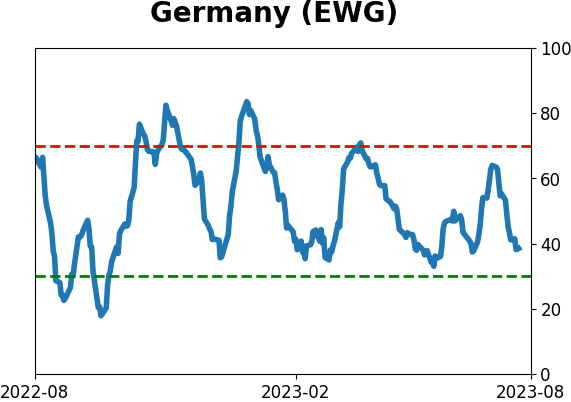
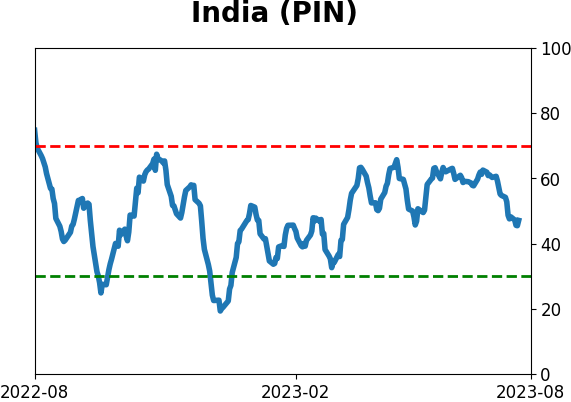
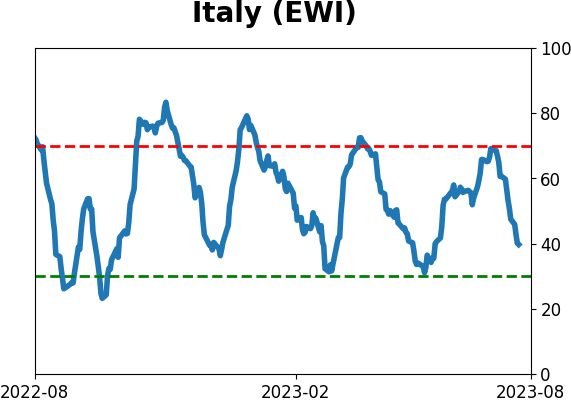
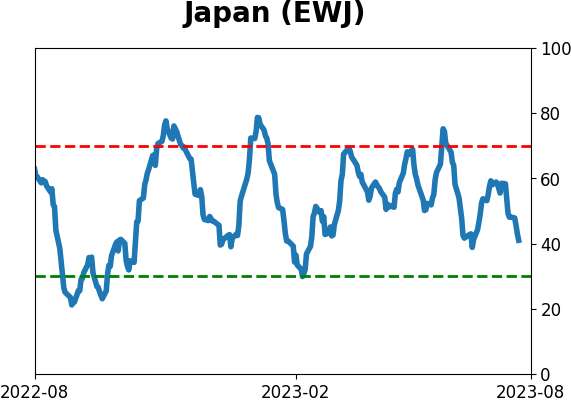
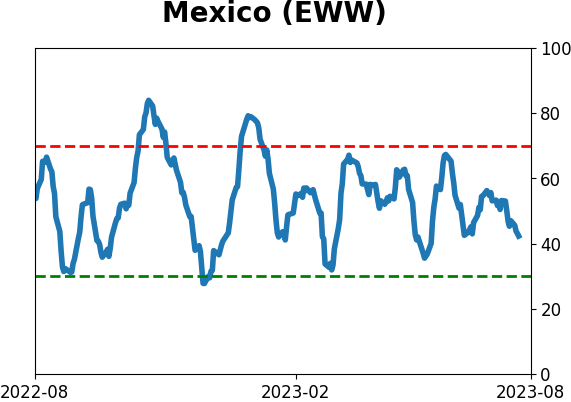
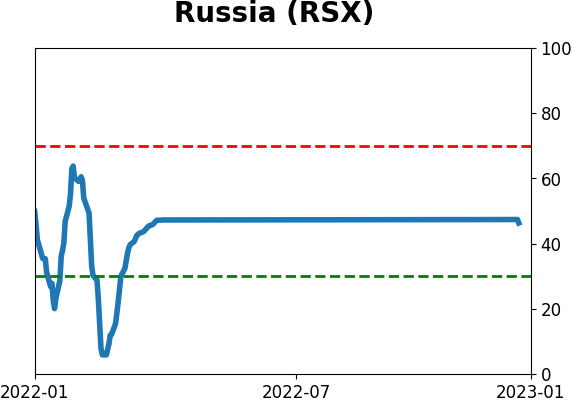
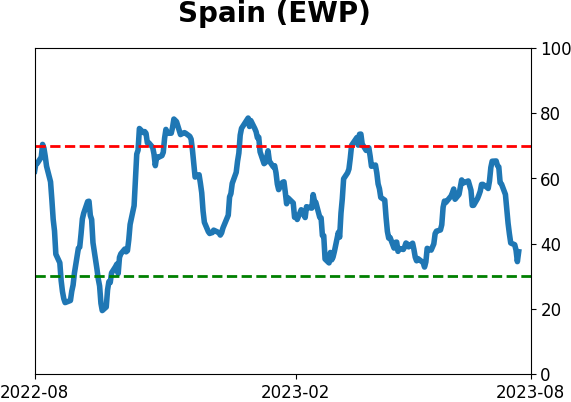
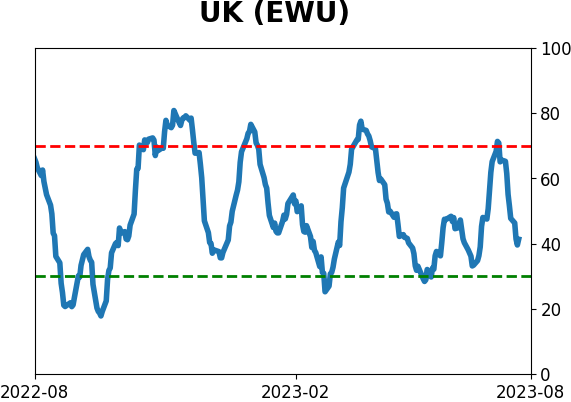
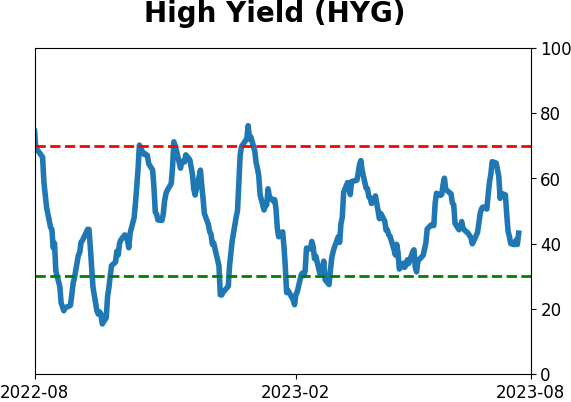
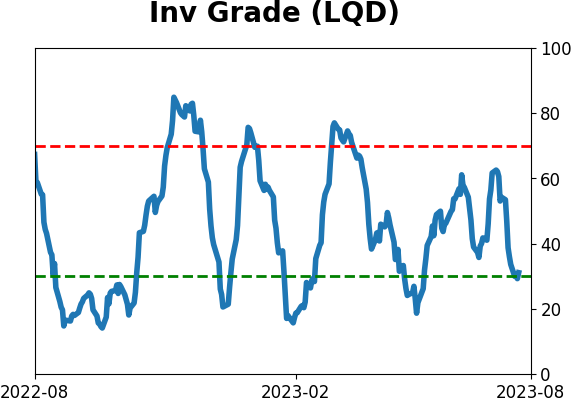
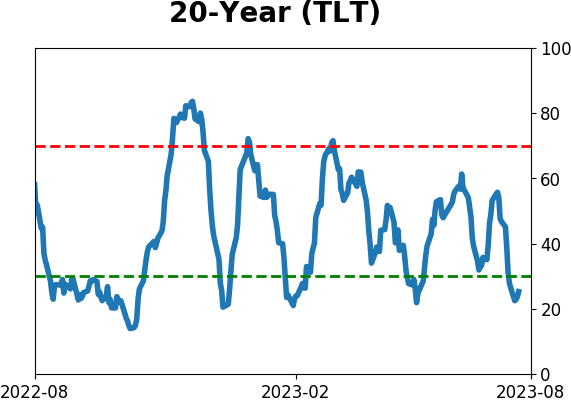
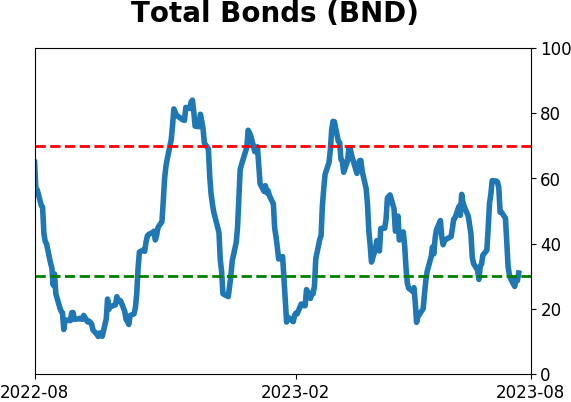
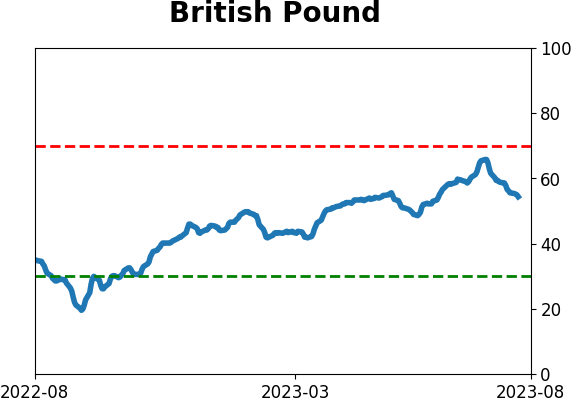
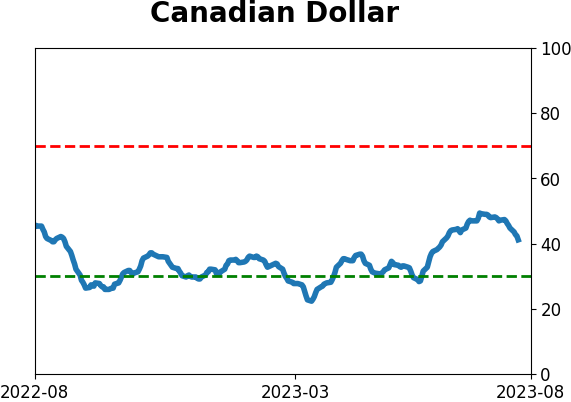
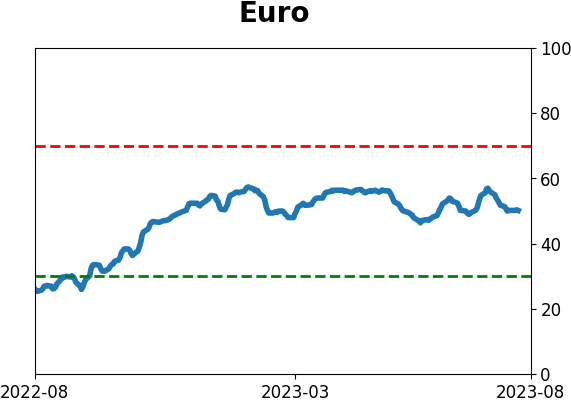
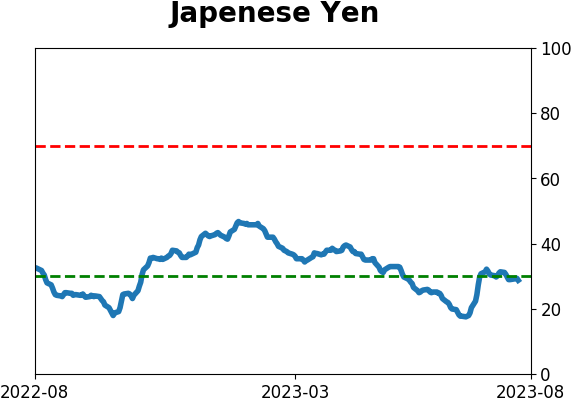
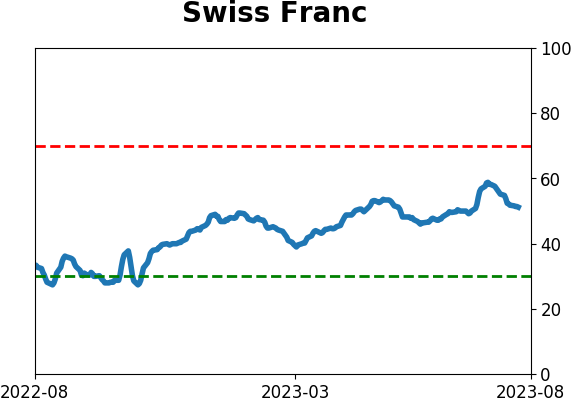
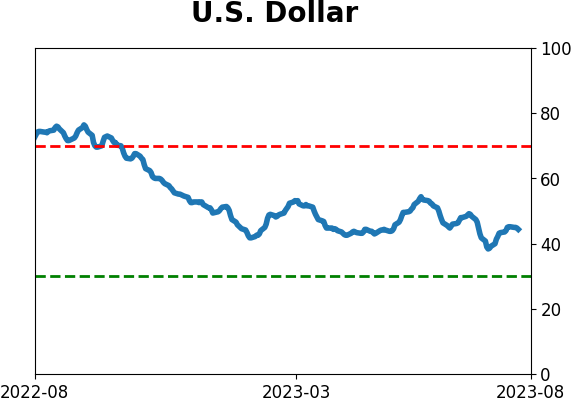
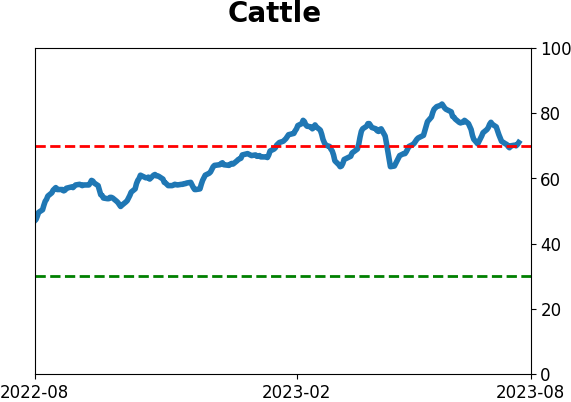
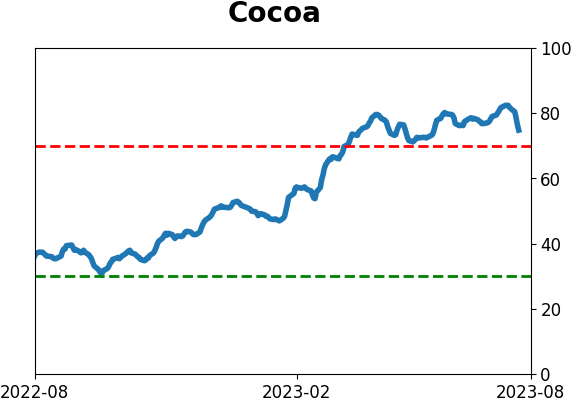
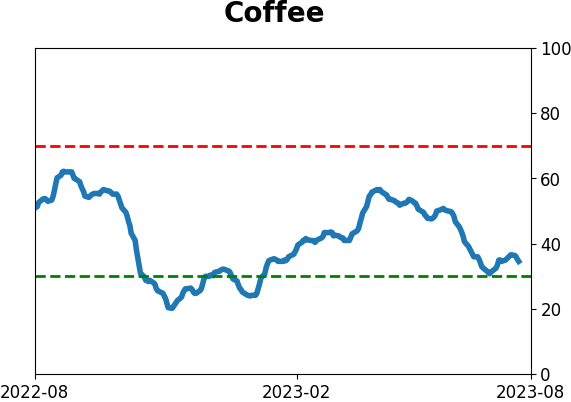
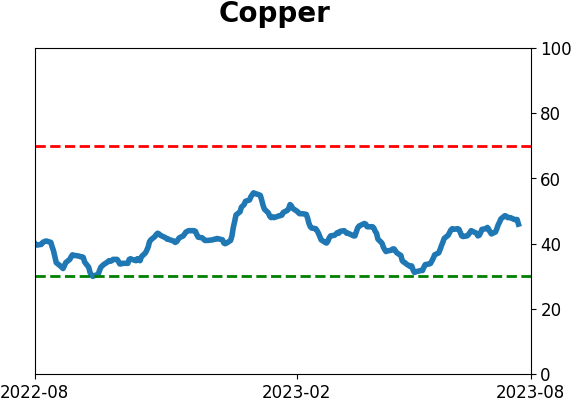
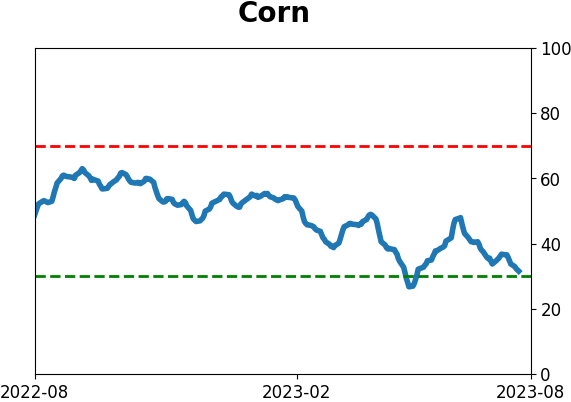
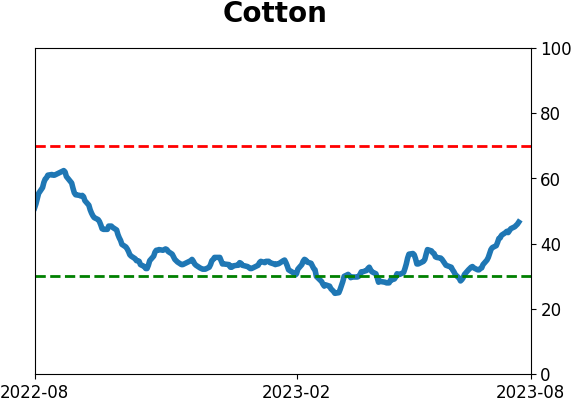
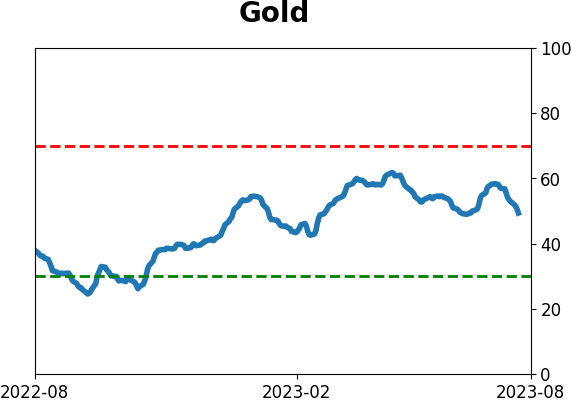
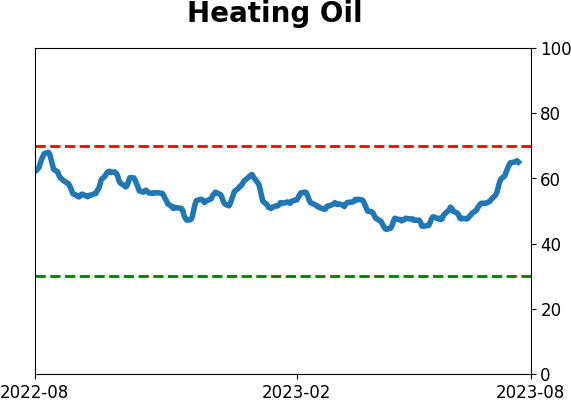
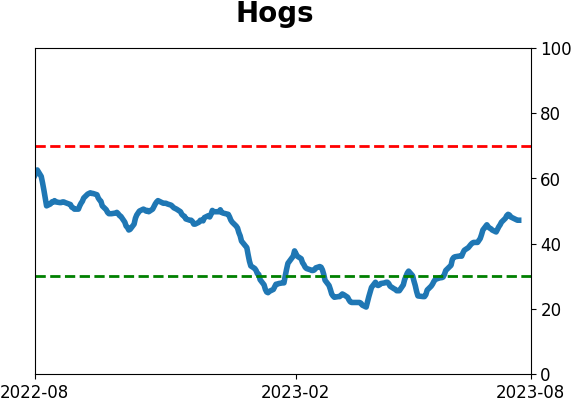
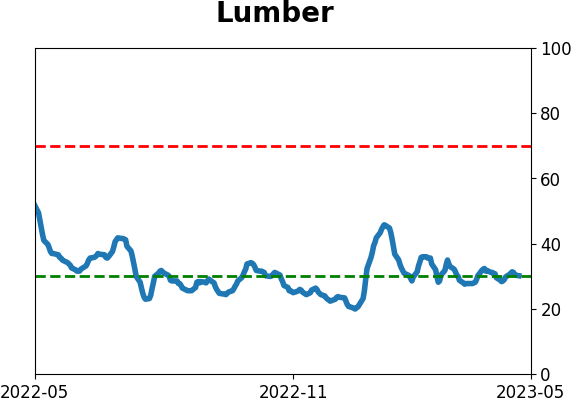
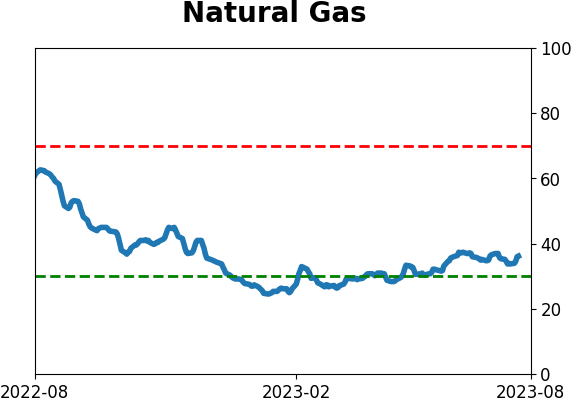
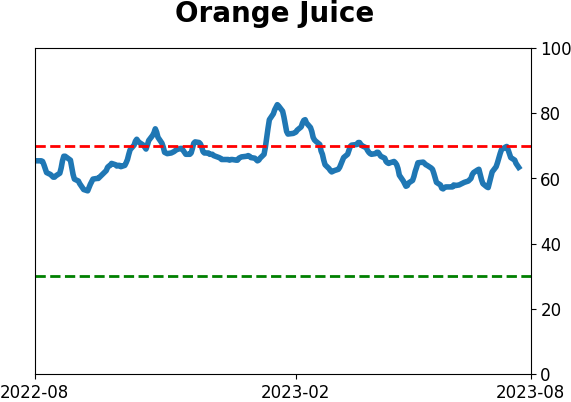
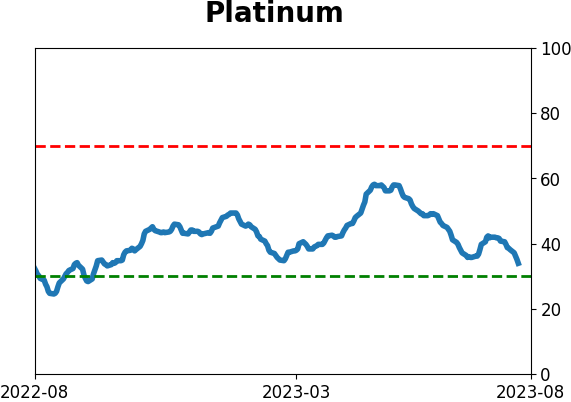
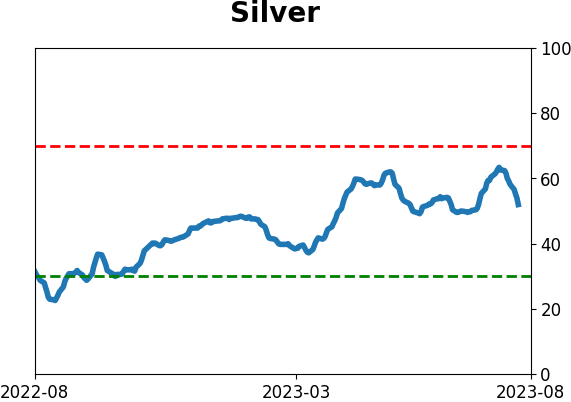
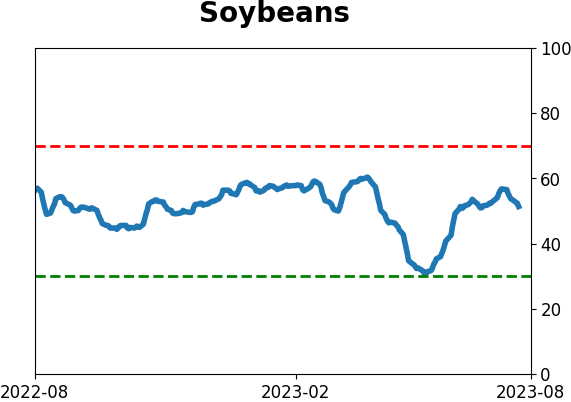
Optimism Index Thumbnails
|
|
|
|
|
|
|
|
|
|
|
|
|
|
|
|
|
|
|
|
|