Daily Report : Weekly recap - Macro deterioration, topping pattern (?), weak PMI

| View/Print a PDF version of this Report |
Headlines
|
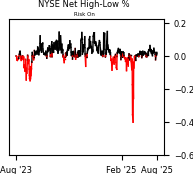
Weekly recap - Macro deterioration, topping pattern (?), weak PMI: This week, we saw that macro conditions have deteriorated but remain in barely healthy territory. The most recent breakout in stocks got hit with consistent selling pressure, but that's an unreliable topping pattern. PMI activity is weak, but again, that has been a poor excuse to sell. A couple of bitcoin systems show mostly healthy activity. |
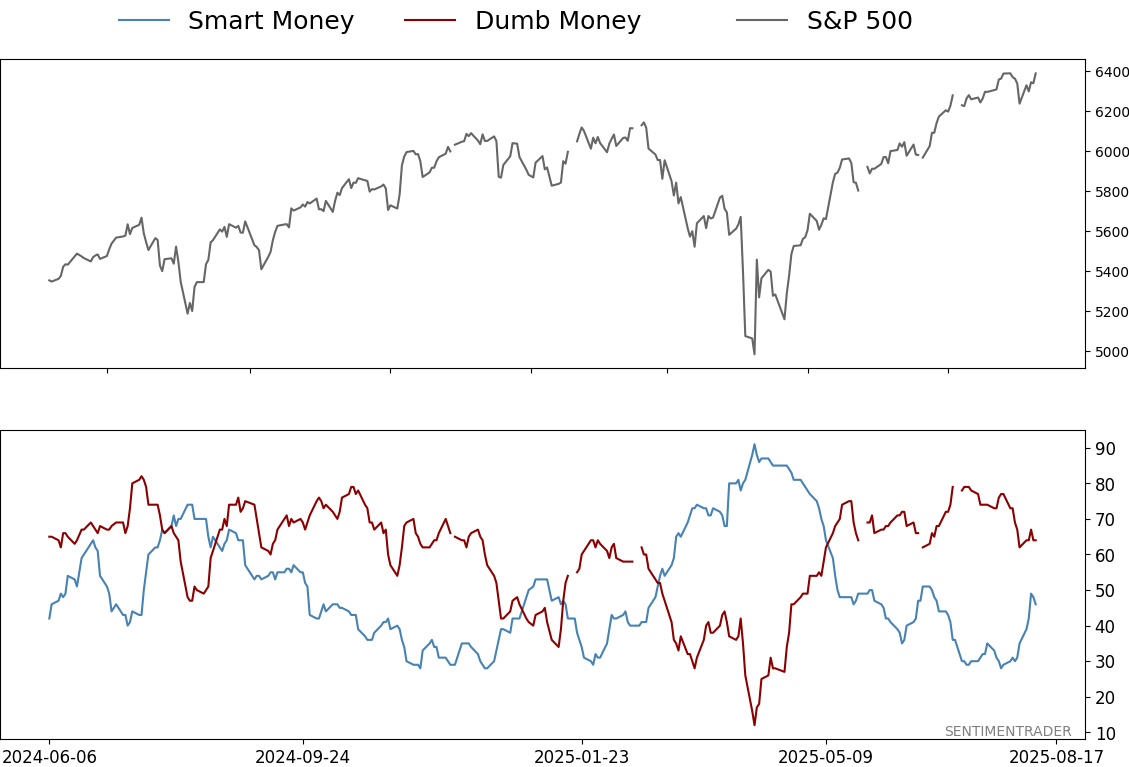
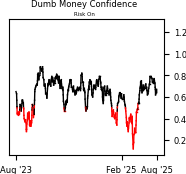
Smart / Dumb Money Confidence
|
|
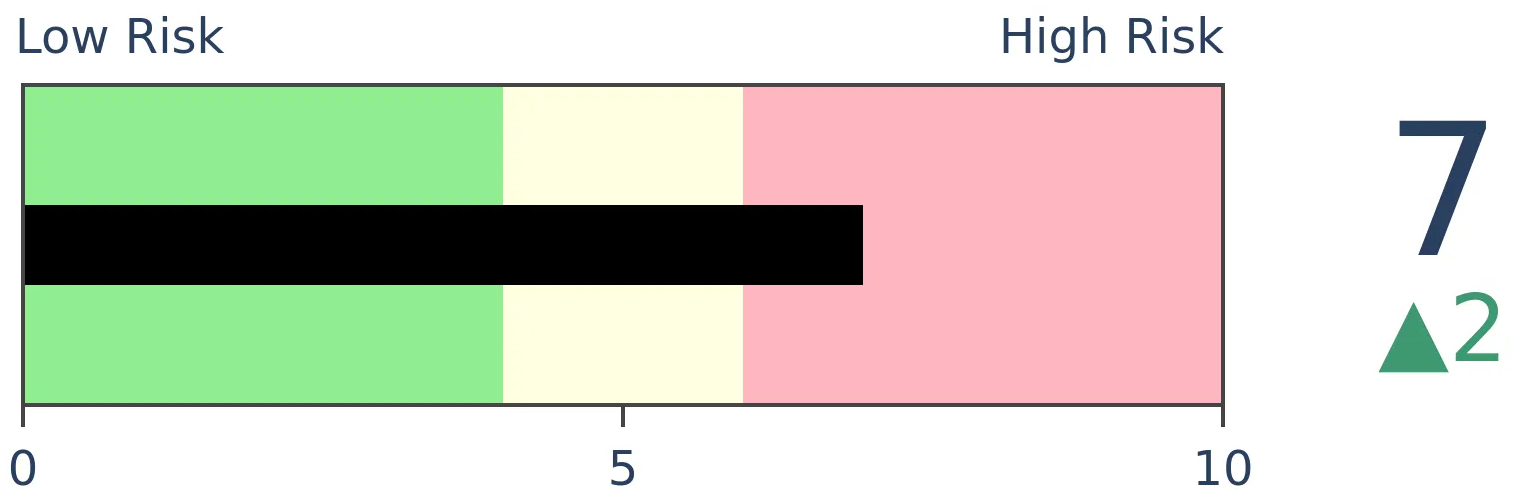
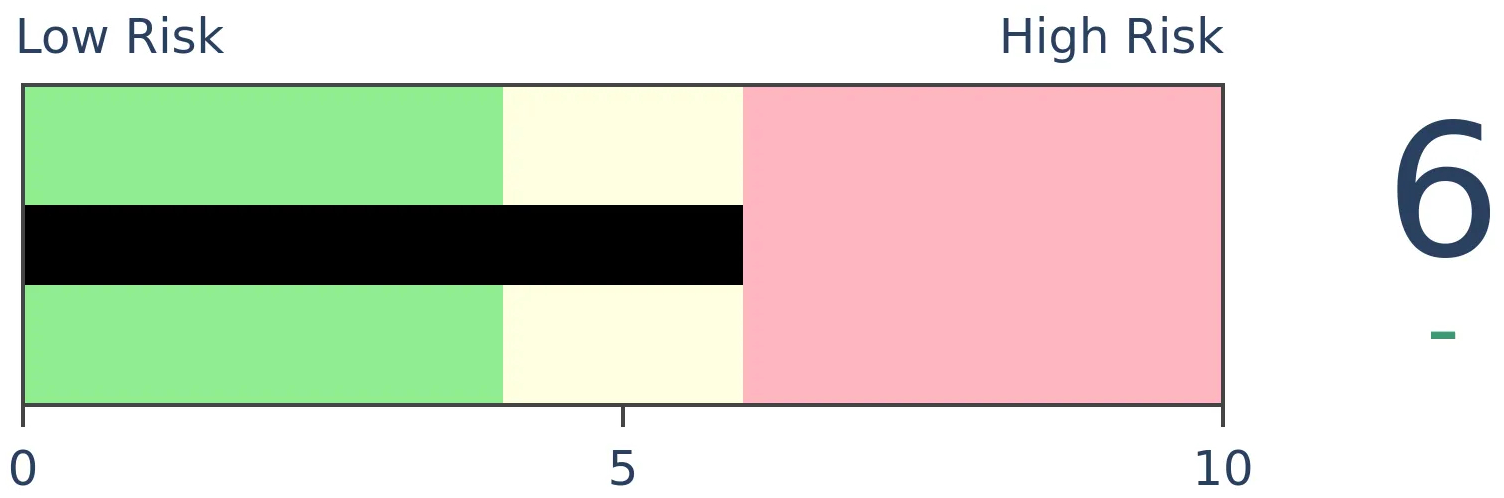
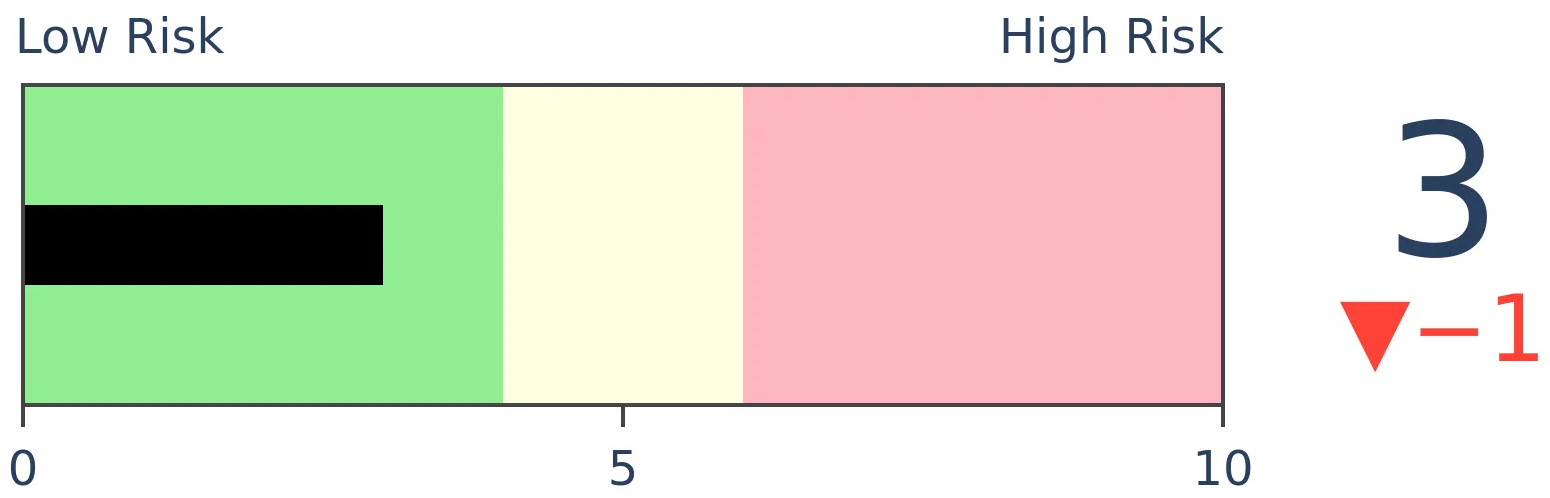
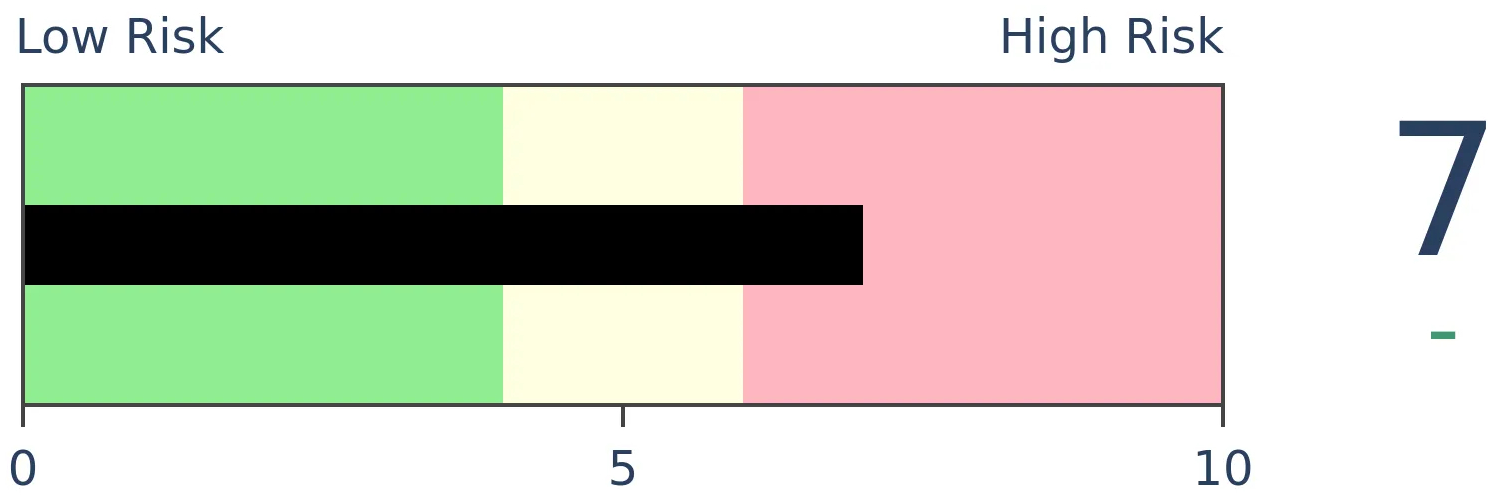
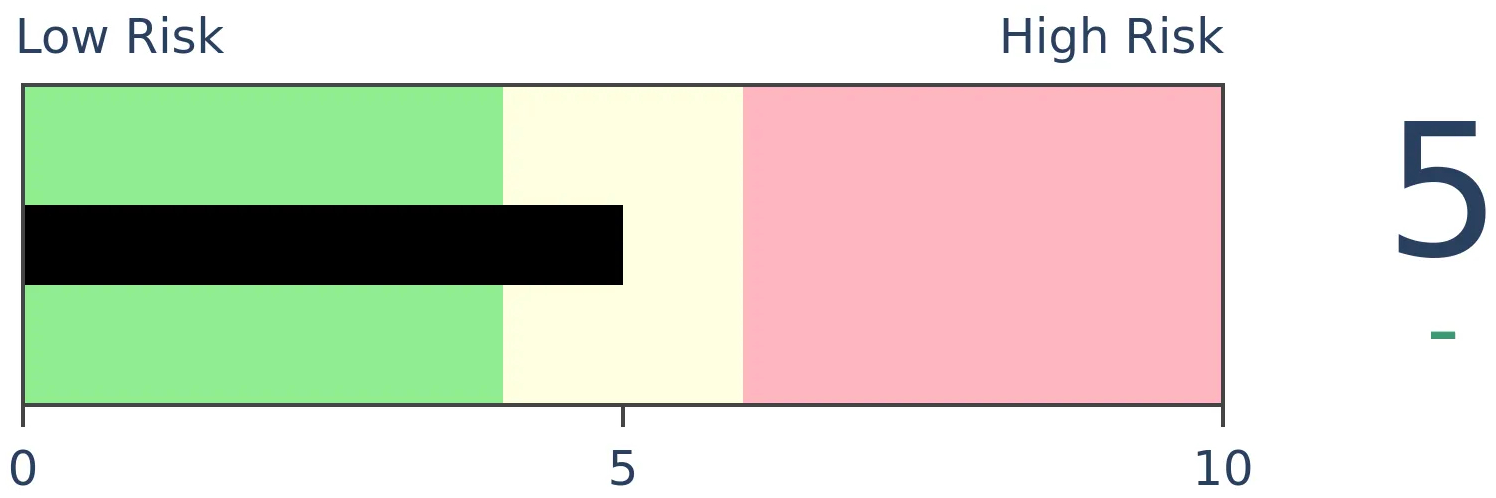
Risk Levels
|
|

|
Research
Weekly recap - Macro deterioration, topping pattern (?), weak PMIBy Jason GoepfertBOTTOM LINEThis week, we saw that macro conditions have deteriorated but remain in barely healthy territory. The most recent breakout in stocks got hit with consistent selling pressure, but that's an unreliable topping pattern. PMI activity is weak, but again, that has been a poor excuse to sell. A couple of bitcoin systems show mostly healthy activity. FORECAST / TIMEFRAME |
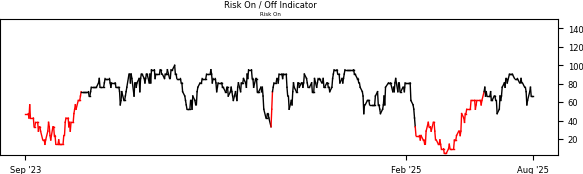
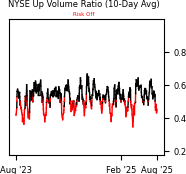
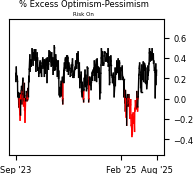
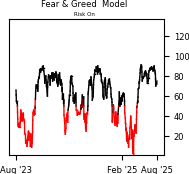
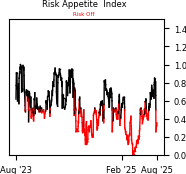
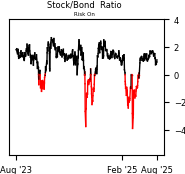
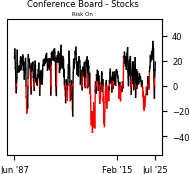
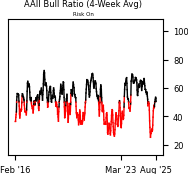
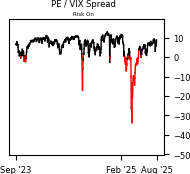
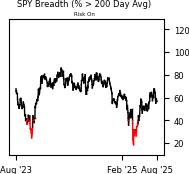
Sentiment Risk On / Risk Off Overview
| ||
|
|
|
|
|
|
|
|
|
|
|
|
Indicators at Extremes
|
|
|
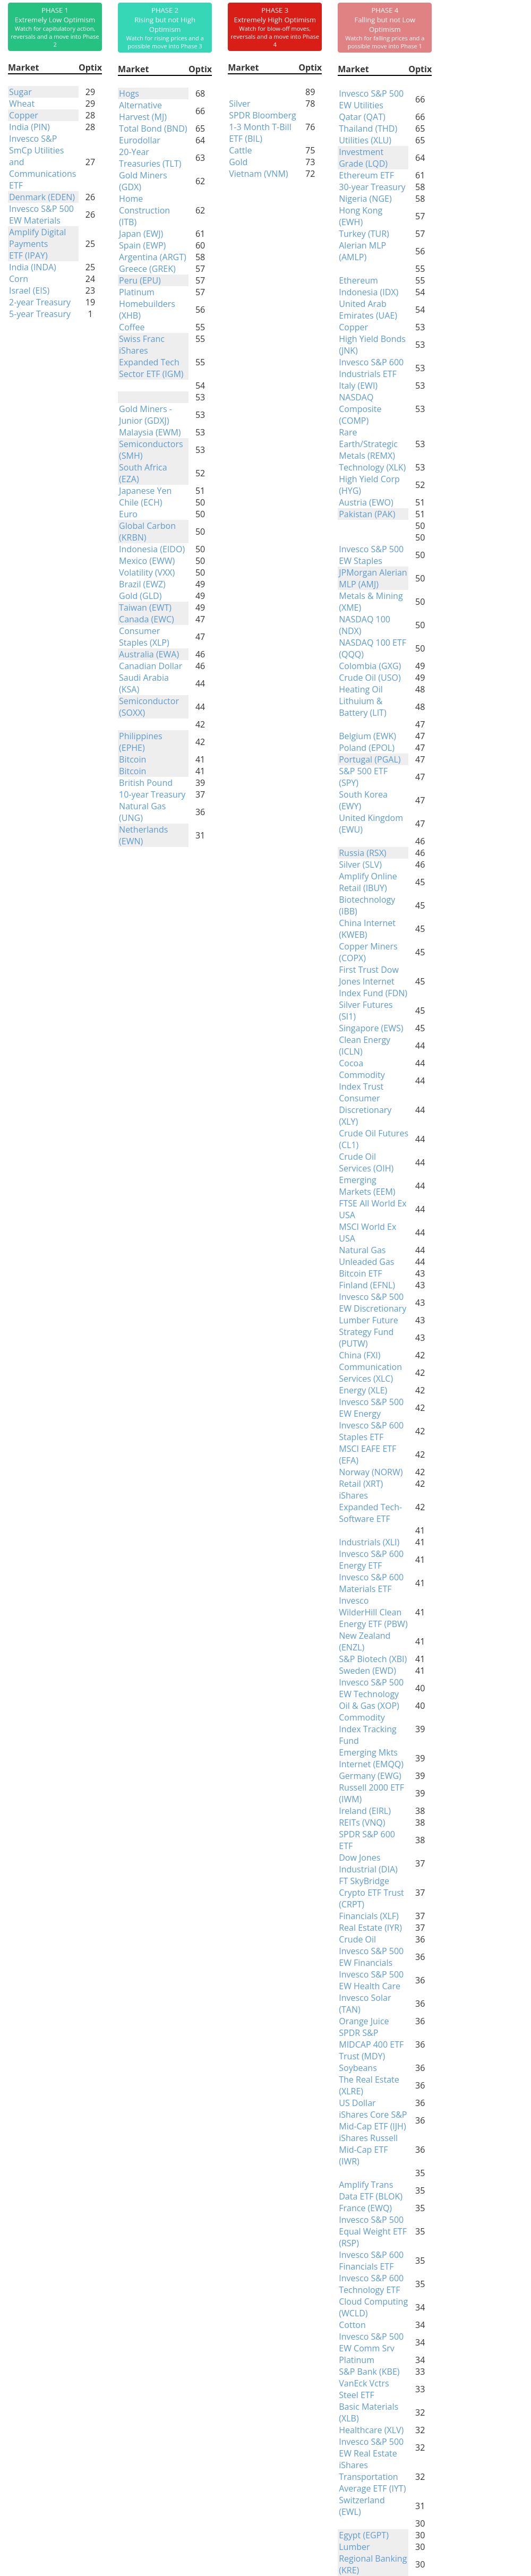
Phase Table
|
|
|
Ranks
|
|
|
|
|
|
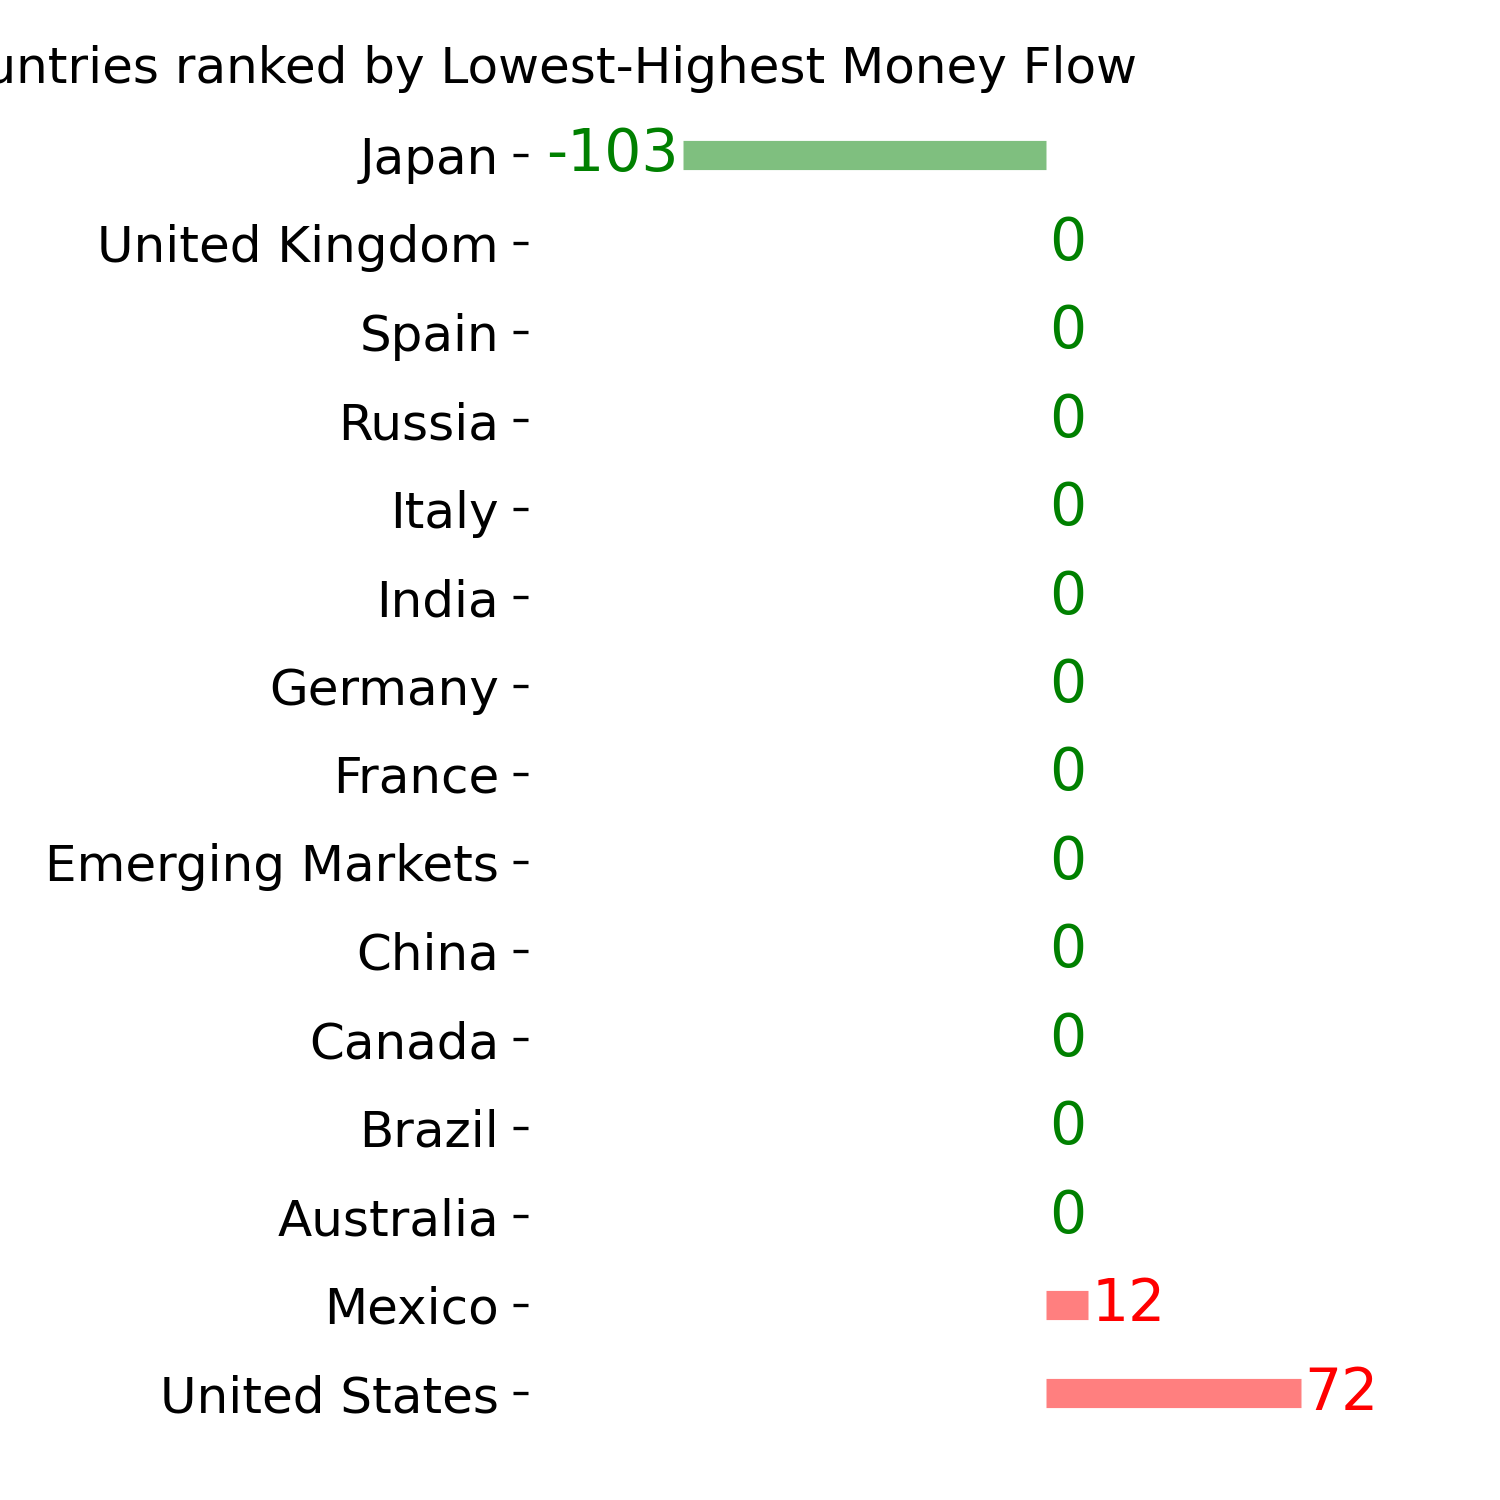
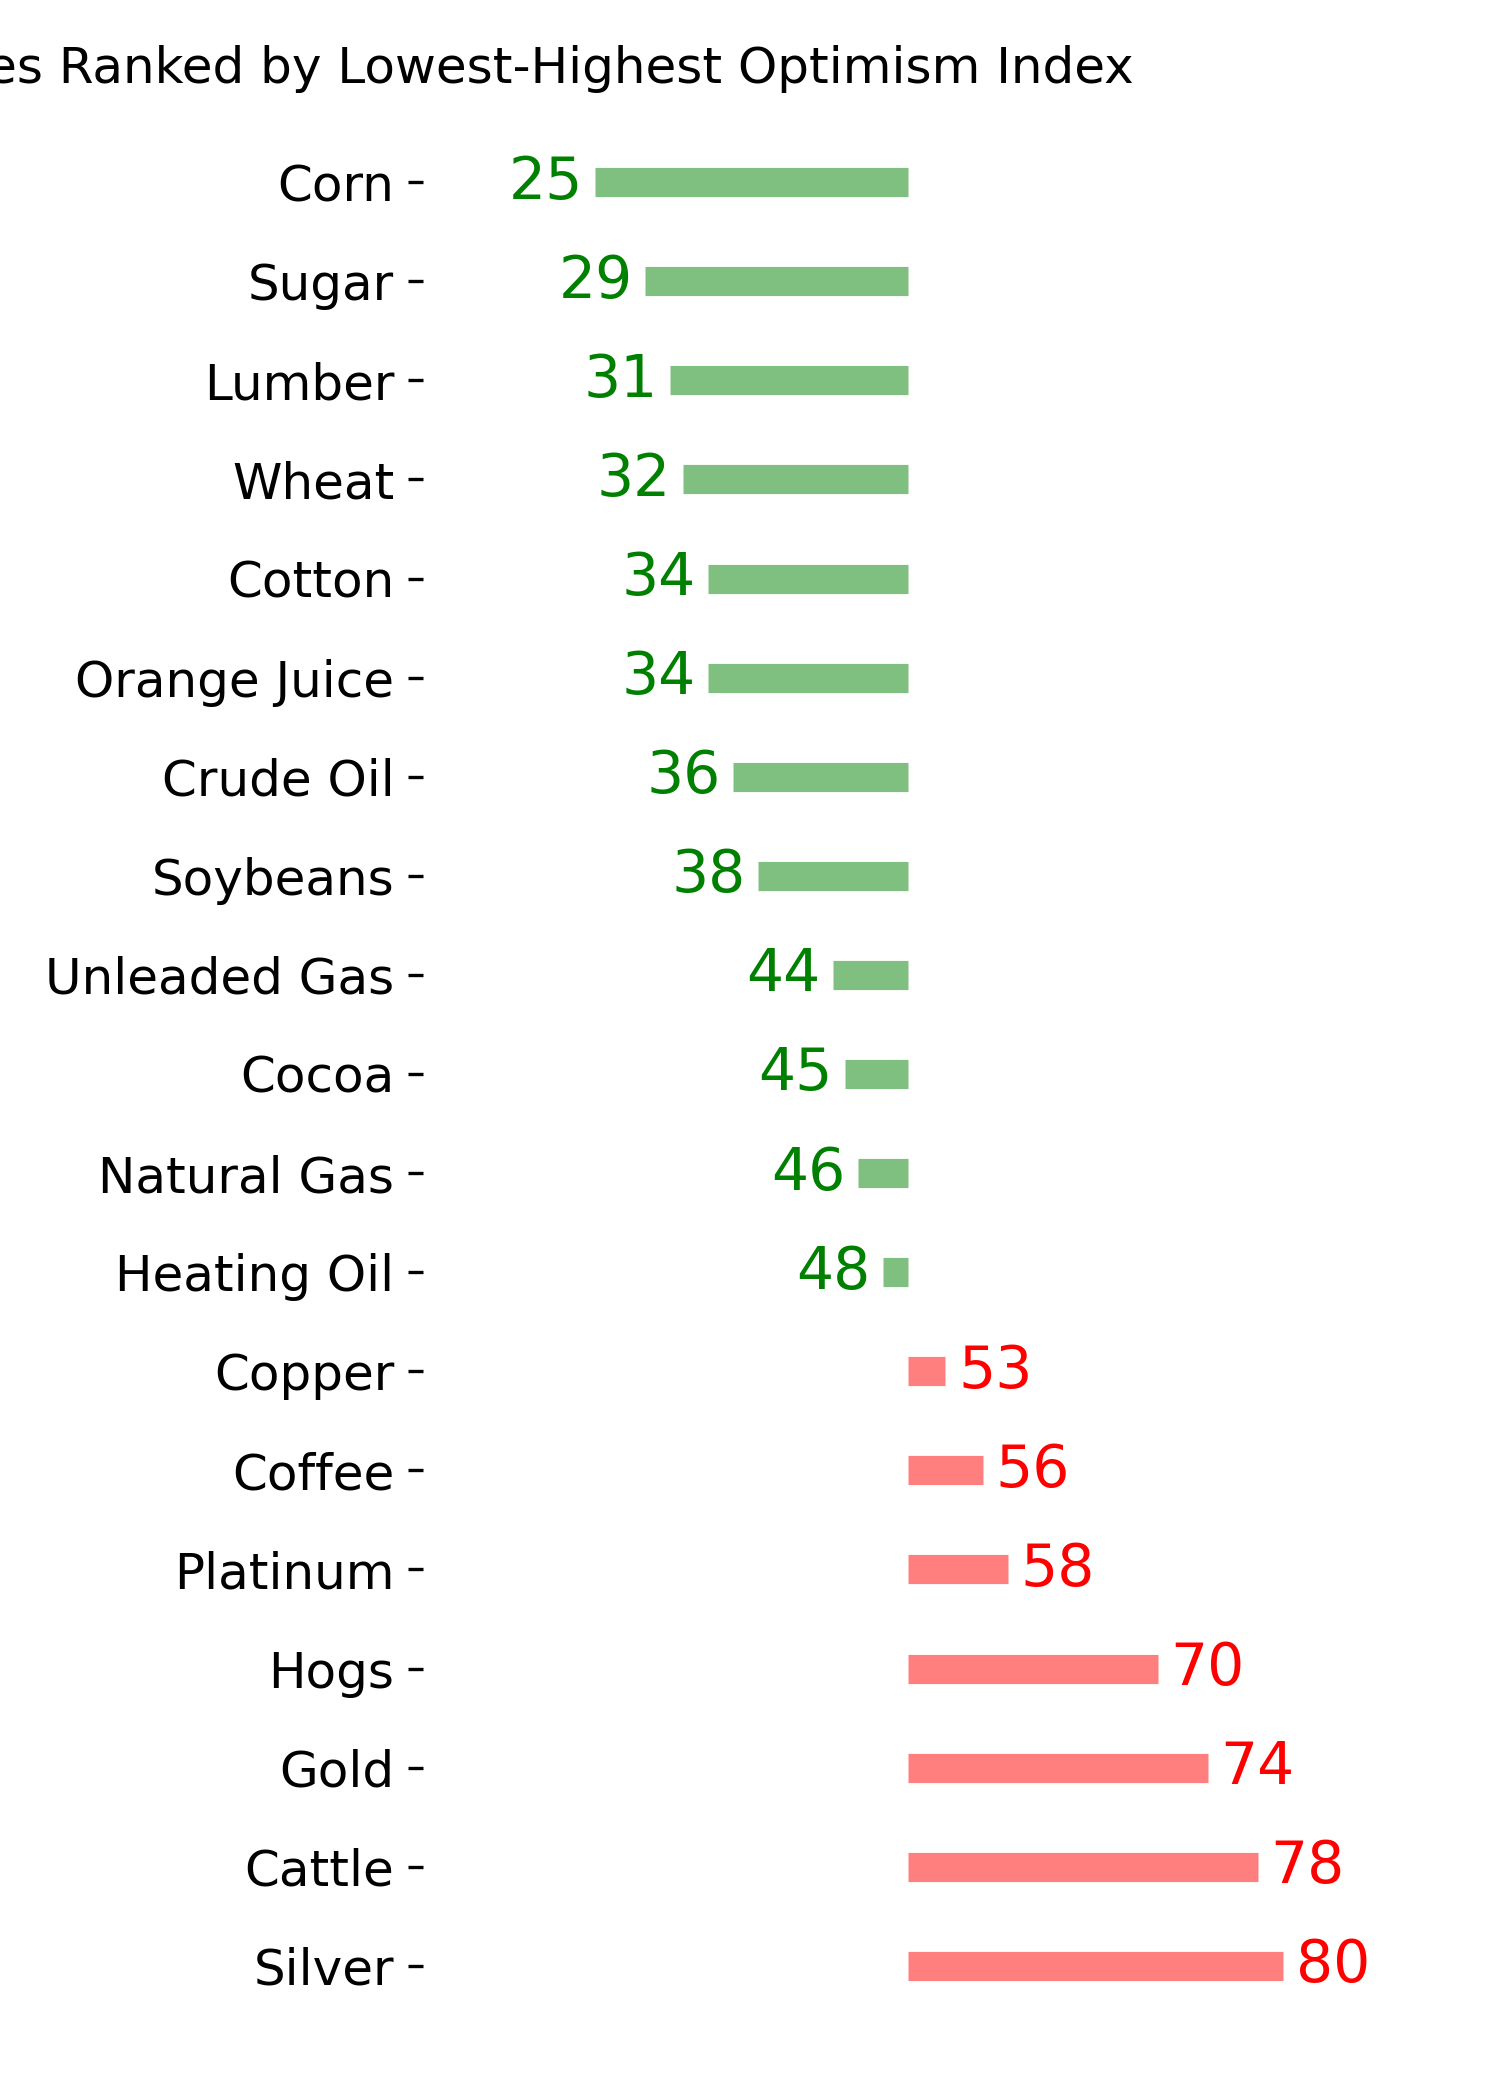
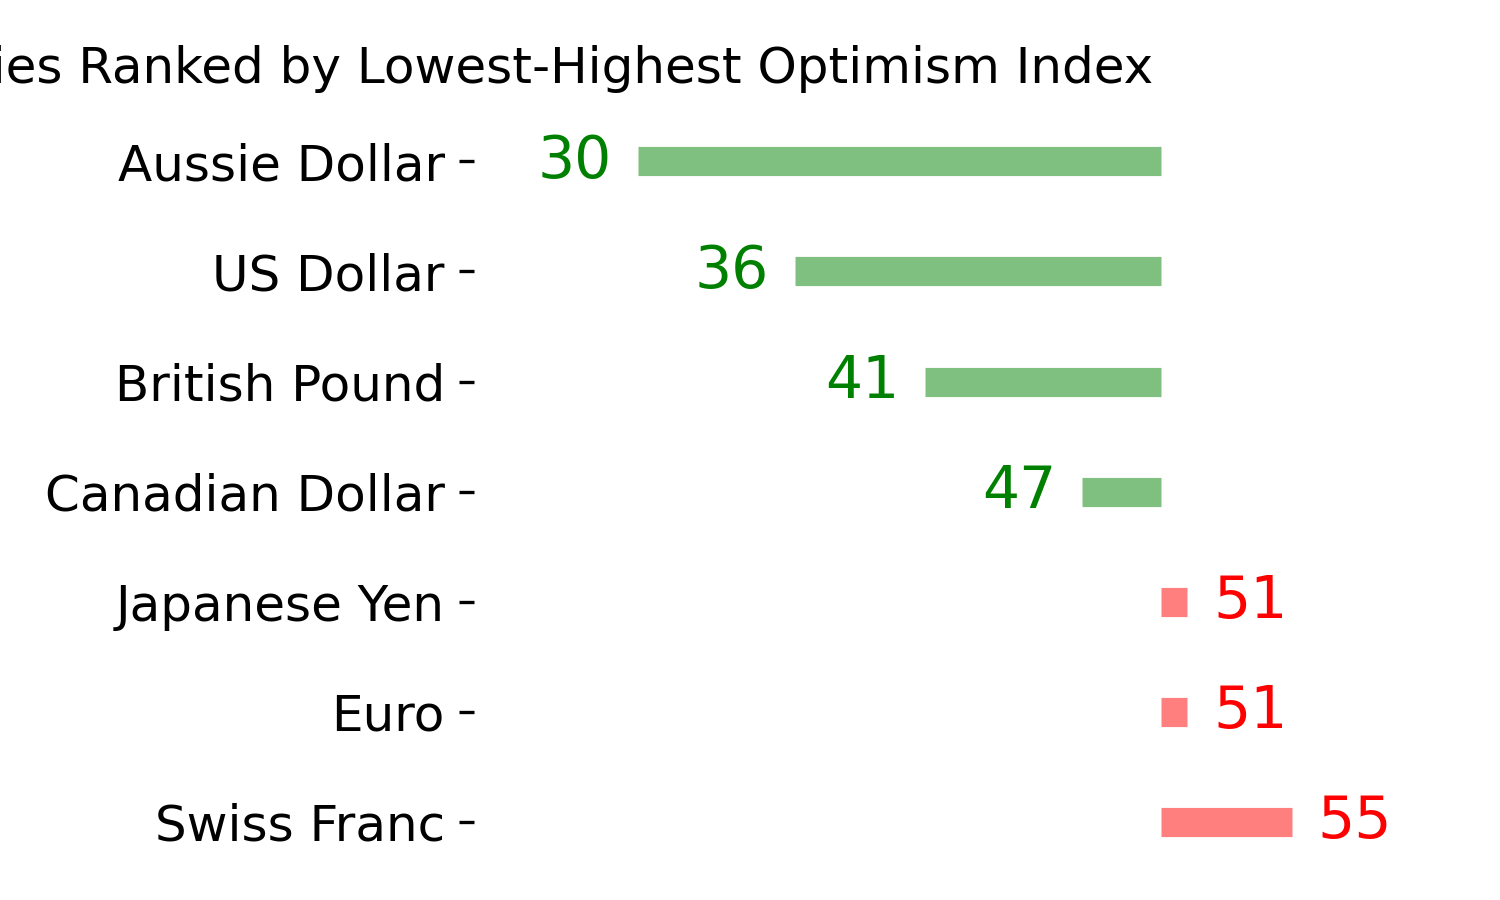
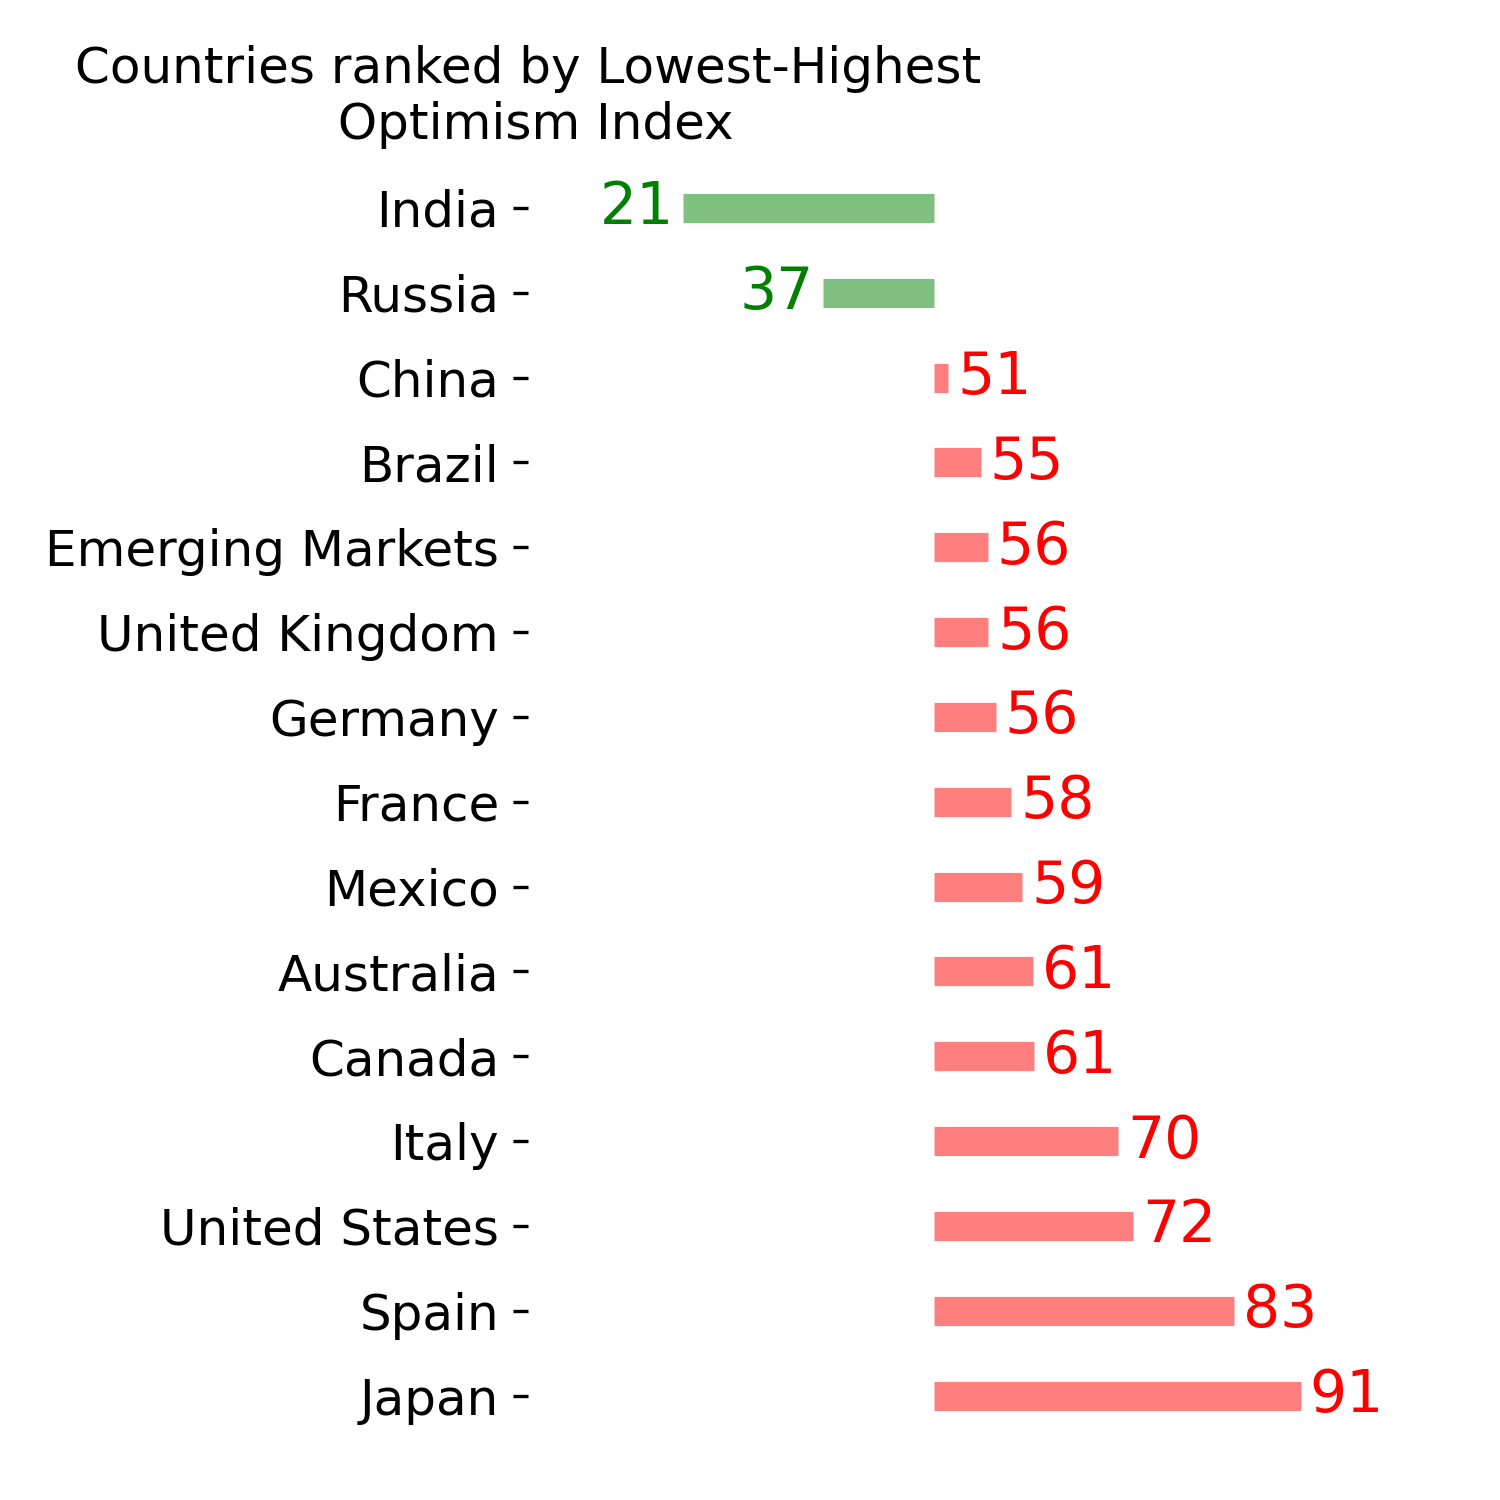
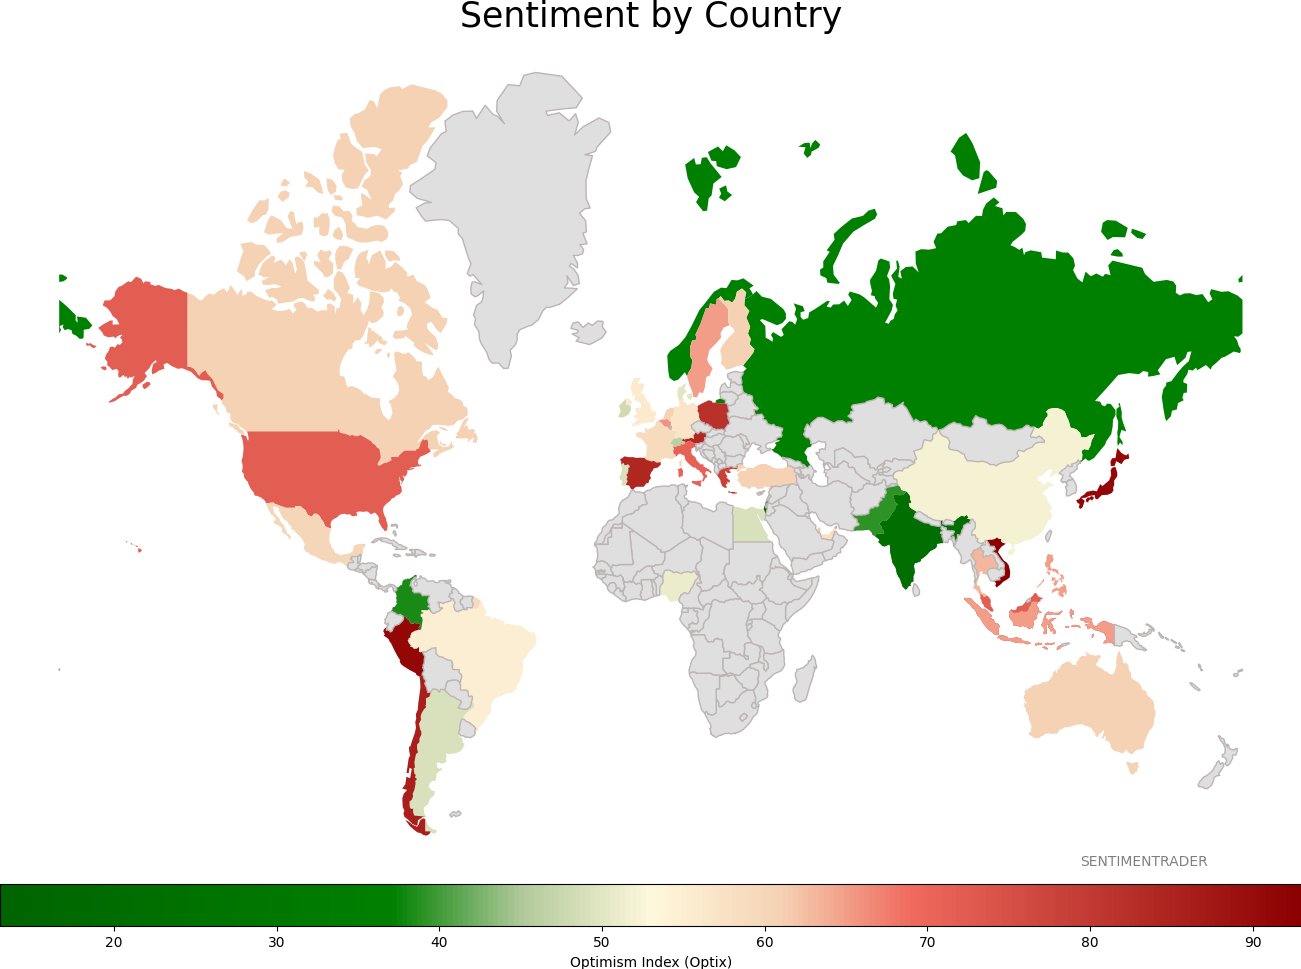
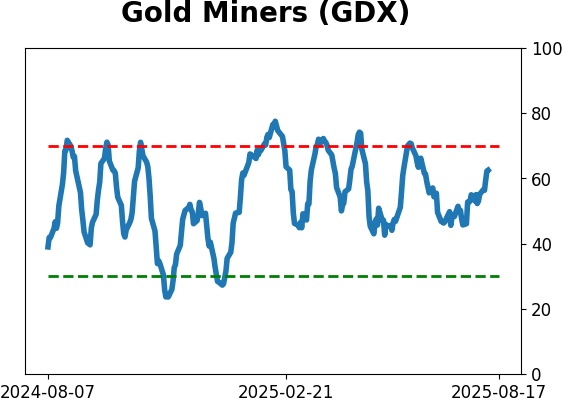
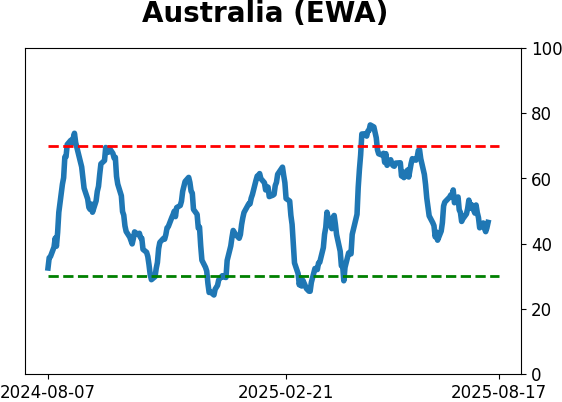
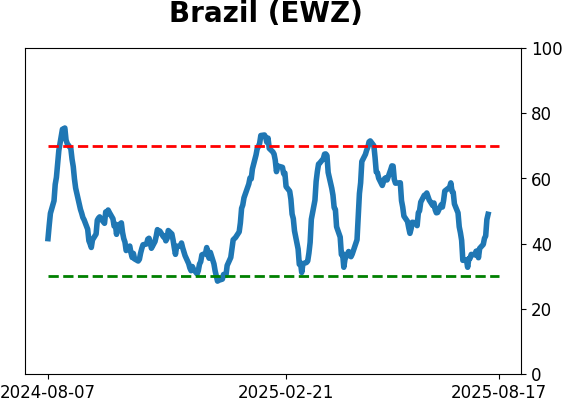
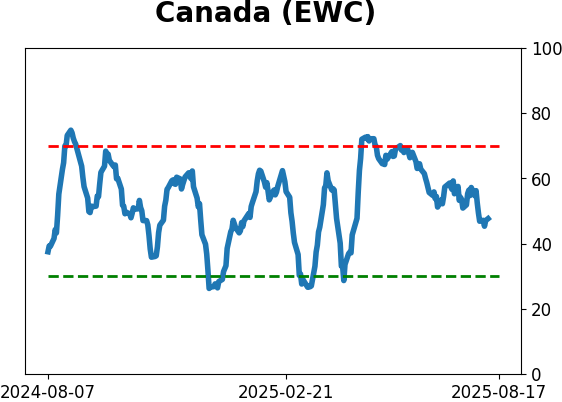
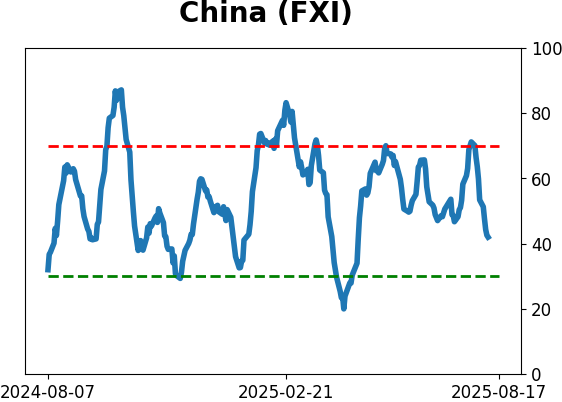
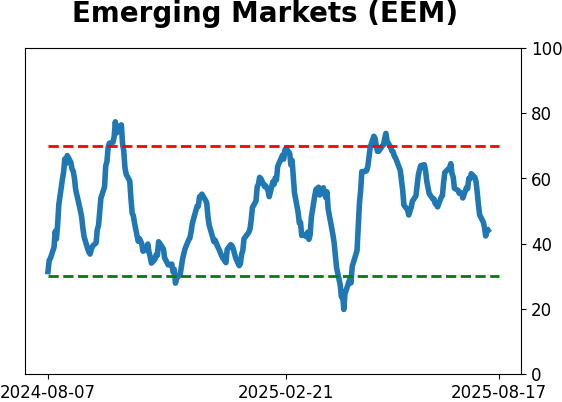
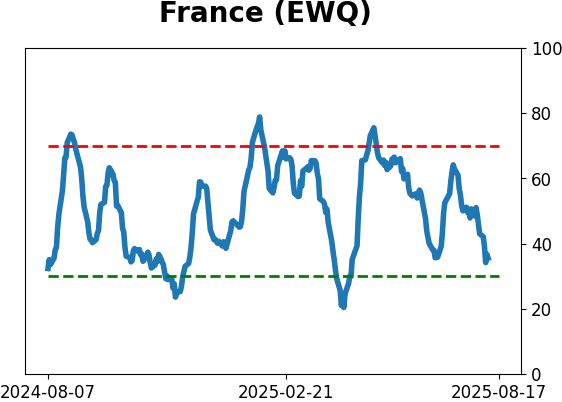
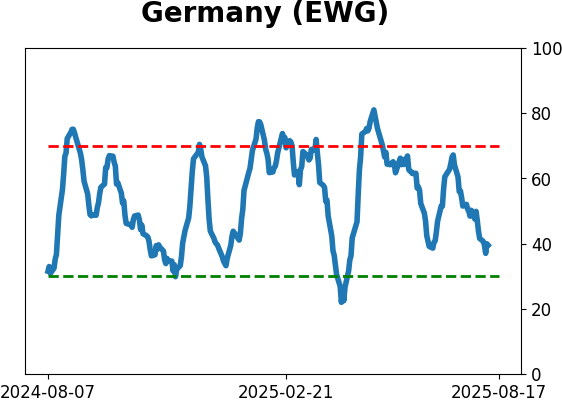
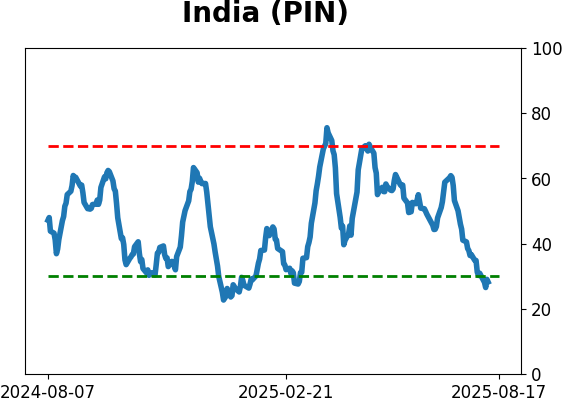
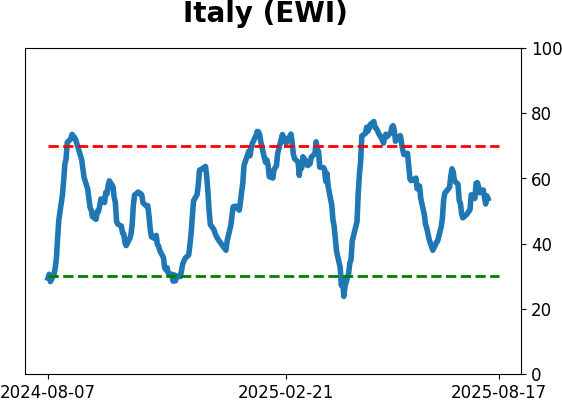
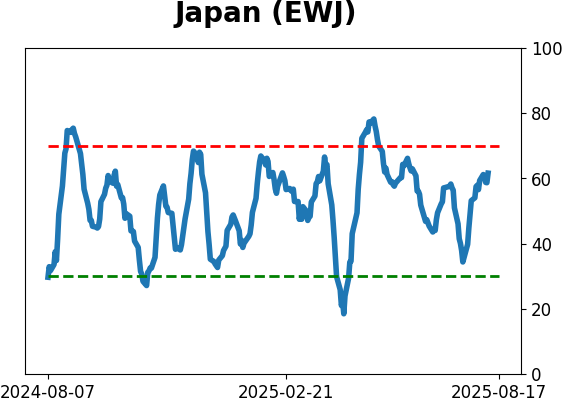
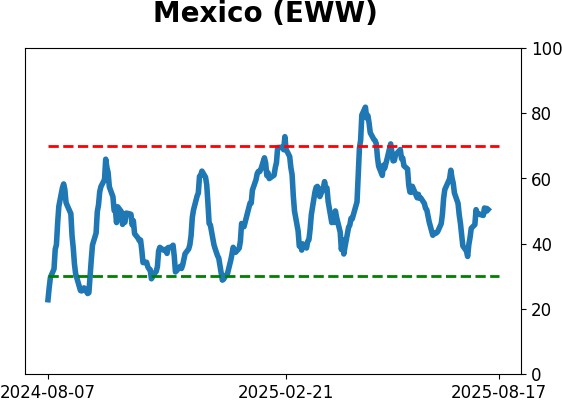
Sentiment Around The World
|
|
|
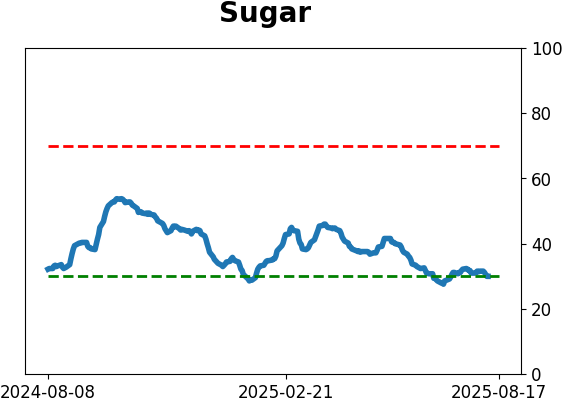
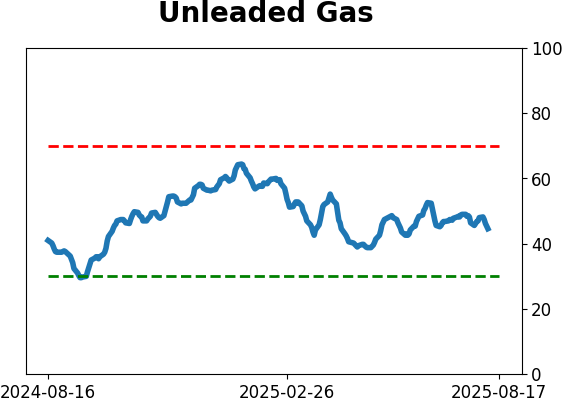
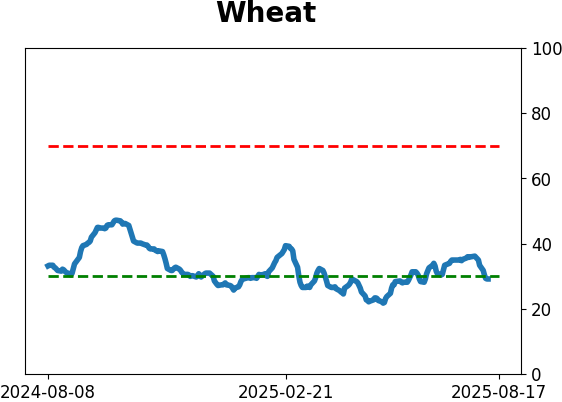
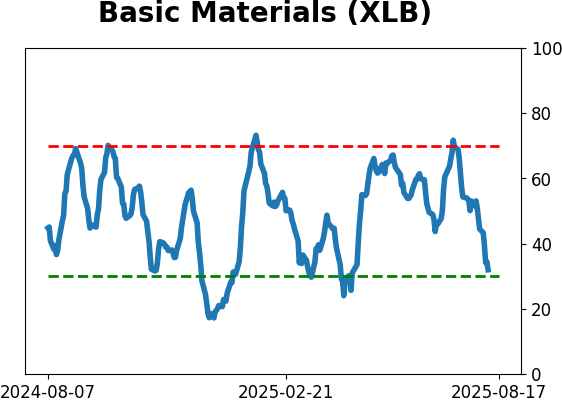
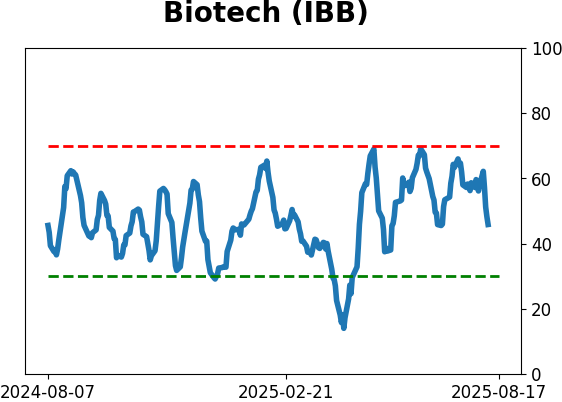
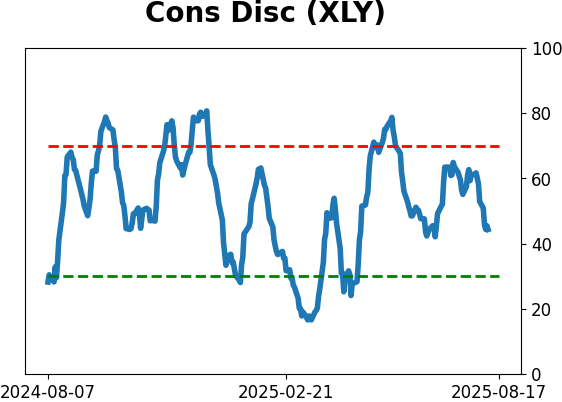
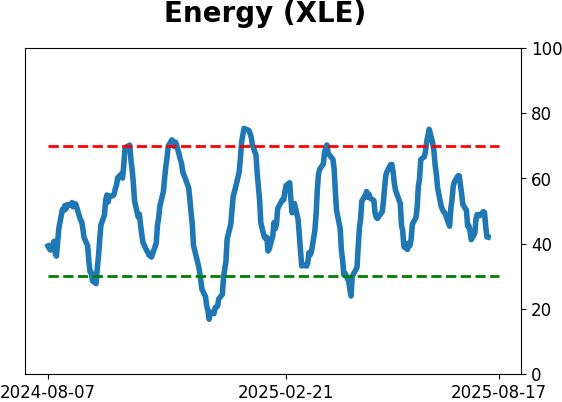
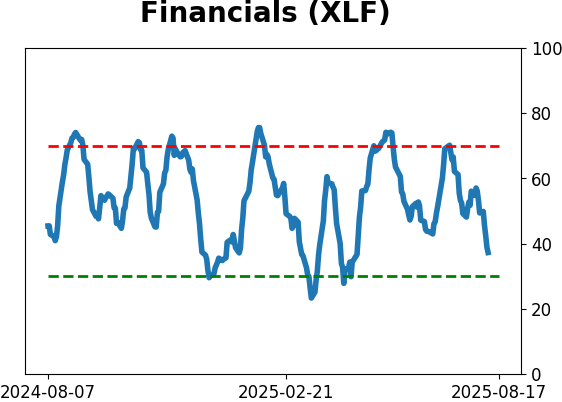
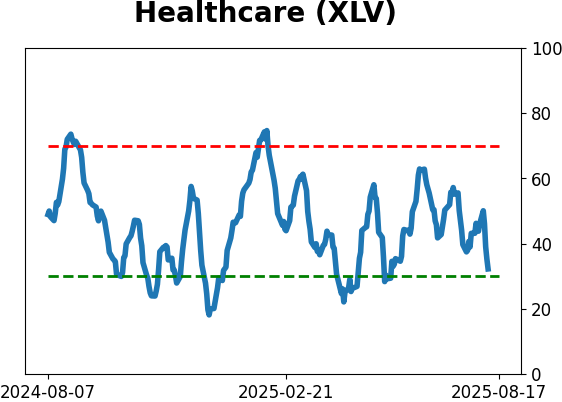
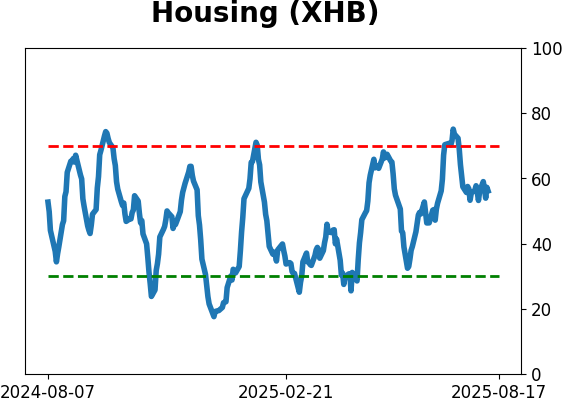
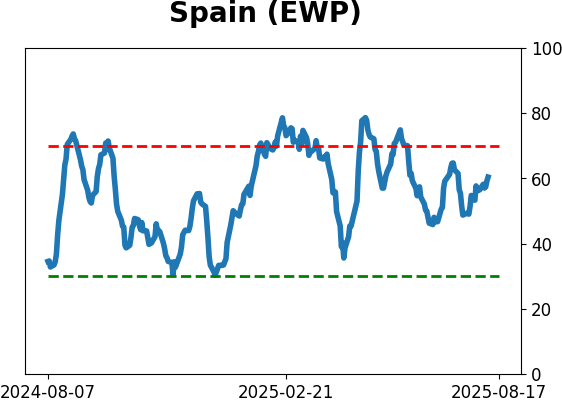
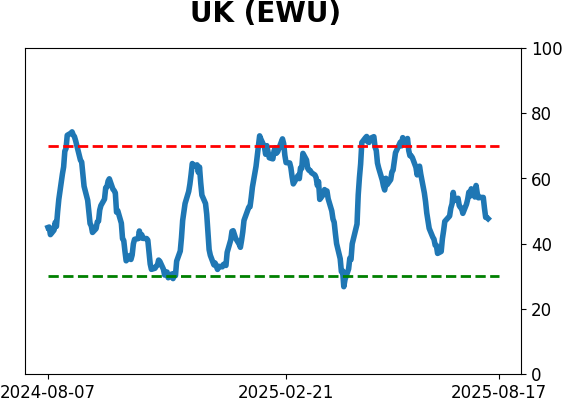
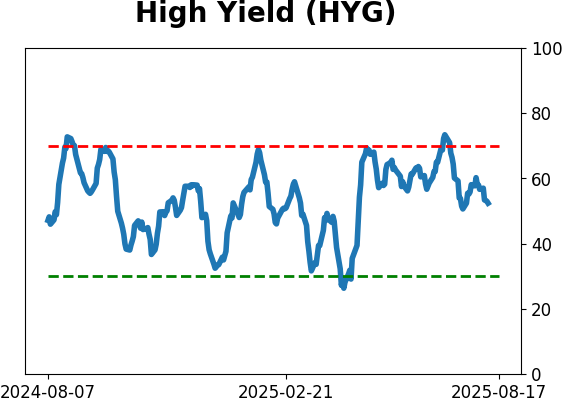
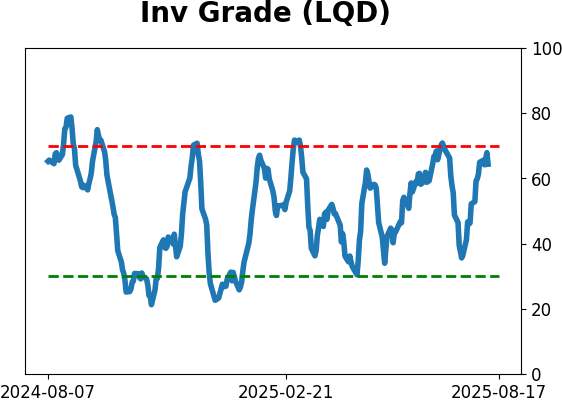
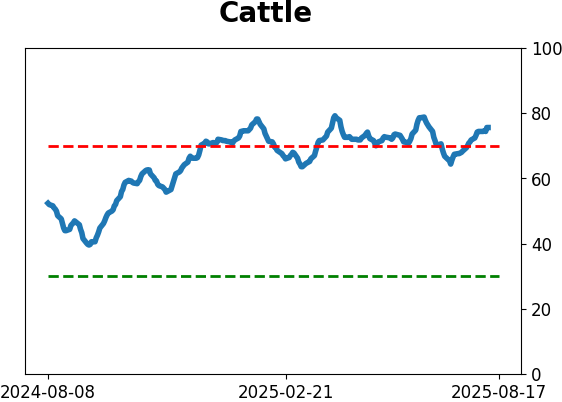
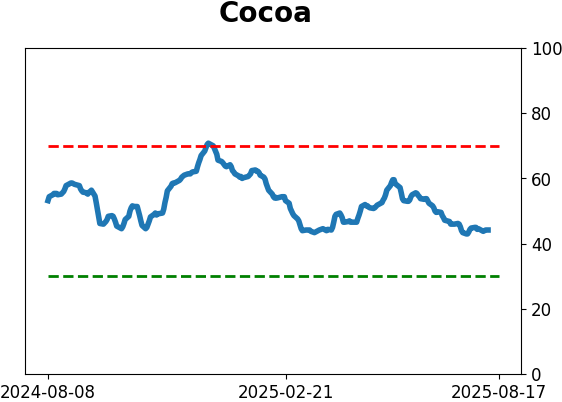
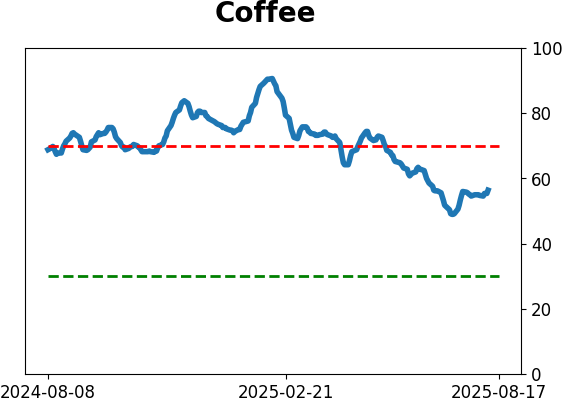
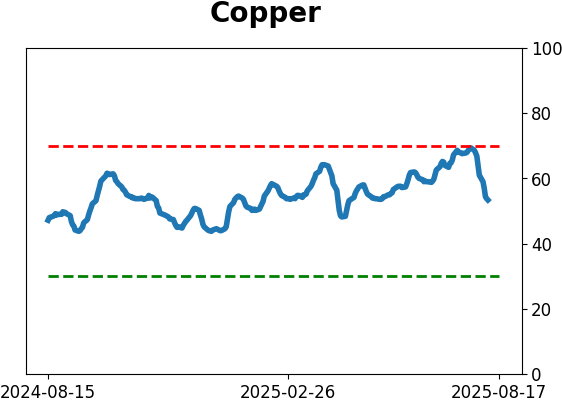
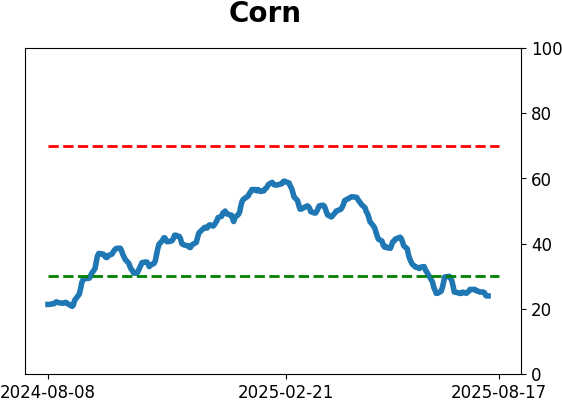
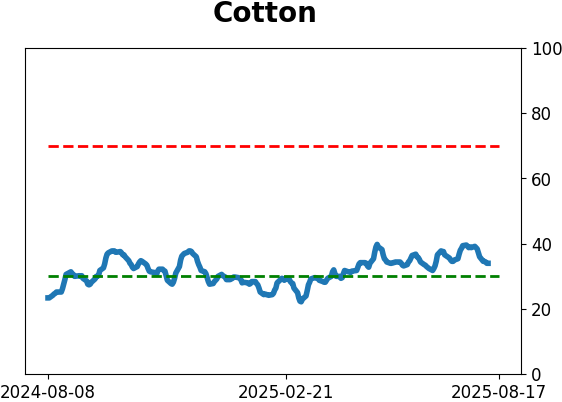
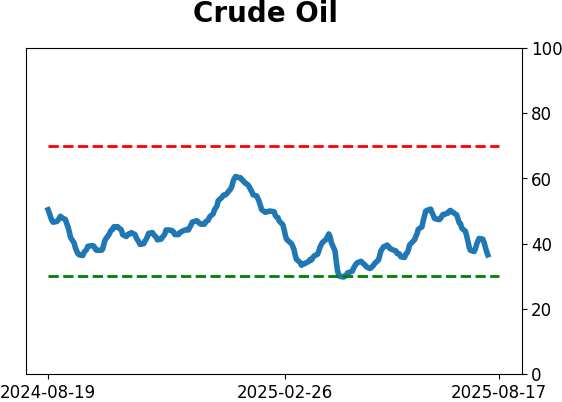
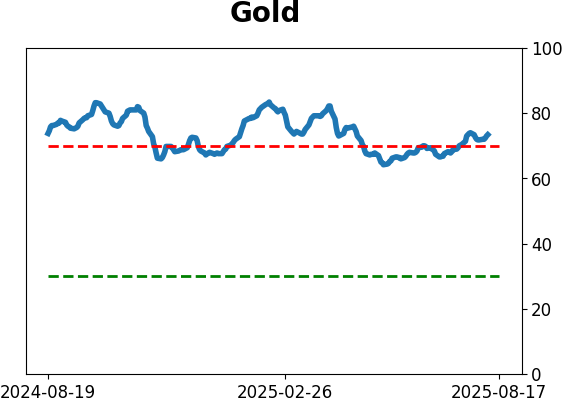
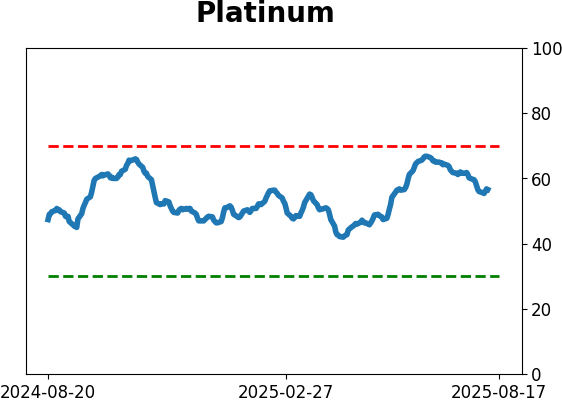
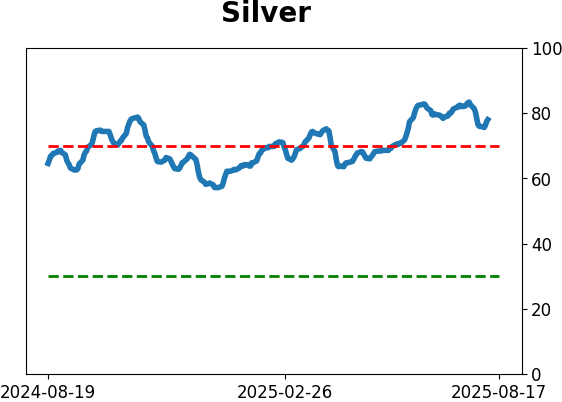
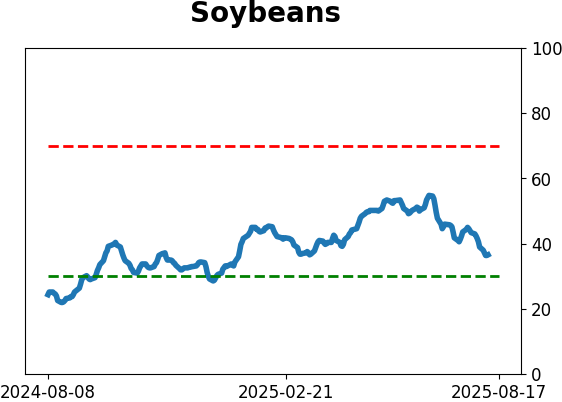
Optimism Index Thumbnails
|
|
|
|
|
|
|
|
|

|
|
|
|
|
|
|
|
|
|

|
|