Headlines
|
|
The interest rate/commodity relationship that hides in plain sight:
Inflation, supply and demand, and seasonality are key drivers of commodity prices. However, a little-known - and extremely useful - relationship between interest rates and commodities "hides in plain sight." We present the details herein.
|
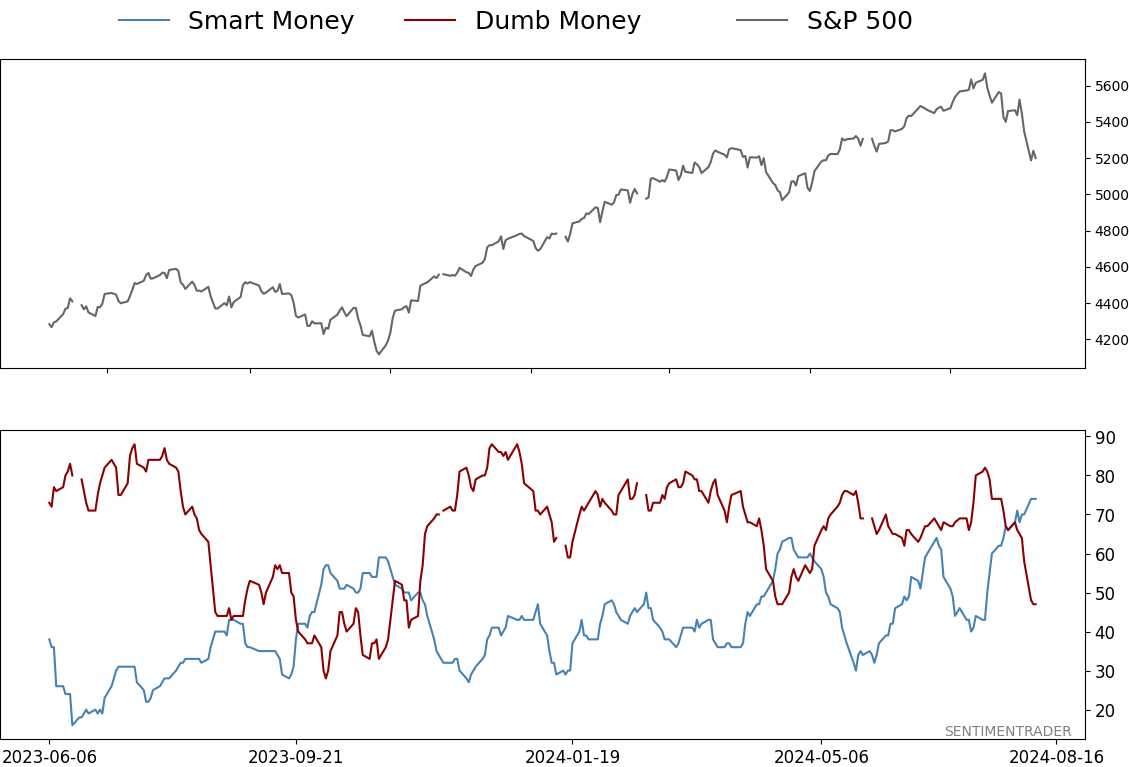
Smart / Dumb Money Confidence
|
Smart Money Confidence: 74%
Dumb Money Confidence: 47%
|
|
Risk Levels
Stocks Short-Term
|
Stocks Medium-Term

|
|
Bonds
|
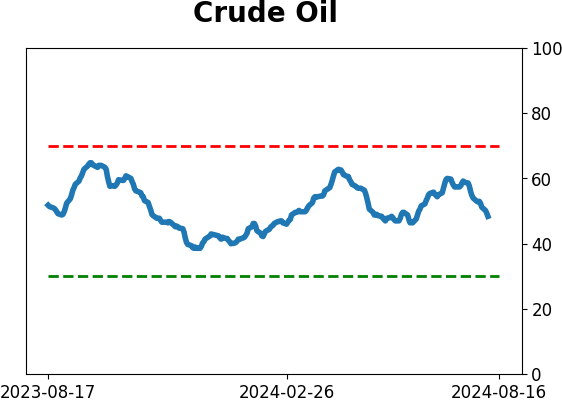
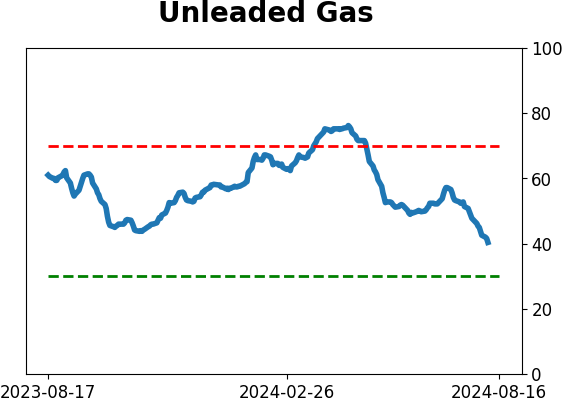
Crude Oil
|
|
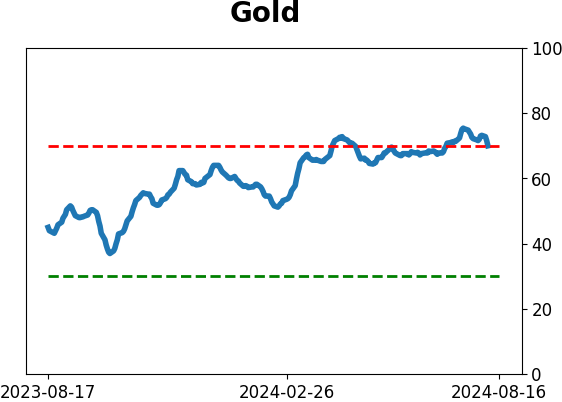
Gold
|
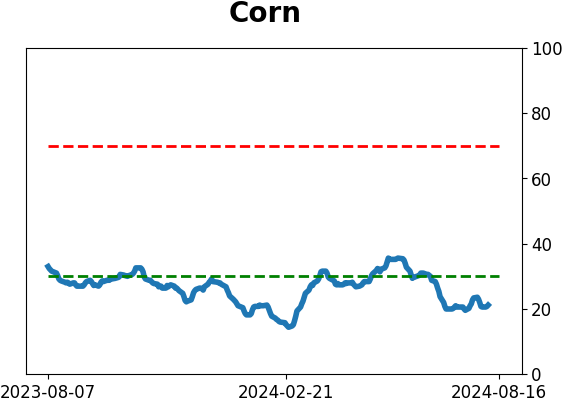
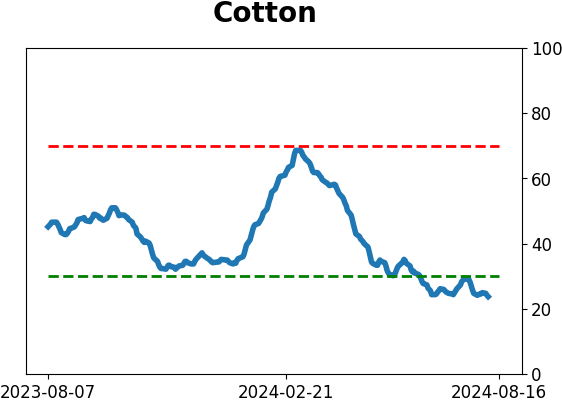
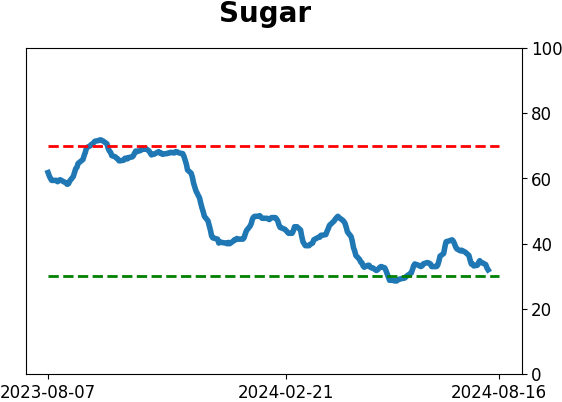
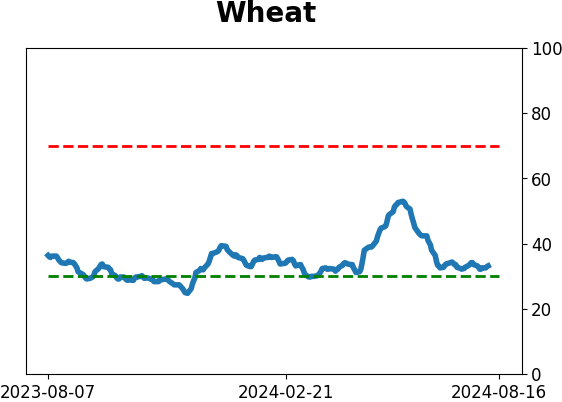
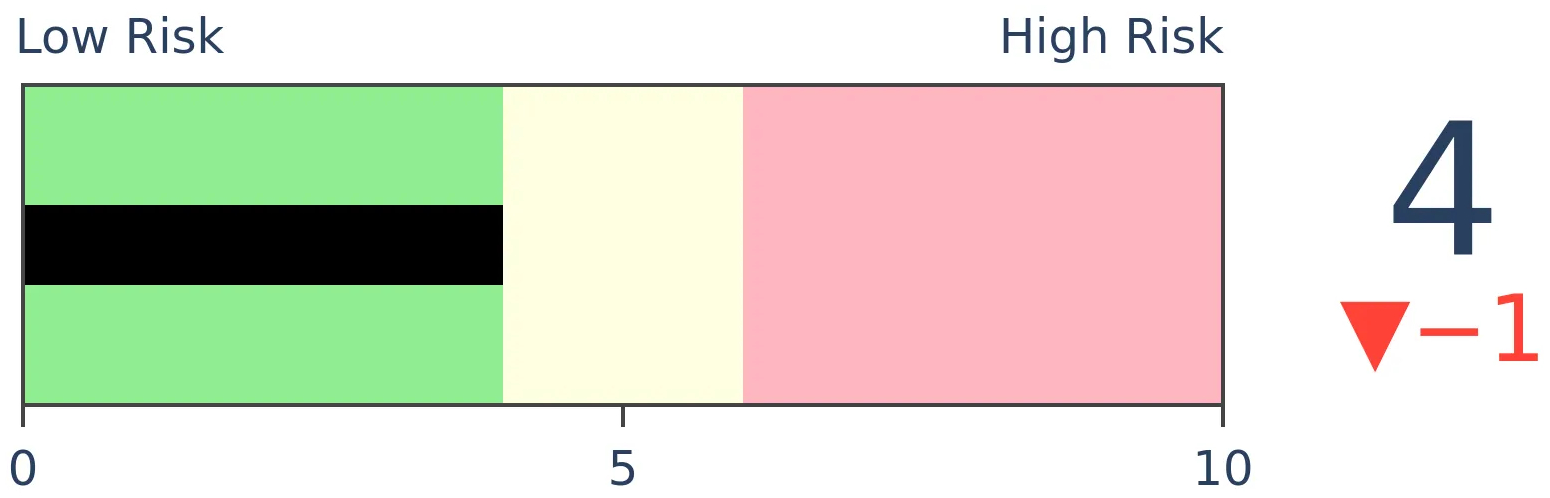
Agriculture

|
|
Research
By Jay Kaeppel
BOTTOM LINE
Inflation, supply and demand, and seasonality are key drivers of commodity prices. However, a little-known - and extremely useful - relationship between interest rates and commodities "hides in plain sight." We present the details herein.
FORECAST / TIMEFRAME
None
|
Key points
- Inflation can be a considerable factor that affects commodity prices in general
- Supply and demand factors for each individual physical commodity are the primary driver
- Seasonality can also play a role in identifying tradable commodity price trends
- Few are aware of an interesting relationship between (very short-term) interest rate trends and the trend of commodities as an asset class
Indexes for tracking interest rates and commodities
For testing purposes, we will use two indexes.
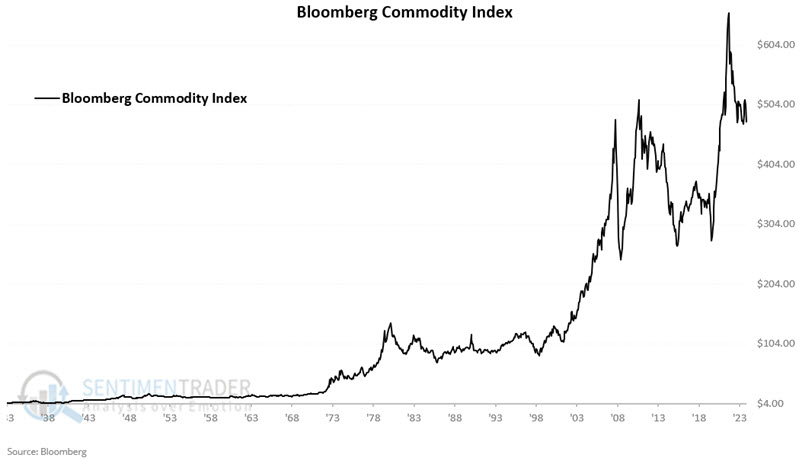
- Starting in 1960, we used monthly changes in the Bloomberg Commodity Spot Price Index (ticker BCOMSP) to represent a basket of commodities to serve as a proxy for commodities as an asset class. Before 1960, we used monthly changes in the Bloomberg Commodity Index (ticker BCOM), which tracks the prices of a basket of commodity futures contracts
- The 10-year treasury yield (Ticker TNX) is precisely as the name implies - it represents the current yield on a 10-year treasury note. Here too, we use monthly closing values
We started our test in September 1933. The chart below shows our combined commodity index's price history.
The chart below shows the same index on a logarithmic scale.
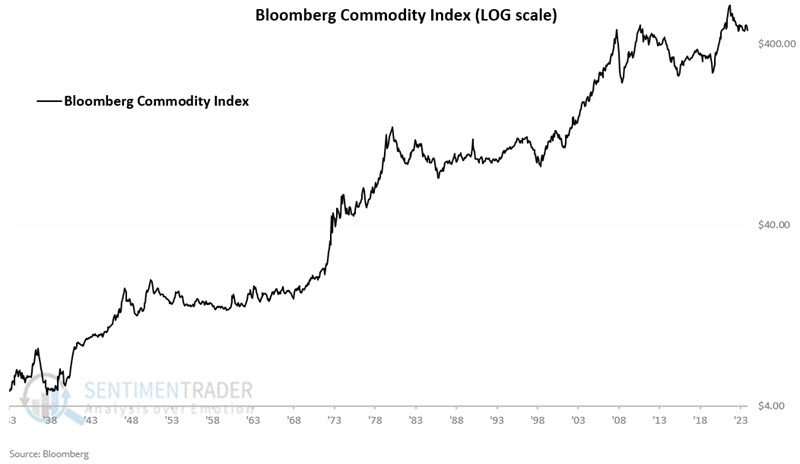
Substantial gains in commodity prices occurred during inflationary periods in the 1940s, 1970s, and 2022 and during the strong gold run between 2001 and 2011.
Now, let's look at interest rate history. The chart below displays the same 1933 through July 2024 period for the 10-year treasury yield.
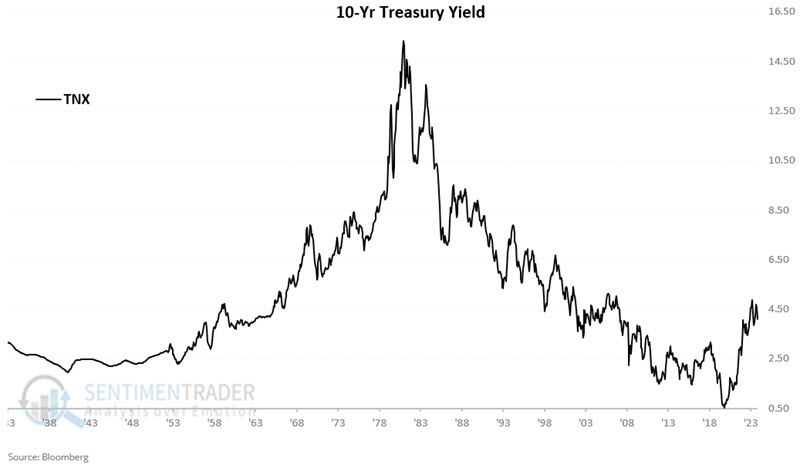
We can note two primary long-term waves. Rates rose steadily and significantly from the early 1950s into the early 1980s. From a peak above 15% in 1981, TNX fell for nearly 39 years before bottoming at around 0.40% in early 2020. TNX rose to almost 5% in late 2023 before drifting back to just under 4% recently.
The chart below plots both data series on the same chart. Interest rates are in blue, and the price axis is on the left-hand side of the chart. Commodity prices are in black, and the price axis is on the right-hand side of the chart.
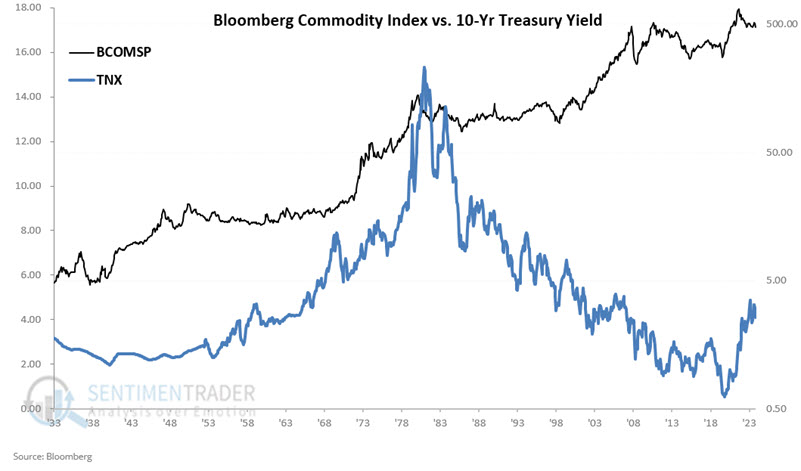
Eyeballing the chart reveals a high correlation at times and almost no correlation at others. The correlation coefficient is -0.18 for the entire period. So, technically speaking, the two are somewhat inversely correlated.
But here is where things get interesting (at least in my market-addled mind).
Rates versus a very short-term moving average
For our test, we will compare TNX at the end of each month to its 1.3-month exponential moving average. TNX data goes back to 1900. So we start by seeding the average by making it equal to the first month's TNX reading (3.15% at the end of January 1900). From there, the exponential average is updated at the end of each month as follows:
(Last month's EMA * 0.13043) + (This month's TNX closing level * 0.86957)
An EMA this short is somewhat counterintuitive as it gives the bulk of the weight to the current month's closing value. However, as a proud graduate of "The School of Whatever Works," there is a reason for this, as we will see momentarily.
The chart below subtracts the month-end value for the 1.3-month EMA from the month-end value for TNX. Positive readings mean TNX is above its 1.3-month EMA and vice versa.
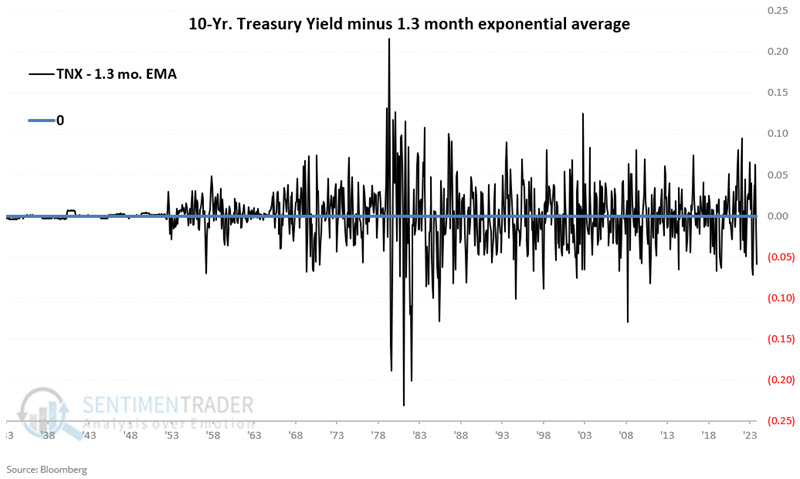
As you can see, this highly volatile series crosses the 0 line with frenetic regularity. Can it be of any use to traders? Let the data decide.
Using the indicator to gauge the trend in commodity prices
First, it should be pointed out that the intention is not necessarily to use this indicator as a standalone trading model but rather as "weight of the evidence." That said, an individual who doesn't mind trading frequently (i.e., being long a commodity index ETF one month and flat the next with great frequency) might do worse.
Our rules are as follows:
- If TNX - 1.3-month EMA > 0 at the end of this month, then hold BCOMSP (i.e., a basket of commodities) for the entirety of the following month
- If TNX - 1.3-month EMA <=0 at the end of the month, then remain flat with no position in commodities for the entirety of the following month
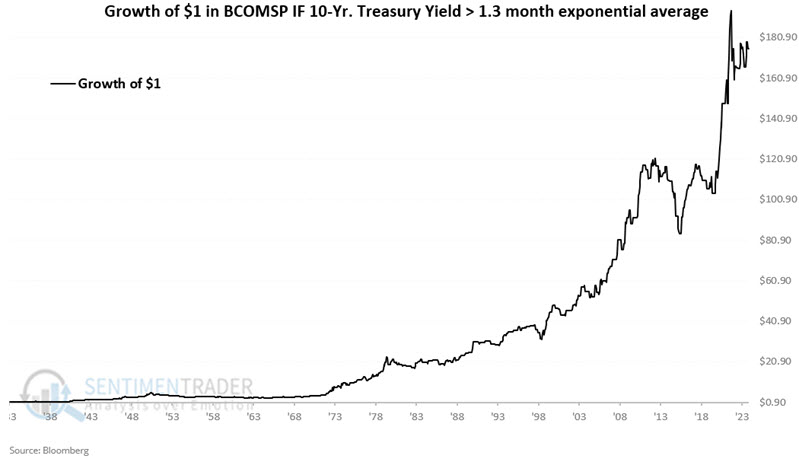
The chart below displays the hypothetical growth of $1 invested in BCOMSP only during favorable months (i.e., TNX ended the previous month > 1.3-month EMA).
The chart below shows the same data series on a logarithmic scale.
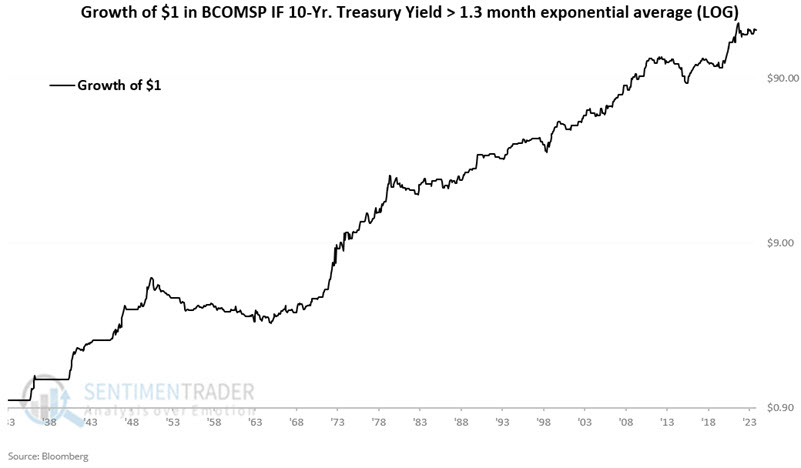
The hypothetical gain for September 1933 through July 2024 is +17,450%.
Now, let's look at the flip side. The chart below displays the hypothetical growth of $1 invested in BCOMSP only during unfavorable months (i.e., TNX ended the previous month < 1.3-month EMA).
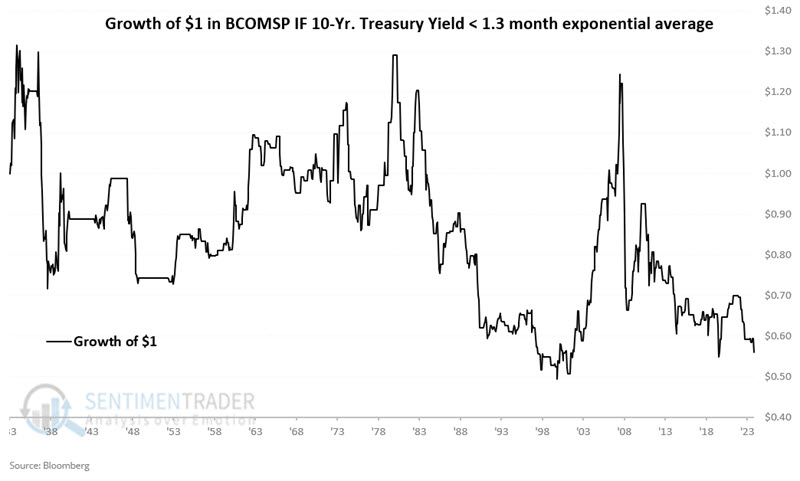
The hypothetical loss for September 1933 through July 2024 is -44%.
TNX has been below the 1.3-month EMA at the close of June and July 2024, indicating an unfavorable signal for commodities in July and August 2024.
What the research tells us…
Supply and demand factors for each individual physical commodity tend to be the primary drivers of price trends. Different commodities can experience widely disparate supply and demand. Despite this, commodities as an asset class tend to trend in the aggregate. It is not apparent to the naked eye - nor even necessarily intuitive - that short-term changes in interest rates should have any bearing on commodity prices. But - again - as a proud graduate of "The School of Whatever Works," the results detailed above strongly suggest that a meaningful relationship does exist.
Indicators at Extremes
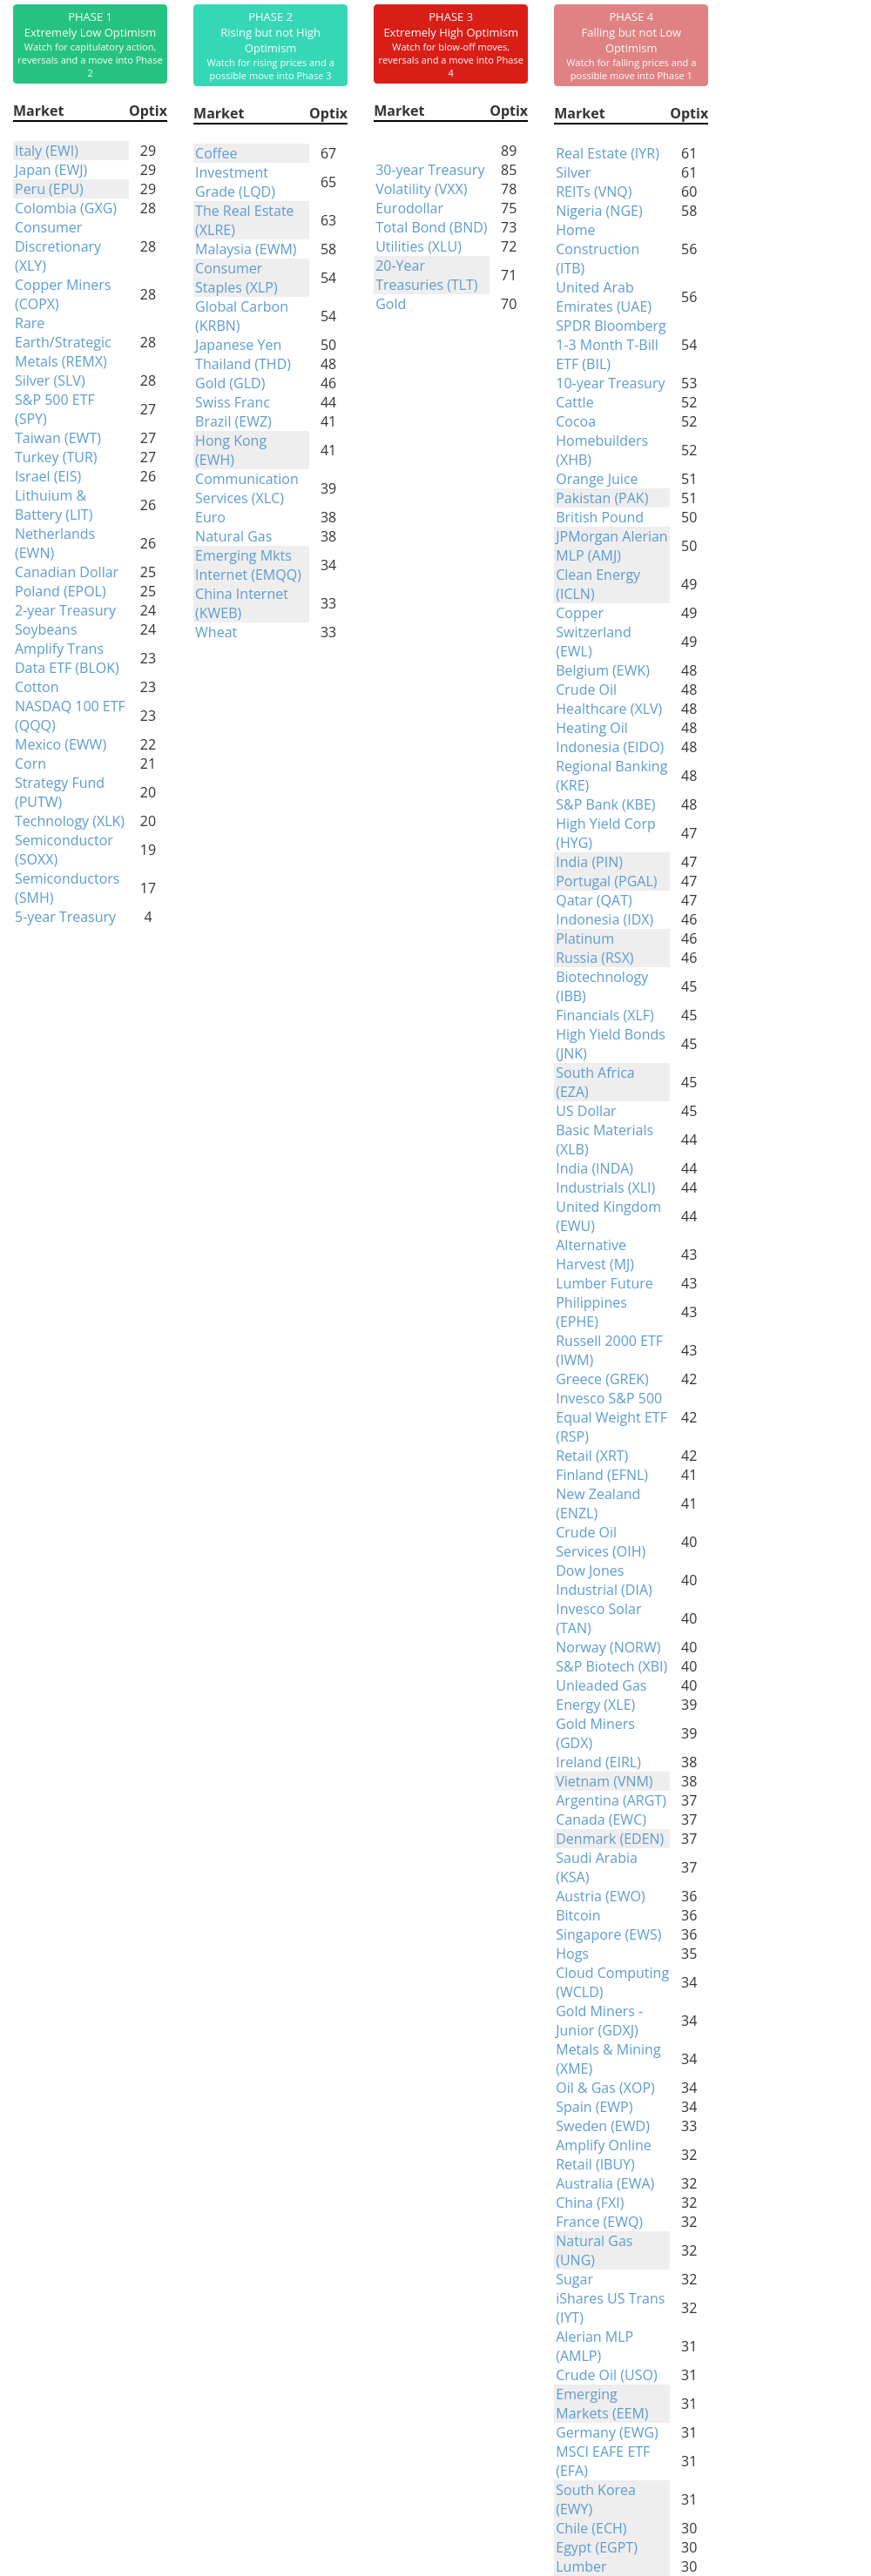
Phase Table
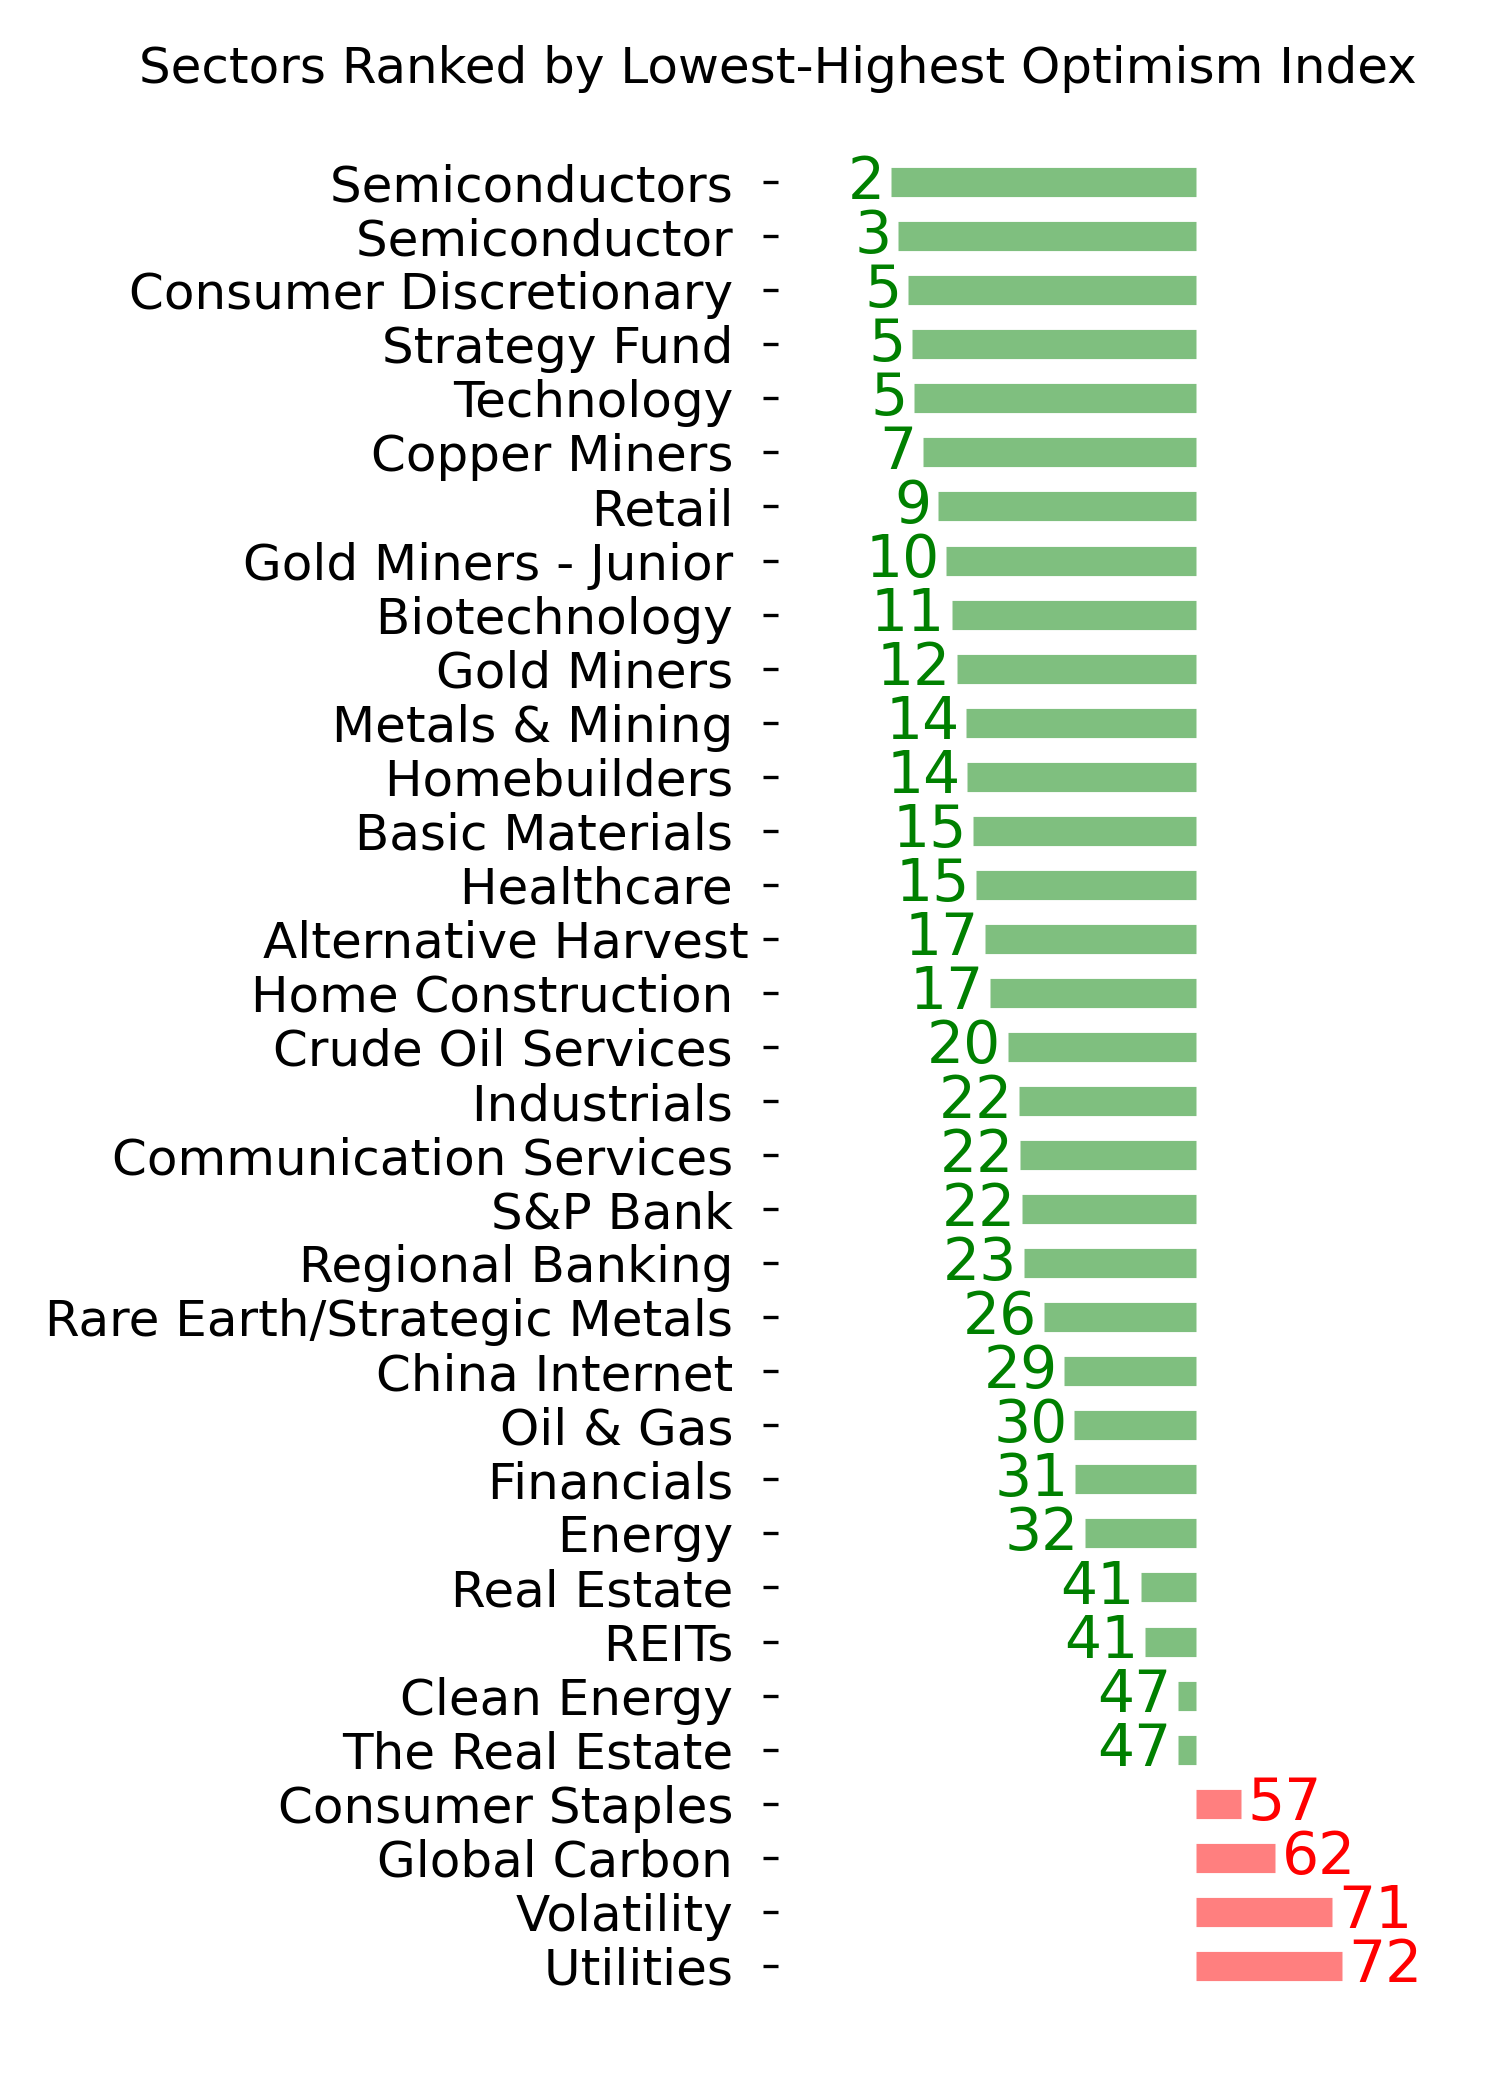
Ranks
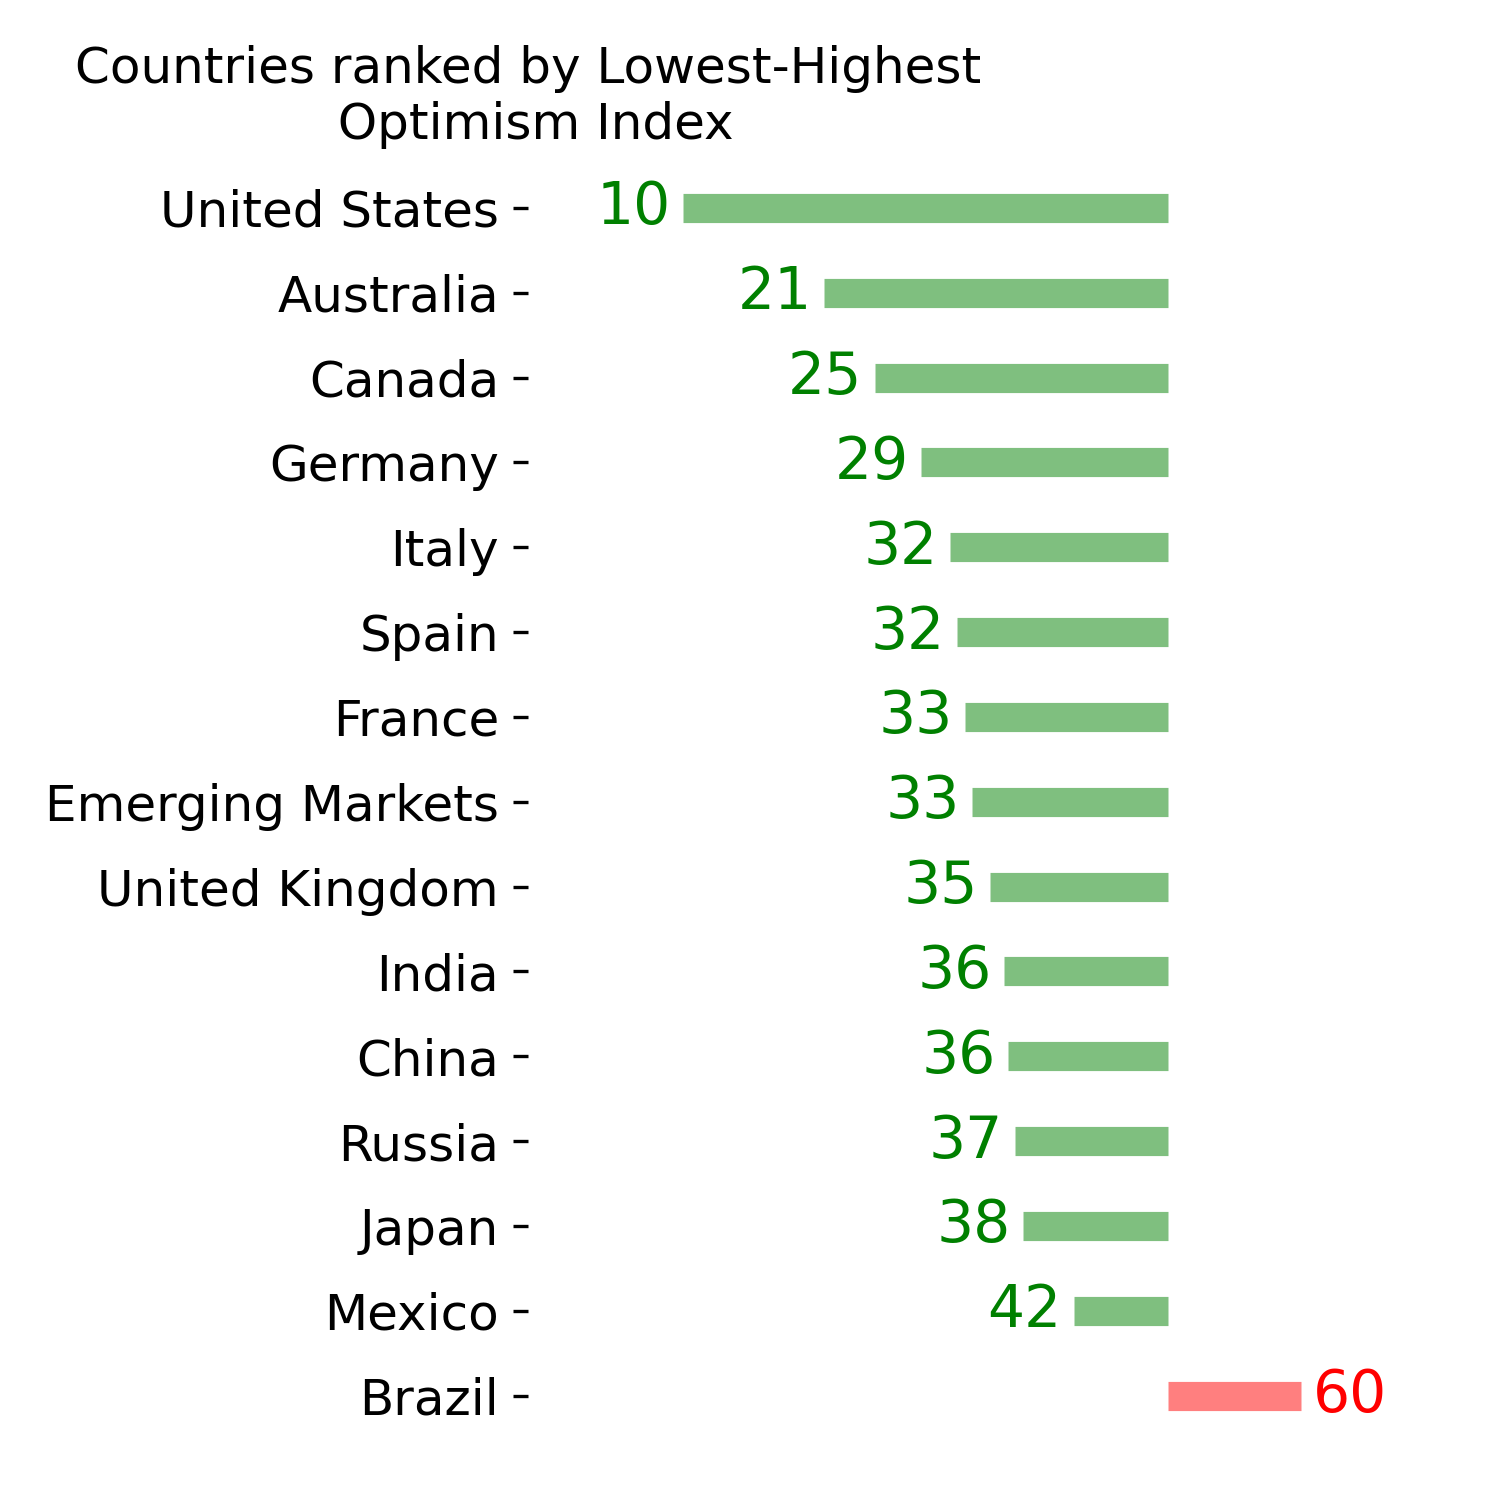
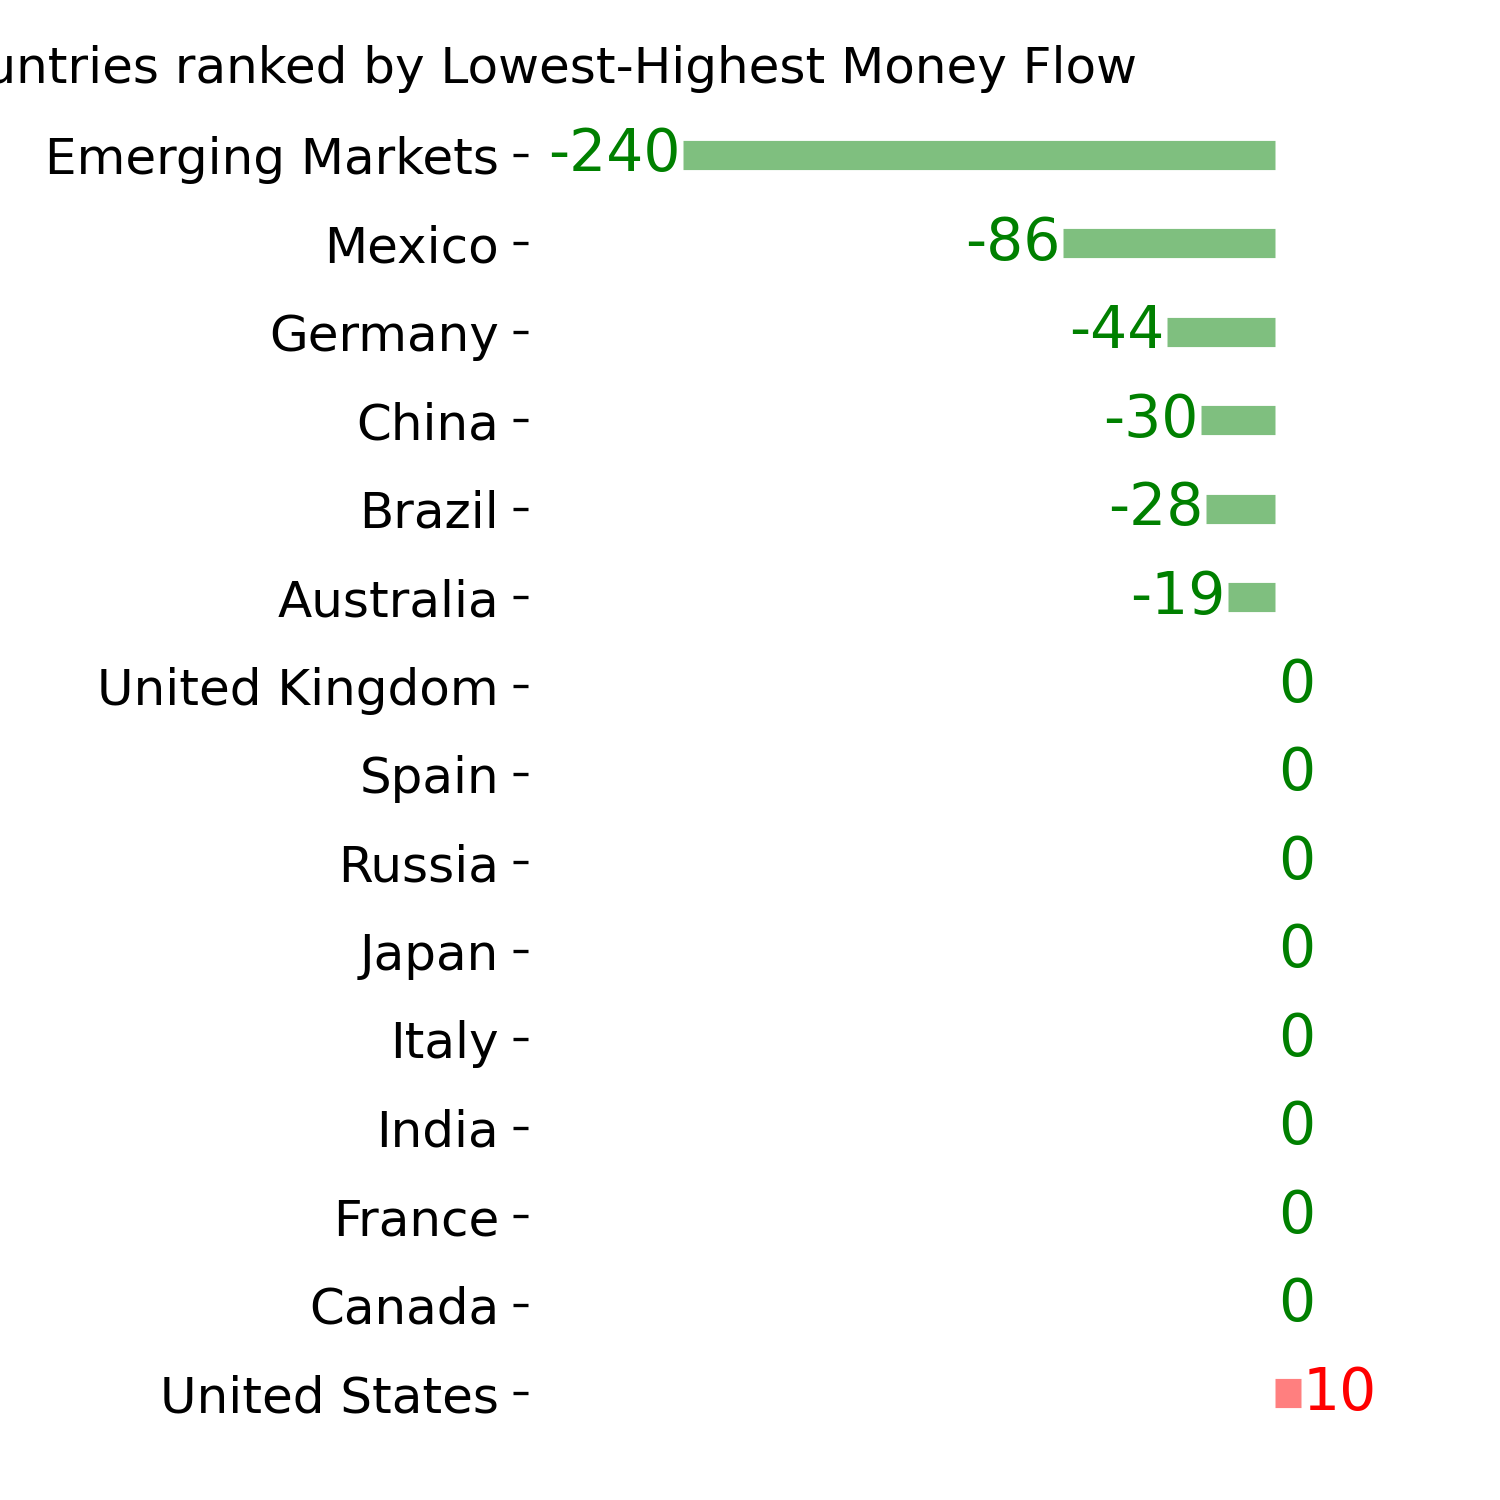
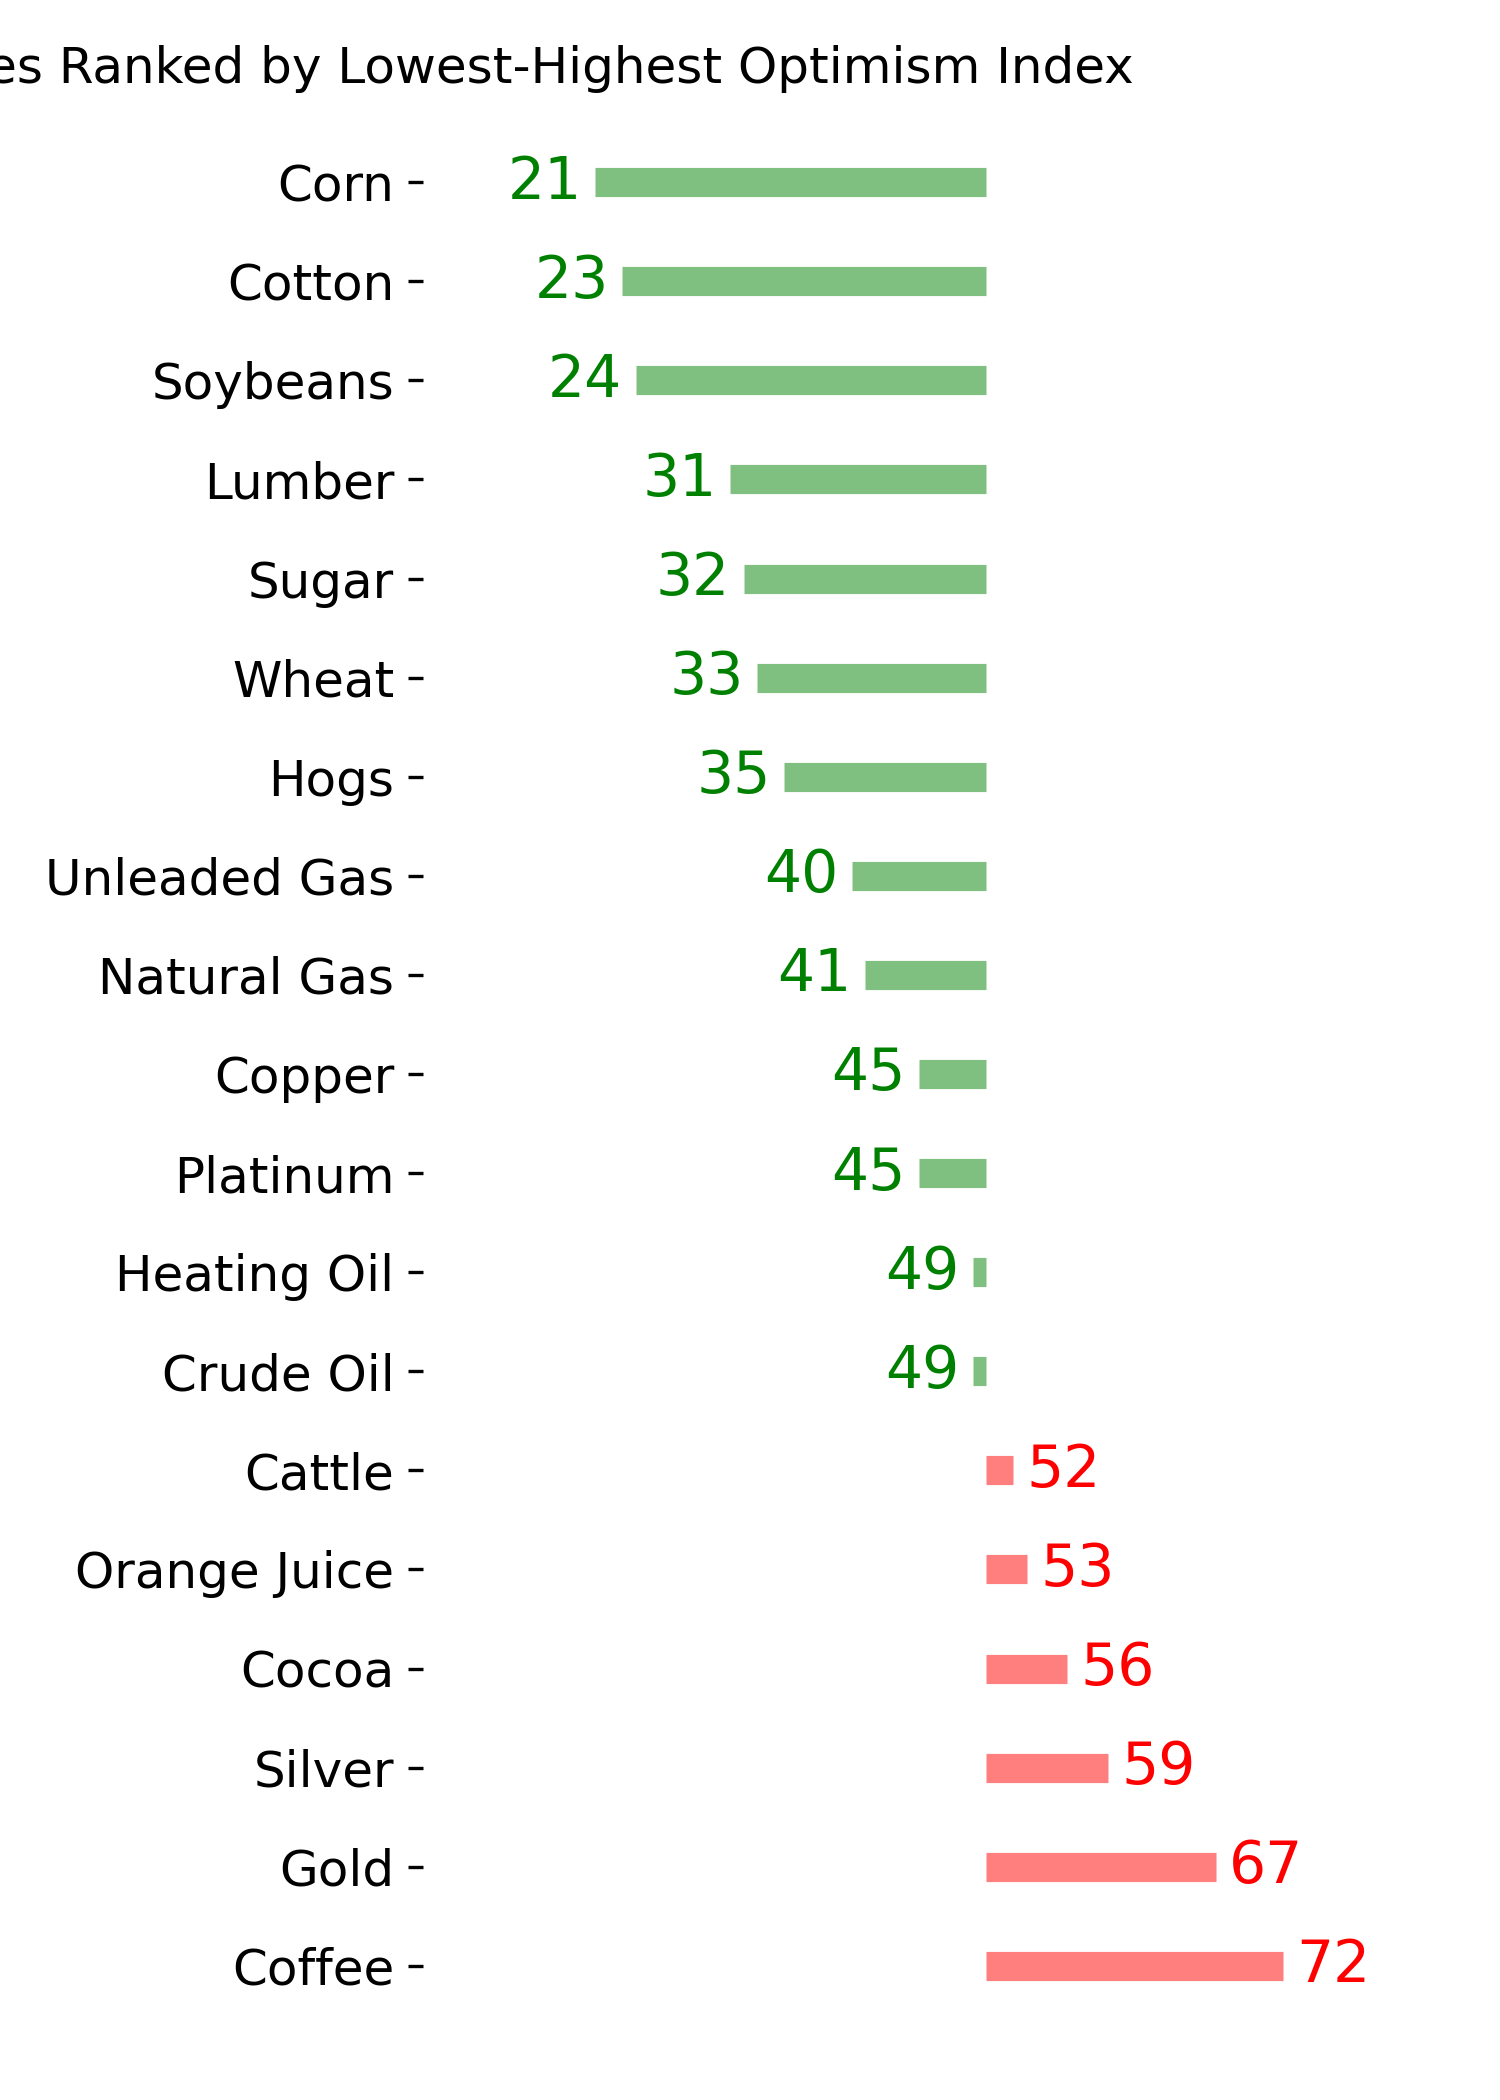
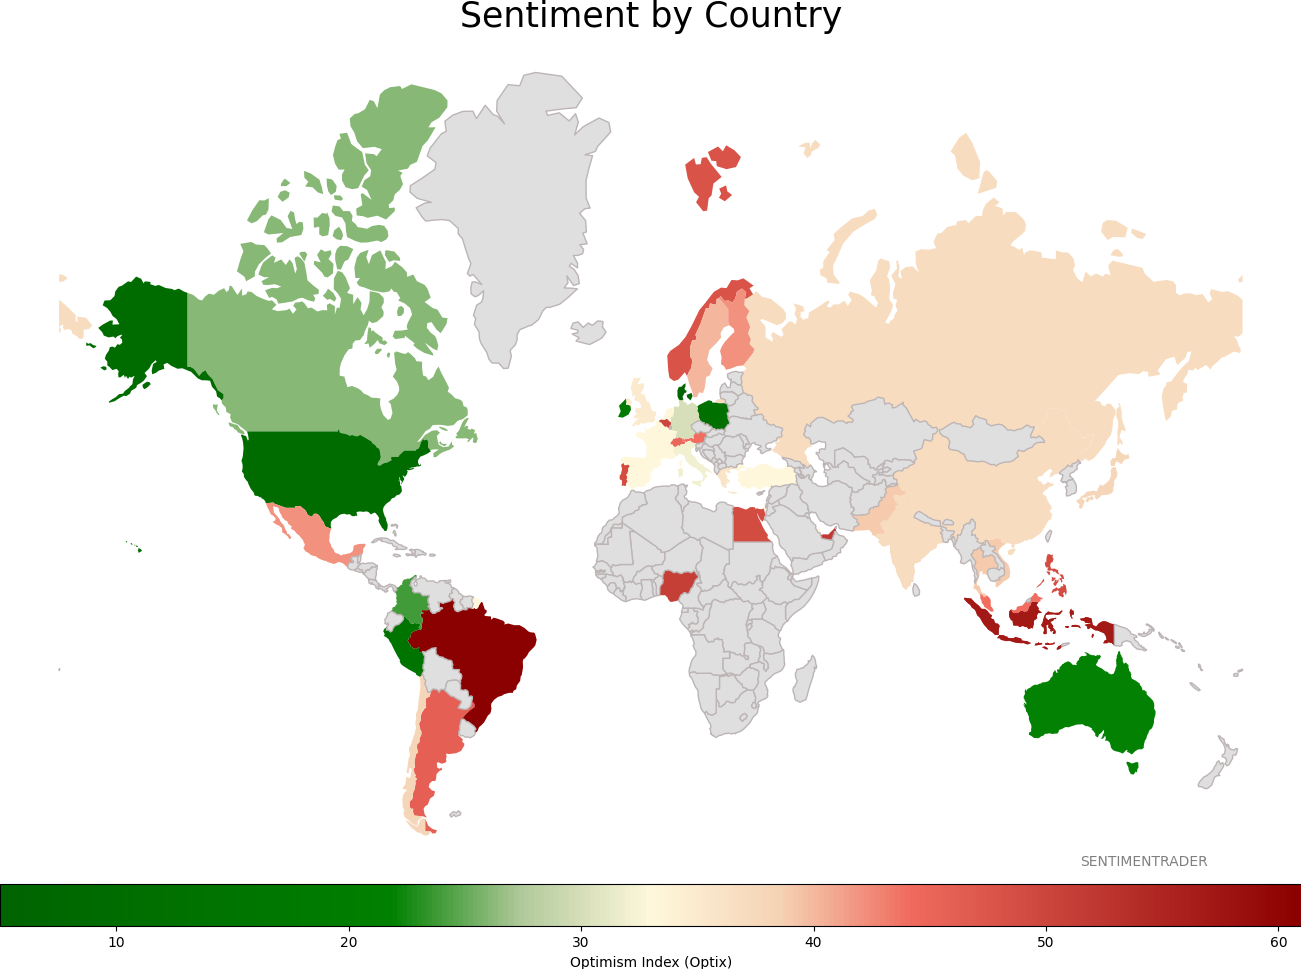
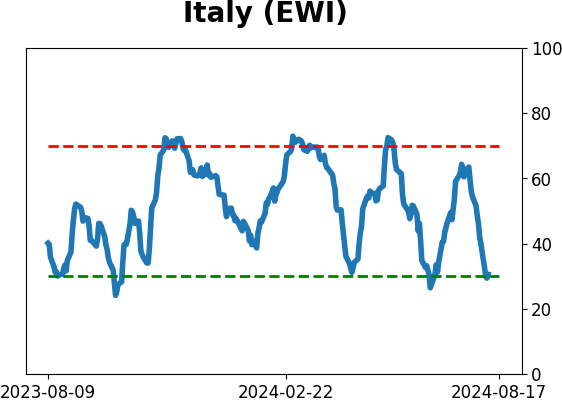
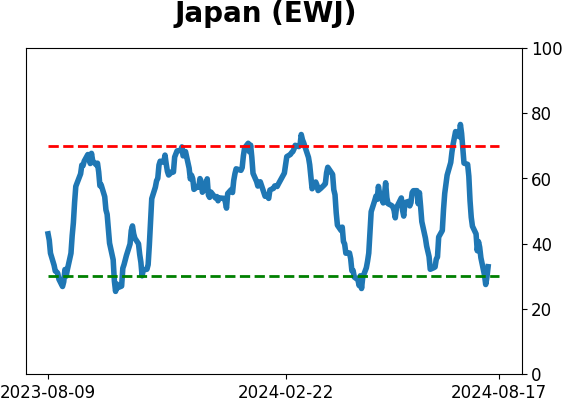
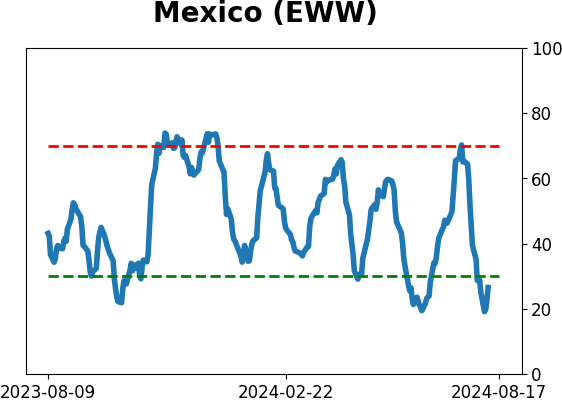
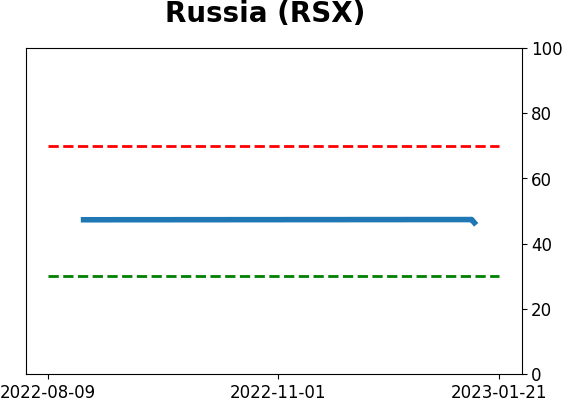
Sentiment Around The World
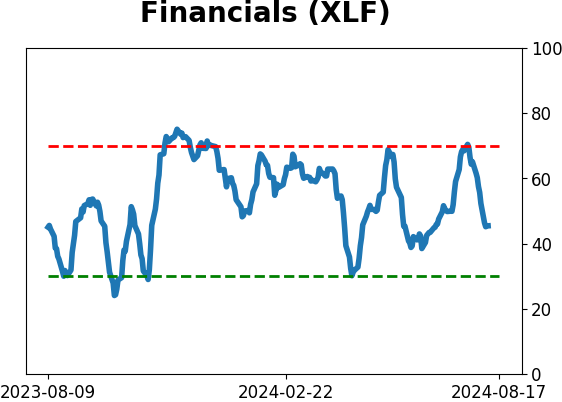
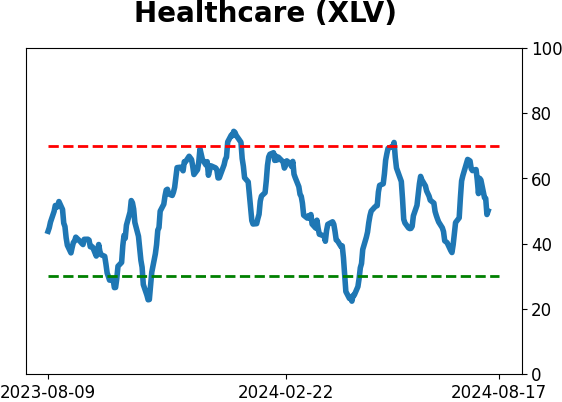
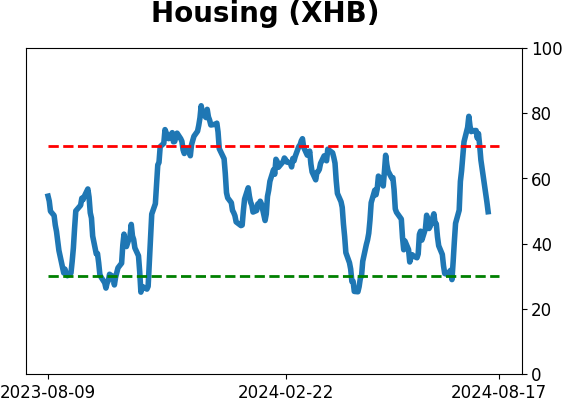
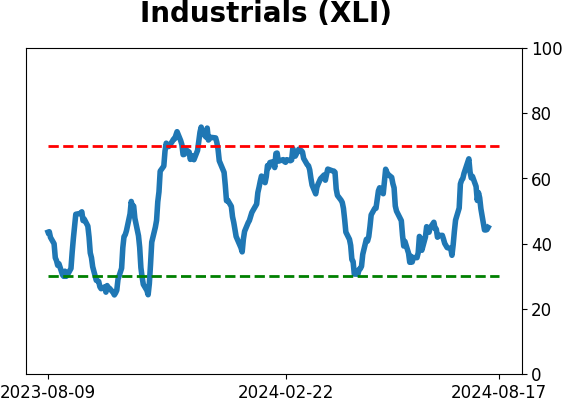
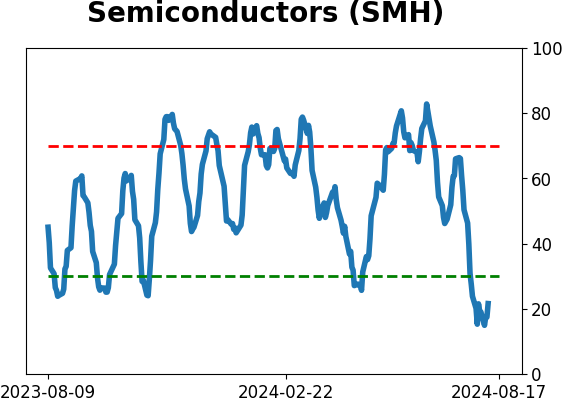
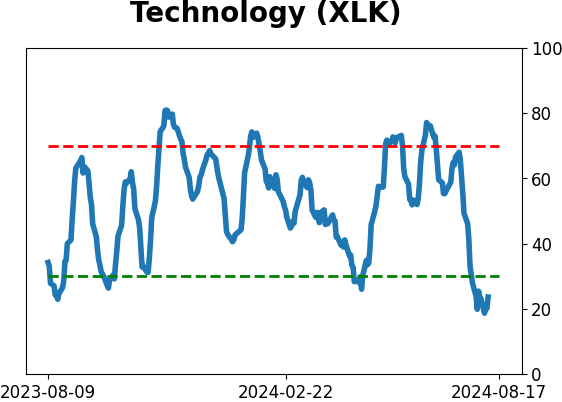
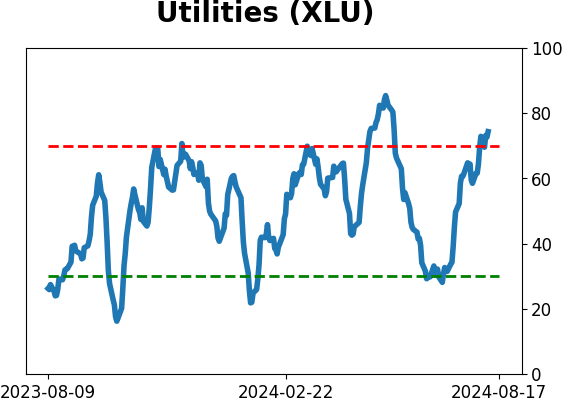
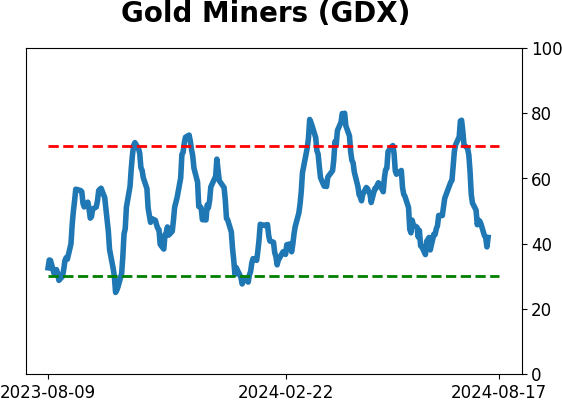
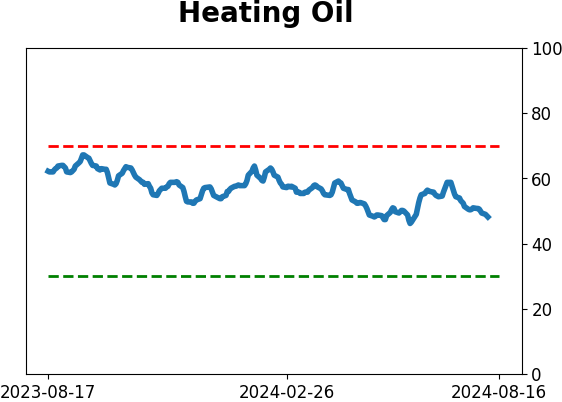
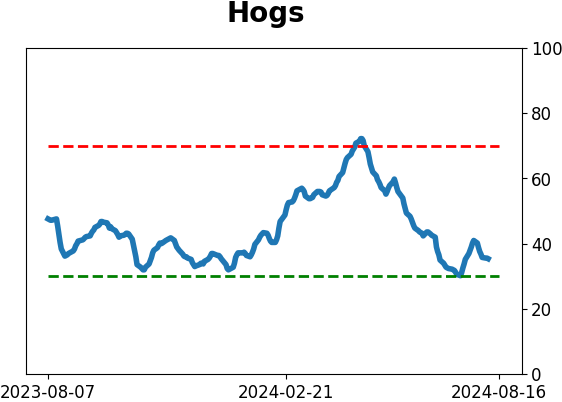
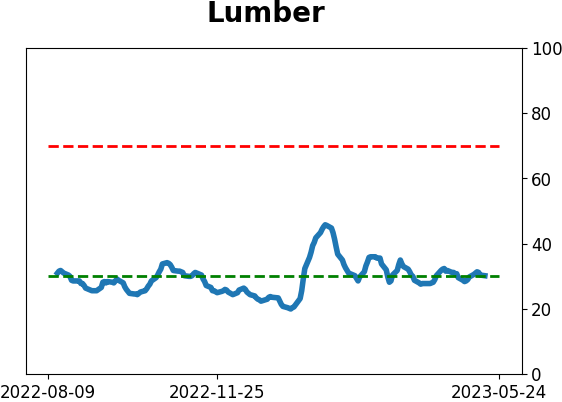
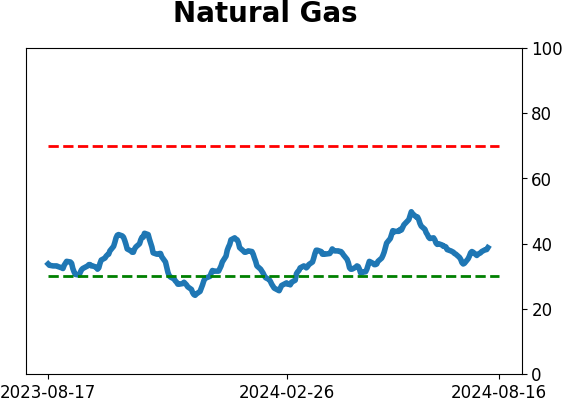
Optimism Index Thumbnails
|
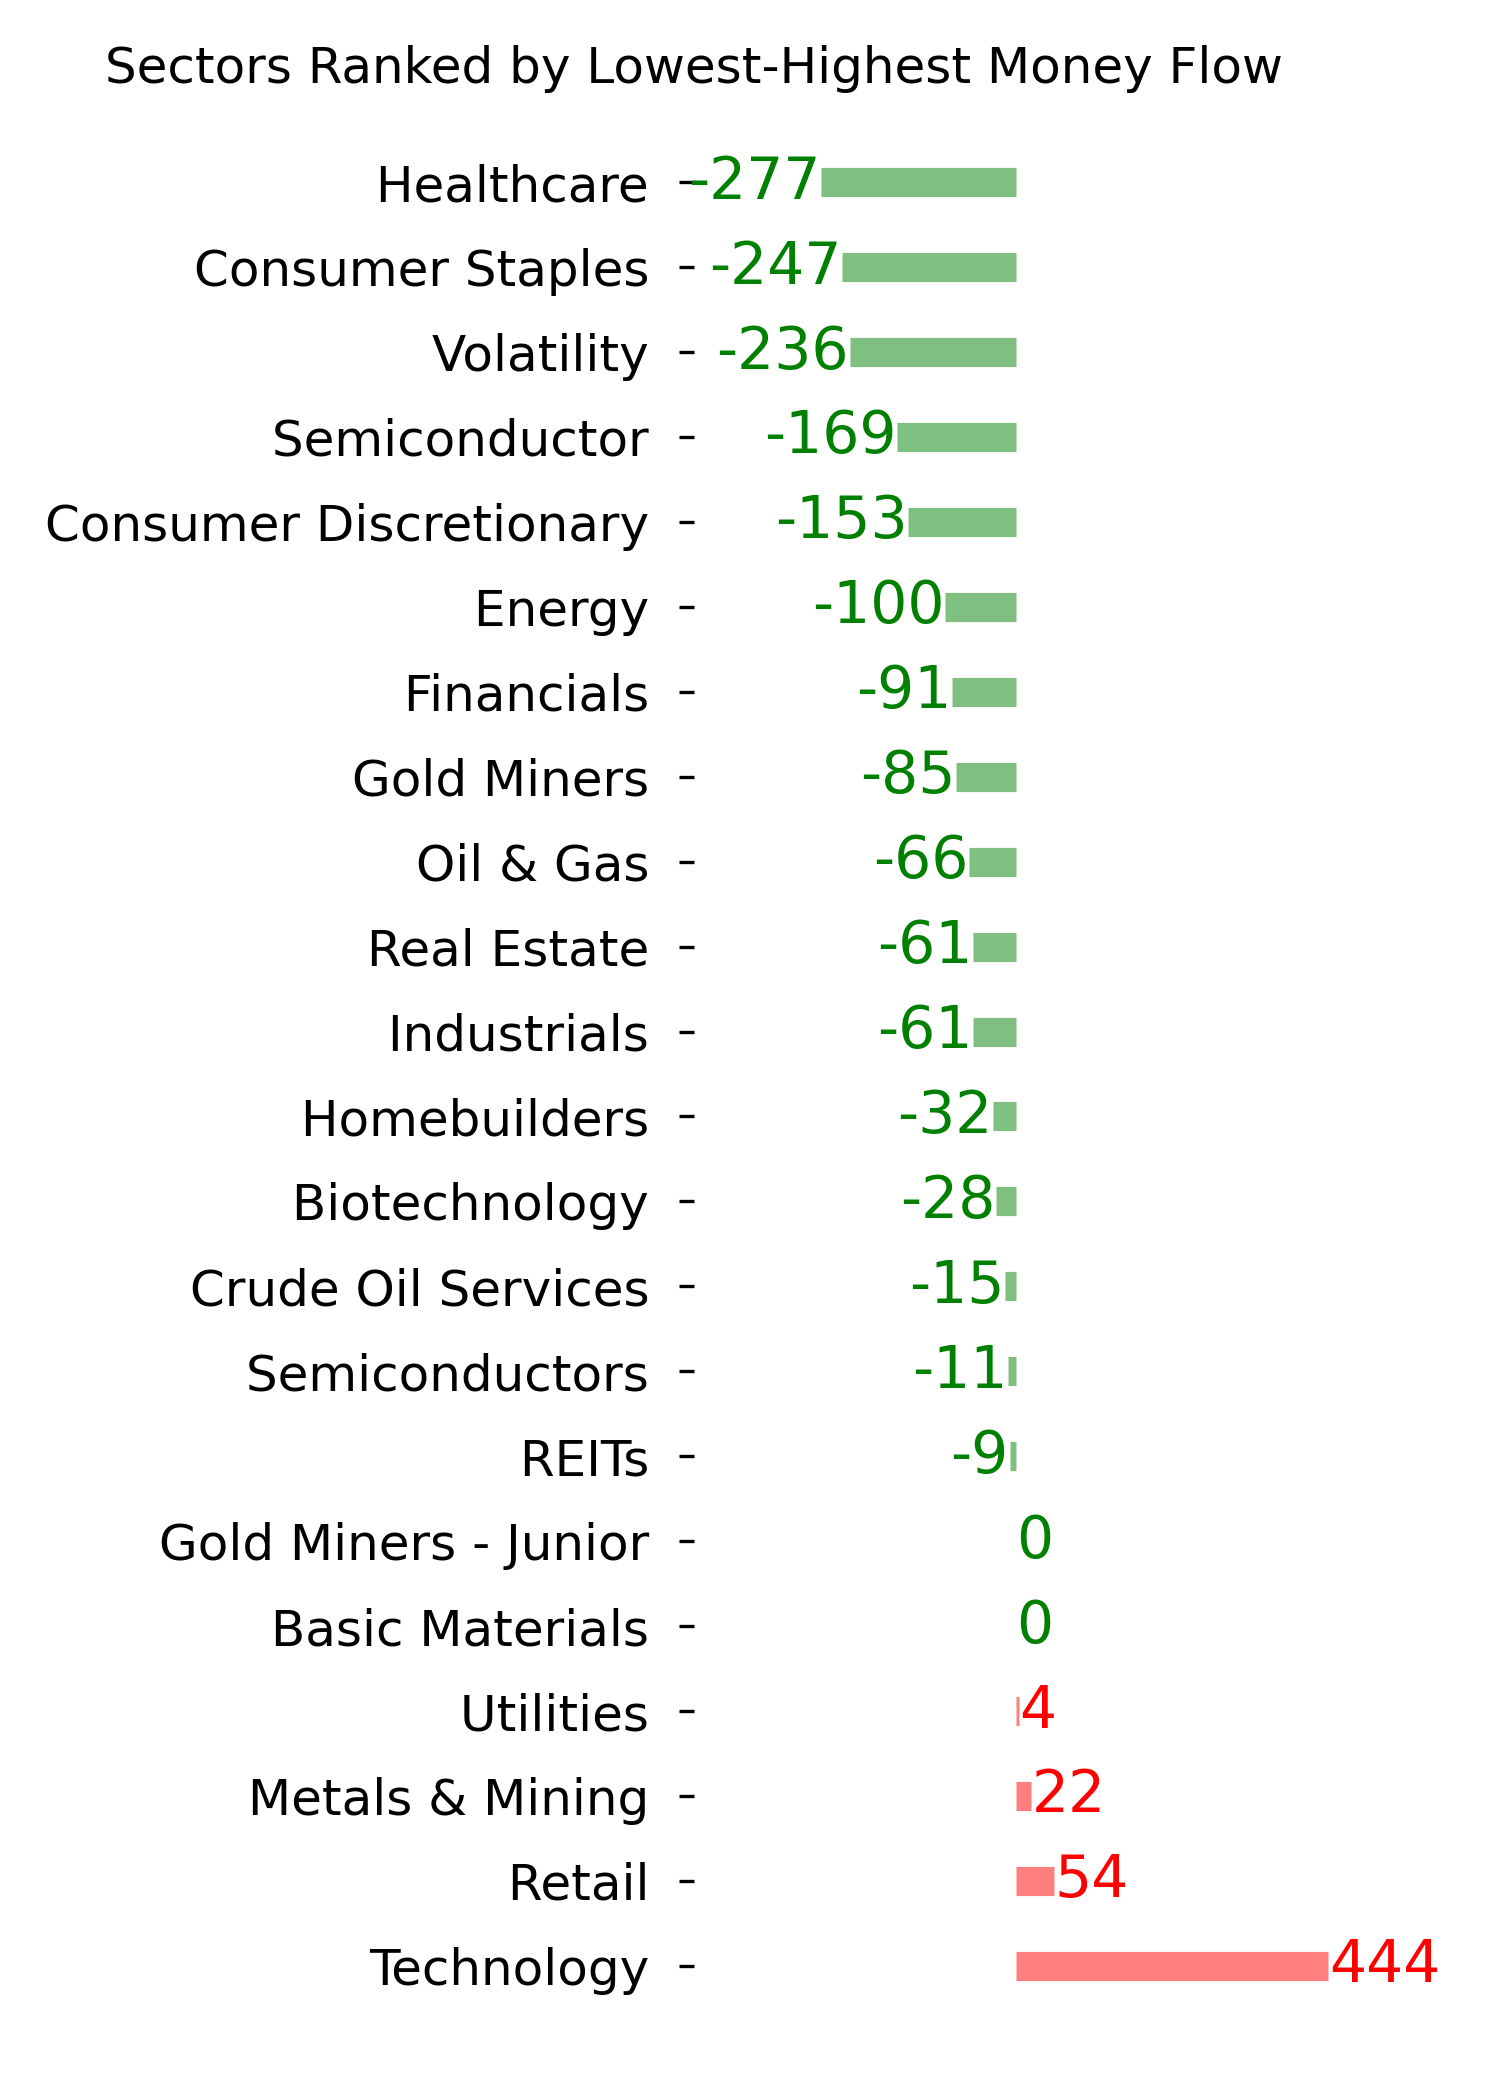
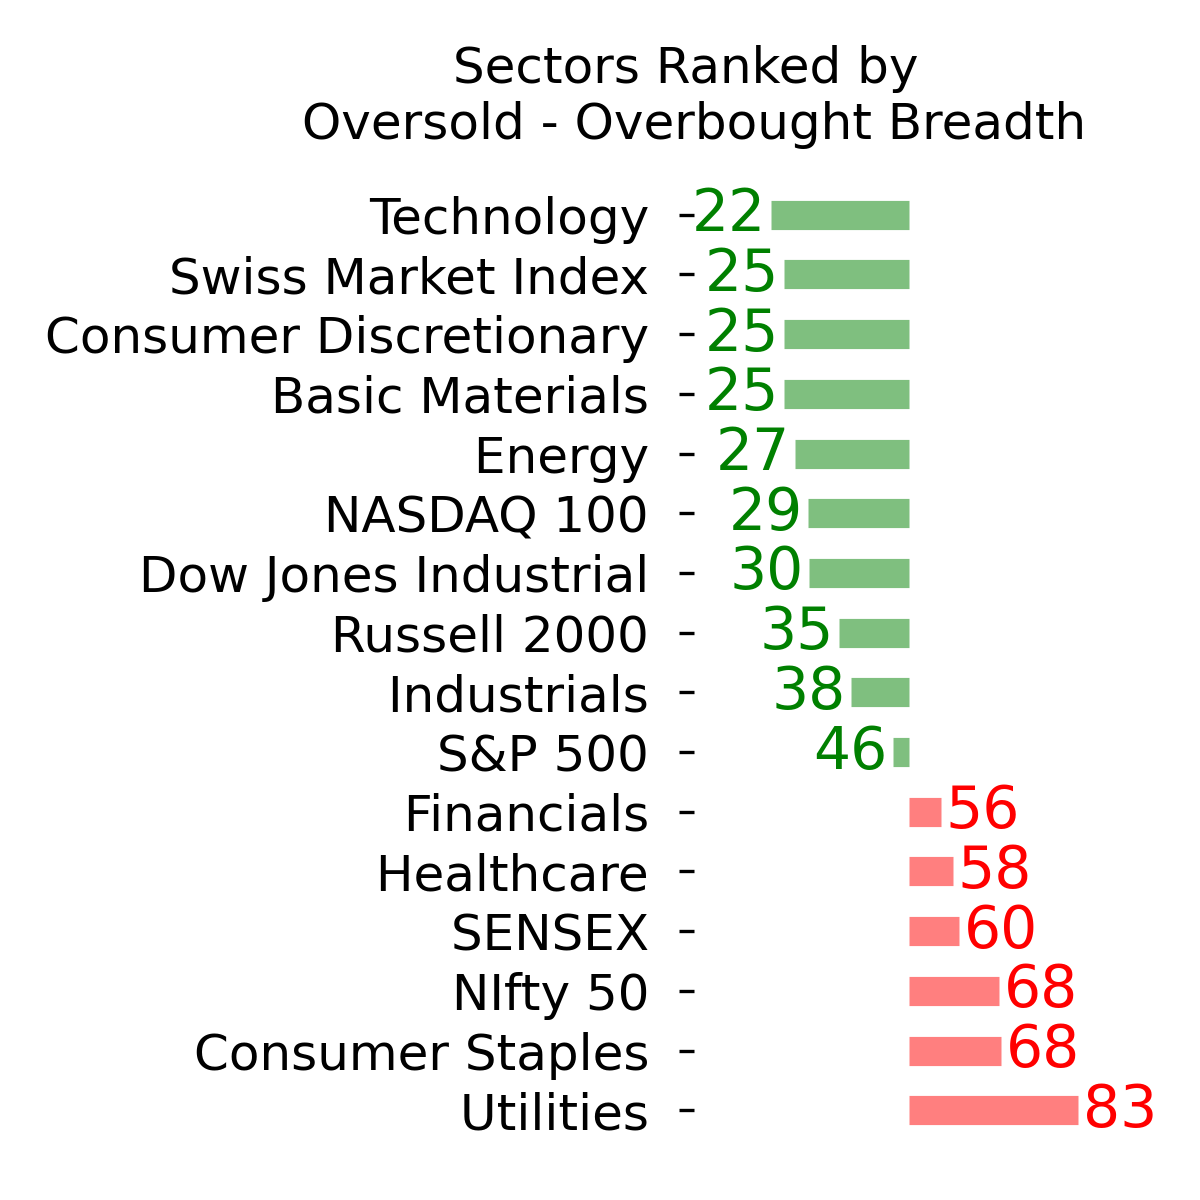
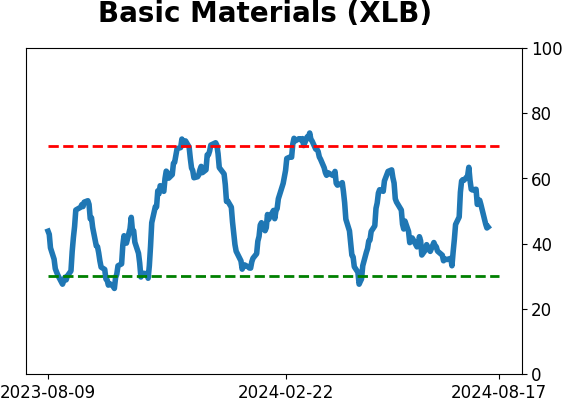
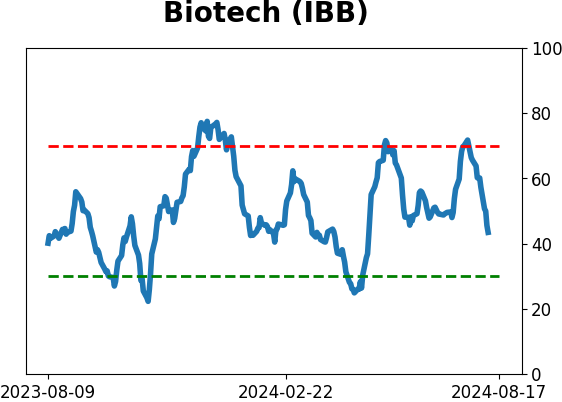
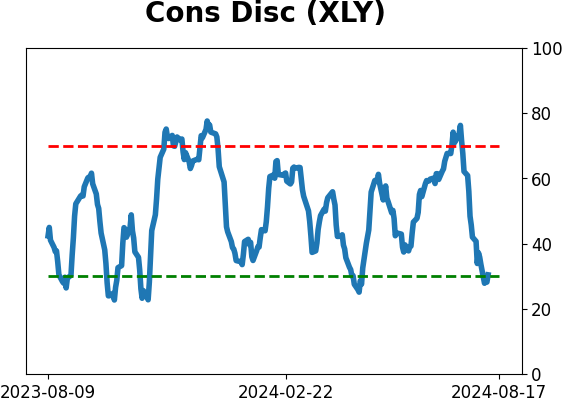
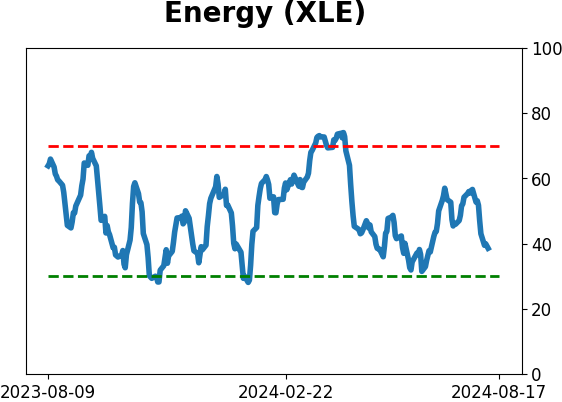
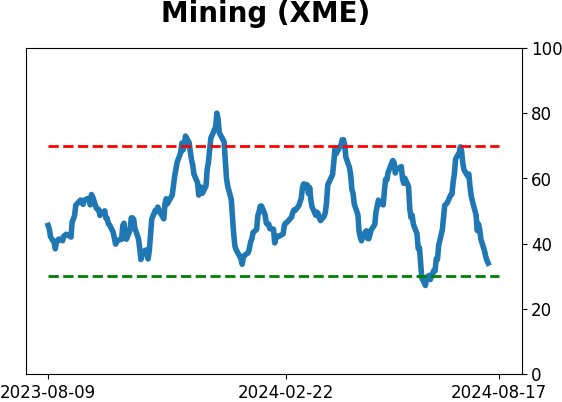
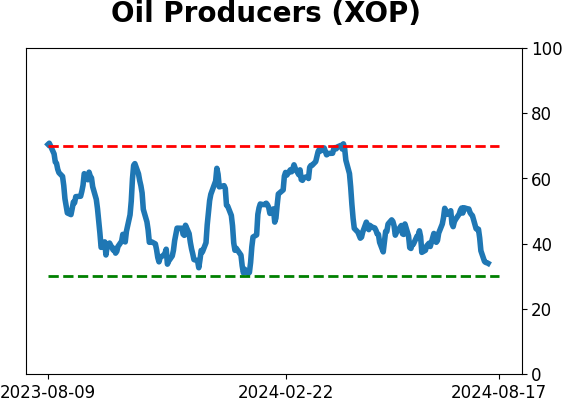
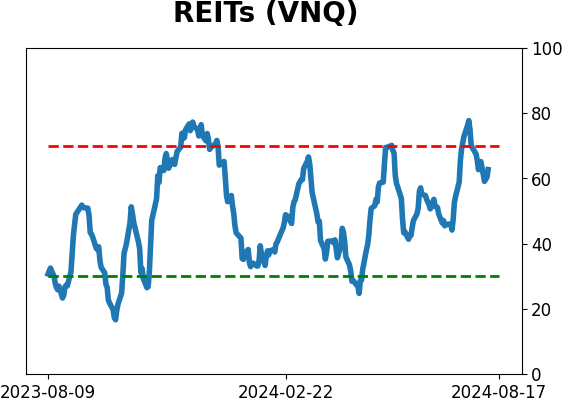
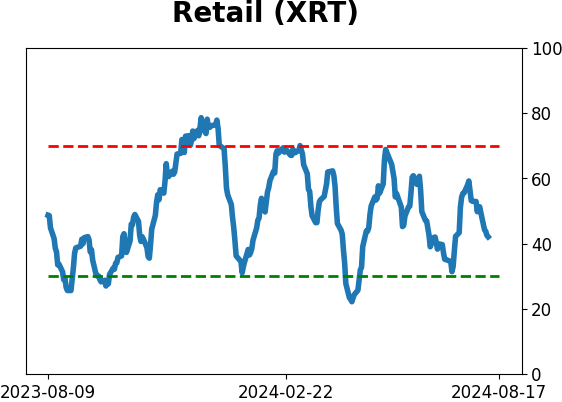
Sector ETF's - 10-Day Moving Average
|
|
|
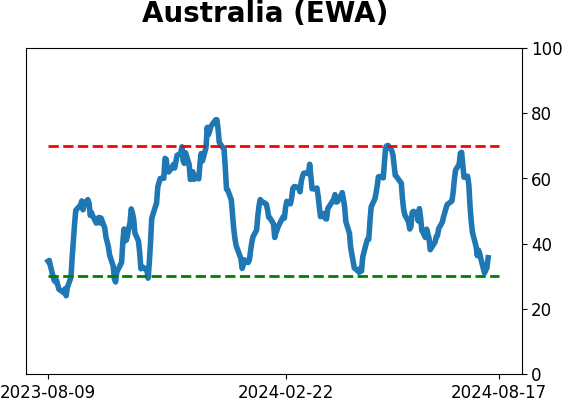
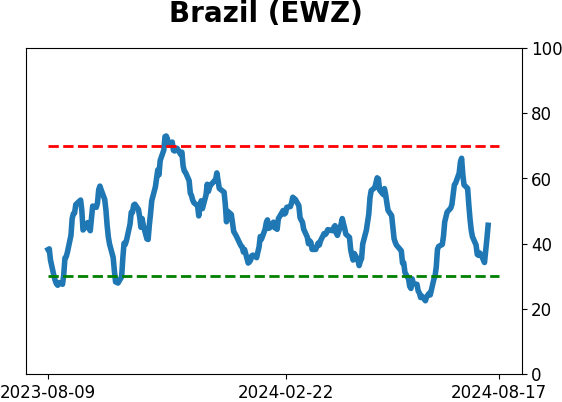
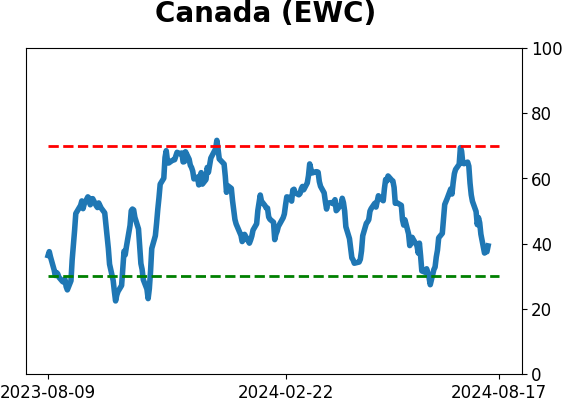
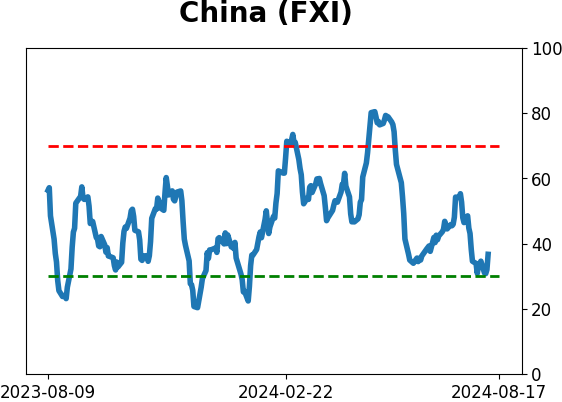
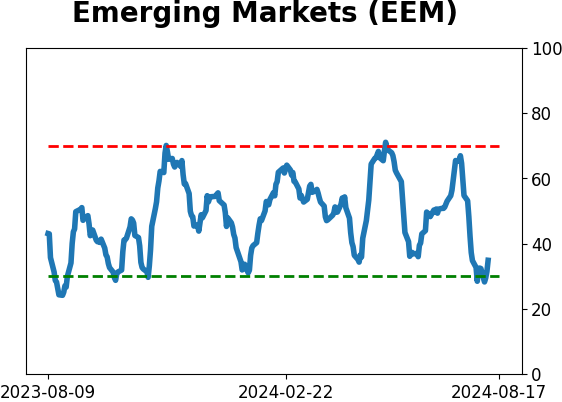
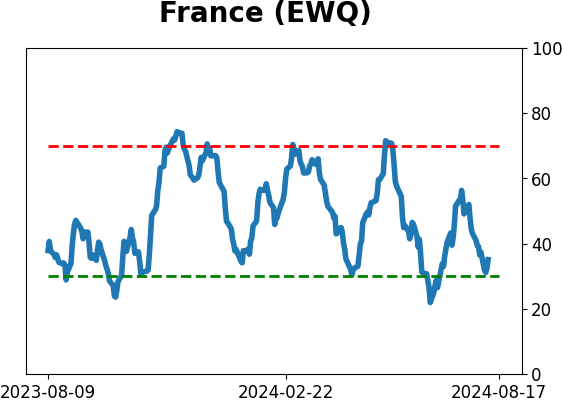
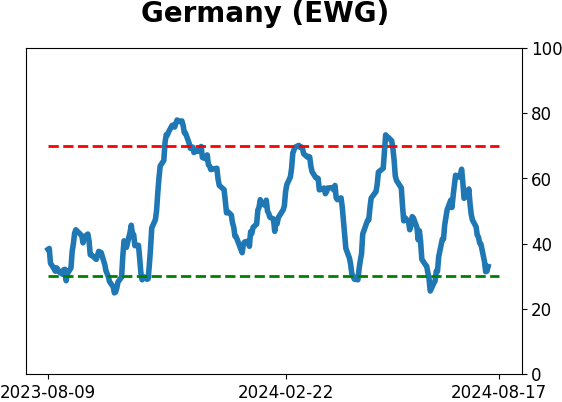
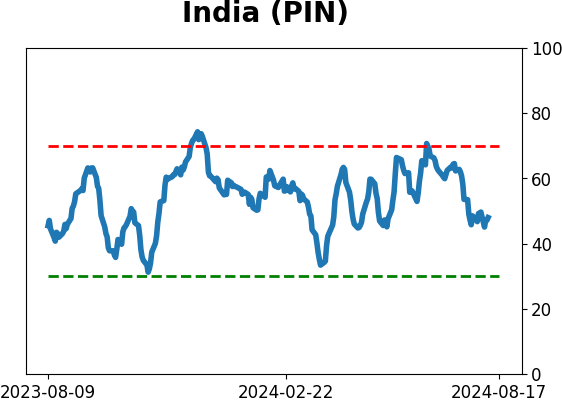
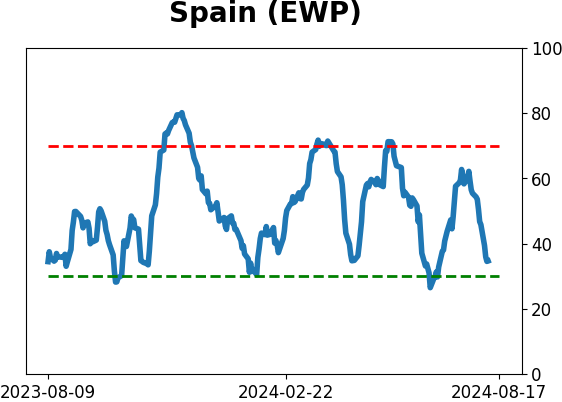
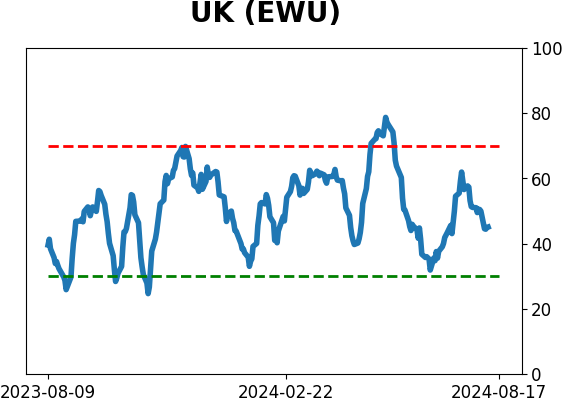
Country ETF's - 10-Day Moving Average
|
|
|
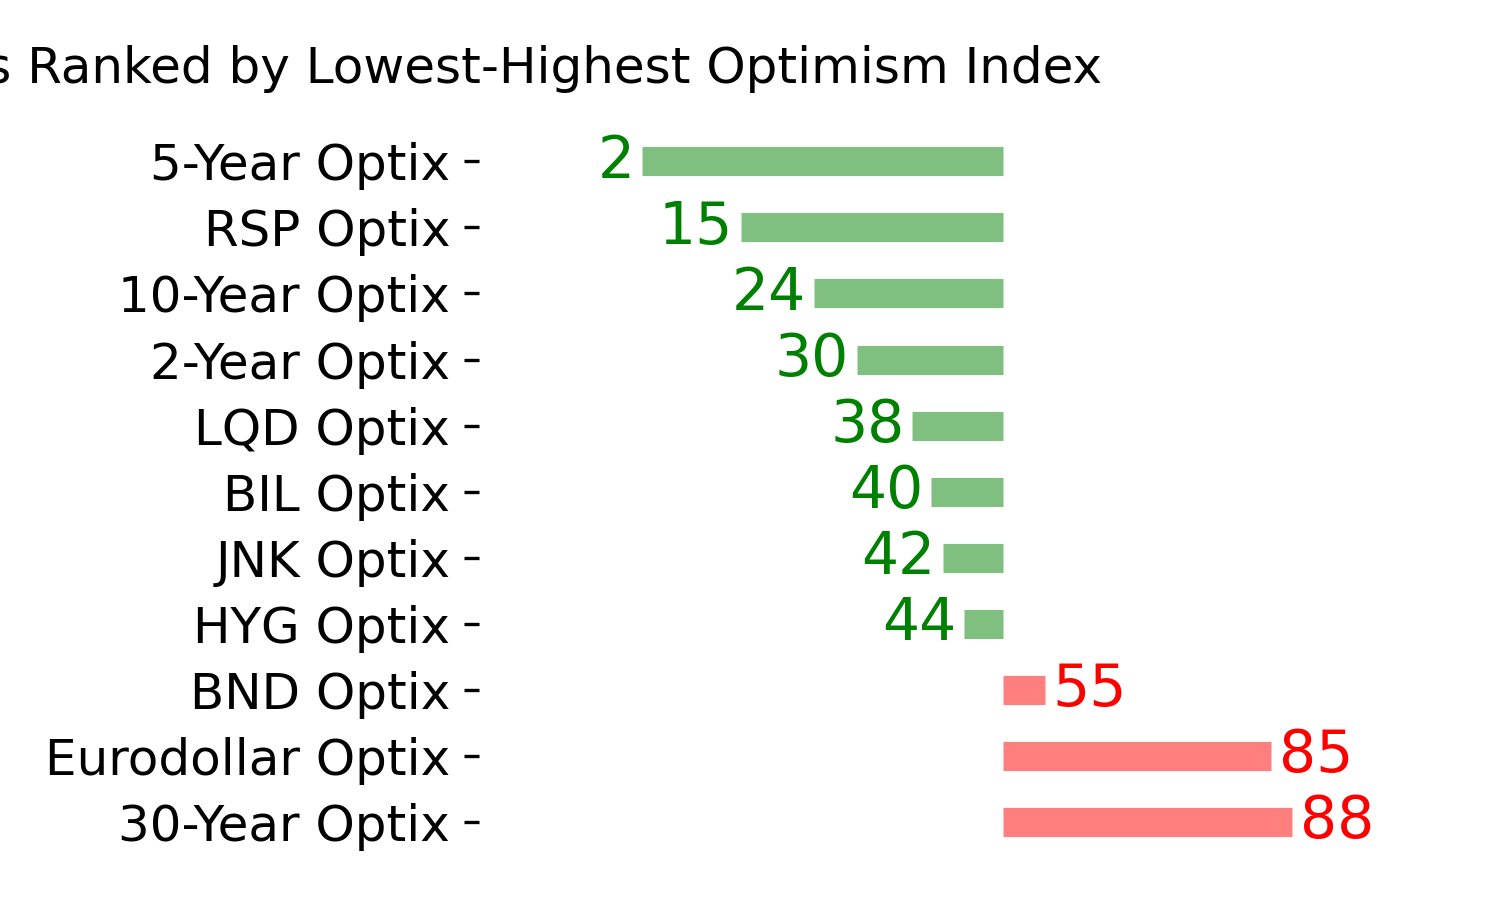
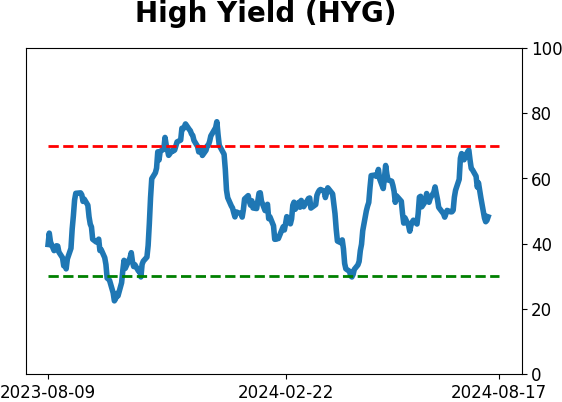
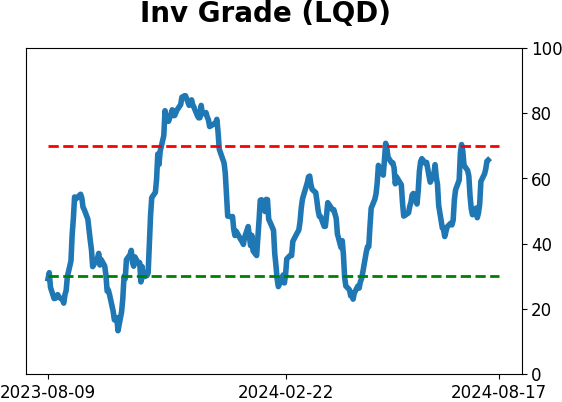
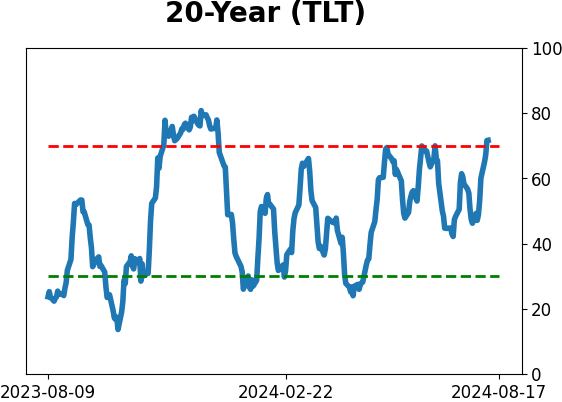
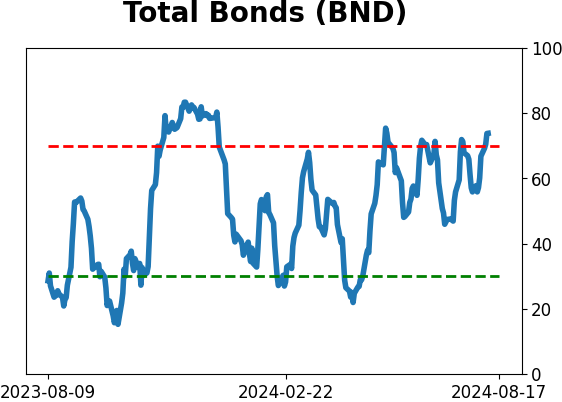
Bond ETF's - 10-Day Moving Average
|
|
|
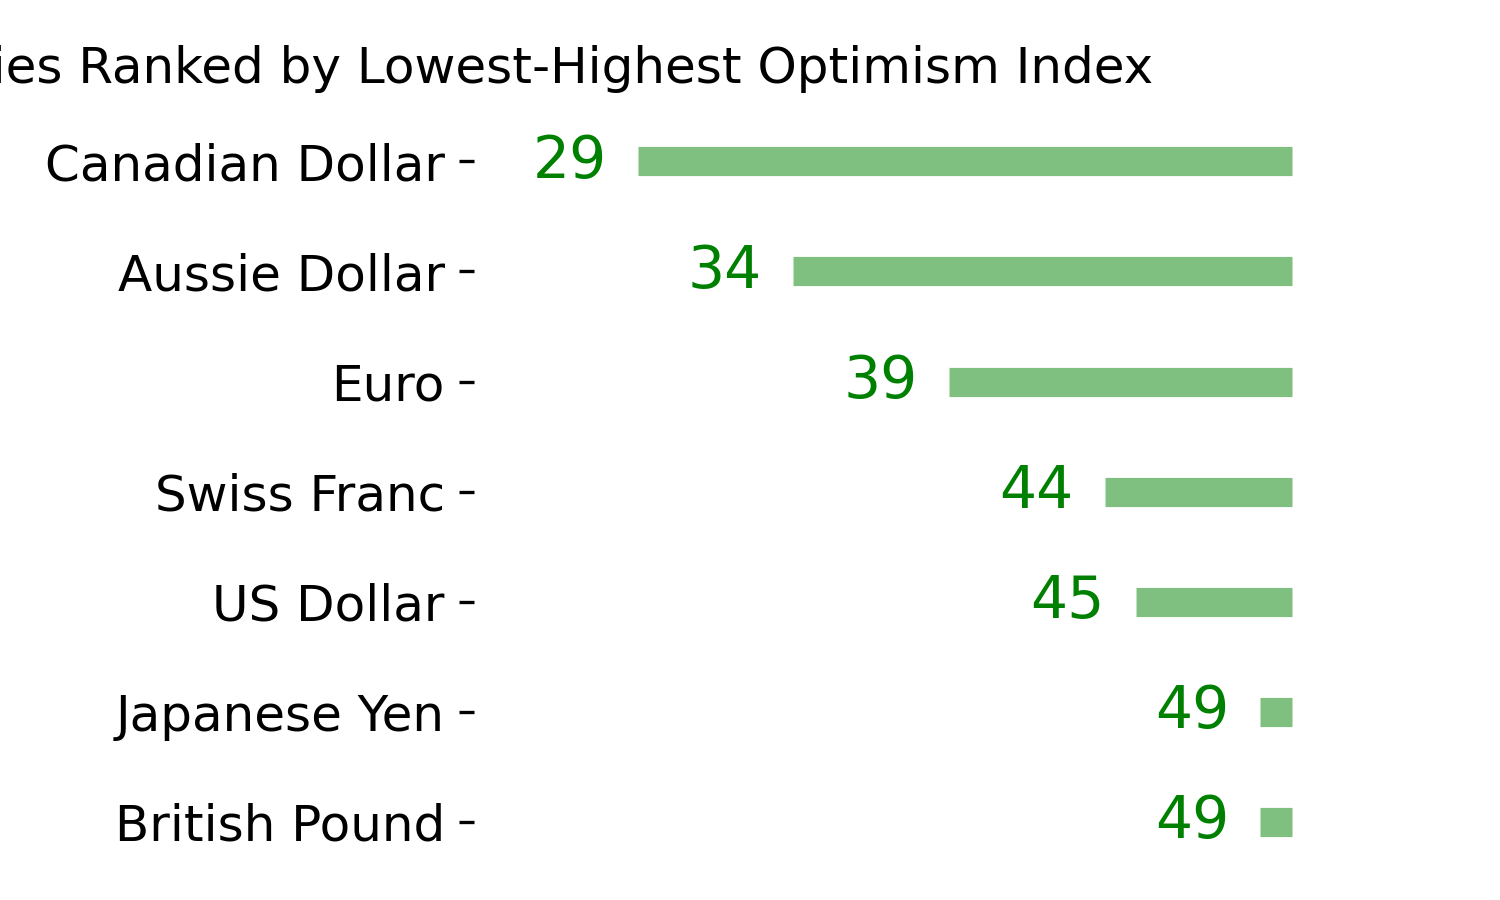
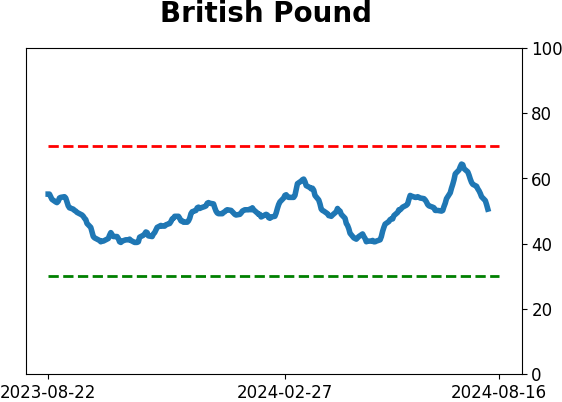
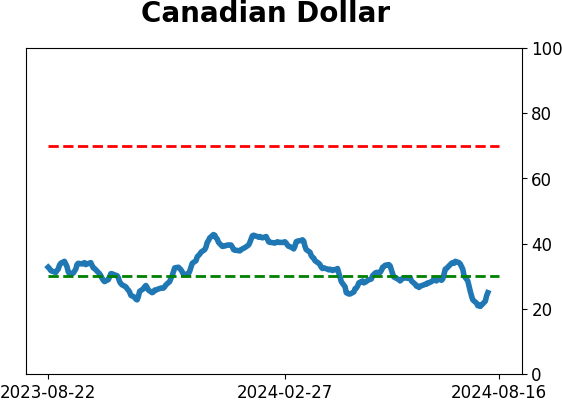
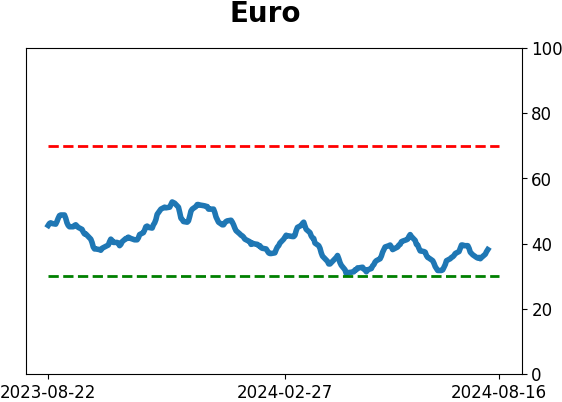
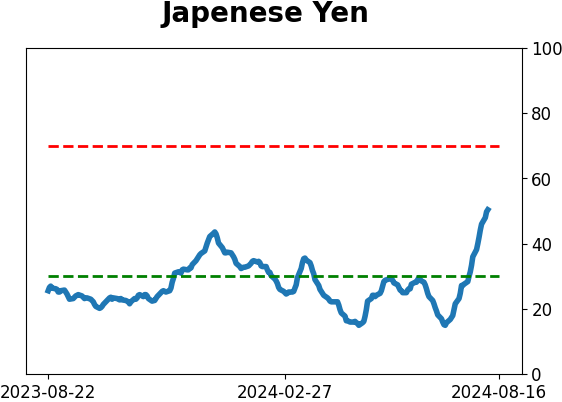
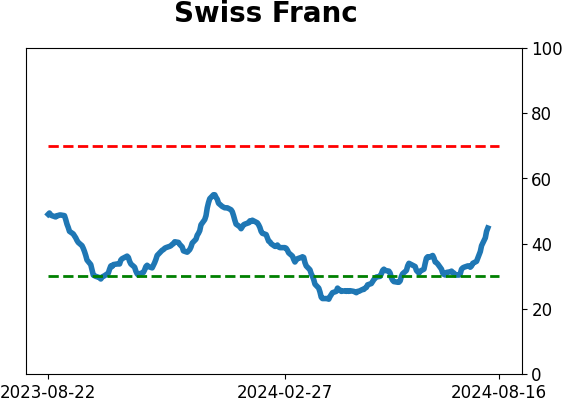
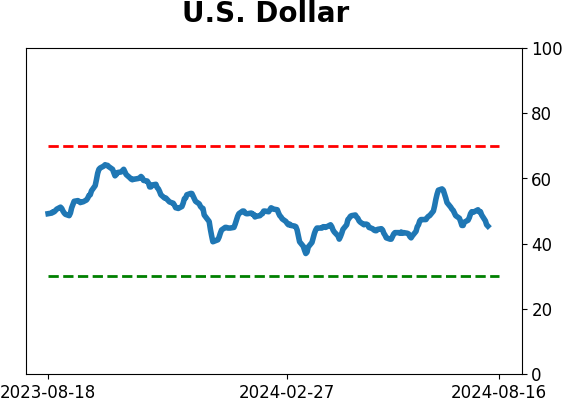
Currency ETF's - 5-Day Moving Average
|
|
|
Commodity ETF's - 5-Day Moving Average
|
|