Headlines
|
|
The S&P has shrugged off an earnings recession:
Earnings for S&P 500 companies have declined year-over-year for three consecutive quarters. Most earnings recessions don't last much beyond four quarters. When stock prices held up well despite declining earnings, forward returns were consistently positive as earnings caught up.
|
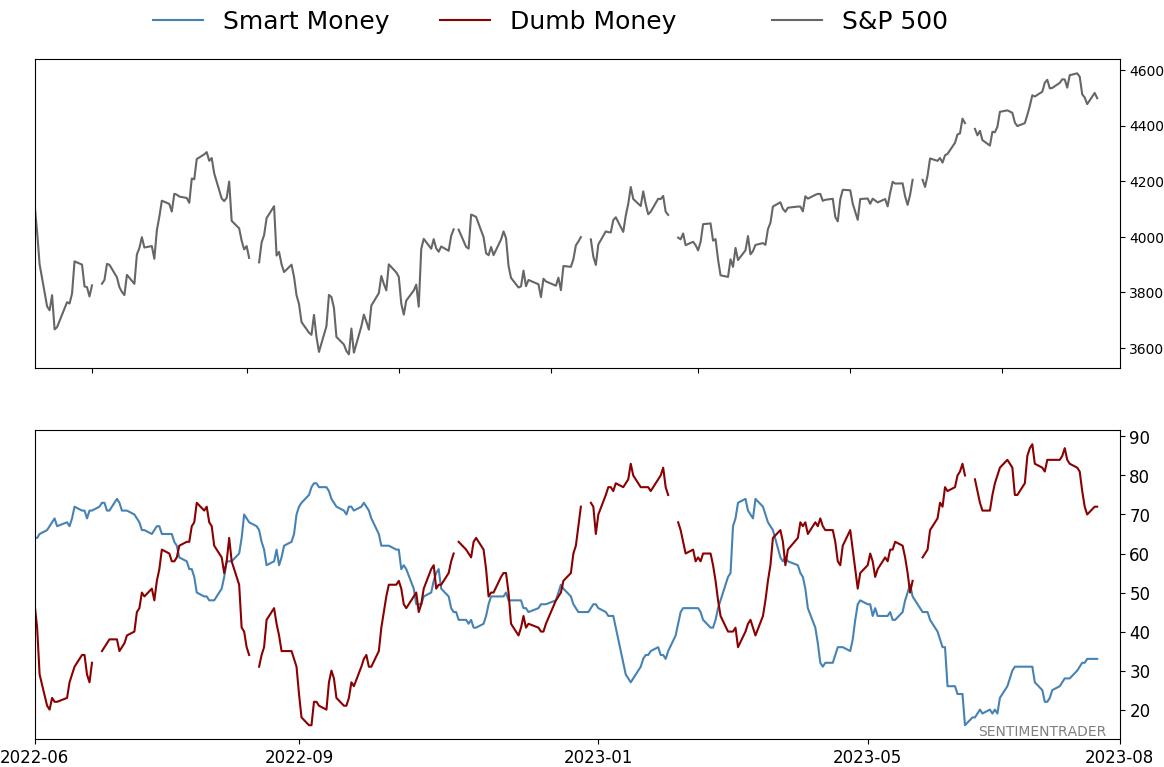
Smart / Dumb Money Confidence
|
Smart Money Confidence: 33%
Dumb Money Confidence: 72%
|
|
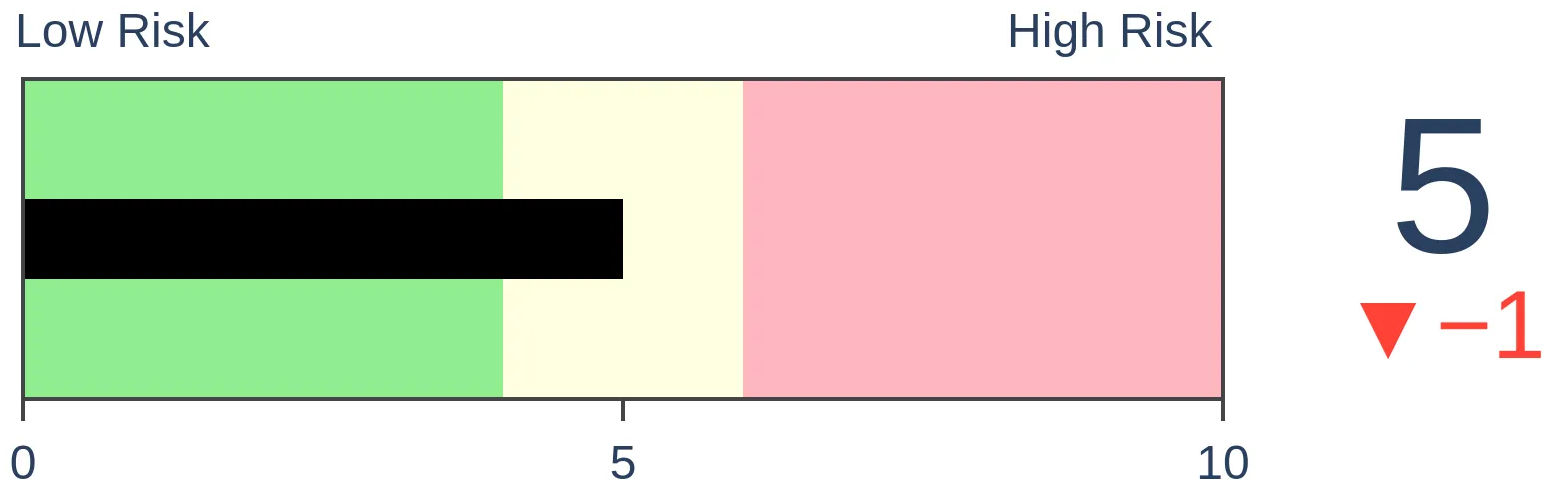
Risk Levels
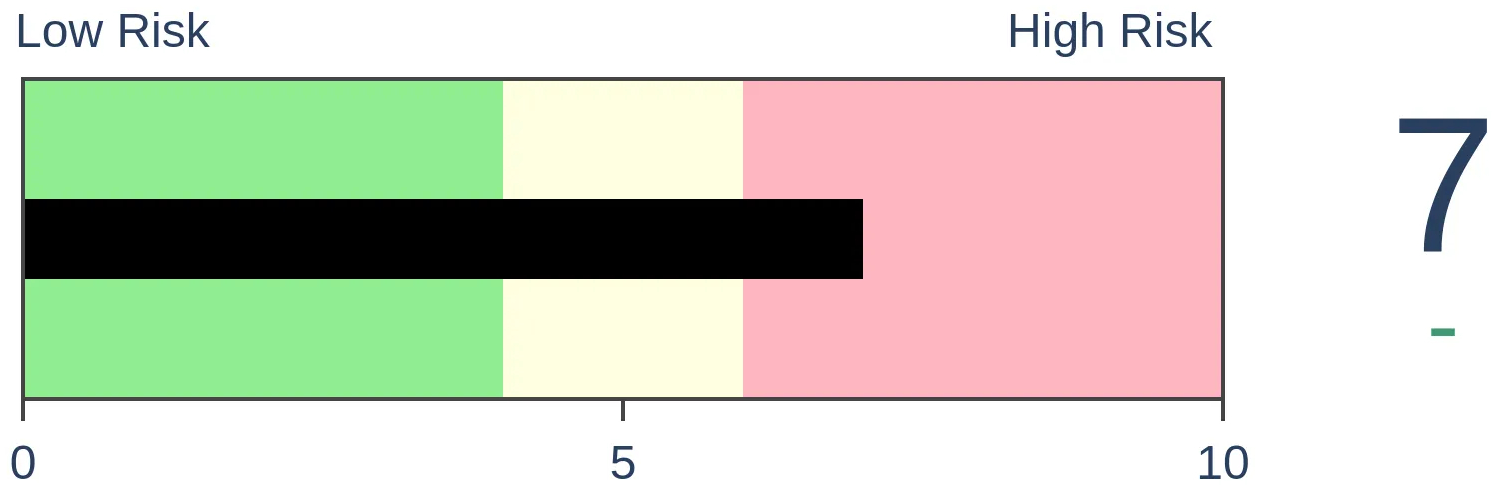
Stocks Short-Term
|
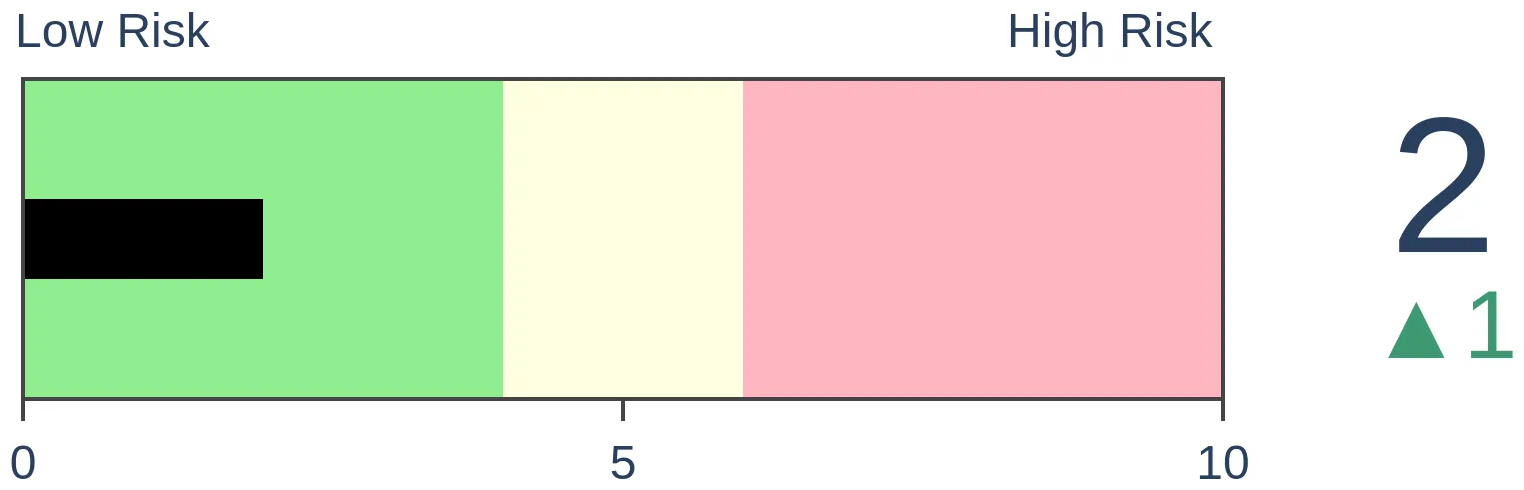
Stocks Medium-Term
|
|
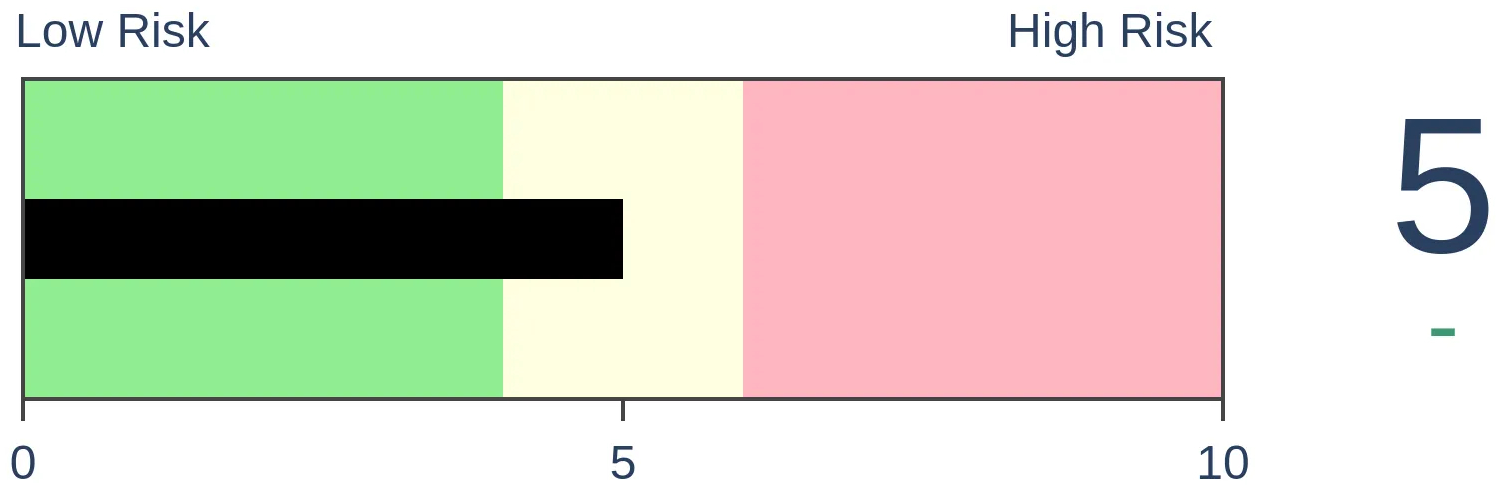
Bonds
|
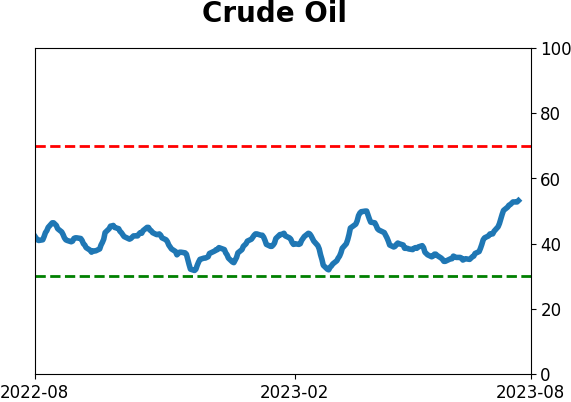
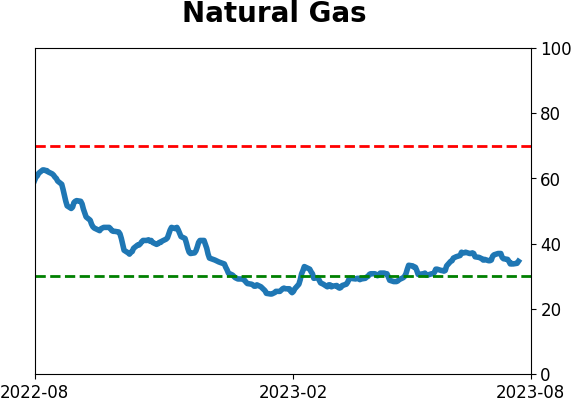
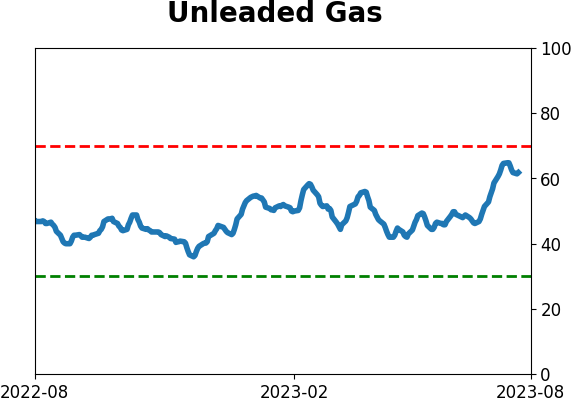
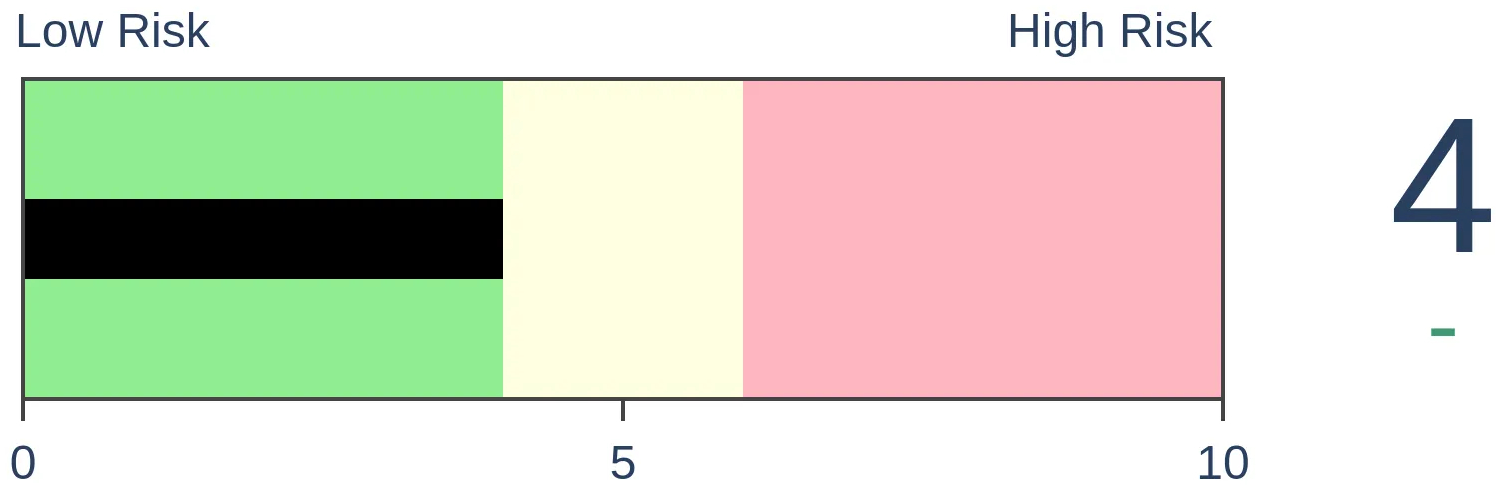
Crude Oil
|
|
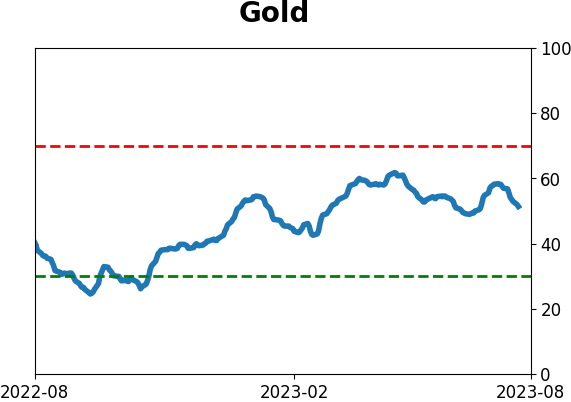
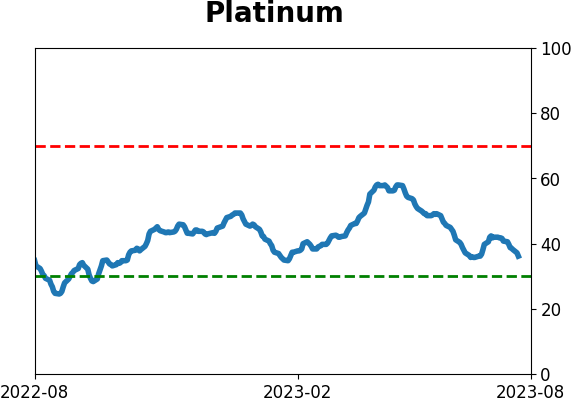
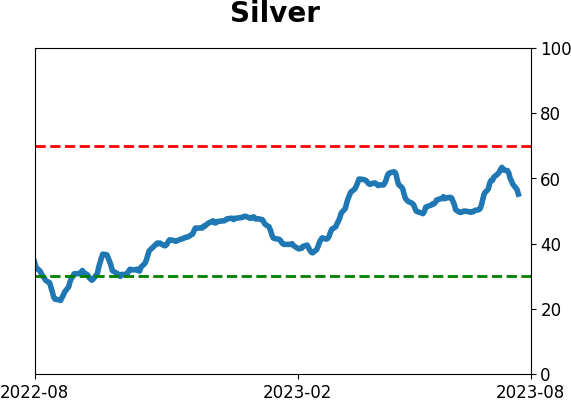
Gold

|
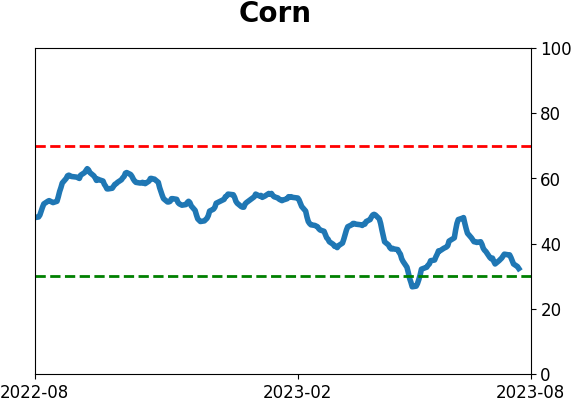
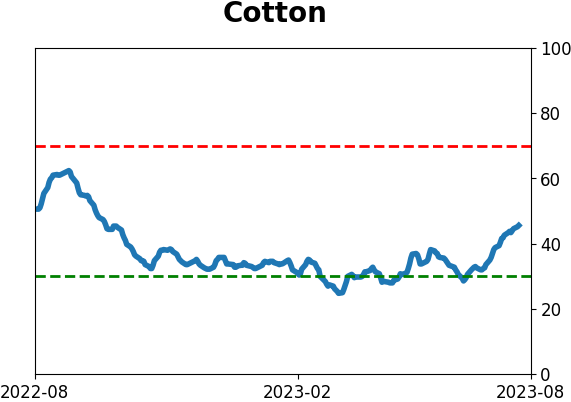
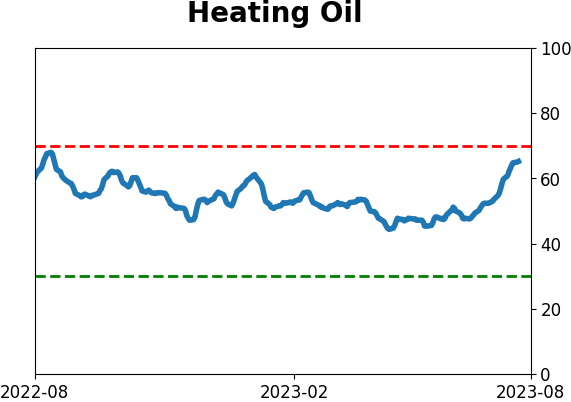
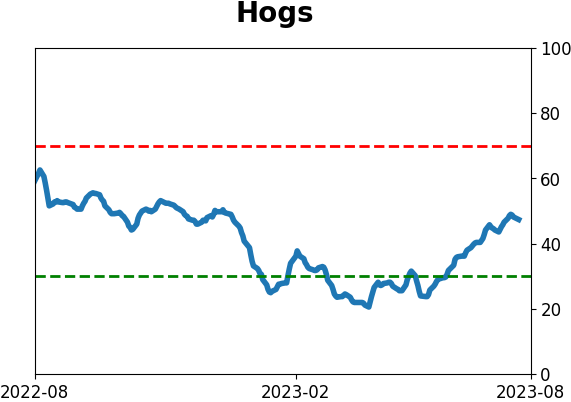
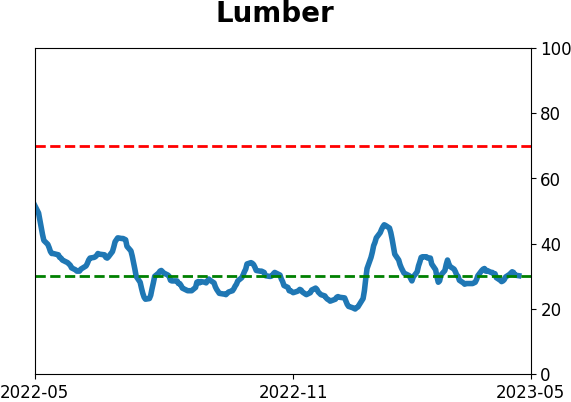
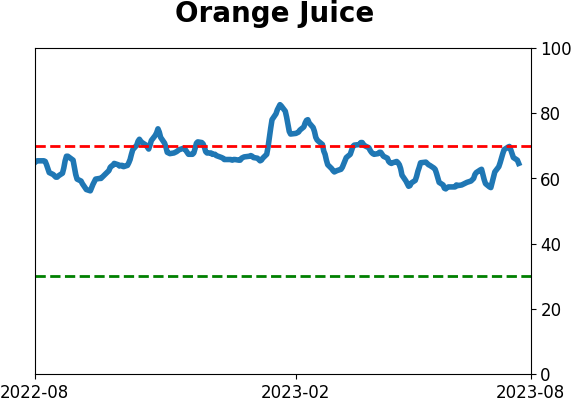
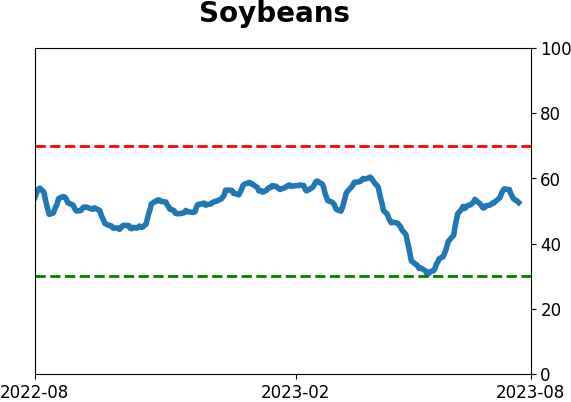
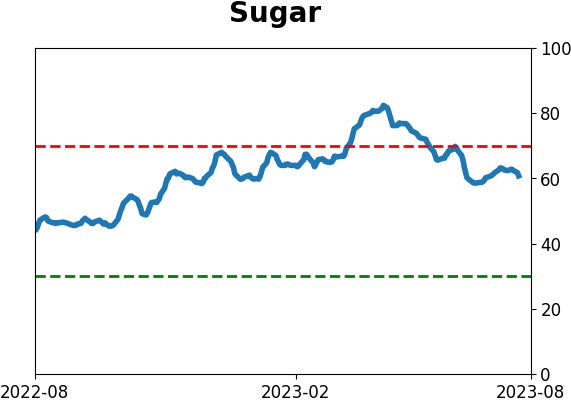
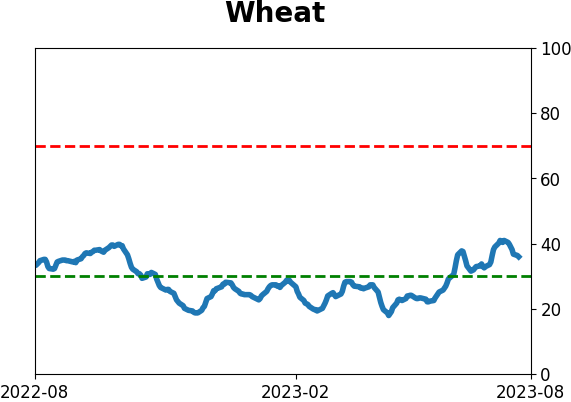
Agriculture
|
|
Research
By Jason Goepfert
BOTTOM LINE
Earnings for S&P 500 companies have declined year-over-year for three consecutive quarters. Most earnings recessions don't last much beyond four quarters. When stock prices held up well despite declining earnings, forward returns were consistently positive as earnings caught up.
FORECAST / TIMEFRAME
None
|
Key points:
- Earnings among S&P 500 companies have declined for three consecutive quarters
- Earnings declines rarely last beyond four consecutive quarters
- When prices held up despite declining earnings, forward returns were above average
An earnings recession
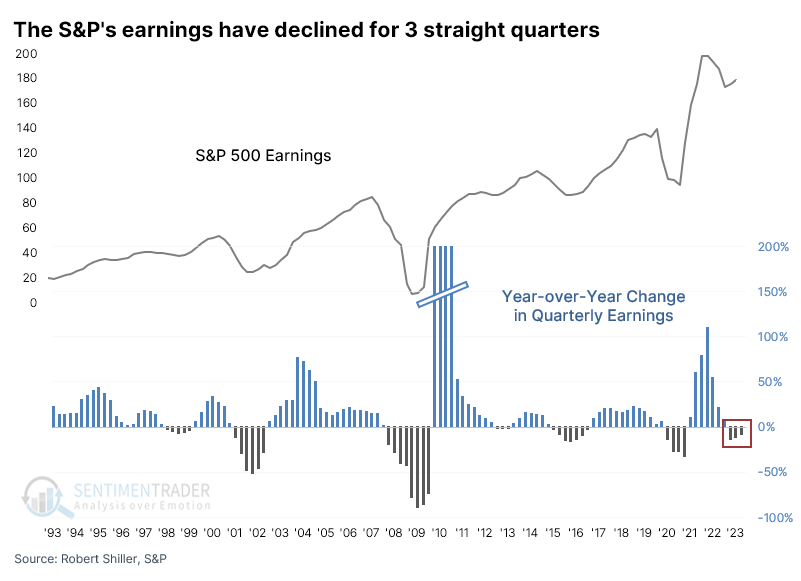
Earnings are dropping, and there is no letup in sight. That has unnerved investors and may explain part of the recent retreat from the months-long rally.
As noted by The Wall Street Journal:
The members of the S&P 500 are on pace to collectively report a 5.2% decline in earnings, their worst performance since 2020. Revenue is on track to rise 0.6% from a year ago, according to FactSet.
While sources vary on the exact makeup and level of earnings for stocks within the S&P 500, the trend is universal - it's down. According to data from Standard & Poors and Robert Shiller, earnings for the S&P have, indeed, declined for three consecutive quarters. By "decline," we mean lower than the same quarter for the prior year.
It's relatively rare to see a streak of three consecutive year-over-year earnings declines. Since 1928, it has happened 19 times, including the current streak.
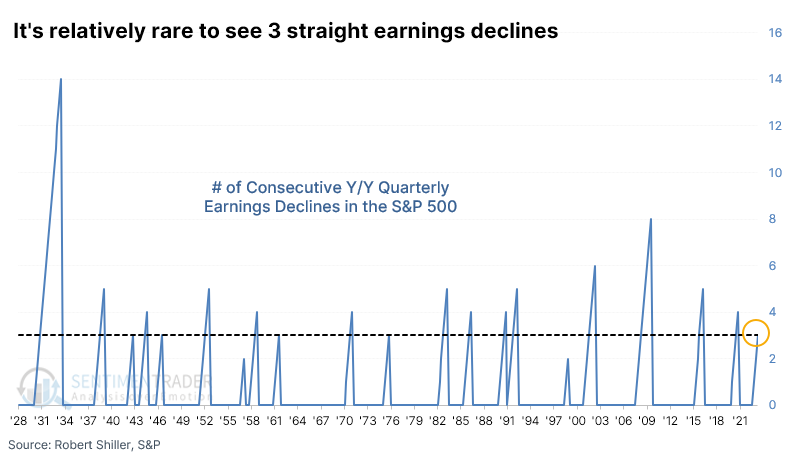
The streaks haven't typically gone much longer. Only eight of them lasted for five or more consecutive quarters.
# of Consecutive Declines | # of Instances |
3 | 19 |
4 | 14 |
5 | 8 |
6 | 3 |
When earnings declined (and declined and declined), returns were decent
The table below shows how the S&P 500 performed after a streak of three consecutive earnings declines. Overall, the returns weren't too bad and were actually quite impressive over the following quarter.
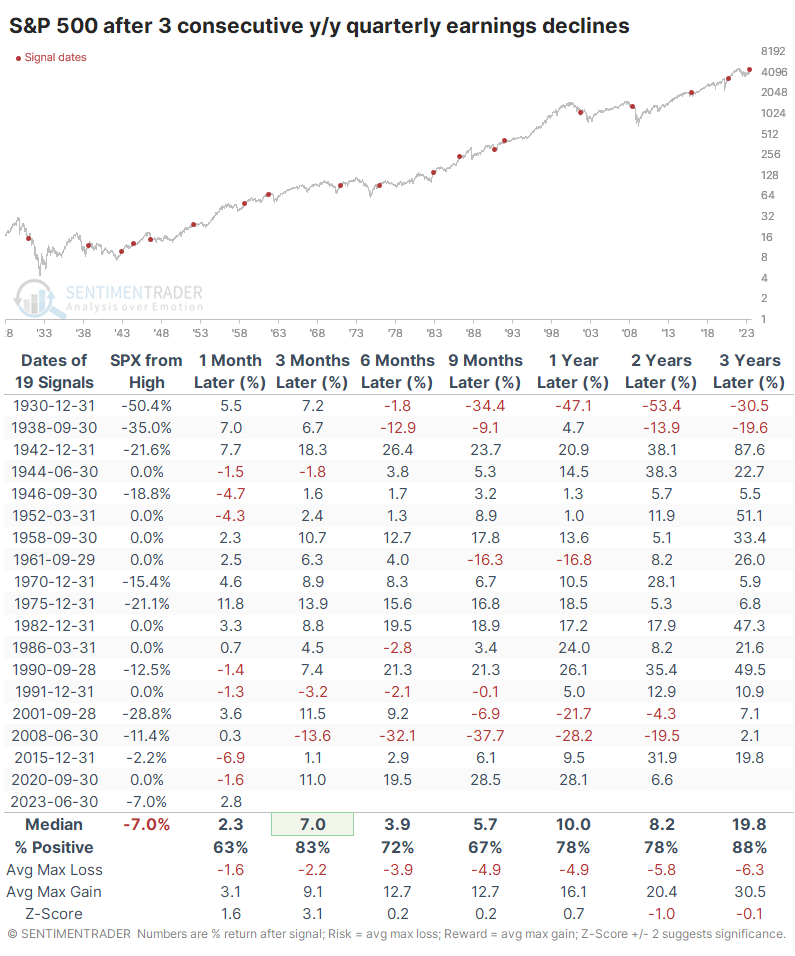
There were a few significant drops over longer time frames. This is a worry, especially since the S&P has recovered from correction territory. Perhaps investors have gotten ahead of themselves without the justification of growing earnings.
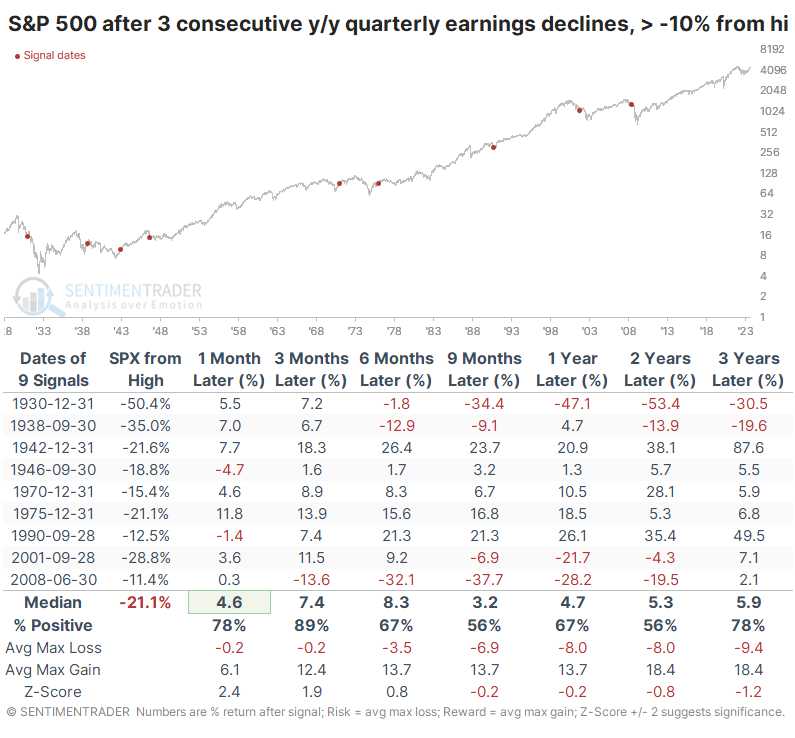
The table below filters the instances to only include those consecutive earnings declines which also triggered when the S&P was within 10% of its prior 3-year high (using quarterly closes). Even though investors might have worried that stocks were rising without fundamental justification, the S&P tended to keep rising. When it lost, it lost small with only a single exception (and that was reversed relatively quickly).
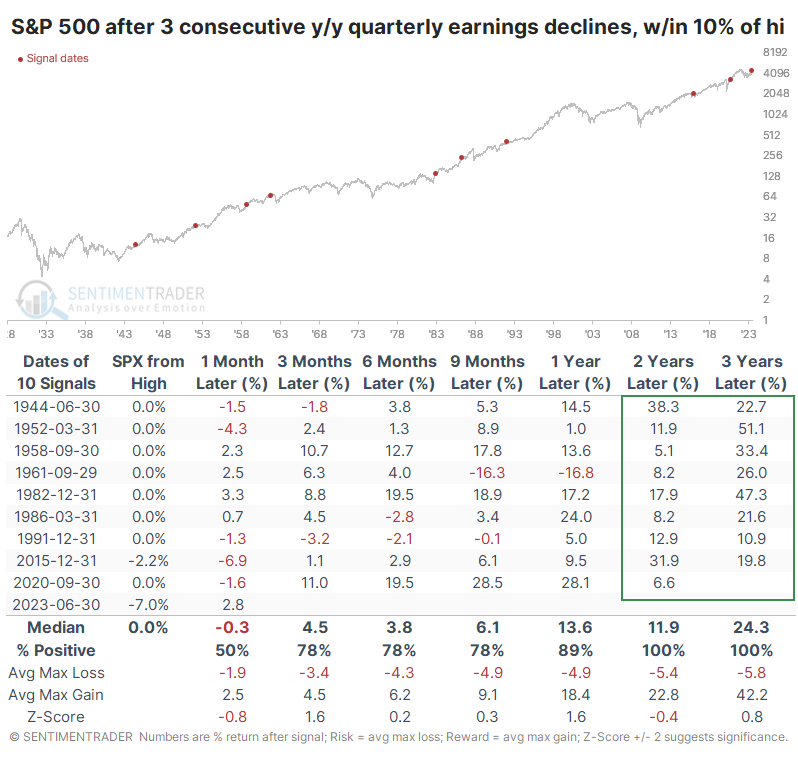
Contrast that to times when earnings were declining, and the S&P was more than 10% below its peak. While investors would have anticipated that the worst was over, returns were significantly worse than when the S&P rose.
What the research tells us...
There has been a lot of talk about an earnings recession, if not an economic one. Depending on how one defines it, we're probably amid one, with solid data suggesting that earnings on the most influential companies in the U.S. declining for three consecutive quarters.
The good news is that earnings declines rarely last much longer. Also, contrary to most assertions, the fact that prices have held up well despite declining earnings has been a good sign. Earnings have caught up to prices; prices have not caught down to earnings. While anything could happen in the short-term, long-term returns after similar behavior were consistently positive and above average.
Indicators at Extremes
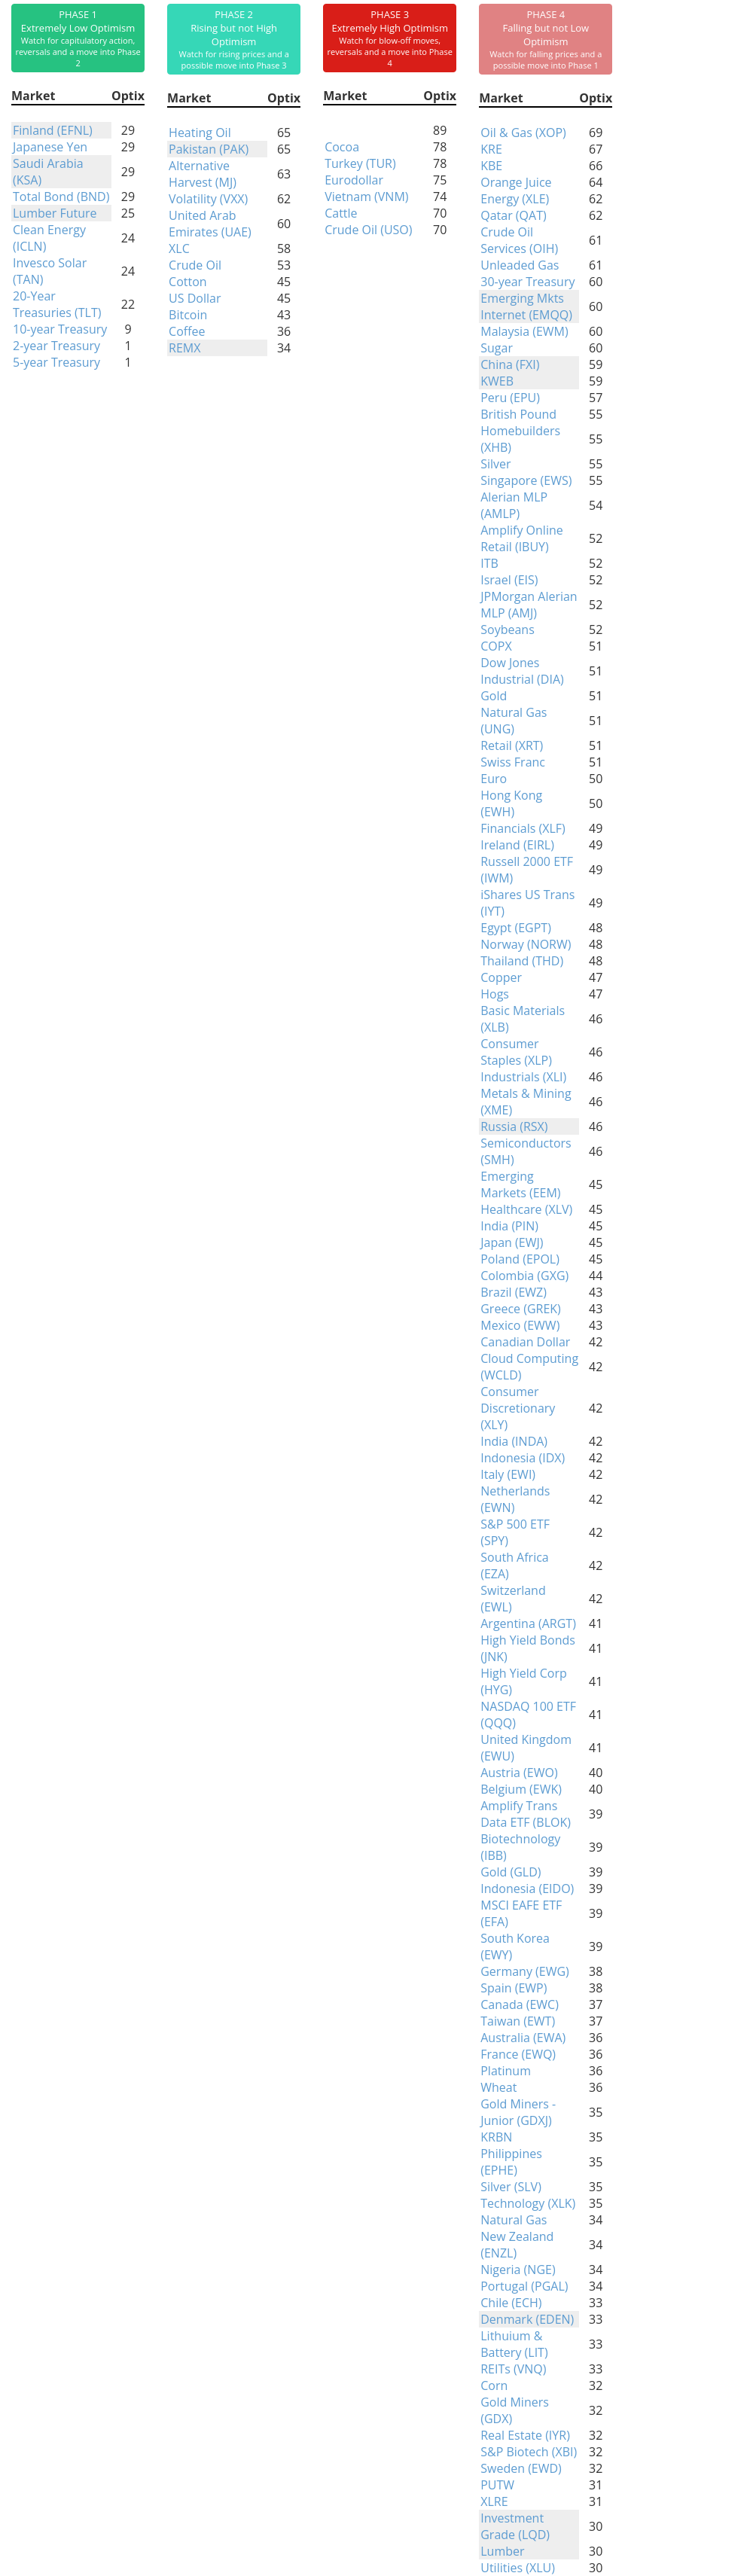
Phase Table
Ranks
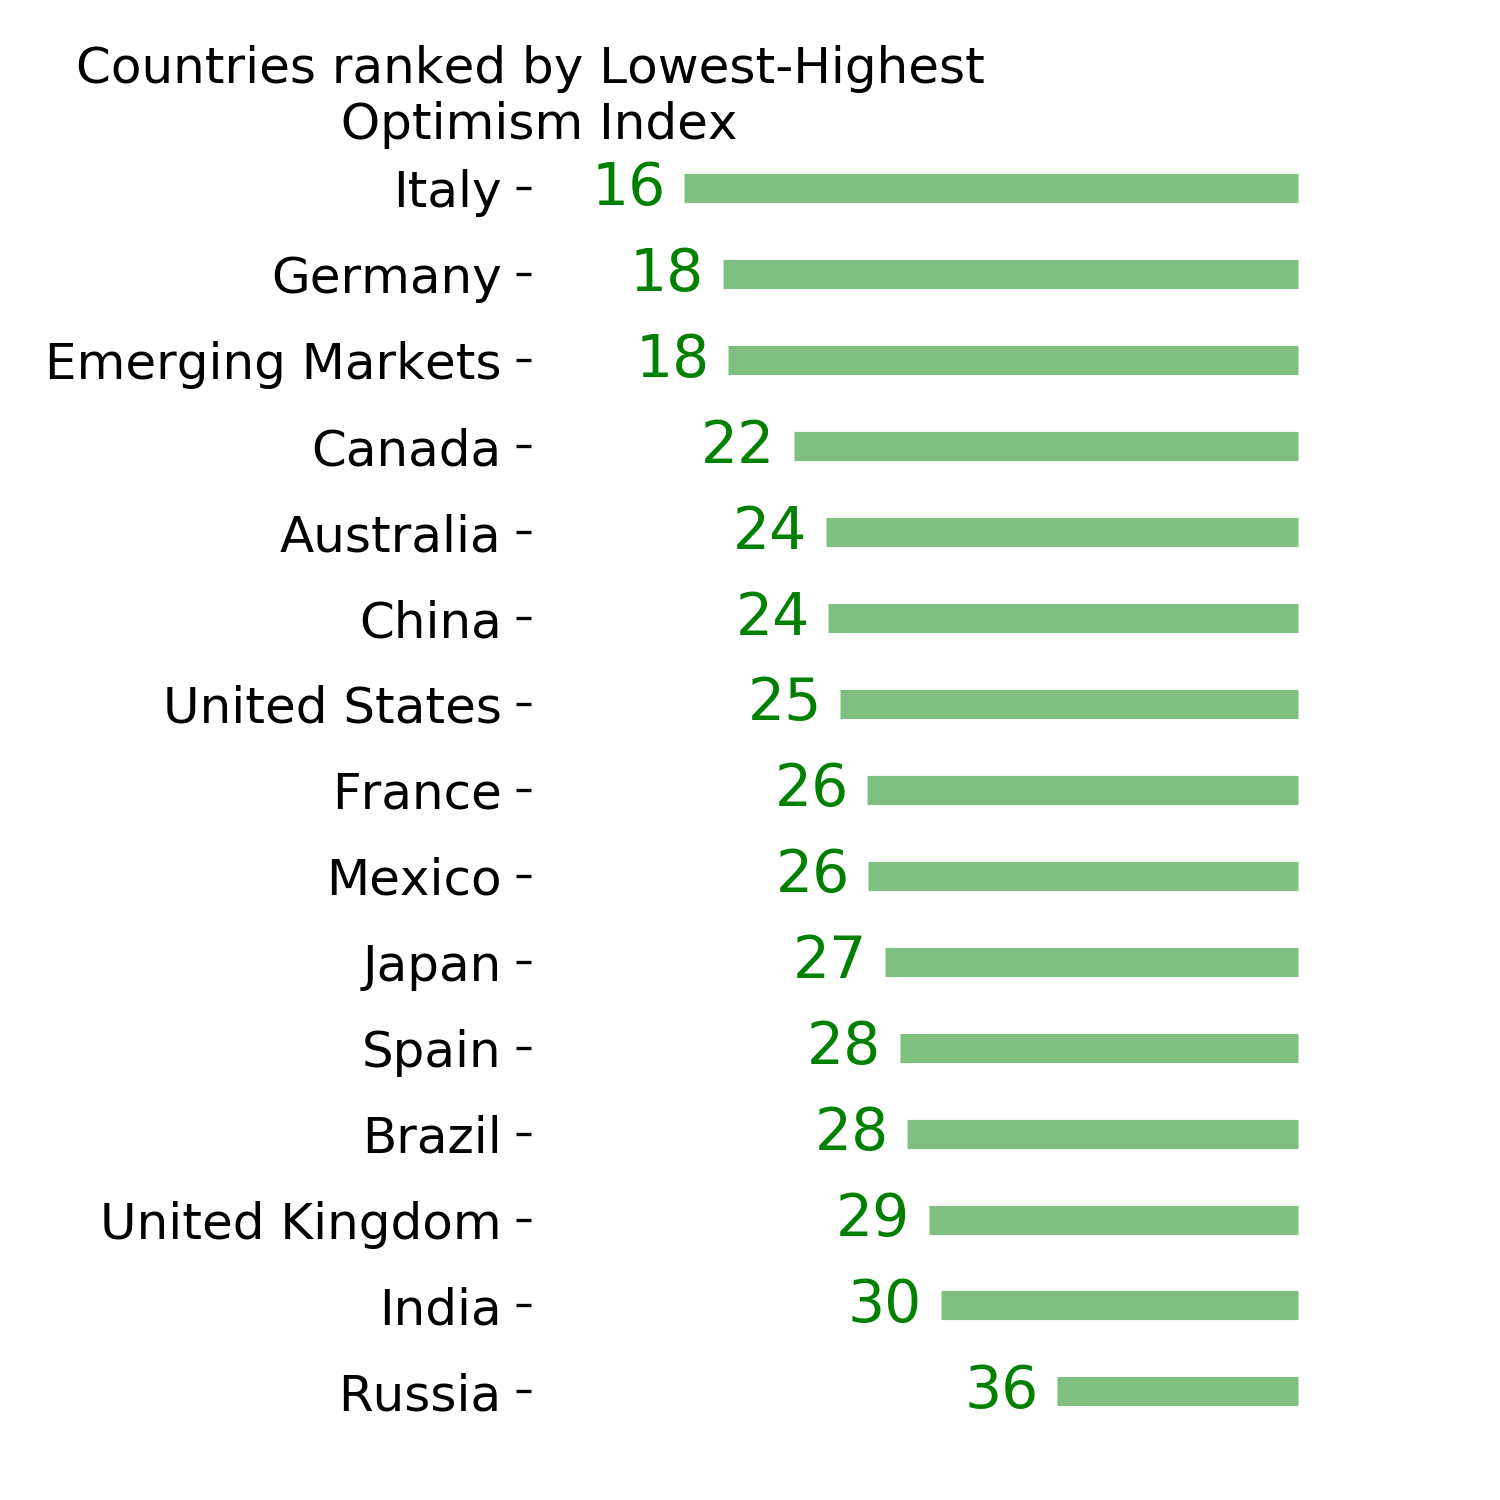
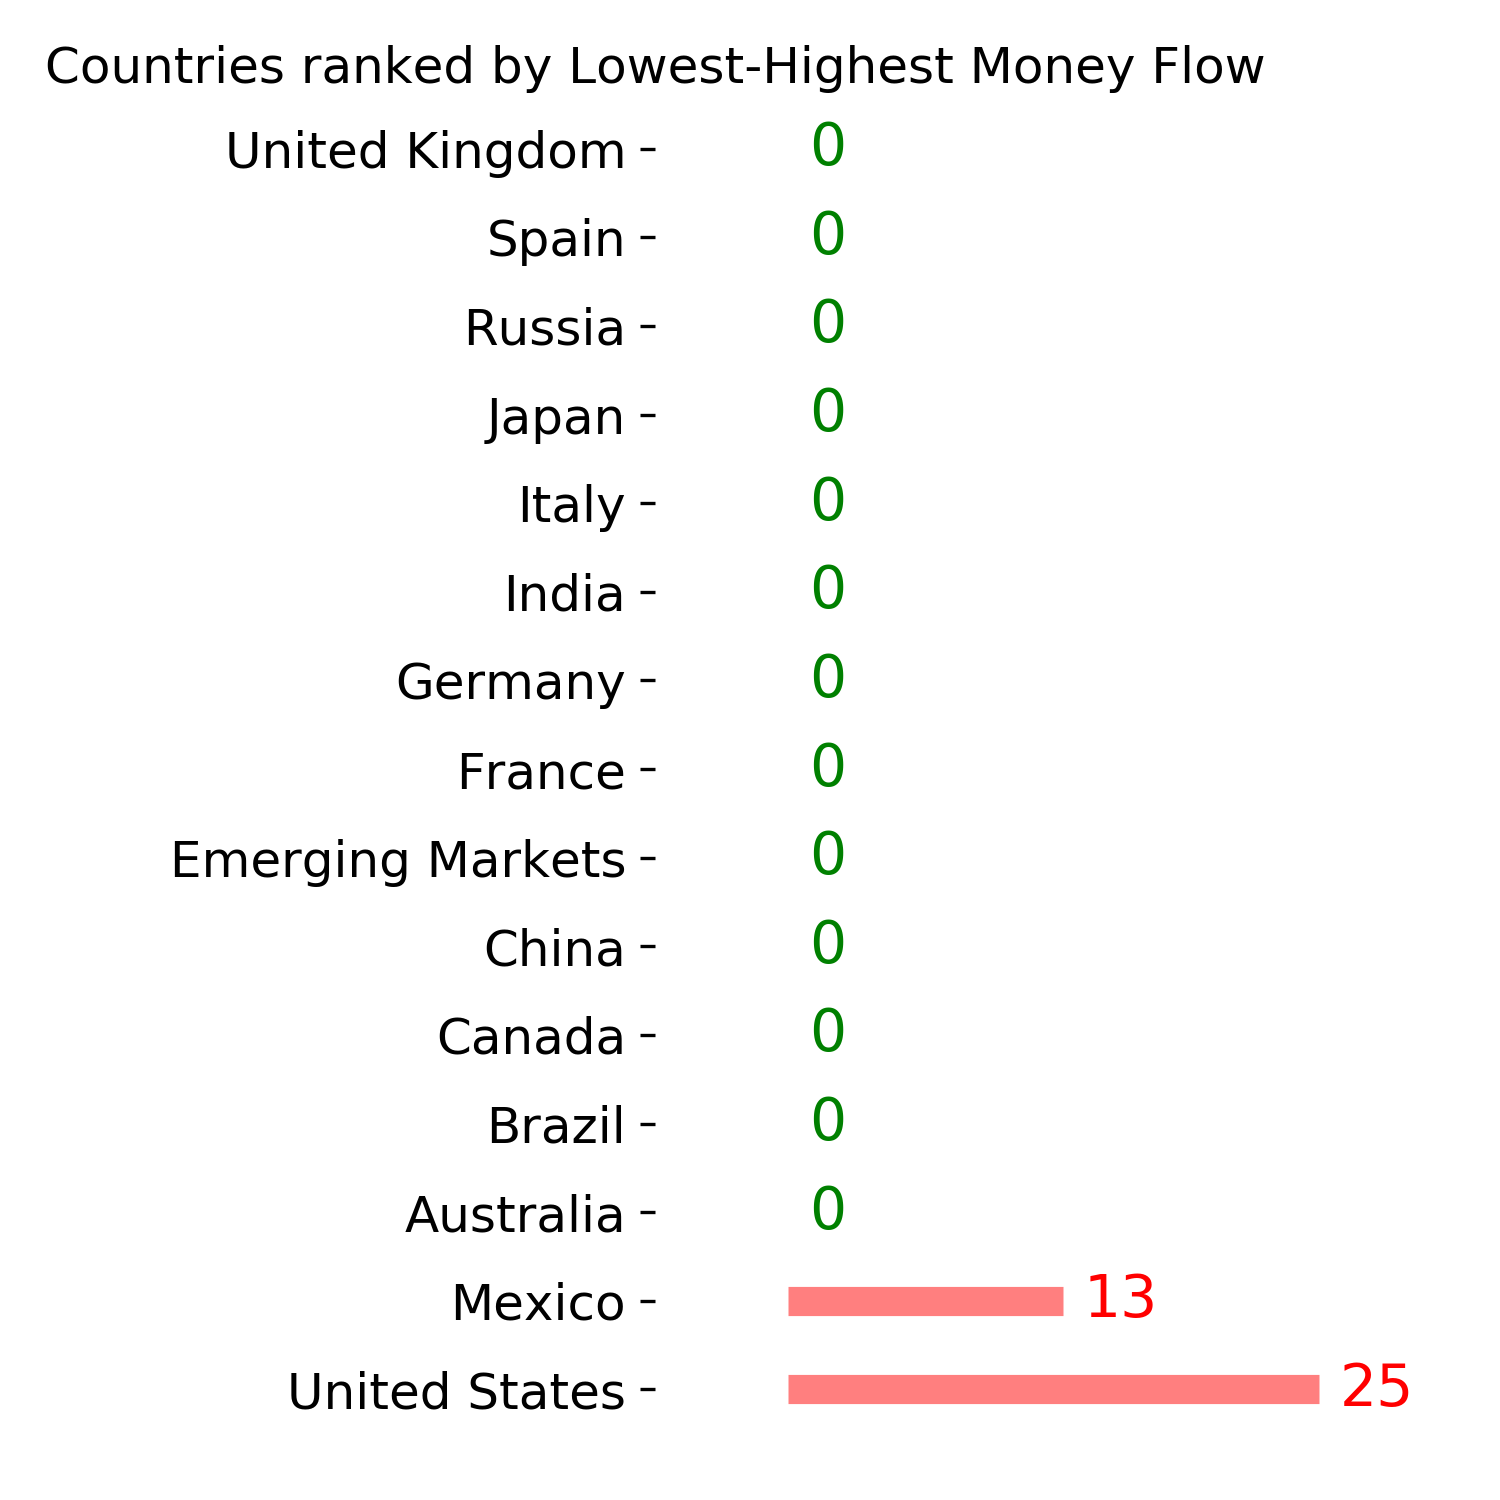
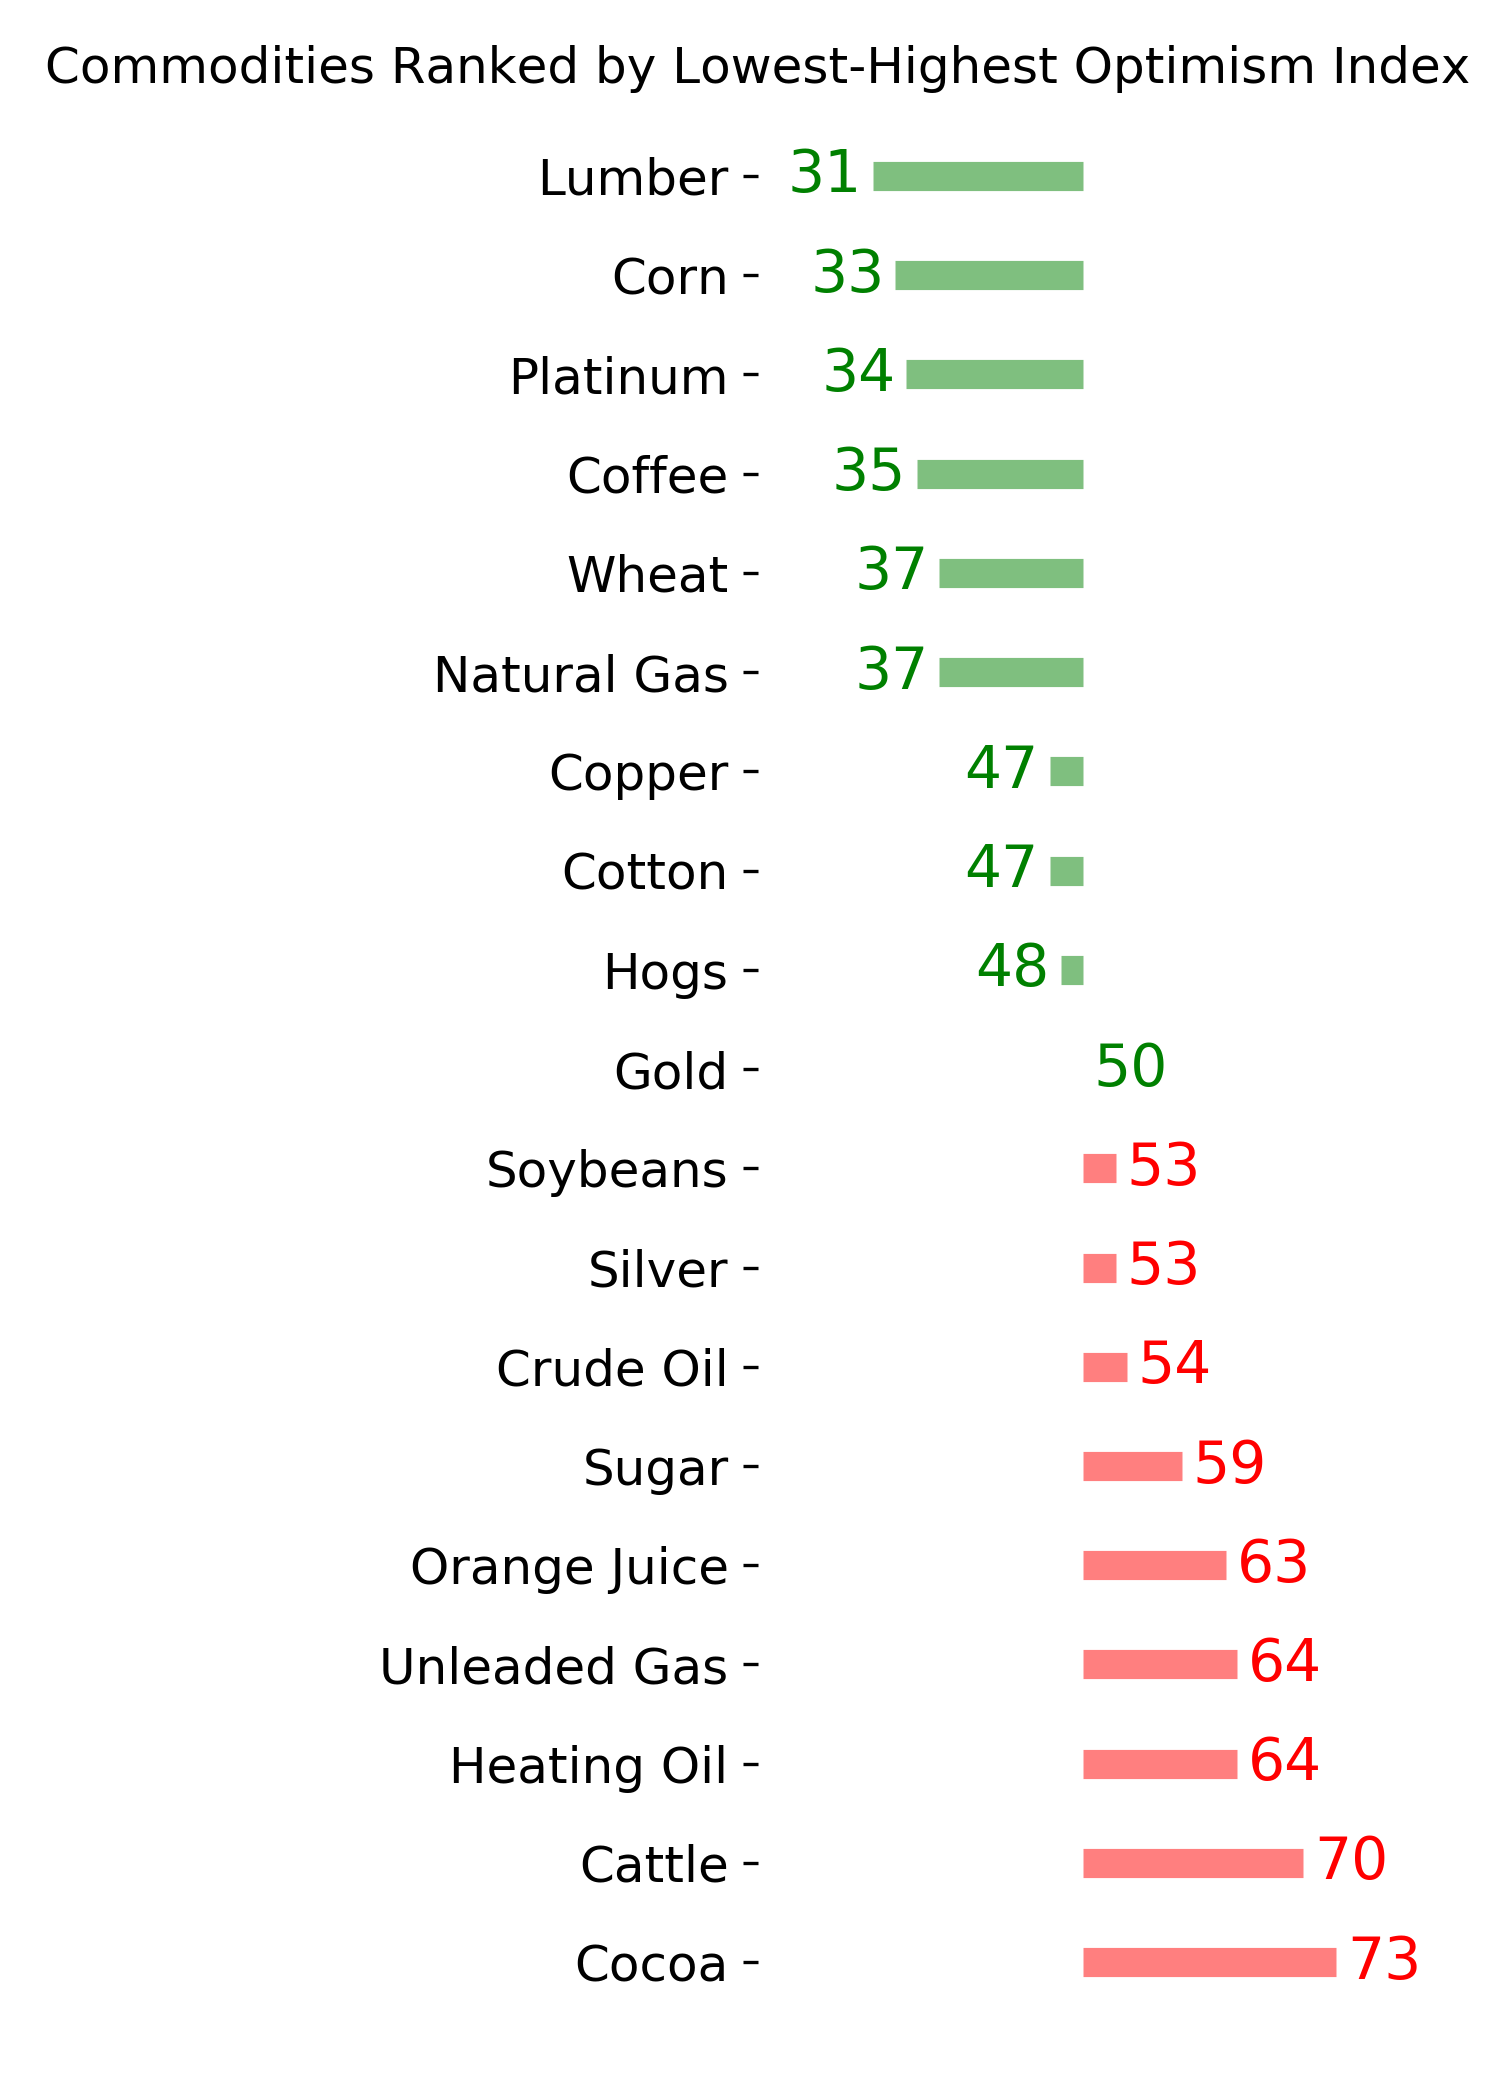
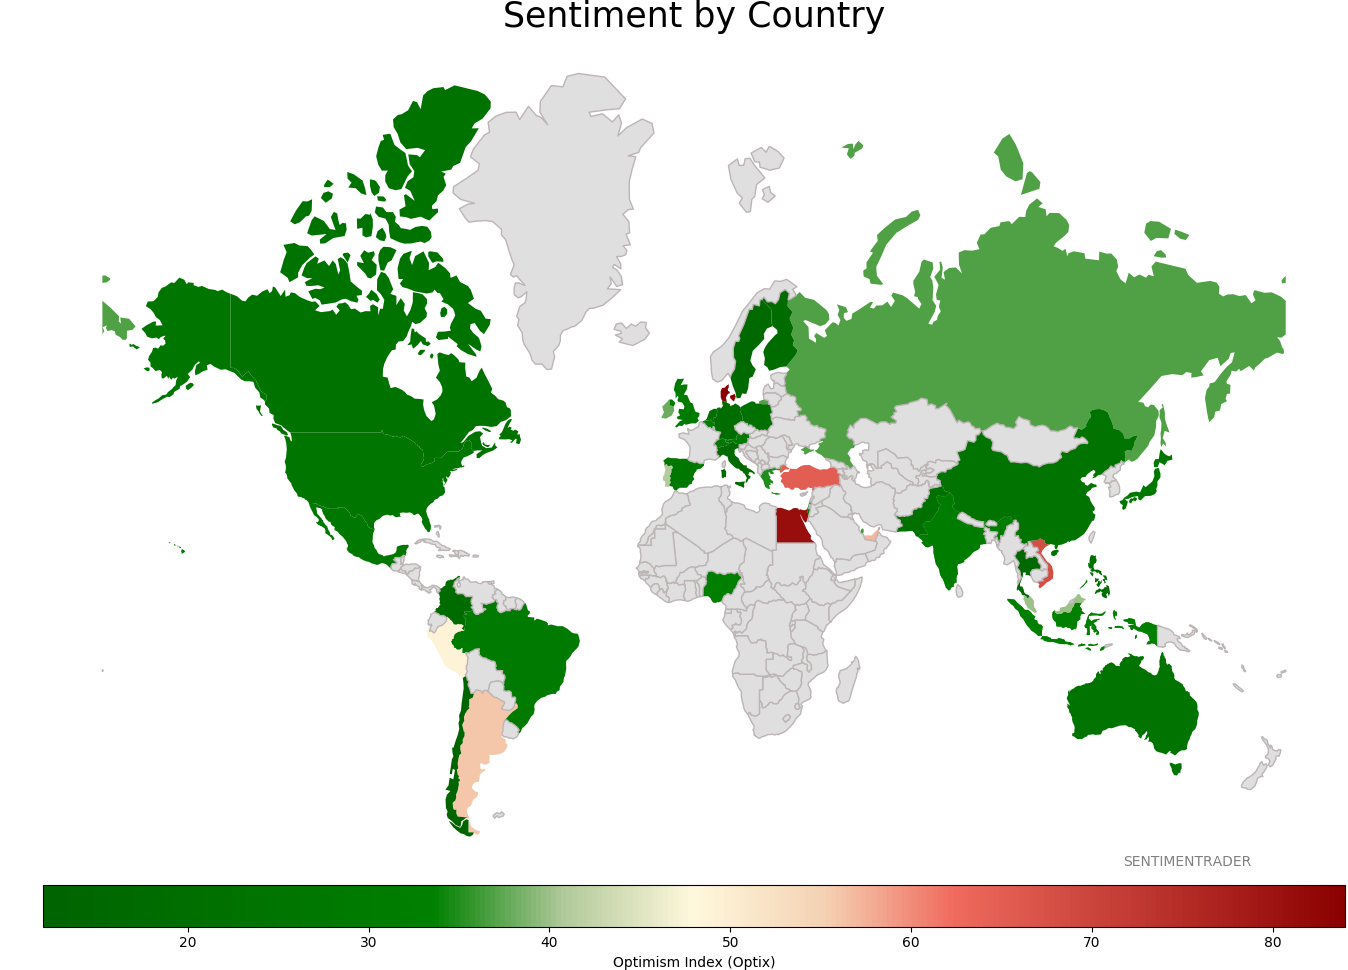
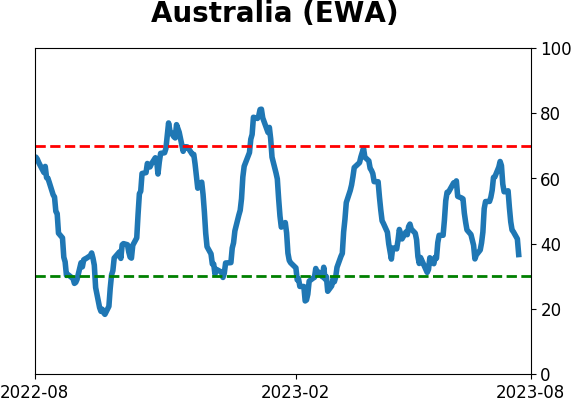
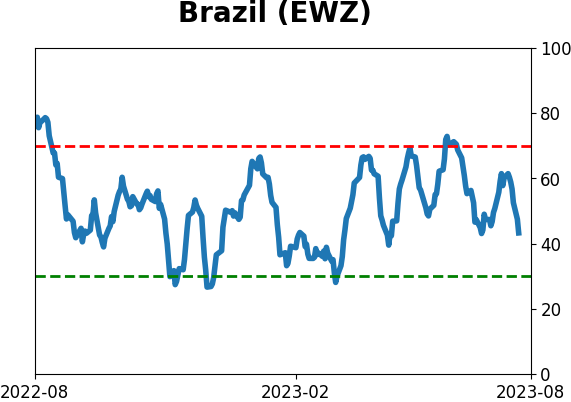
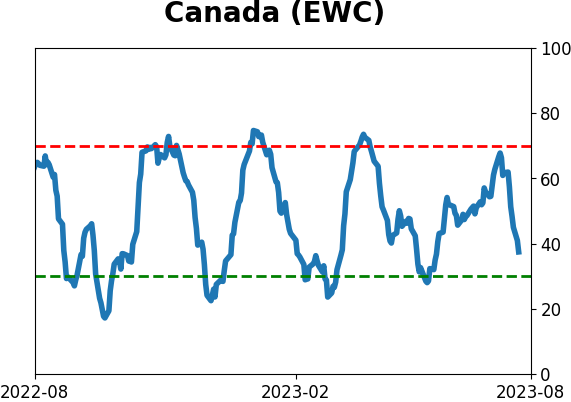
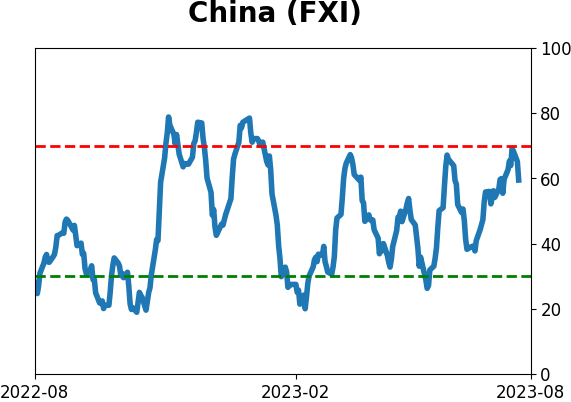
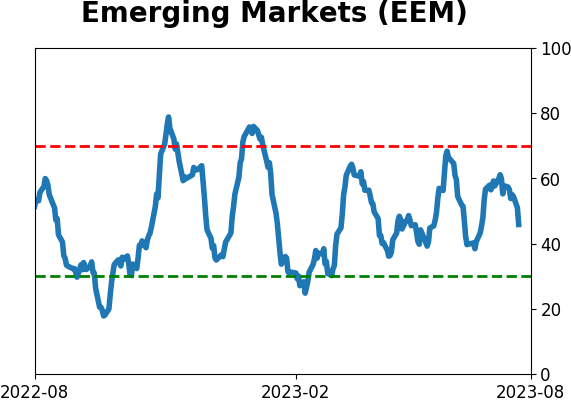
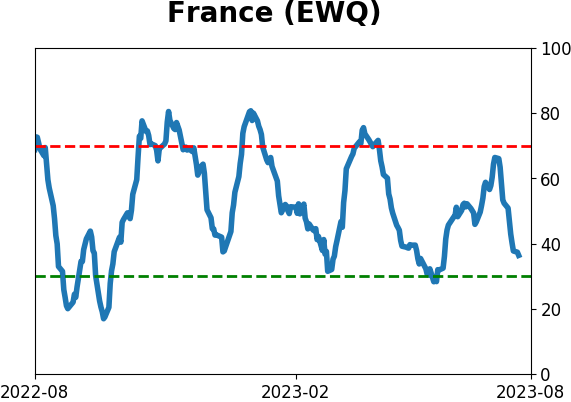
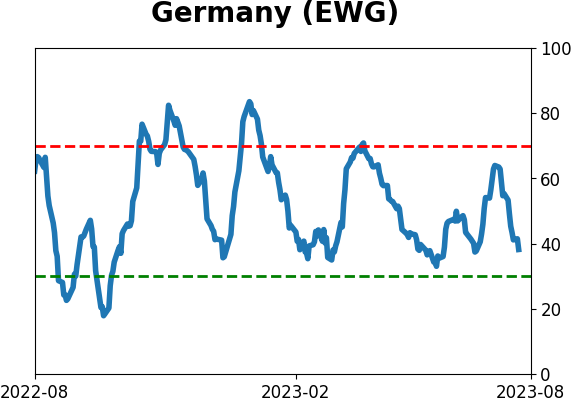
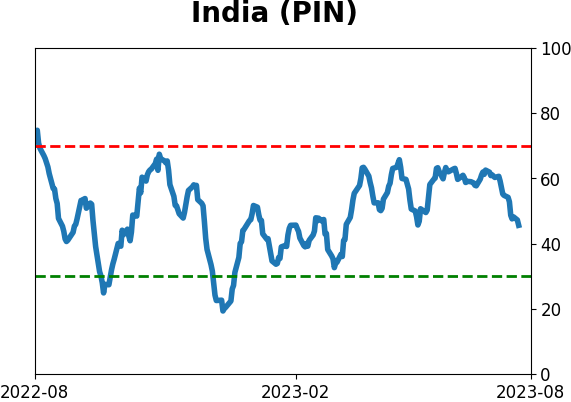
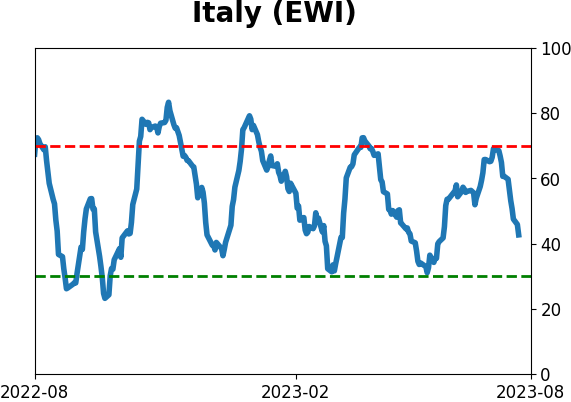
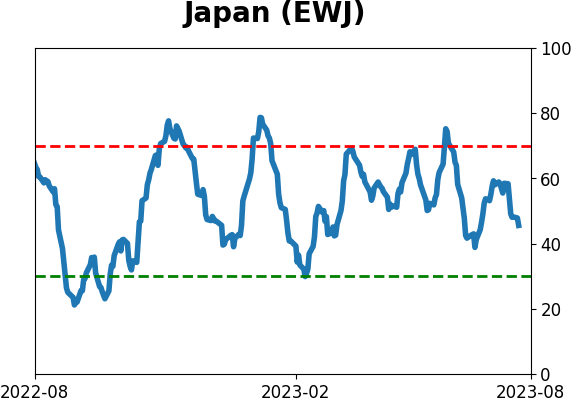
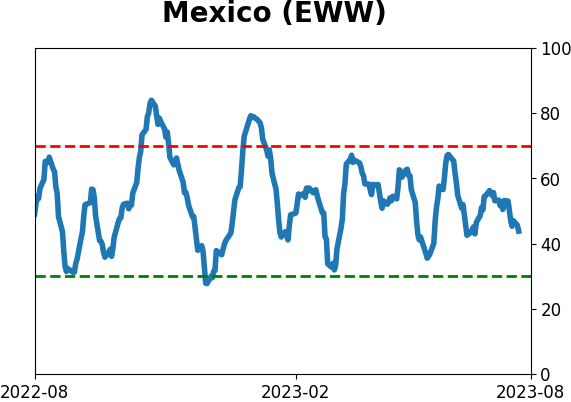
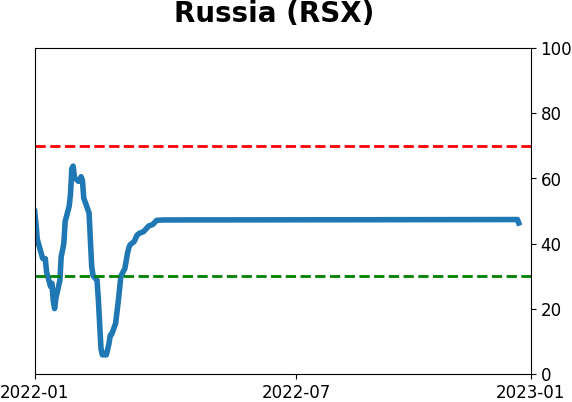
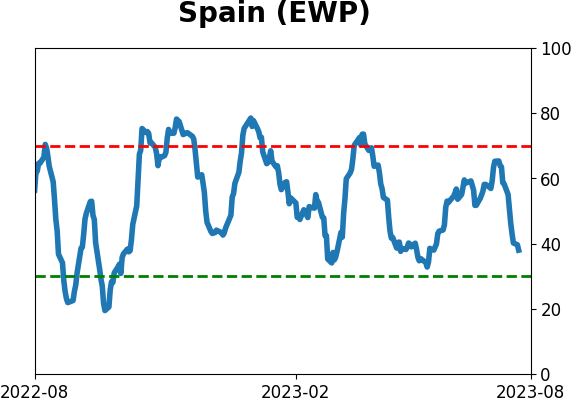
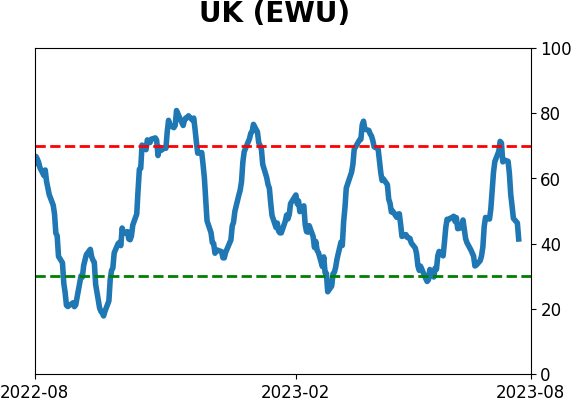
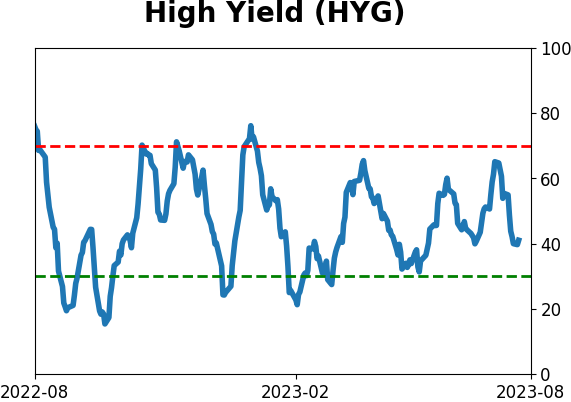
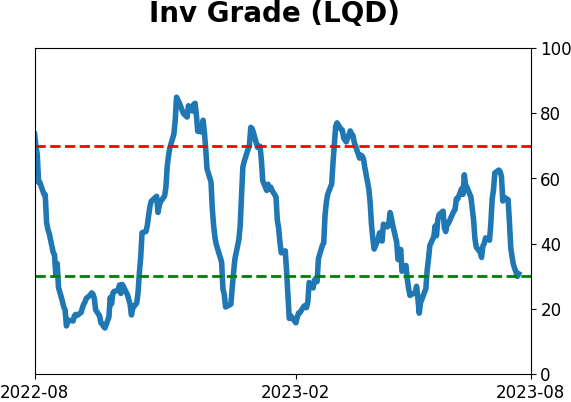
Sentiment Around The World
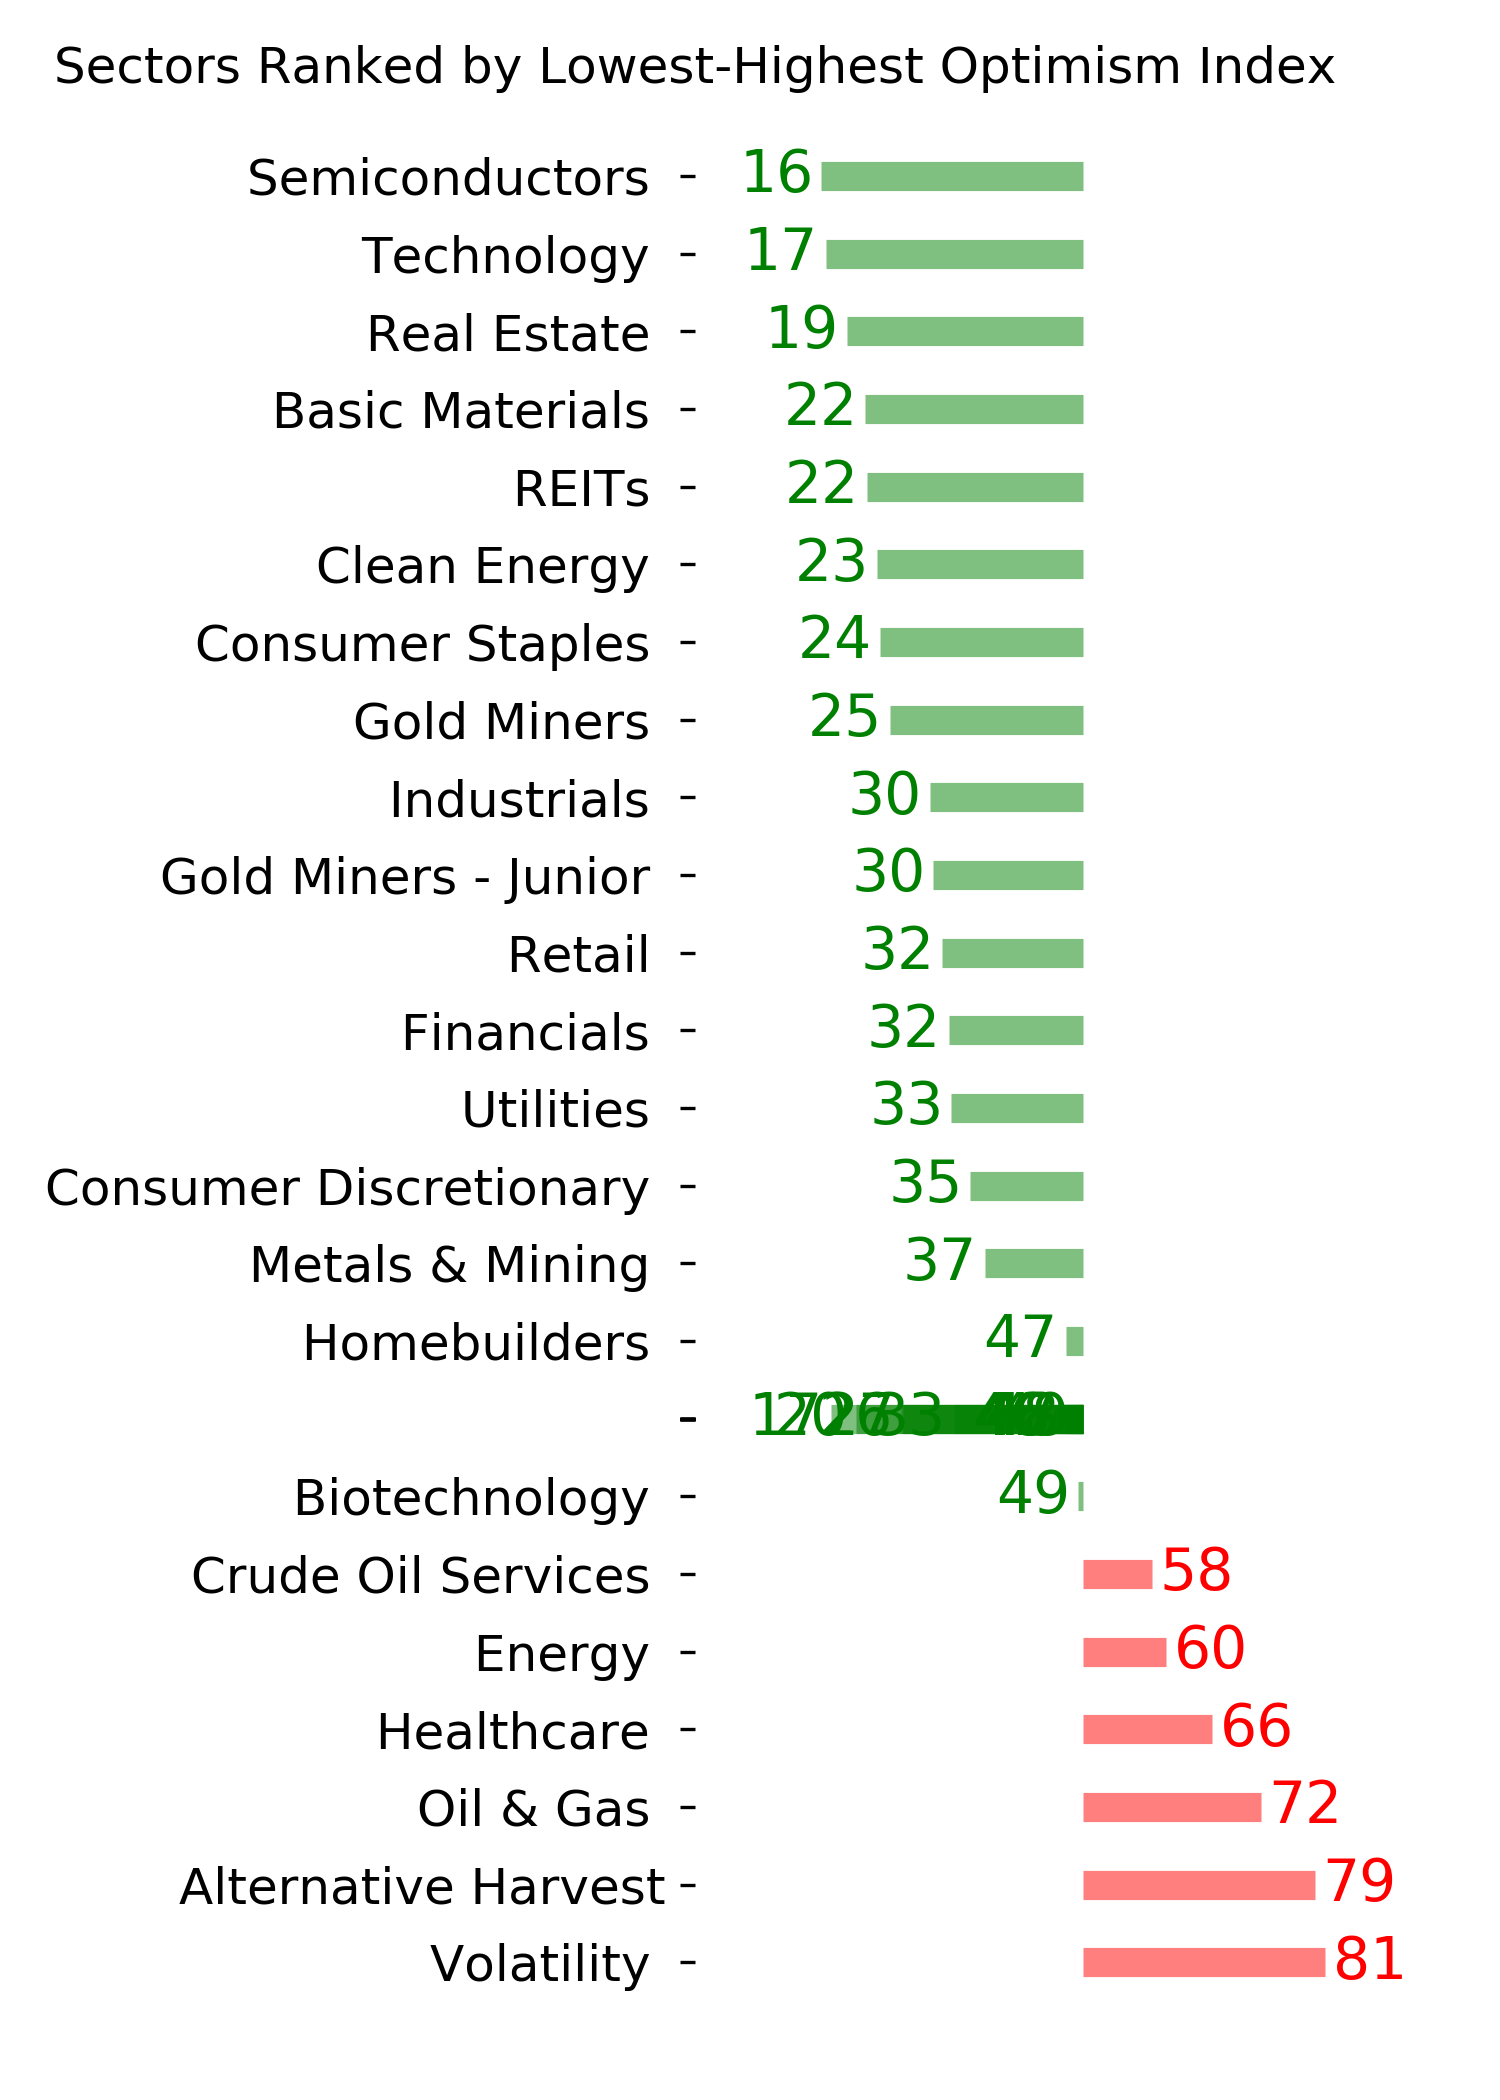
Optimism Index Thumbnails
|
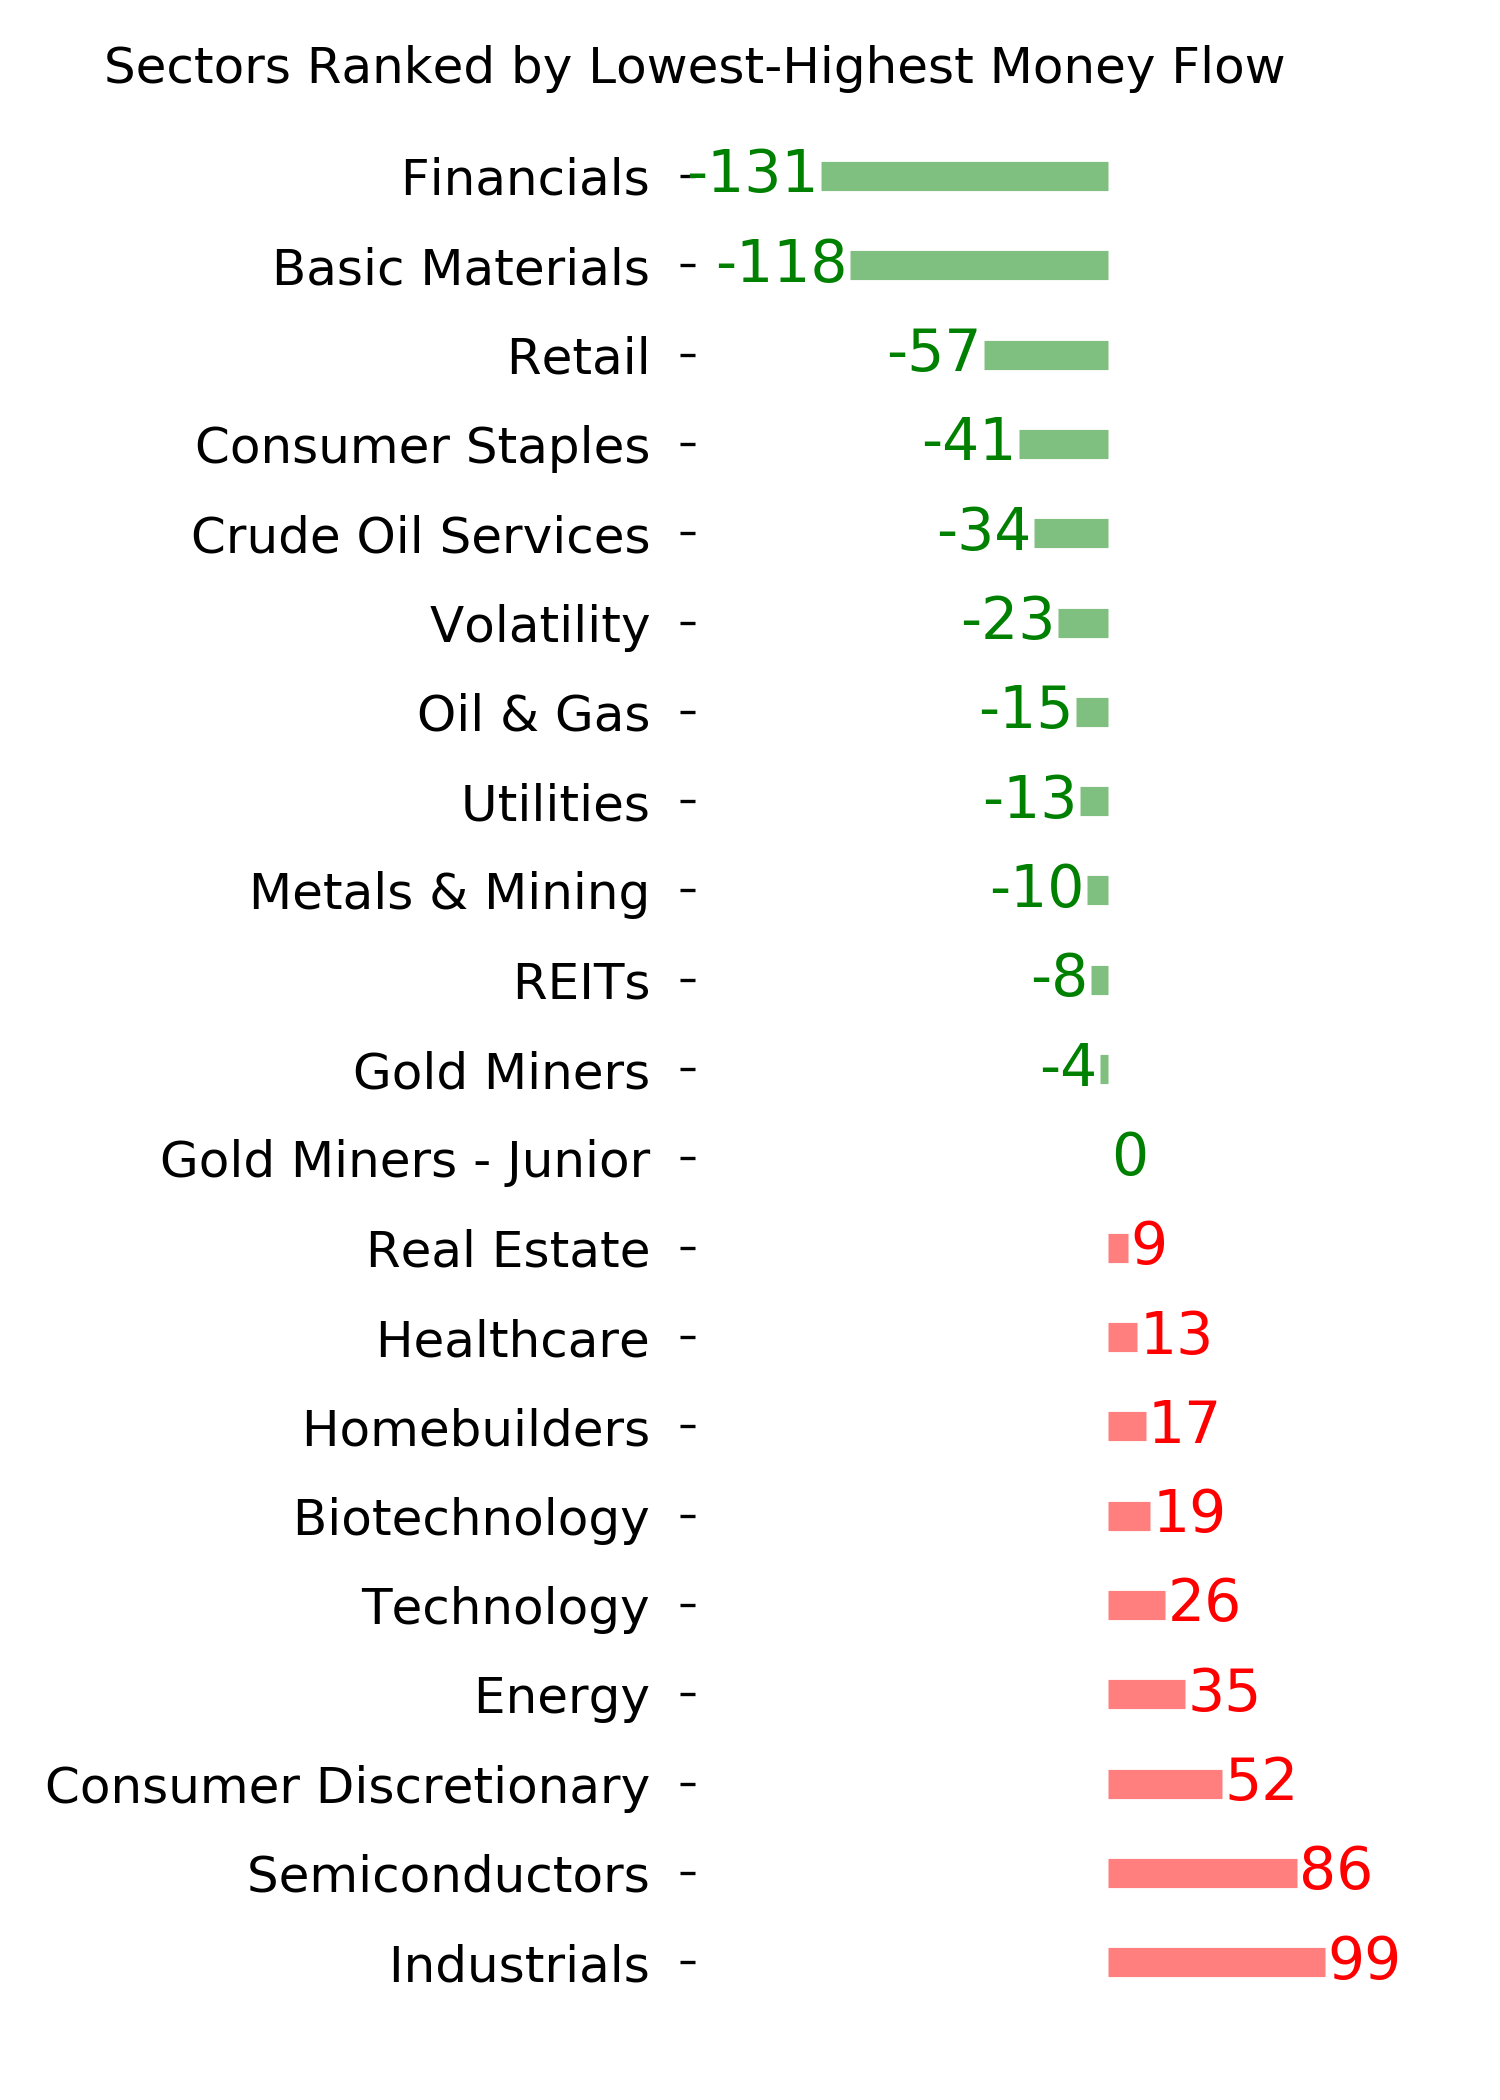
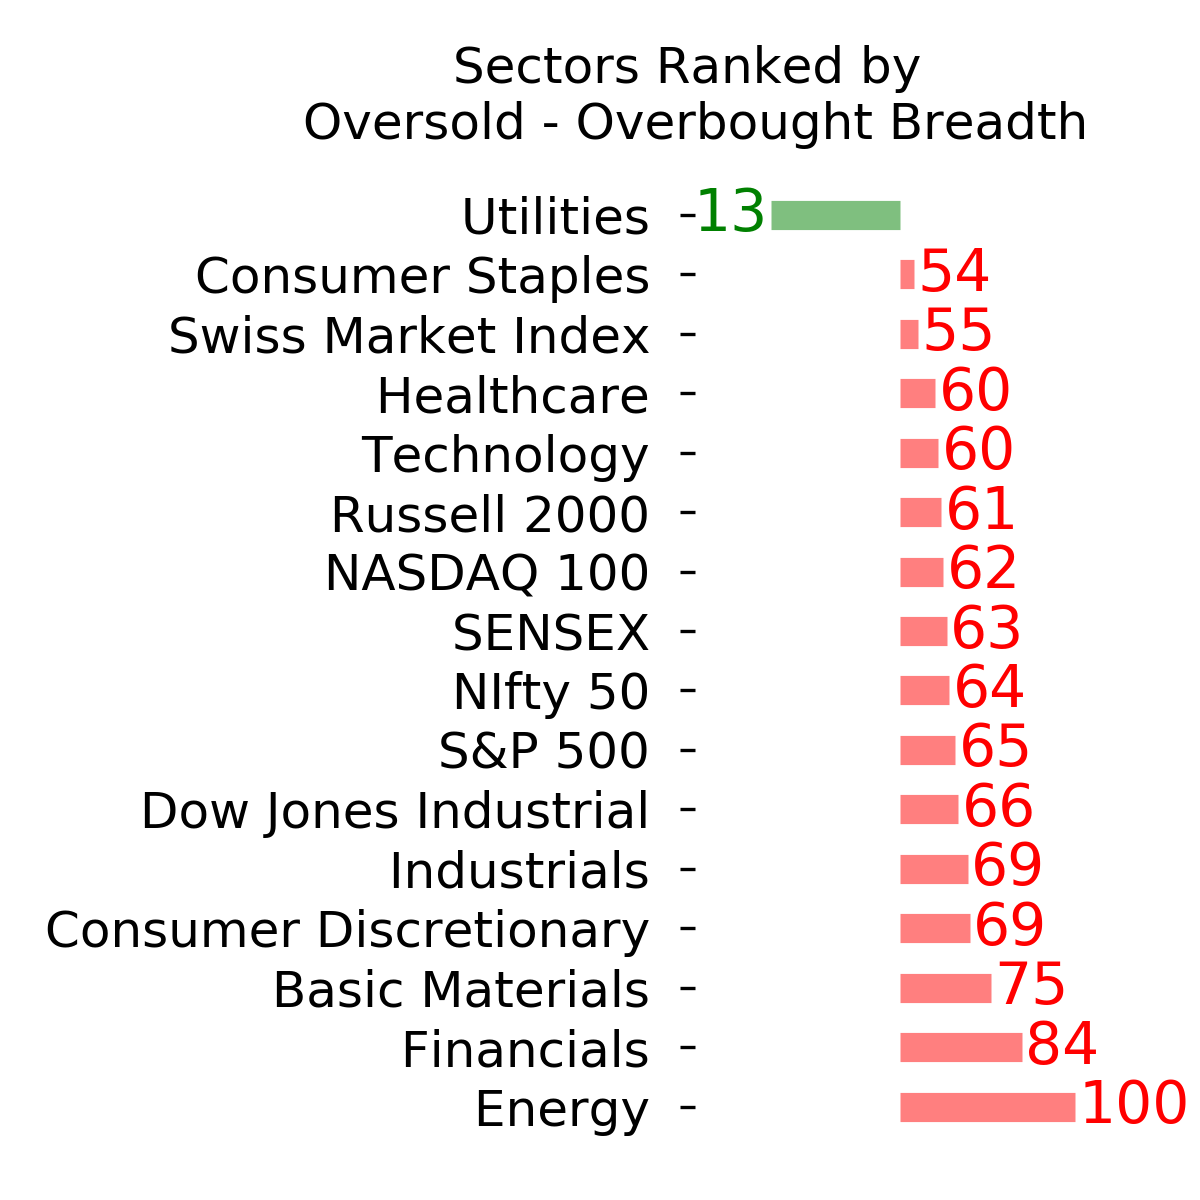
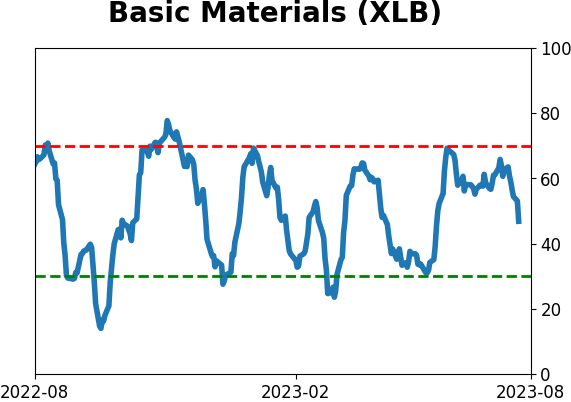
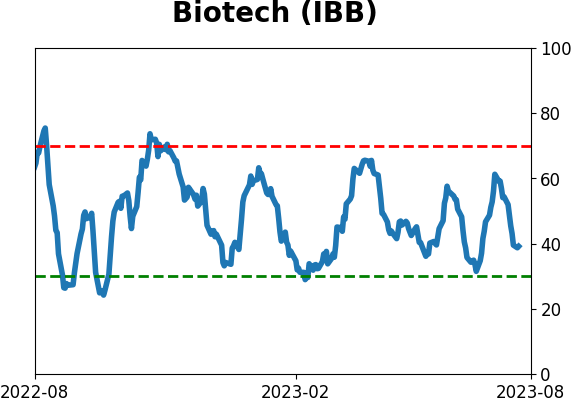
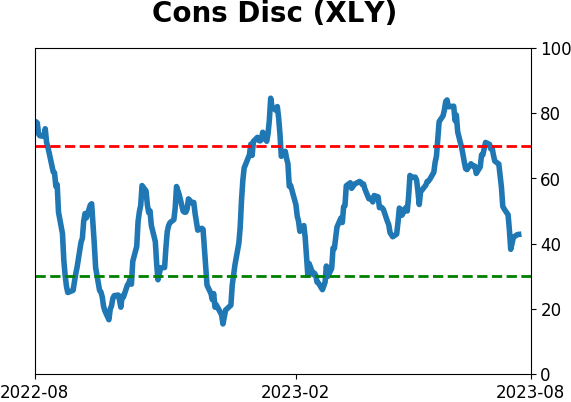
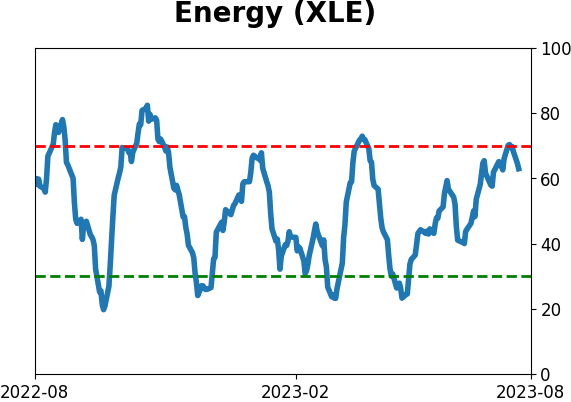
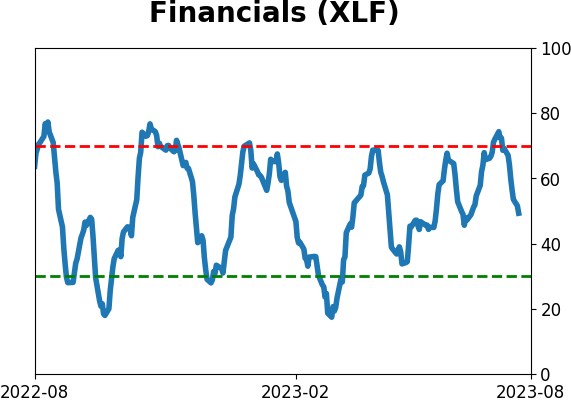
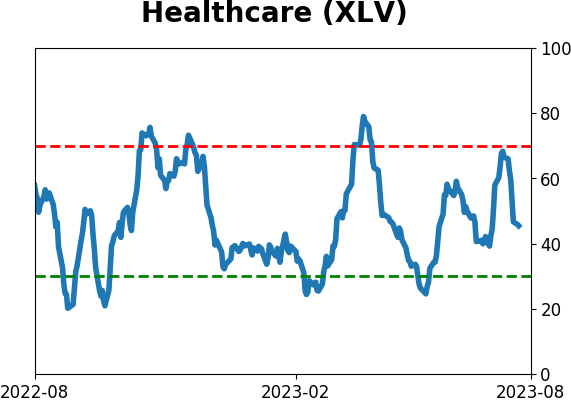
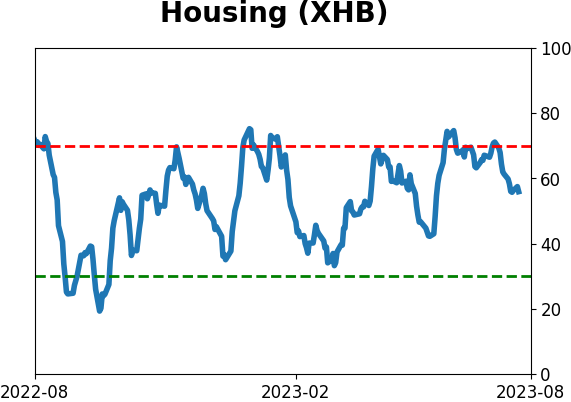
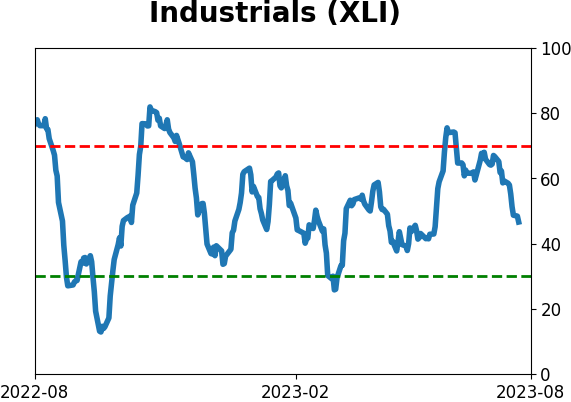
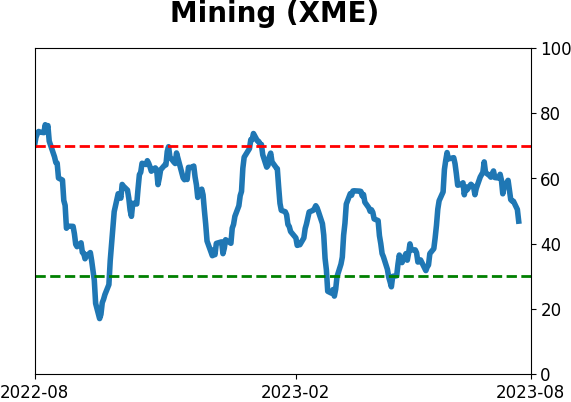
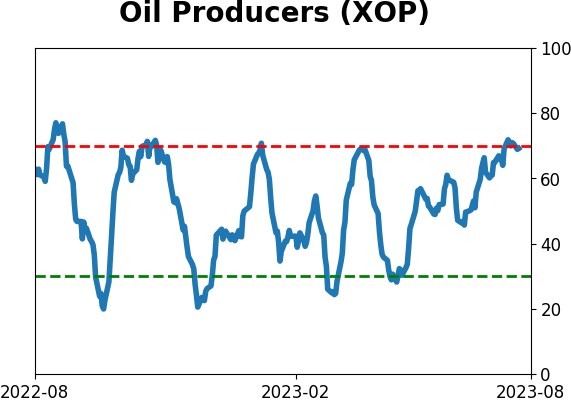
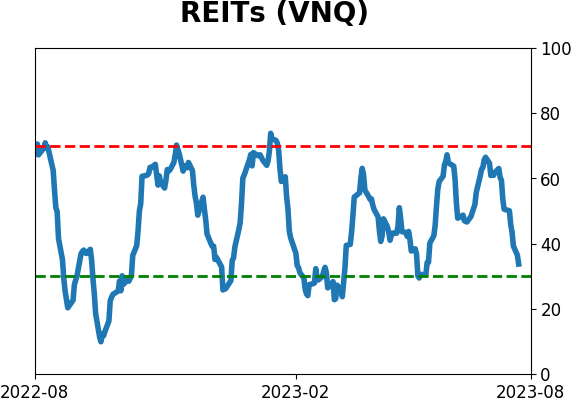
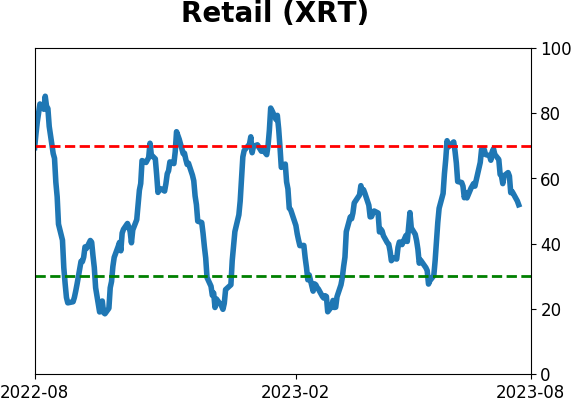
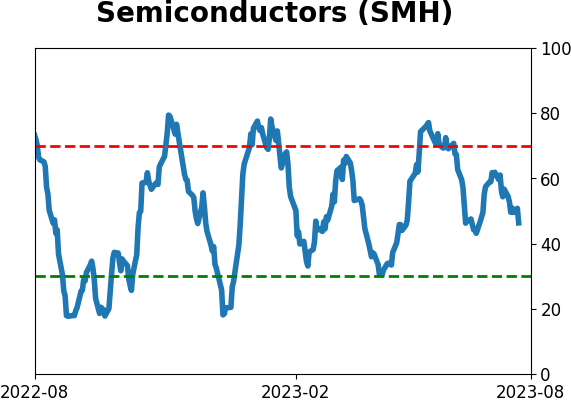
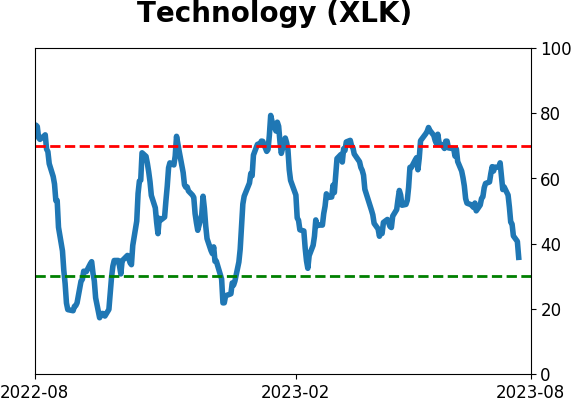
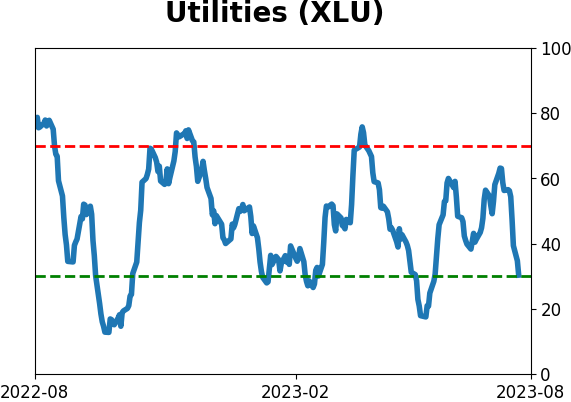
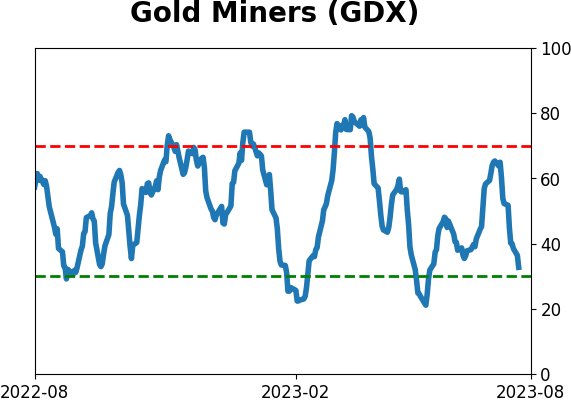
Sector ETF's - 10-Day Moving Average
|
|
|
Country ETF's - 10-Day Moving Average
|
|
|
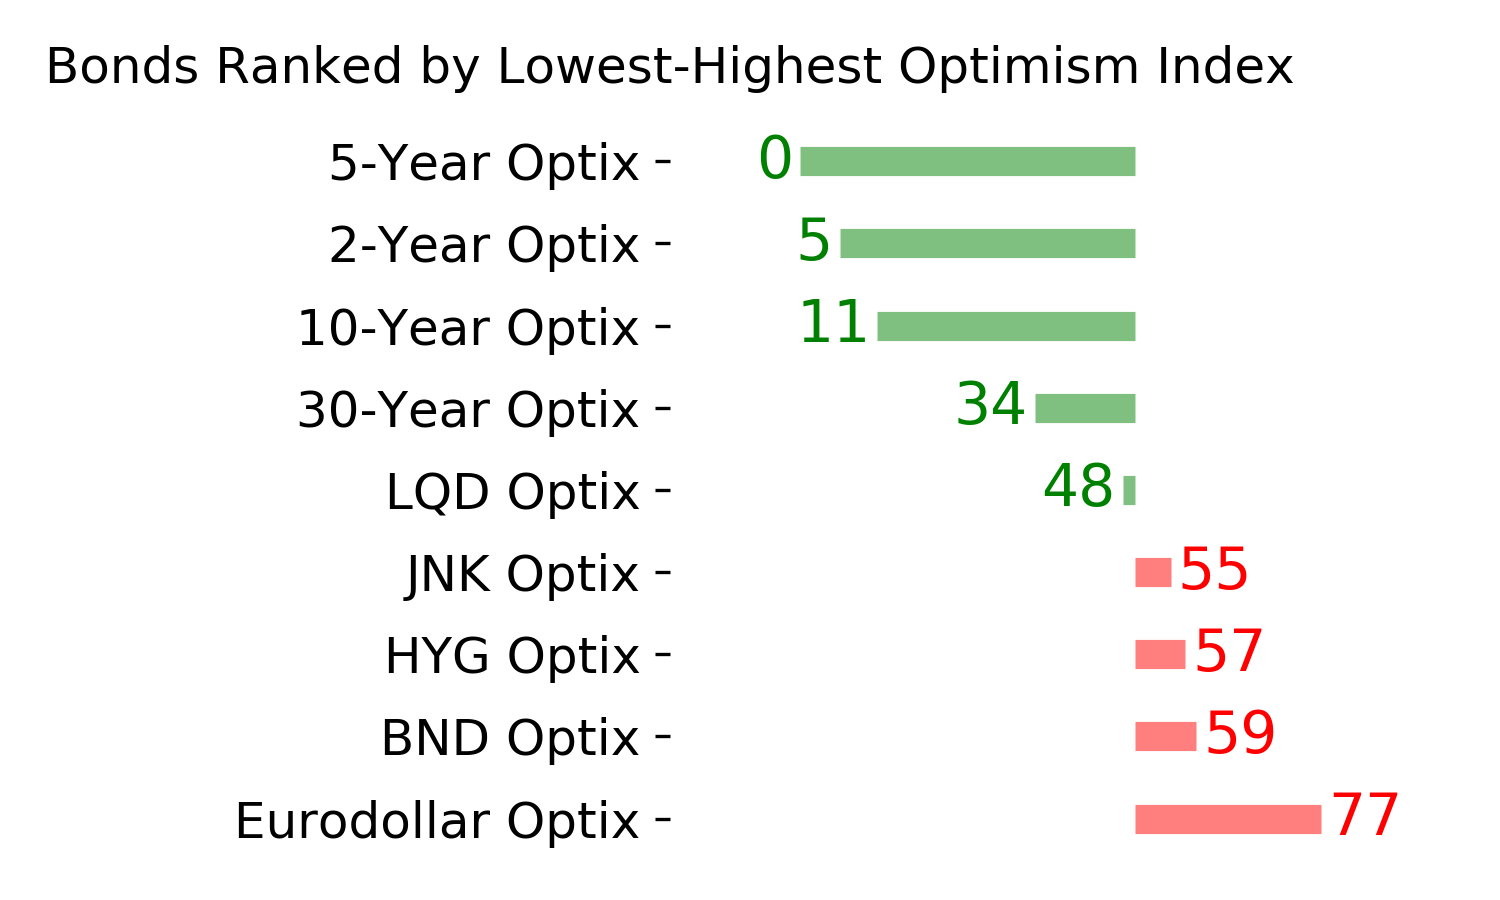
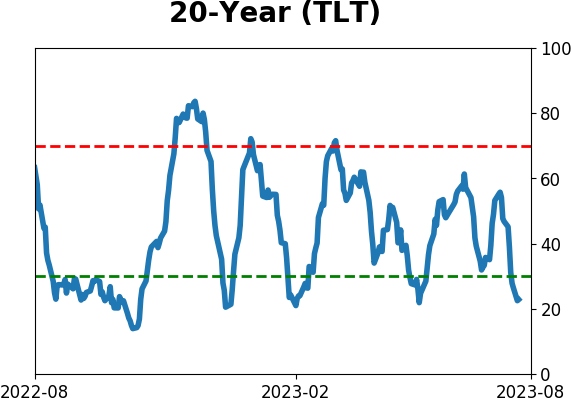
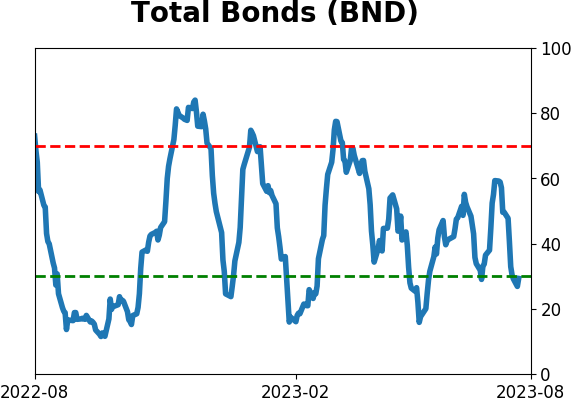
Bond ETF's - 10-Day Moving Average
|
|
|
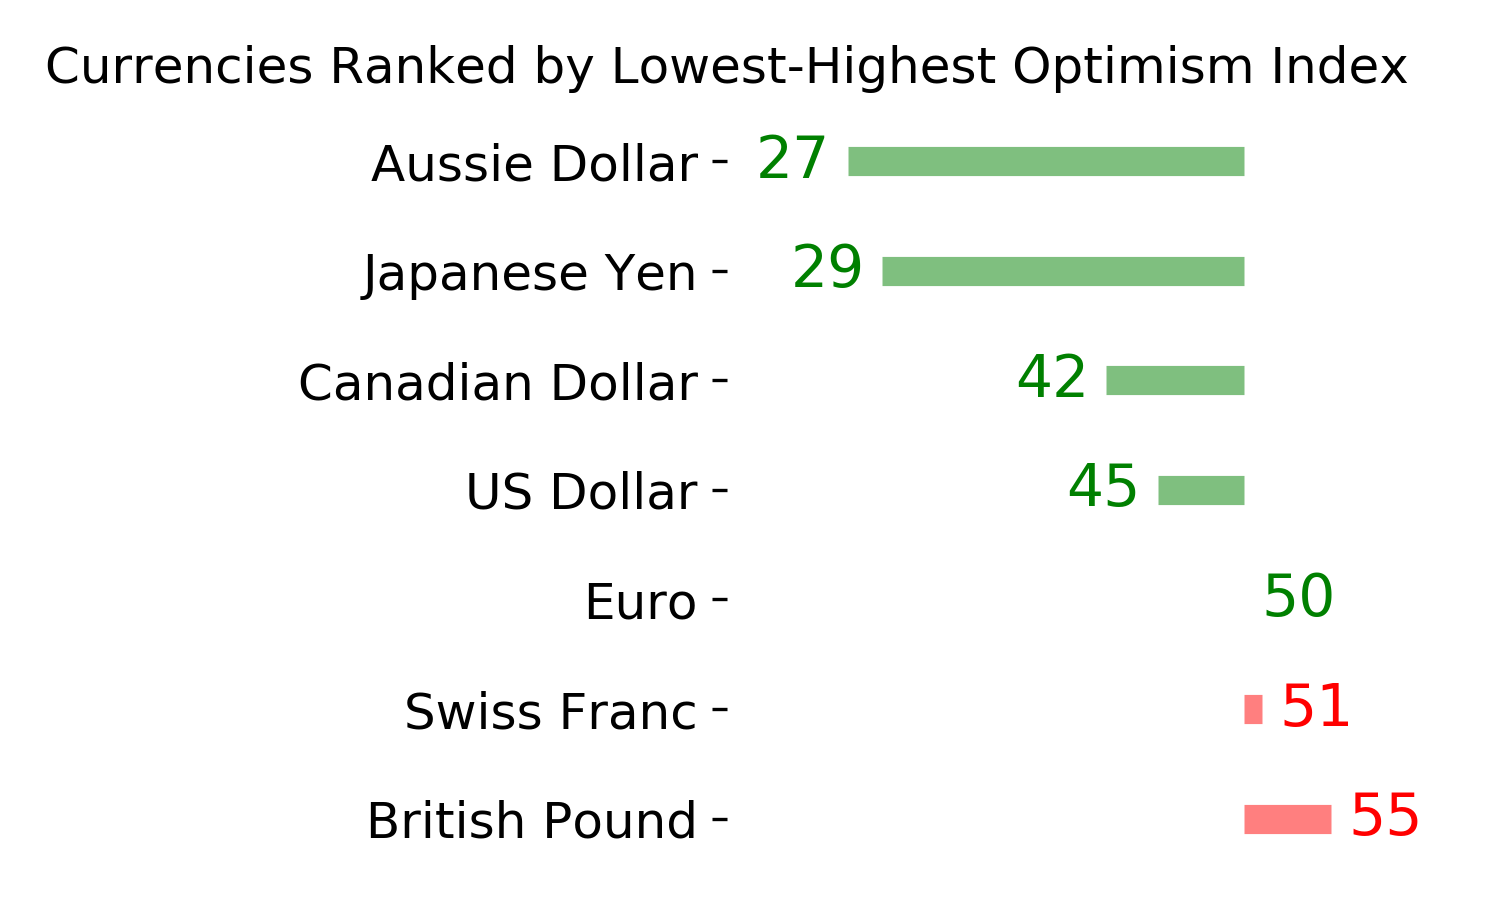
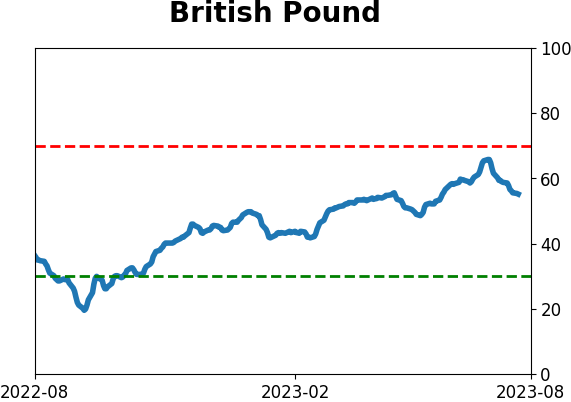
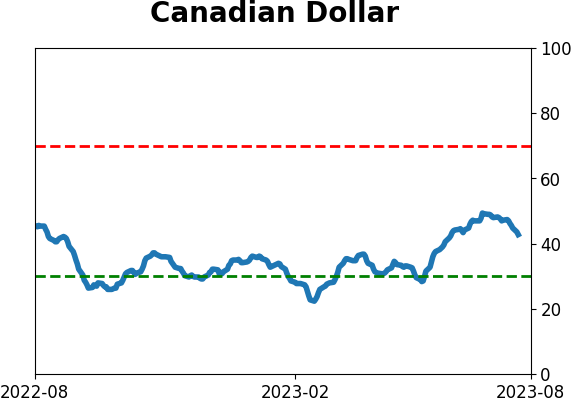
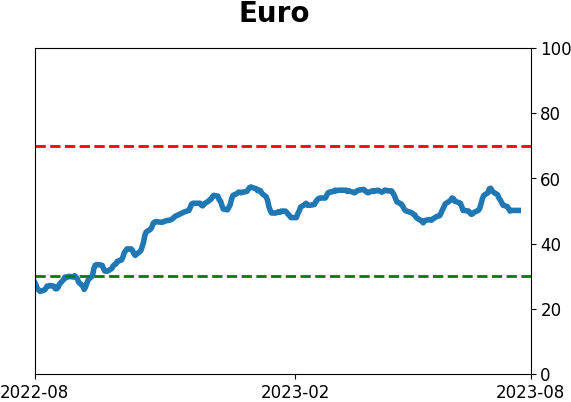
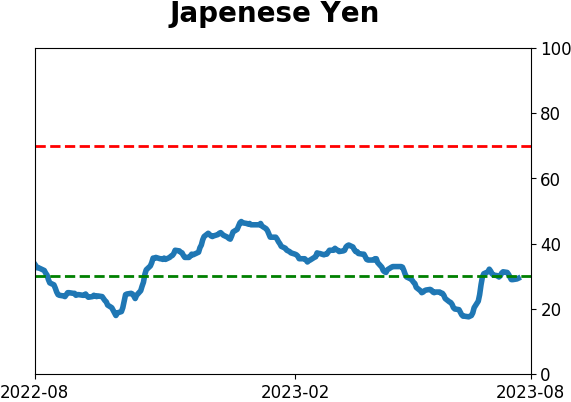
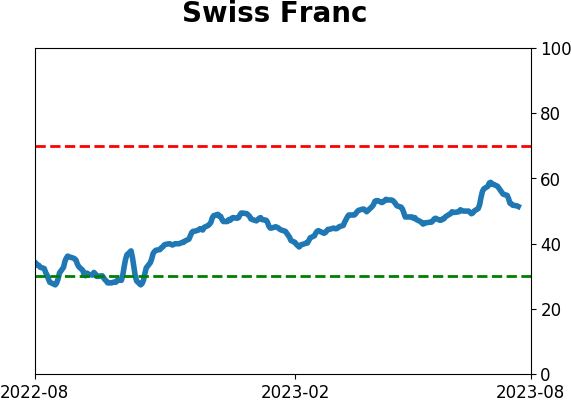
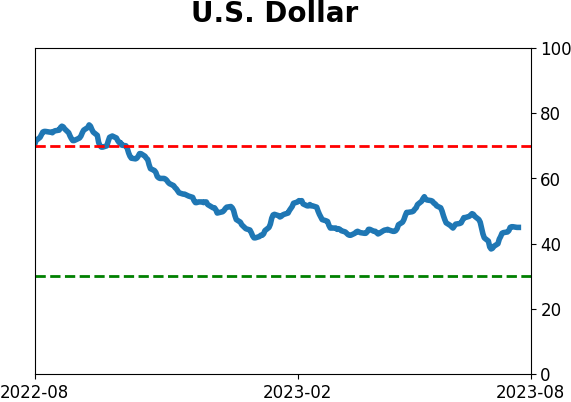
Currency ETF's - 5-Day Moving Average
|
|
|
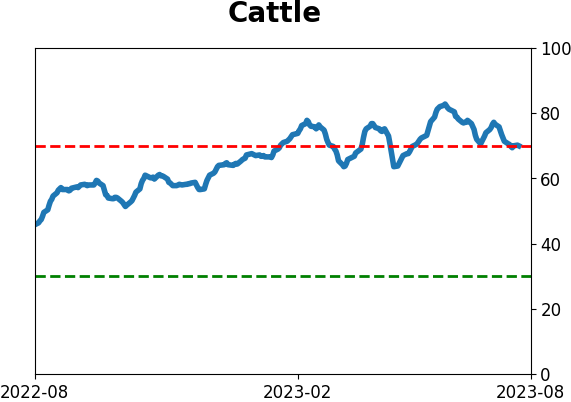
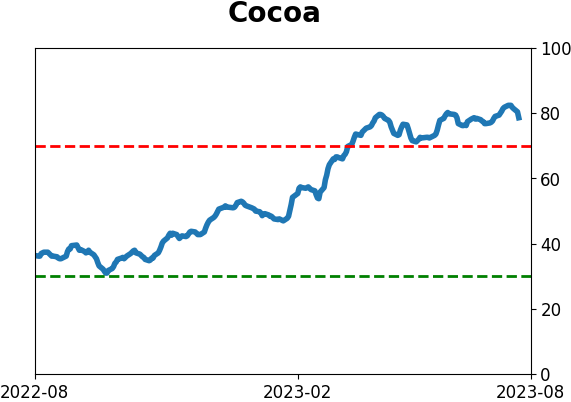
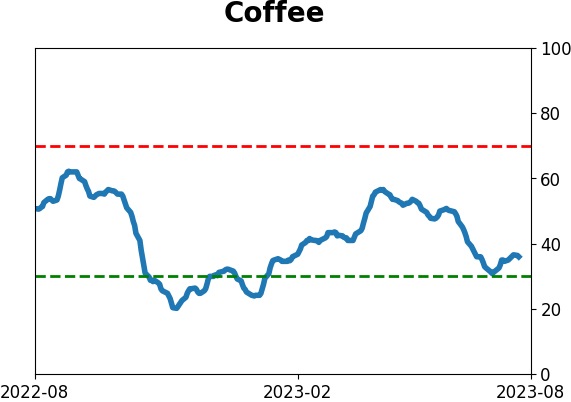
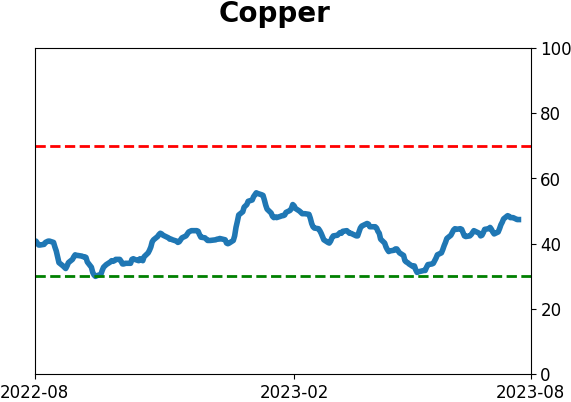
Commodity ETF's - 5-Day Moving Average
|
|