Headlines
|
|
Why this probably isn't just a bear market rally:
There is almost universal acceptance that the current rise in stocks is only a "bear market rally." According to news articles, skepticism has never been higher. But the S&P 500 has still retraced more than 43% of its decline with a double-digit rally. Only once did such an impressive recovery fail.
|
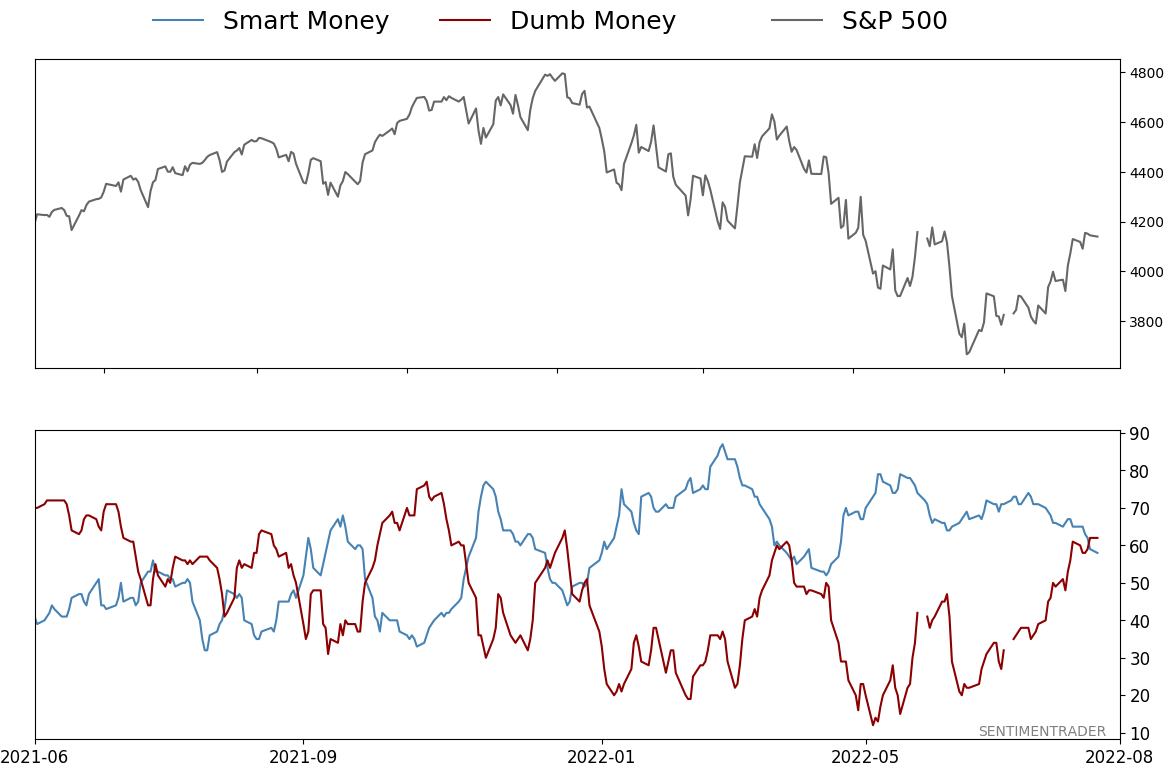
Smart / Dumb Money Confidence
|
Smart Money Confidence: 58%
Dumb Money Confidence: 62%
|
|
Risk Levels
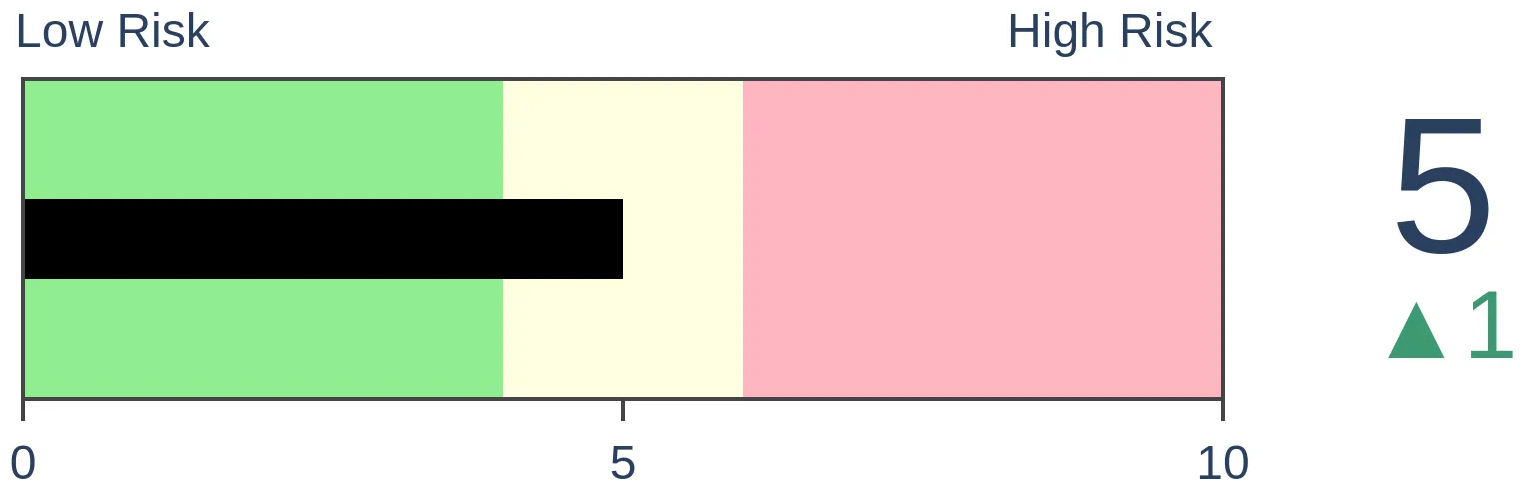
Stocks Short-Term
|
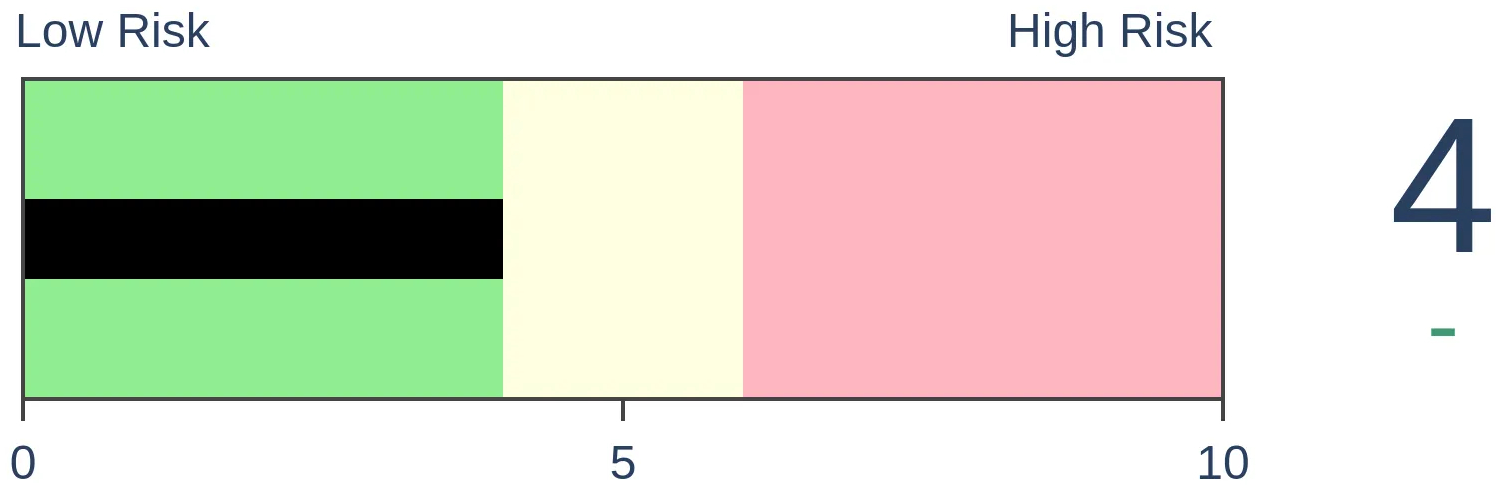
Stocks Medium-Term
|
|
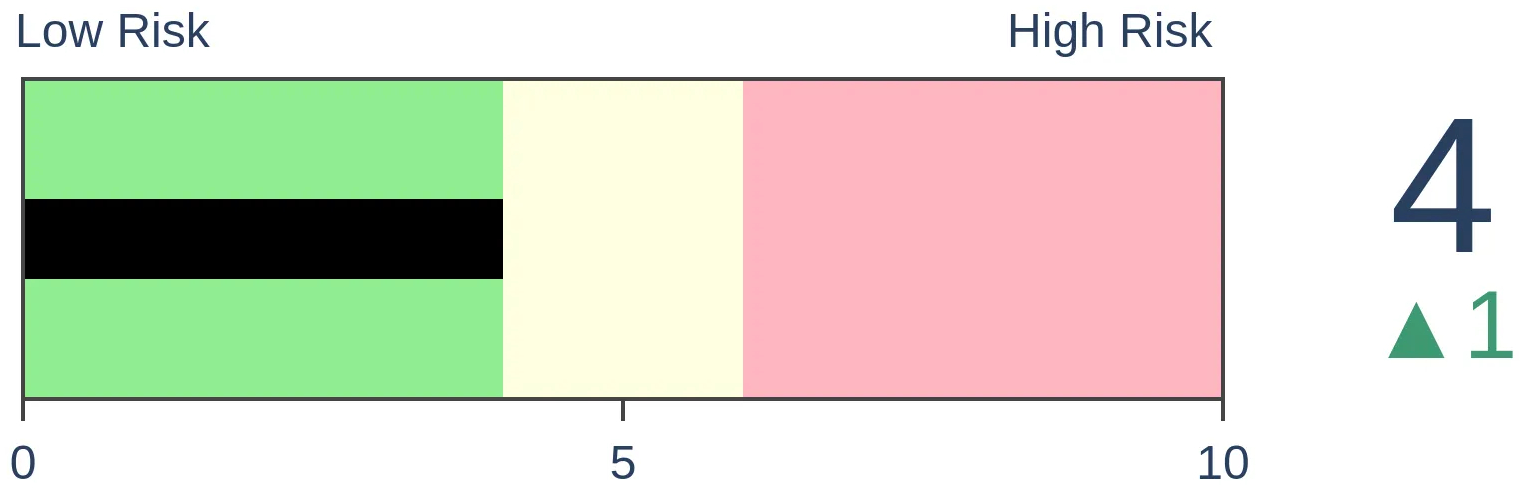
Bonds
|
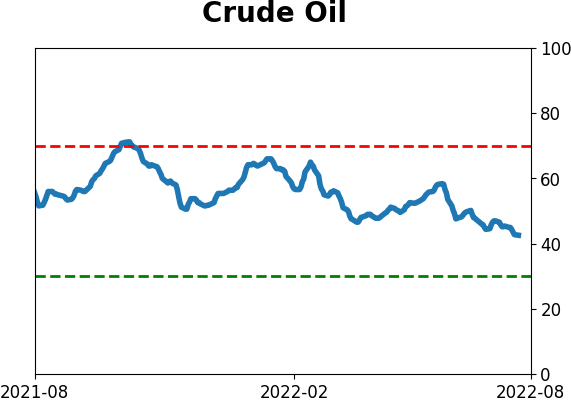
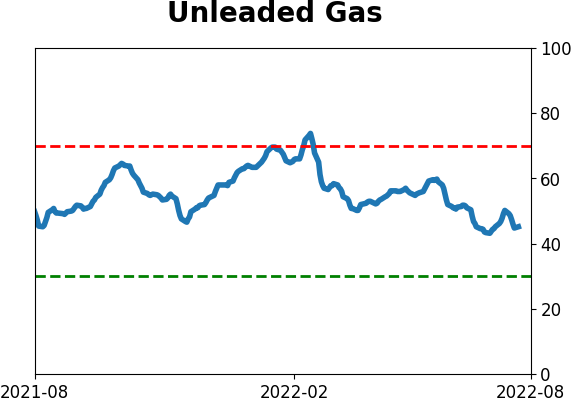
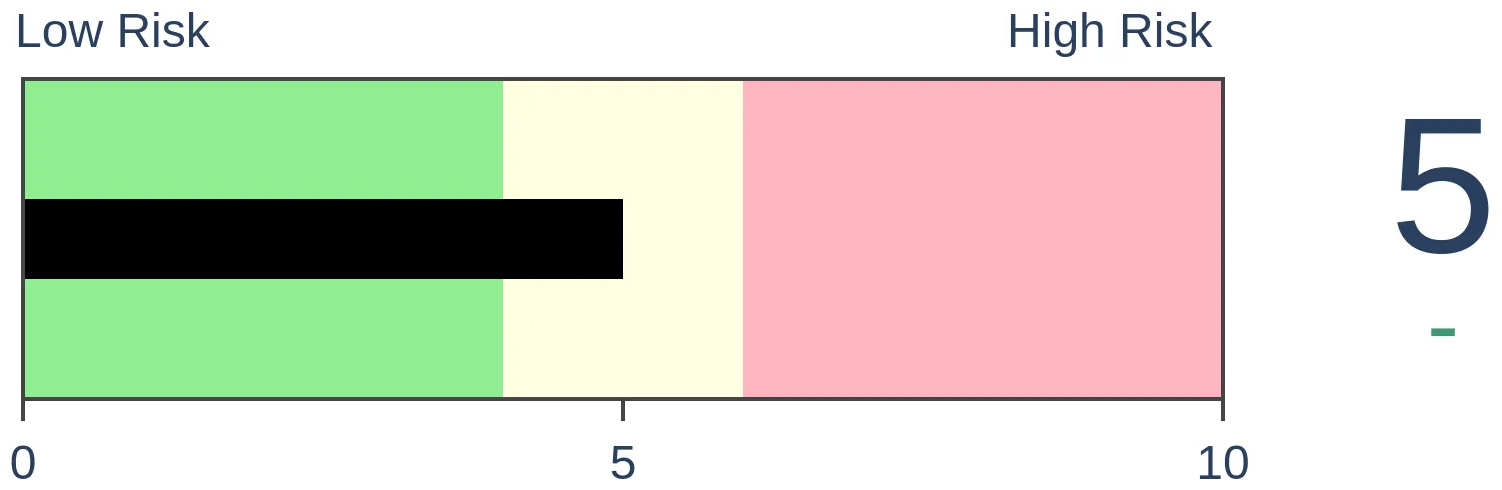
Crude Oil
|
|
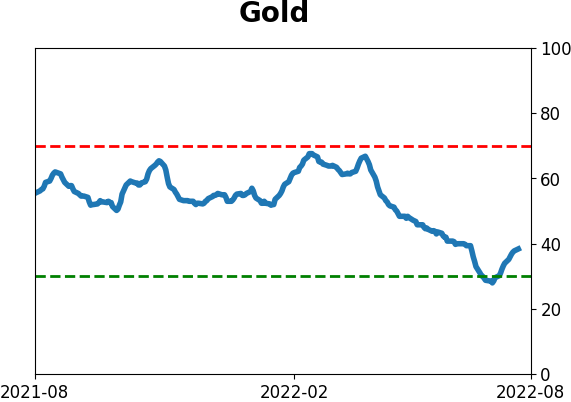
Gold
|
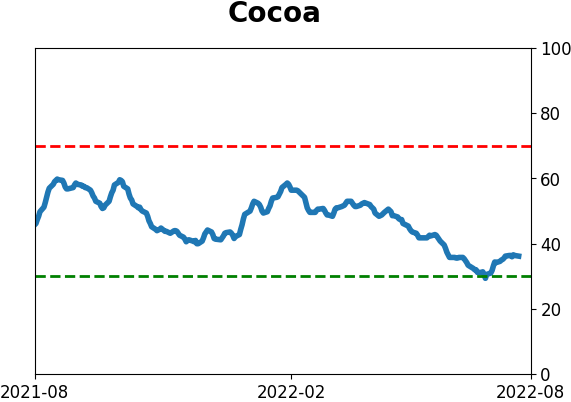
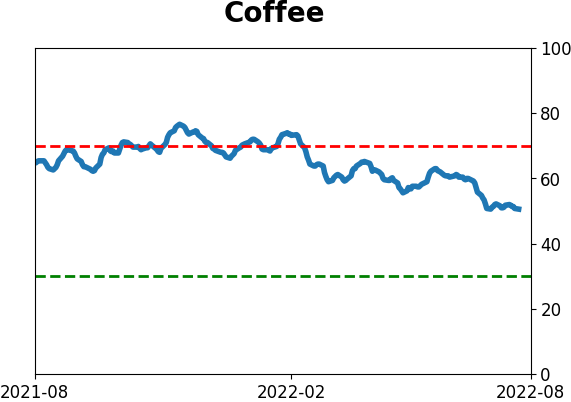
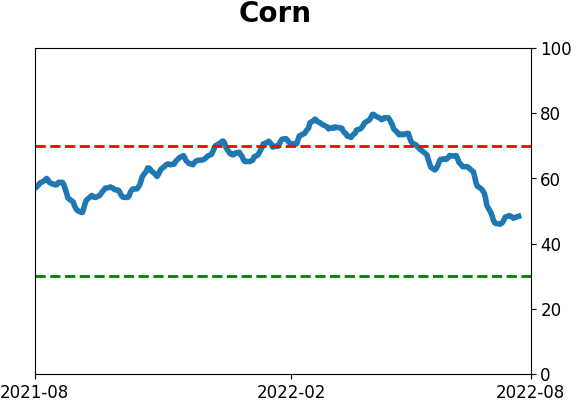
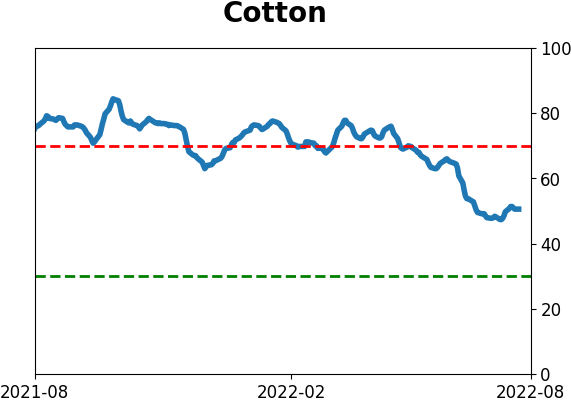
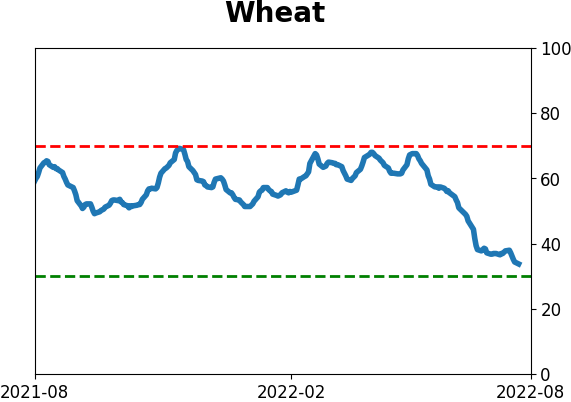
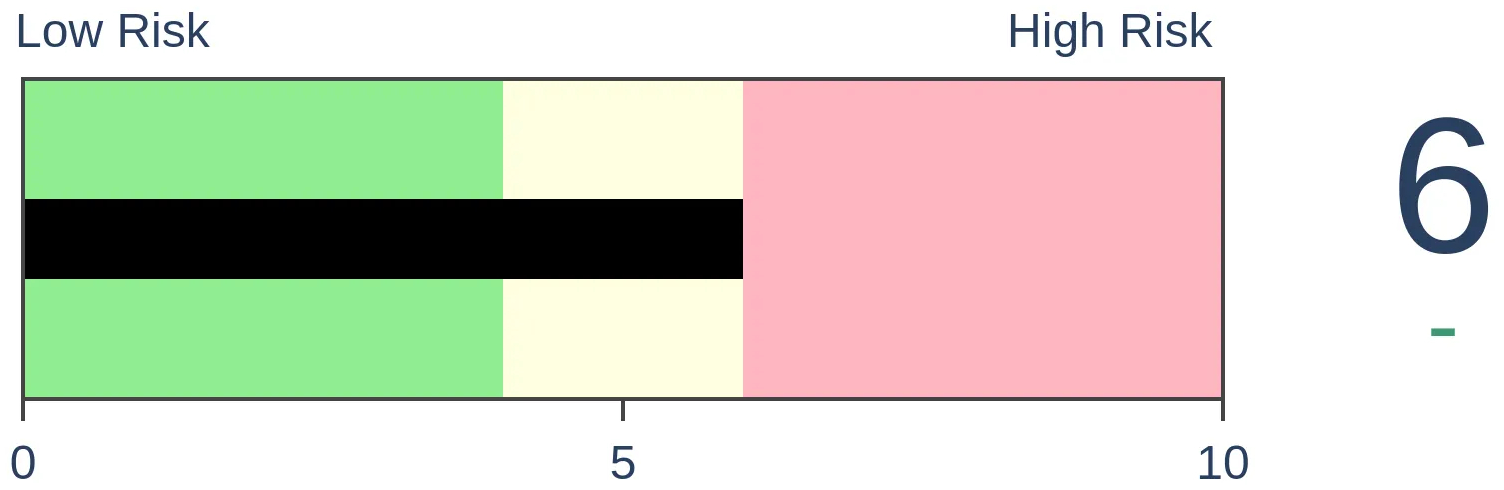
Agriculture

|
|
Research
By Jason Goepfert
BOTTOM LINE
There is almost universal acceptance that the current rise in stocks is only a "bear market rally." According to news articles, skepticism has never been higher. But the S&P 500 has still retraced more than 43% of its decline with a double-digit rally. Only once did such an impressive recovery fail.
FORECAST / TIMEFRAME
SPY -- Up, Long-Term
|
Key points:
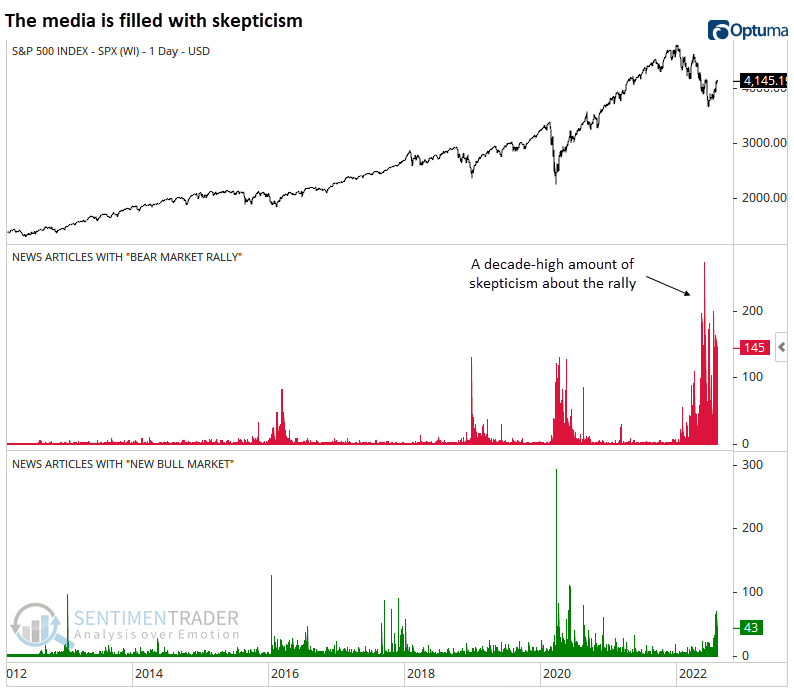
- There has been a record amount of skepticism about the current rally in stocks
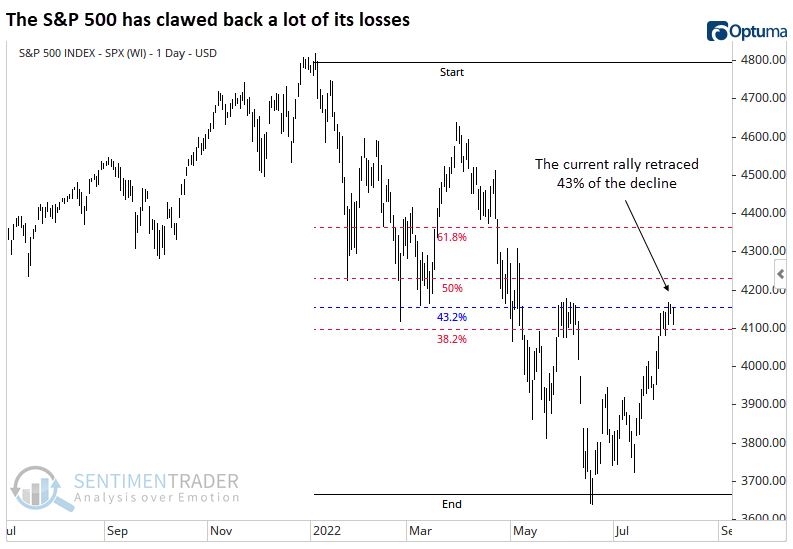
- Despite the doubts, the S&P 500 has retraced more than 43% of its decline, rallying double-digits
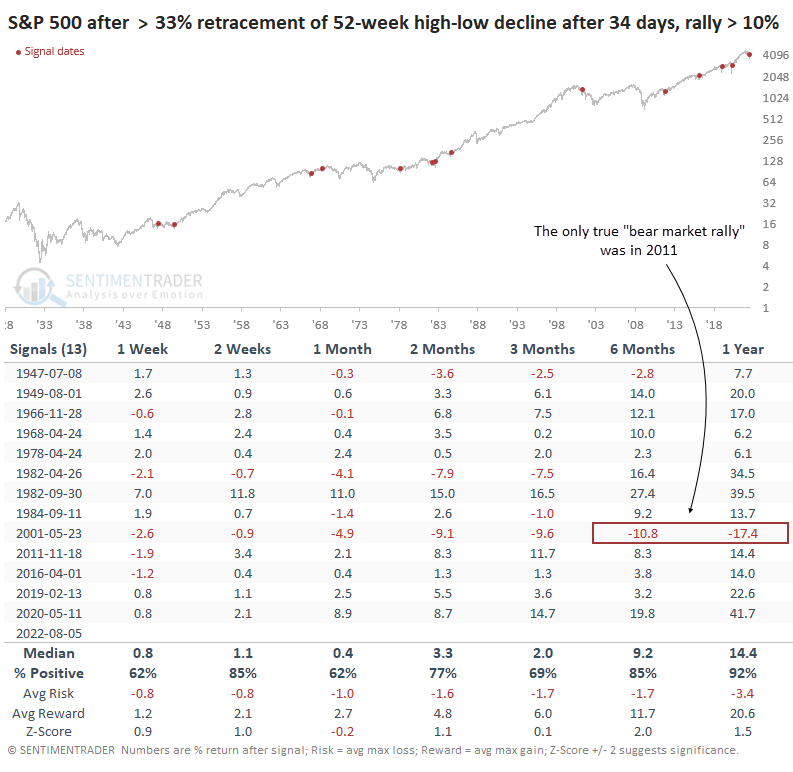
- Out of all similar retracements, only one ultimately failed and was an actual bear market rally
Just another bear market rally
It's hard to avoid the implication that the current rally in risky assets is bound to fail. From Wall Street strategists to financial media to the chattering masses on Twitter, there is very little conviction that stocks can hold onto their gains.
Pull up a quick Google search, and the amount of skepticism is overwhelming; it's almost entirely one-sided.
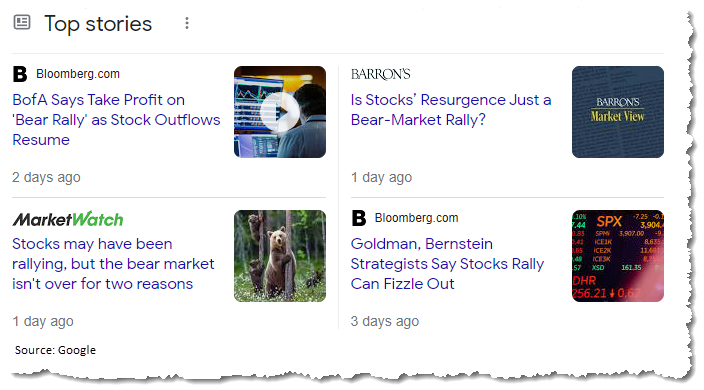
This isn't just anecdotal. According to an exhaustive Bloomberg database of world media, the number of news articles mentioning a "bear market rally" hit a record in June. Even after a double-digit rally, the accusation hasn't abated much.
Mentions of "new bull market" are picking up, but that's also what happened after the spikes in "bear market rally" articles in 2016 and 2020.
We heard the same refrains off of the pandemic low. But as we saw at the time, it was not just another bear market rally. The key then was in the retracement - in only a couple of weeks, the S&P 500 clawed back more than a third of its decline.
That's not what happens in bear markets.
An impressive retracement means it's less likely to fail
This time, the rally has been slower to unfold. As of Friday, the rally has gone 34 trading days, but it's still been impressive. Measuring from the S&P 500's last 52-week high to 52-week low, the index retraced more than 43% of its decline and stood more than 13% above its low.
Similar to 2020, this is not what we typically see during a bear market. The table below shows every rally from a 52-week low when the S&P 500 retraced at least a third of its decline over 34 days. The index had to be at least 10% higher than its low. There was a failure in 2001, which is a concern; it was also the only one.
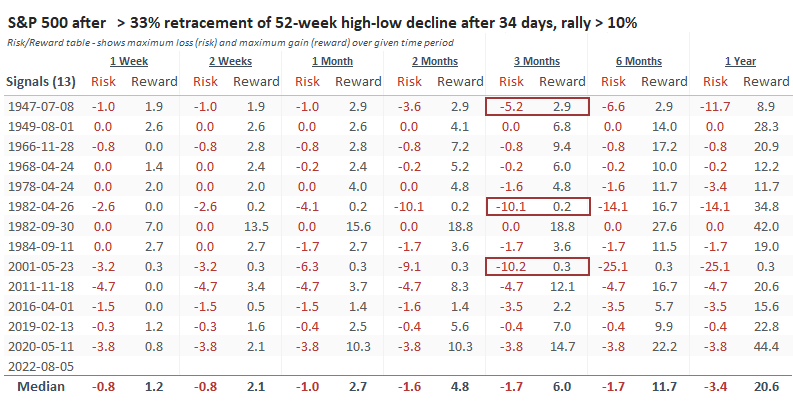
The Risk/Reward Table shows that the former tended to be muted while the latter was impressive. Within the next three months, besides the 2001 failure, only 1947 and 1982 saw more than a 5% drawdown. Those two ultimately recovered but were still weaker than average.
As usual, it was a better sign for longer-term returns if shorter-term risk was muted relative to reward.
Lesser rallies = higher probability of failure
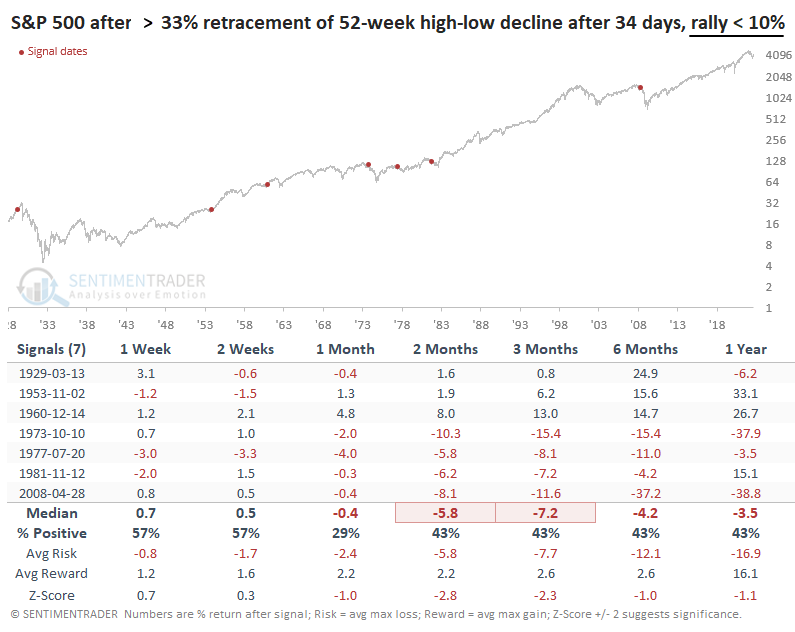
If we look at lesser rallies when the S&P retraced at least a third of its decline, but the rally was less than 10%, returns were much less impressive. They still marked bottoms in 1953 and 1960, but the others failed.
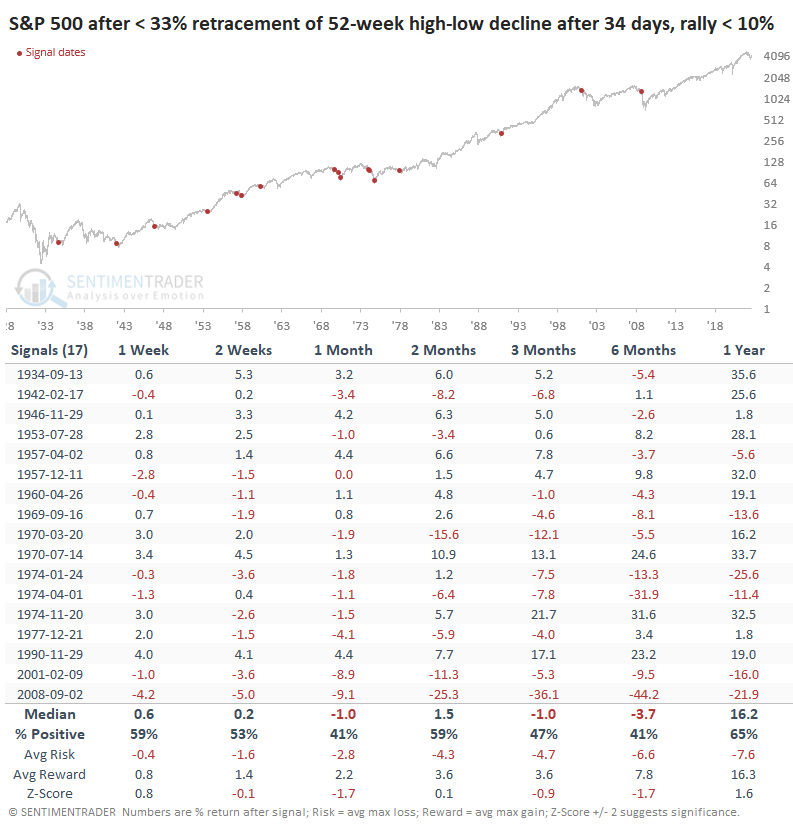
The same goes for rallies when the index retraced less than a third of its decline after 34 days and rallied less than 10%. Again, a few of these coincided with long-term lows, but the S&P saw weakness over the next 3-6 months most of the time.
What the research tells us...
Heading into June, sentiment was about as poor as it gets, even during bear markets. Then buyers returned in force, triggering several breadth thrusts. The rally has been impressive enough to erase more than a third of the decline in the most benchmarked index in the world. These factors have a strong tendency to lead to positive medium- to long-term returns, lessening the probability that this is just another bear market rally.
Indicators at Extremes
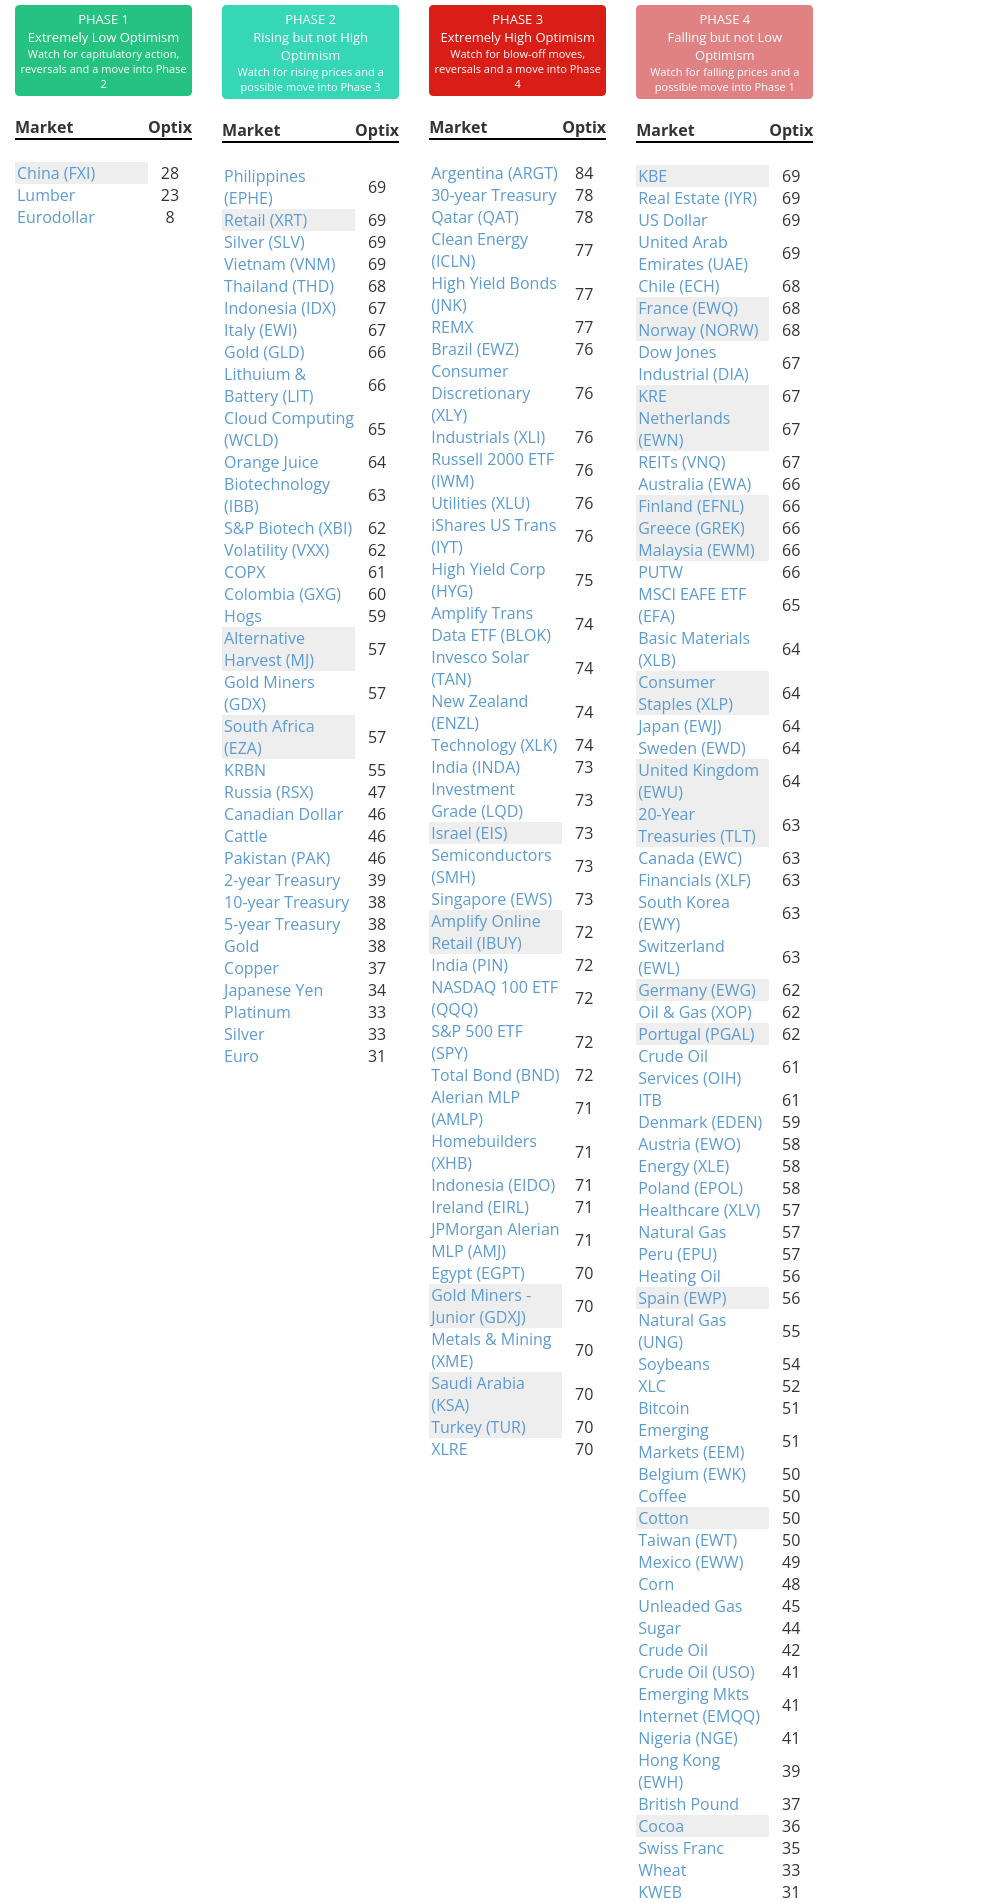
Phase Table
Ranks
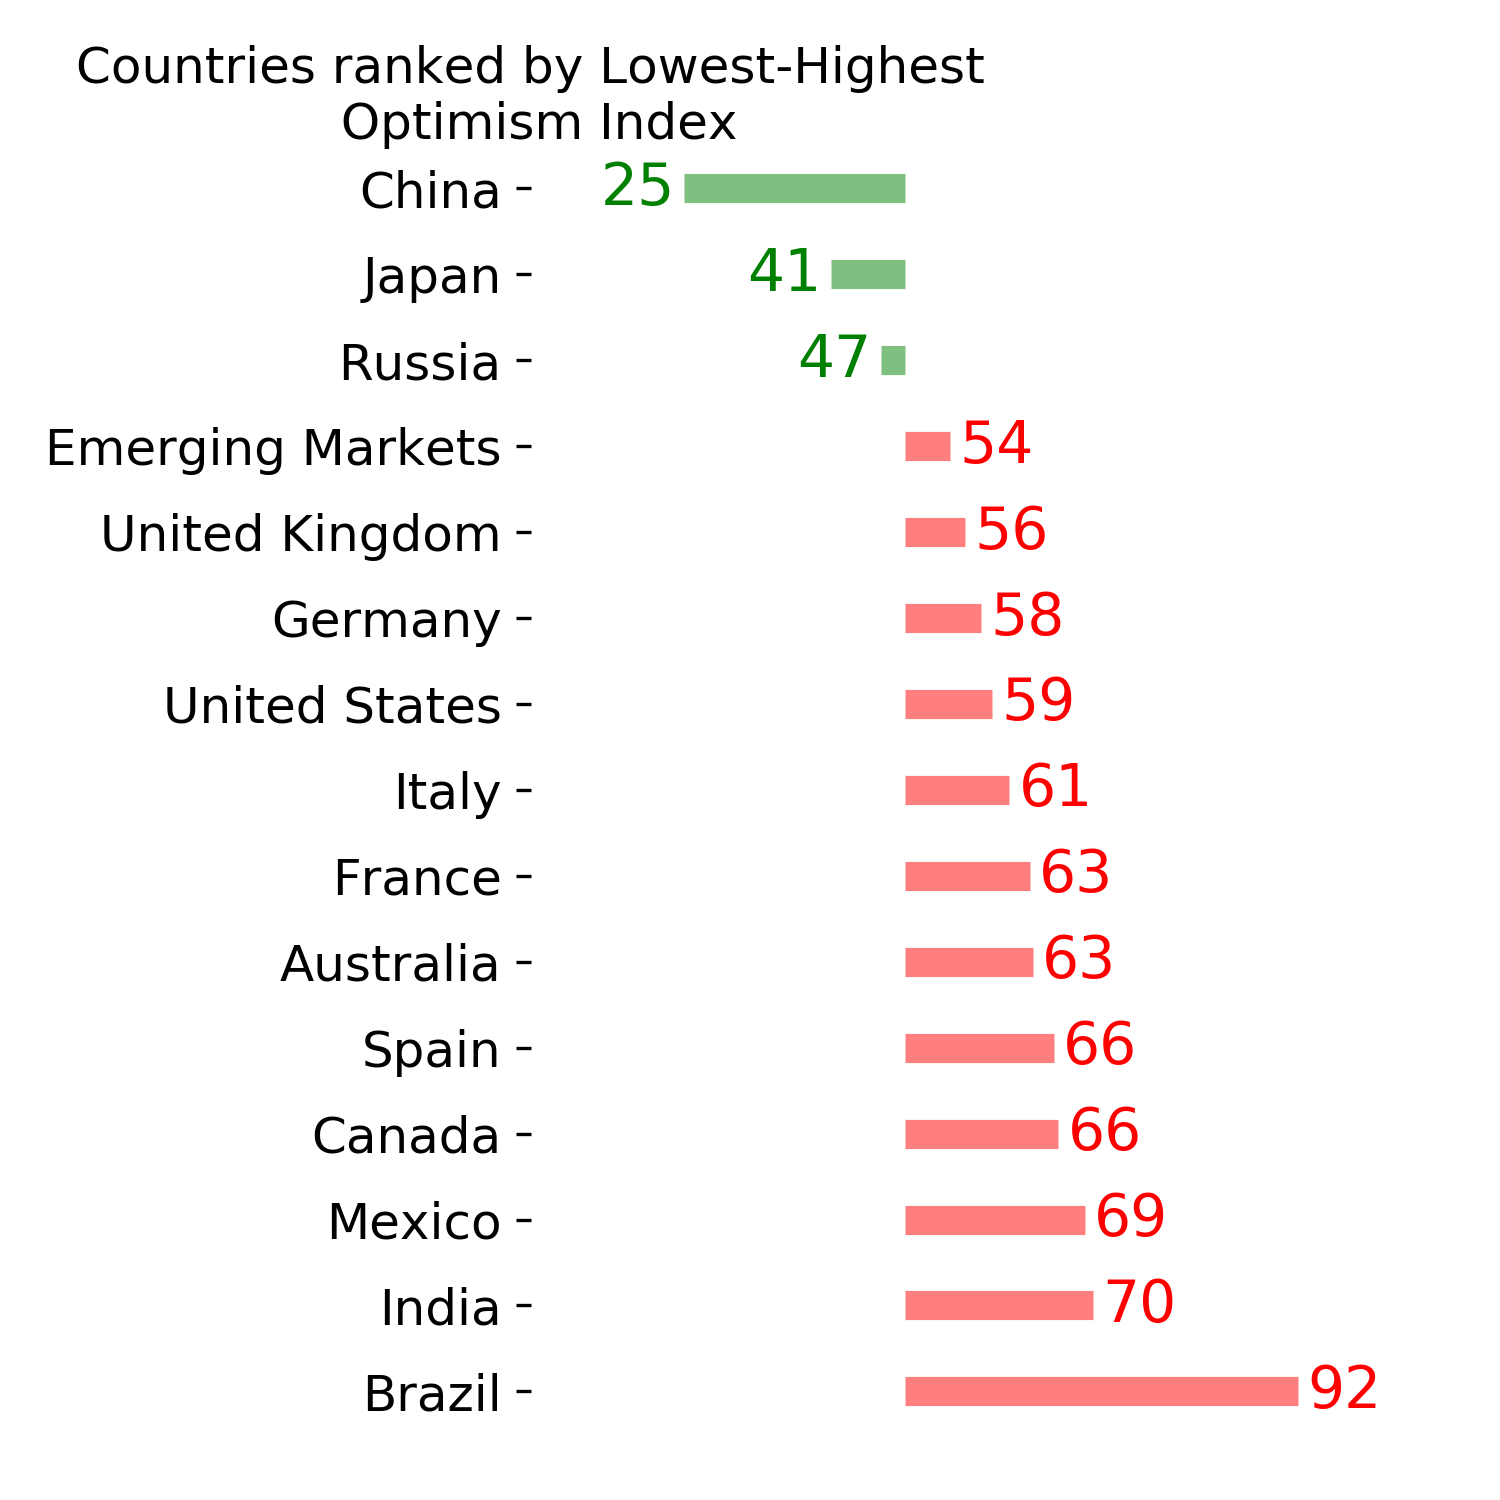
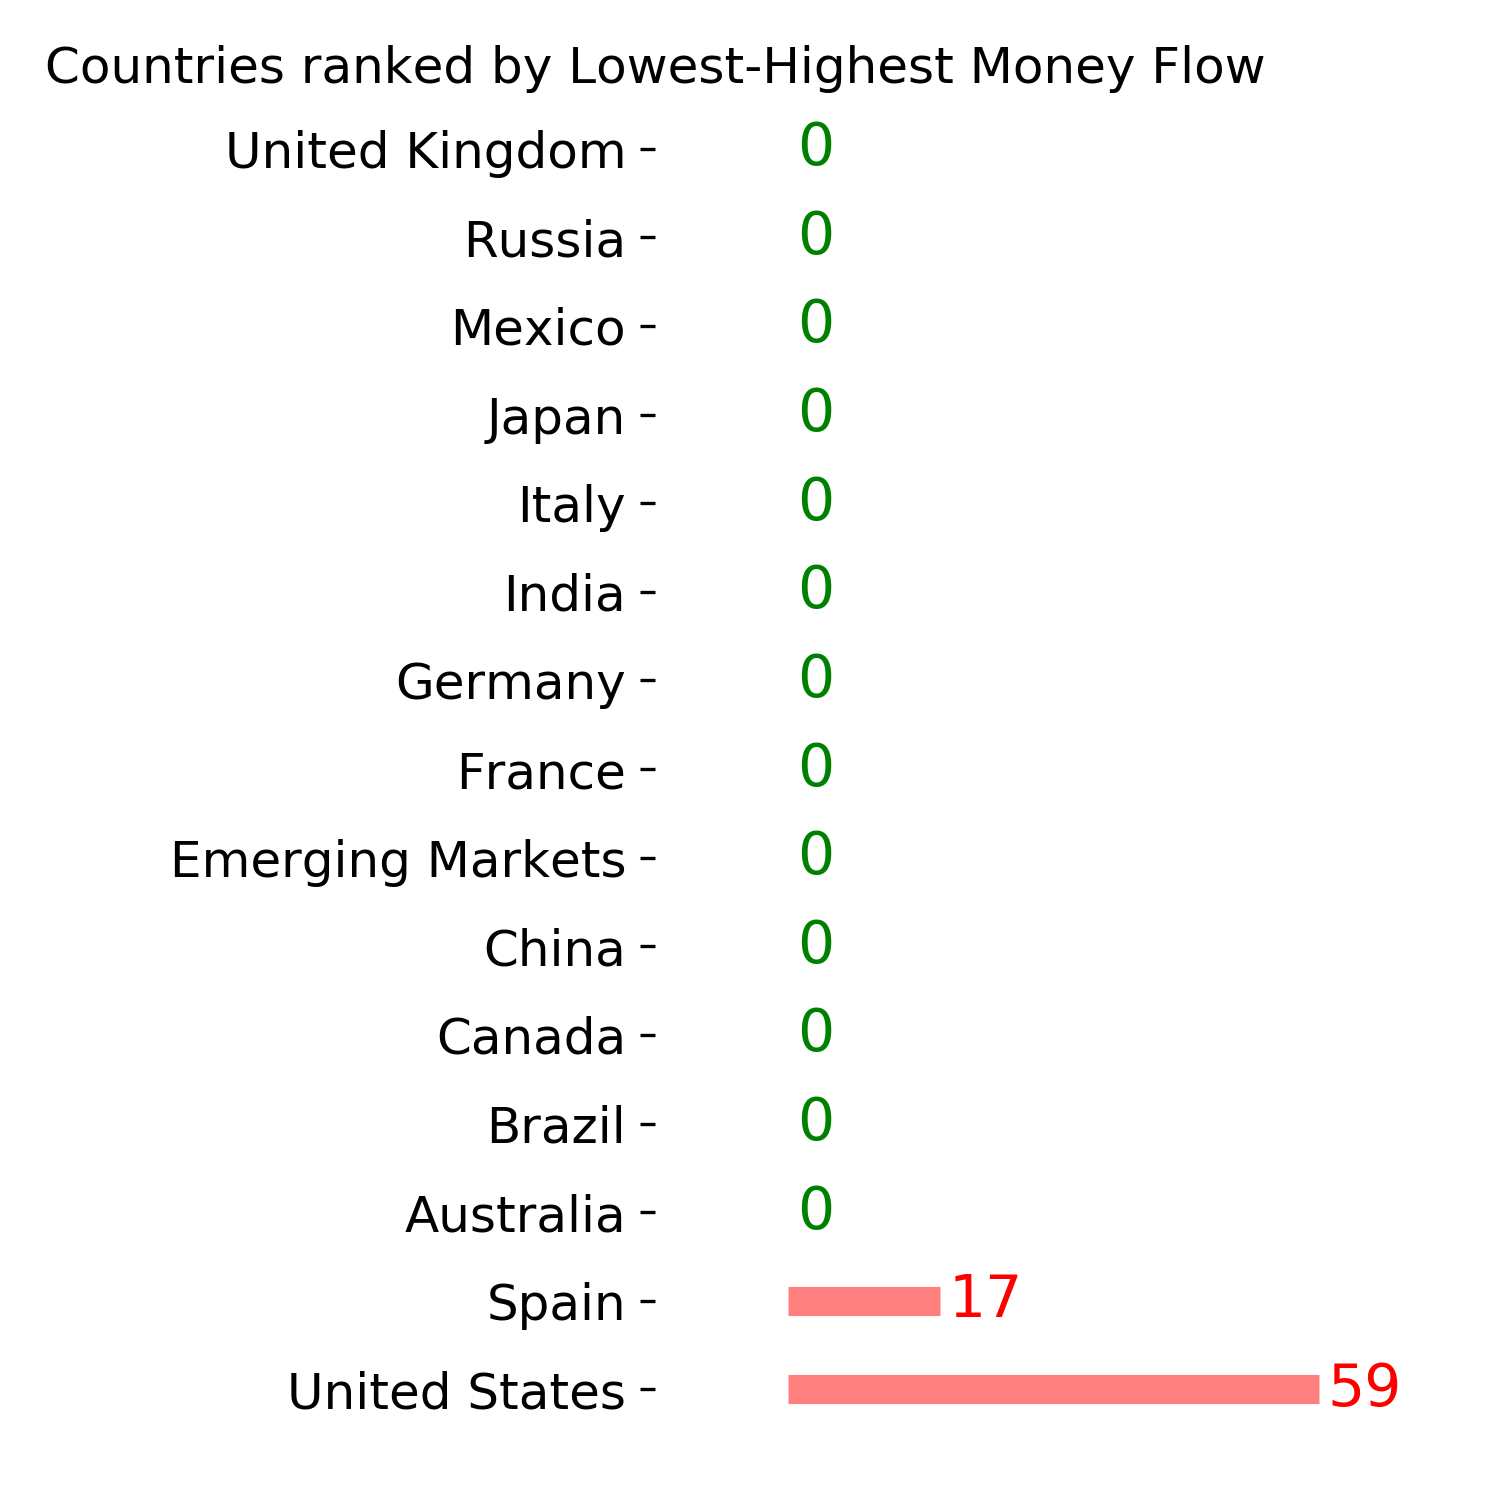
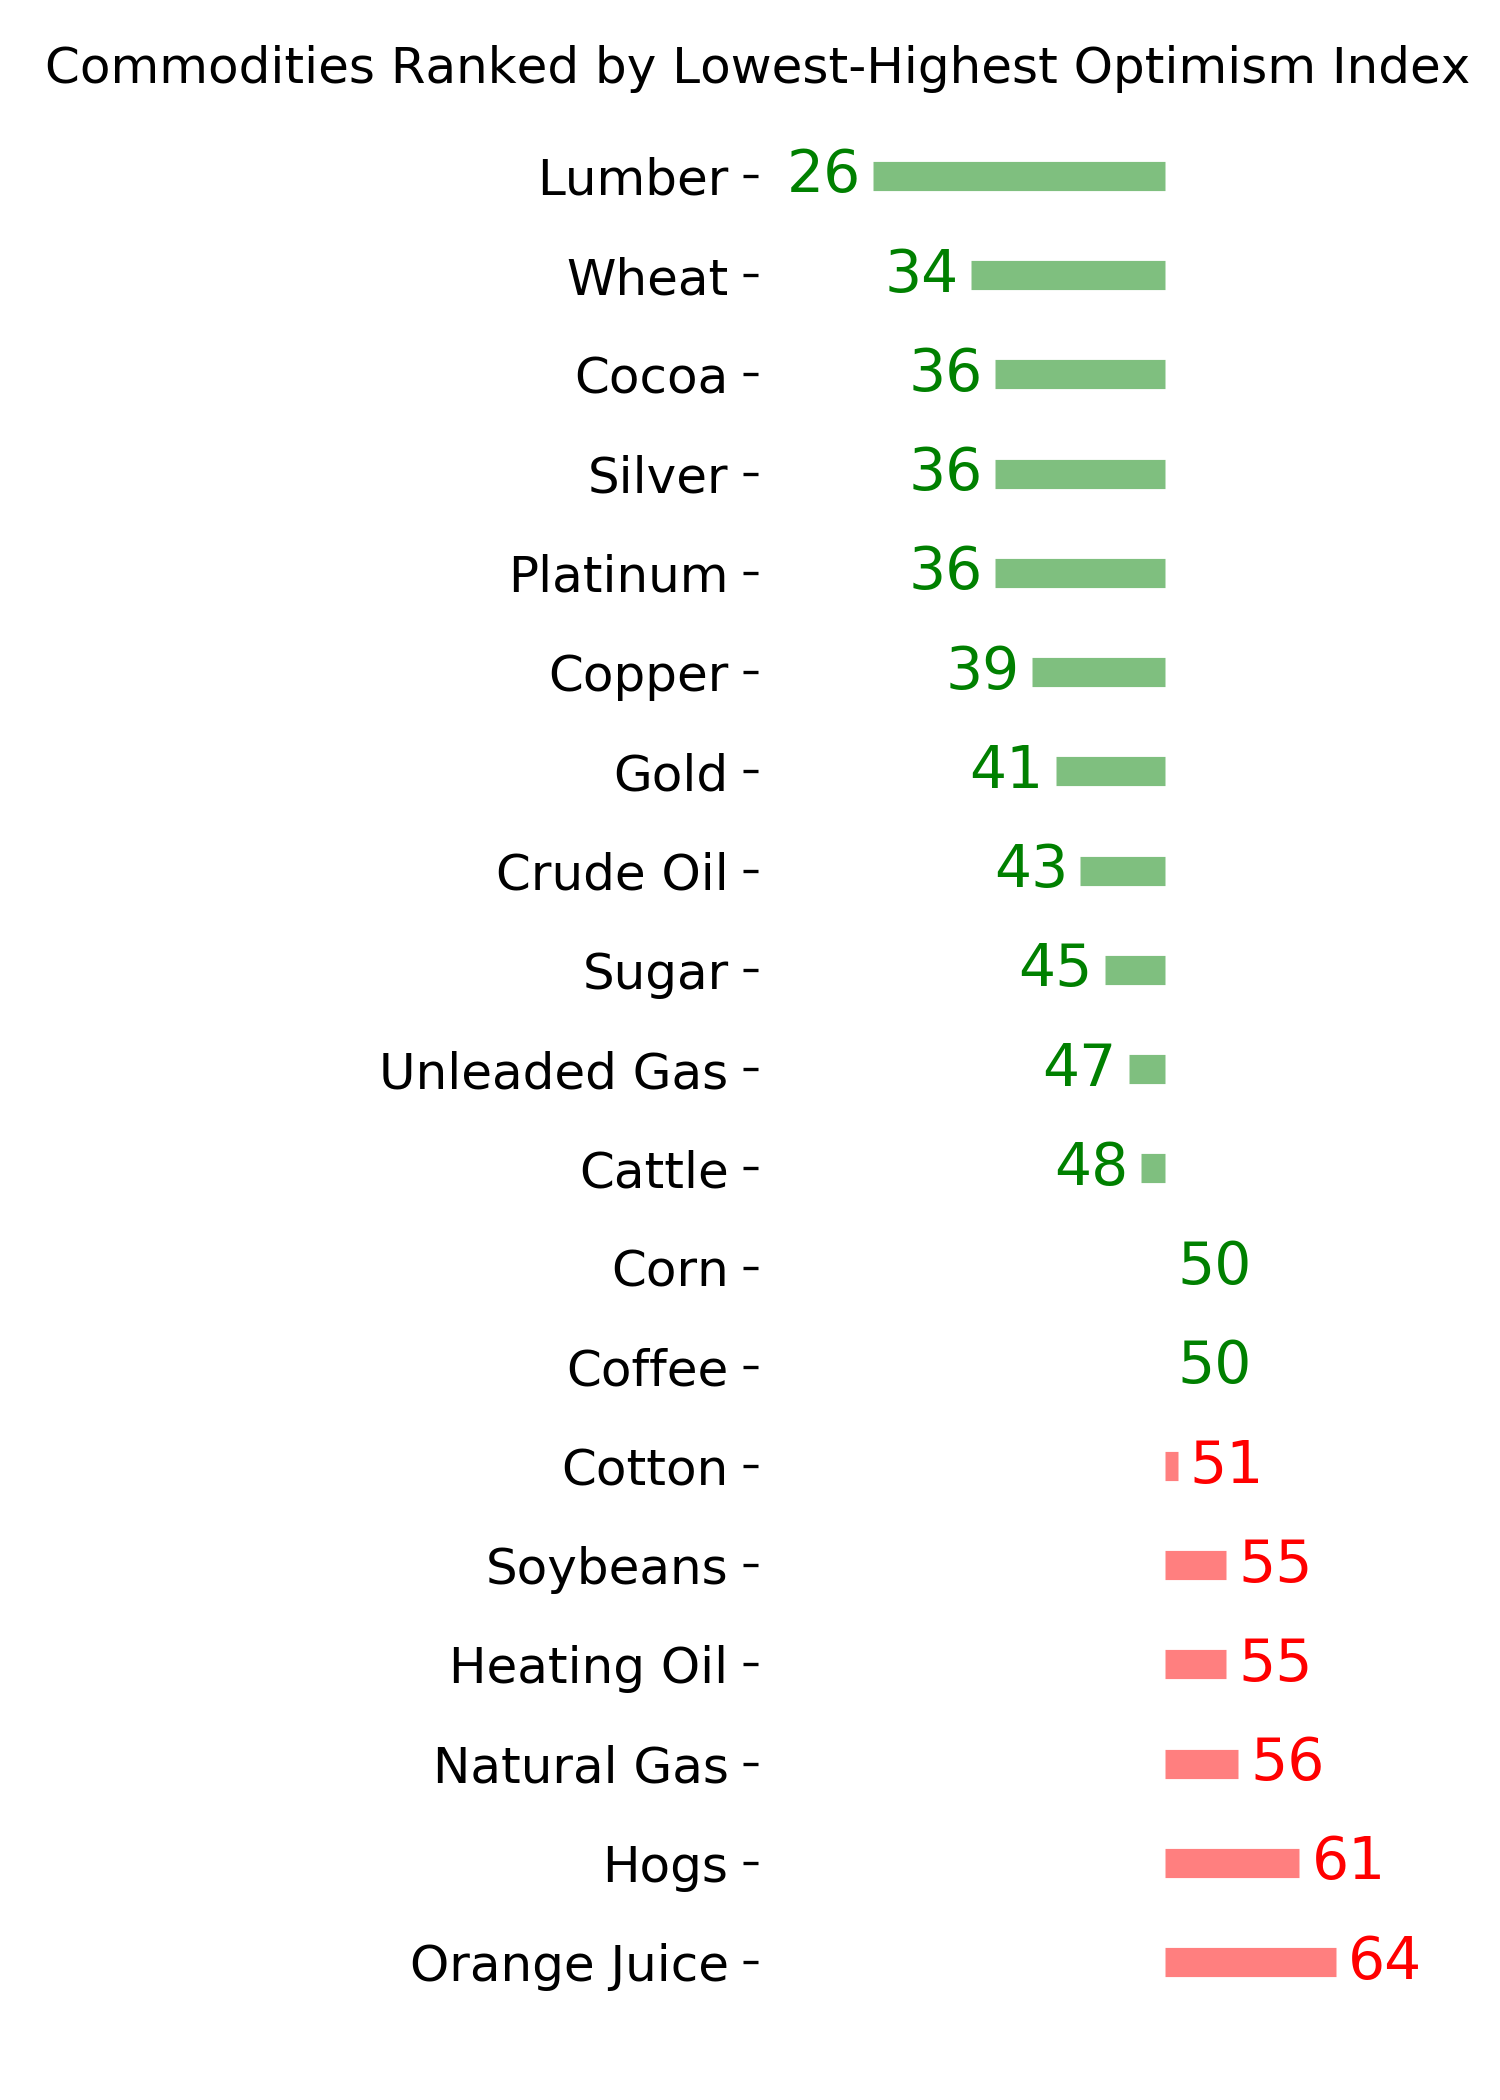
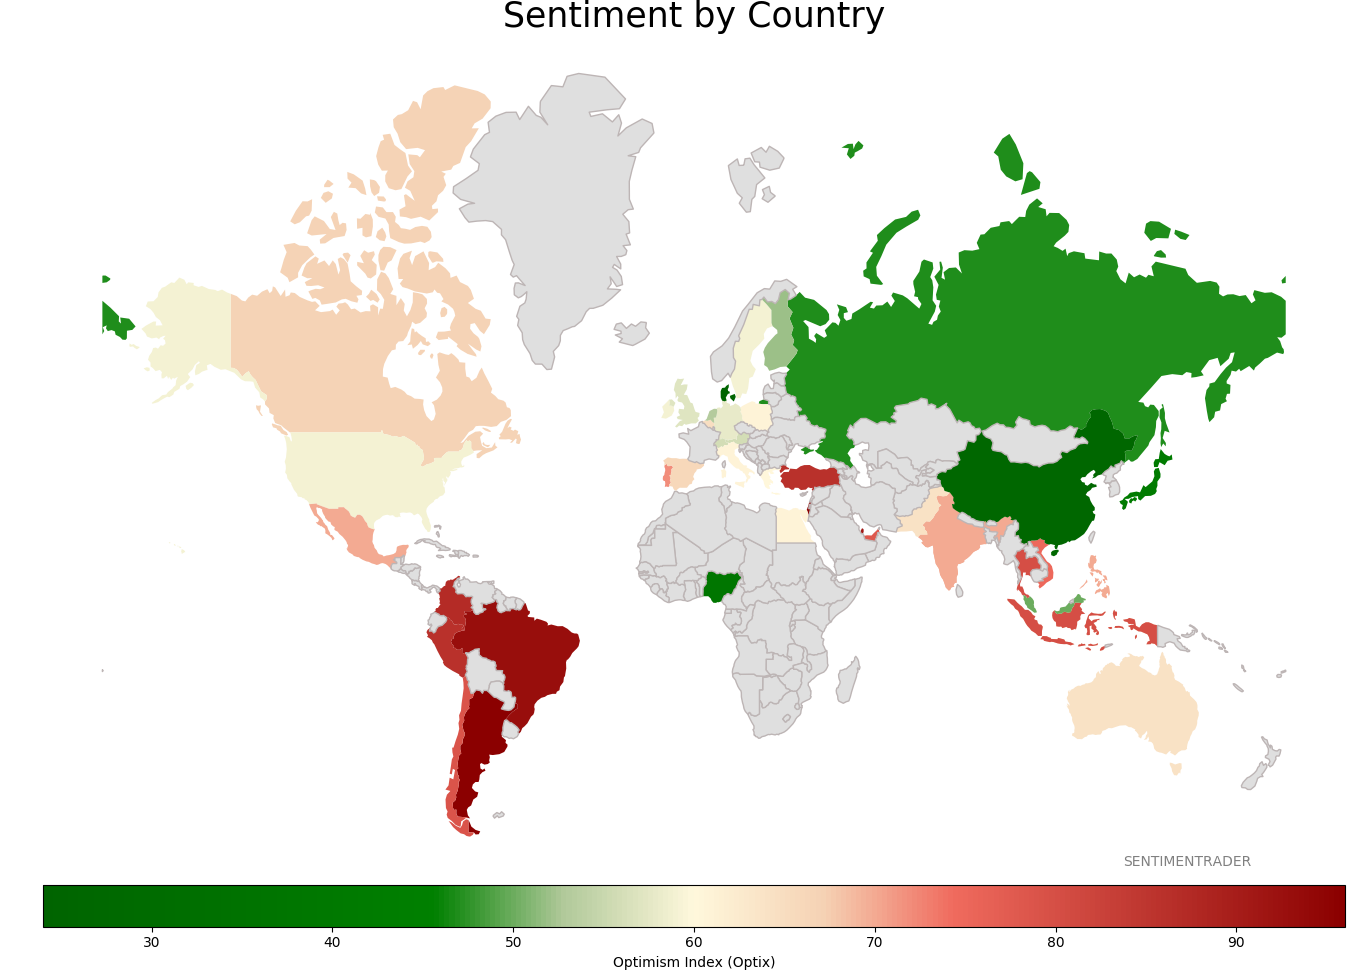
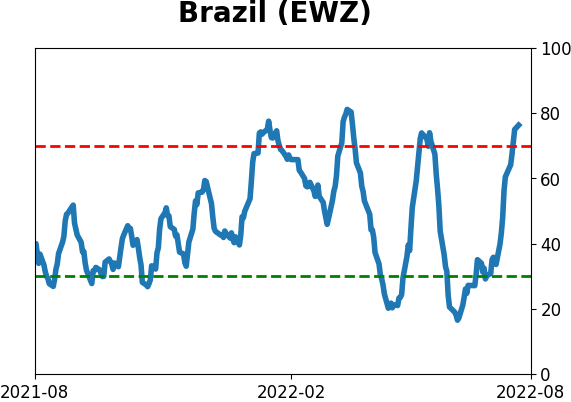
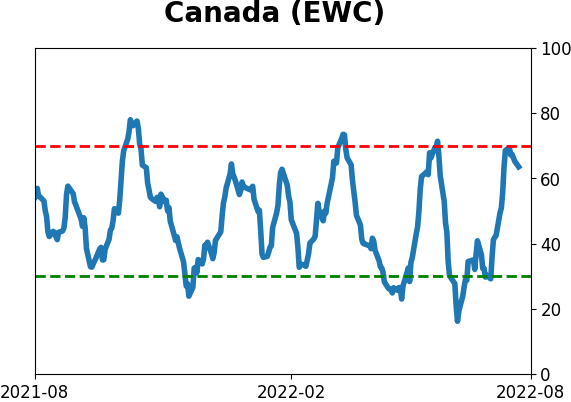
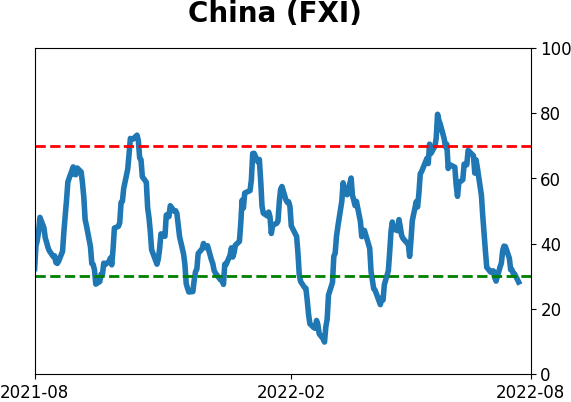
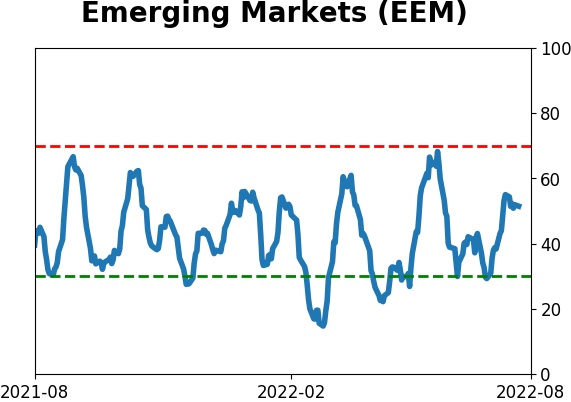
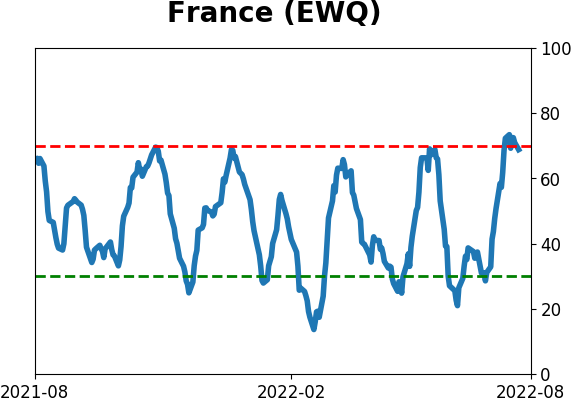
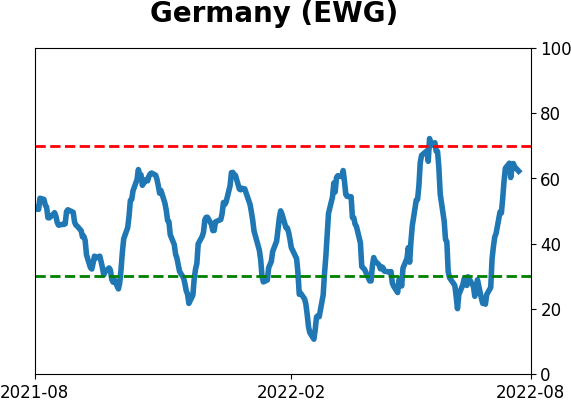
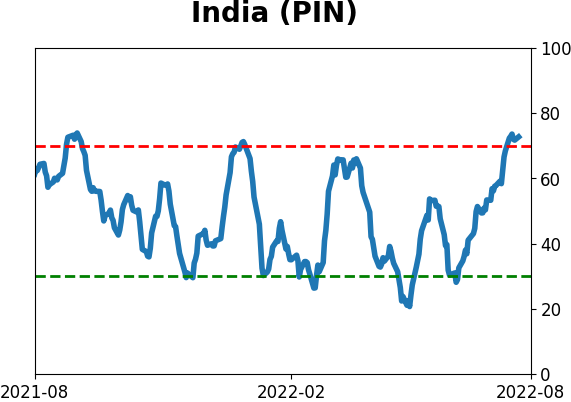
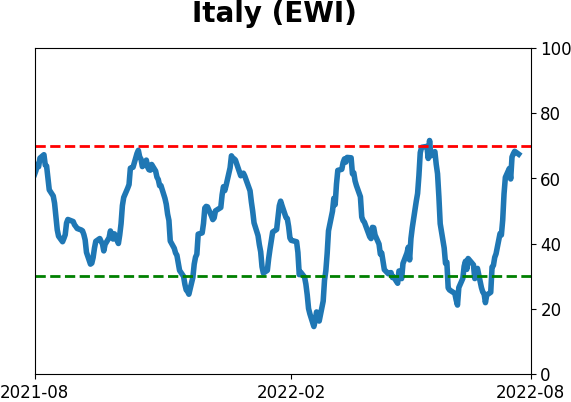
Sentiment Around The World
Optimism Index Thumbnails
|
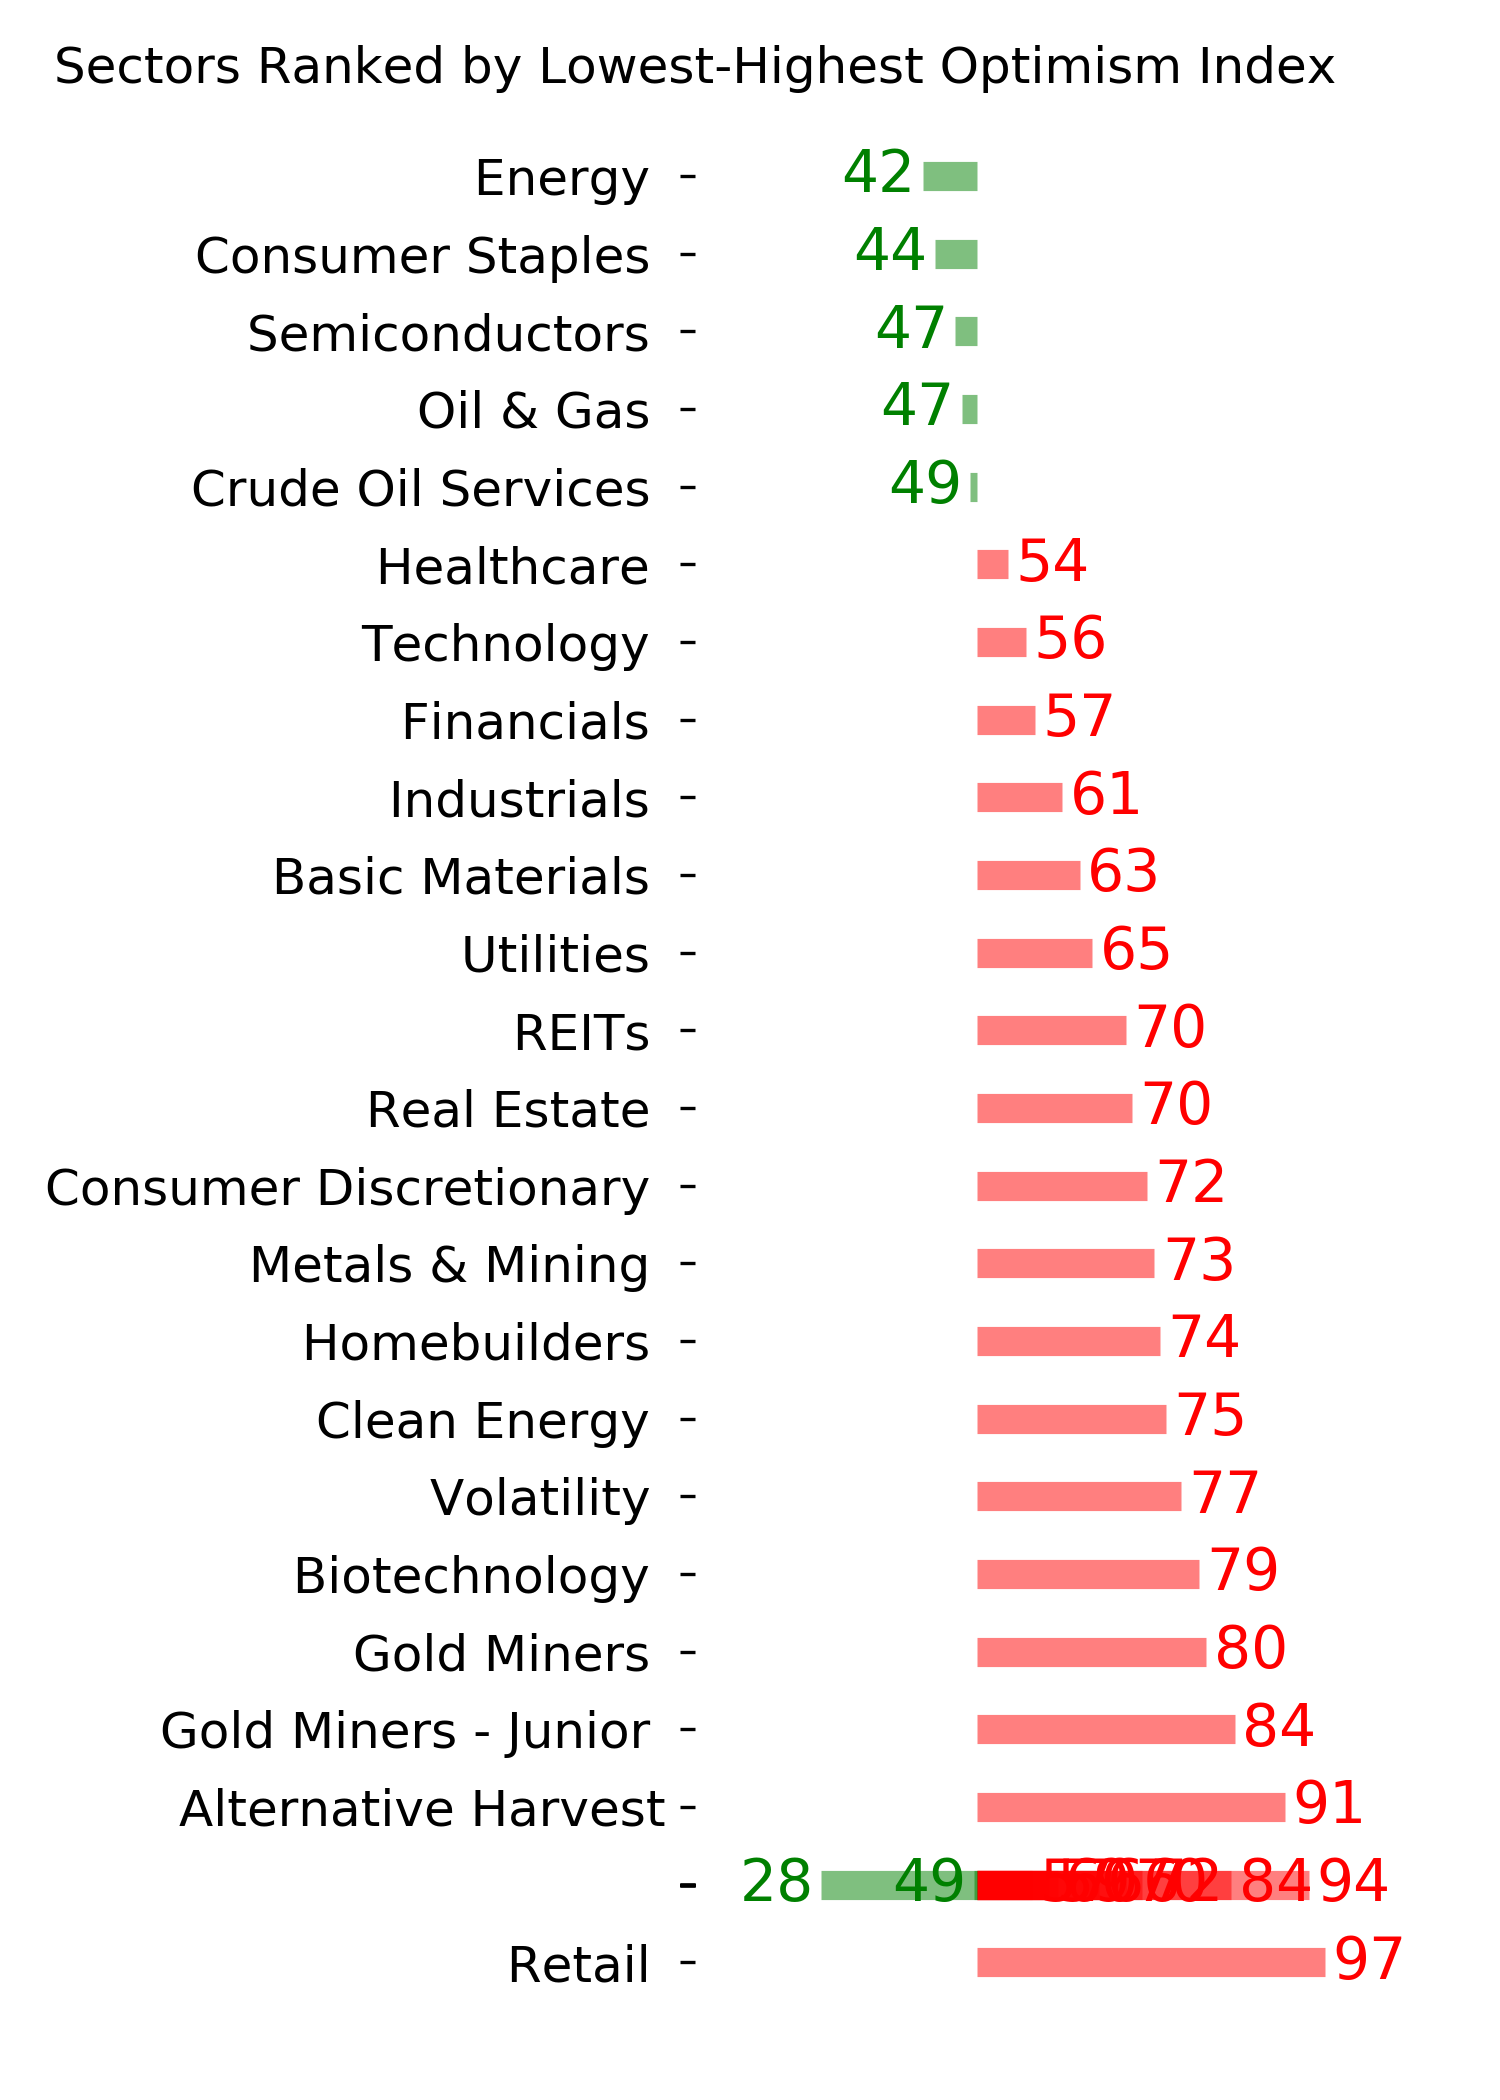
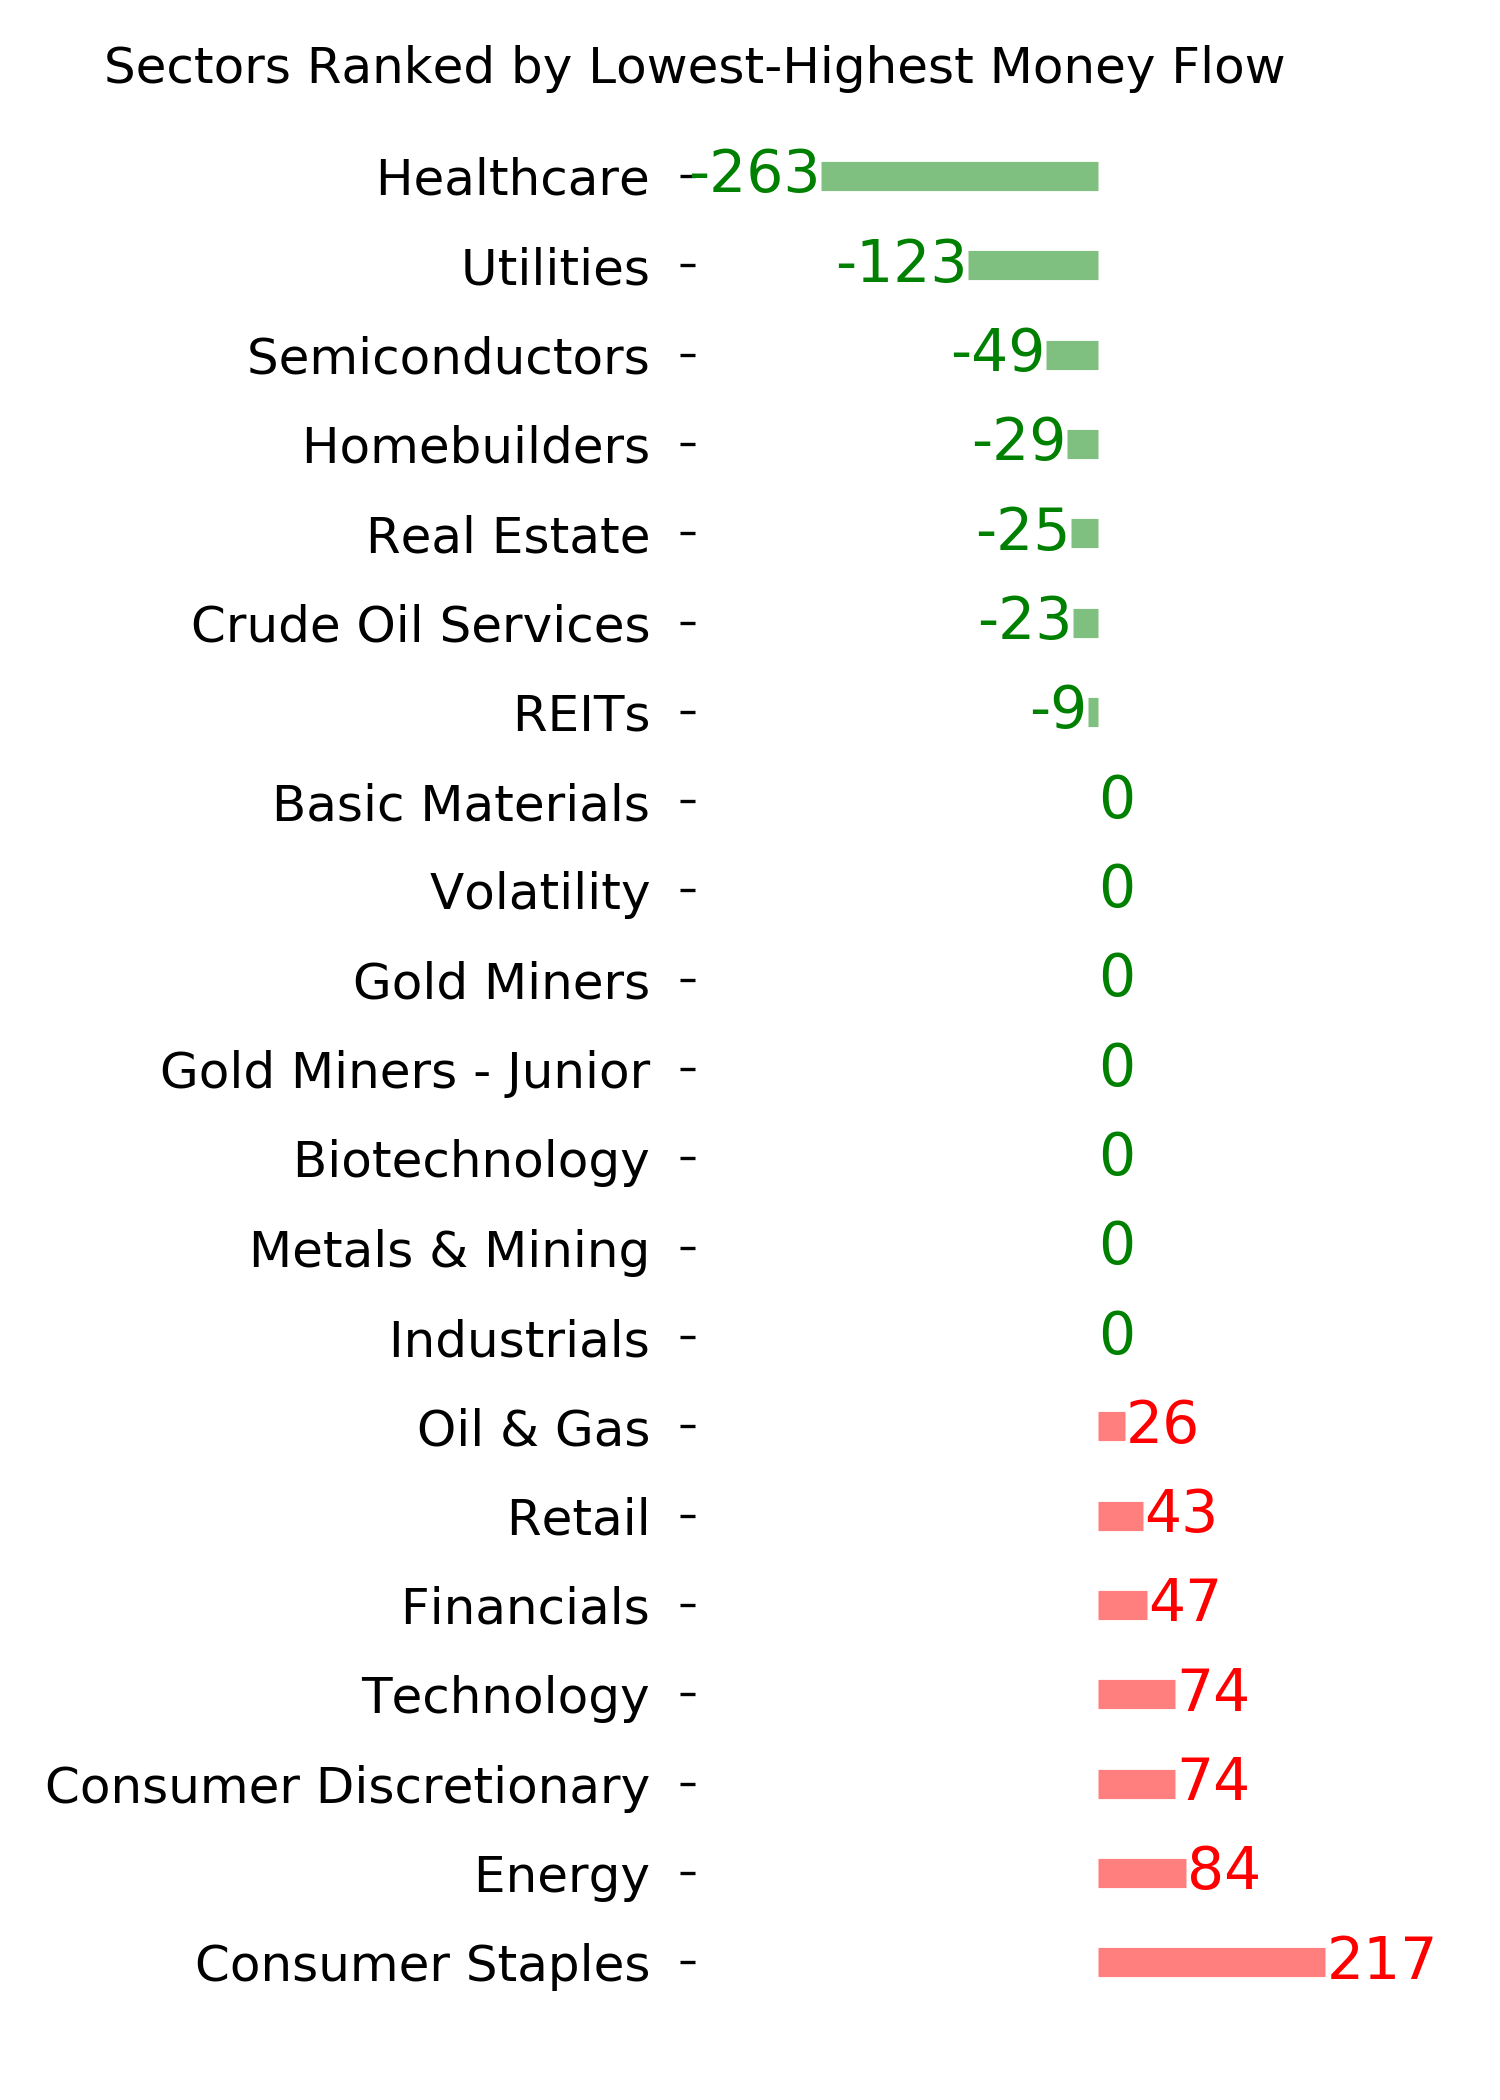
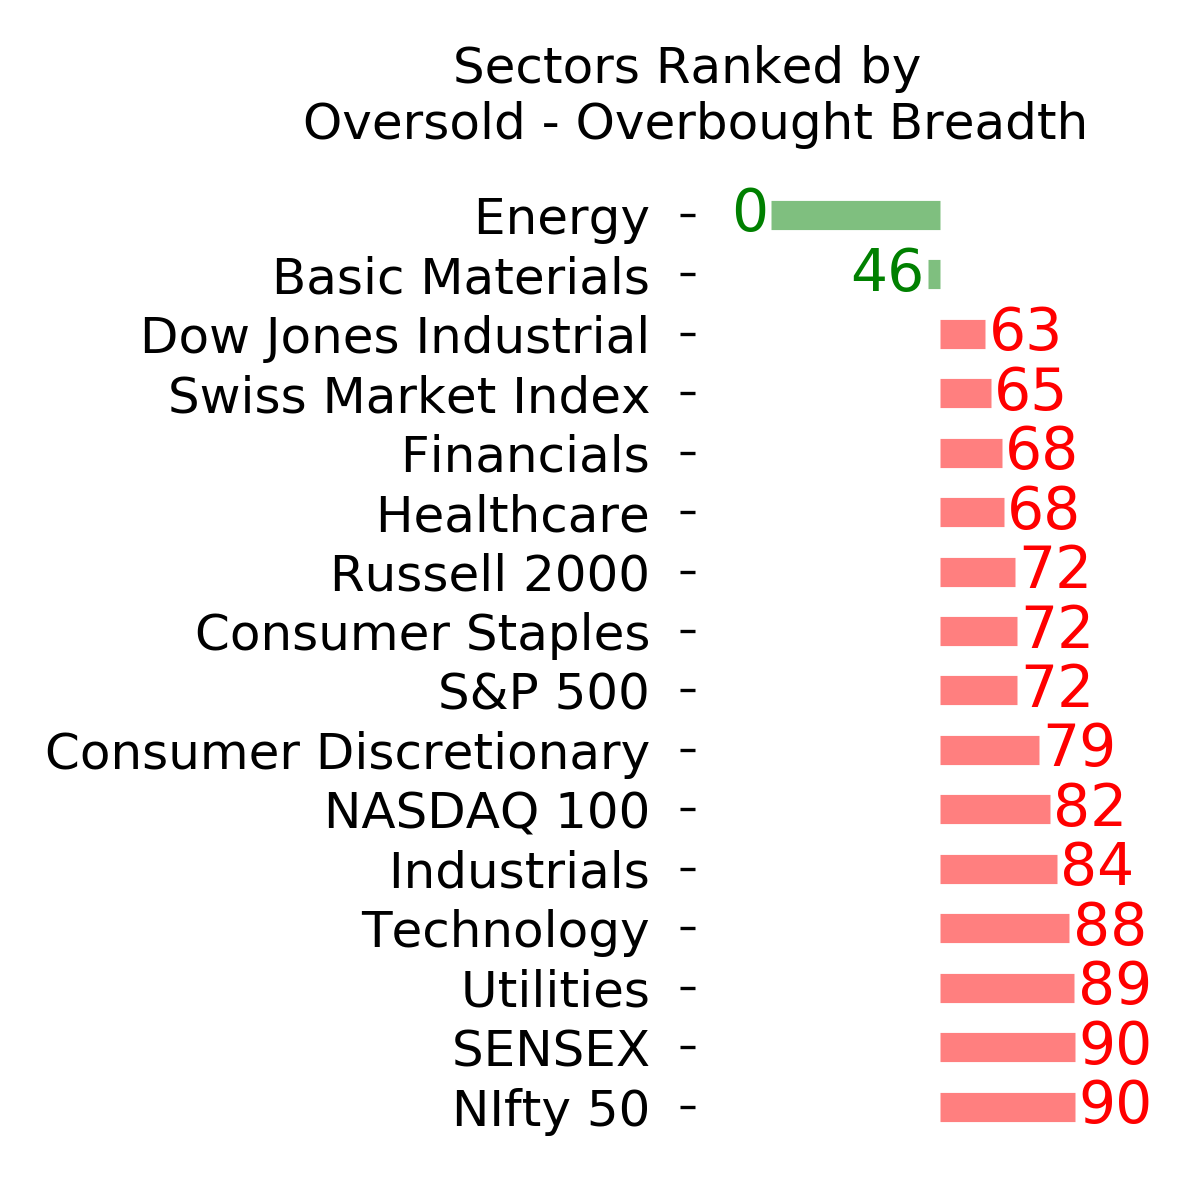
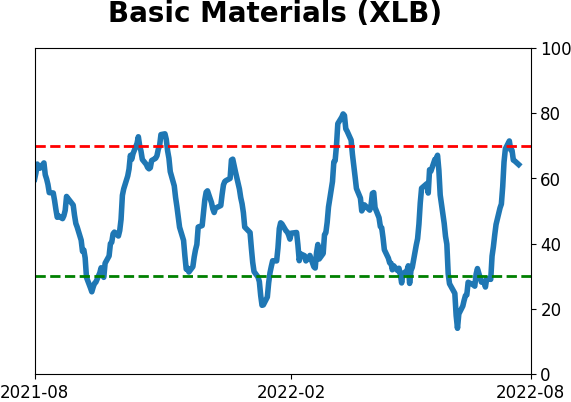
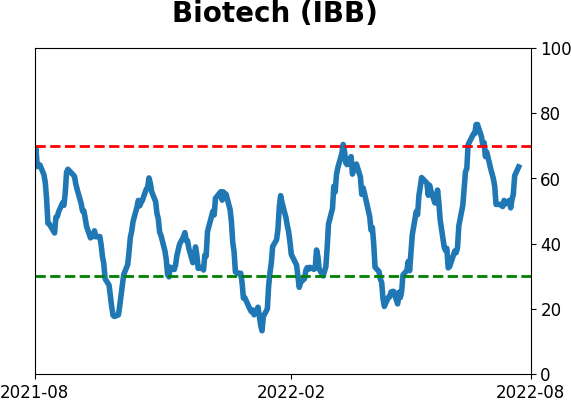
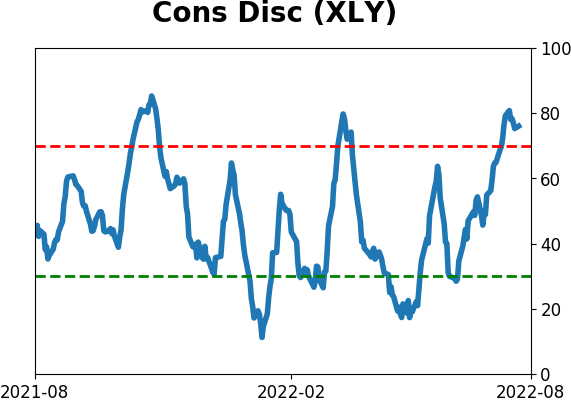
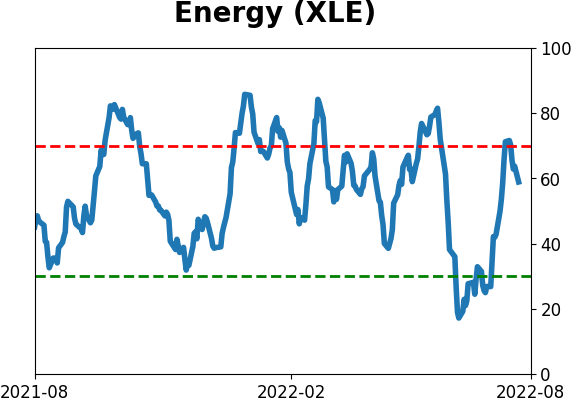
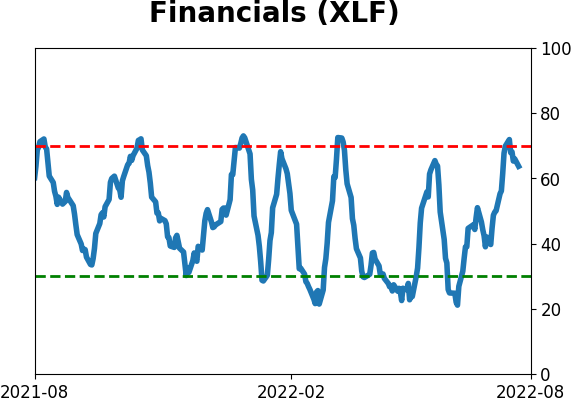
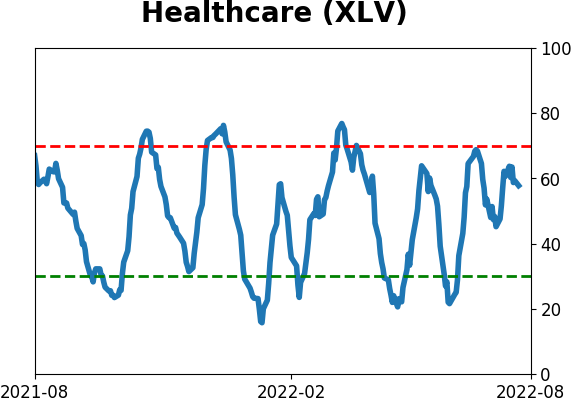
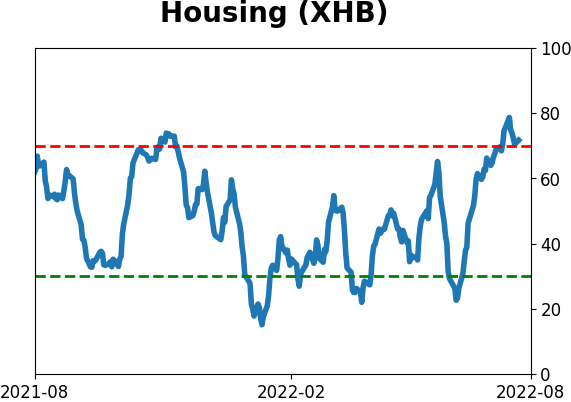
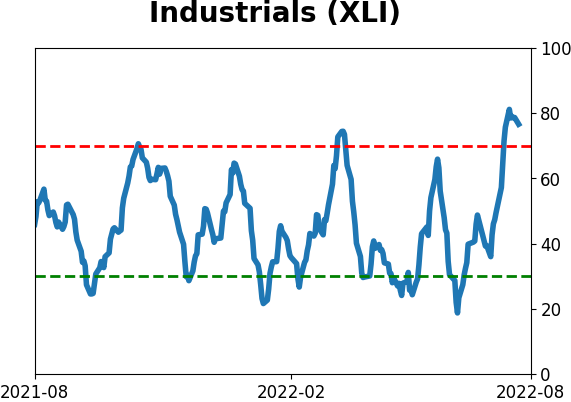
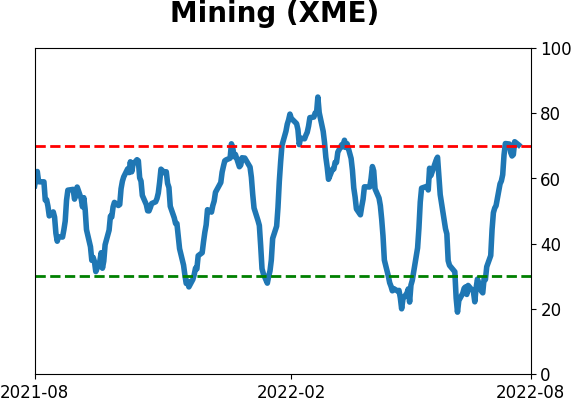
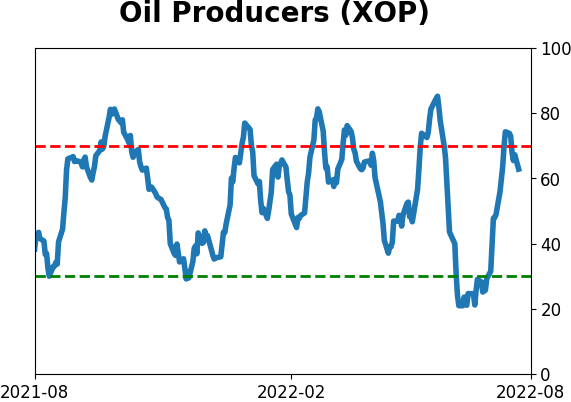
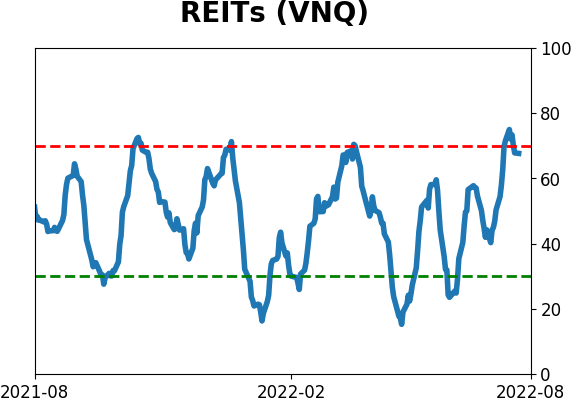
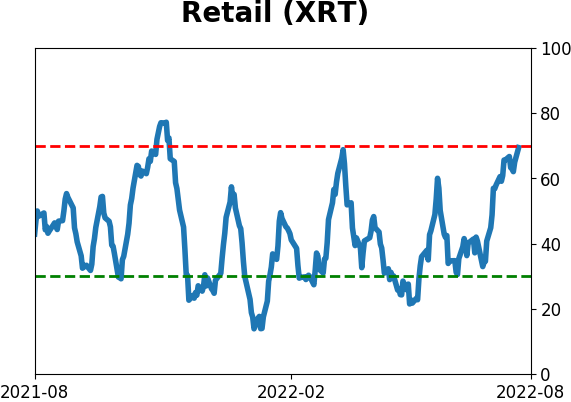
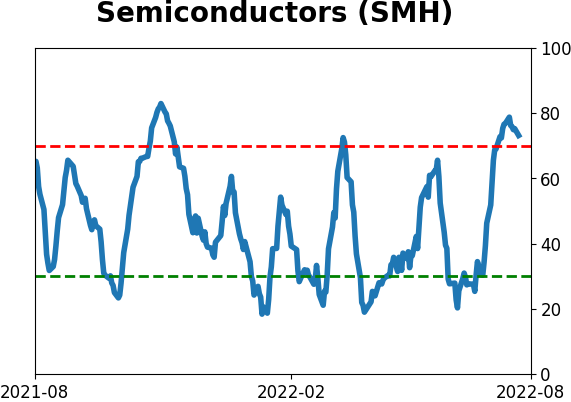
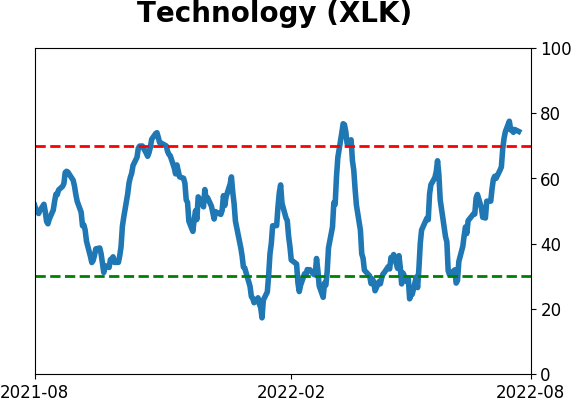
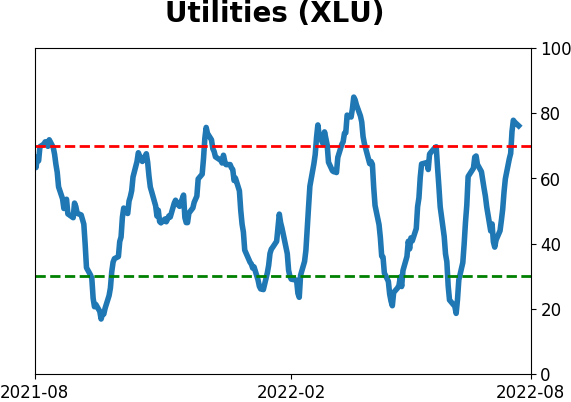
Sector ETF's - 10-Day Moving Average
|
|
|
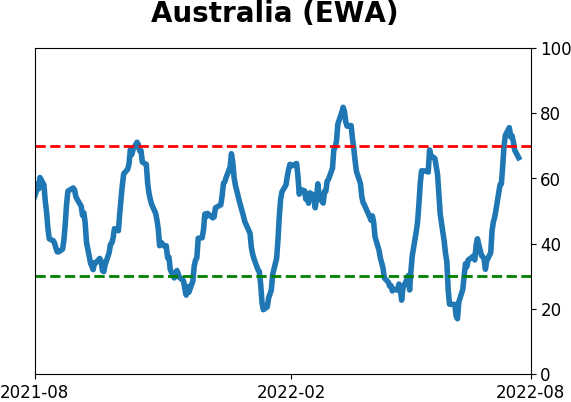
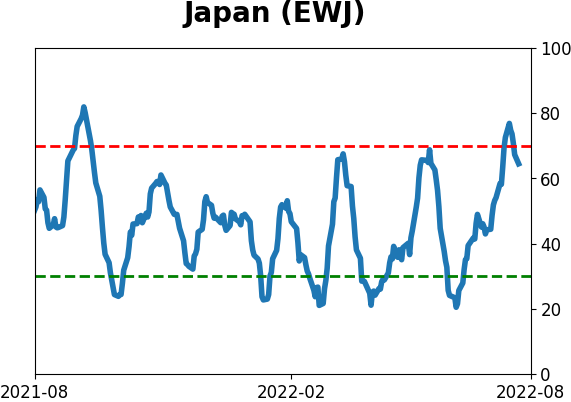
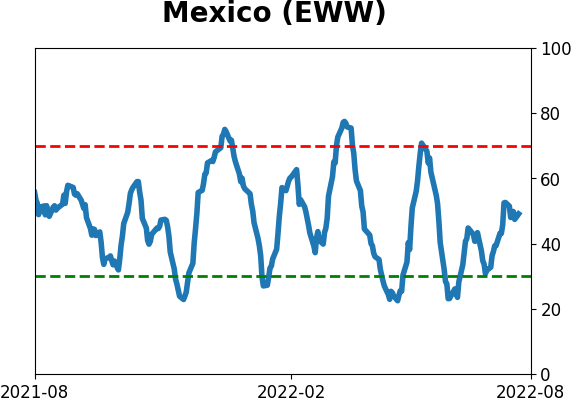
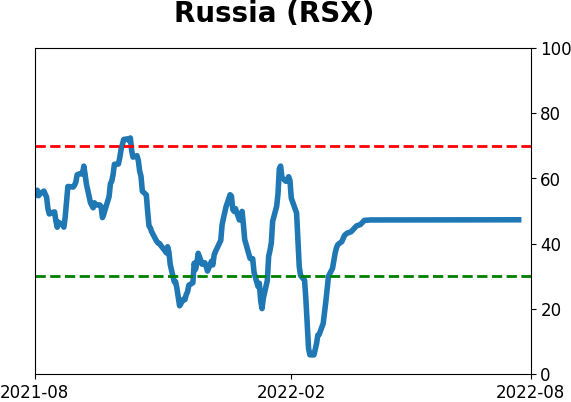
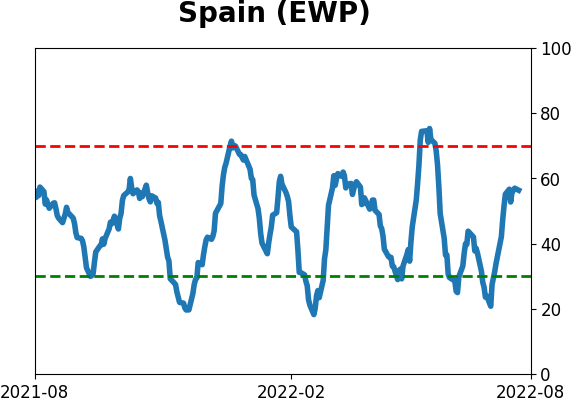
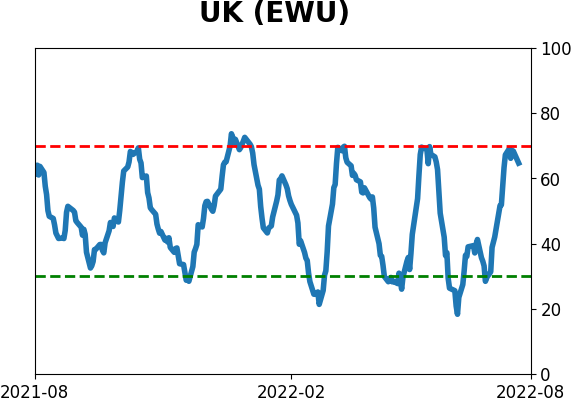
Country ETF's - 10-Day Moving Average
|
|
|
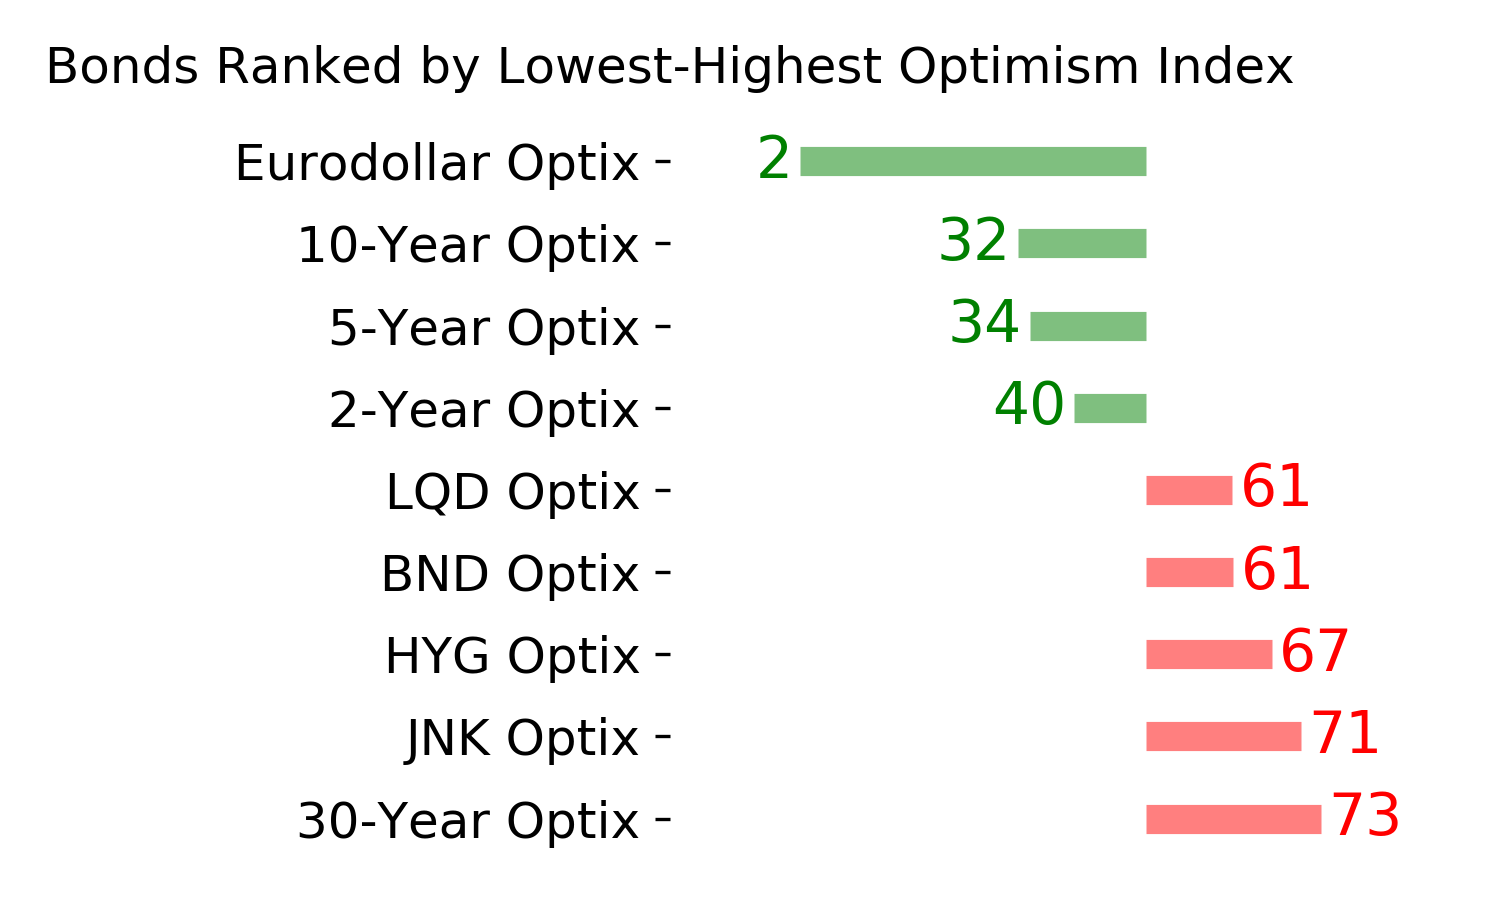
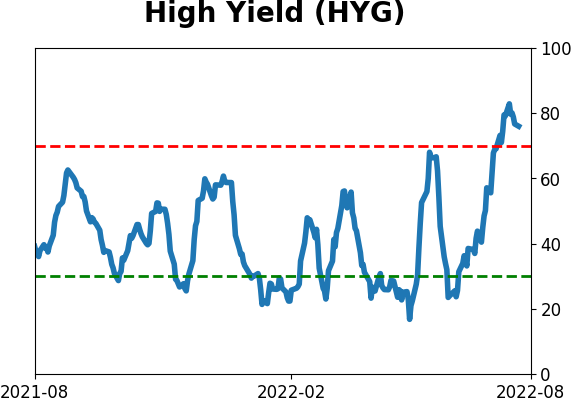
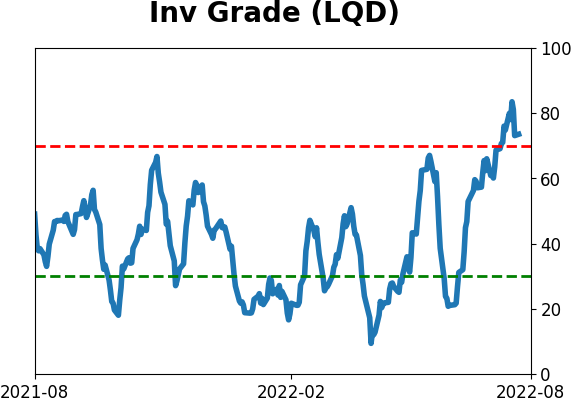
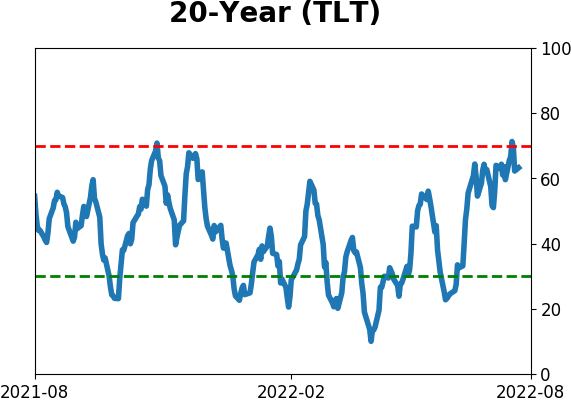
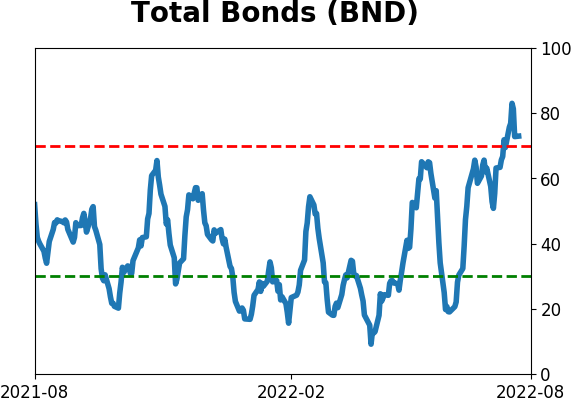
Bond ETF's - 10-Day Moving Average
|
|
|
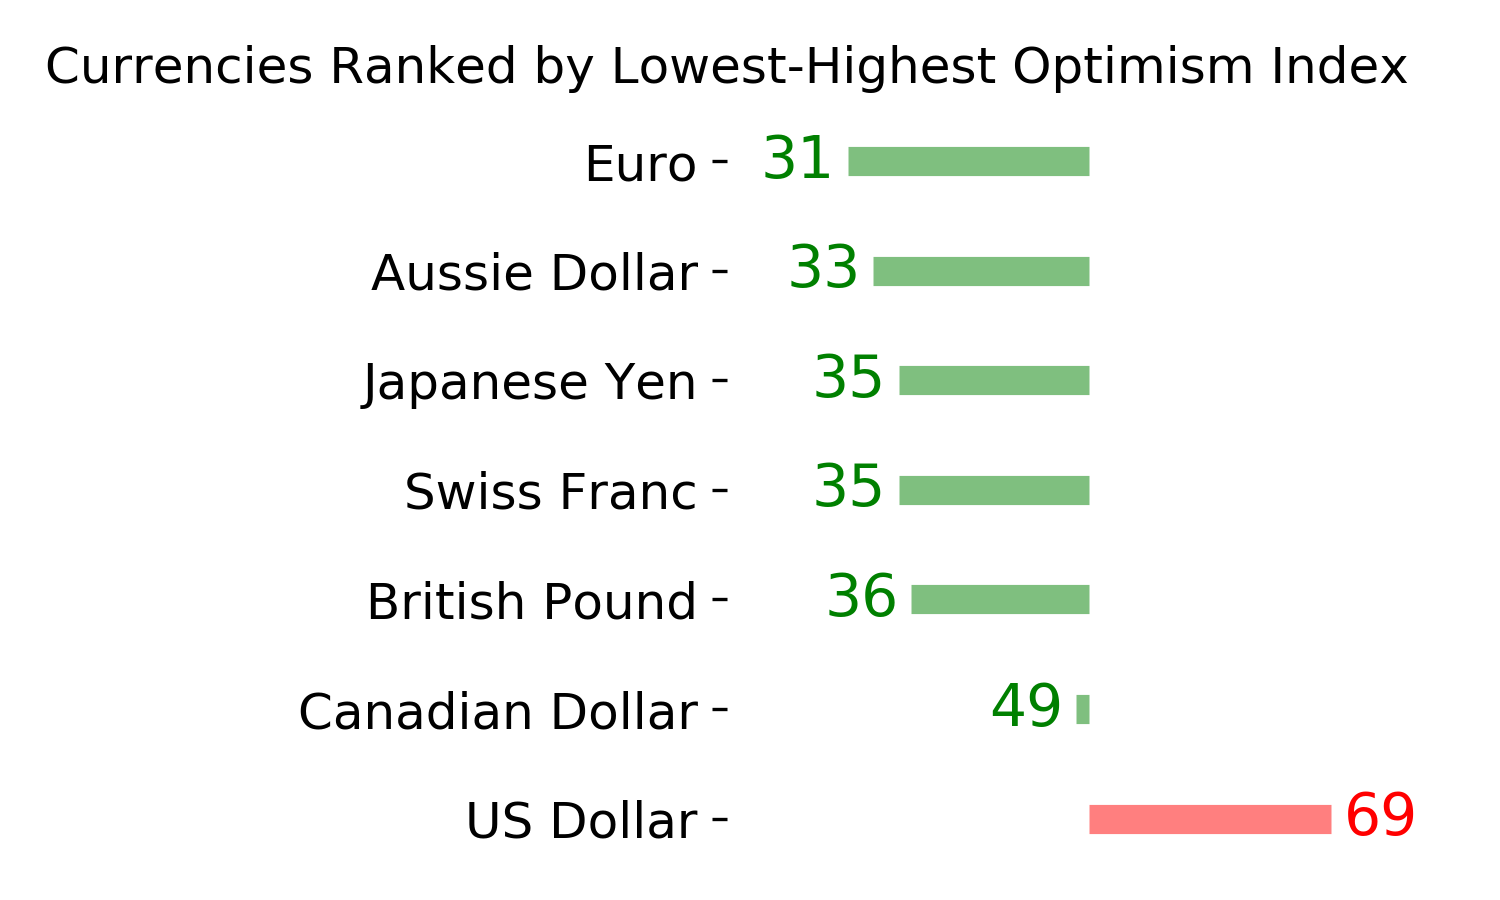
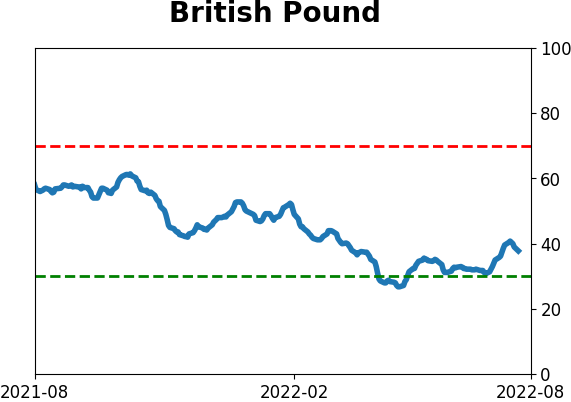
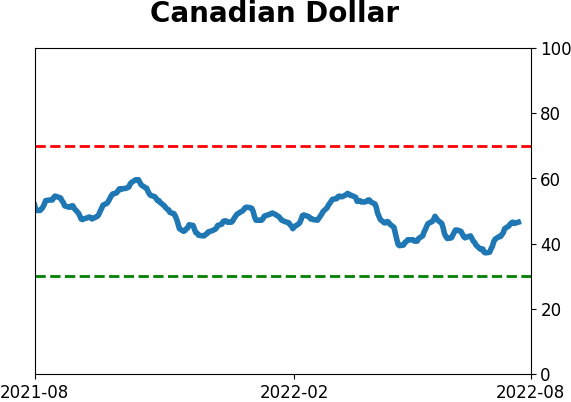
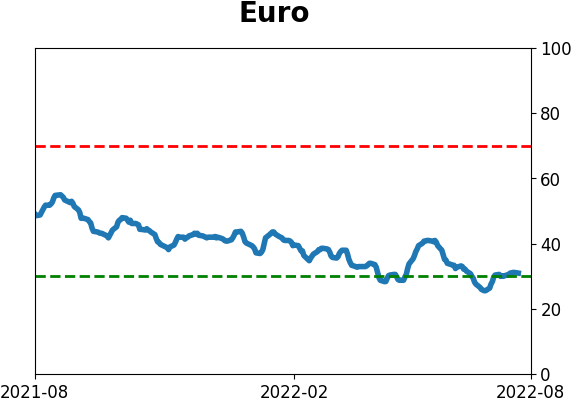
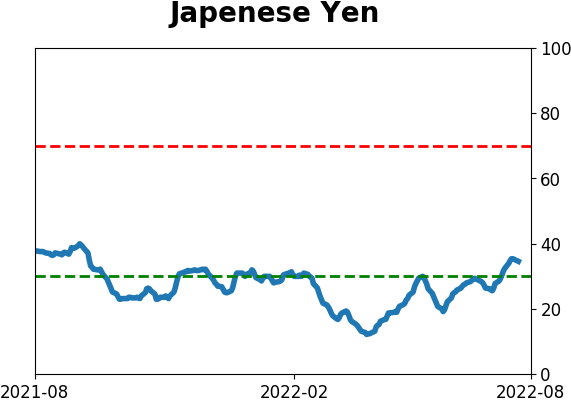
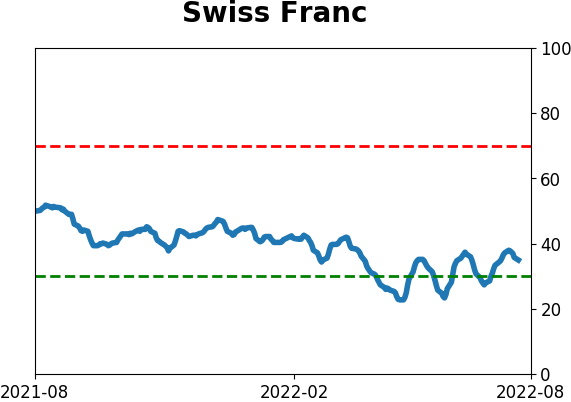
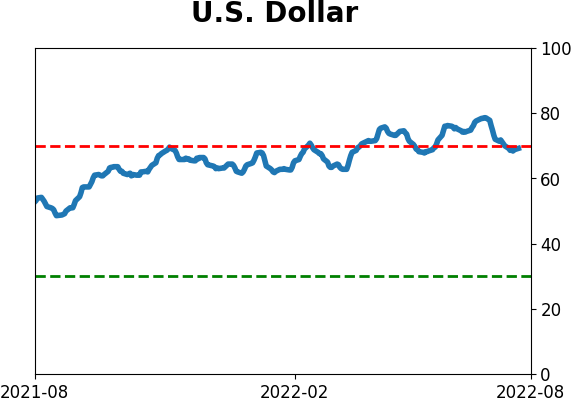
Currency ETF's - 5-Day Moving Average
|
|
|
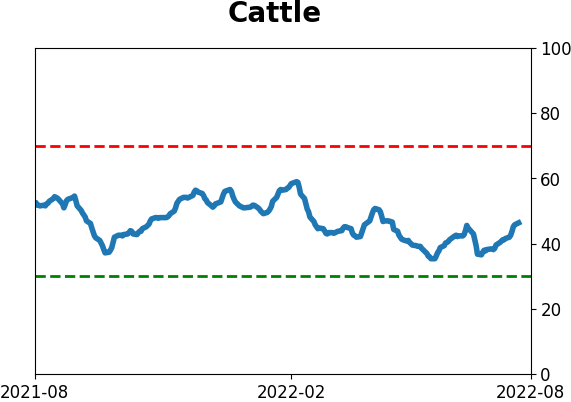
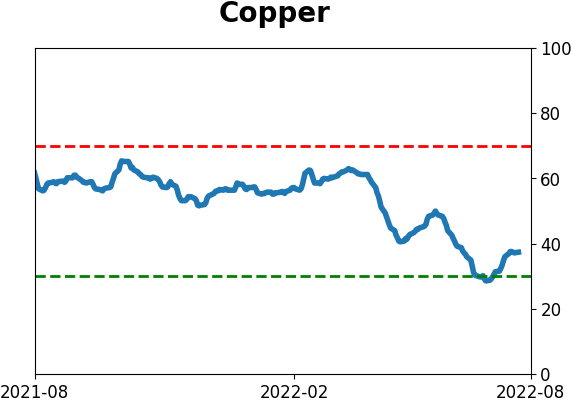
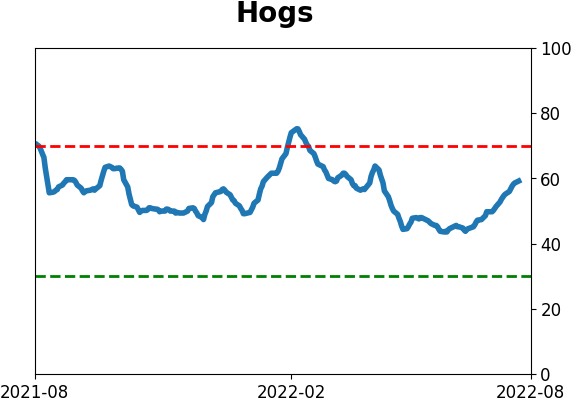
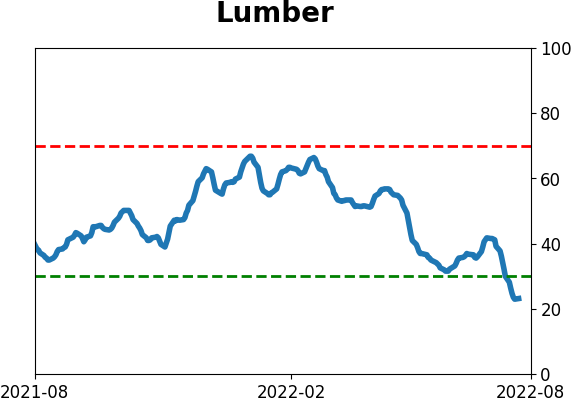
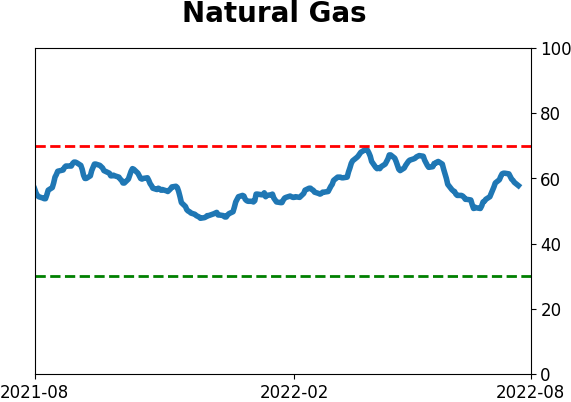
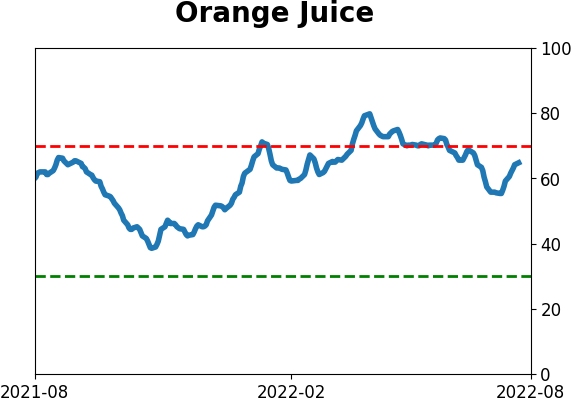
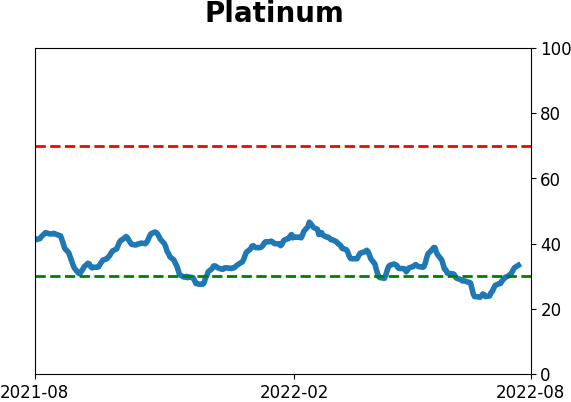
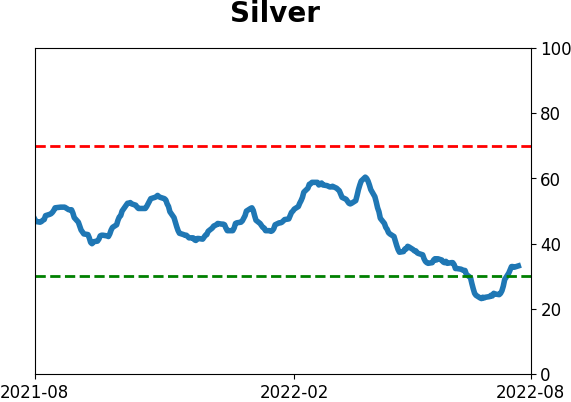
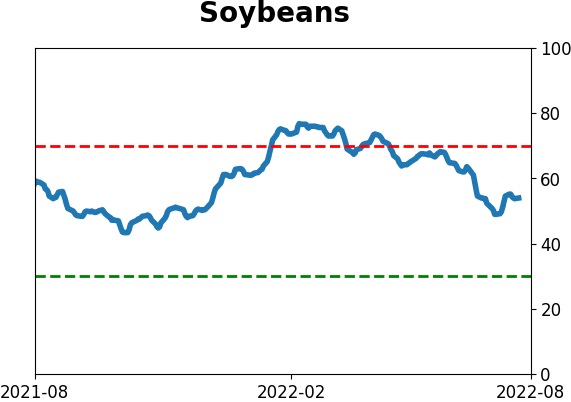
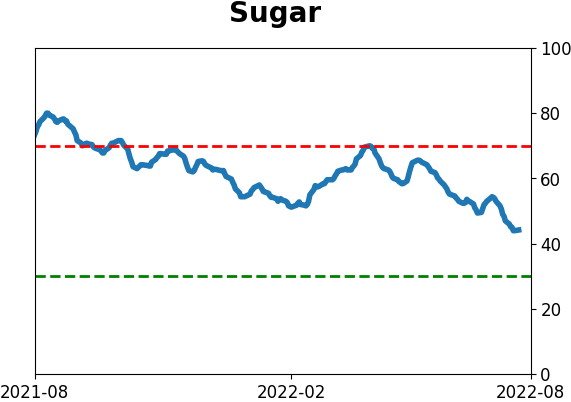
Commodity ETF's - 5-Day Moving Average
|
|