Headlines
|
|
The sentiment cycle is turning:
The last few months have had an extremely high correlation to the Enthusiasm phase of a Typical Sentiment Cycle. That has started to reverse, which has preceded some choppy markets, though with a positive expectation over long time frames. Investors have tended to gravitate toward defensive sectors after sentiment changes like this.
|
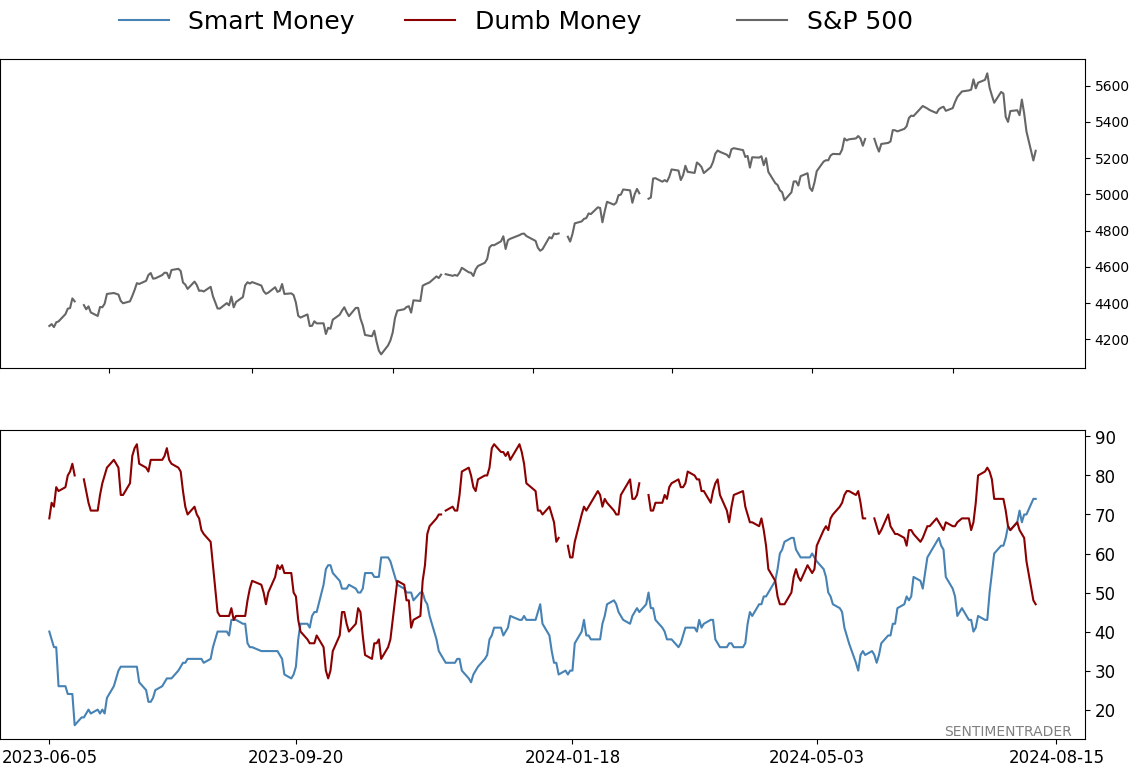
Smart / Dumb Money Confidence
|
Smart Money Confidence: 74%
Dumb Money Confidence: 47%
|
|
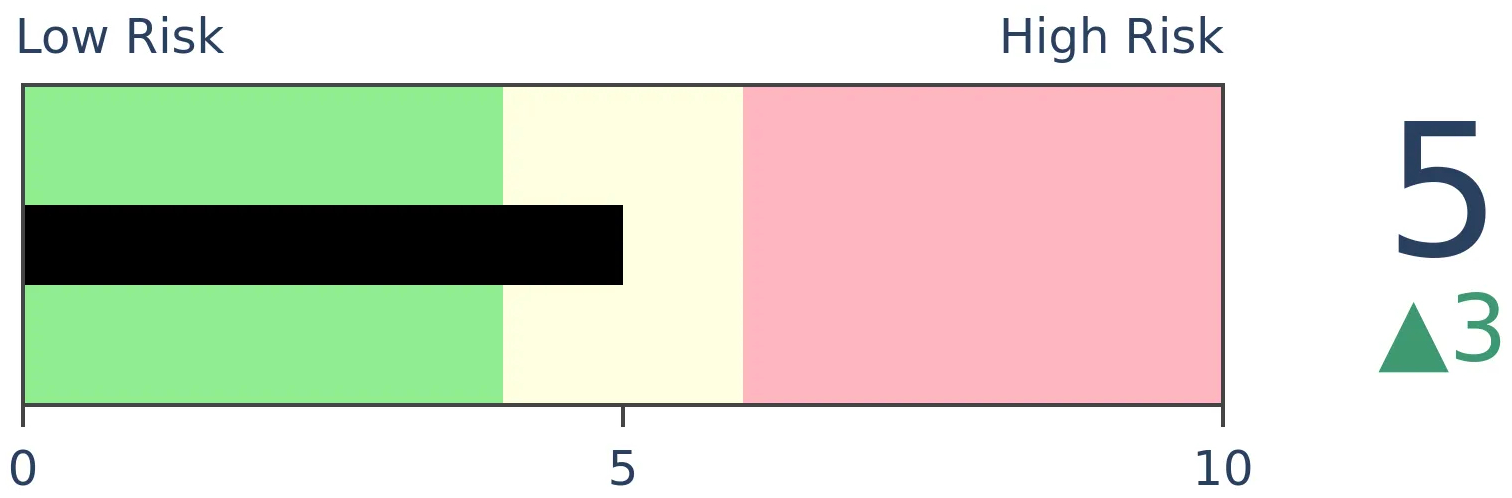
Risk Levels
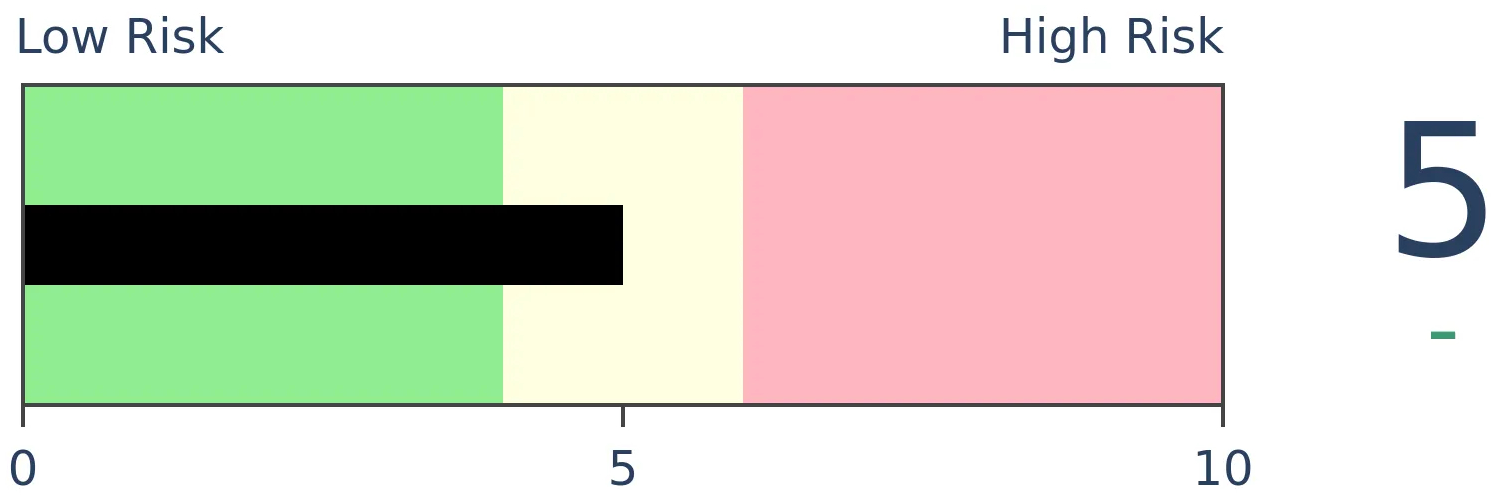
Stocks Short-Term
|
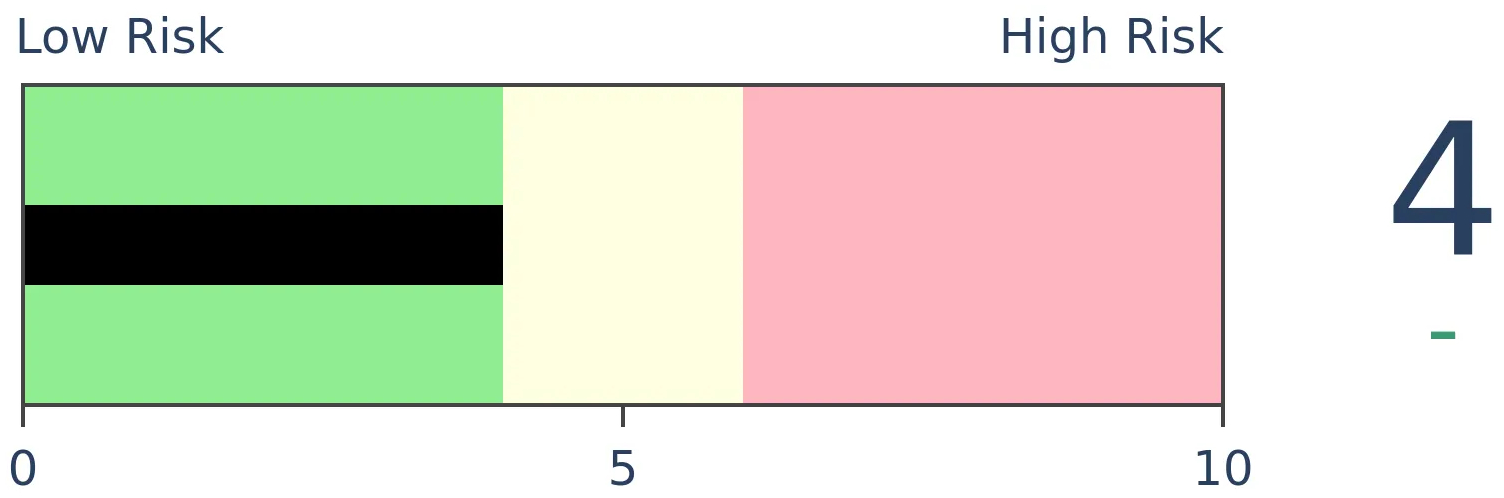
Stocks Medium-Term
|
|
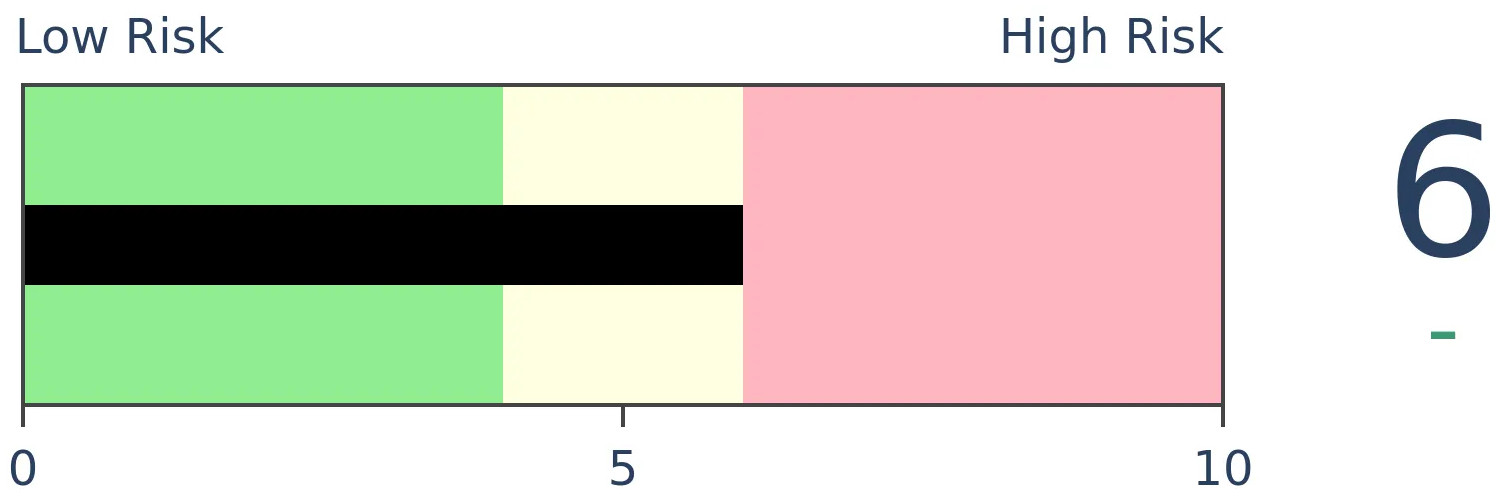
Bonds
|
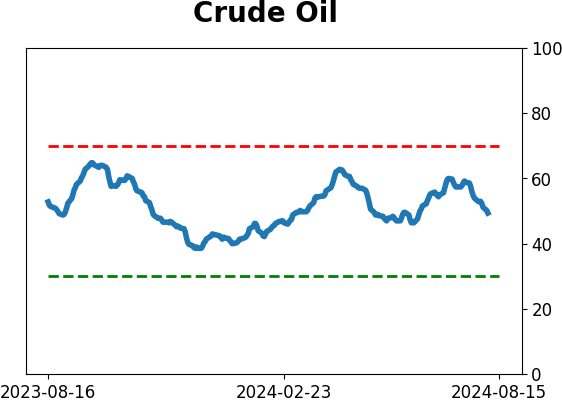
Crude Oil

|
|
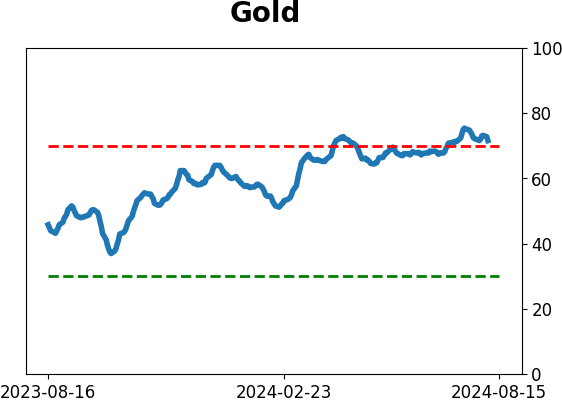
Gold
|
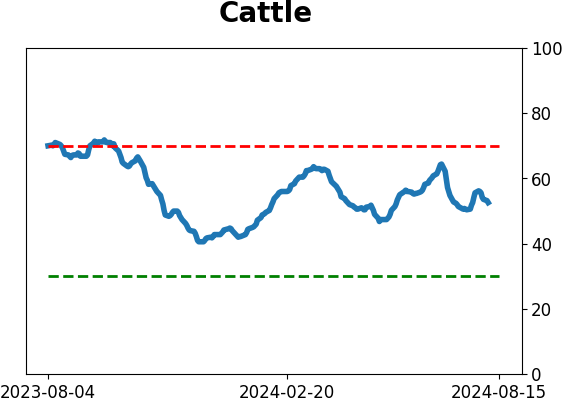
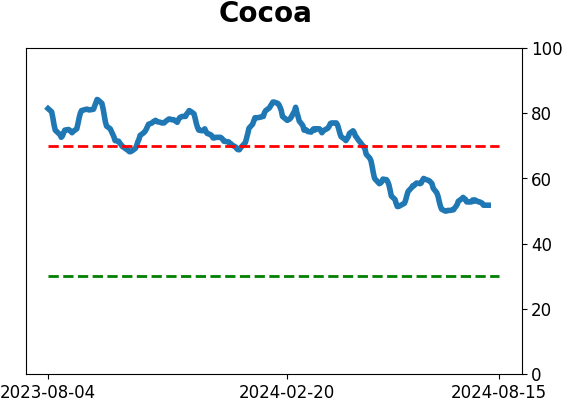
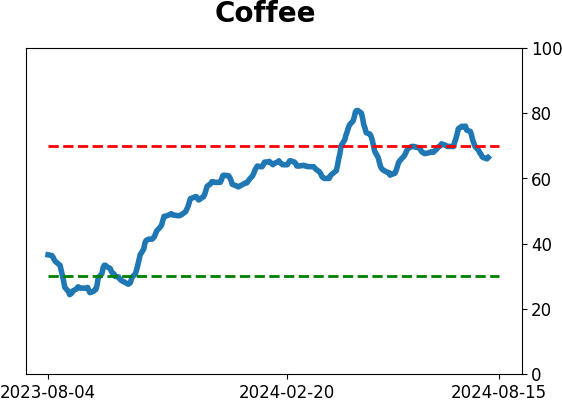
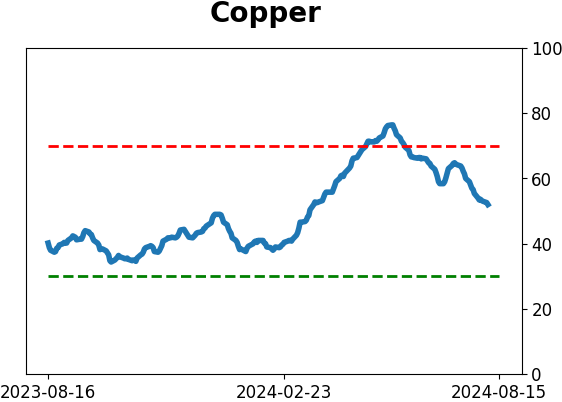
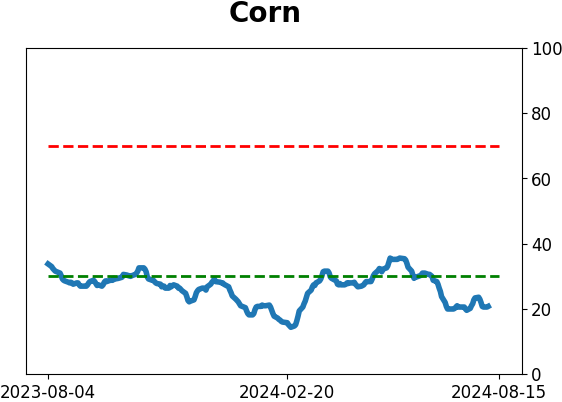
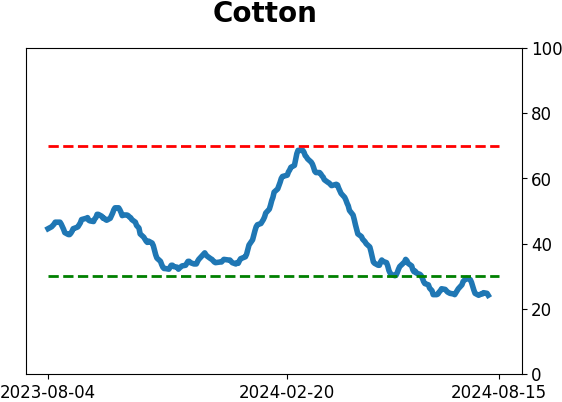
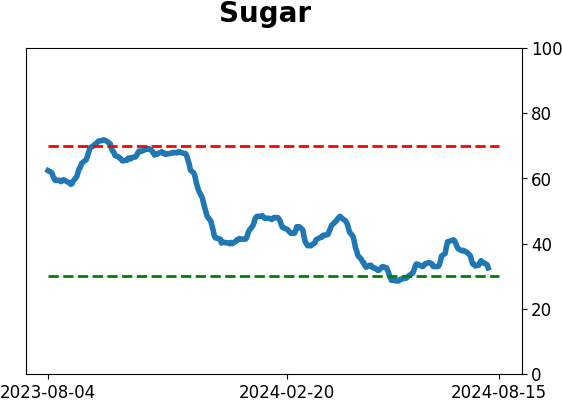
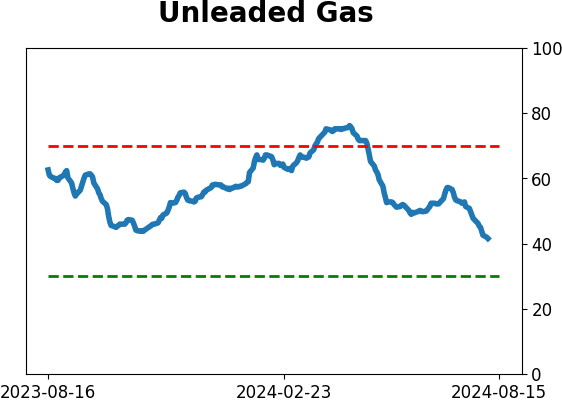
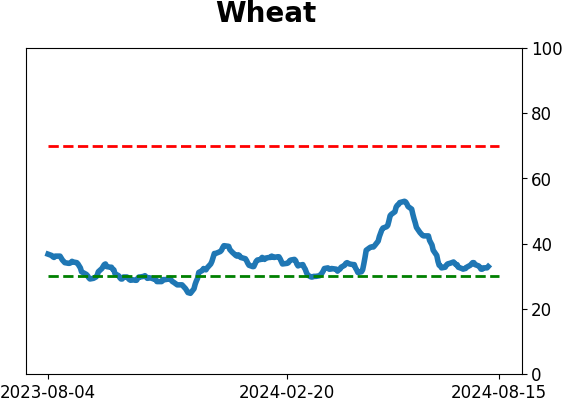
Agriculture

|
|
Research
By Jason Goepfert
BOTTOM LINE
The last few months have had an extremely high correlation to the Enthusiasm phase of a Typical Sentiment Cycle. That has started to reverse, which has preceded some choppy markets, though with a positive expectation over long time frames. Investors have tended to gravitate toward defensive sectors after sentiment changes like this.
FORECAST / TIMEFRAME
None
|
Key points:
- Based on a Typical Sentiment Cycle, it's clear that investors spent a long time in a highly enthusiastic mood
- When this level of sentiment has reversed, it has preceded a mixed market with mostly positive long-term results
- As enthusiasm cooled, investors consistently gravitated toward more defensive sectors
Enthusiasm is ebbing
With a mostly uninterrupted rally in stocks since last October, it's hard to blame investors for feeling enthusiastic. They certainly have been that, though the last few days have eased that sentiment.
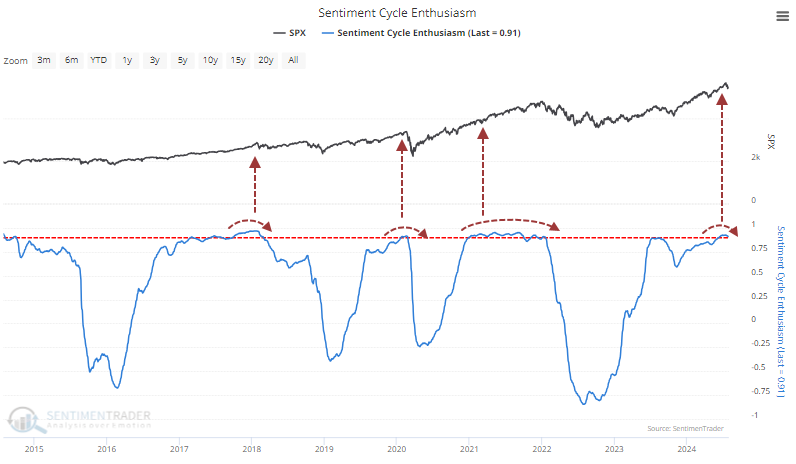
According to the Typical Sentiment Cycle, investors are just starting to reverse from an extreme of Enthusiasm. The cycle has four major parts, including both qualitative and quantitative measures.
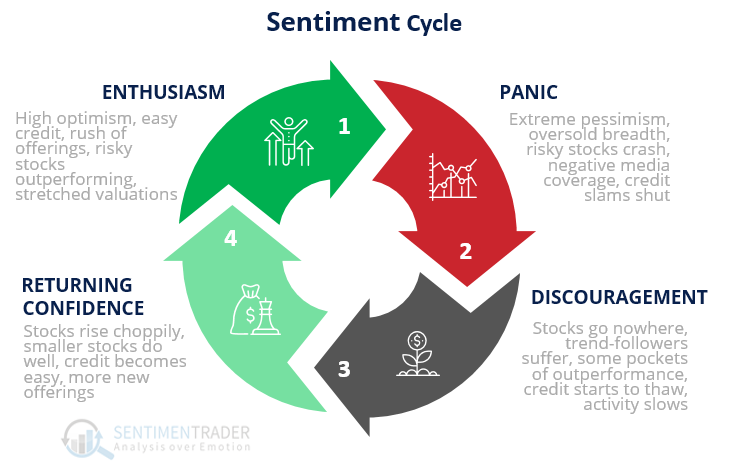
1. Enthusiasm - High optimism, easy credit, a rush of offerings, risky stocks outperforming, stretched valuations
2. Panic - Extreme pessimism, oversold breadth, risky stocks crash, negative media coverage, credit slams shut
3. Discouragement - Stocks go nowhere, trend-followers suffer, some pockets of outperformance, credit starts to thaw, activity slows
4. Returning Confidence - Stocks rise choppily, smaller stocks do well, credit becomes easy, more new offerings
On the quantitative side, the four phases are tracked on the site according to price action correlation to idealized sentiment cycles over the past 90 years. The S&P 500's correlation to the Enthusiasm part of the cycle has now peaked above 0.9, an exceptionally high correlation that has been met only a few times in the past decade.
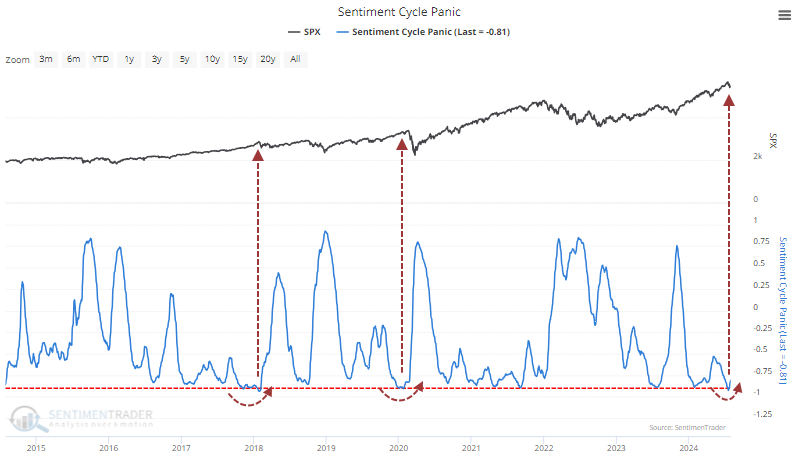
The opposite of Enthusiasm is Panic, and it stands to reason that investors have exhibited the opposite of that, which they have. Since the S&P rises over time, it's more difficult to find times of "opposite panic," but that's what is reversing now.
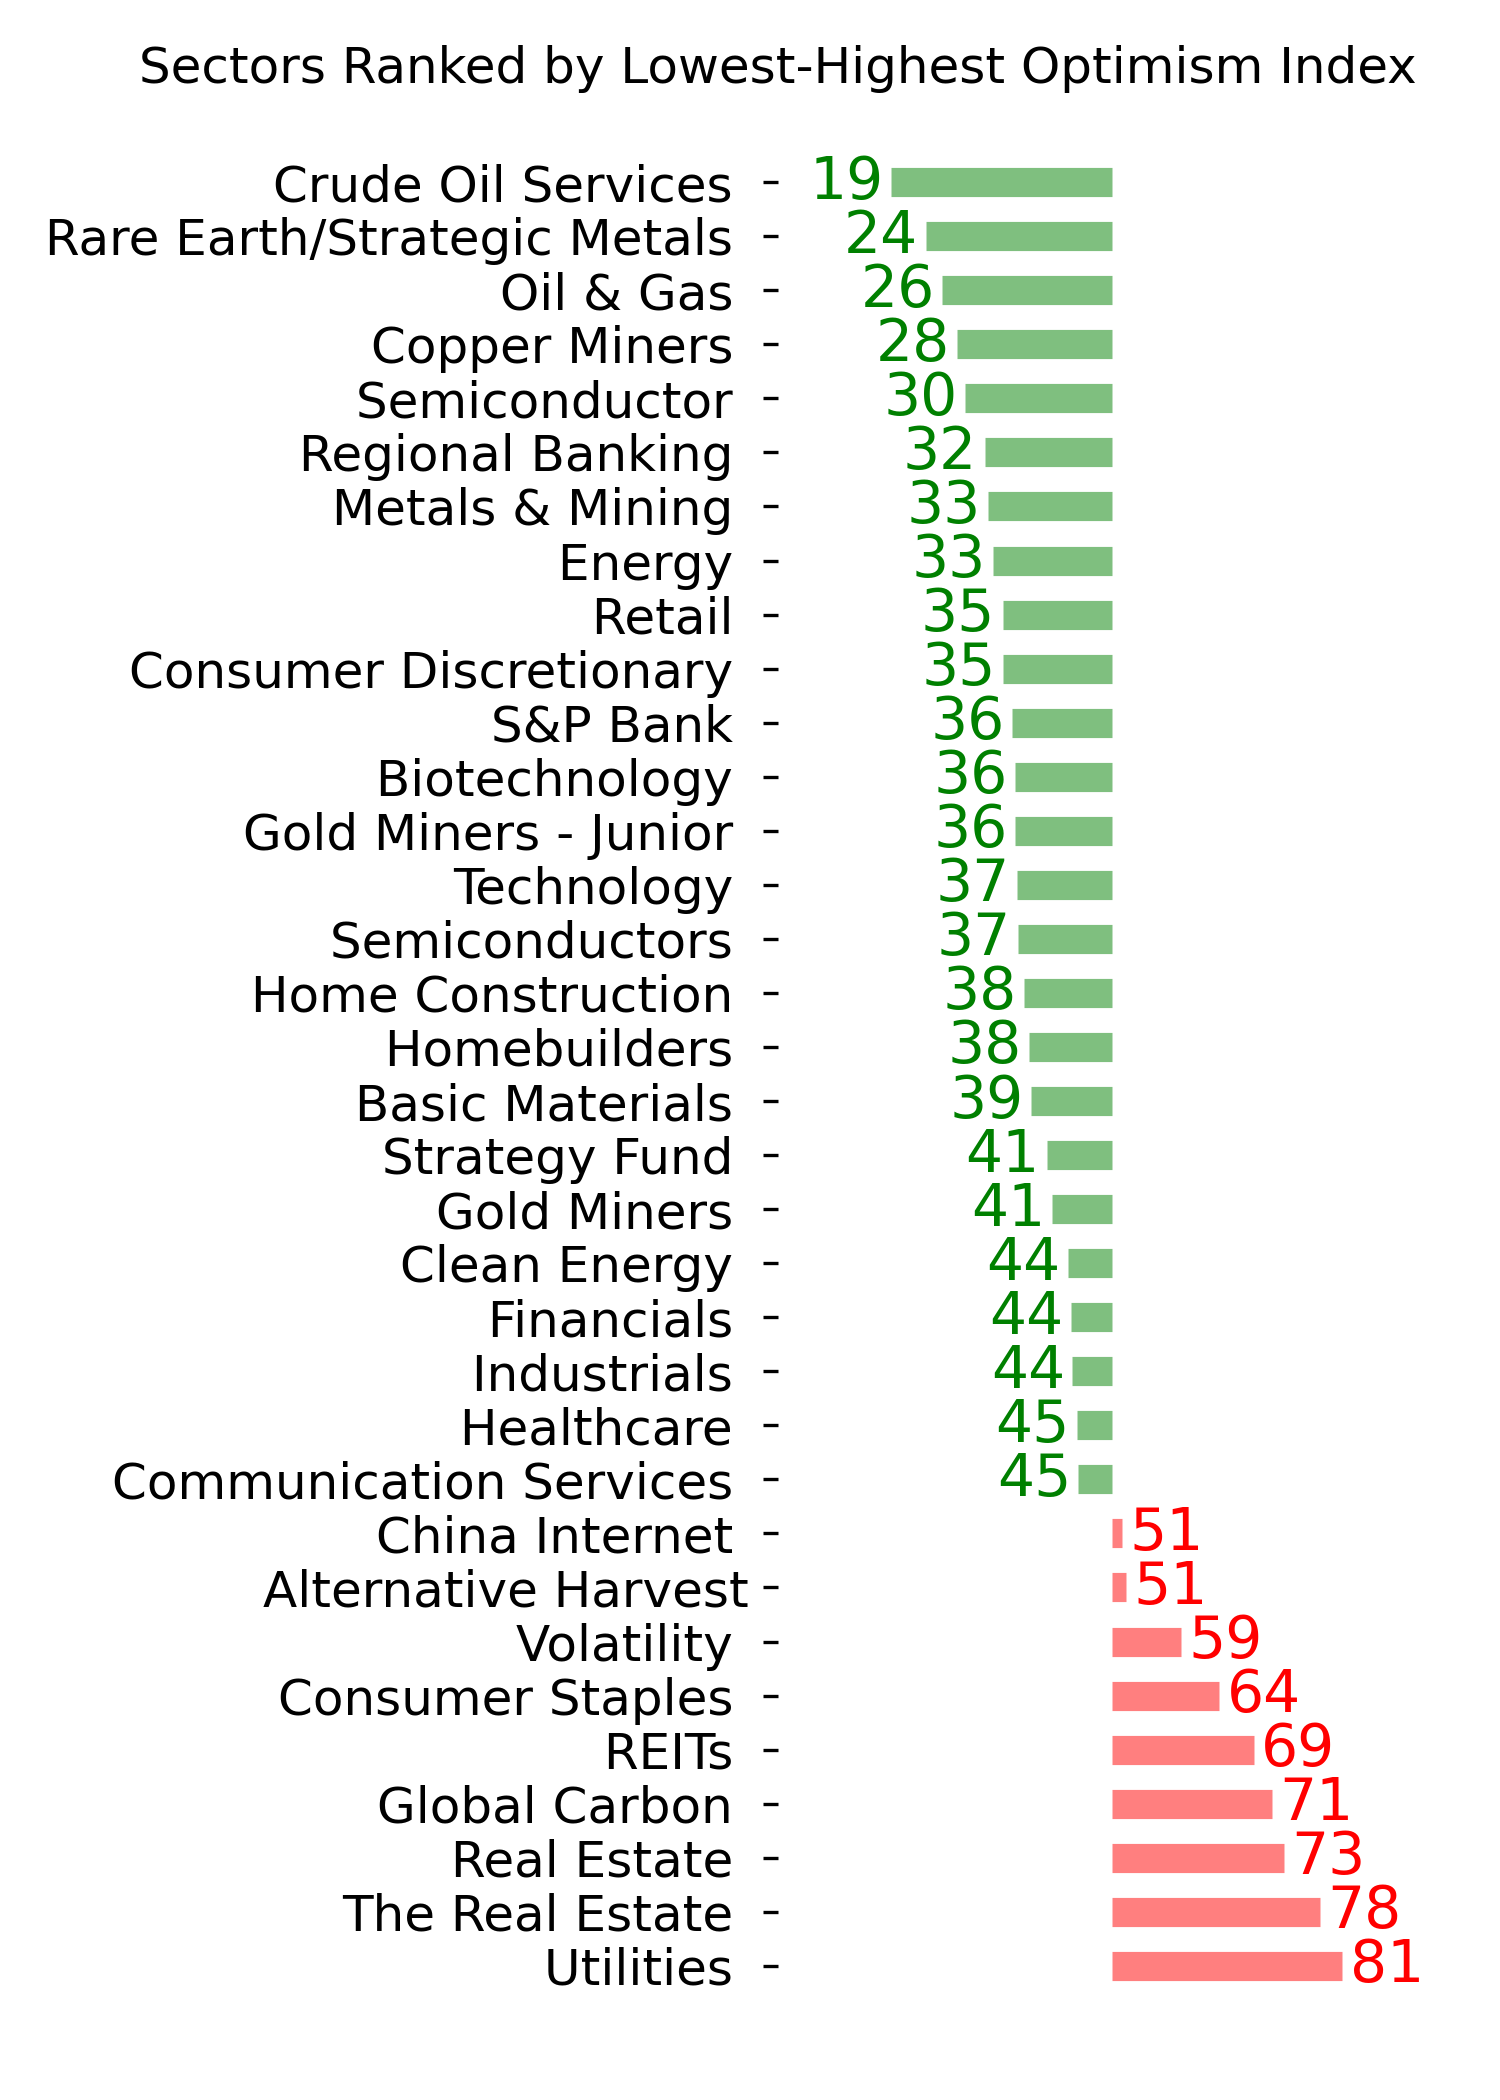
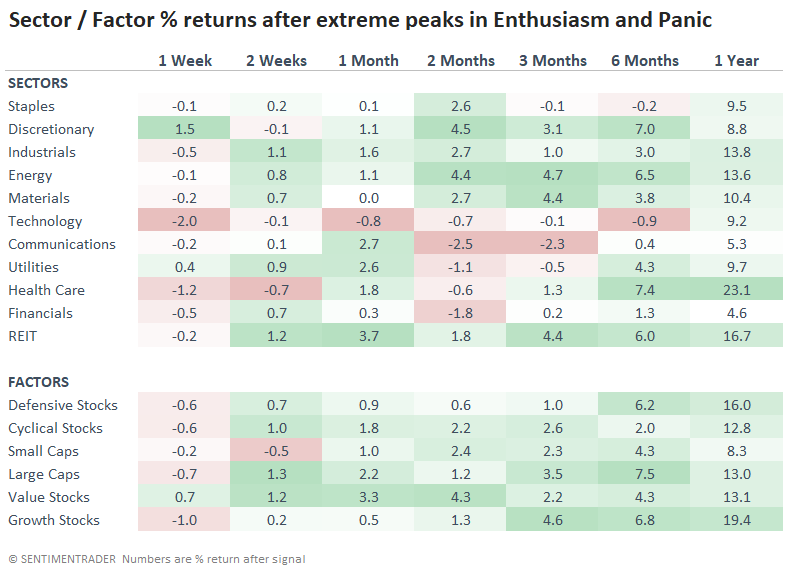
As enthusiasm ebbs, defensive sectors take the lead
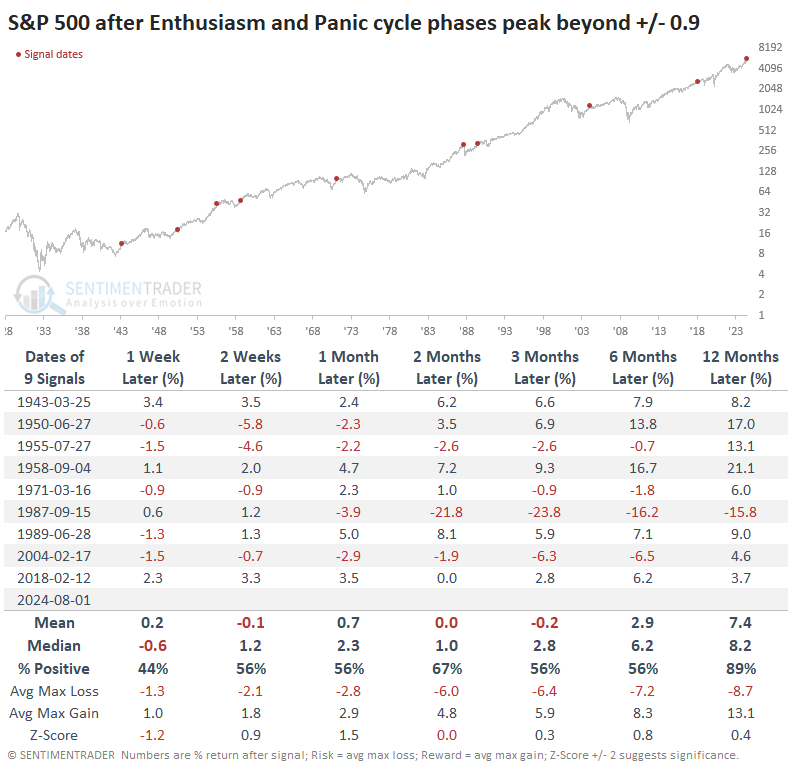
After the phases peaked at true extremes, the S&P 500's returns were mediocre-to-mixed up to three months later, with a poor ratio of reward to risk. There wasn't much impact on longer time frames, so the most damaging effects did seem to be mostly confined to shorter time frames.
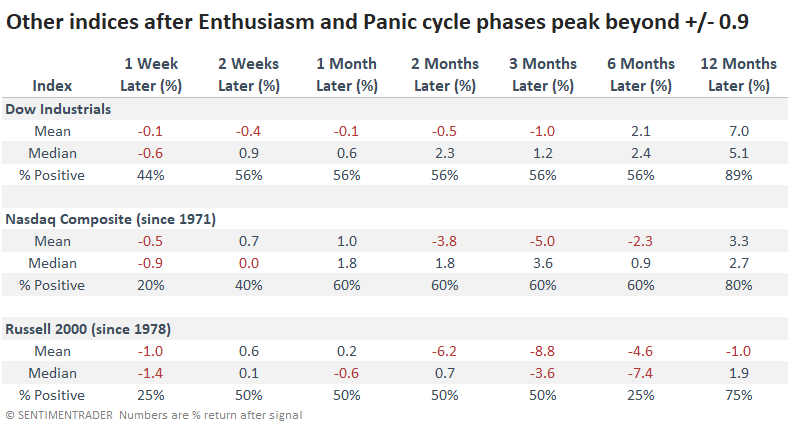
Among the other major equity indices, the small-cap Russell 2000 fared the worst, with only a 25% win rate over the next six months. The Nasdaq's returns were more consistently positive, but the Dow Industrials improved on that over the next year, with an 89% win rate.
It makes sense that when investors reverse a prolonged period of enthusiasm and lack of panic, they might gravitate toward defensive sectors, and we see that in the table below. The defensive factor returned an average of +16.0 % over the next year, powered by health care and utilities.
What the research tells us...
The persistent uptrend that rolled over every concern has finally stubbed its toe in a big way. That is quickly having an impact on sentiment, and even long term measures are witnessing the effect. Price action in recent months has had a high correlation to the most enthusiastic and "anit-panic" markets in history, and when that unravels, stock prices have often swung back and forth for weeks or even months. There isn't much of a signal over those time frames, but long-term returns have generally been favorable, especially for the broader market and sectors with a more defensive tilt.
Indicators at Extremes
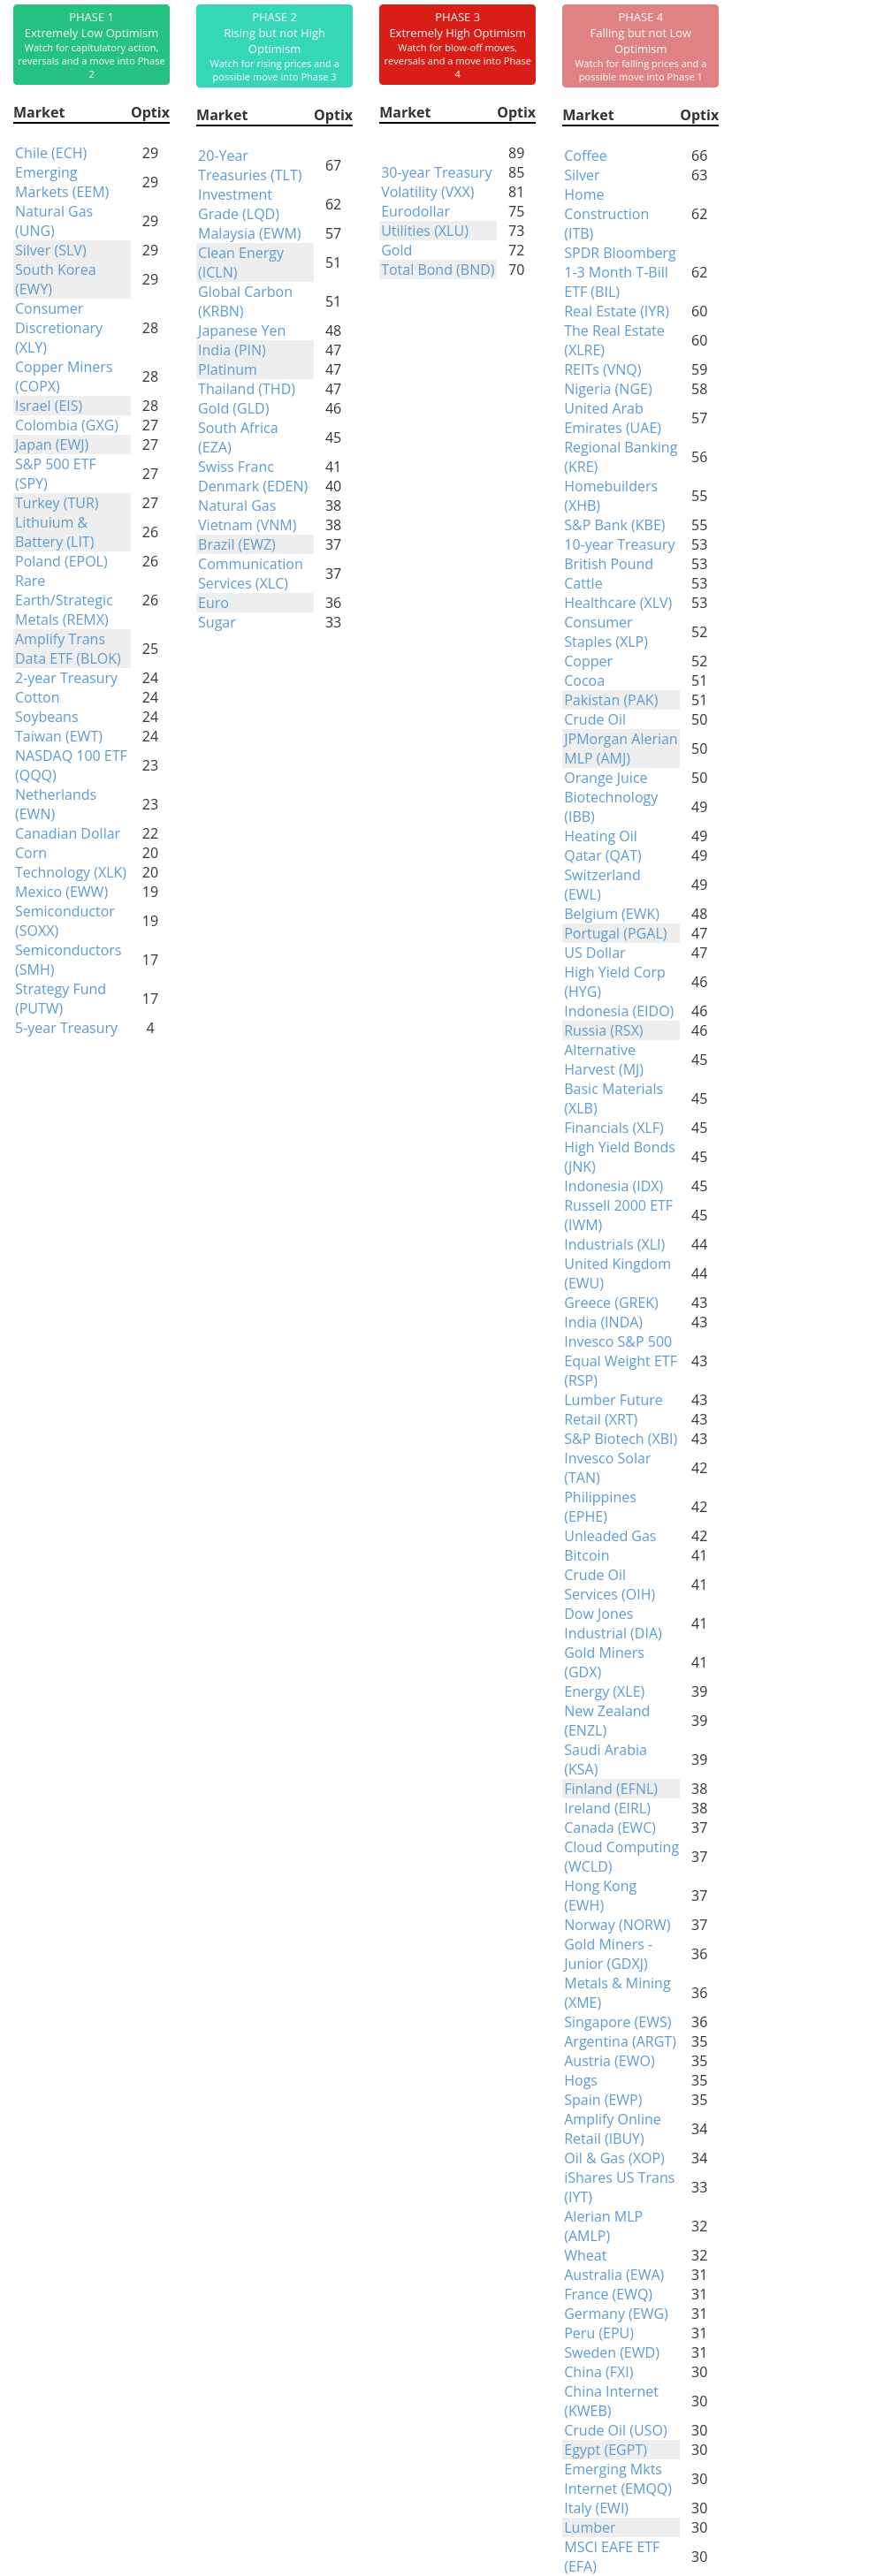
Phase Table
Ranks
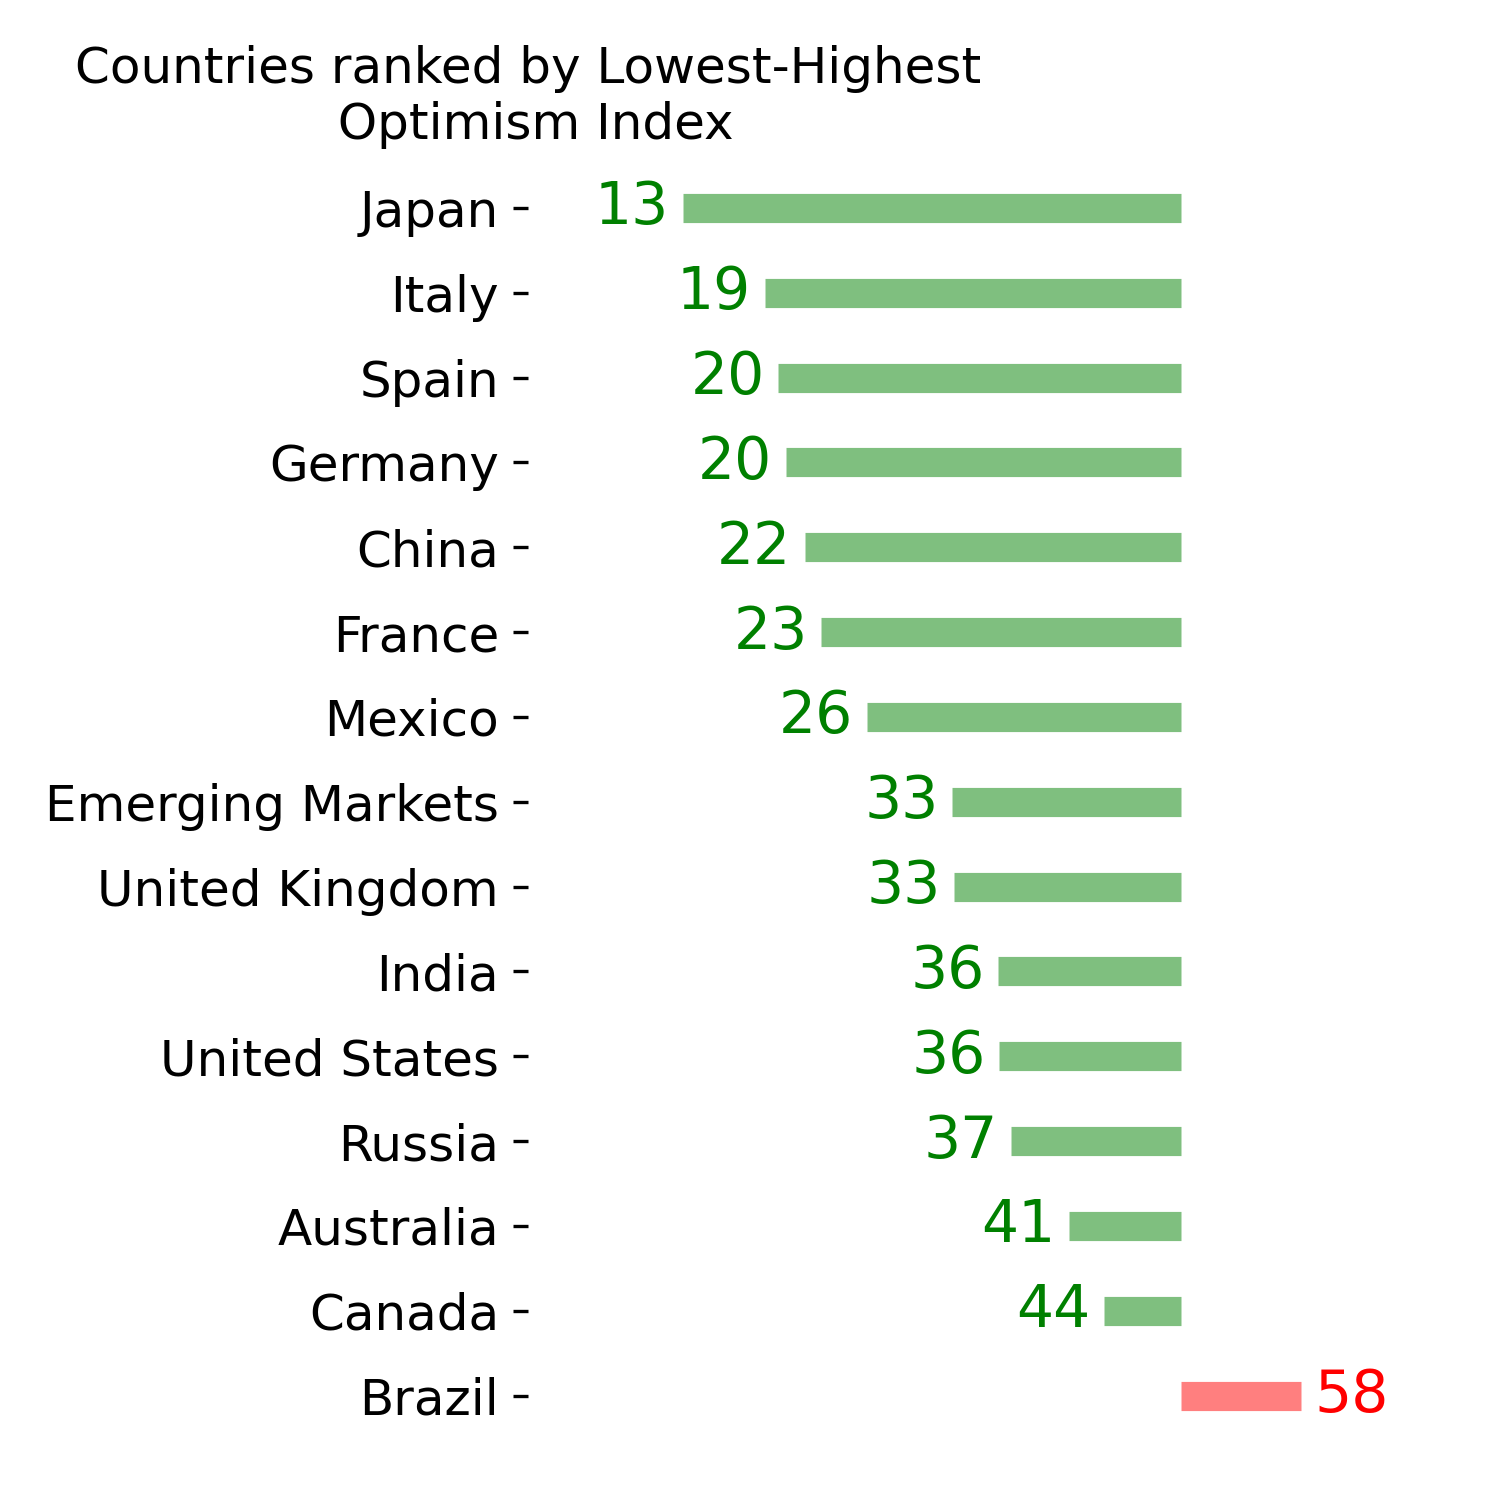
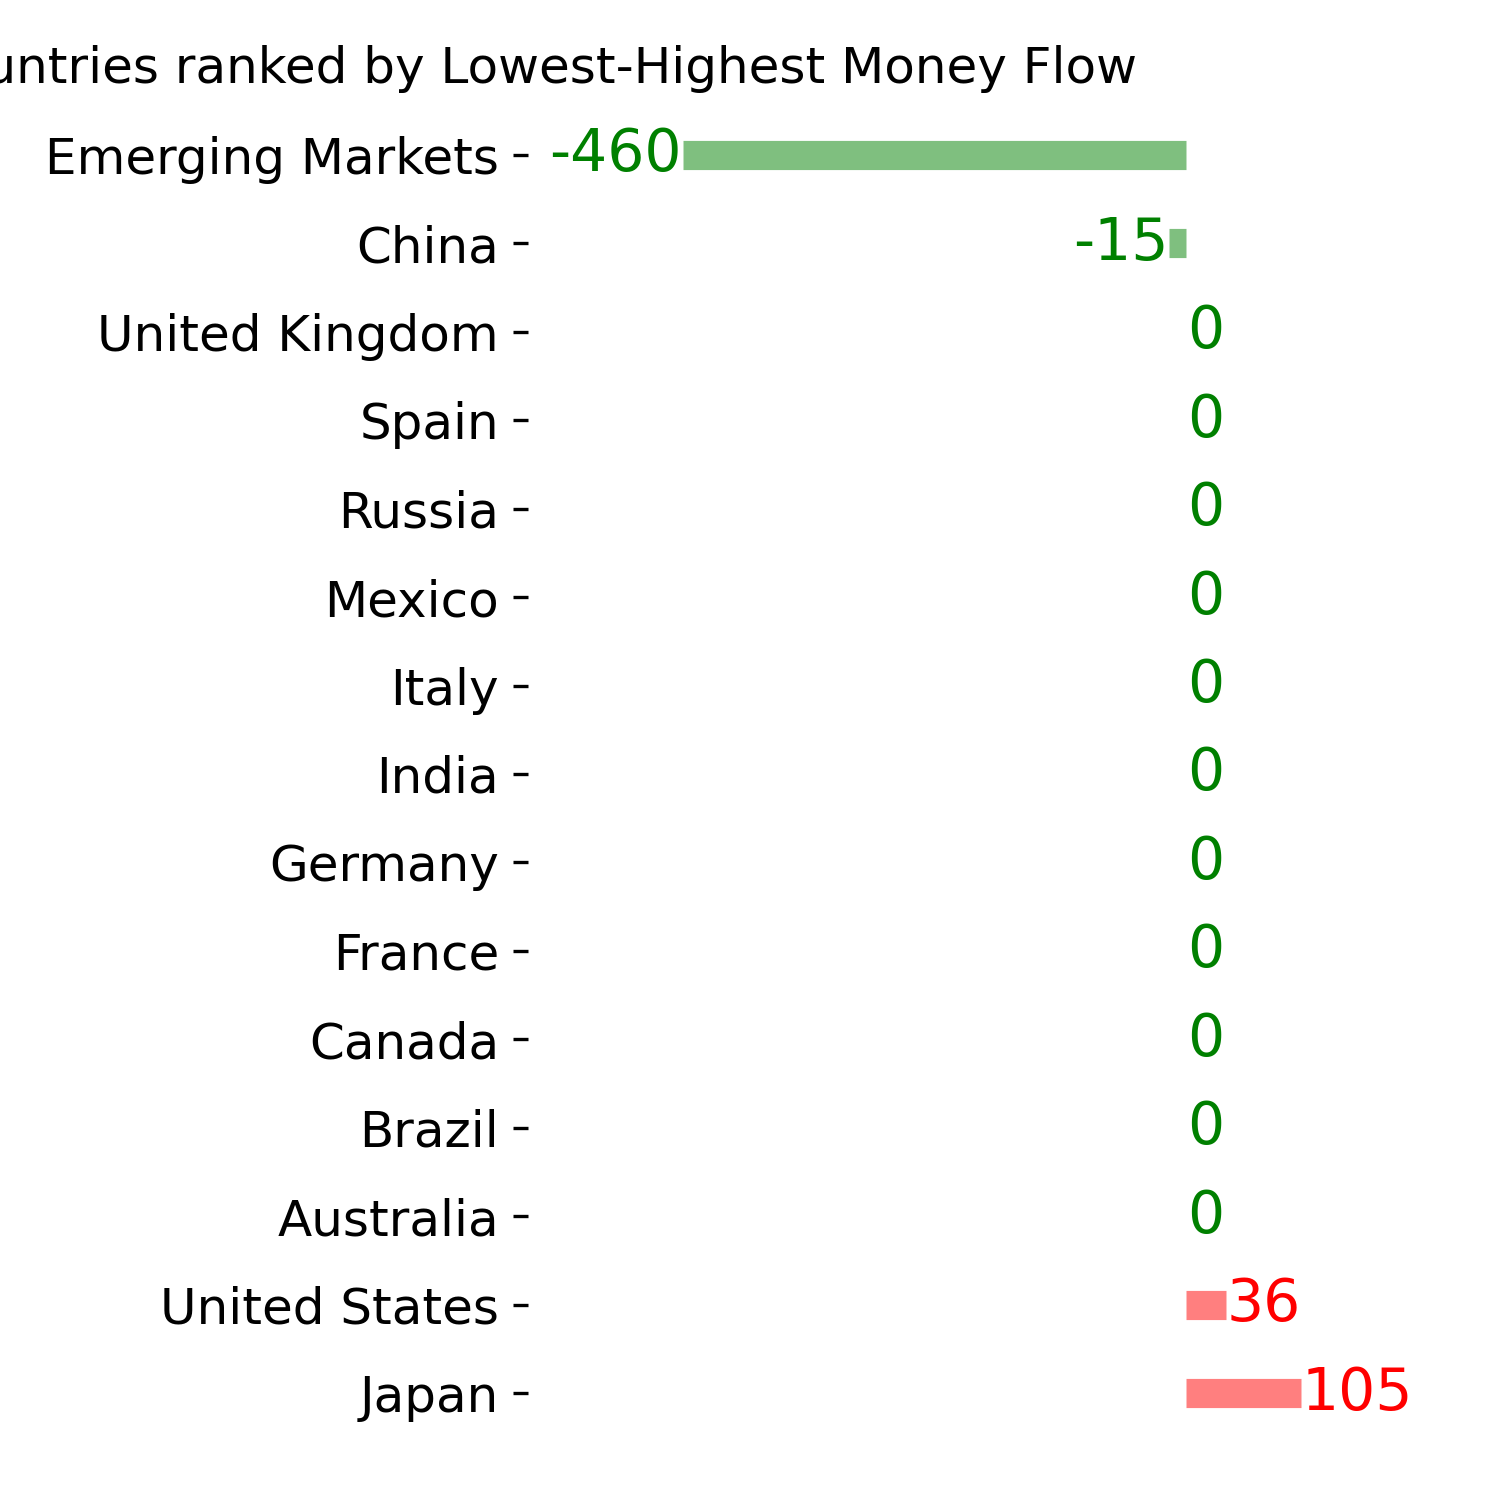
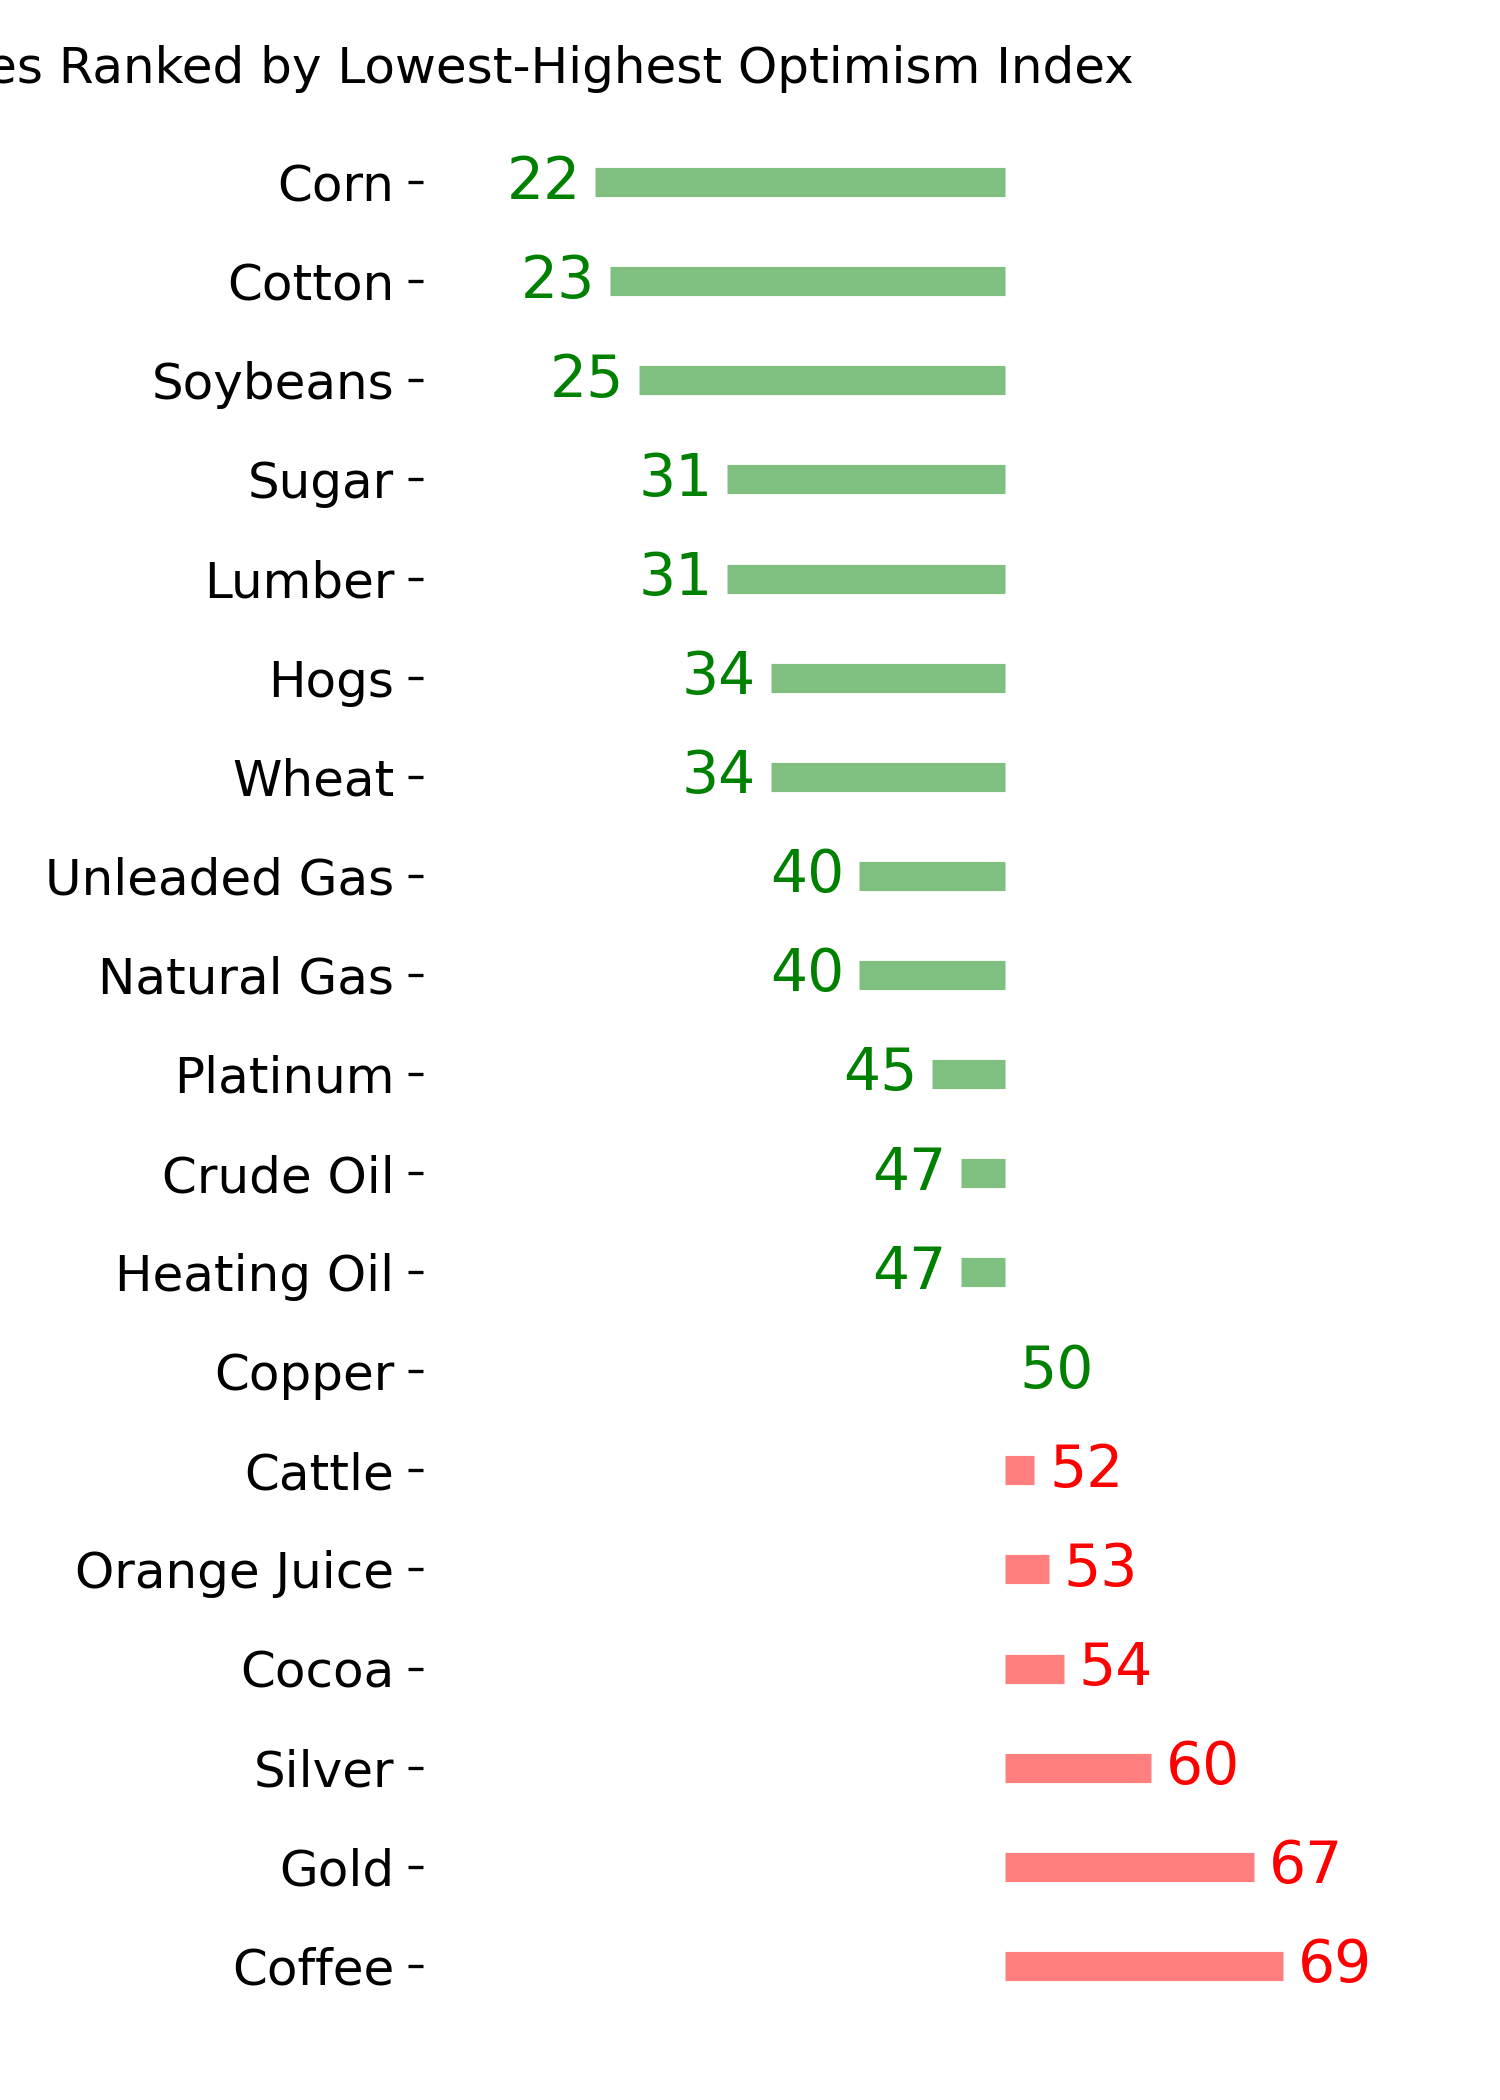
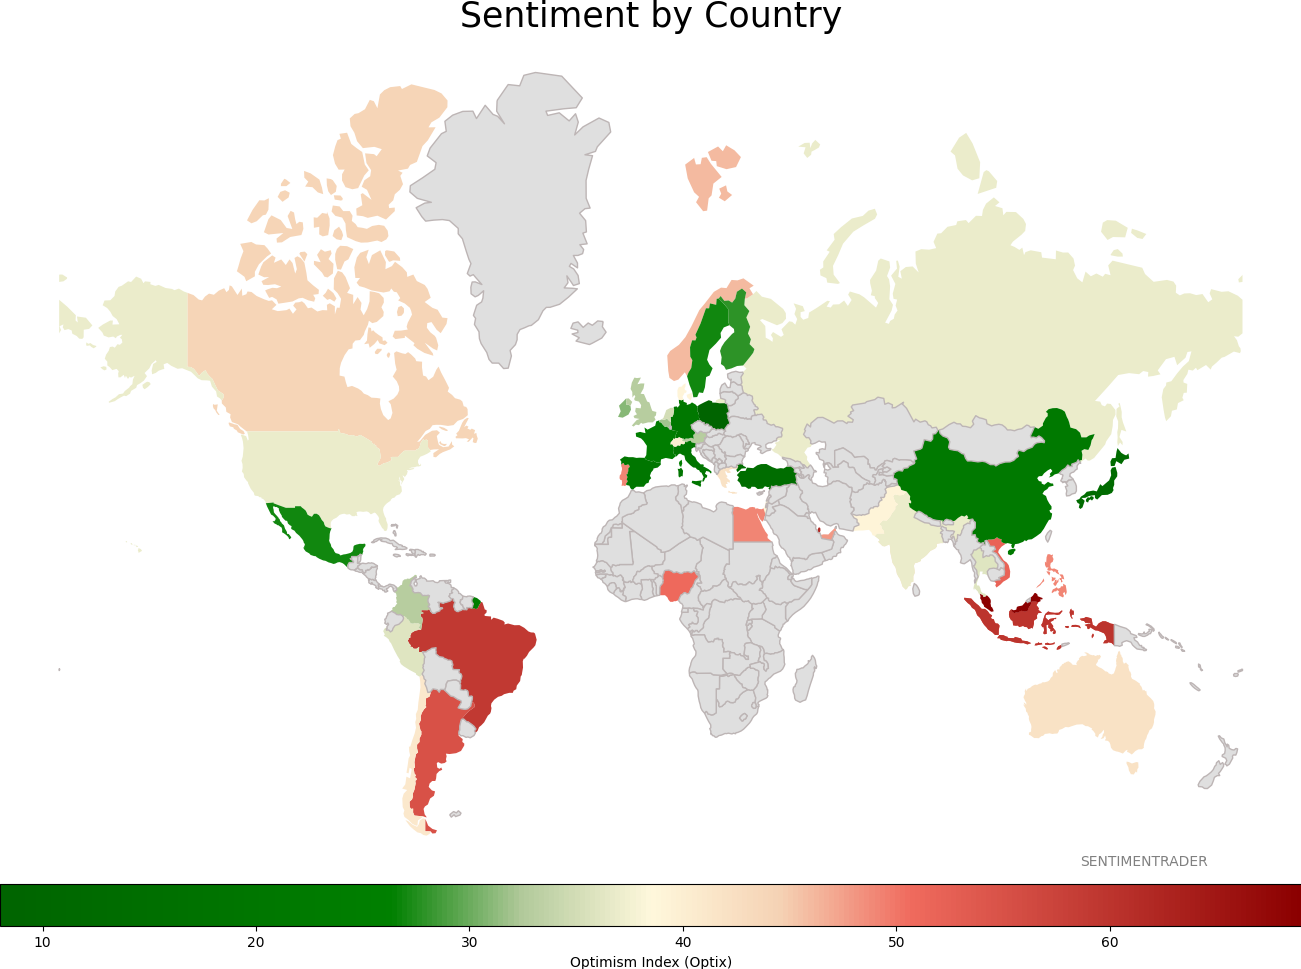
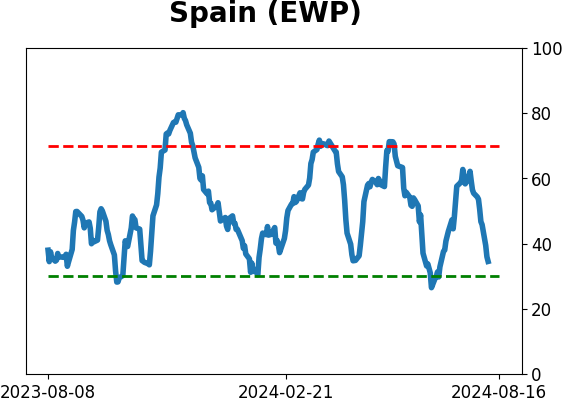
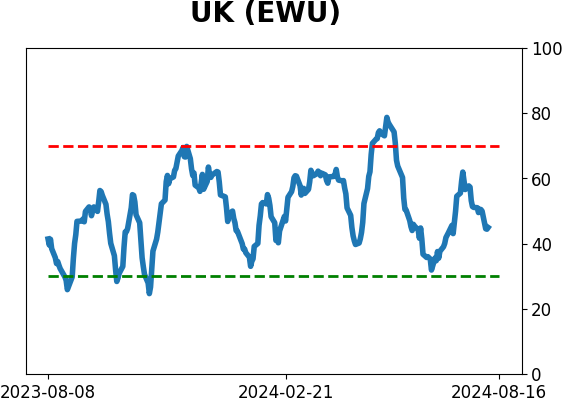
Sentiment Around The World
Optimism Index Thumbnails
|
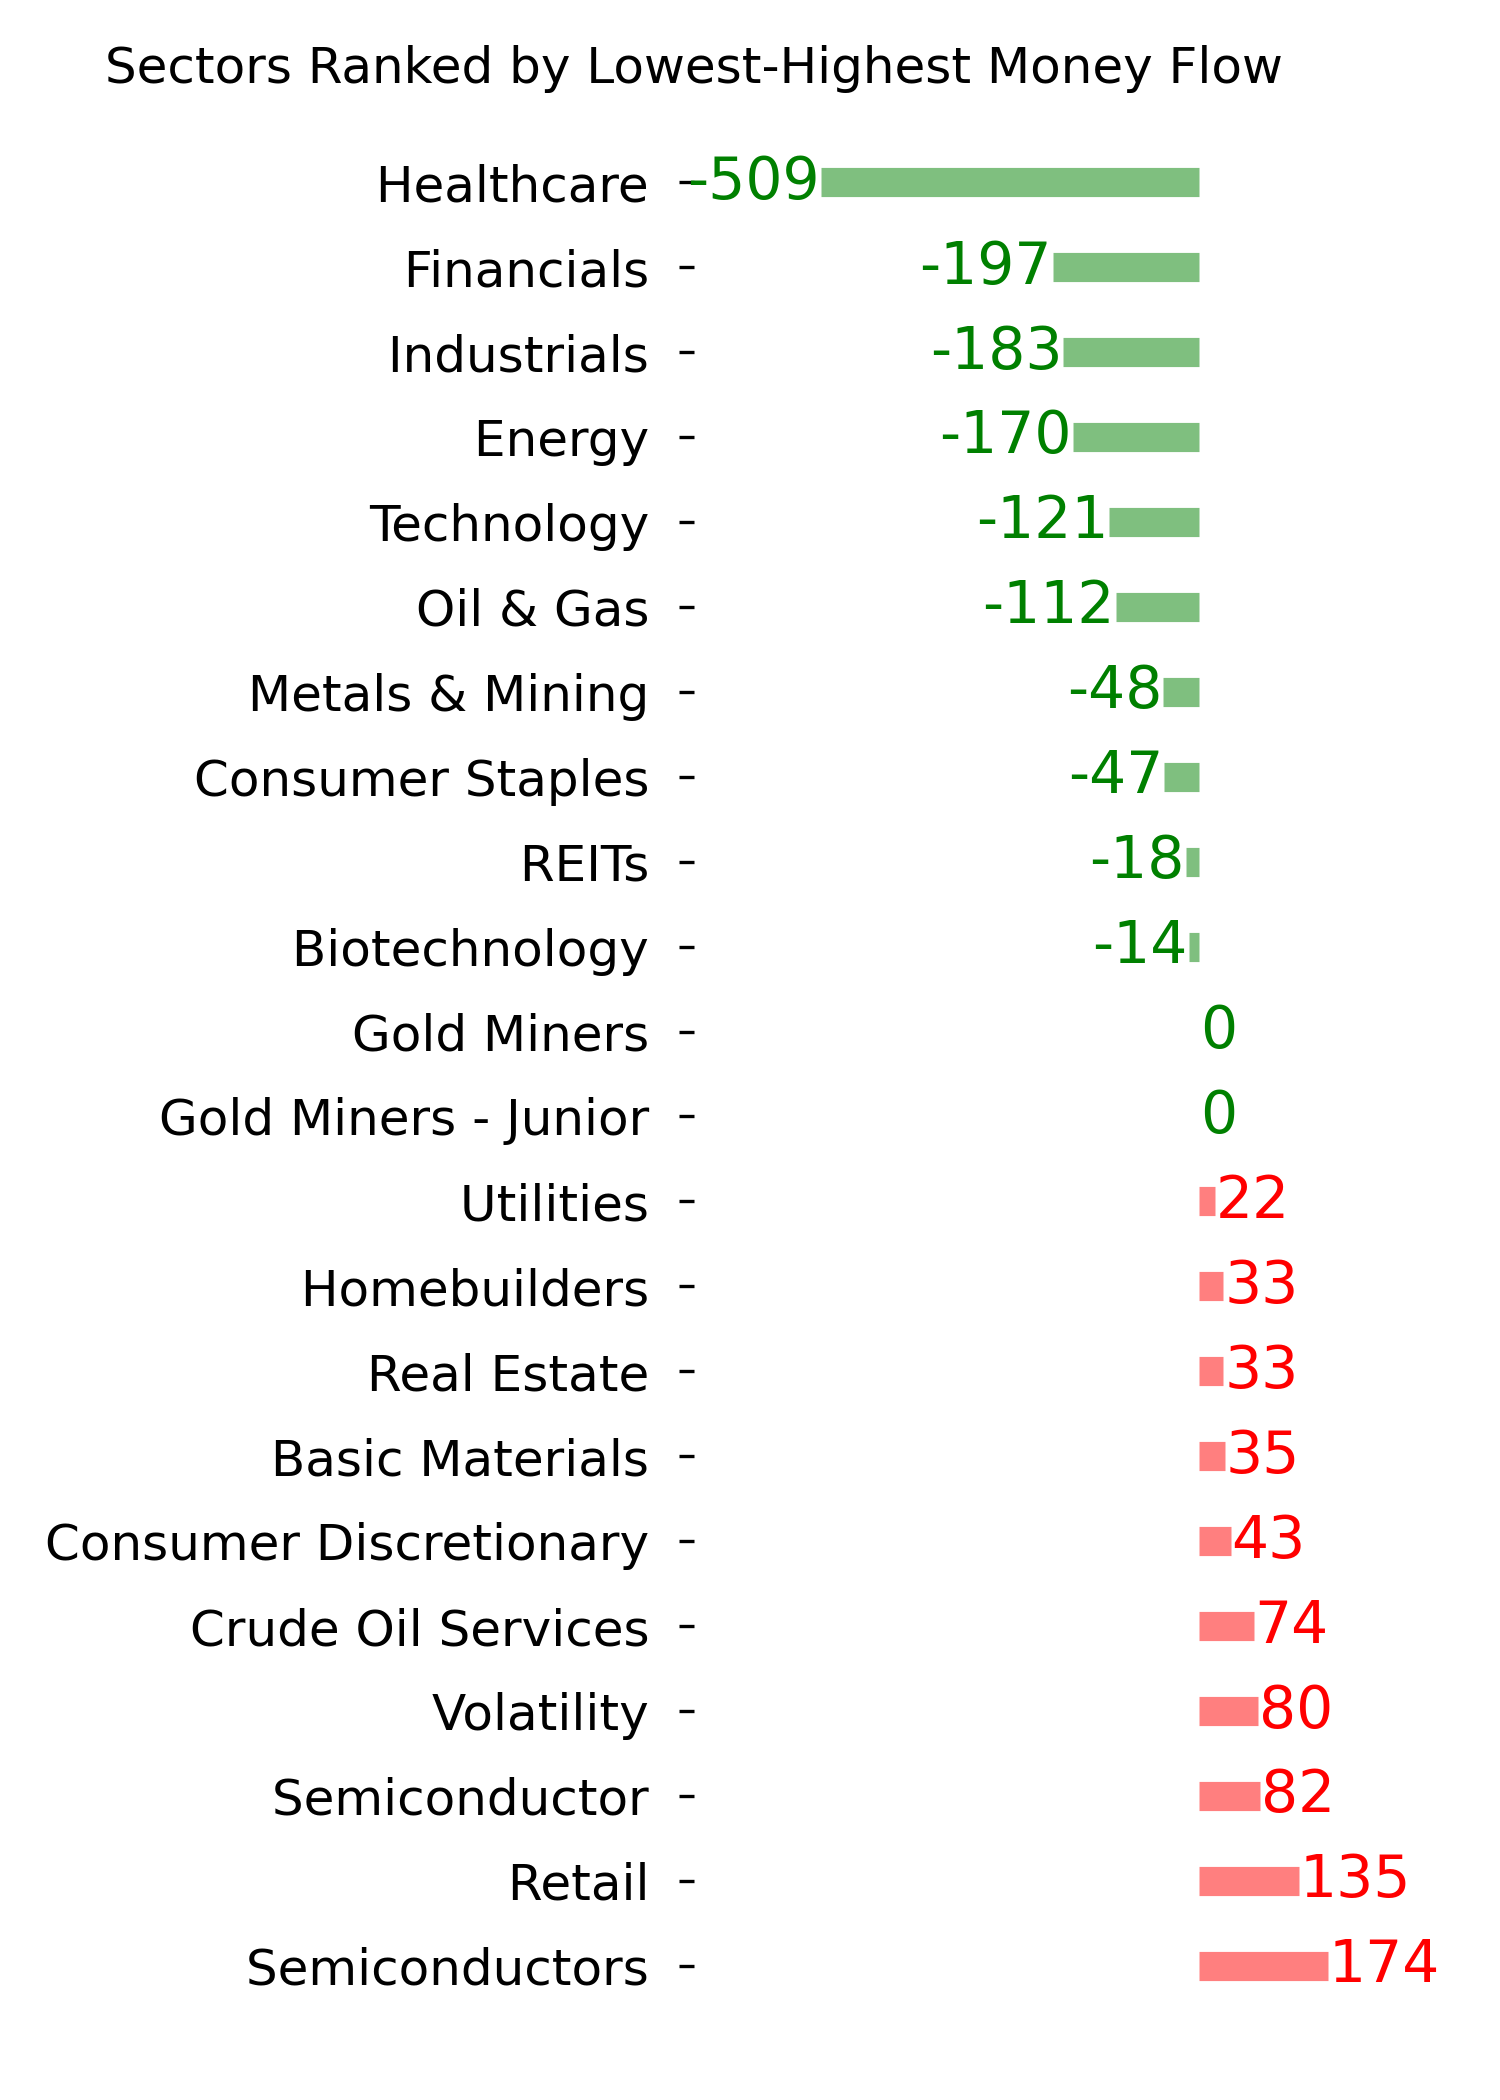
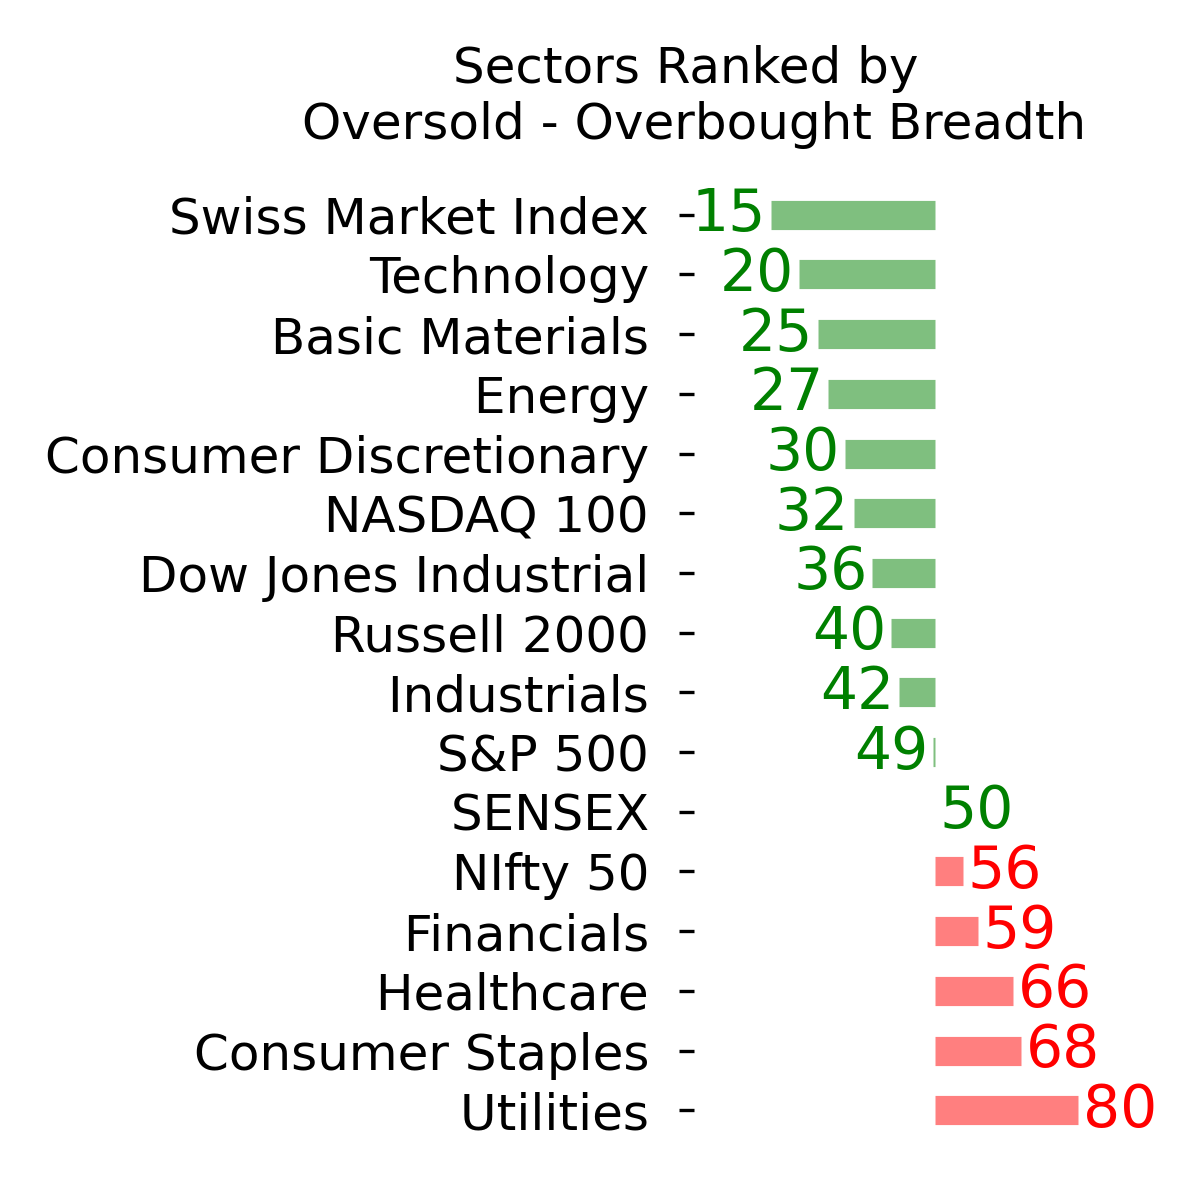
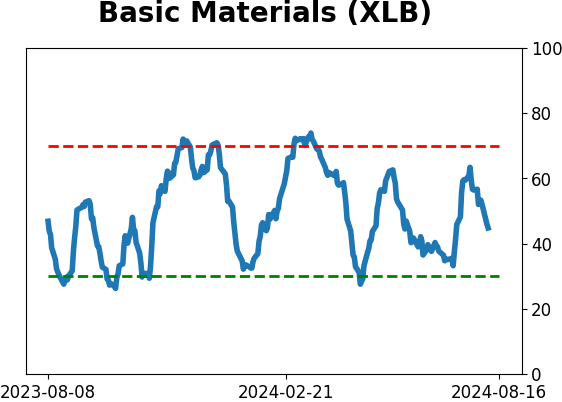
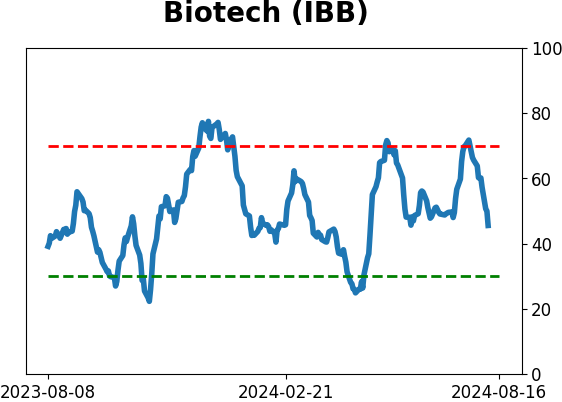
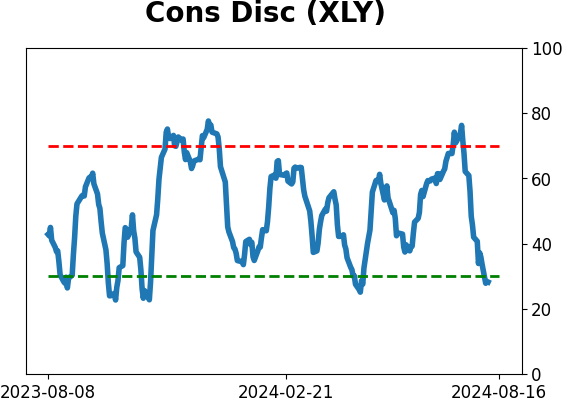
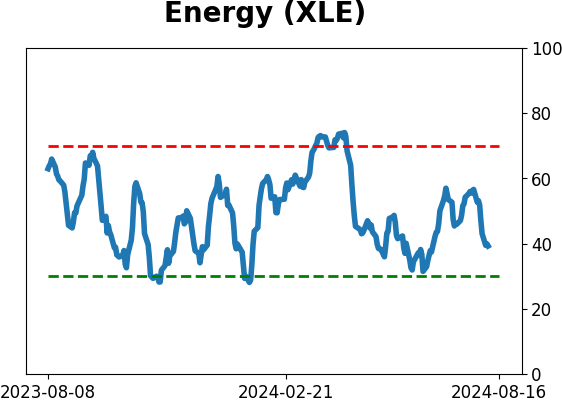
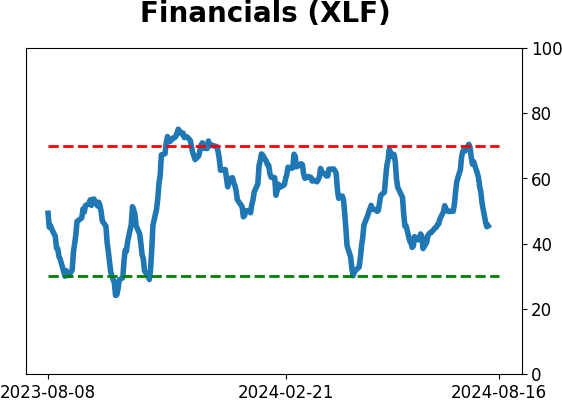
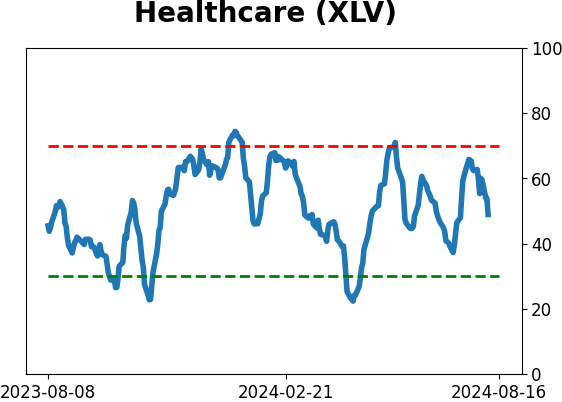
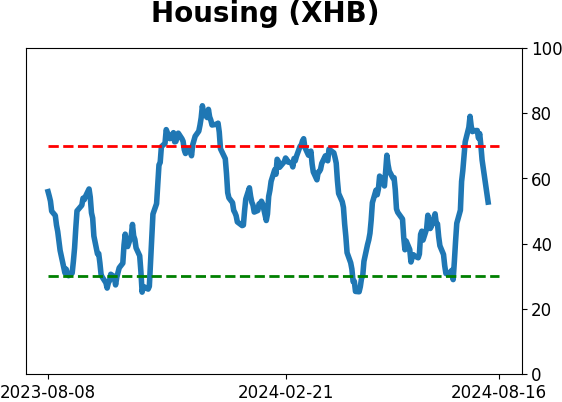
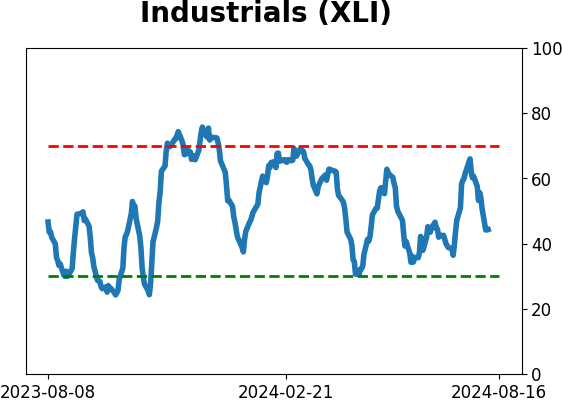
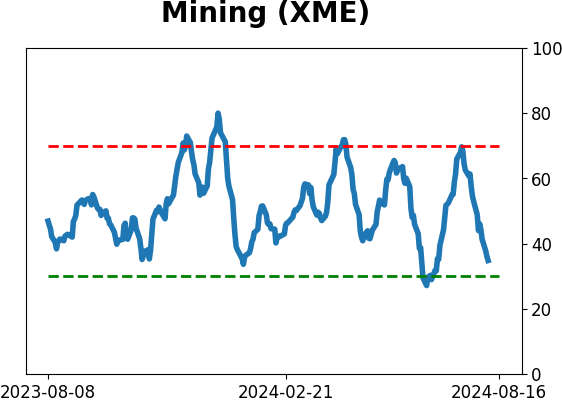
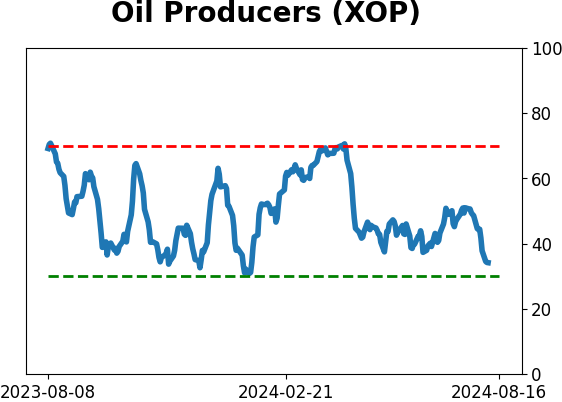
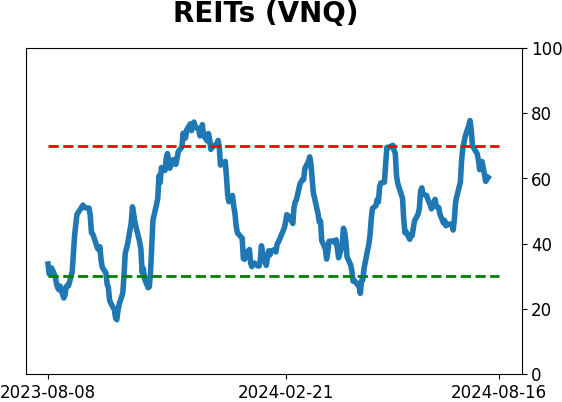
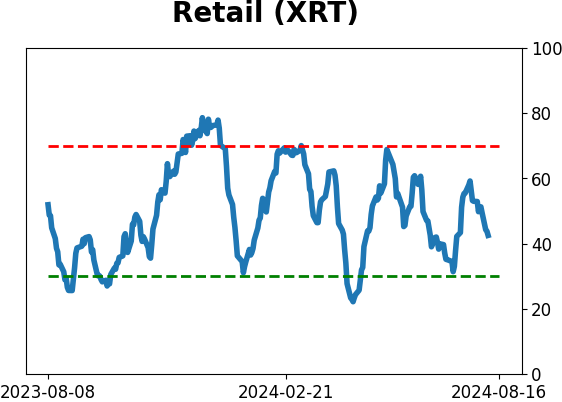
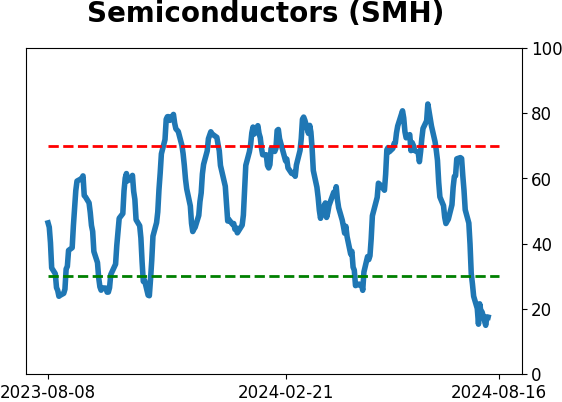
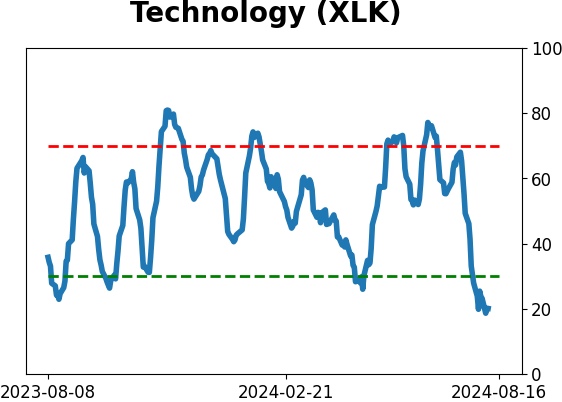
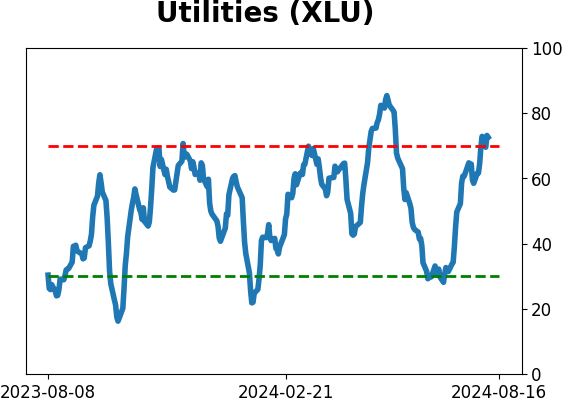
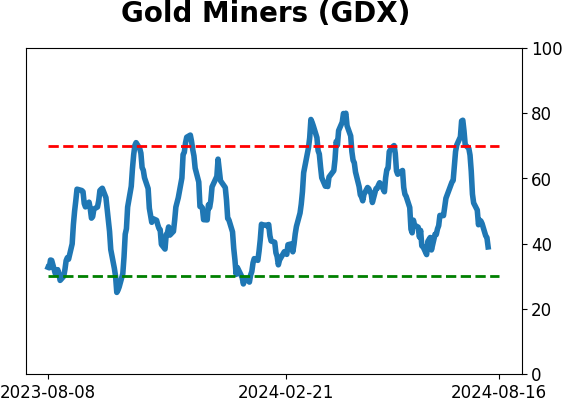
Sector ETF's - 10-Day Moving Average
|
|
|
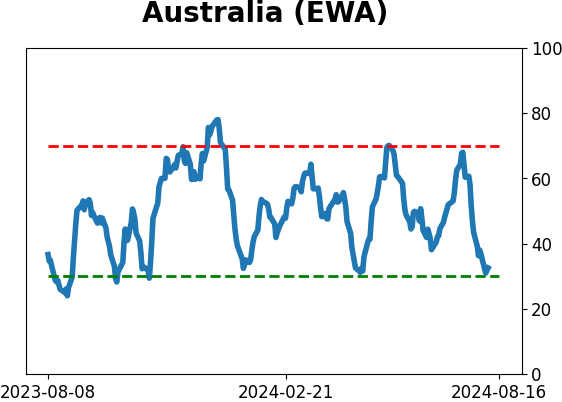
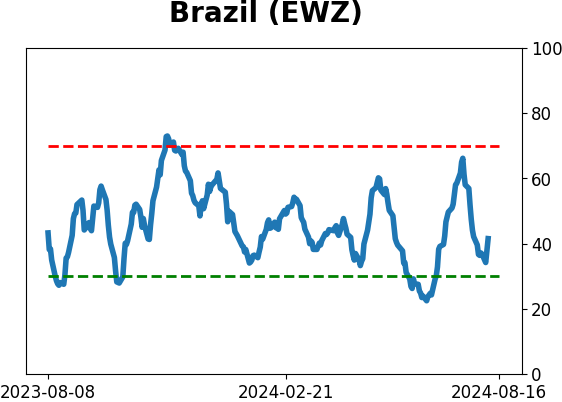
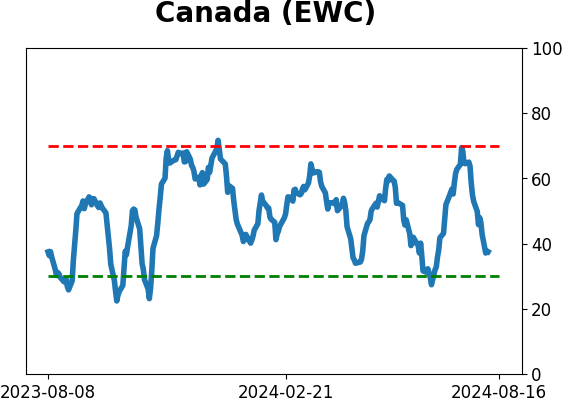
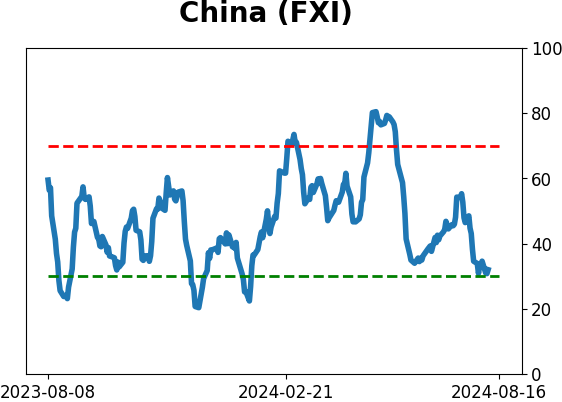
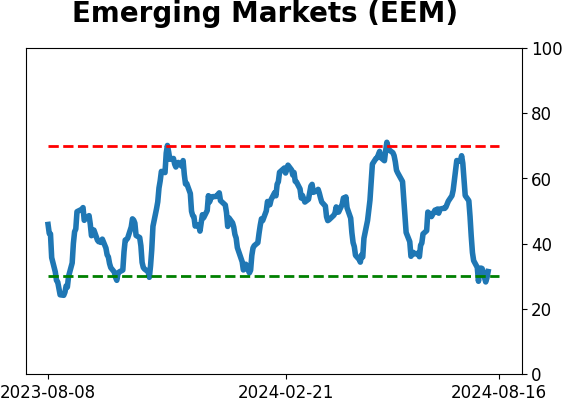
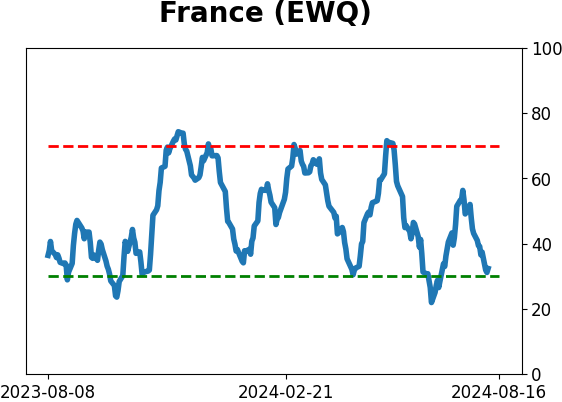
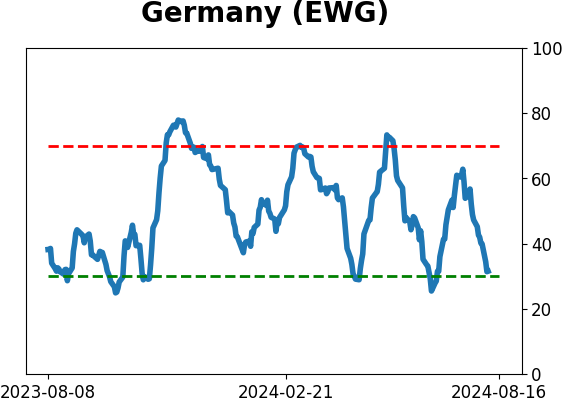
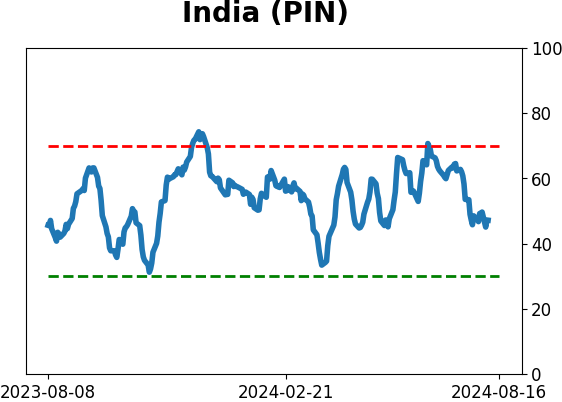
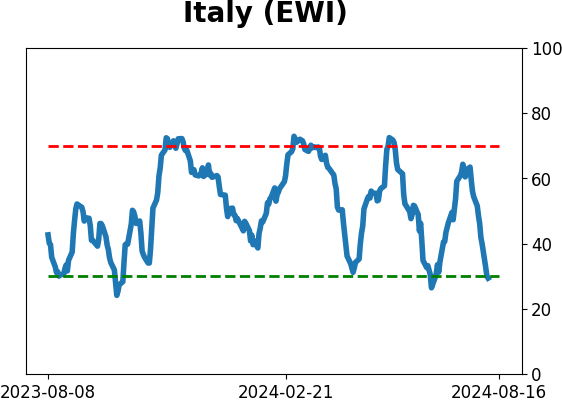
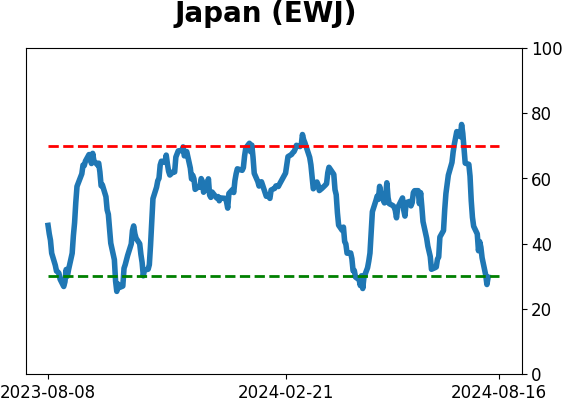
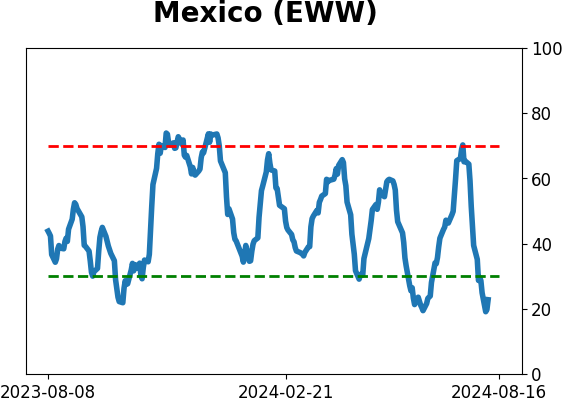
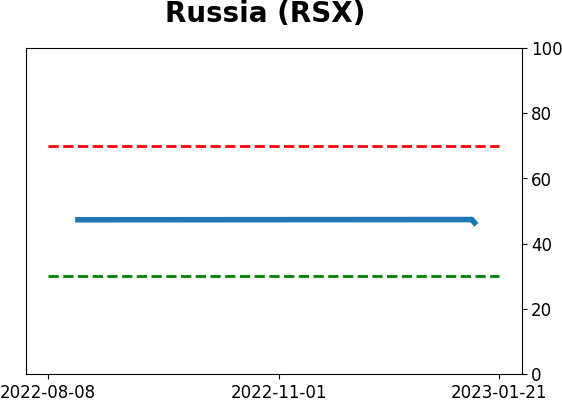
Country ETF's - 10-Day Moving Average
|
|
|
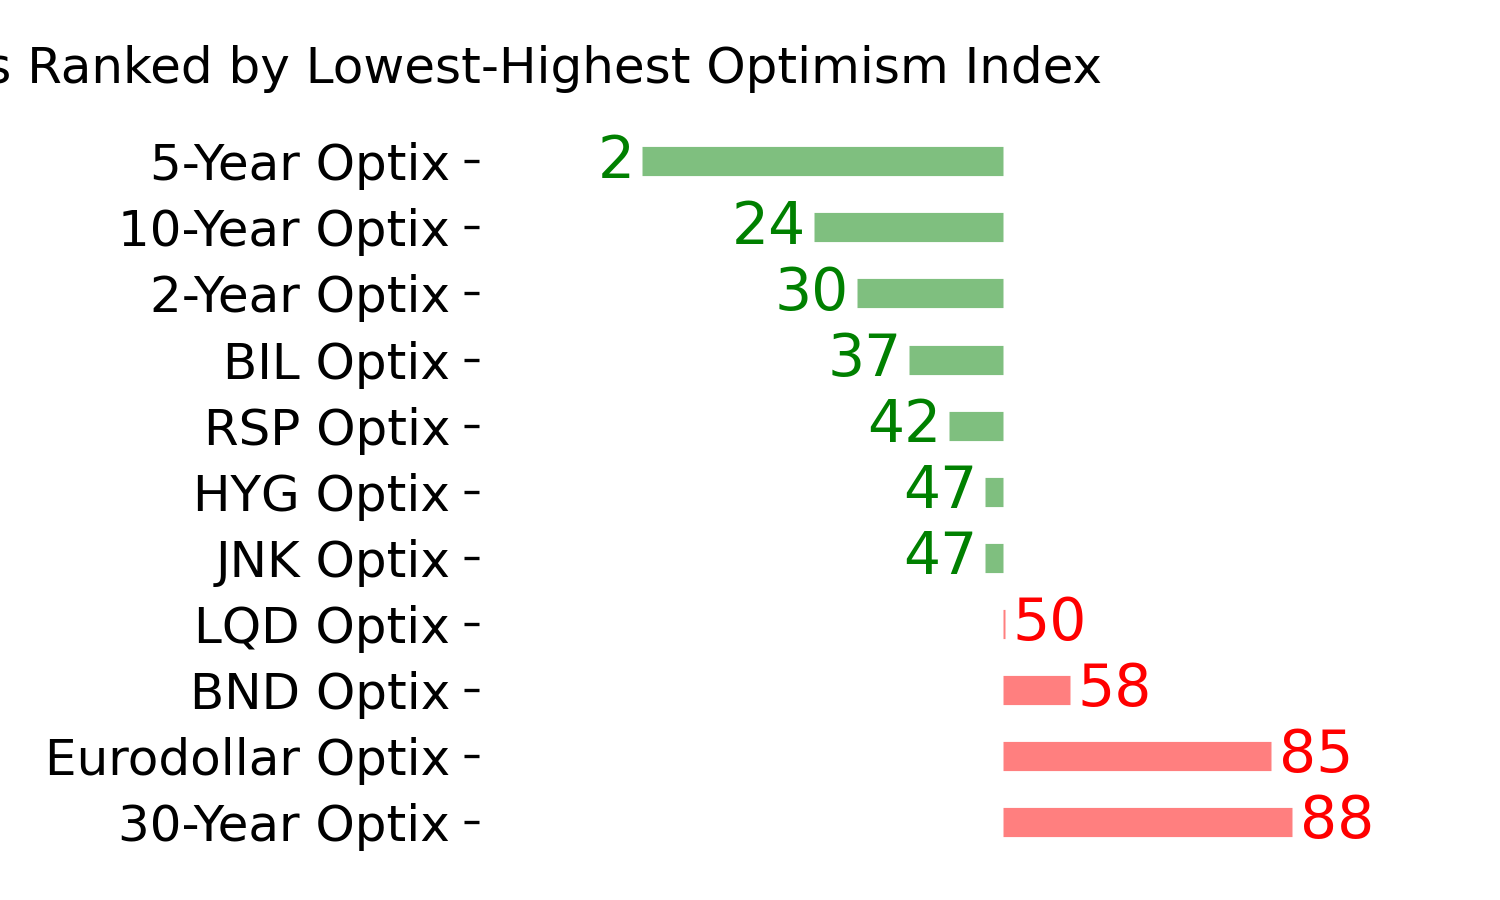
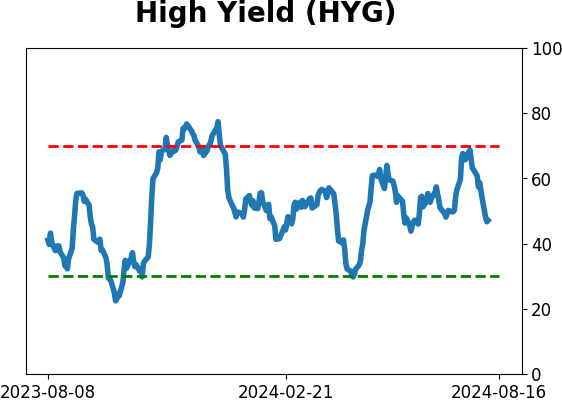
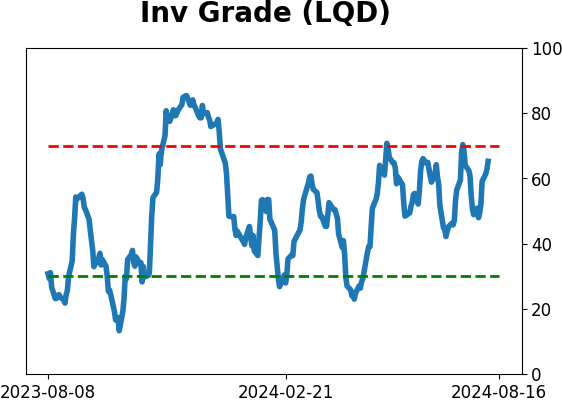
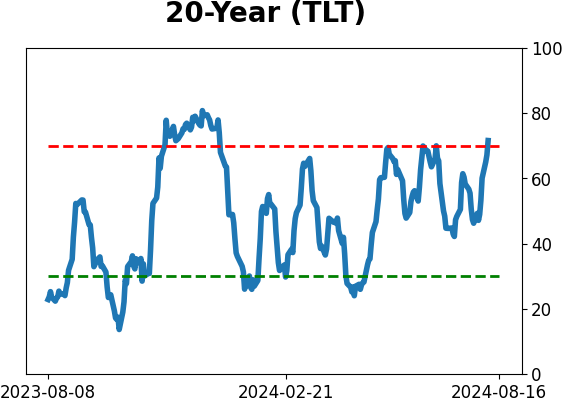
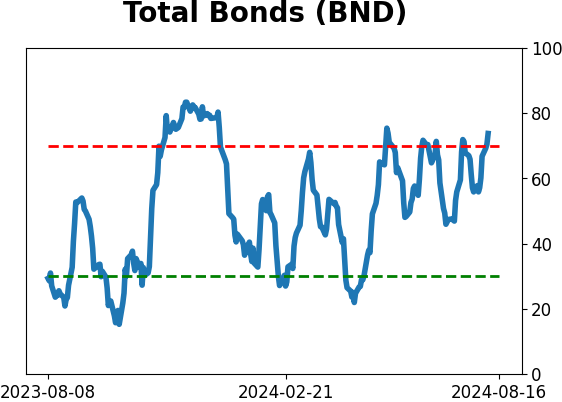
Bond ETF's - 10-Day Moving Average
|
|
|
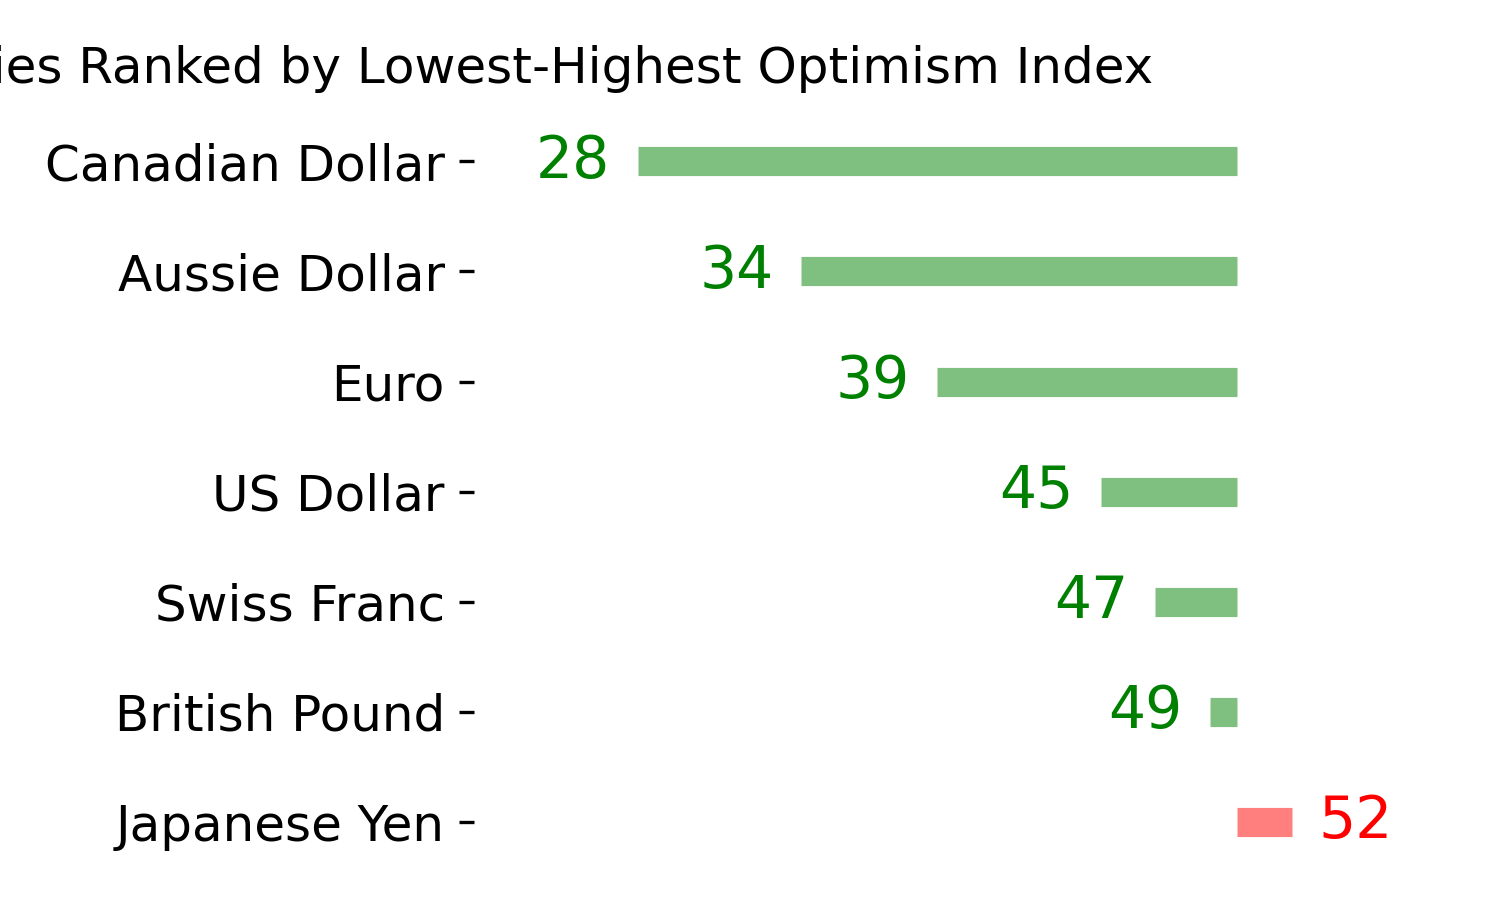
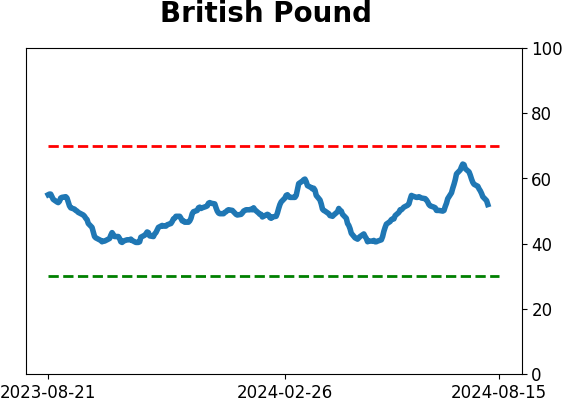
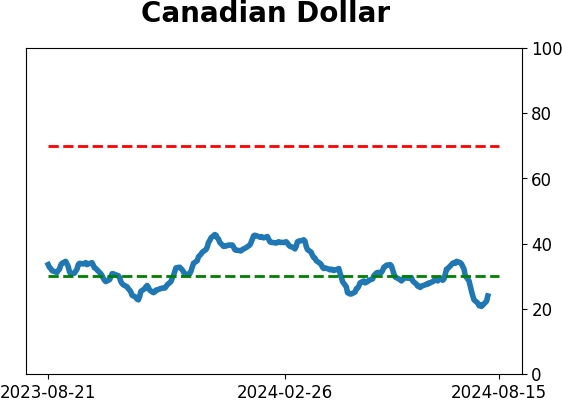
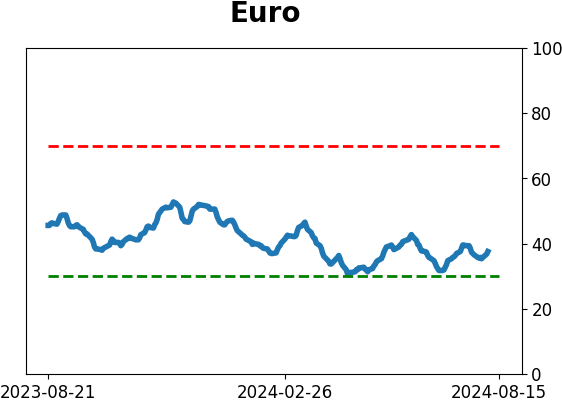
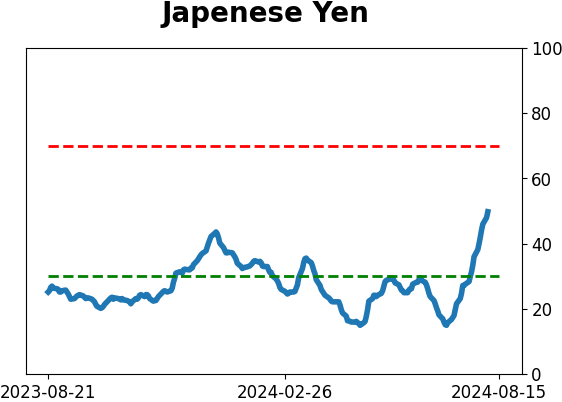
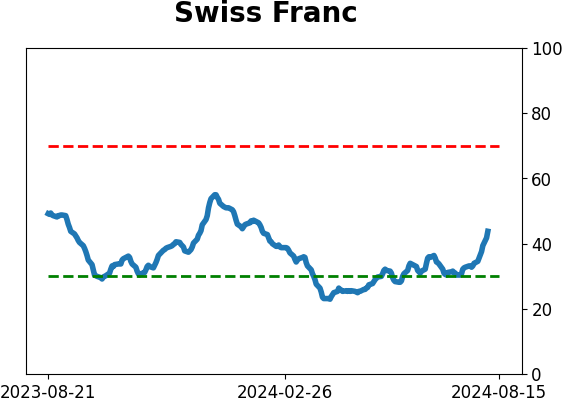
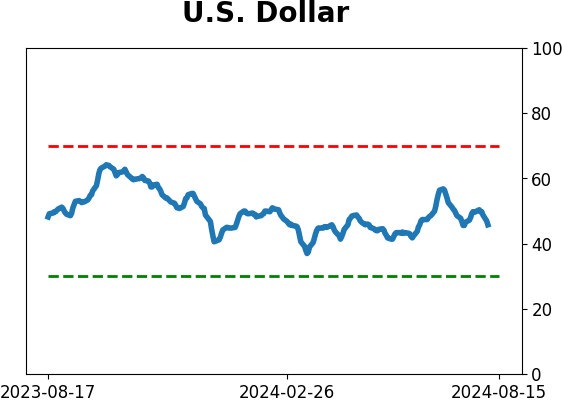
Currency ETF's - 5-Day Moving Average
|
|
|
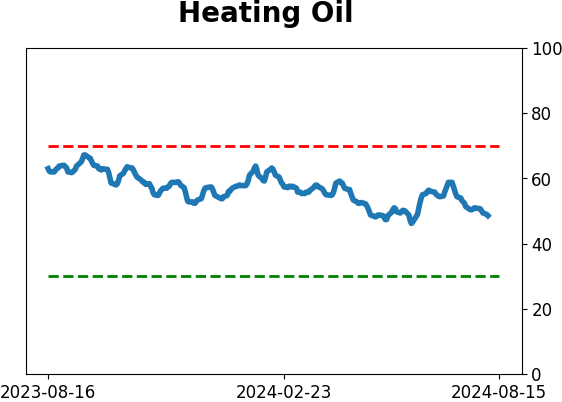
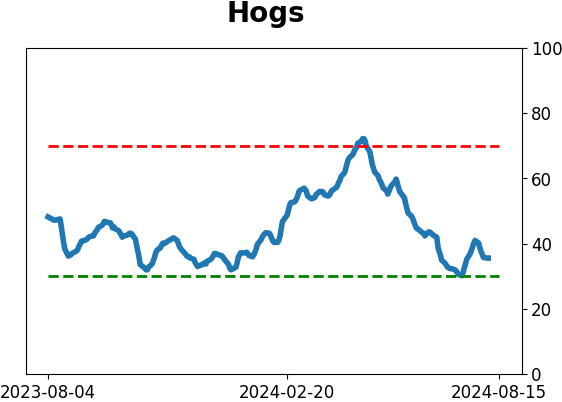
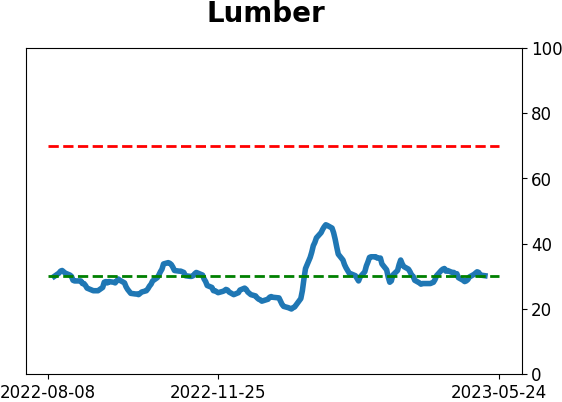
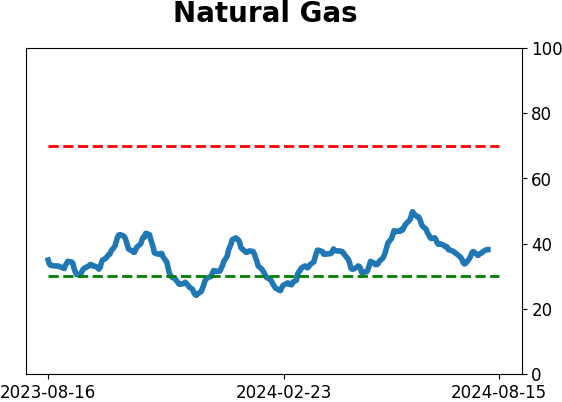
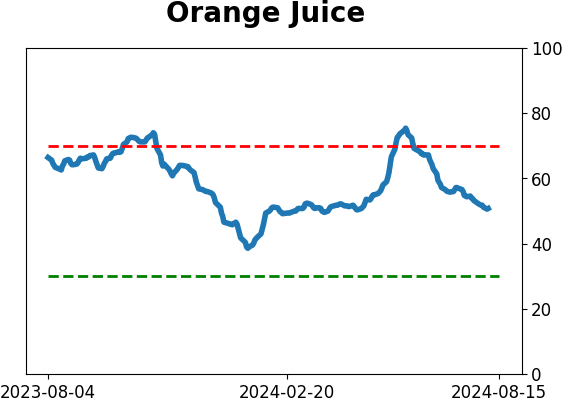
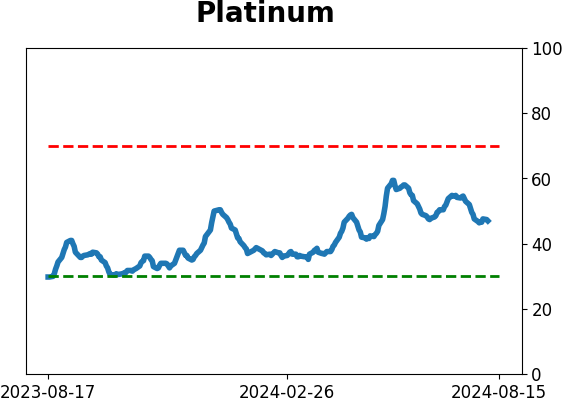
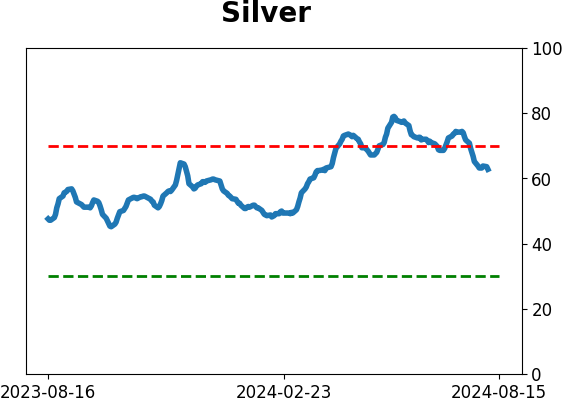
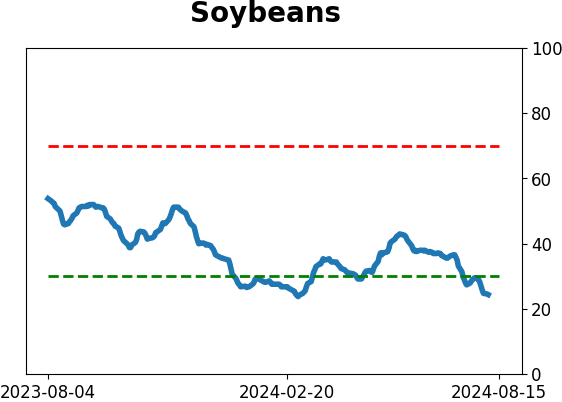
Commodity ETF's - 5-Day Moving Average
|
|