Headlines
|
|
Greed is gone:
Two models of investor behavior show that sentiment has cycled out of the greed zone. While short-term returns following similar behavior were mixed, longer-term returns tended to skew positive.
|
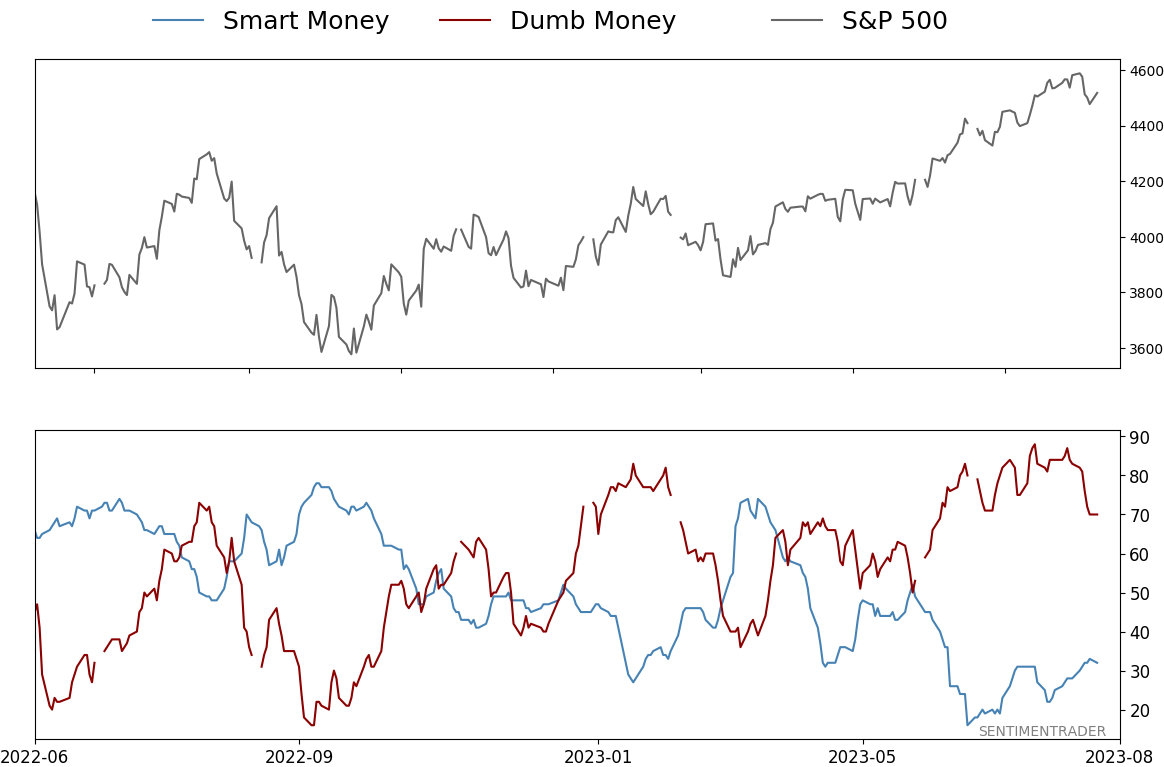
Smart / Dumb Money Confidence
|
Smart Money Confidence: 32%
Dumb Money Confidence: 70%
|
|
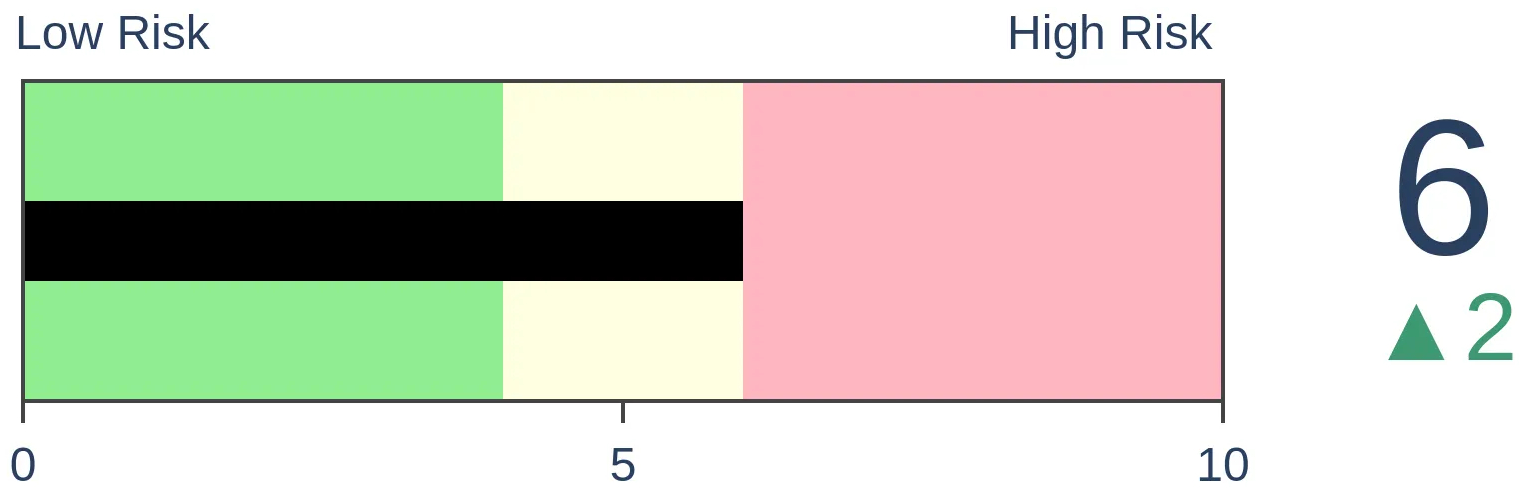
Risk Levels
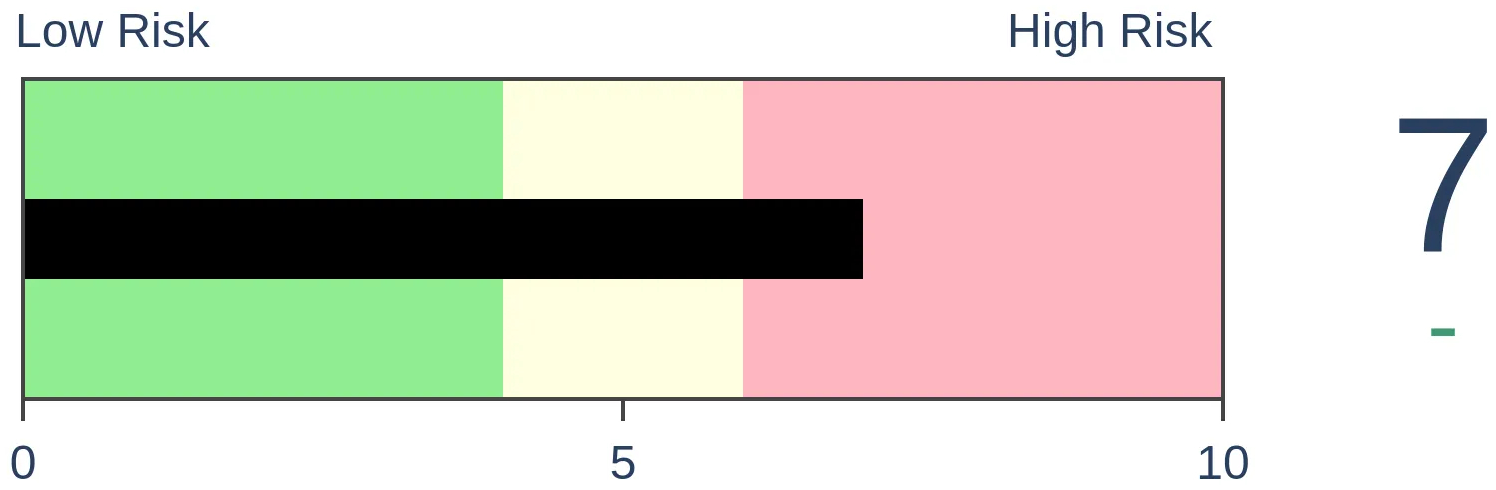
Stocks Short-Term
|
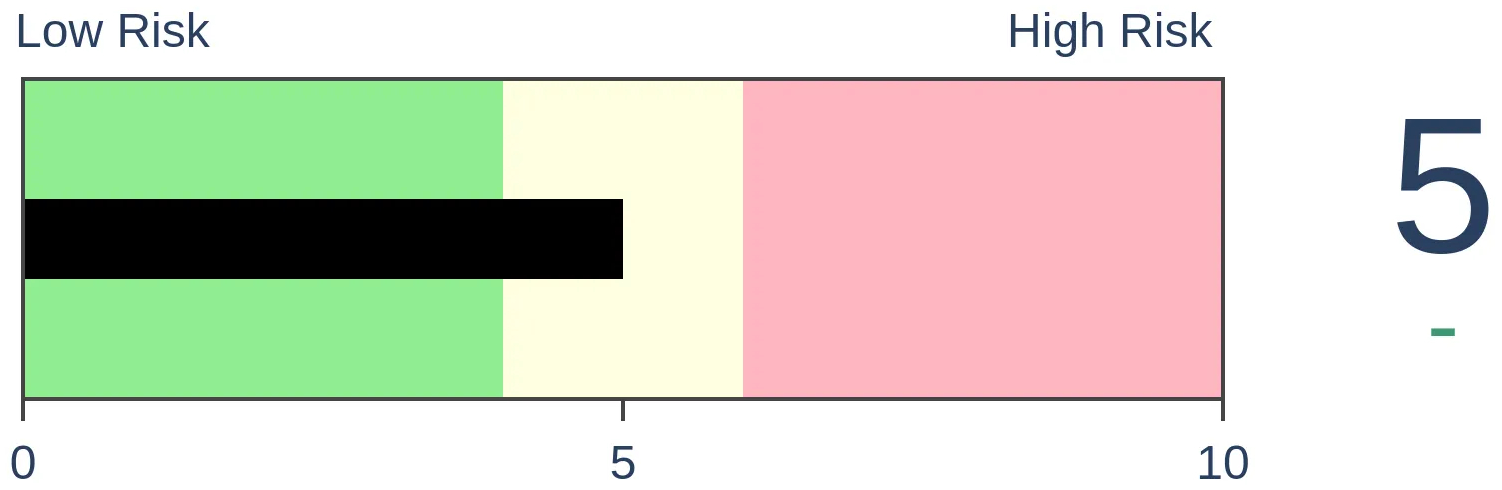
Stocks Medium-Term
|
|
Bonds
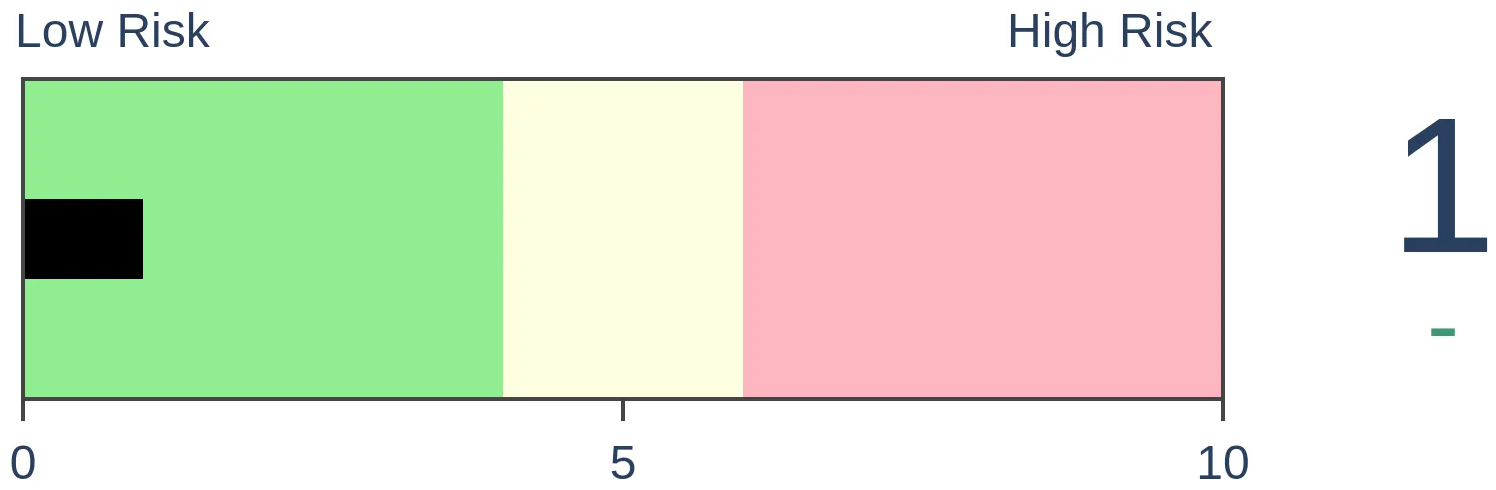
|
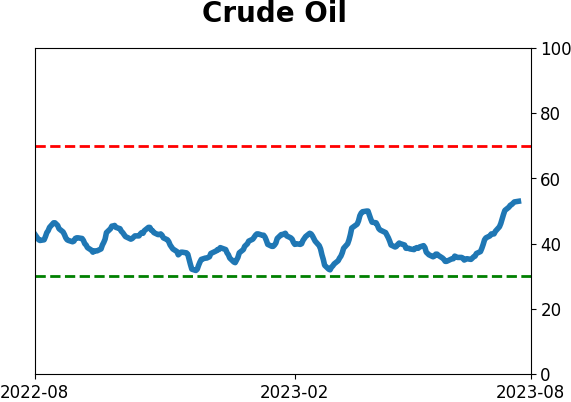
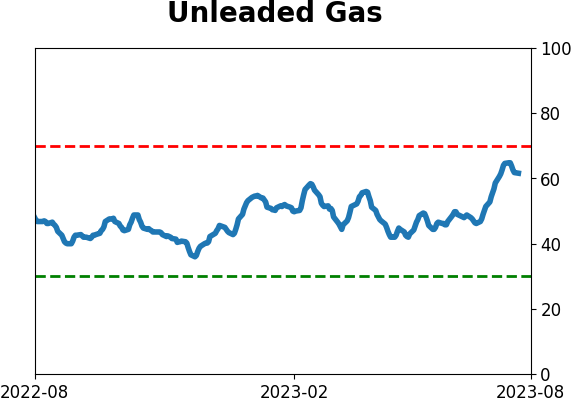
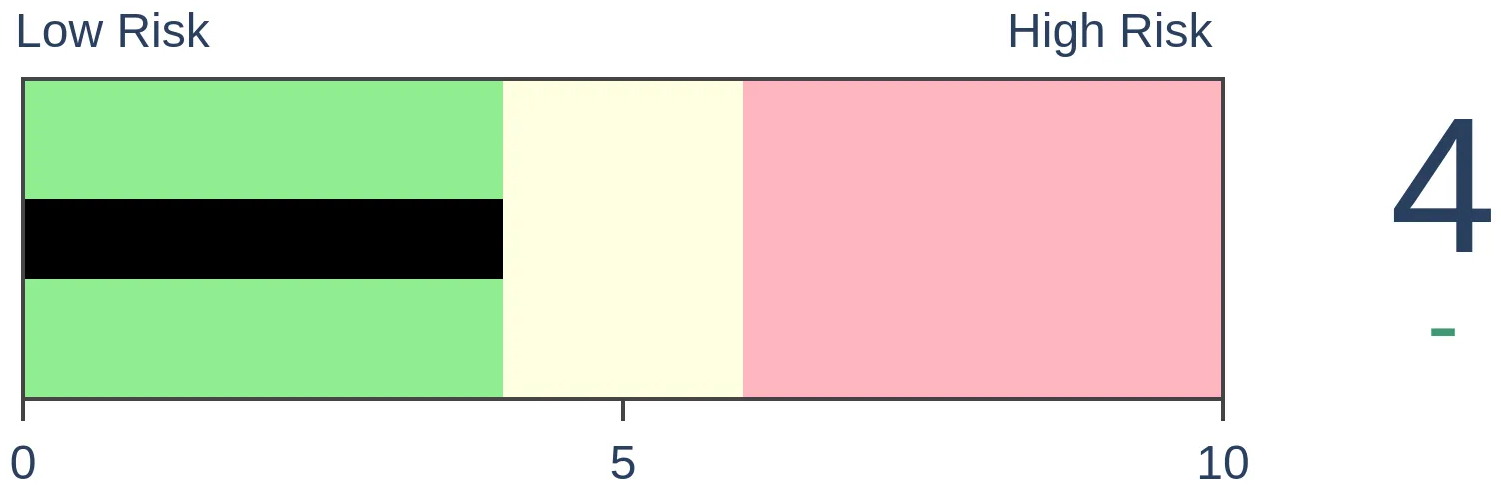
Crude Oil
|
|
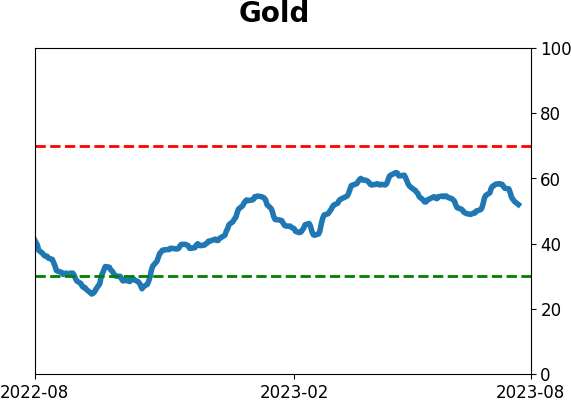
Gold

|
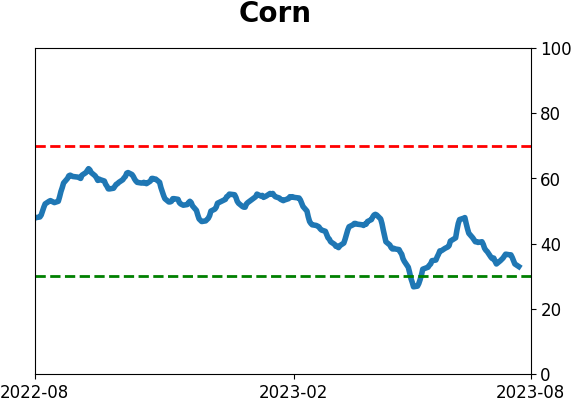
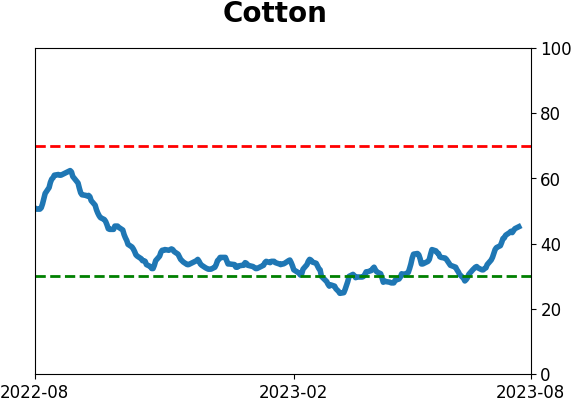
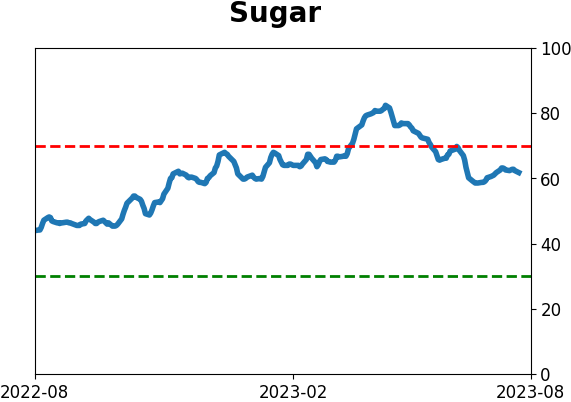
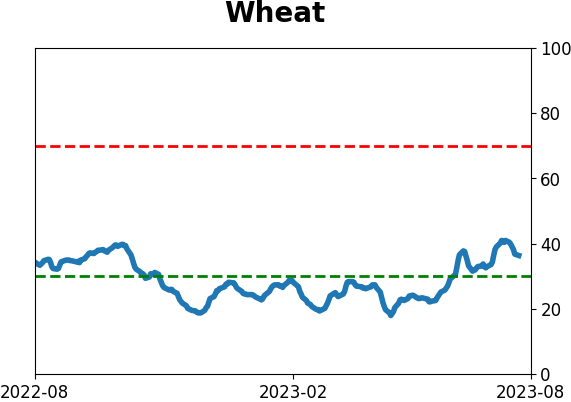
Agriculture
|
|
Research
By Jason Goepfert
BOTTOM LINE
Two models of investor behavior show that sentiment has cycled out of the greed zone. While short-term returns following similar behavior were mixed, longer-term returns tended to skew positive.
FORECAST / TIMEFRAME
None
|
Key points:
- Investor greed is in retreat after registering an extreme
- The "dumb money" is also pulling back from a bout of supreme confidence
- Similar behavior tended to precede short-term weakness and longer-term strength
Investors' greed has eased
Well, at least investors aren't greedy anymore.
Sentiment had been absurdly optimistic for a while. We've seen that similar conditions typically preceded below-average annualized returns but were poor predictors of significant and protracted declines. That was particularly the case when sentiment became exceptionally extreme and when it was the first signal after a bout of depression. Both were the cases this time.
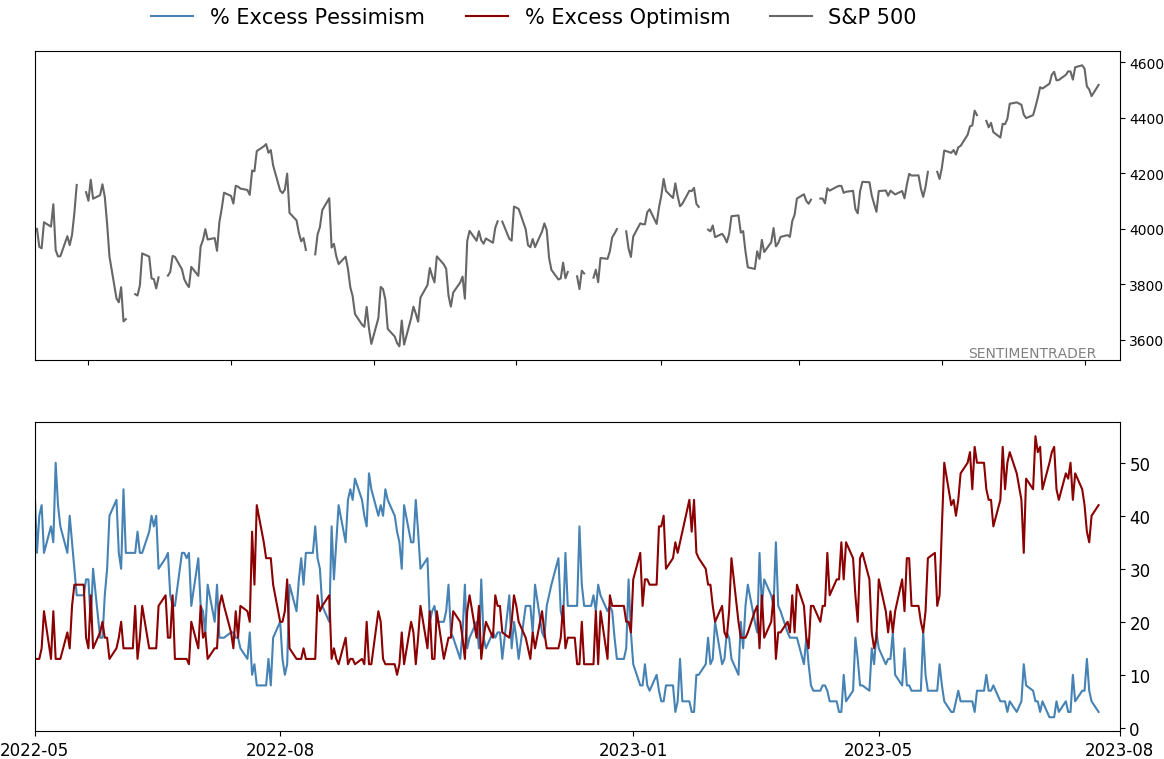
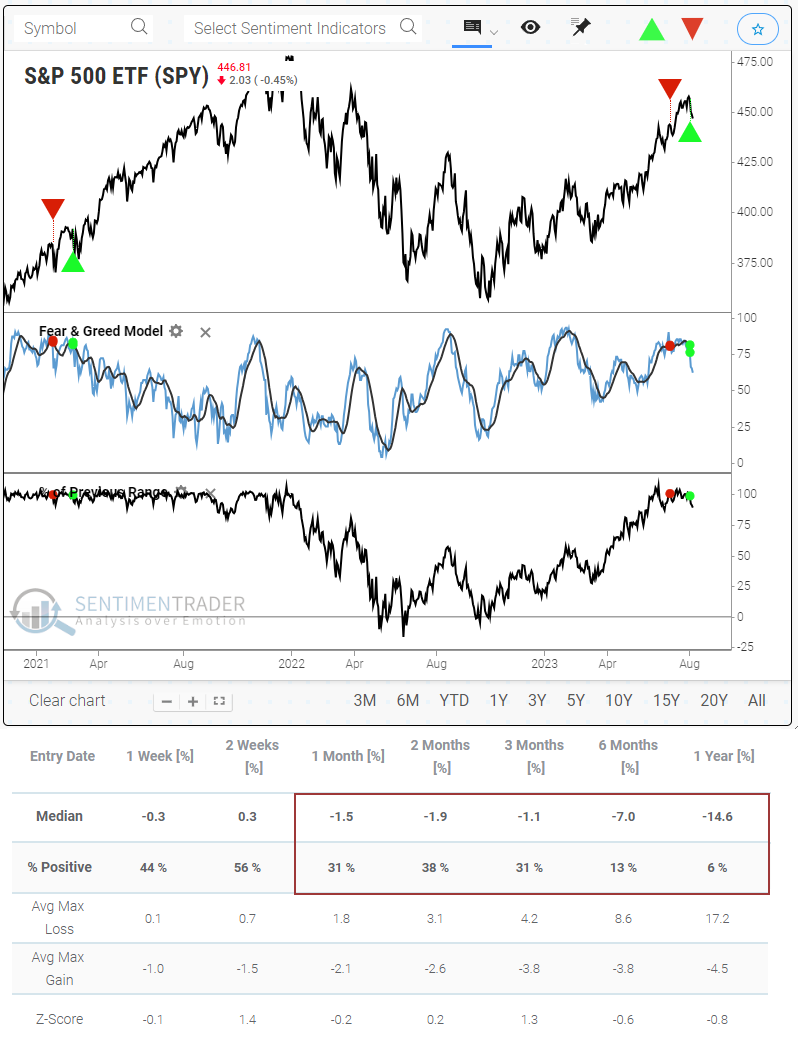
The Fear & Greed model has moved aggressively out of the greed zone and is back in neutral territory.
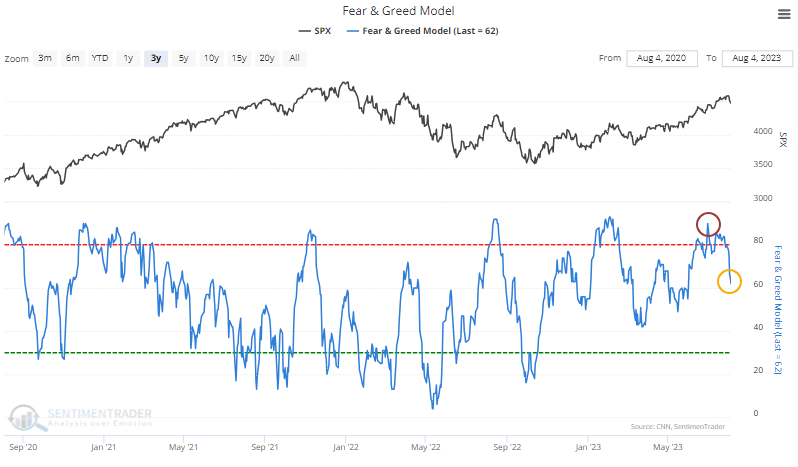
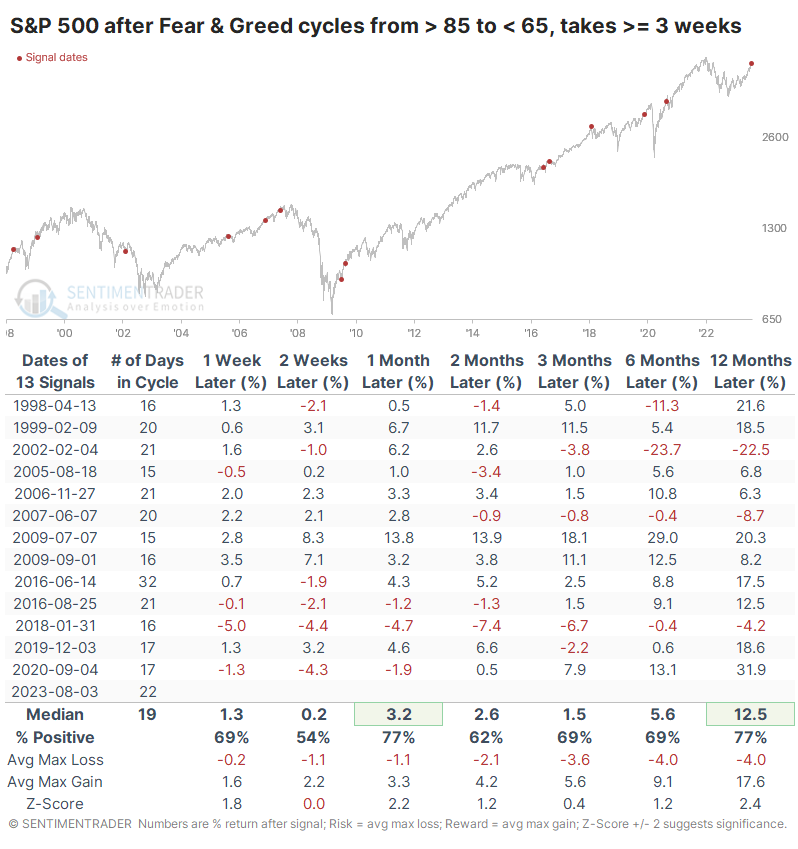
The table below shows other times when Fear & Greed cycled from extreme greed back to neutral conditions. This cycle is unusual because it has taken quite a while to reverse, about twice as long as it usually does. The table filters the signals only to include those that took three weeks or longer to play out. There was only one loss greater than -3.8% over the next three months.
Compare that to the summary table below, which shows shorter cycles. These are times when it took fewer than three weeks to cycle from above 85 to below 65.
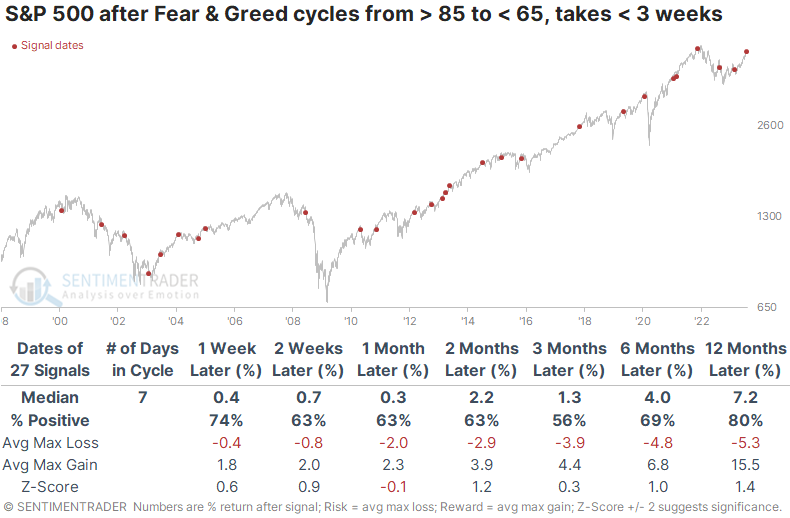
Over a medium- to long-term time frame, when it took longer for investors to get rid of their optimism, stocks performed better. When they were quicker to move back to neutral, returns were worse.
The new backtesting engine allows for much more powerful tests than the existing one. It lets a user test realistic strategies within a more robust environment.
For example, let's say that an investor heard that sentiment is rolling over, so they should sell short, betting on a further decline. Using the backtest engine, we can see how it would have worked to sell short SPY when within 1% of its prior 52-week range and the 10-day average of the Fear & Greed model crosses below 84%. The test is straightforward in that it exits after 20 trading days, but it can be adjusted for much more sophisticated exits.
As a trading strategy, it is populated with losses. There was only one year when selling short would have resulted in a double-digit profit.
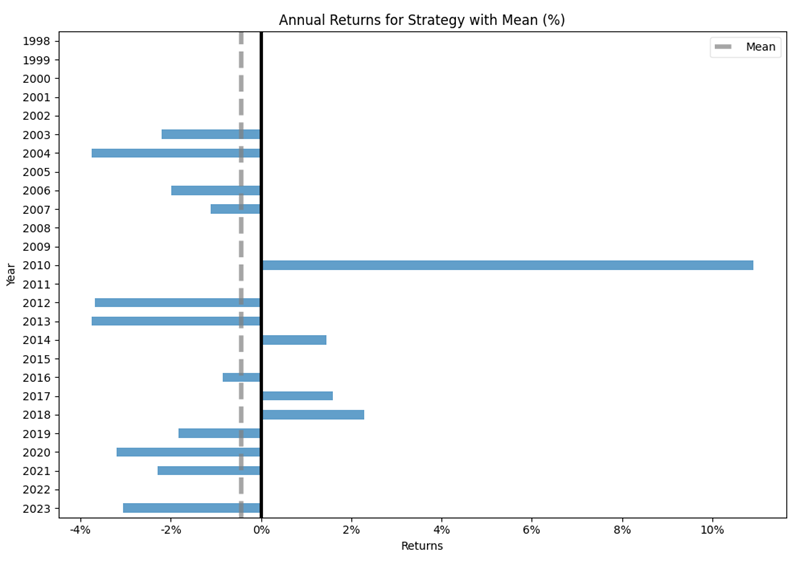
The chart and stats show that betting against the S&P after these conditions was a recipe for pain. It took a while sometimes, and the 2-week forward return was positive more than half the time. Again, these are short sales, so SPY declined 56% of the time two weeks later. But after that, selling short was a losing strategy.
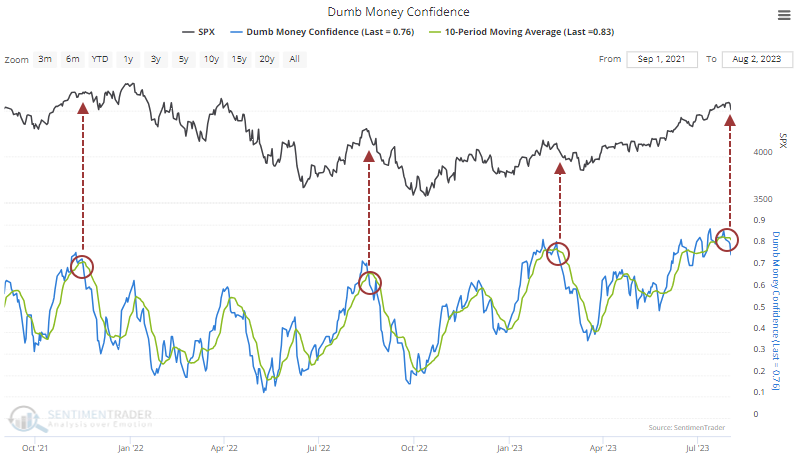
The "dumb money" is retreating
The Dumb Money Confidence model is also starting to reverse. It suggests that trend-following traders had reached a theoretical maximum level of optimism (and, by extension, exposure to stocks) and have started selling. Over the last couple of years, when Confidence fell under its 10-day average following an extreme, the S&P 500 continued to fall, at least for a while.
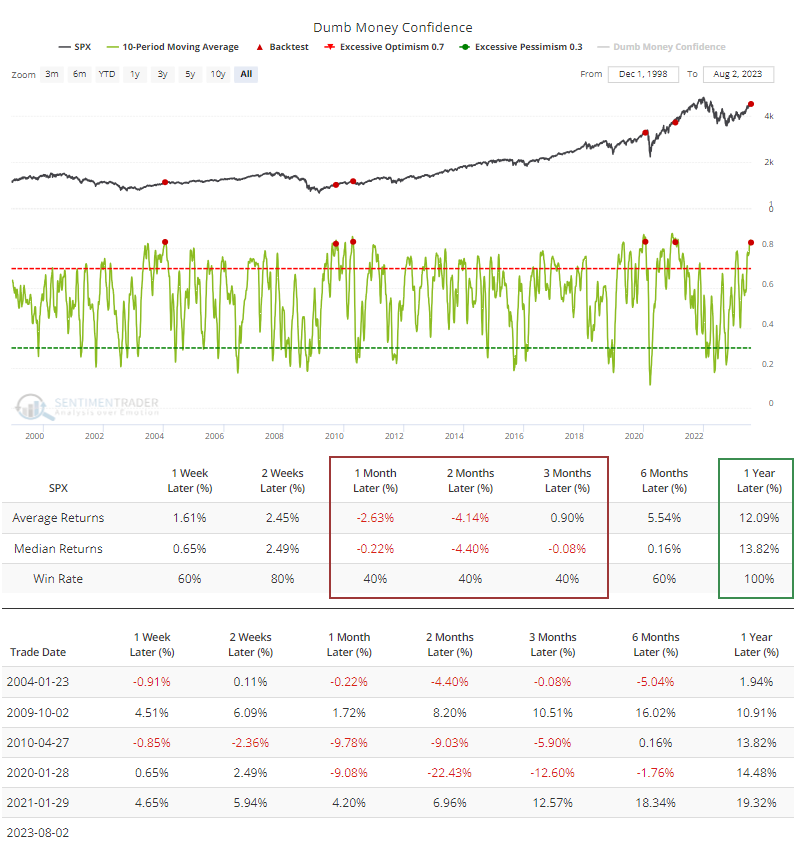
The Backtest Engine shows that when the 10-day average of Dumb Money Confidence curls lower and drops below 83%, the S&P 500 struggled three times and shrugged it off twice. However, over the next twelve months, all of them showed positive returns.
What the research tells us...
We've noted multiple times recently that sentiment had become excessively optimistic. While that has been a drag on short-term returns, one notable wrinkle this time is just how extreme sentiment had become and where it was coming from. Optimism was in the gutter, and these are the first signs of excessive optimism since then. Similar conditions were typically only seen during the first thrust of new bull markets, not ongoing bear markets. Retreating sentiment after extreme optimism is a definite headwind for stocks and should be for perhaps the weeks ahead. But again, this is within the context of what should be a different environment from the devastation of 2022.
Indicators at Extremes
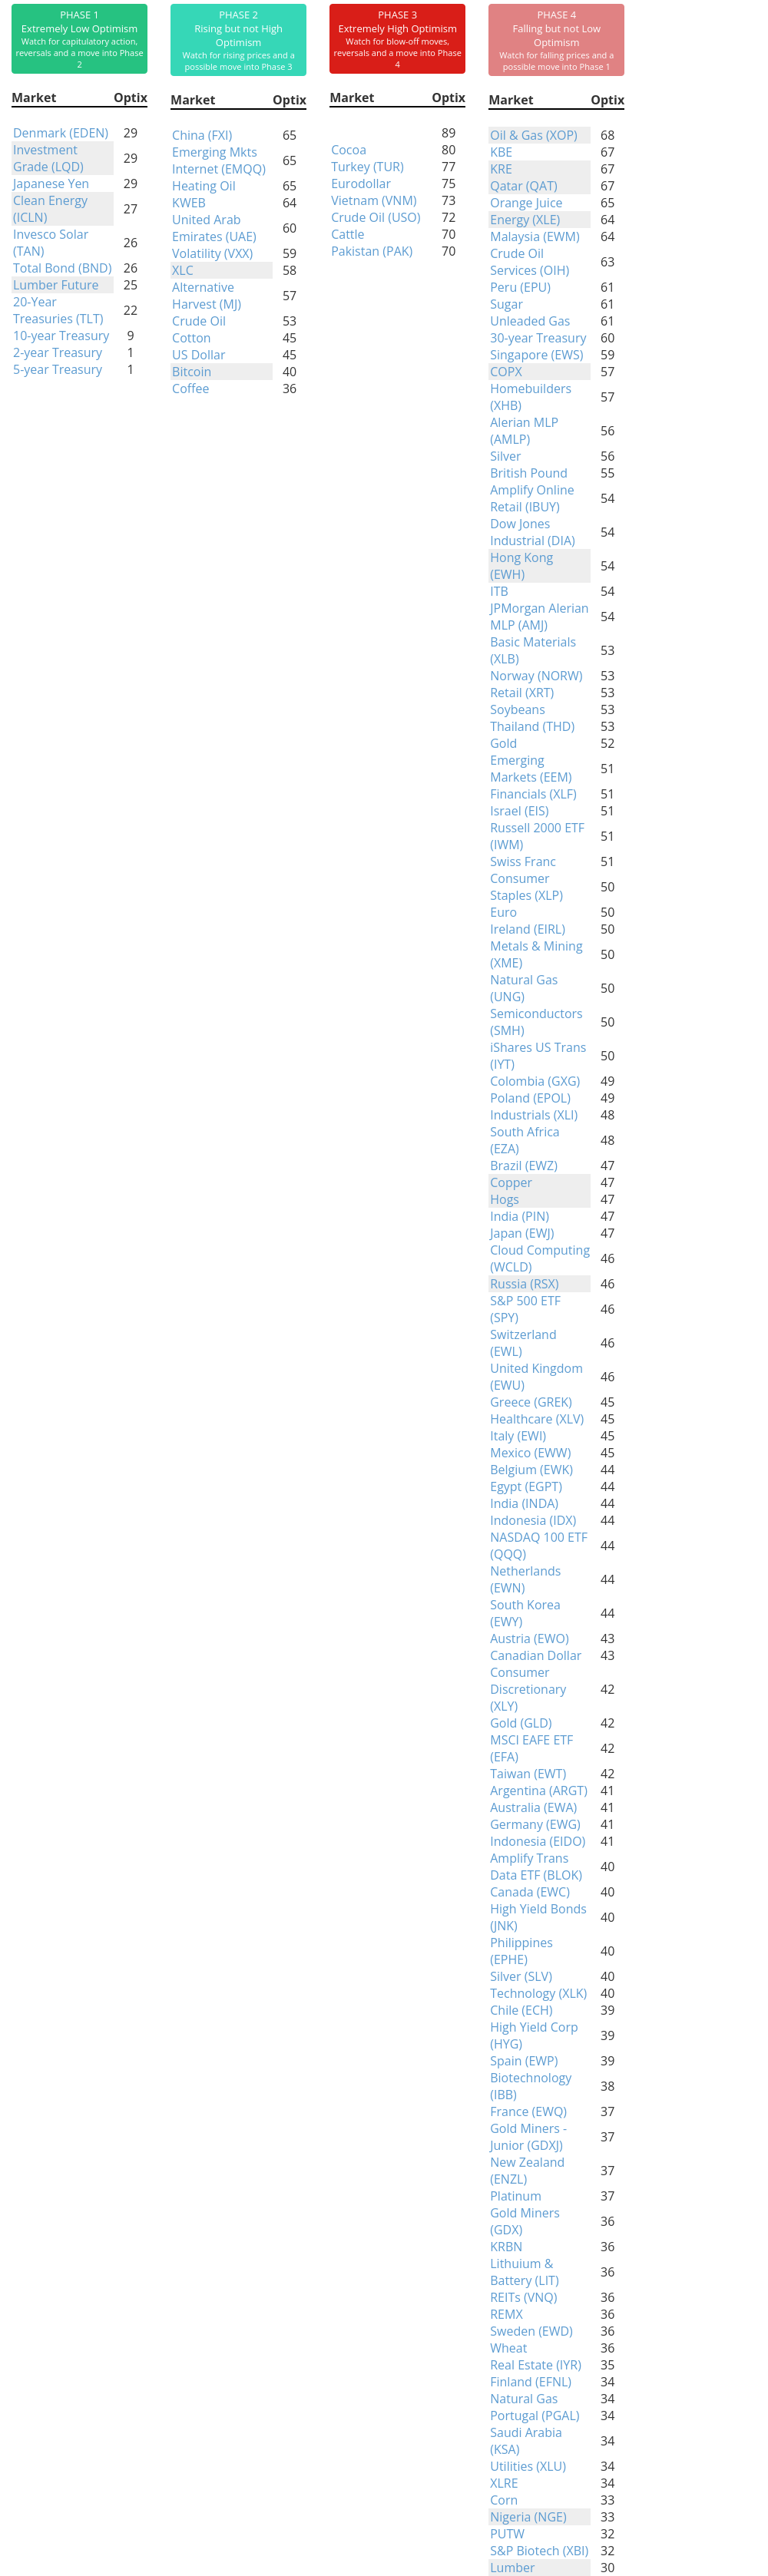
Phase Table
Ranks
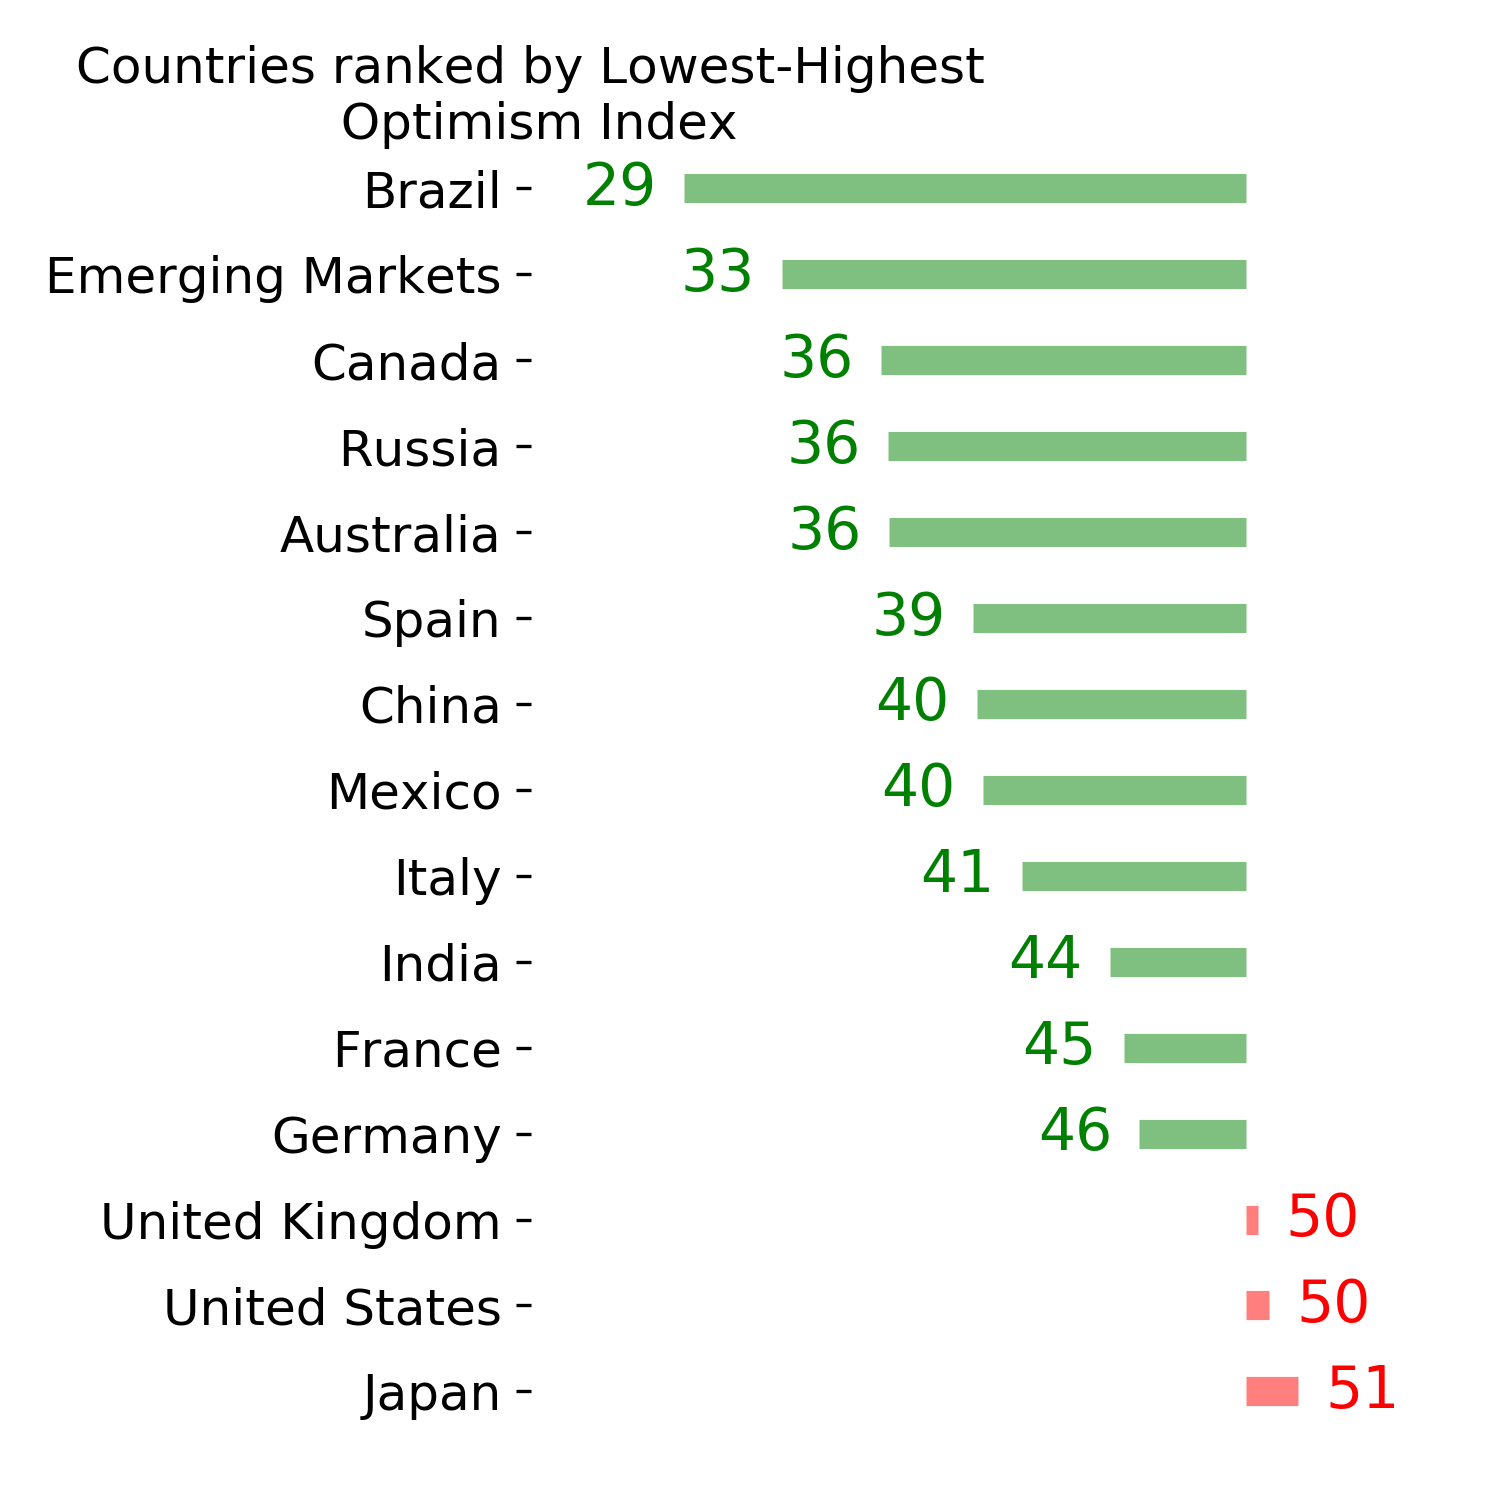
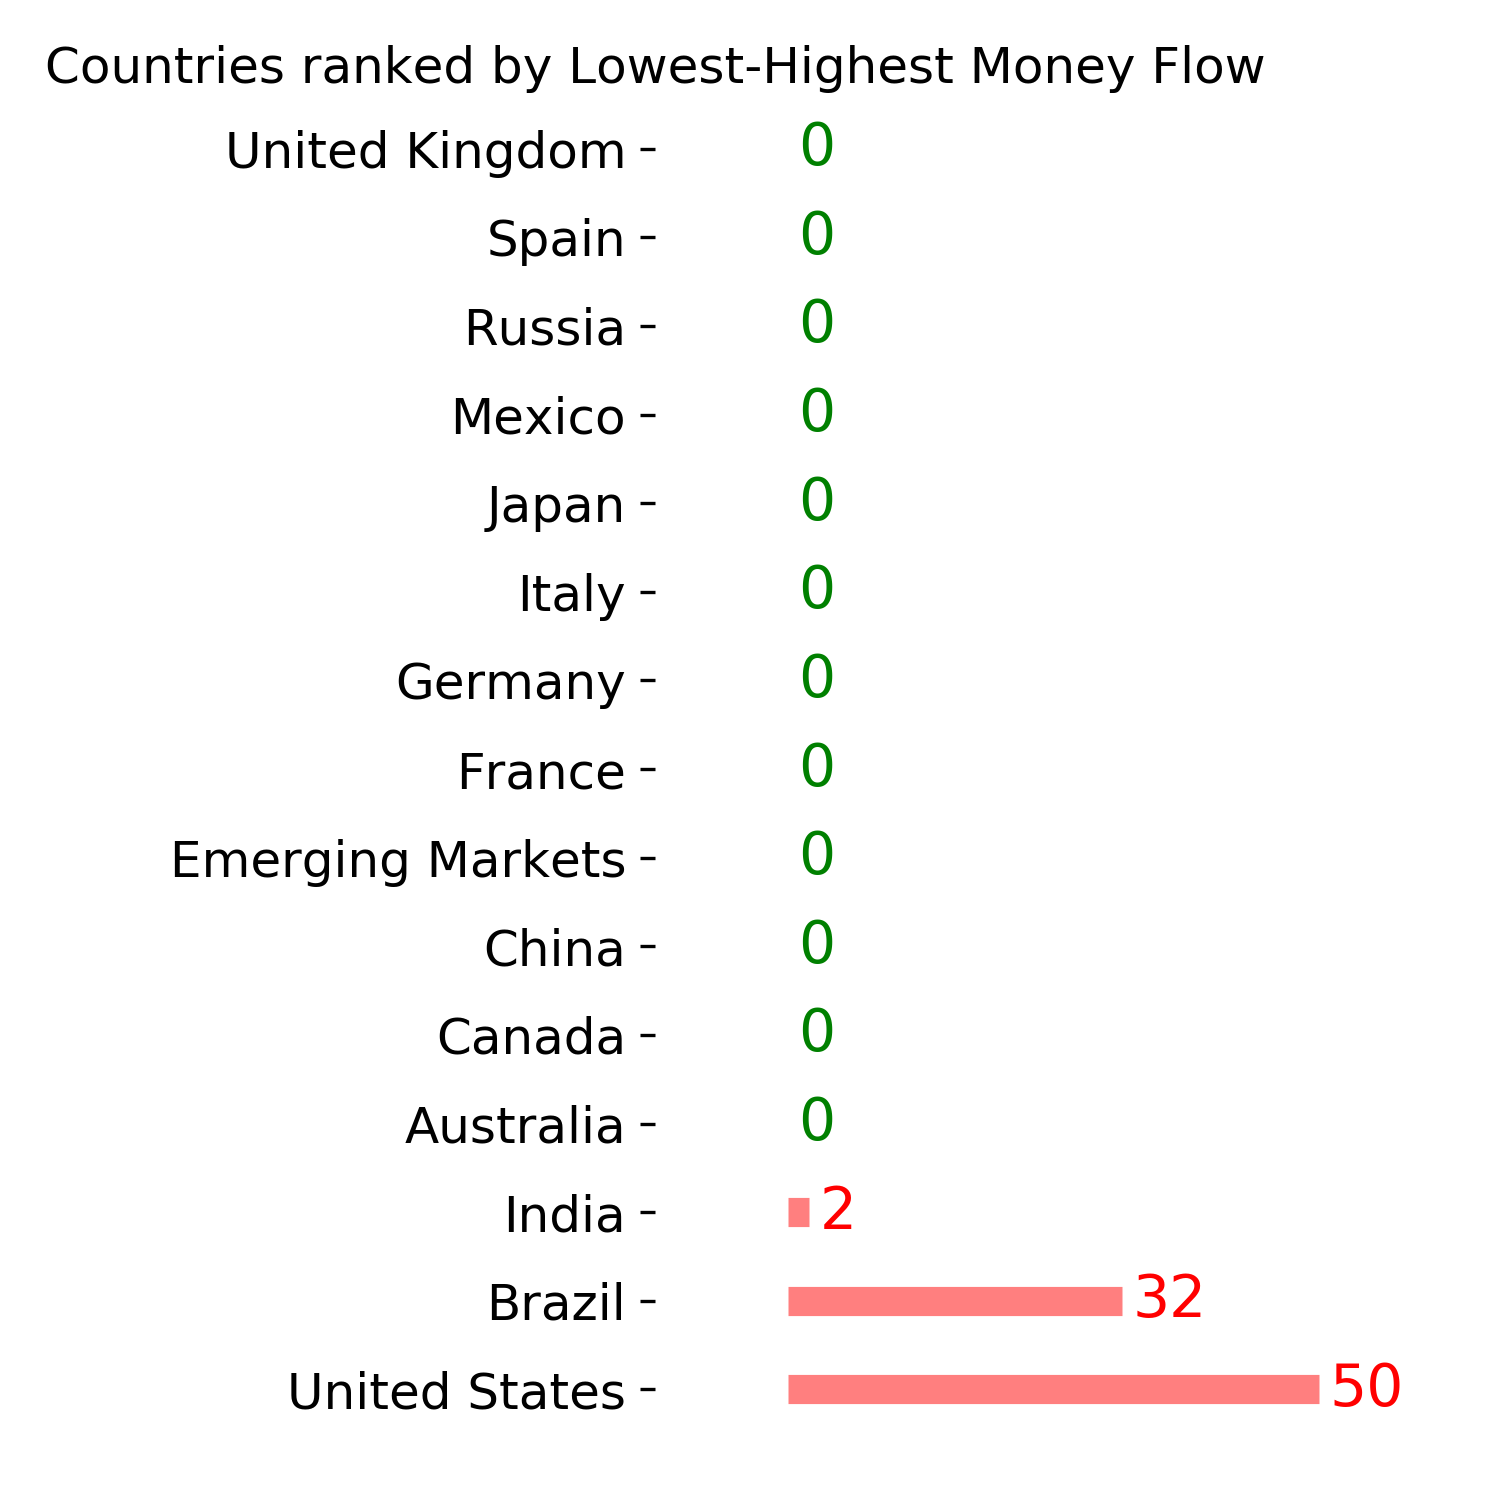
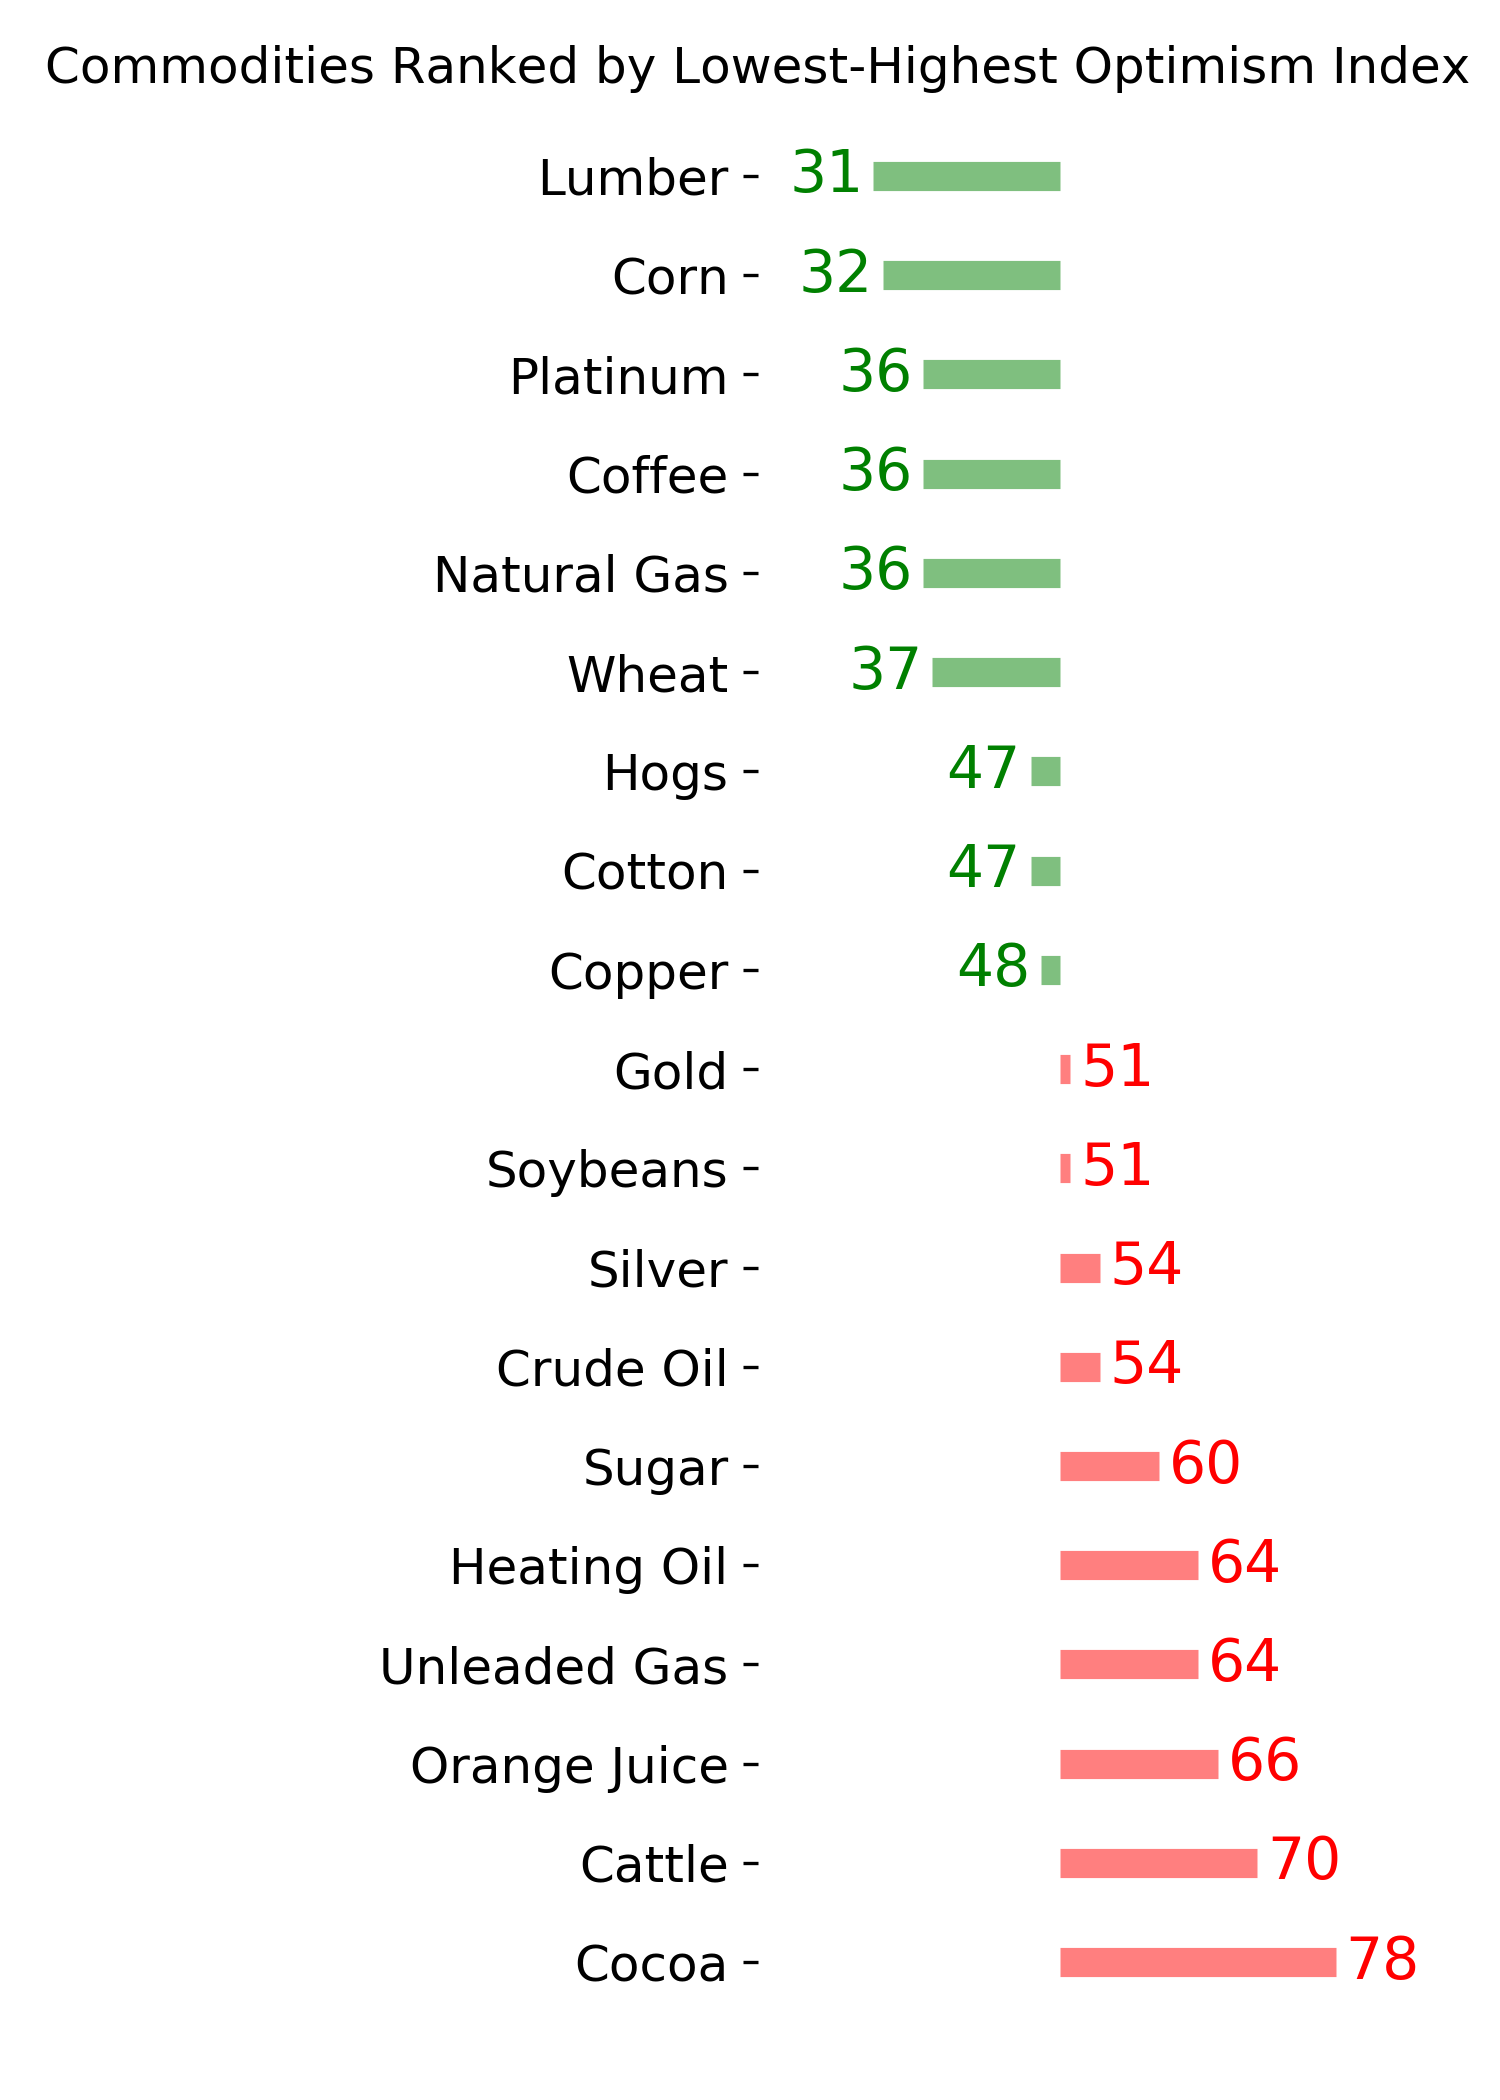
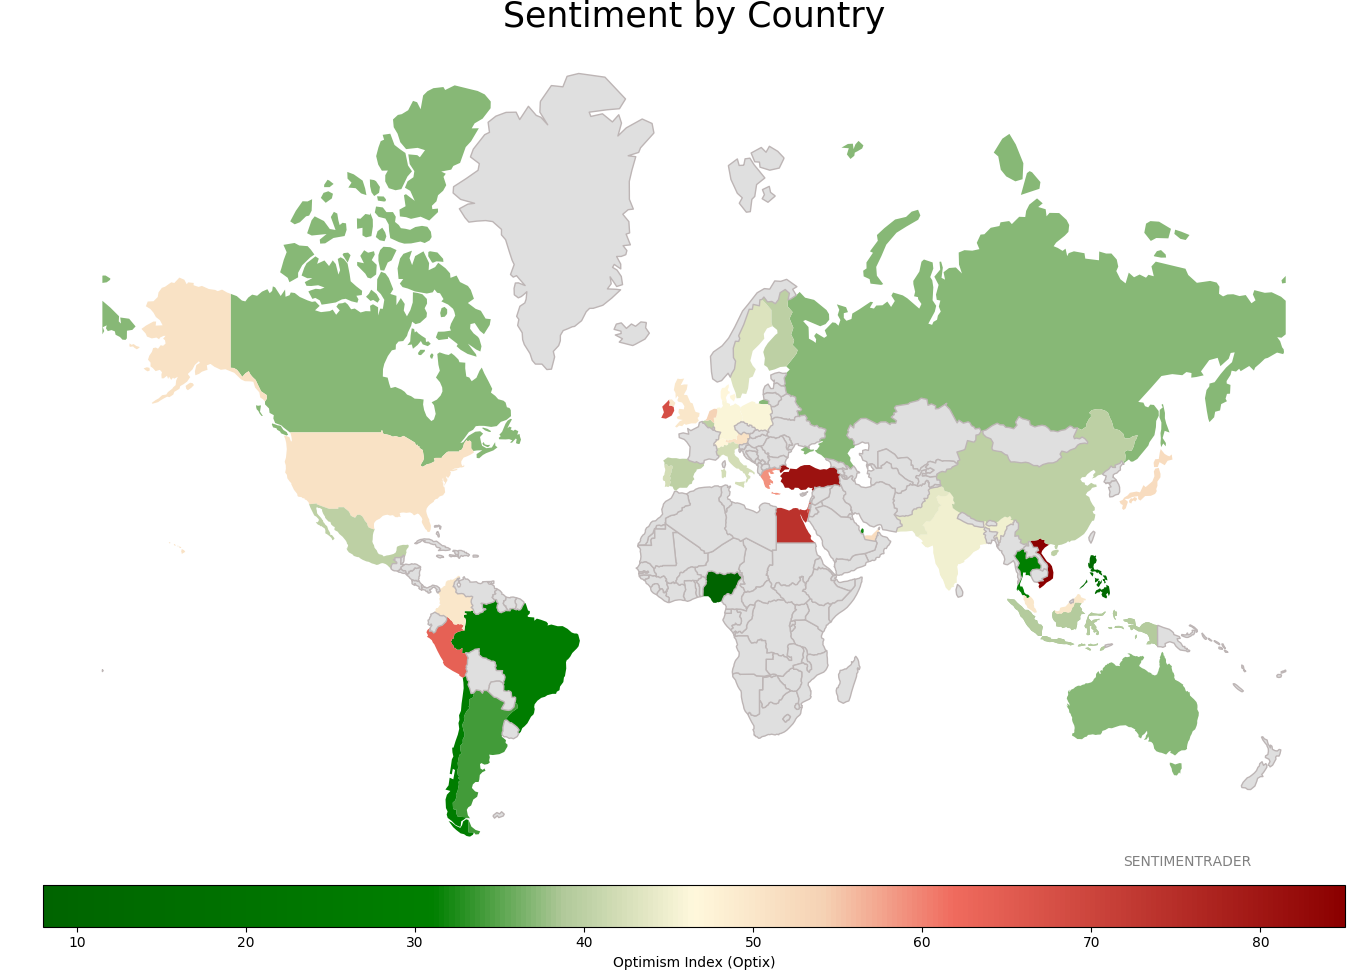
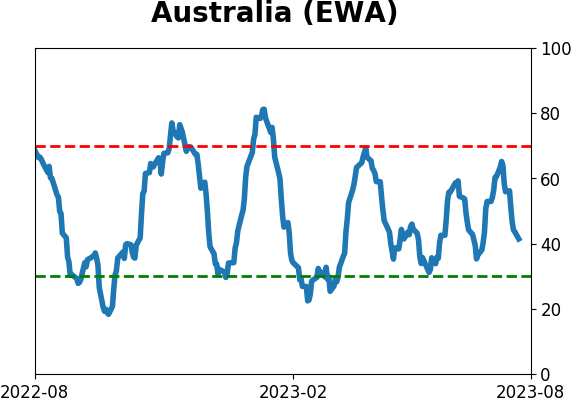
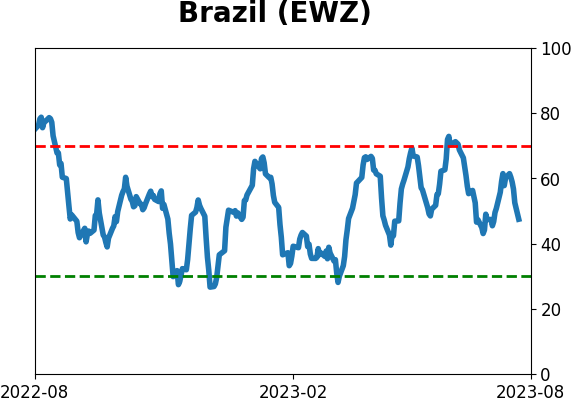
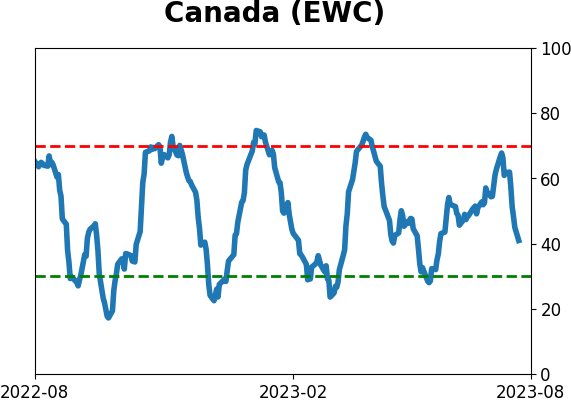
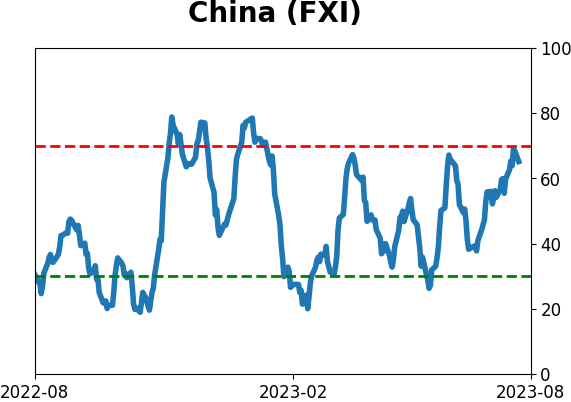
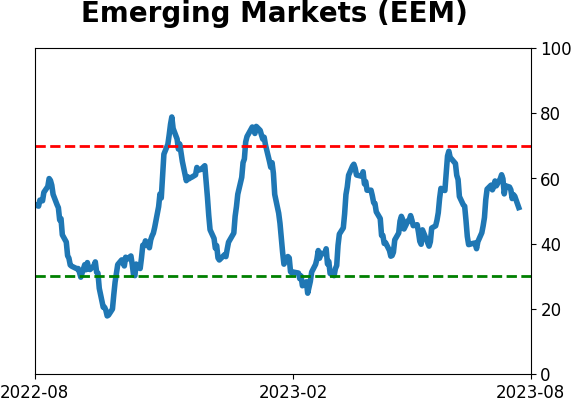
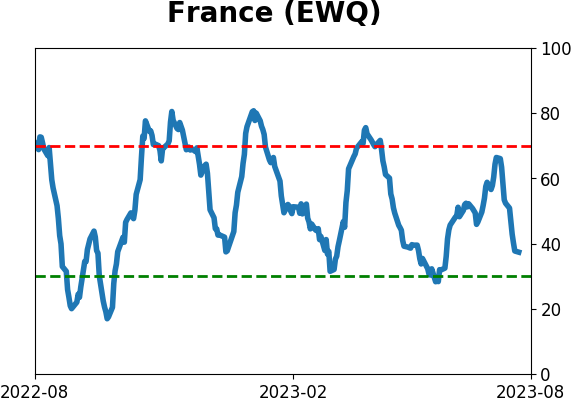
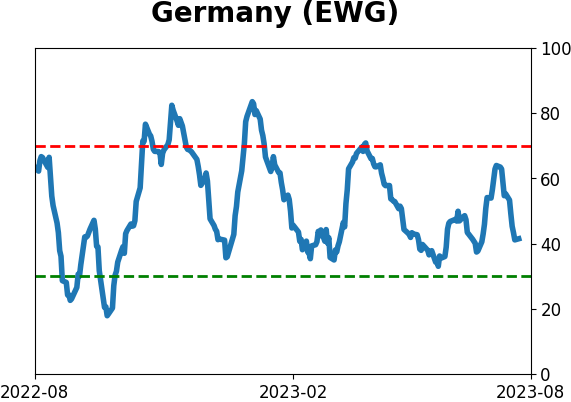
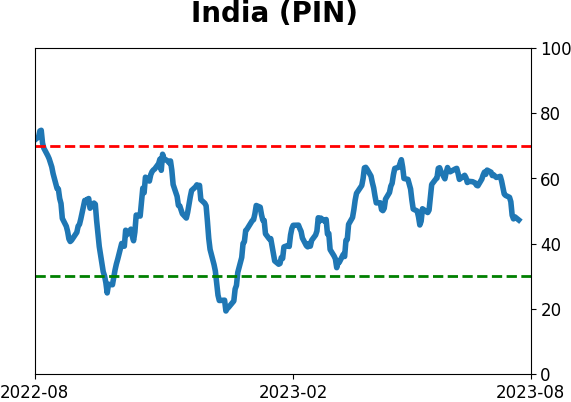
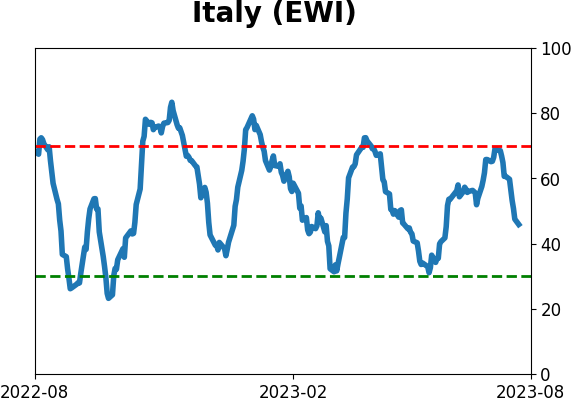
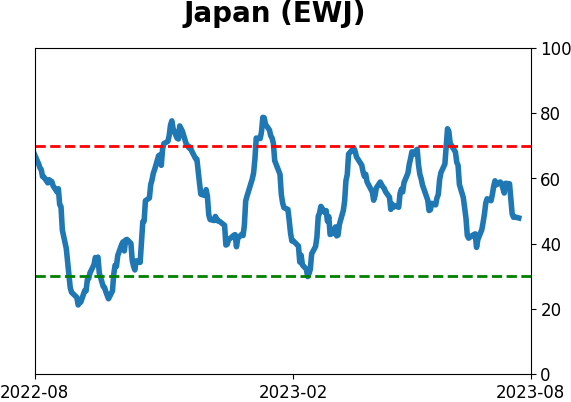
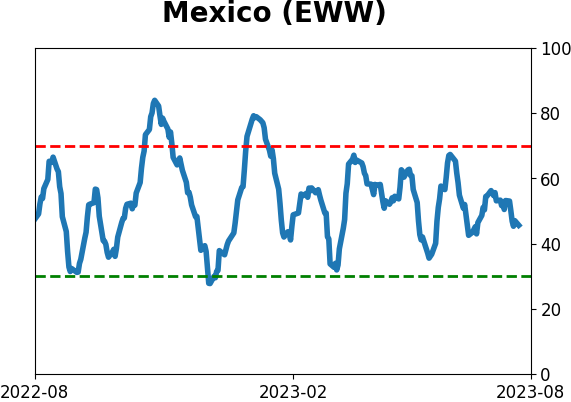
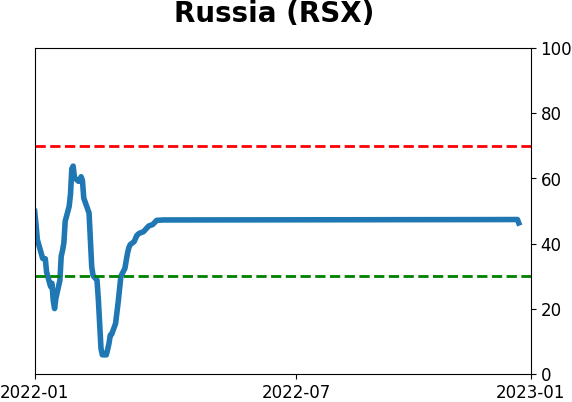
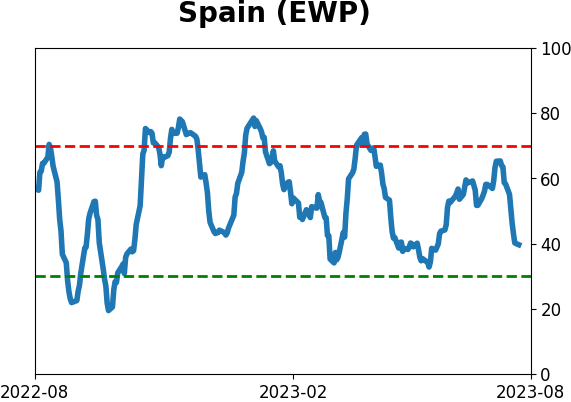
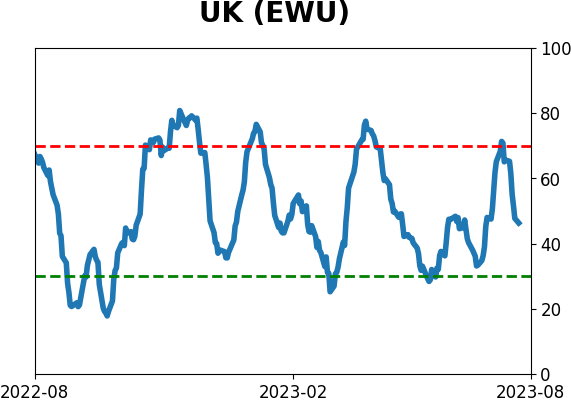
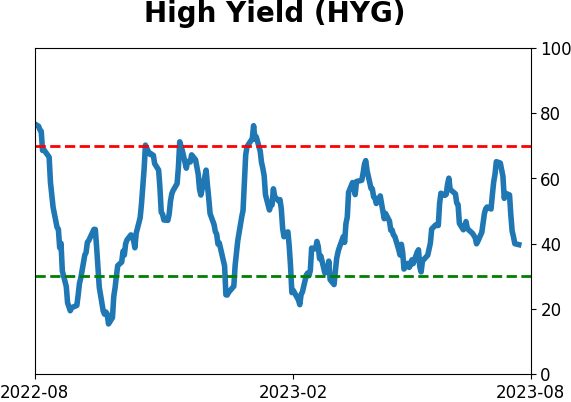
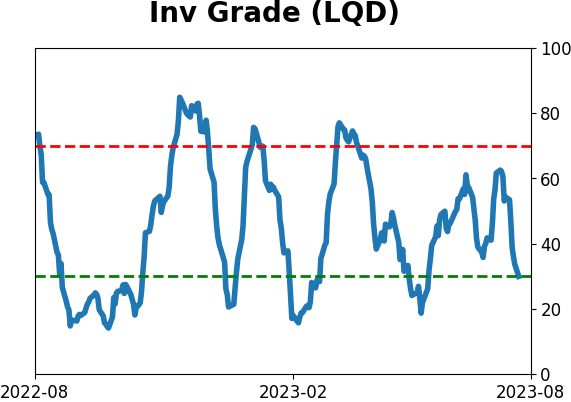
Sentiment Around The World
Optimism Index Thumbnails
|
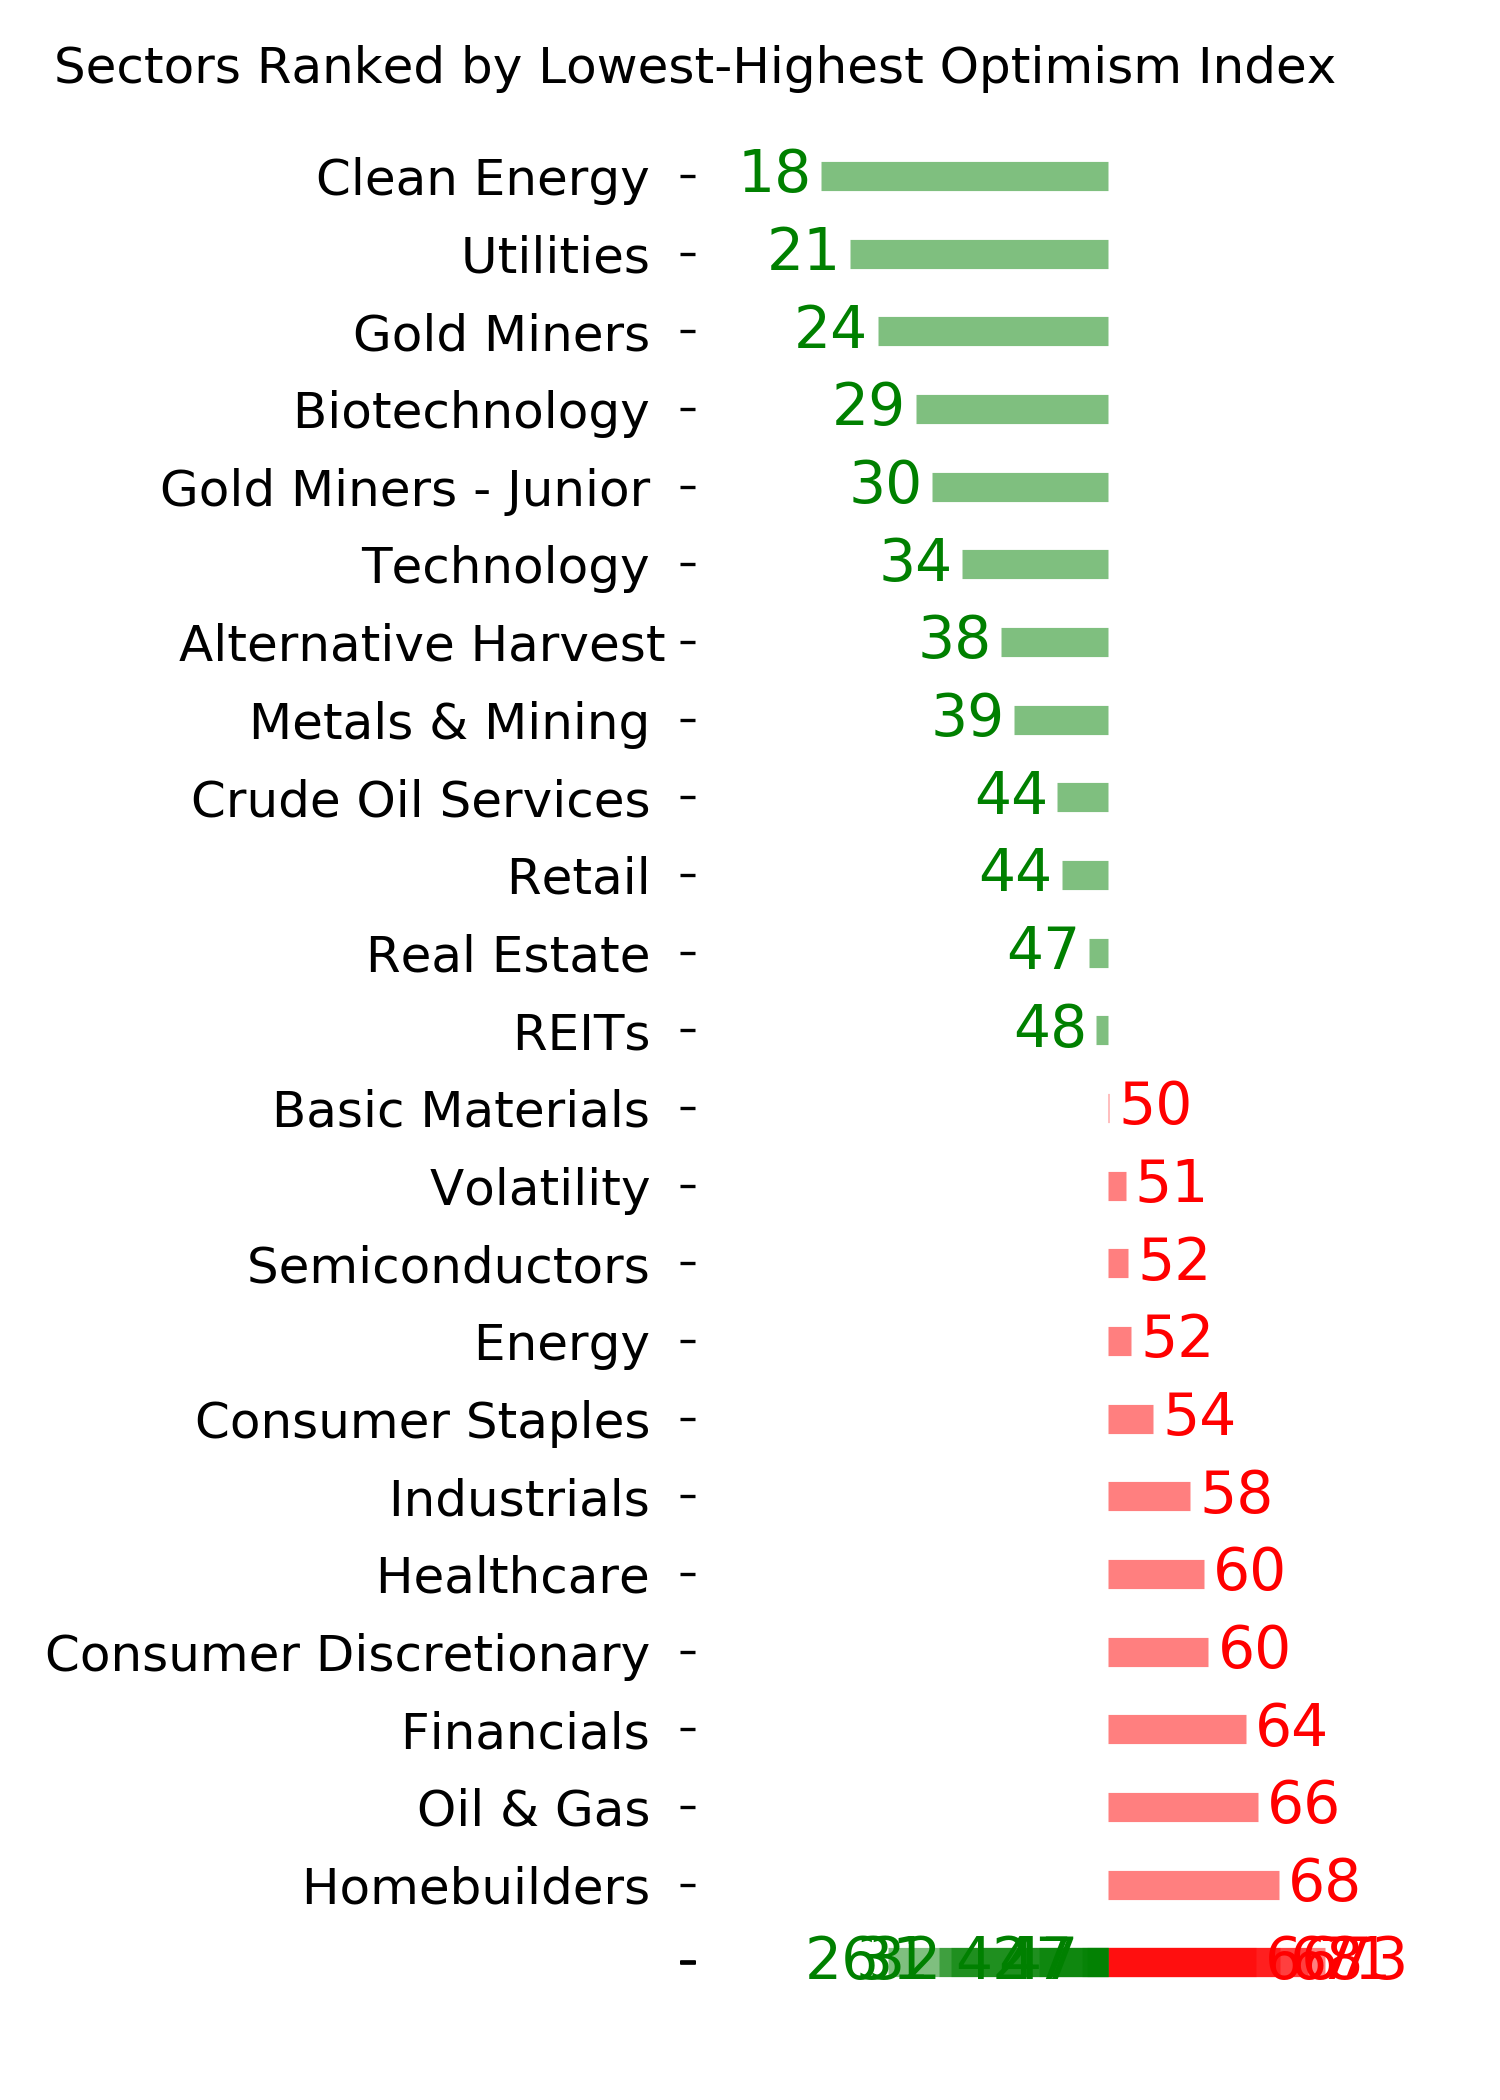
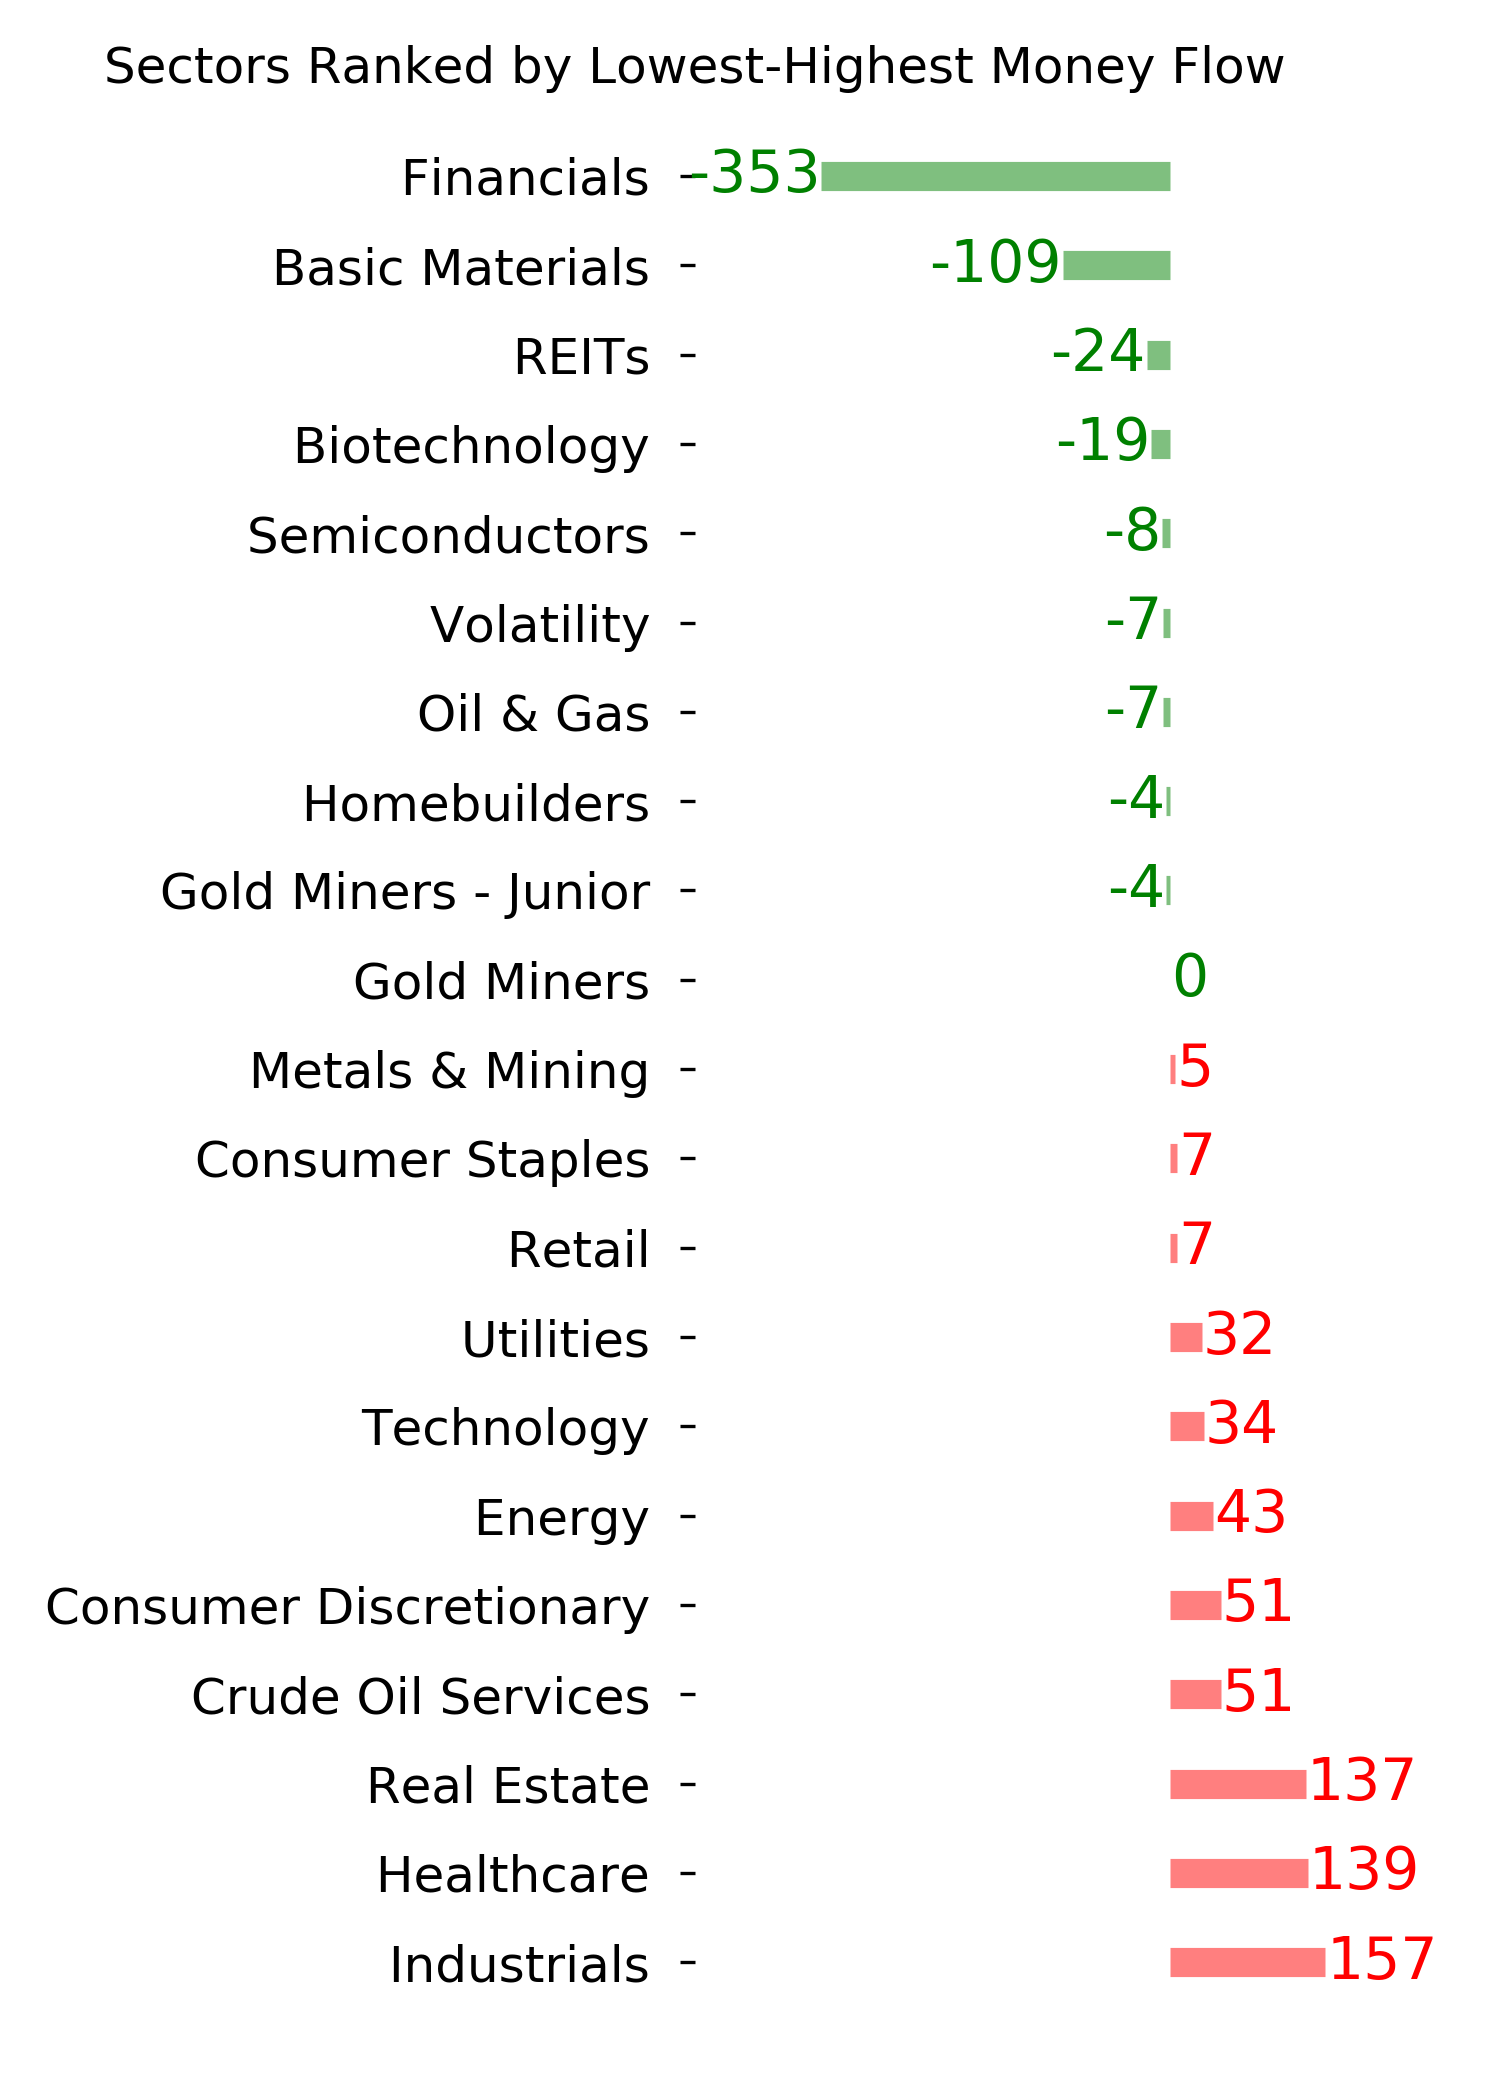
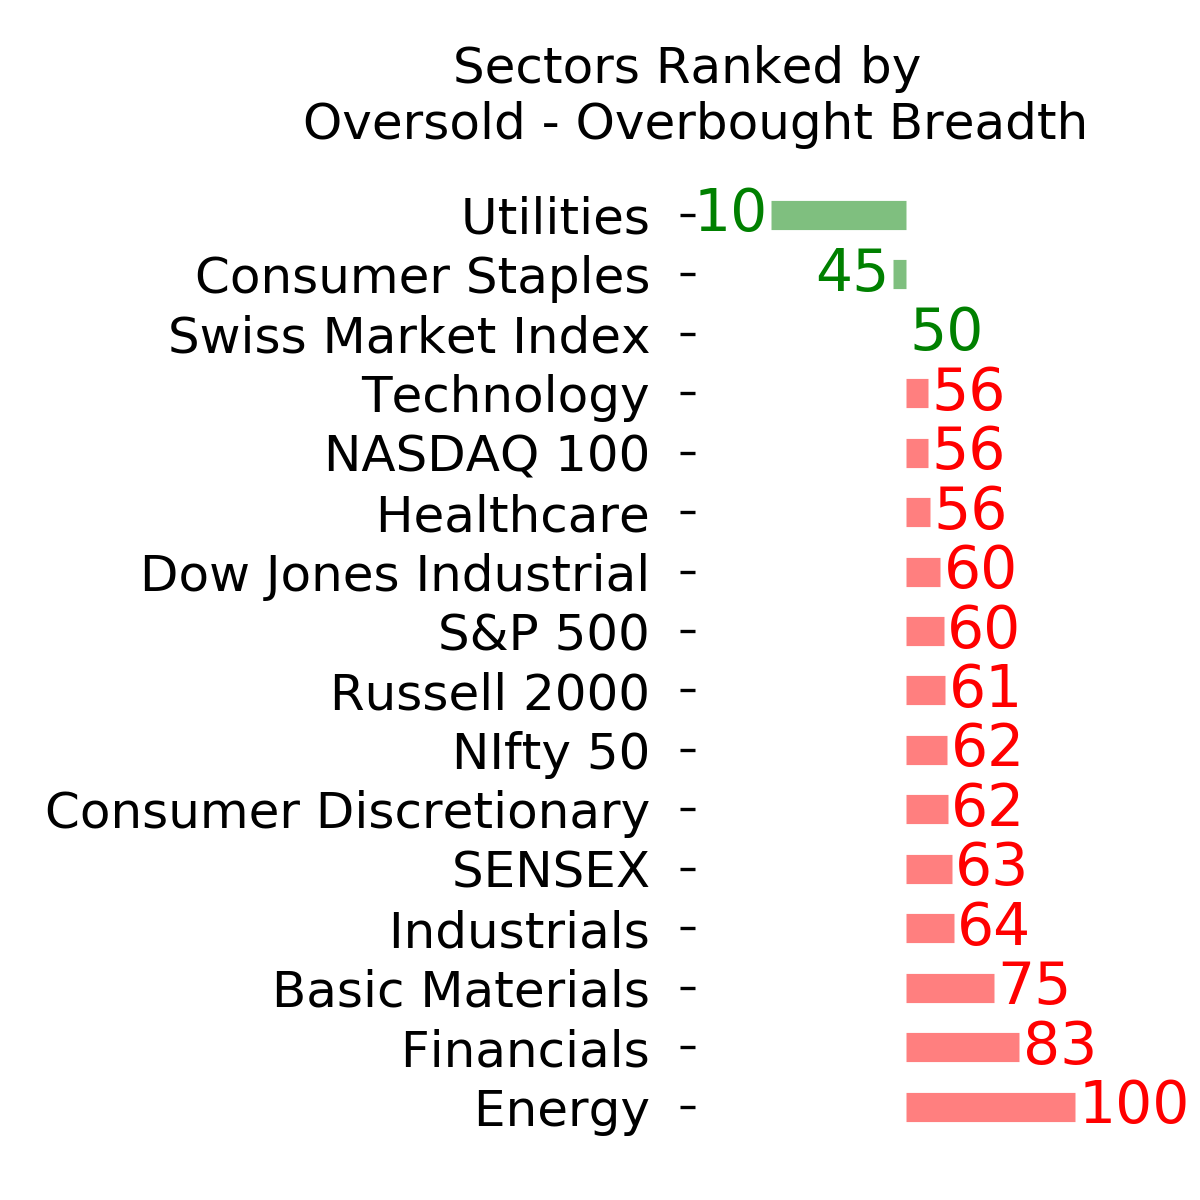
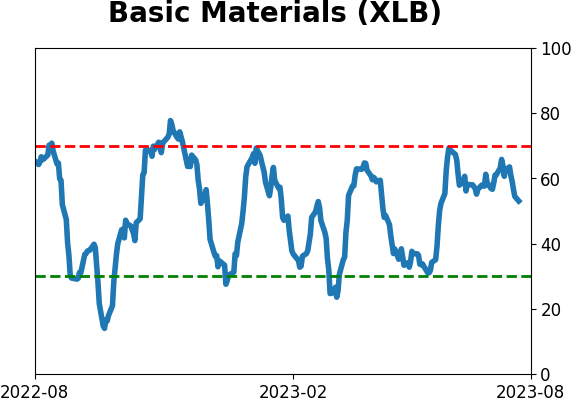
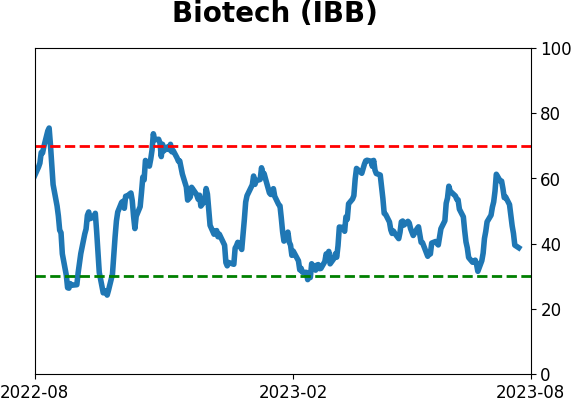
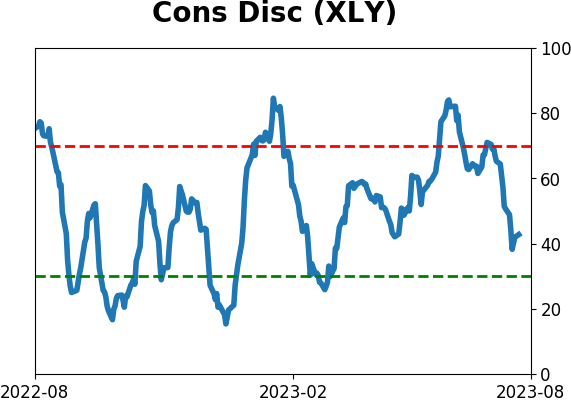
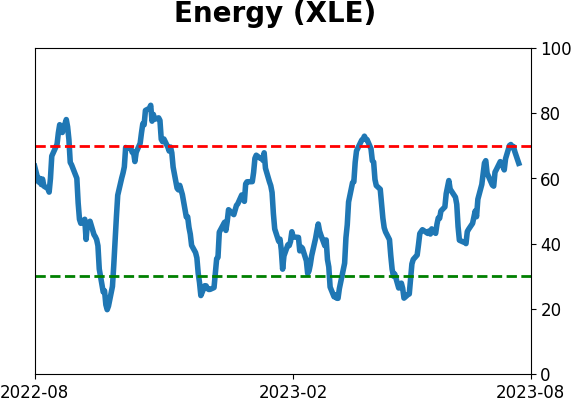
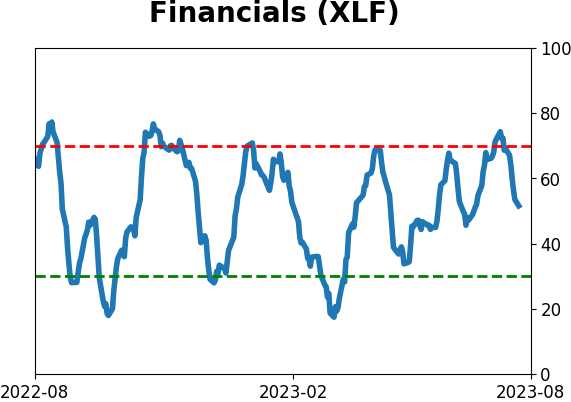
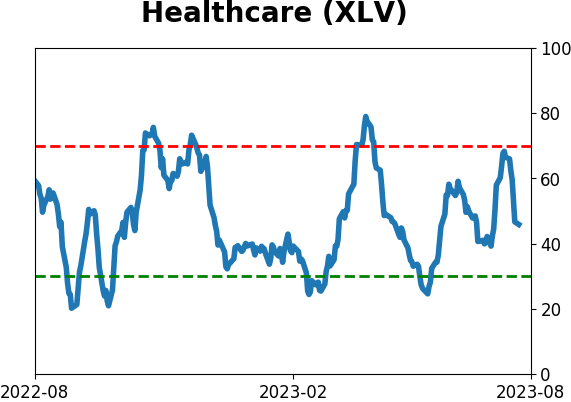
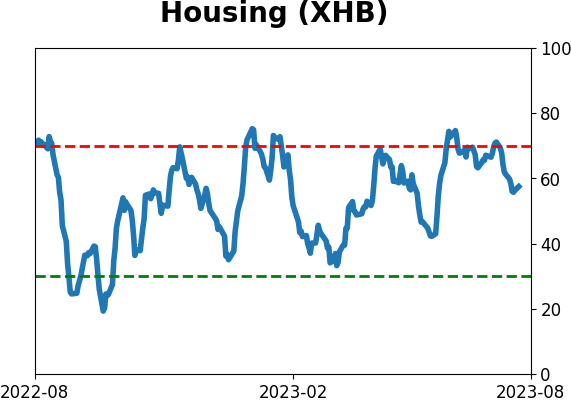
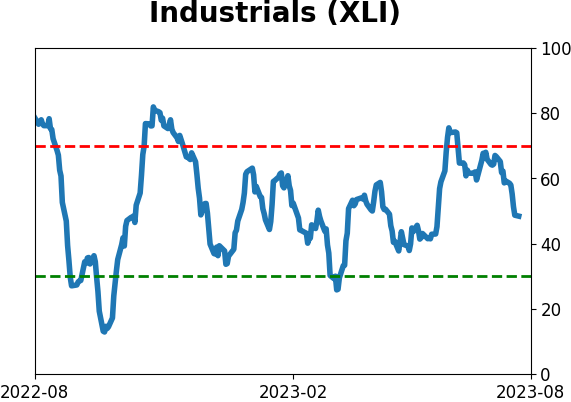
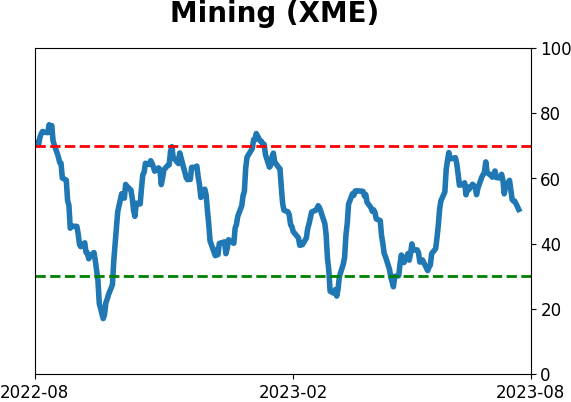
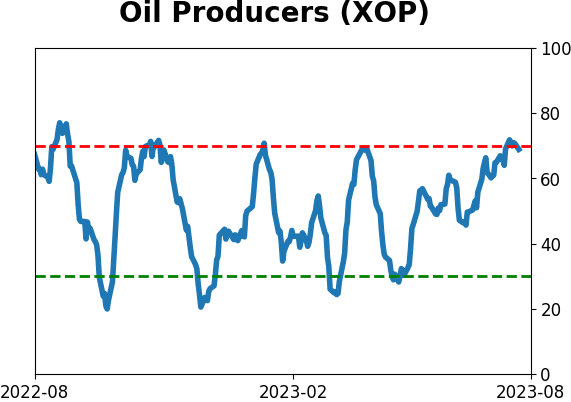
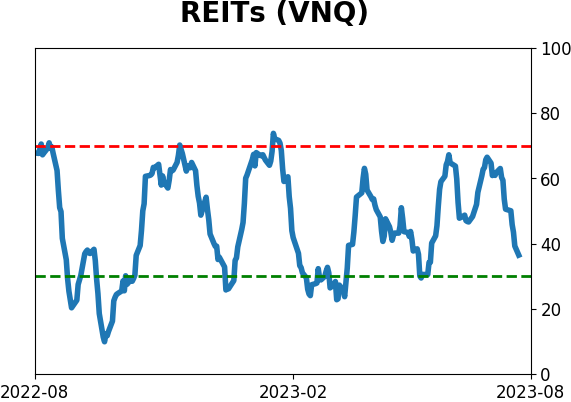
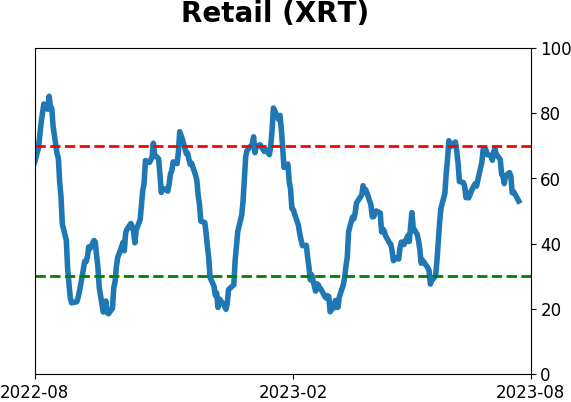
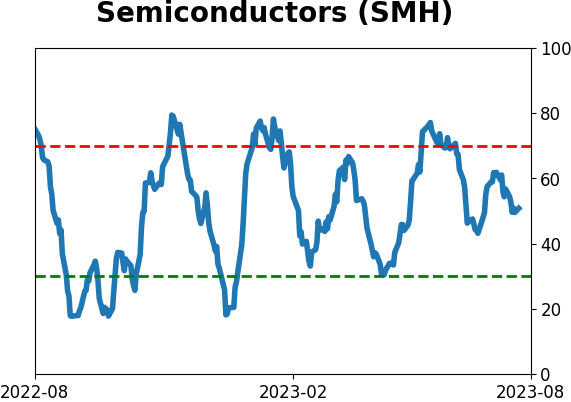
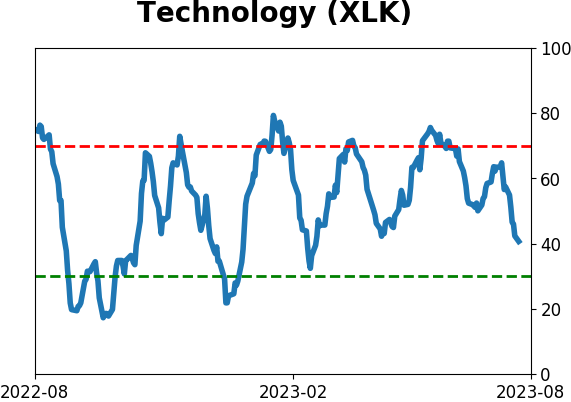
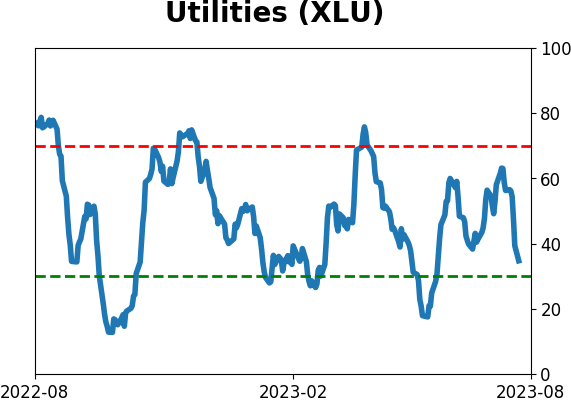
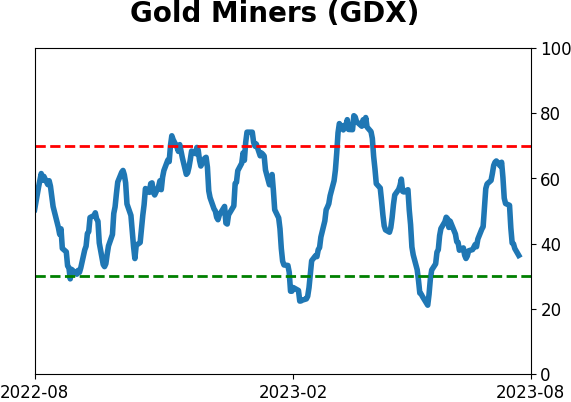
Sector ETF's - 10-Day Moving Average
|
|
|
Country ETF's - 10-Day Moving Average
|
|
|
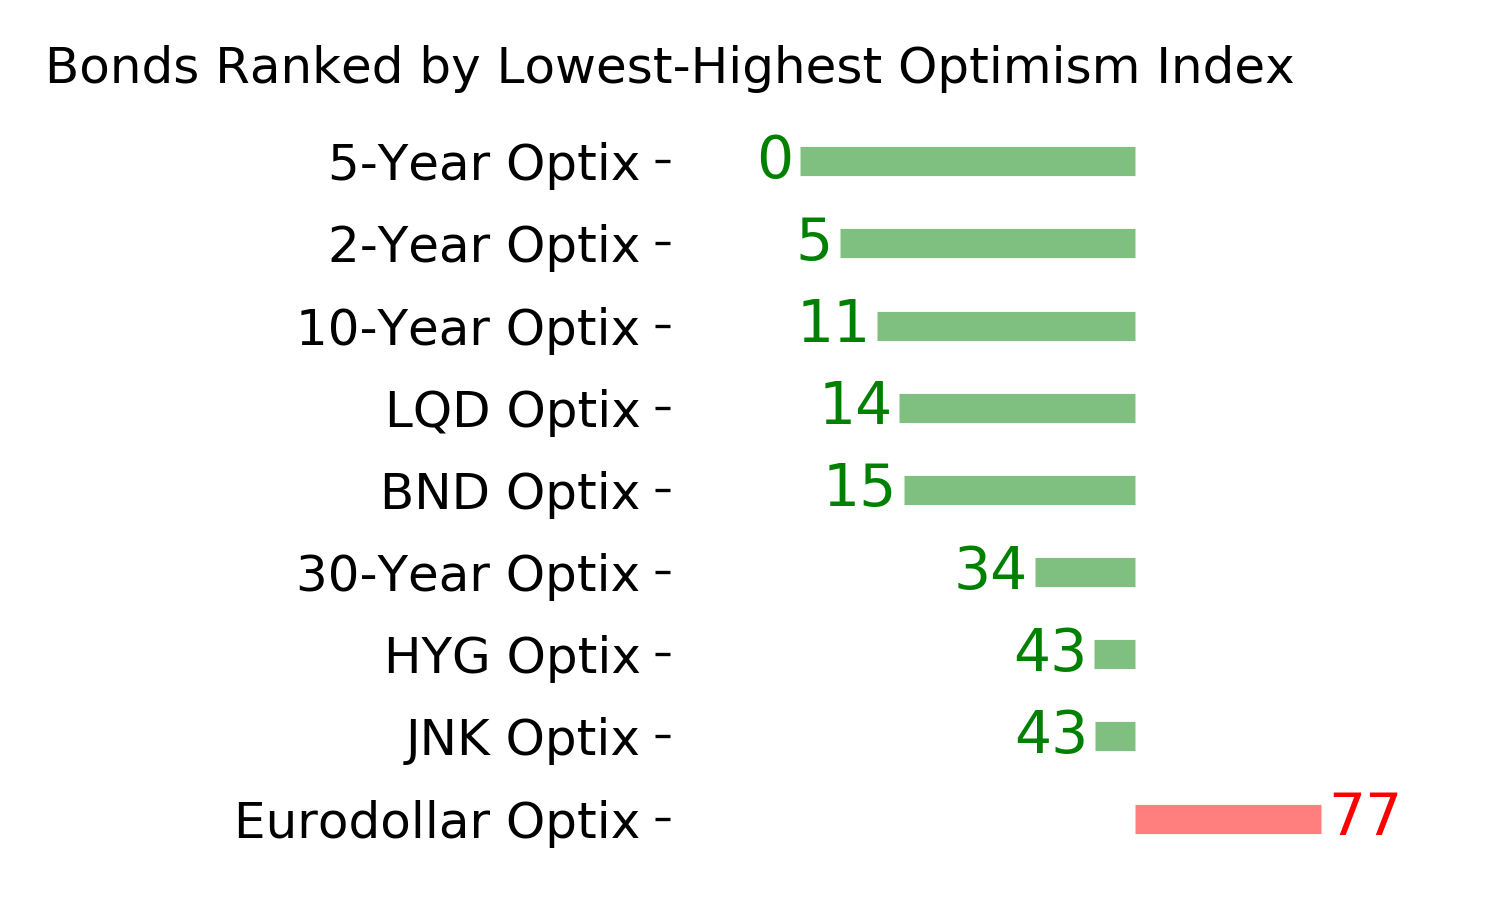
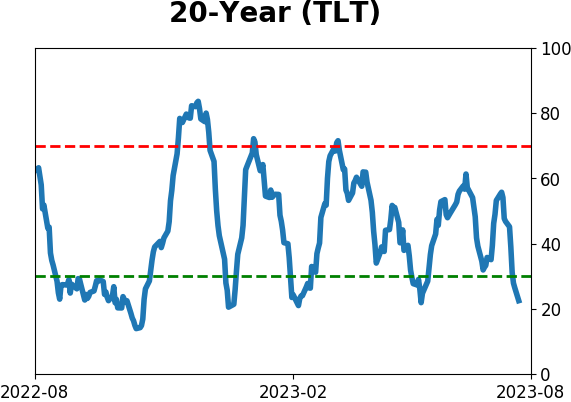
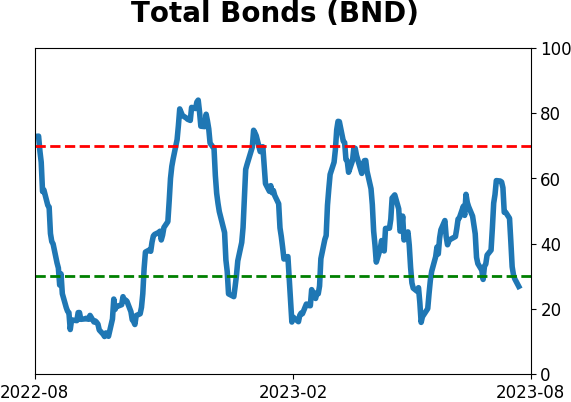
Bond ETF's - 10-Day Moving Average
|
|
|
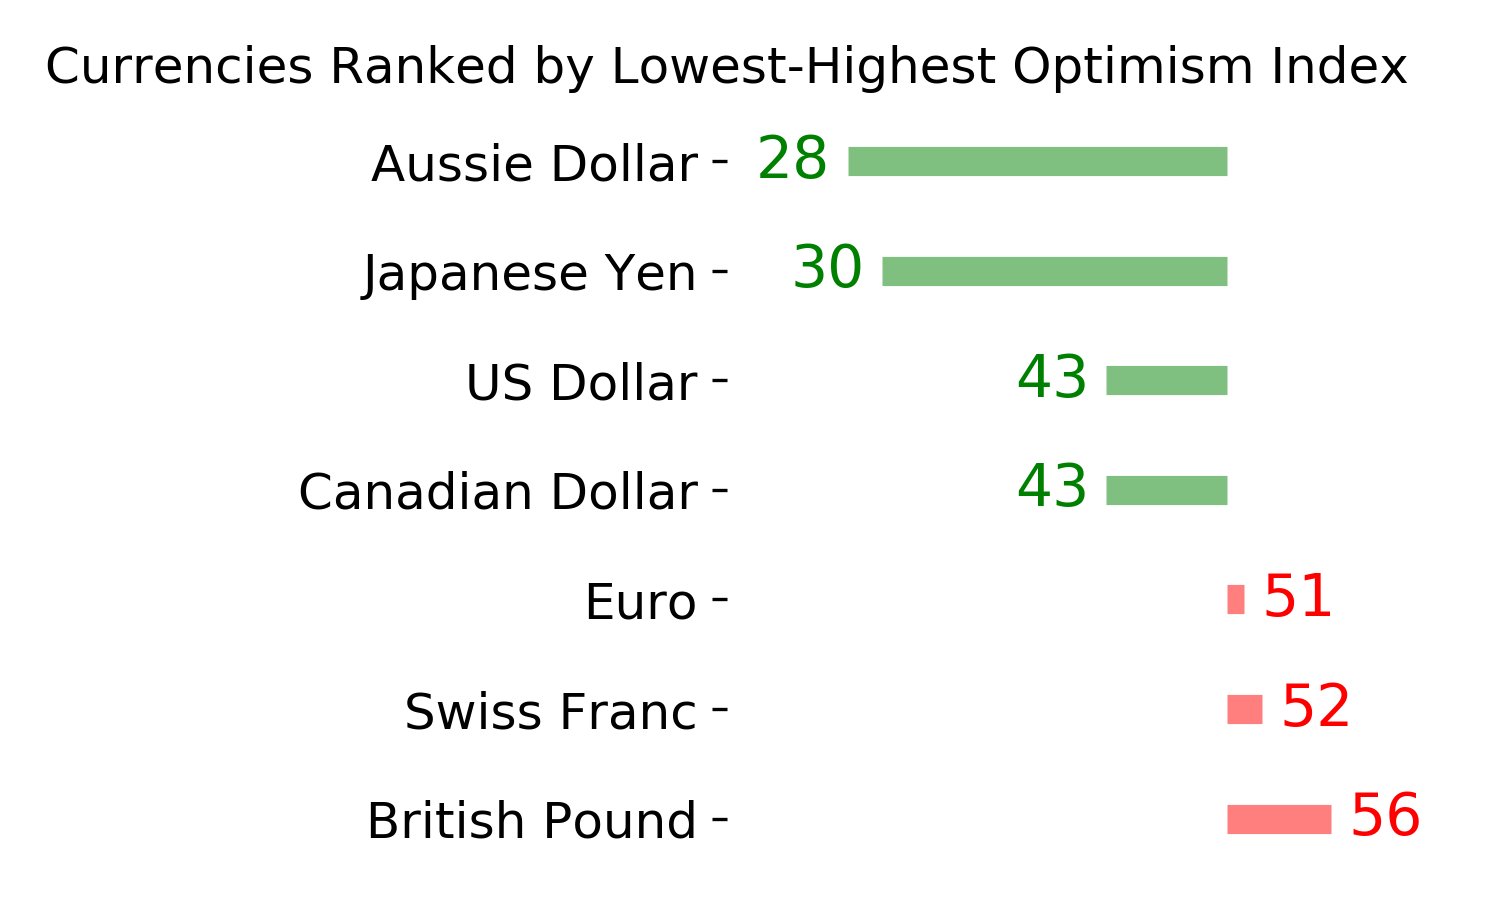
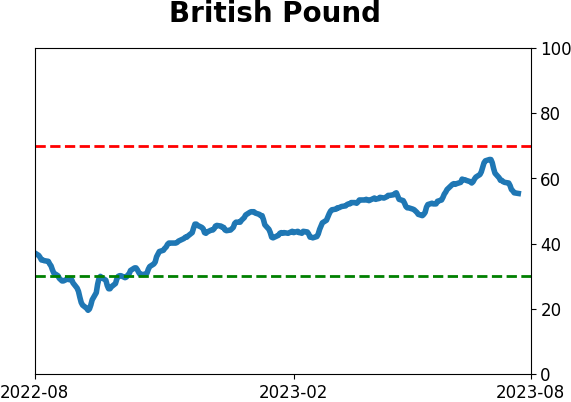
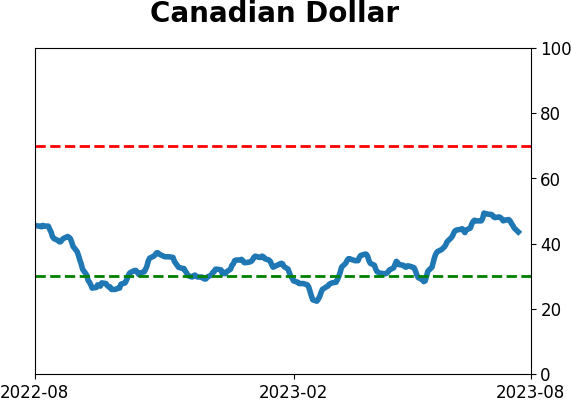
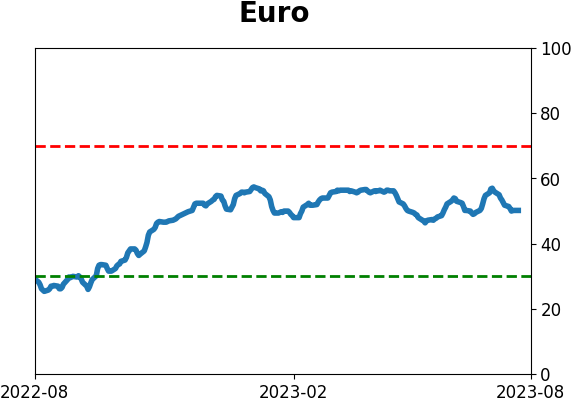
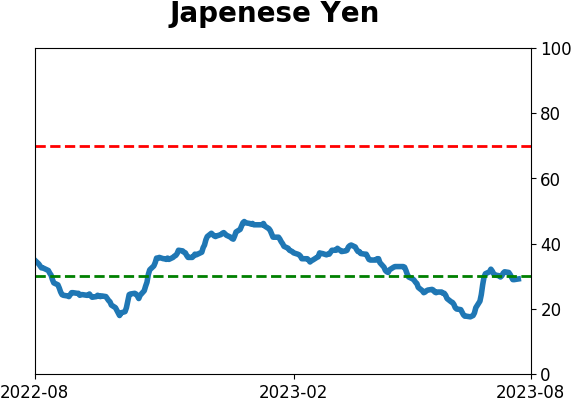
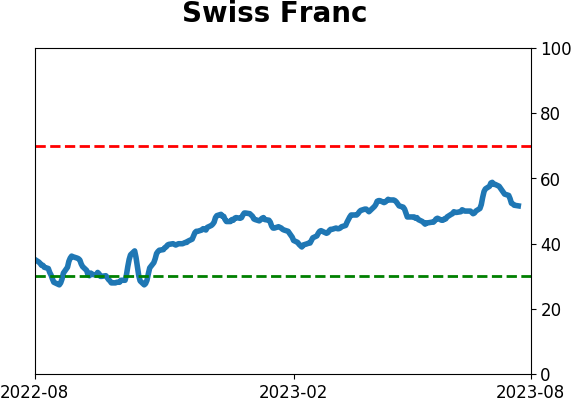
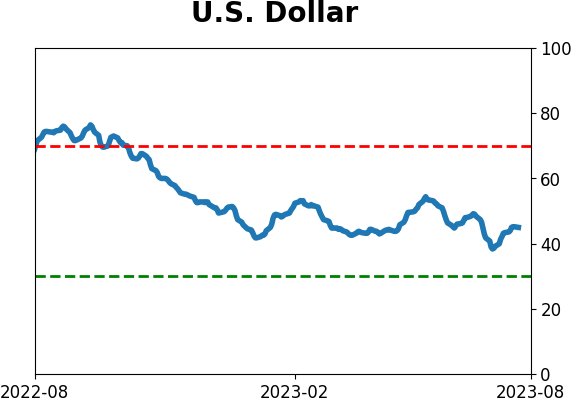
Currency ETF's - 5-Day Moving Average
|
|
|
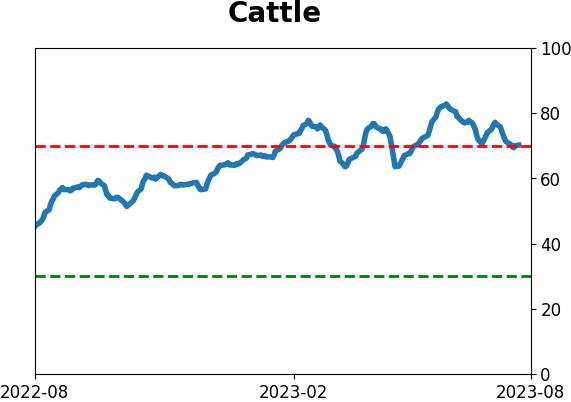
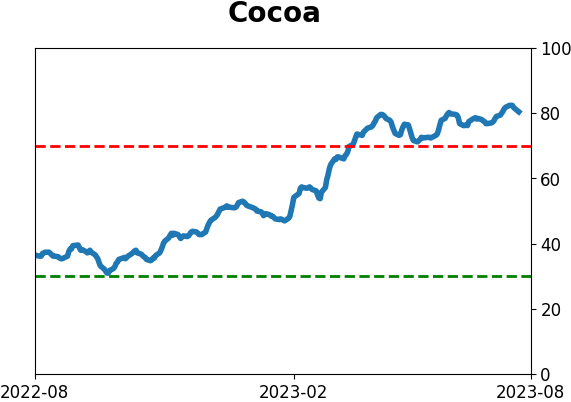
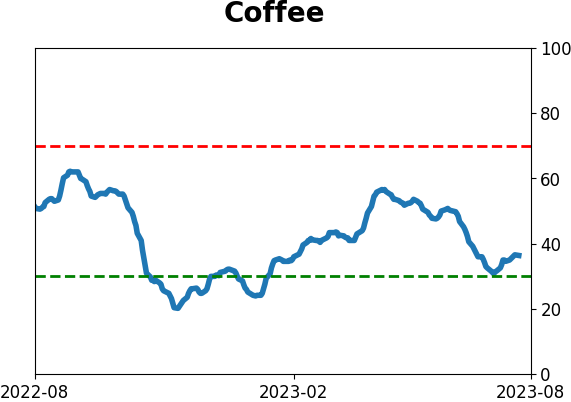
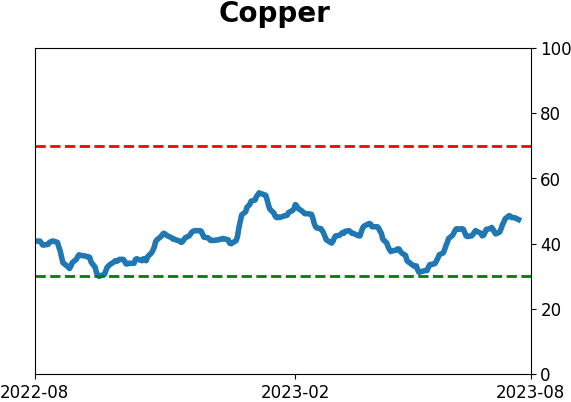
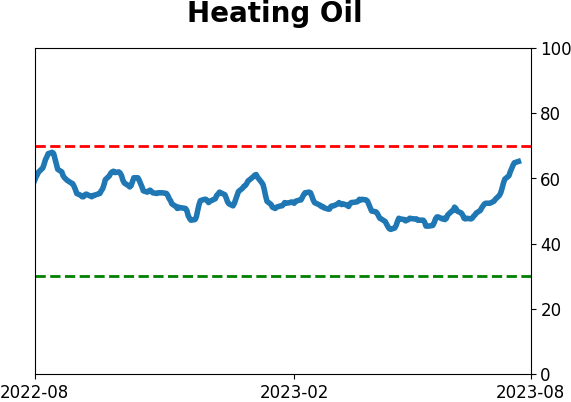
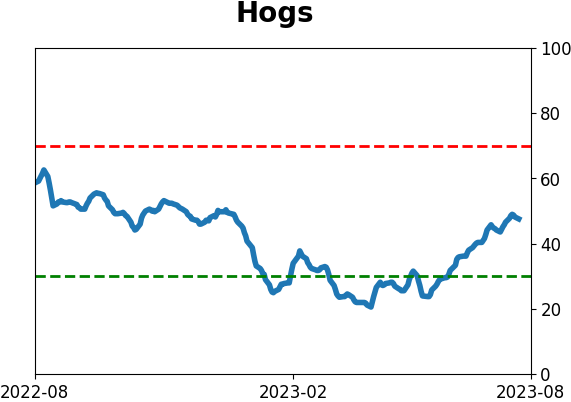
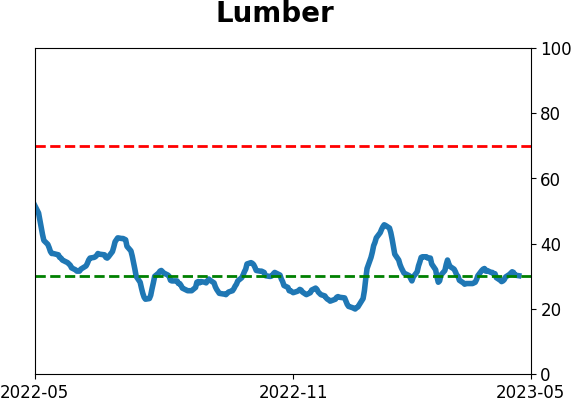
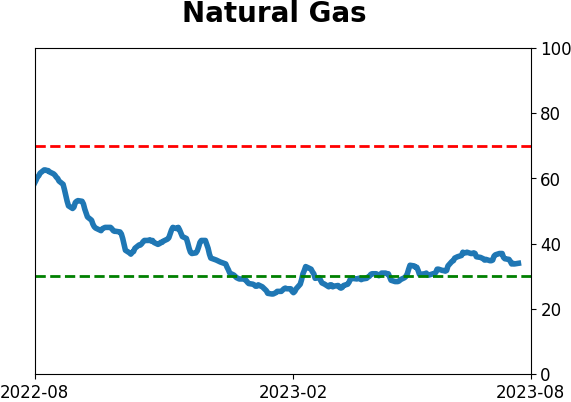
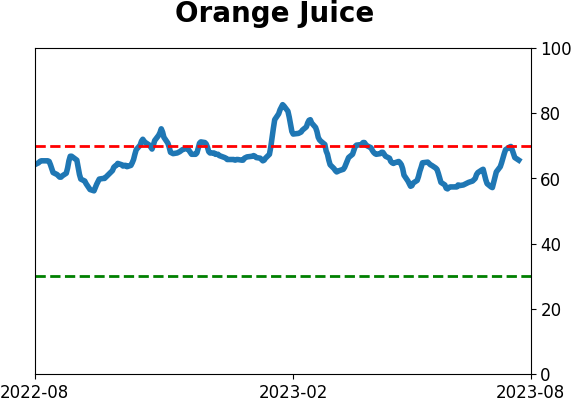
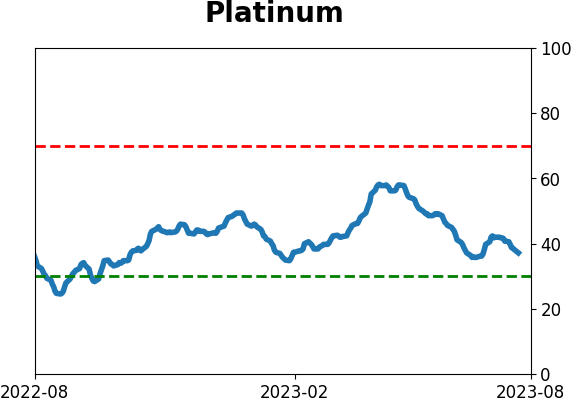
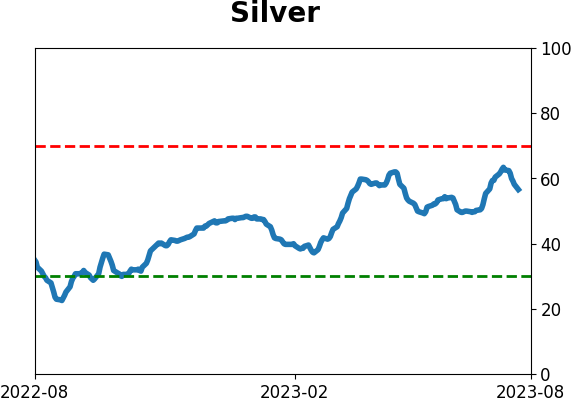
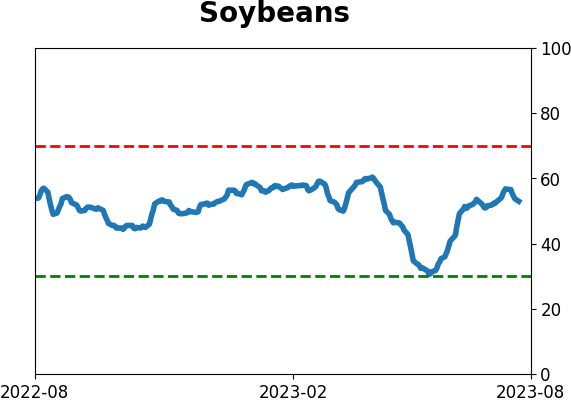
Commodity ETF's - 5-Day Moving Average
|
|