Headlines
|
|
The KOSPI suffers a historic selling panic:
The carnage in Japanese stocks received most of the worldwide headlines in recent days, but South Korea's KOSPI index got hit nearly as hard. The two-day selling spree was among its worst in 40 years. Selling pressure was so widespread that the Panic Breadth Composite indicator spiked to a rarely-seen level that has preceded large rebounds.
|
Smart / Dumb Money Confidence
|
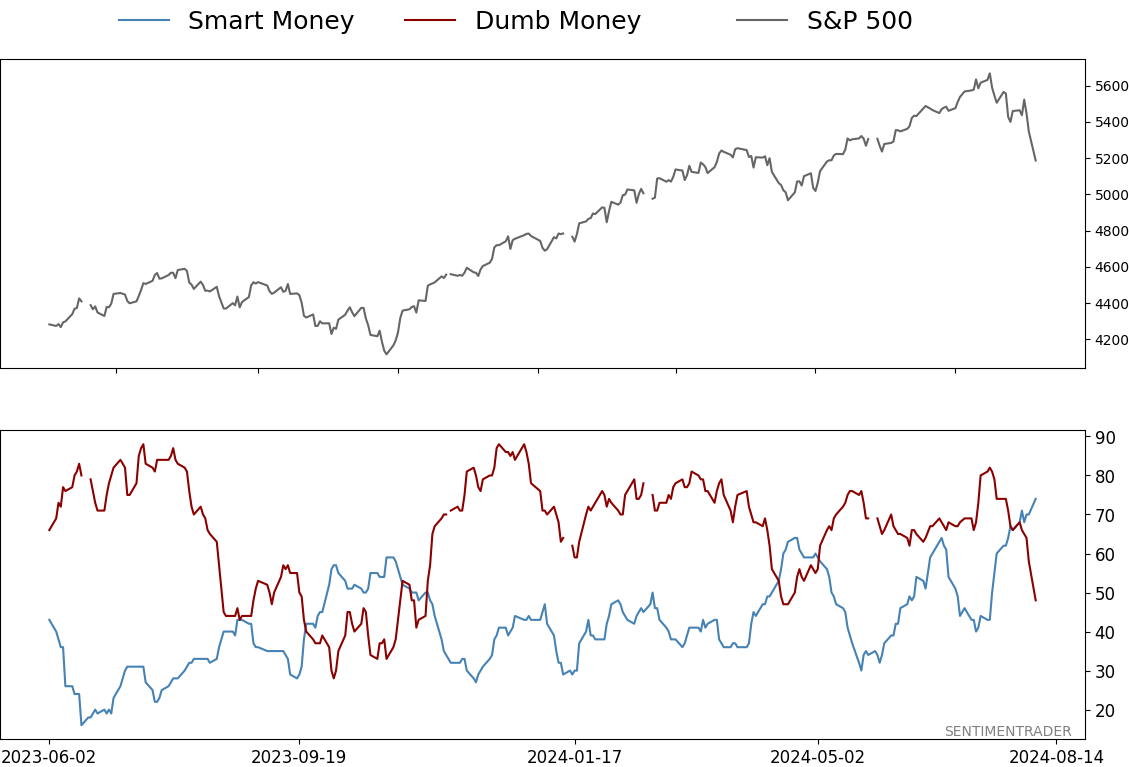
Smart Money Confidence: 74%
Dumb Money Confidence: 48%
|
|
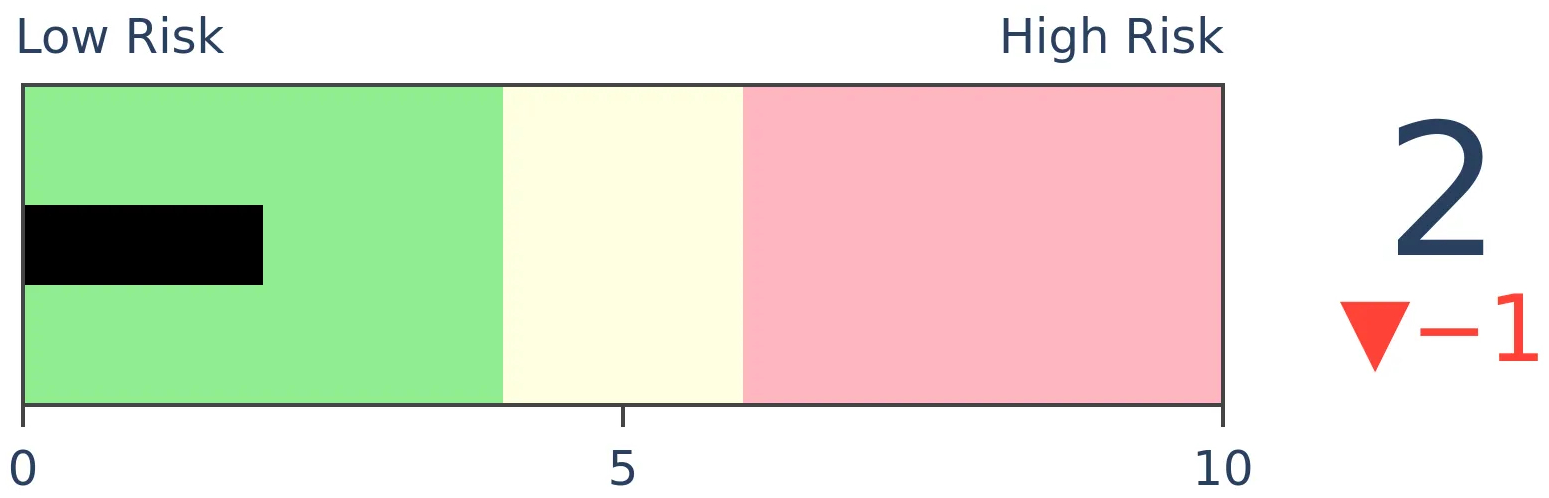
Risk Levels
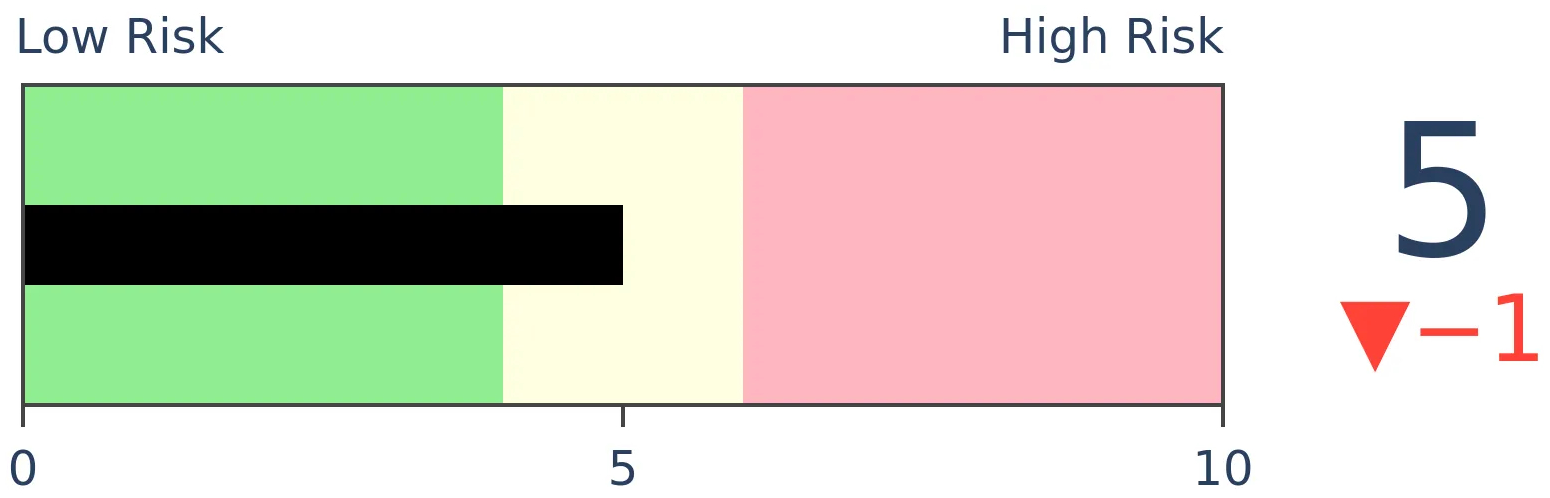
Stocks Short-Term
|
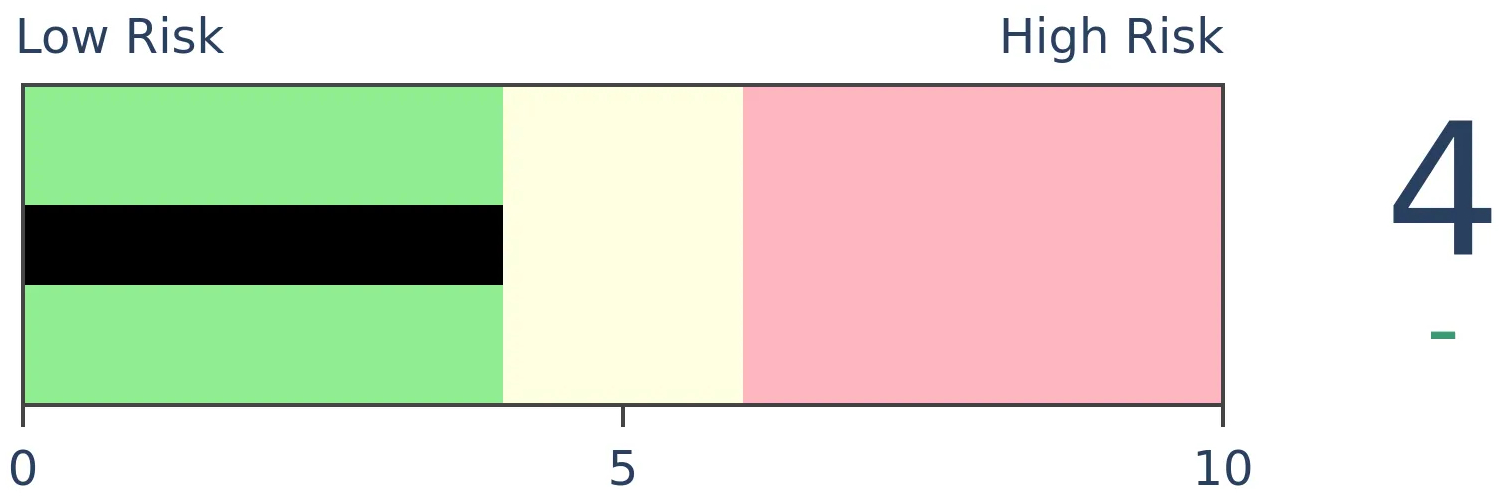
Stocks Medium-Term
|
|
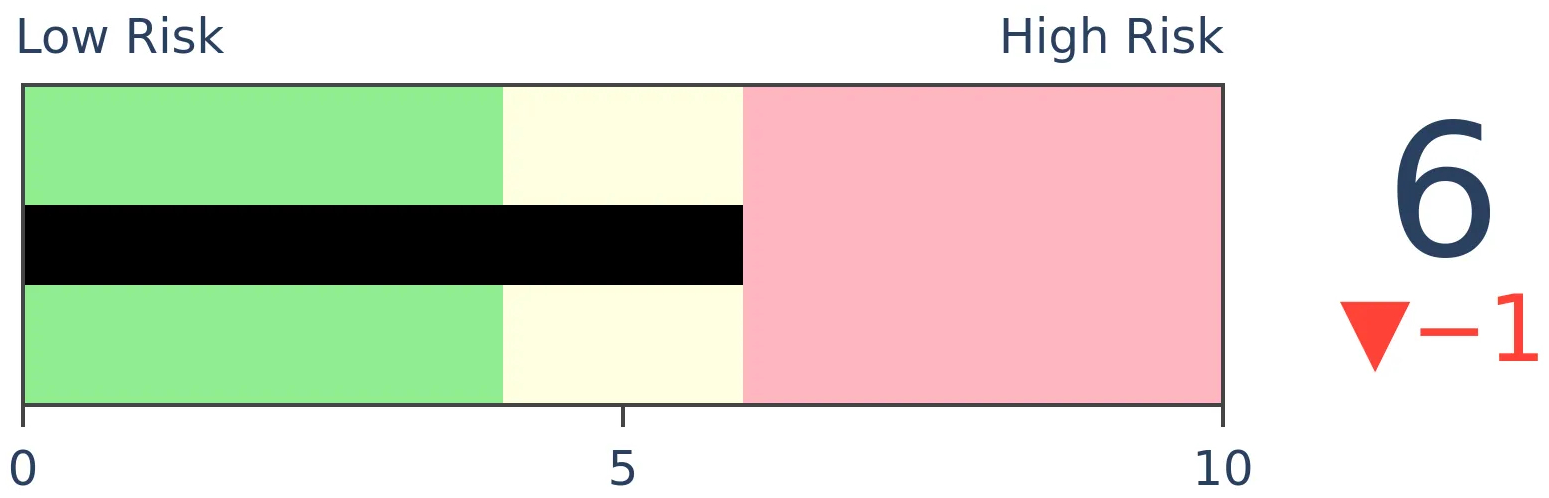
Bonds
|
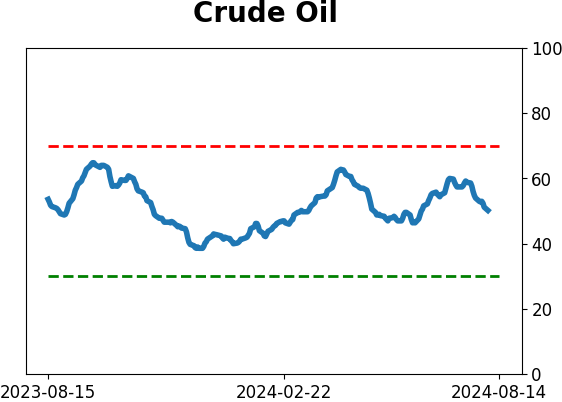
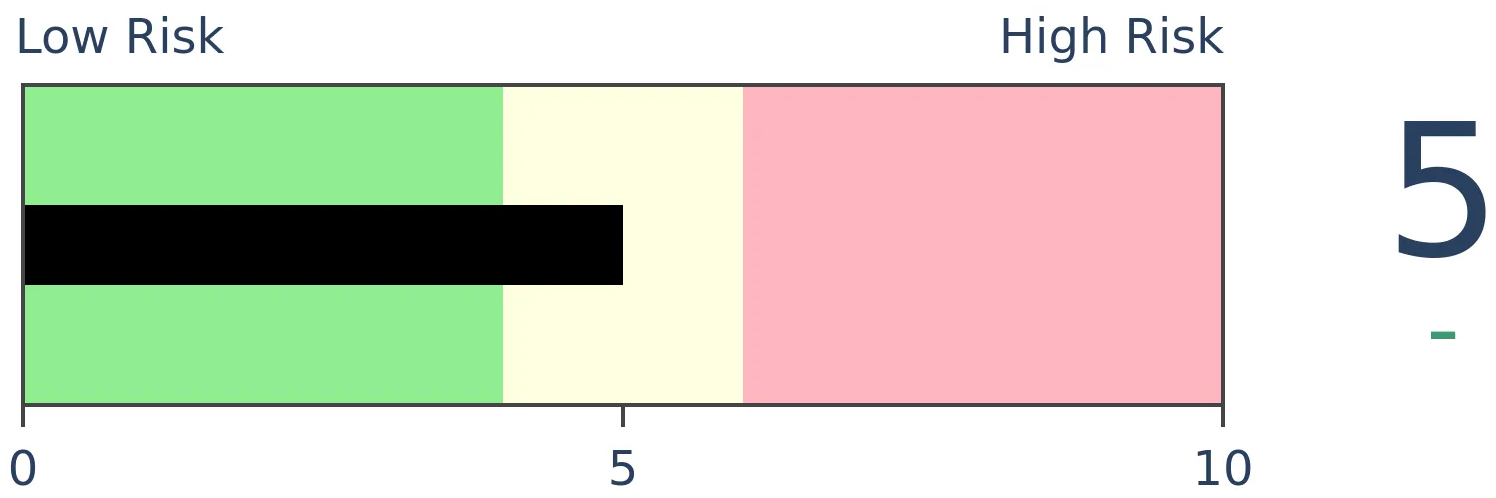
Crude Oil

|
|
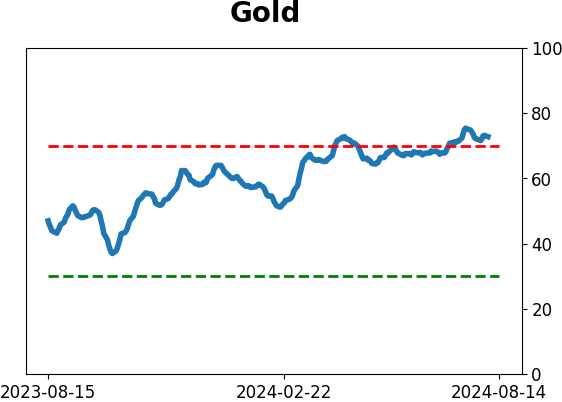
Gold
|
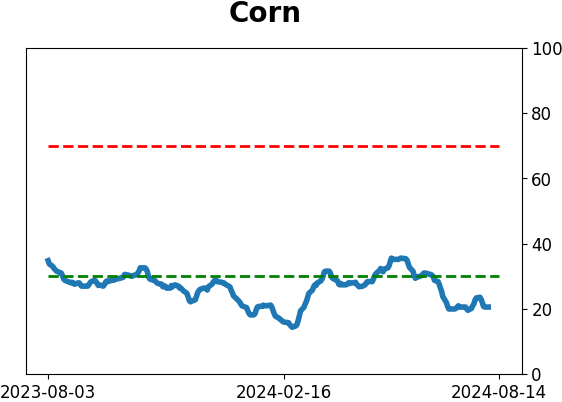
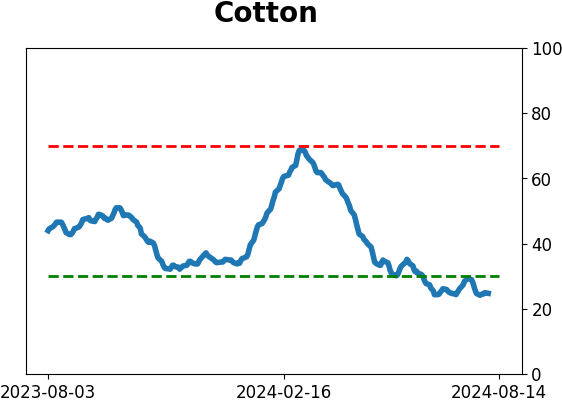
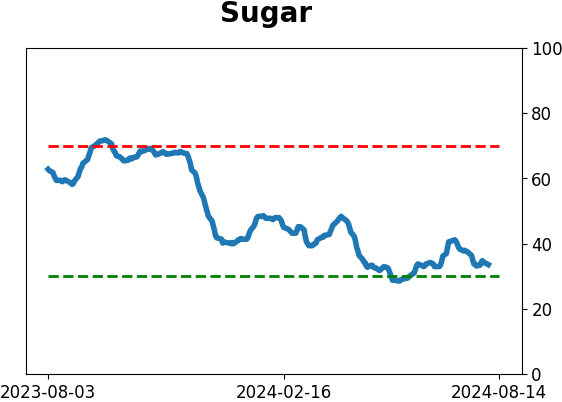
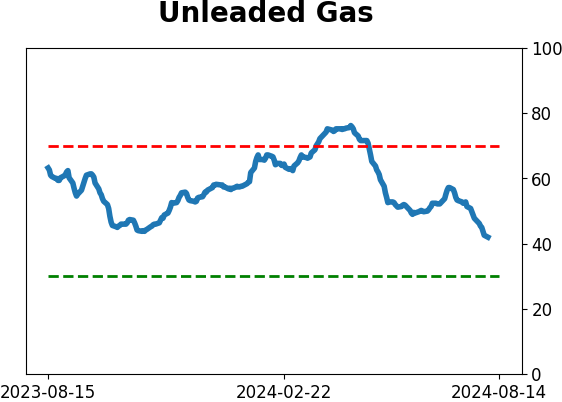
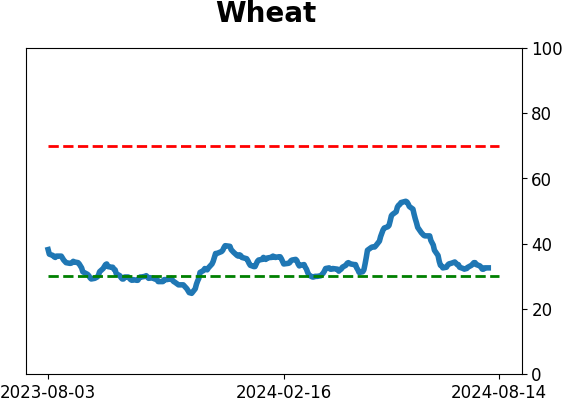
Agriculture
|
|
Research
By Jason Goepfert
BOTTOM LINE
The carnage in Japanese stocks received most of the worldwide headlines in recent days, but South Korea's KOSPI index got hit nearly as hard. The two-day selling spree was among its worst in 40 years. Selling pressure was so widespread that the Panic Breadth Composite indicator spiked to a rarely-seen level that has preceded large rebounds.
FORECAST / TIMEFRAME
EWY -- Up, Long-Term
|
Key points:
- Asian markets have been battered, with South Korea's KOSPI index dropping more than -12% in two days
- The two-day selling spree was among the worst the index has suffered in more than 40 years
- Selling was so widespread that the Panic Breadth Composite spiked to a rarely-seen level
It wasn't just Japan
The crash in Japanese stocks - and this is one of the few times when "crash" is accurate - made most of the worldwide headlines on Monday. Less mentioned but nearly as dramatic was the crash in South Korea.
The Korean Composite Stock Price Index (KOSPI) contains more than 800 stocks and is heavily weighted toward technology shares, specifically those with exposure to semiconductors. On Monday, that was ground zero of the selling pressure, and the index suffered one of the worst losses in its history.
Other times the index dropped this much in a single session, it bounced back hard, with the only long-term loss being during the bursting of the internet bubble.
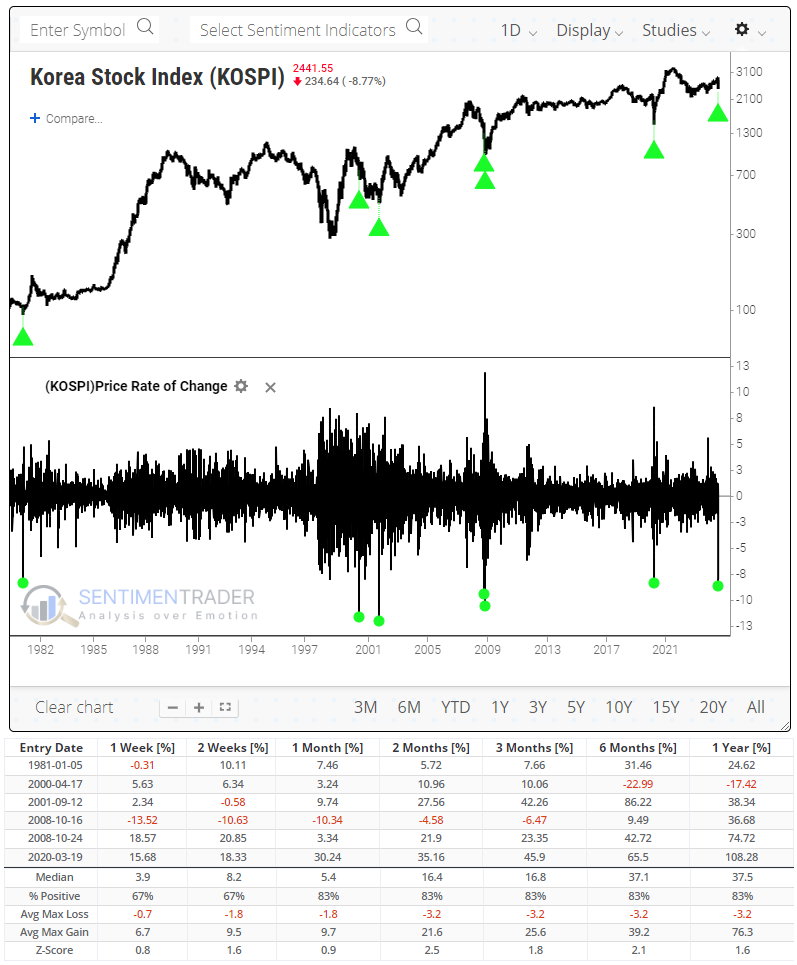
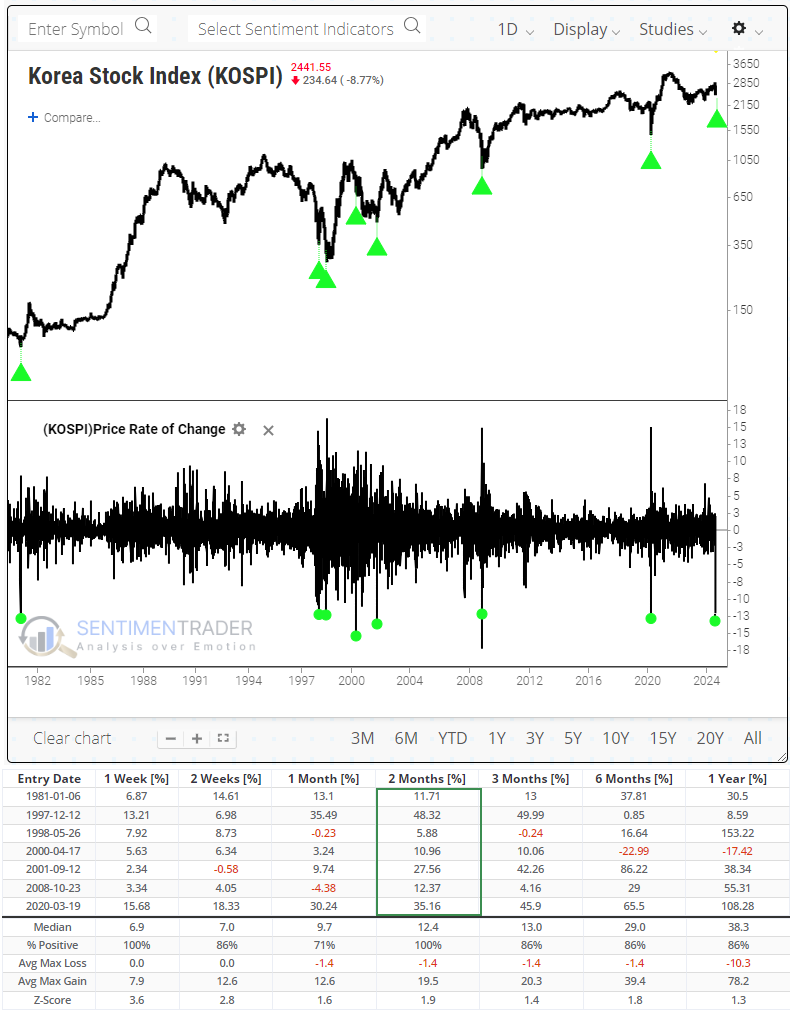
If we look for 2-day declines larger than -12%, the 1997-98 currency crises appear in the precedents. After each plunge, the KOSPI rallied over the next two months.
Historically widespread selling
Damage was widespread, with few stocks spared. There were more declining than advancing stocks than on any day in at least 20 years, leading to severe losses for most of them.
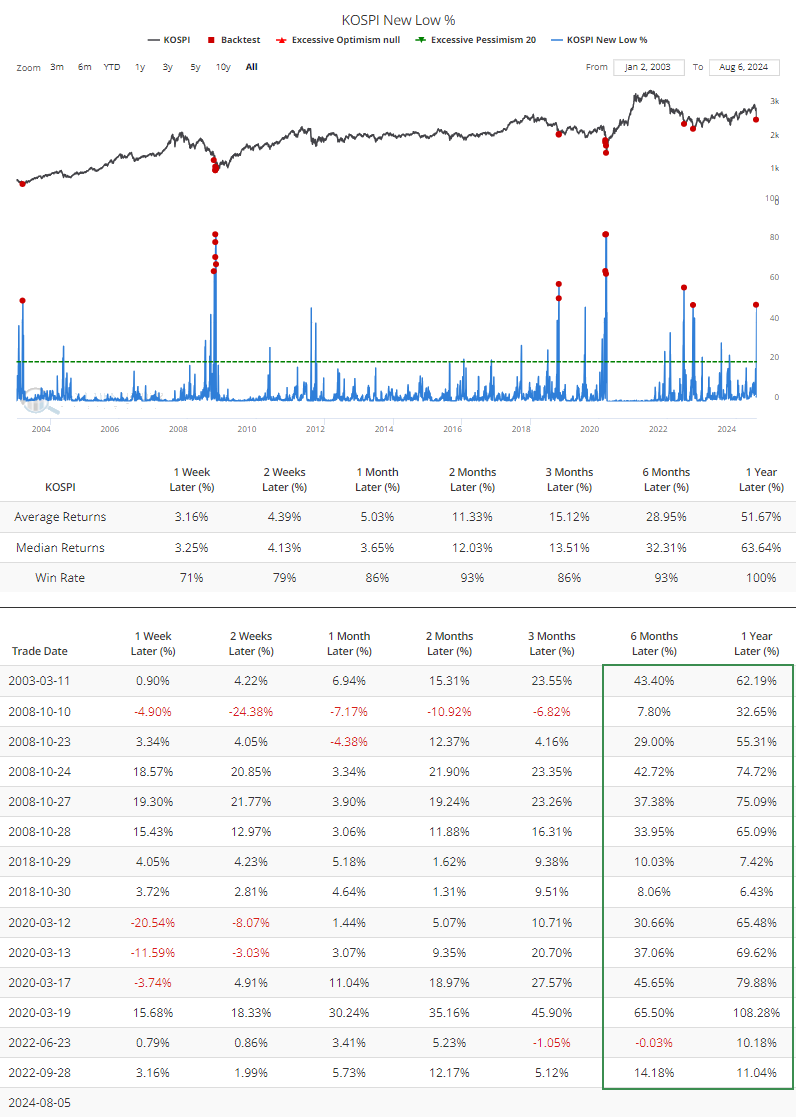
When we look at the breadth metrics, most of the longer-term ones are somewhat oversold but not remarkably so. One exception is the percentage of stocks at 52-week lows, which surged to nearly half of all stocks. That is a rare feat in any sector, index, or exchange. Each of the other times there was this level of coordinated selling pressure, the KOSPI rallied over the following year by an average of more than +50%.
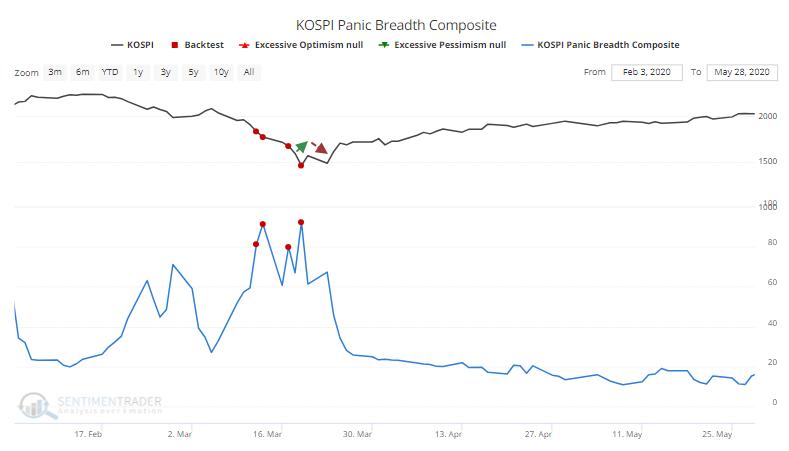
Due to the shocking nature of the decline, the short-term measures are extreme. In more than 20 years, the index has only seen this level of outright panic among so many stocks once, during the puke phase of the pandemic decline.
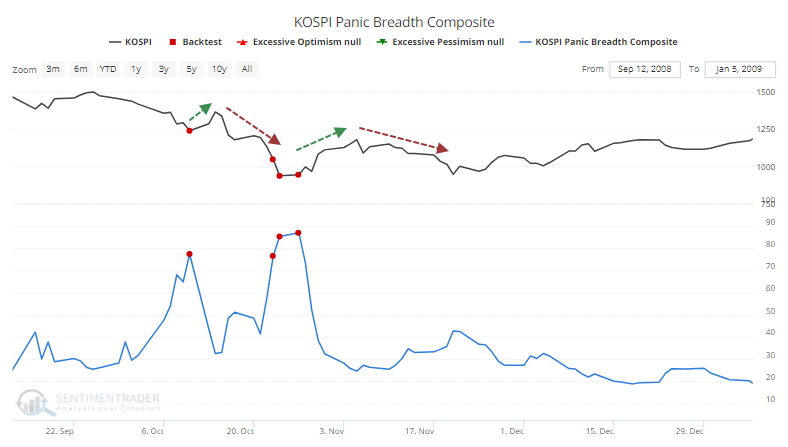
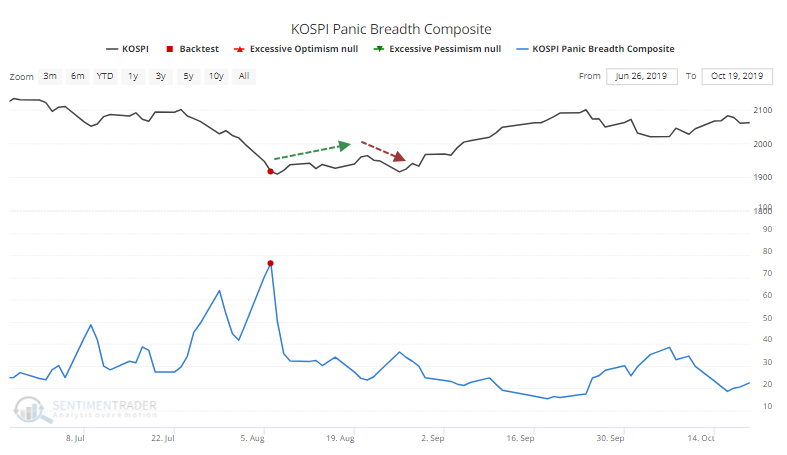
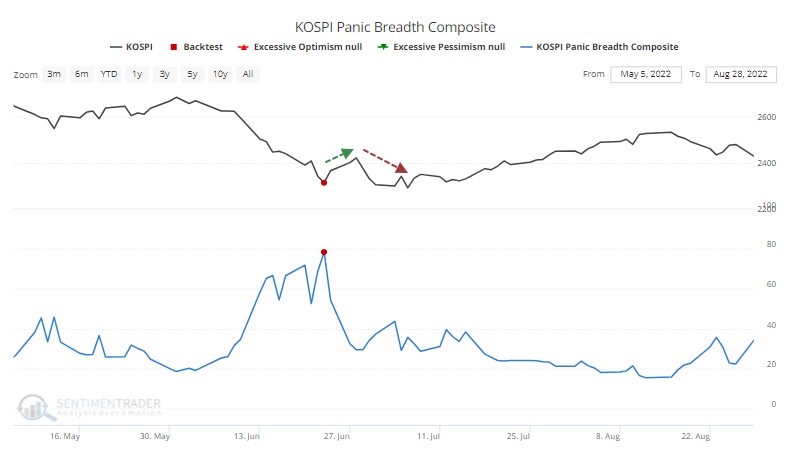
There is perhaps no better reflection of this wholesale selling pressure than the Panic Breadth Composite, which aggregates various breadth metrics across various time frames into a single indicator. It spiked above 75 on Monday, one of the highest readings in over 20 years.
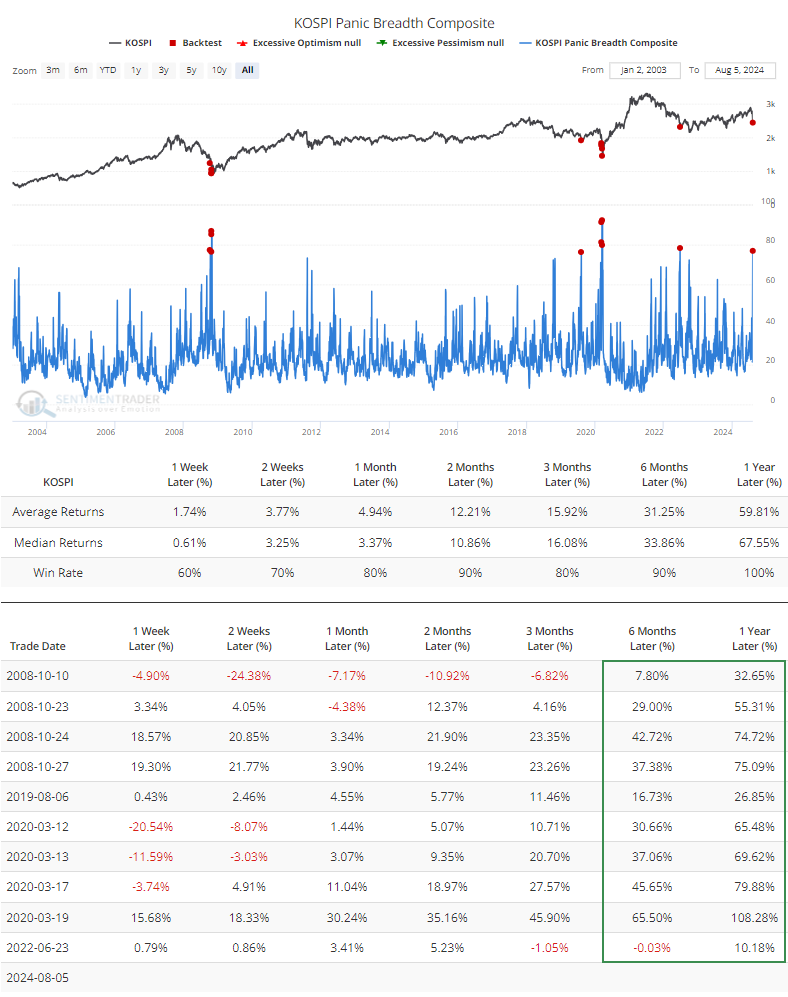
The table shows a single tiny loss over the next six months, and over the next twelve months, the worst signal was a double-digit gain. On average, the KOSPI rallied more than +67% over the following year.
While the one-year returns were excellent, it's worth noting that investors who bought into the panic likely suffered some doubts along the way. Most of the instances saw a short-term bounce but a test of the panic lows at some point before sustained gains. That is the risk-reward calculation that all investors must compute for themselves - the risk of a further decline (likely temporary) versus the risk of missing a long-term move altogether.
For U.S.-based investors, the iShares MSCI South Korea ETF (EWY) showed even better performance, with a median one-year return of +87.3%. 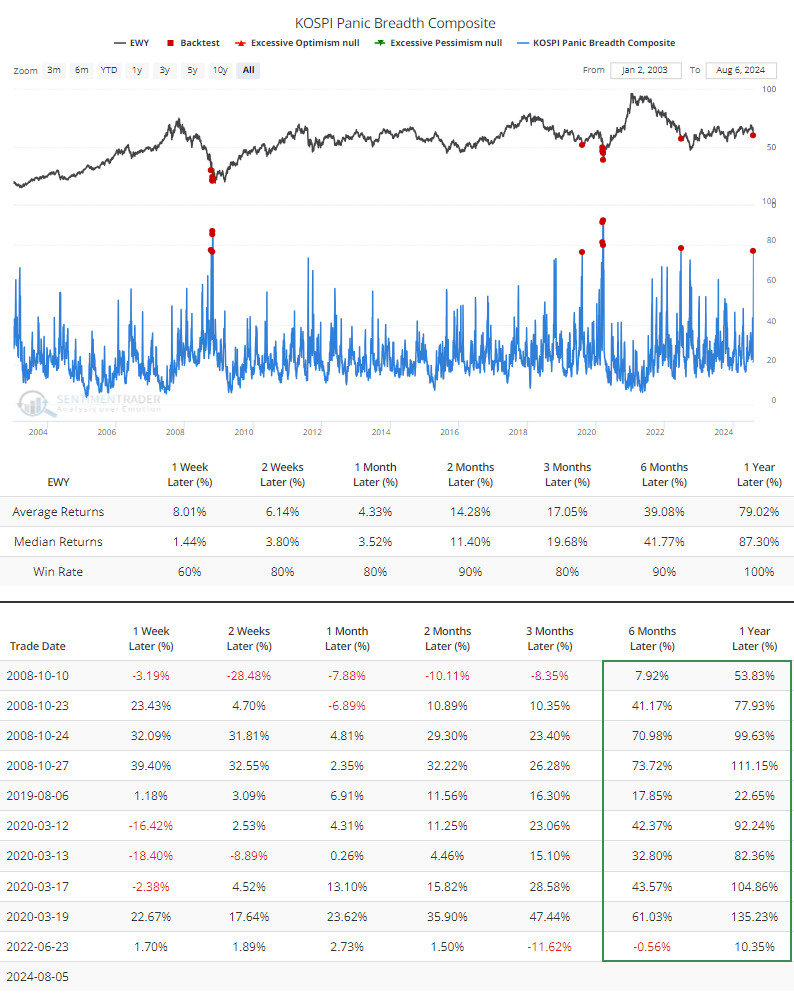
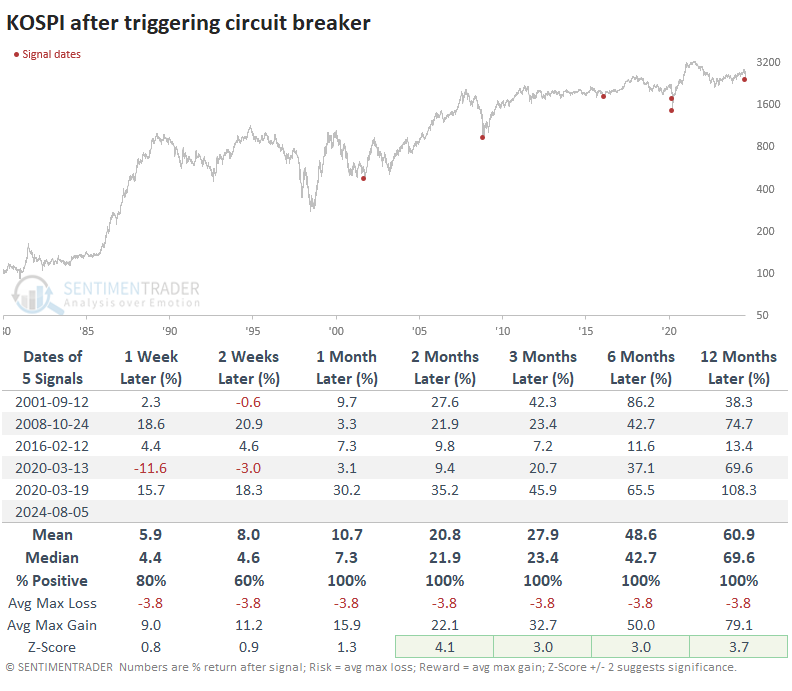
It's also worth noting that the moves in stocks on South Korean exchanges were so extreme that it triggered the circuit breakers, designed to pause trading during exceptional conditions. This history is likely incomplete, but the below dates are all I could find for other trading days that triggered the breakers.
What the research tells us...
Panics are often the best chance for long-term investors to enter markets. That's with the understanding that every once in a generation, at most, it turns into something more nefarious and longer-lasting. Most indications are that this is not one of those times of economic distress but rather financial excesses, and those tend to work themselves out rather quickly.
In the tables above, there are some losses in the weeks ahead, including some severe ones. However, each of them was temporary and eventually led to double-digit gains, usually within the next 6-12 months.
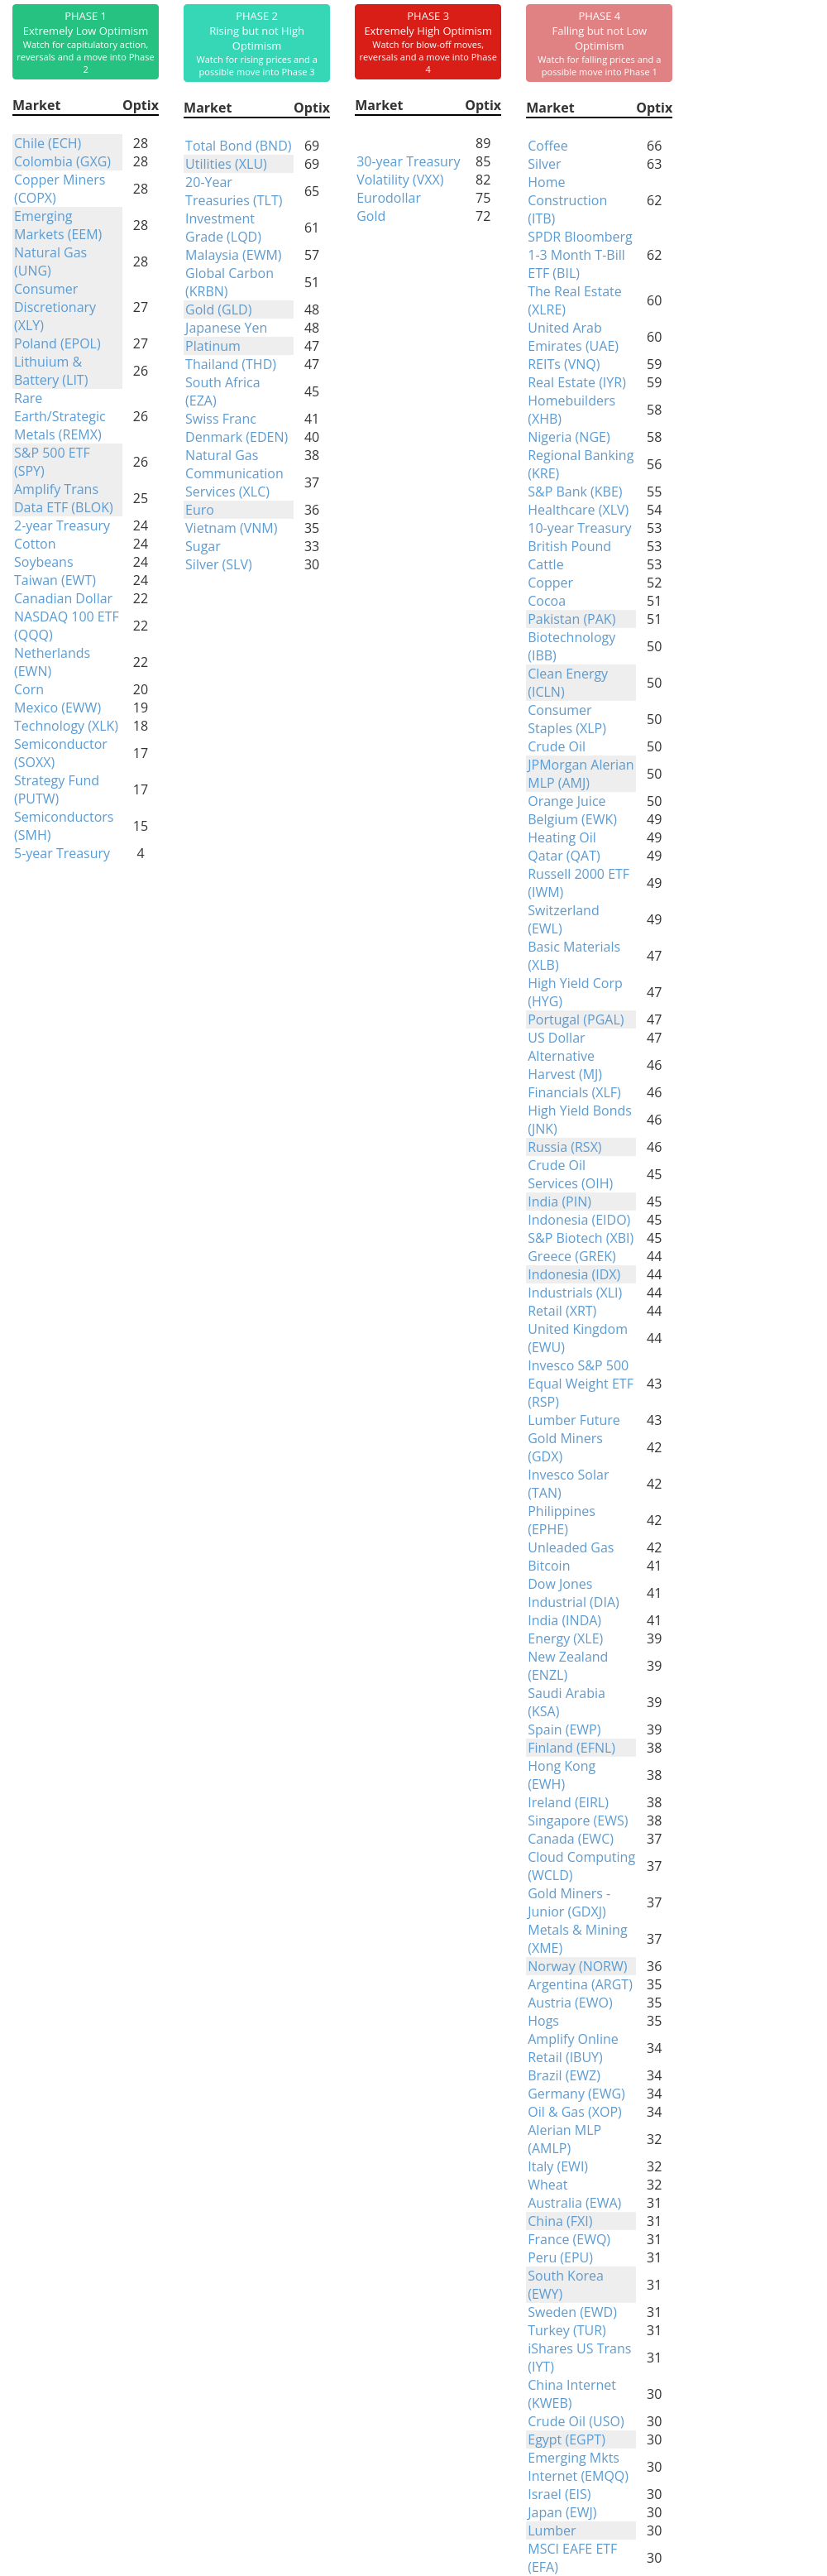
Indicators at Extremes
Phase Table
Ranks
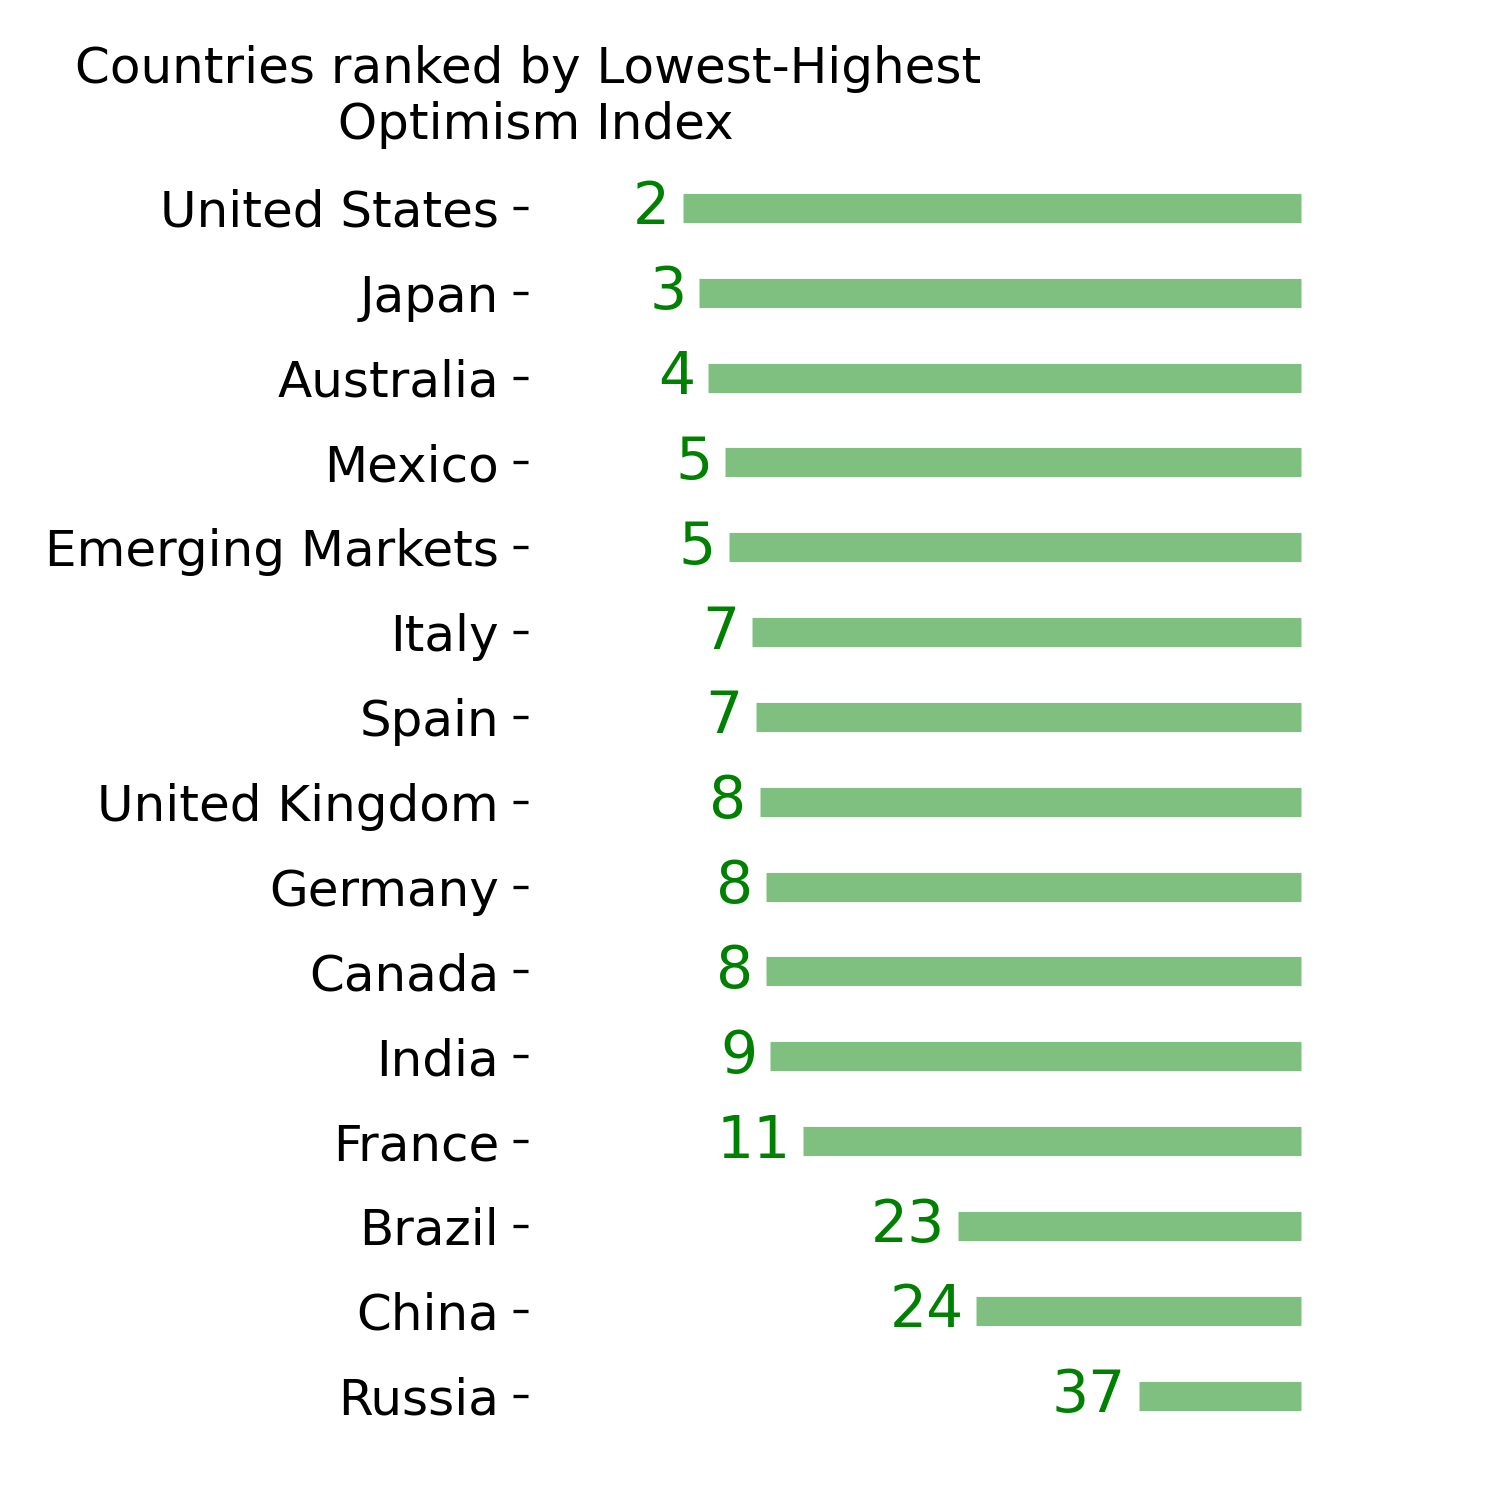
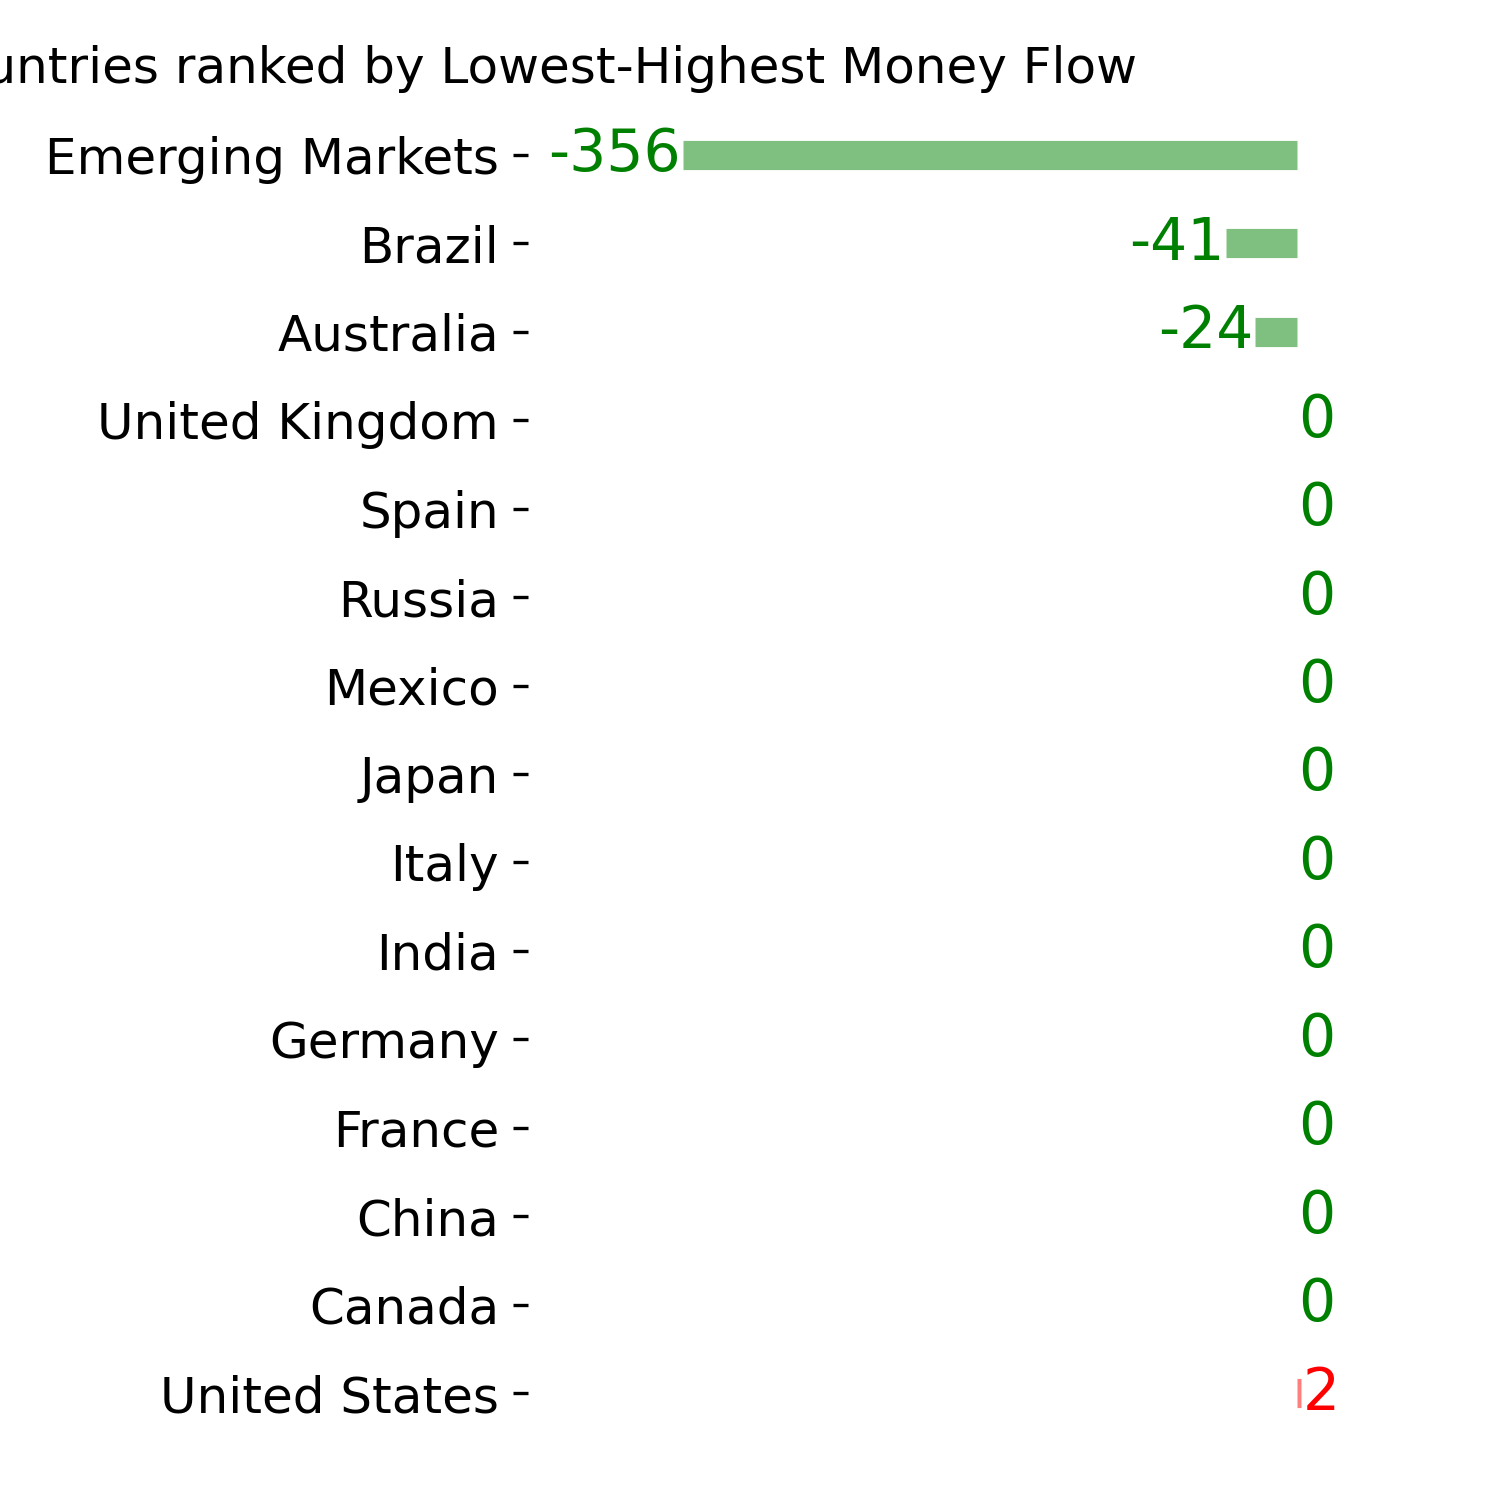
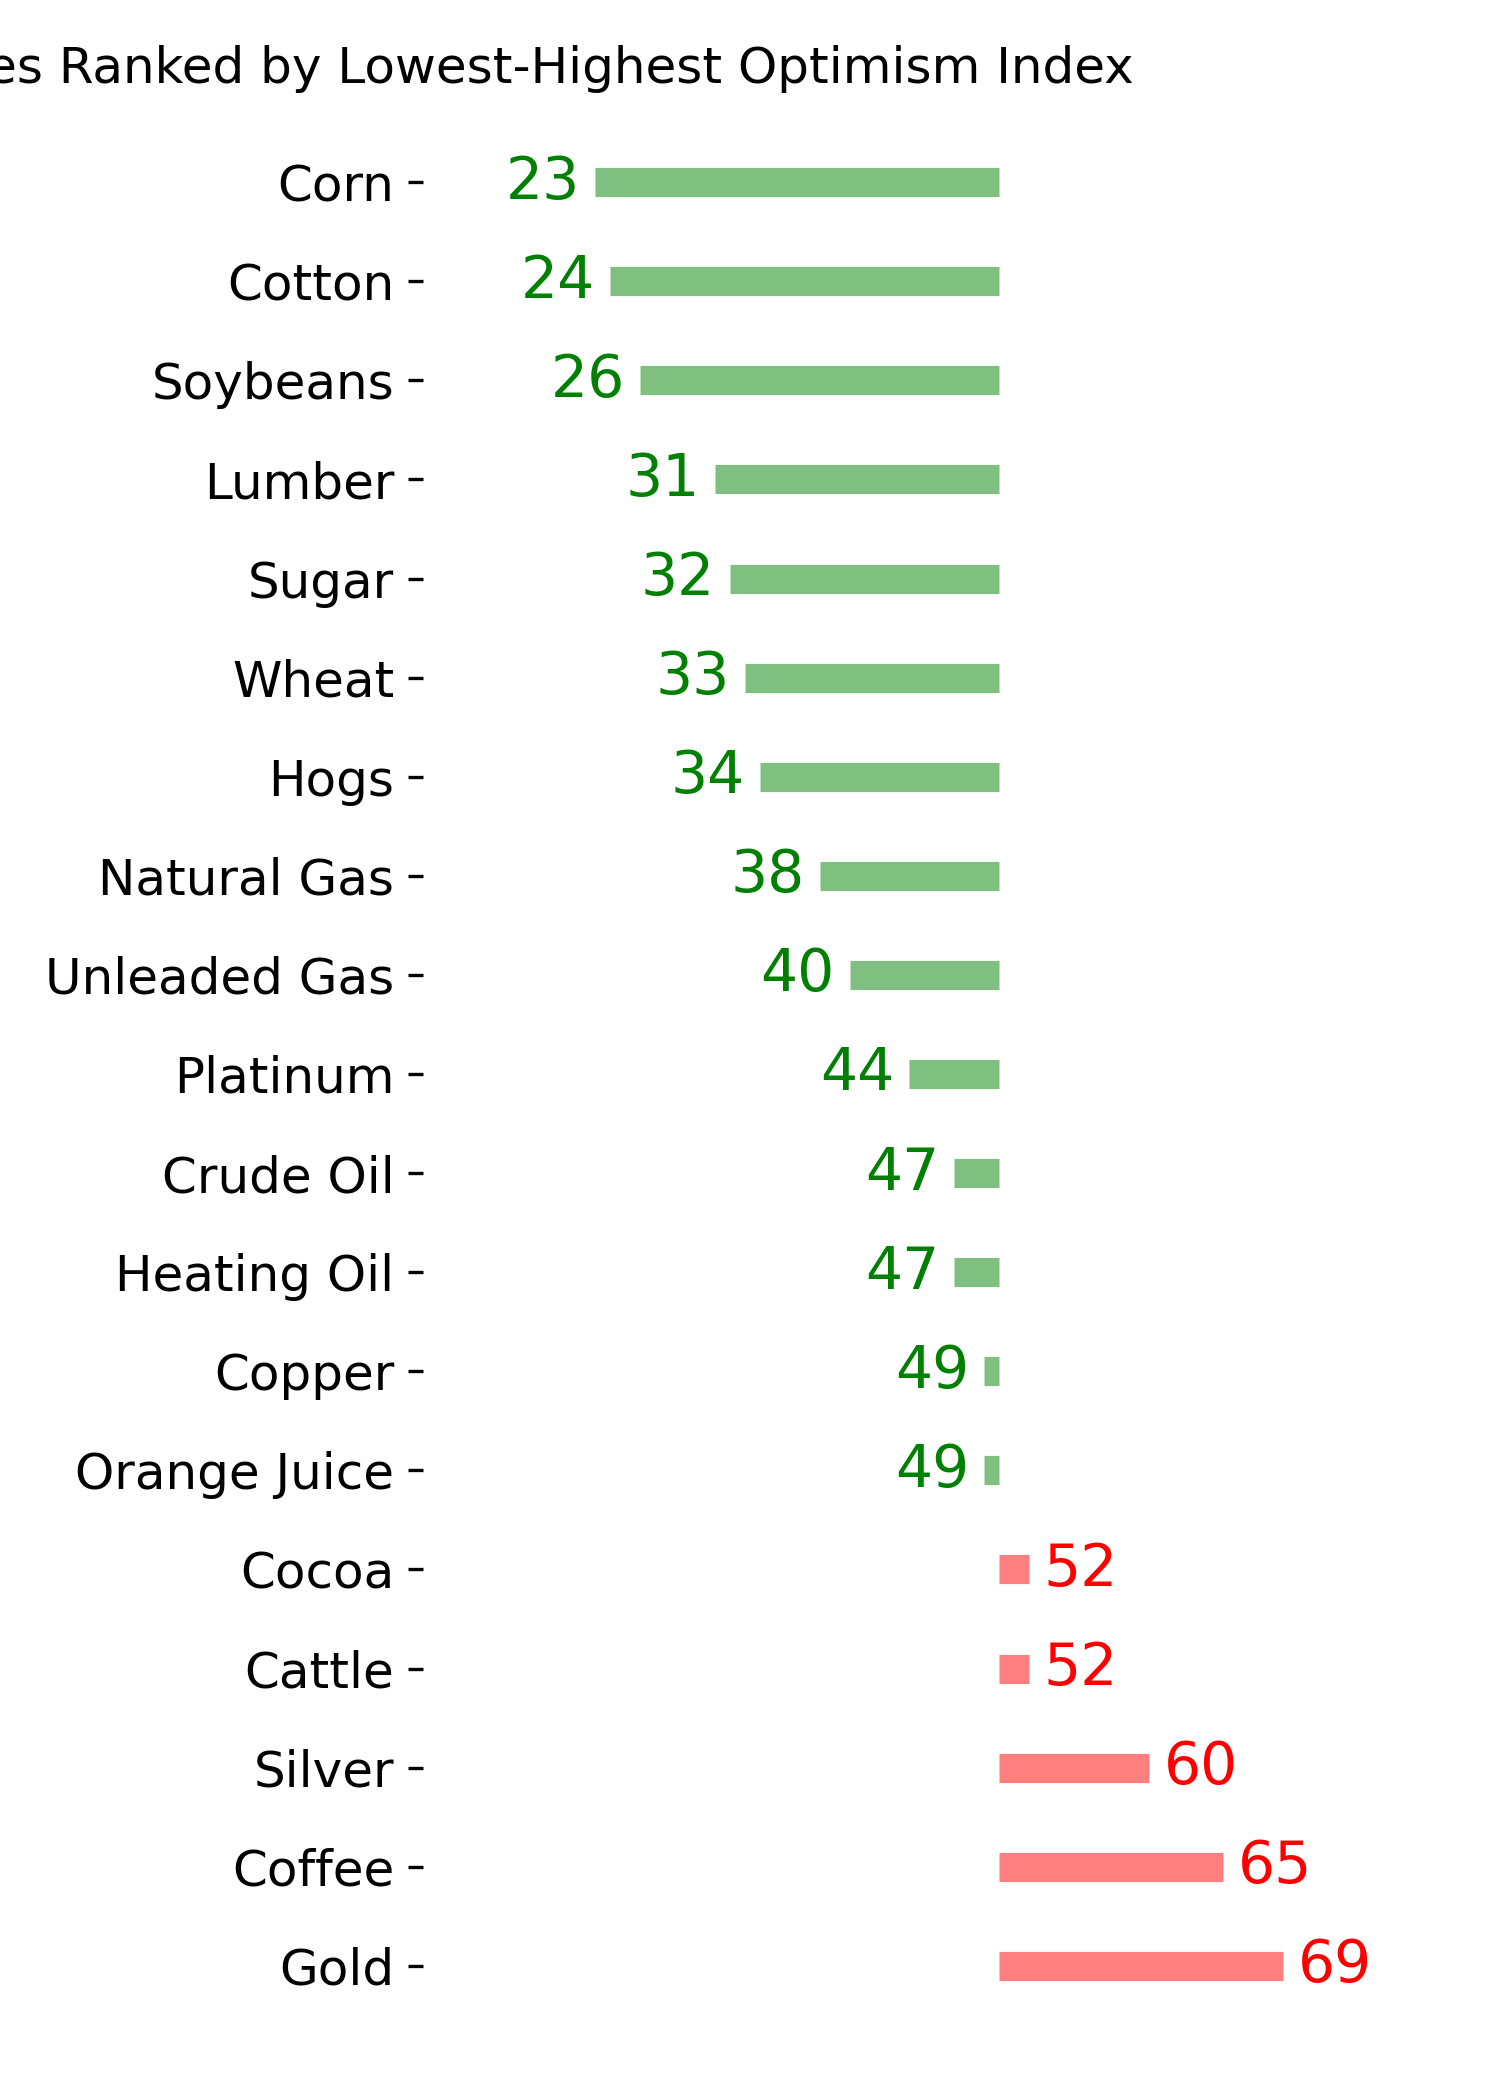
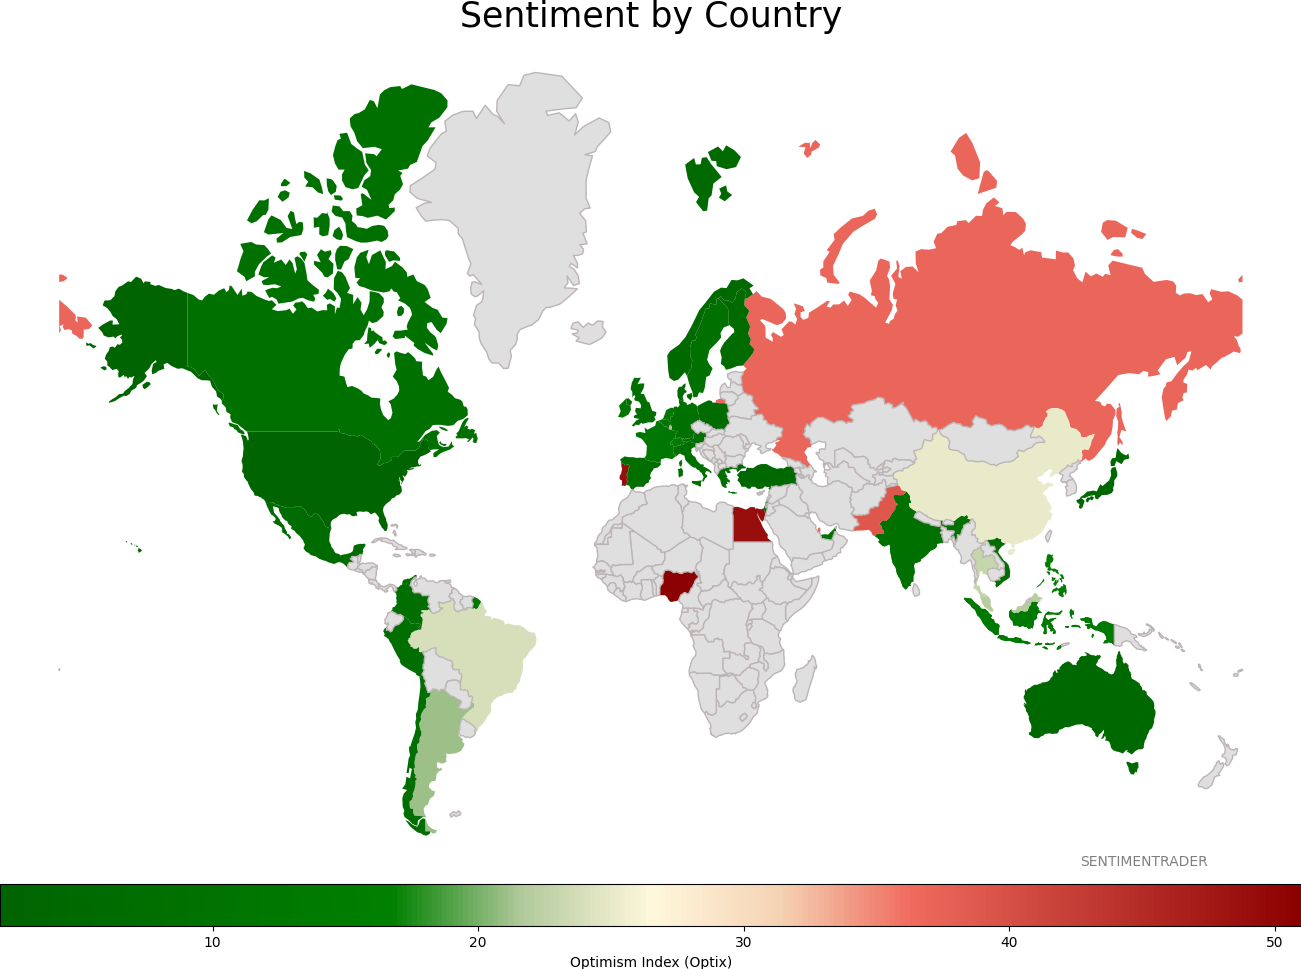
Sentiment Around The World
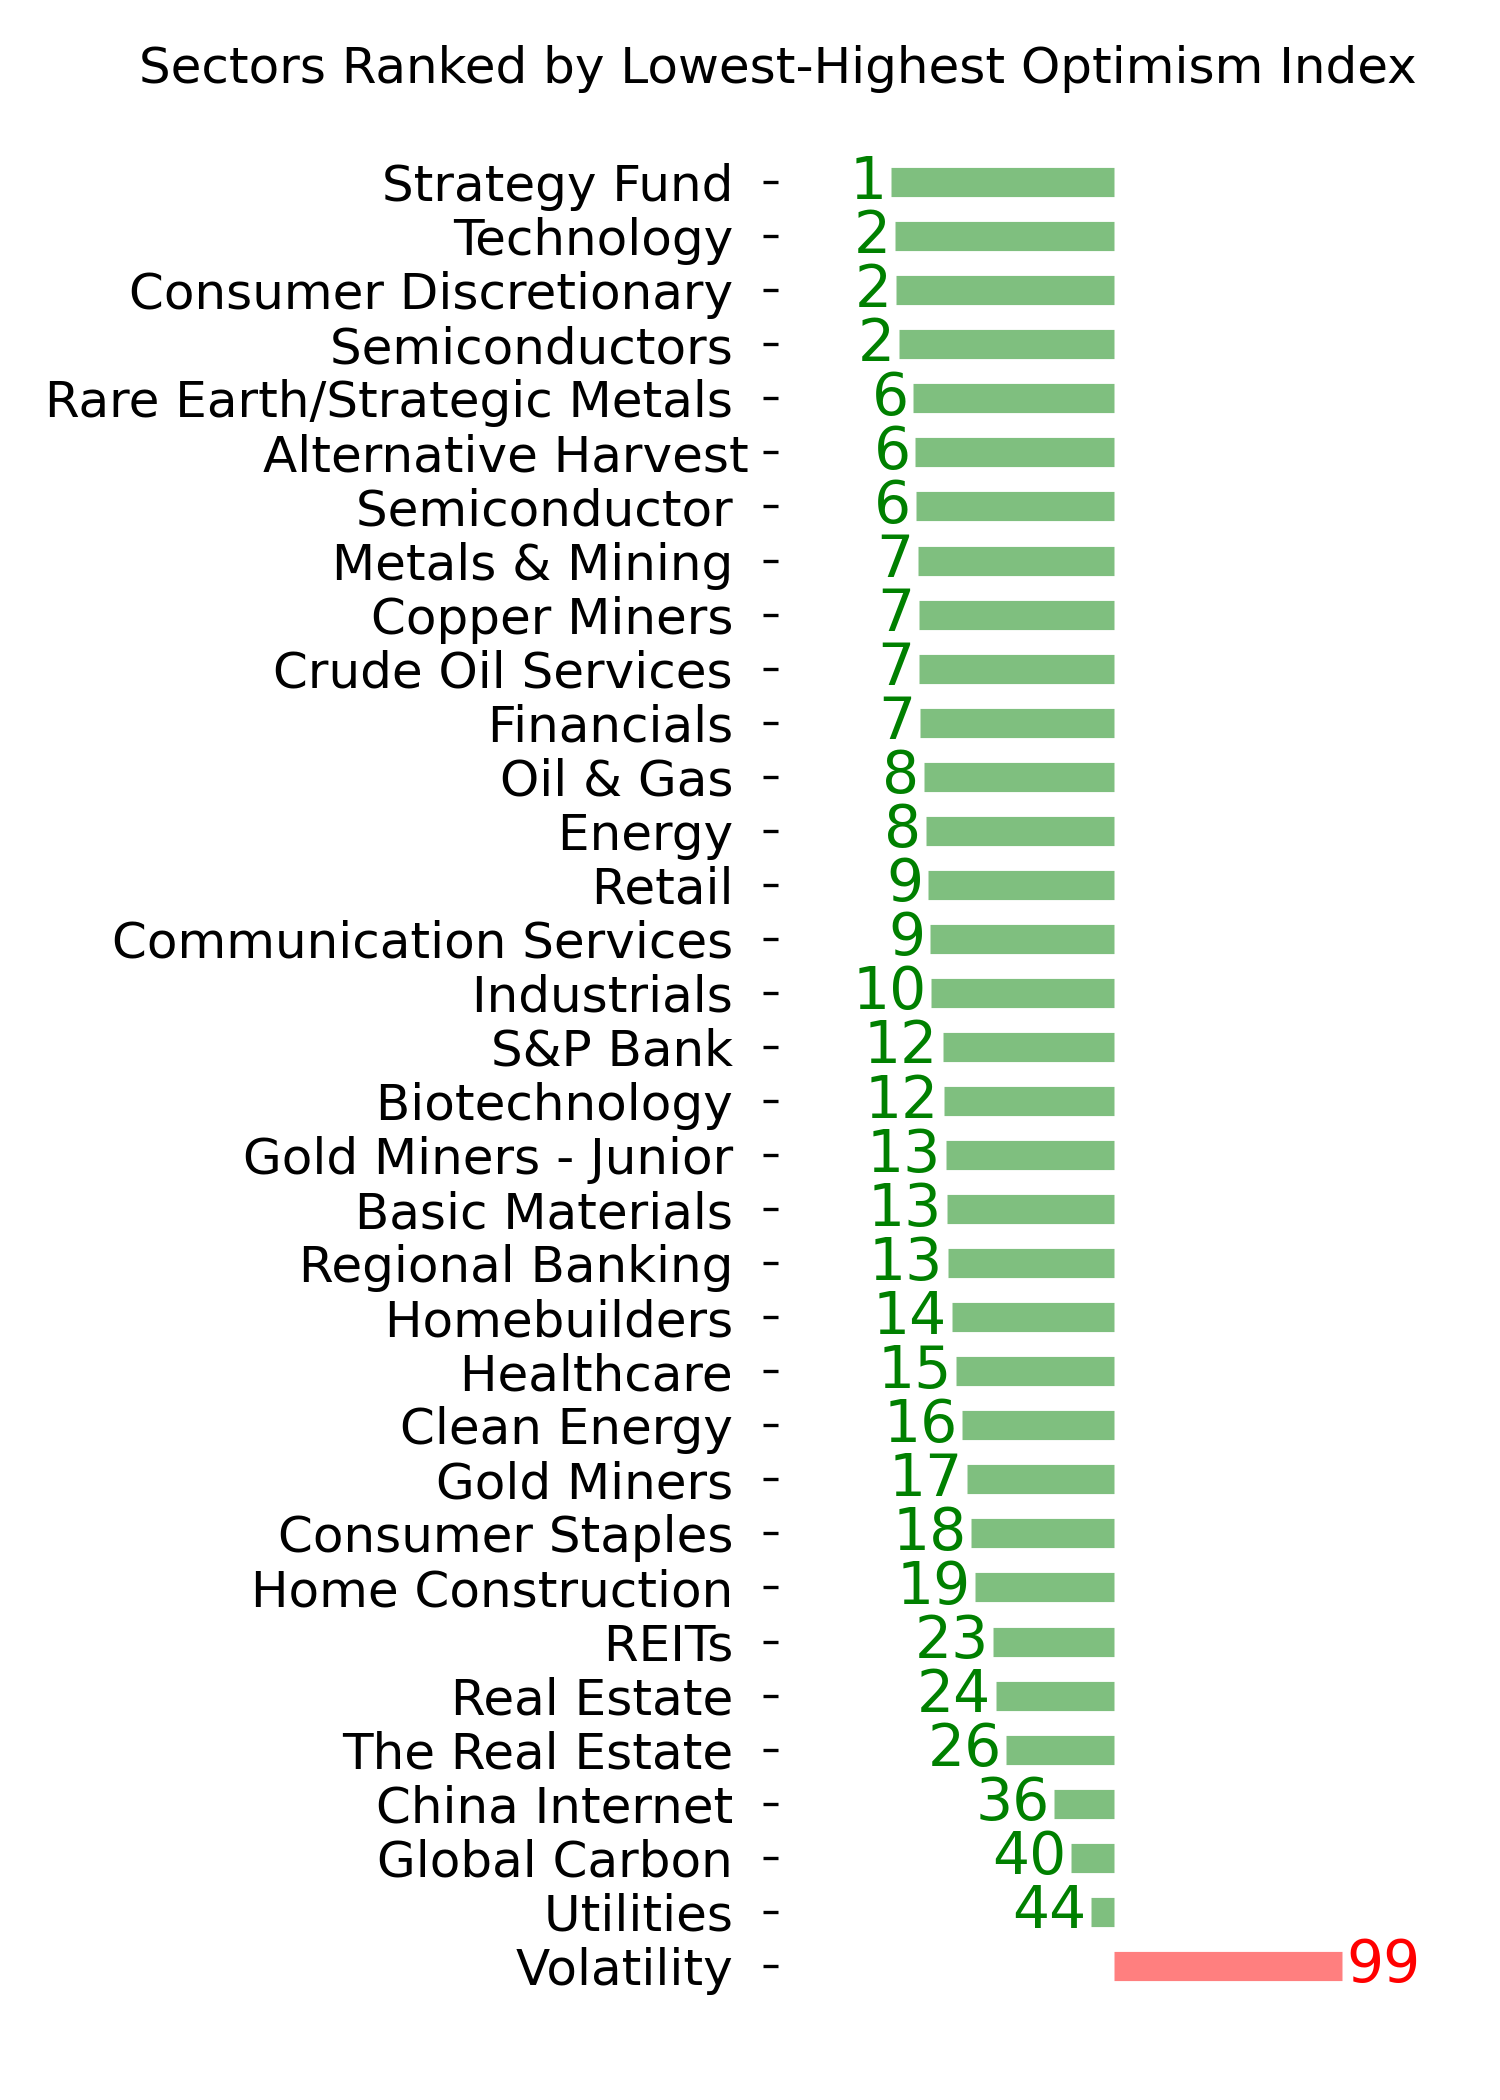
Optimism Index Thumbnails
|
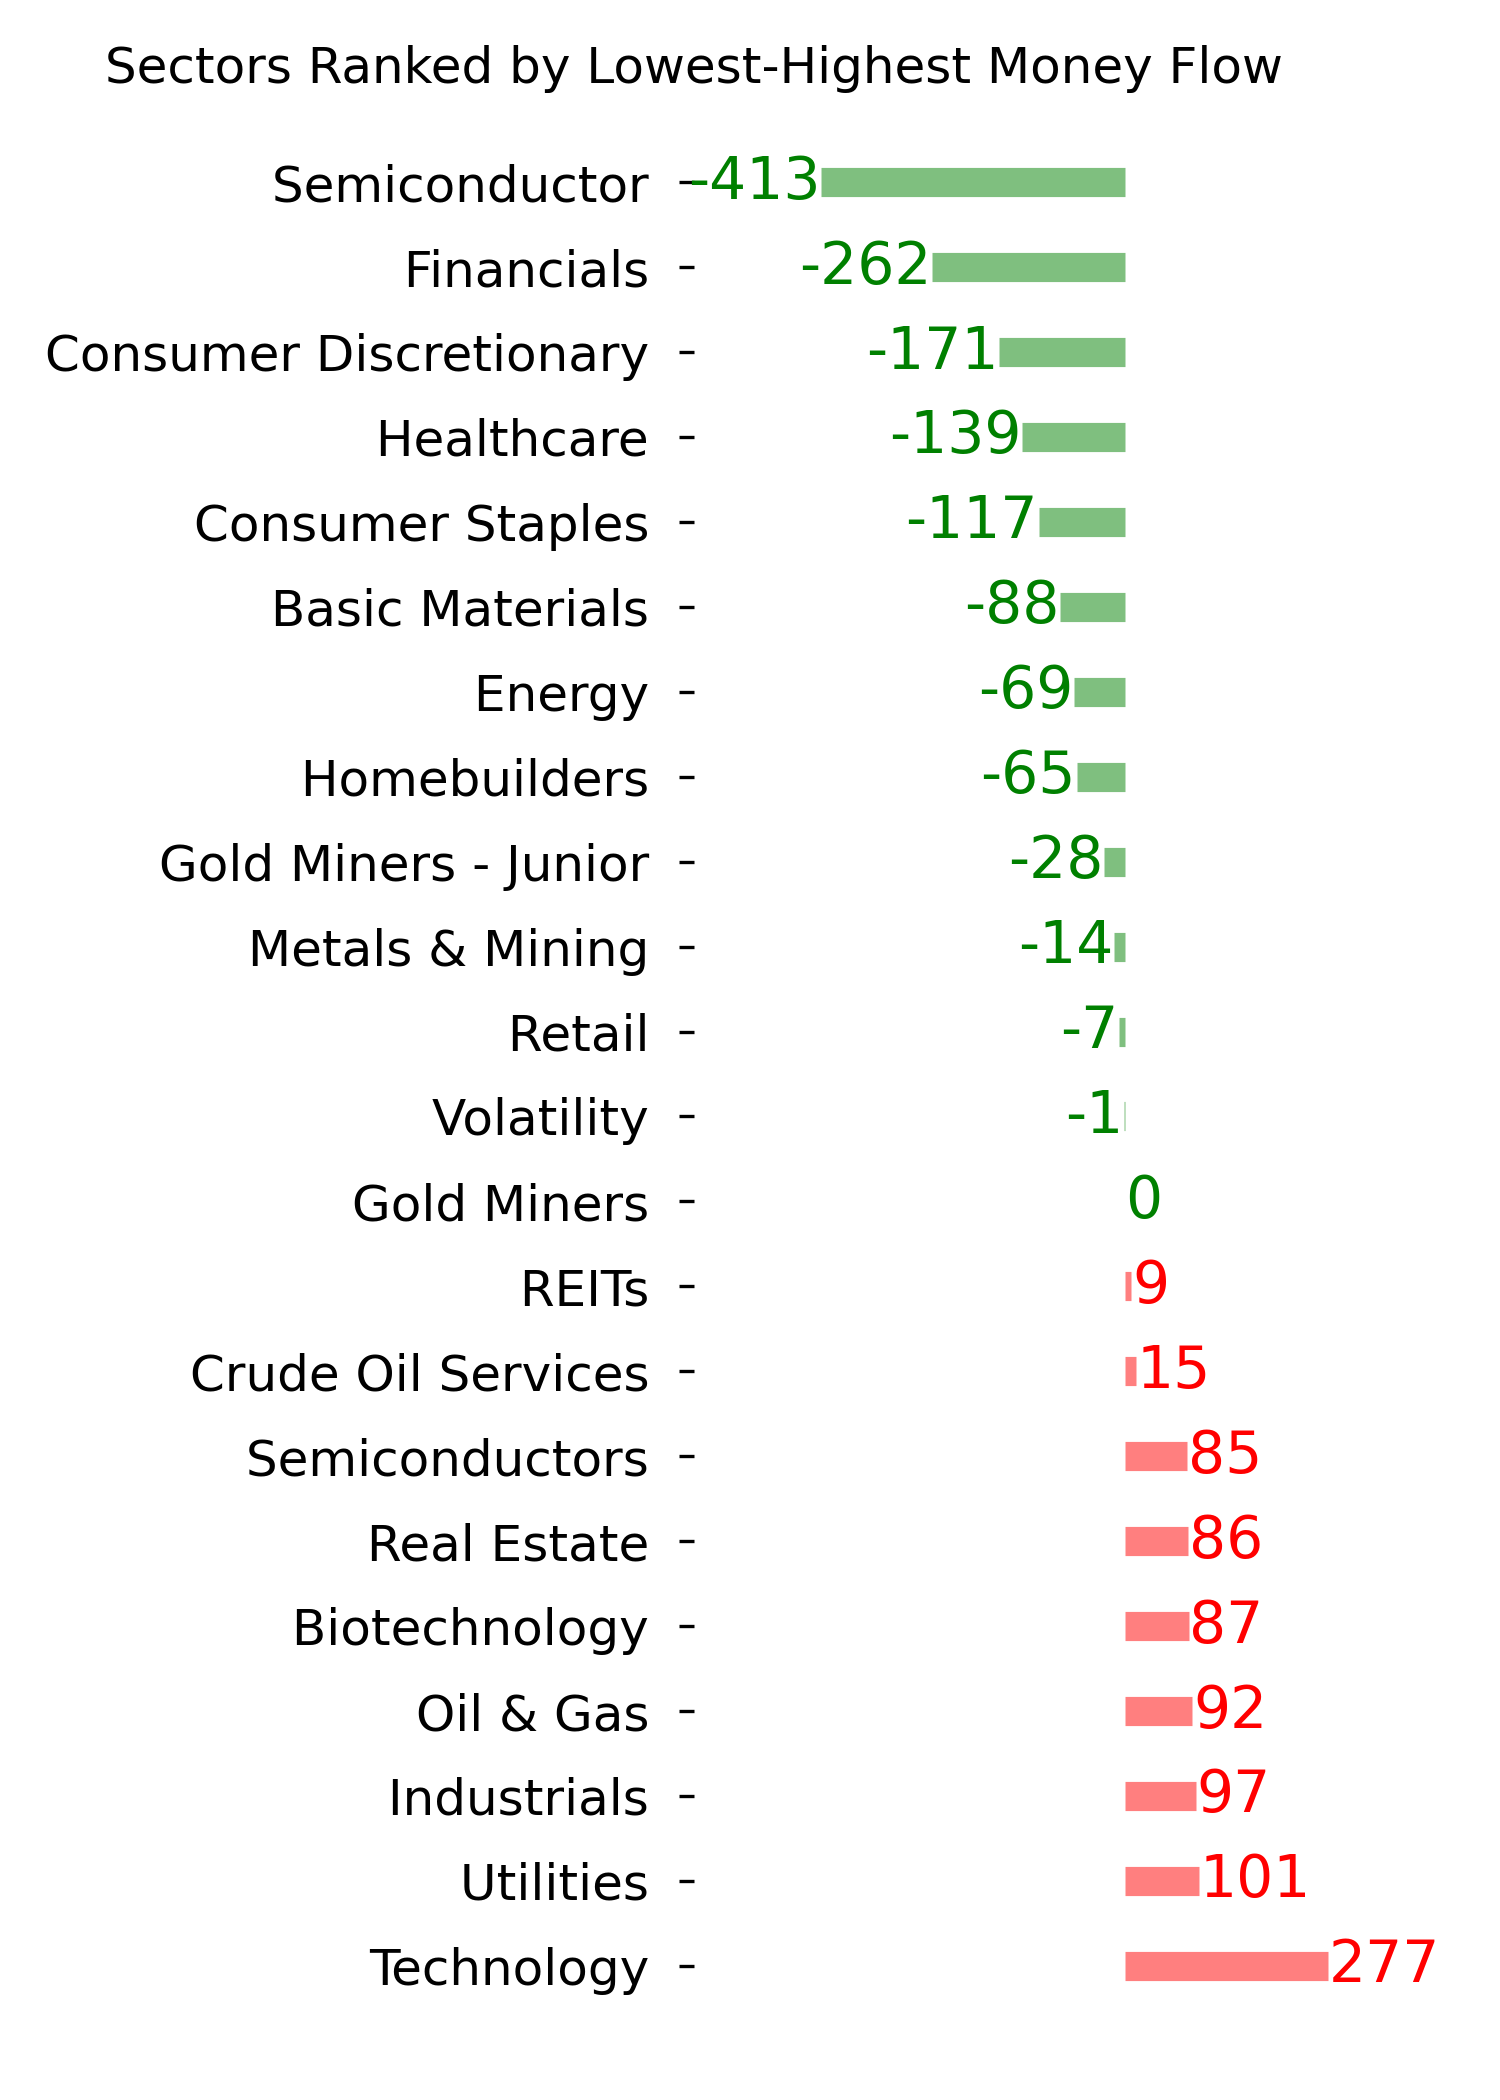
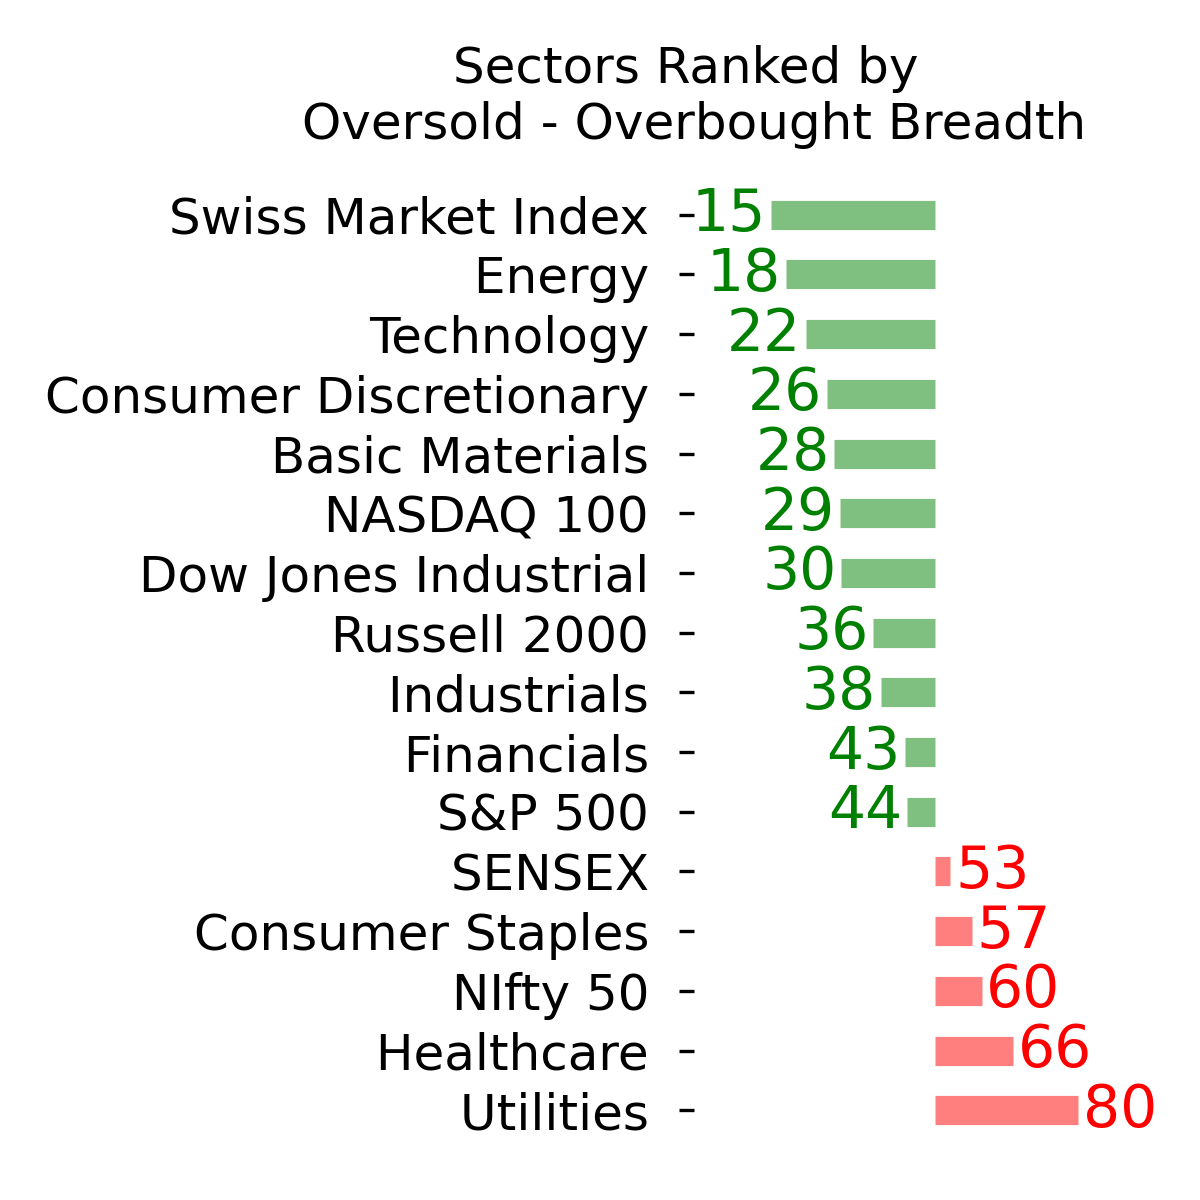
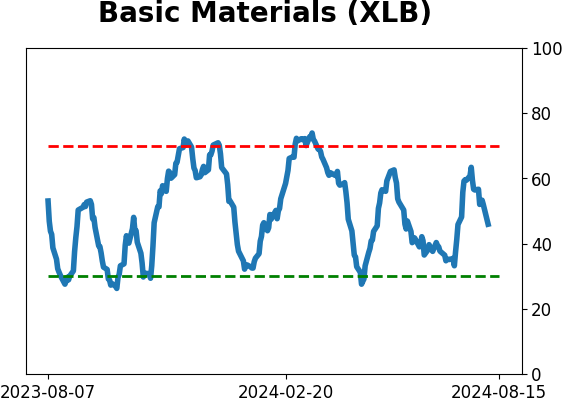
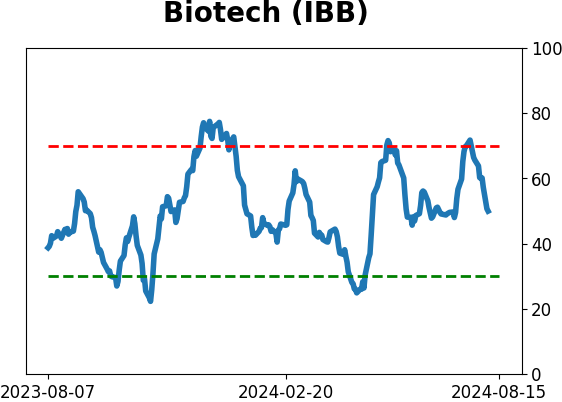
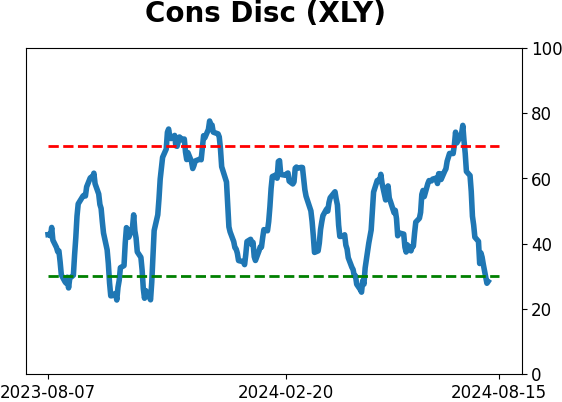
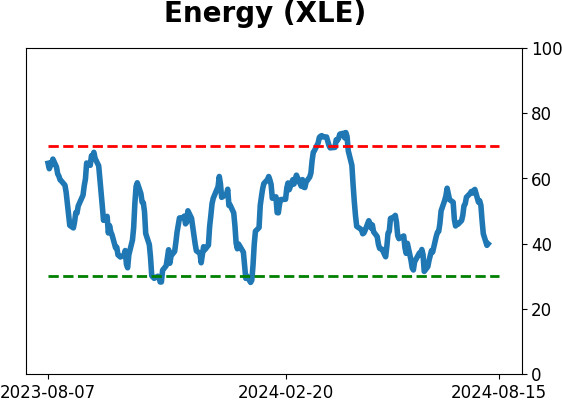
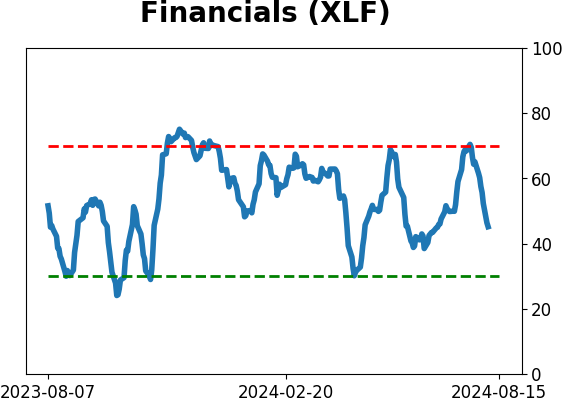
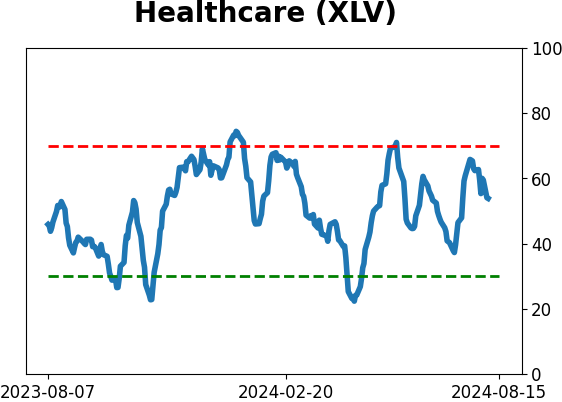
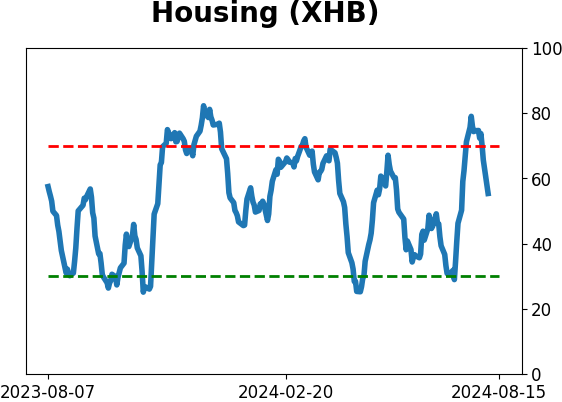
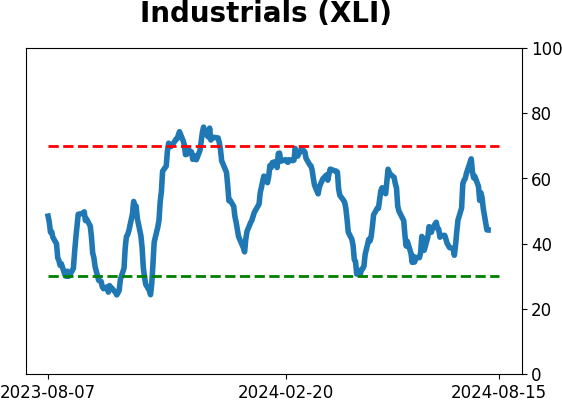
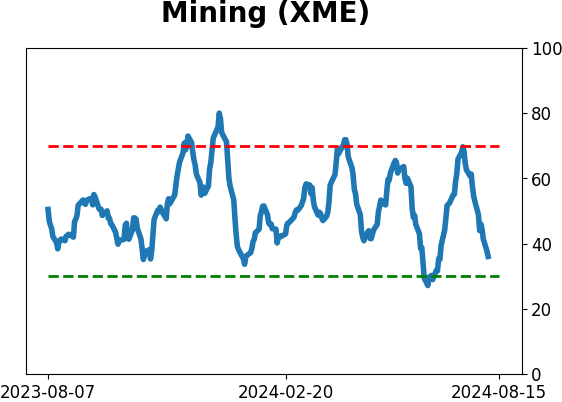
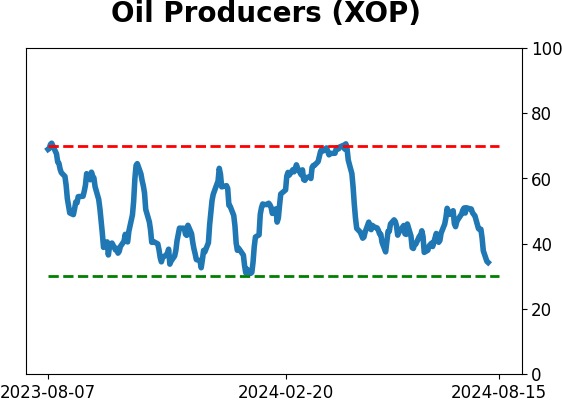
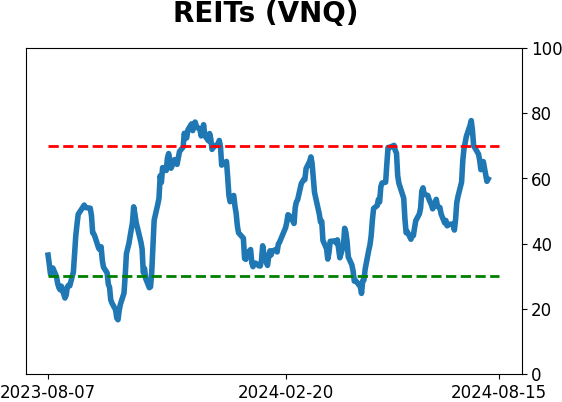
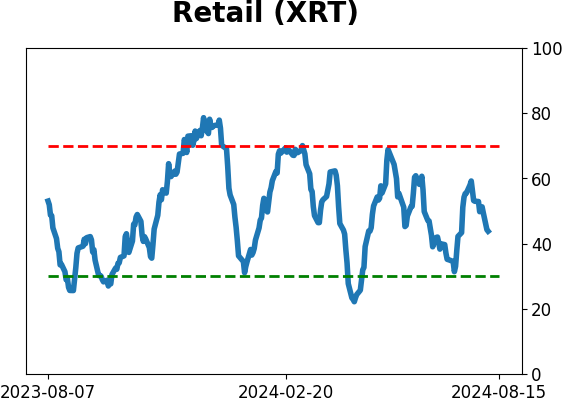
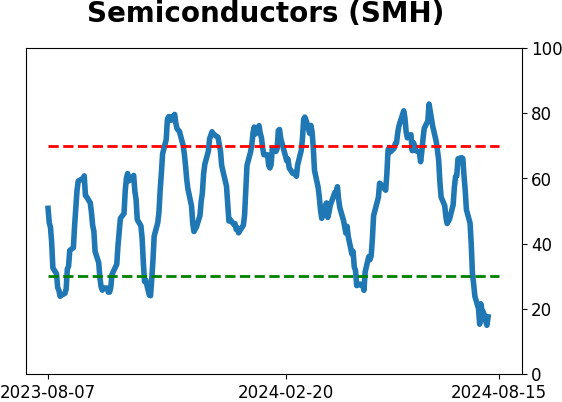
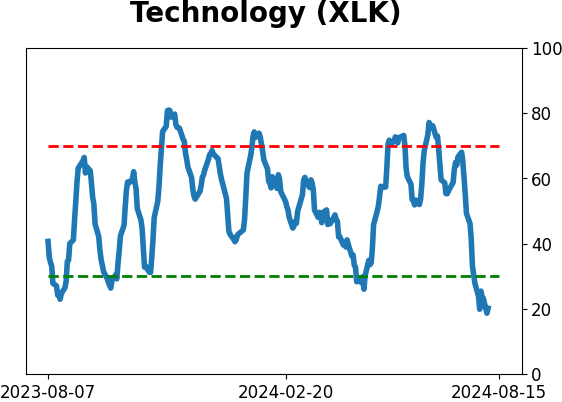
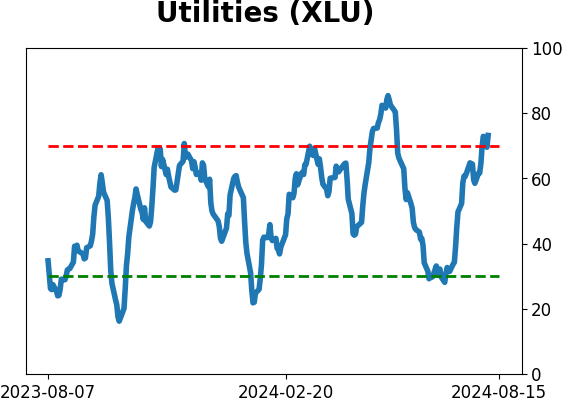
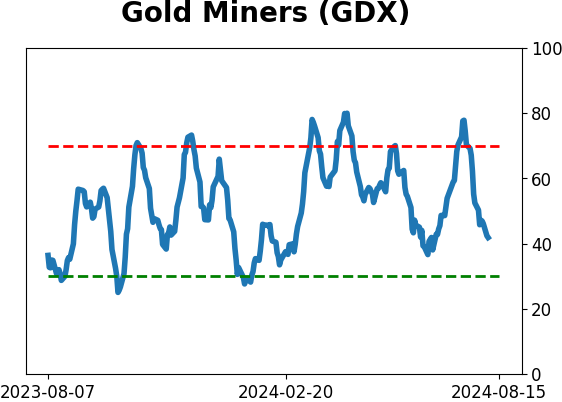
Sector ETF's - 10-Day Moving Average
|
|
|
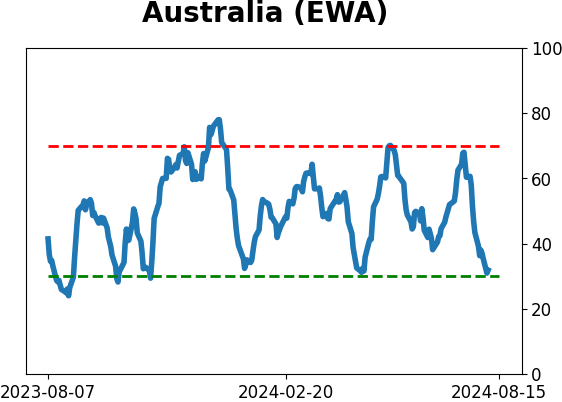
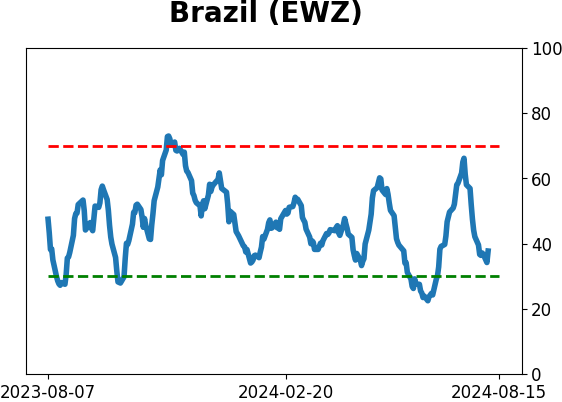
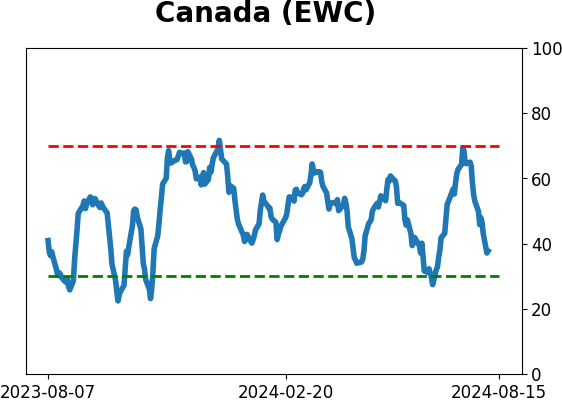
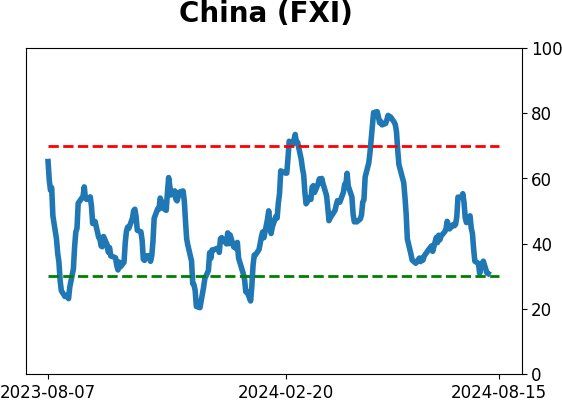
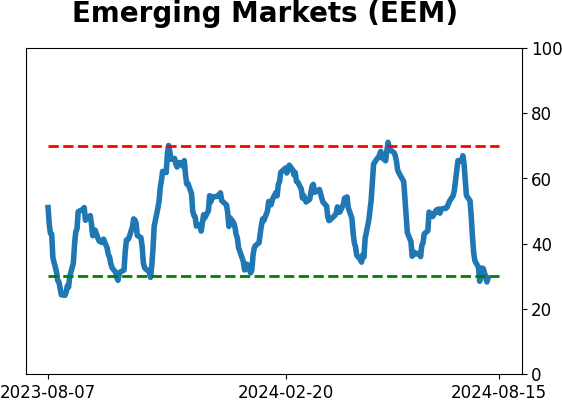
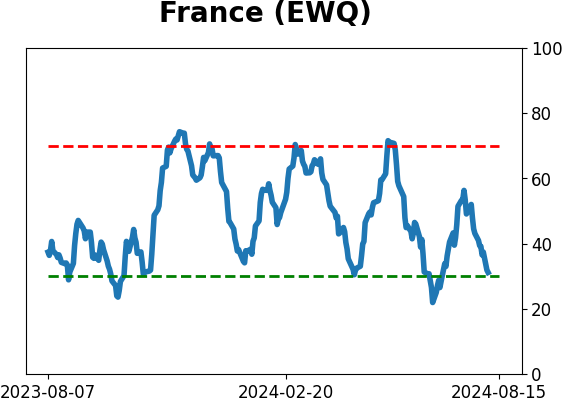
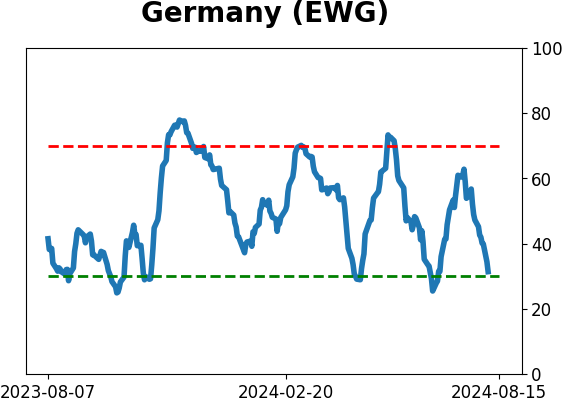
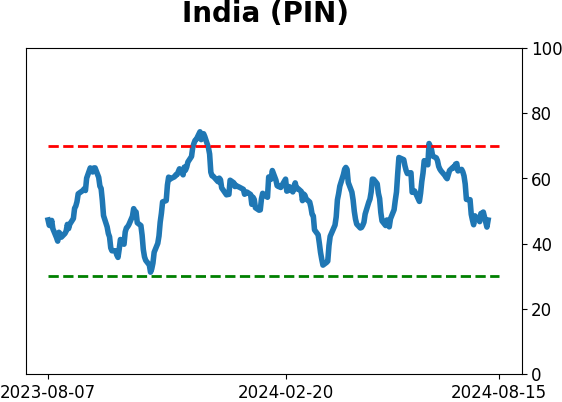
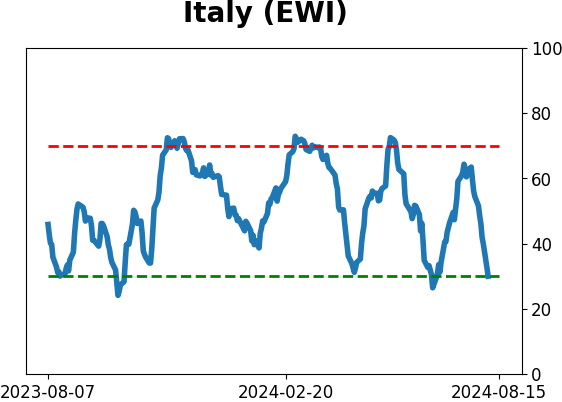
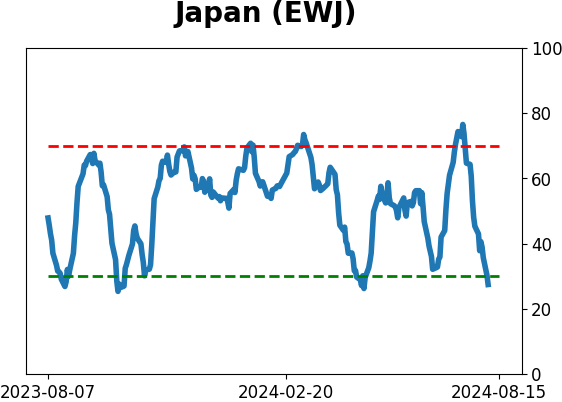
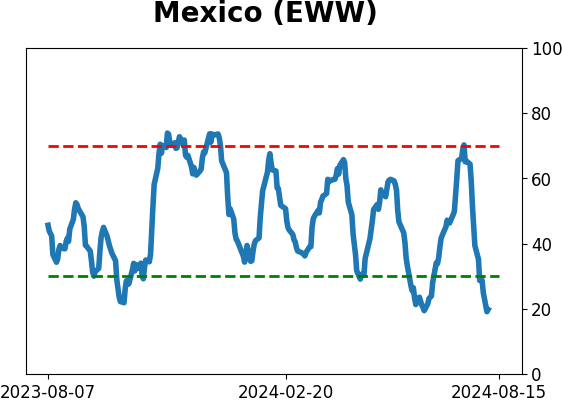
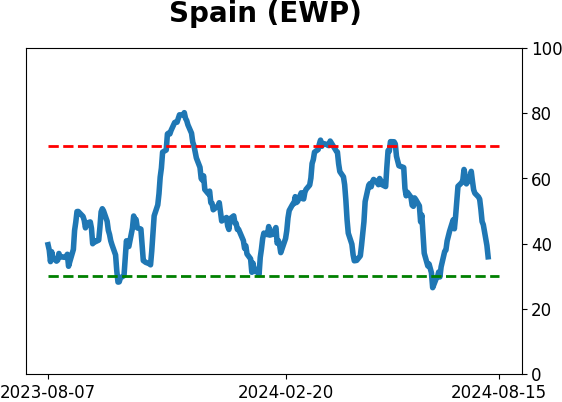
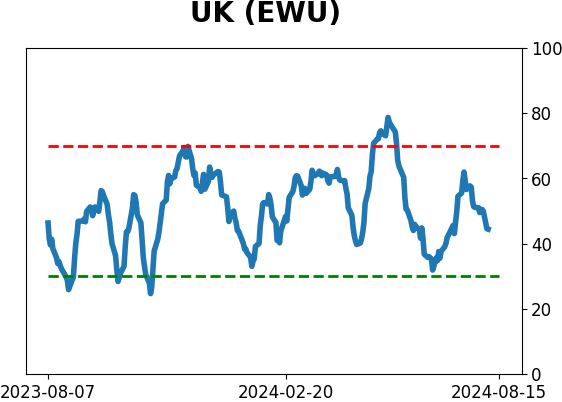
Country ETF's - 10-Day Moving Average
|
|
|
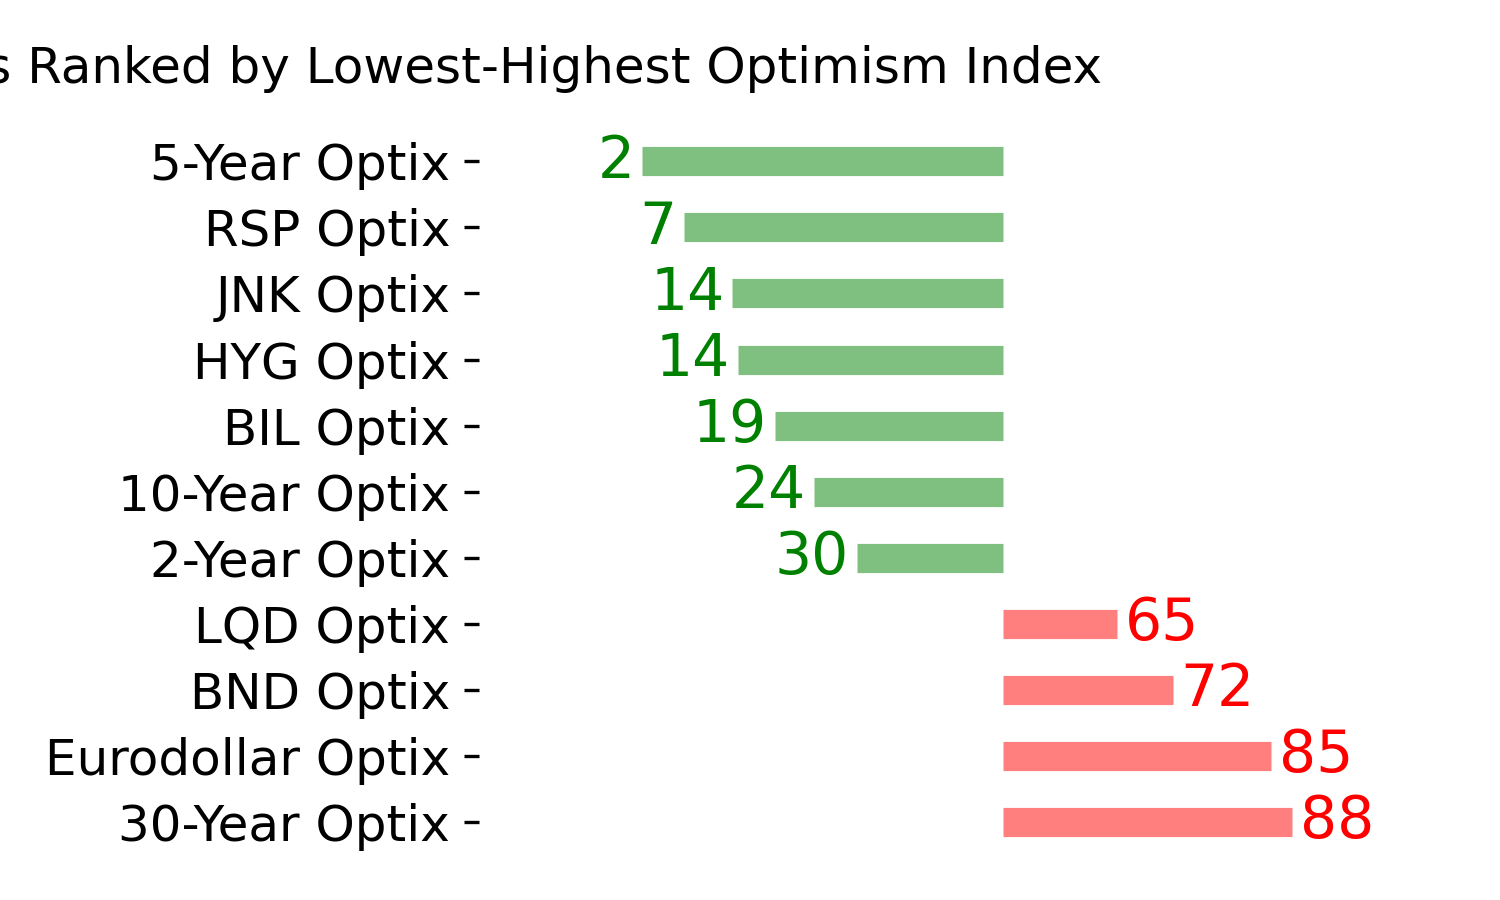
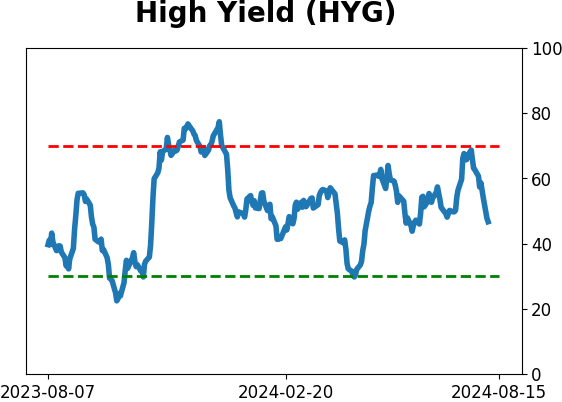
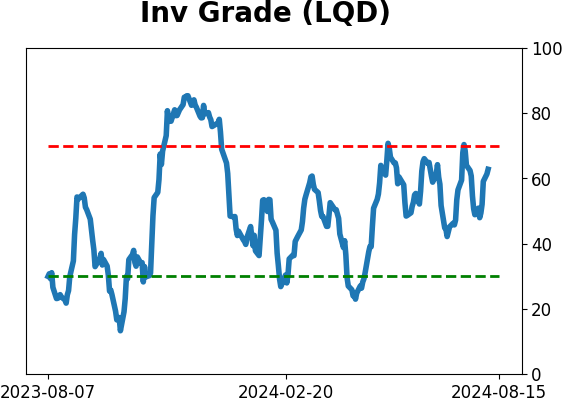
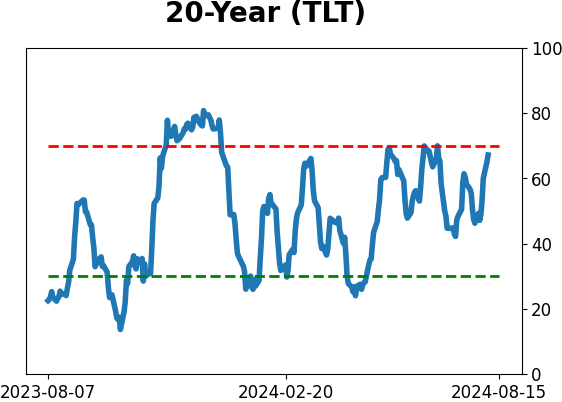
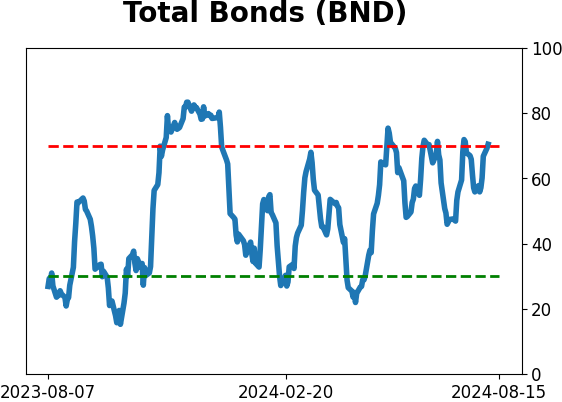
Bond ETF's - 10-Day Moving Average
|
|
|
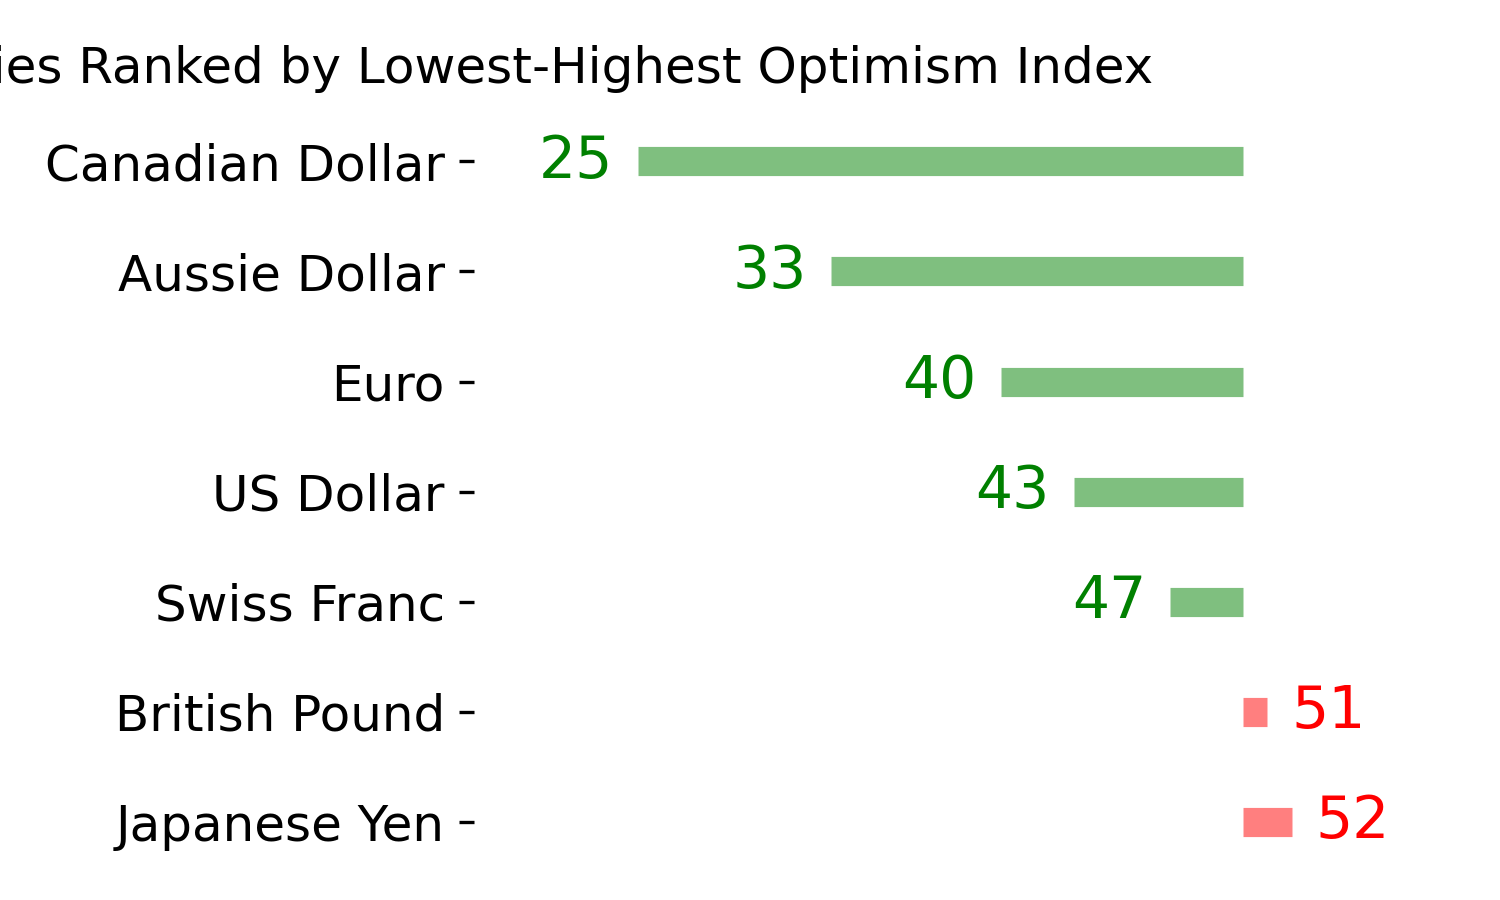
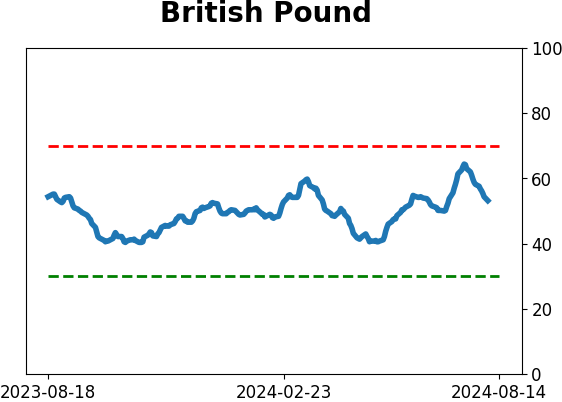
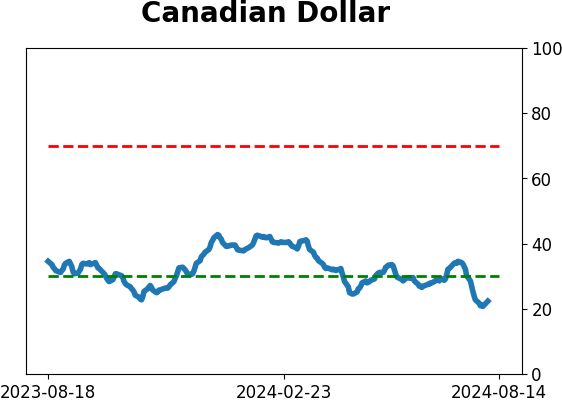
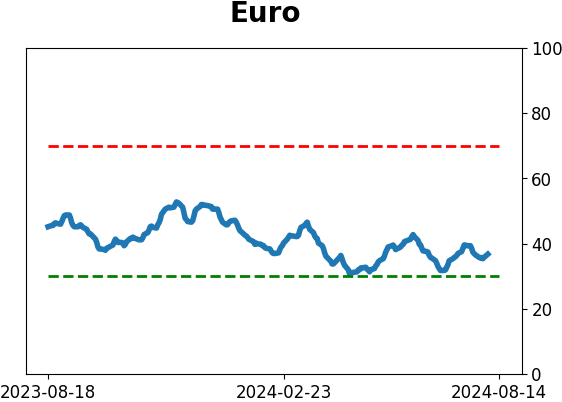
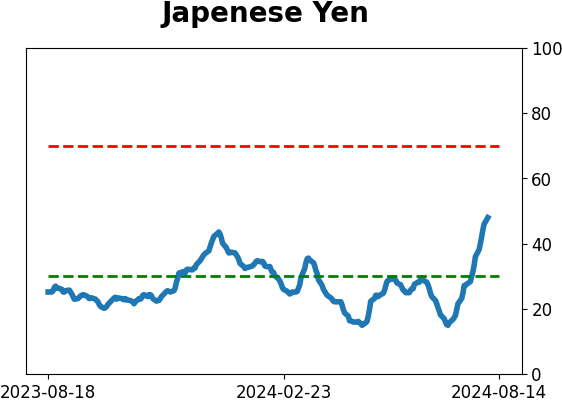
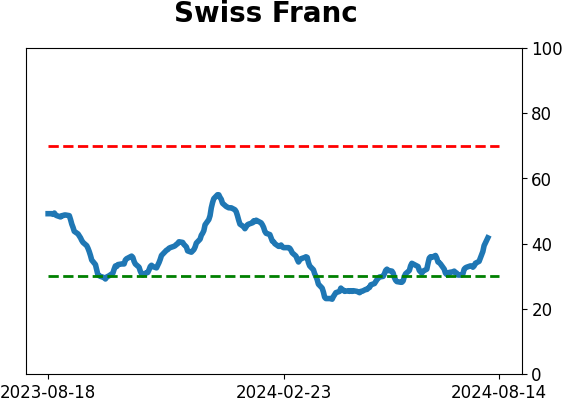
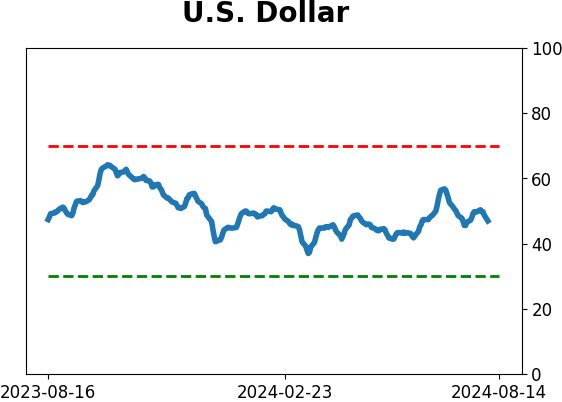
Currency ETF's - 5-Day Moving Average
|
|
|
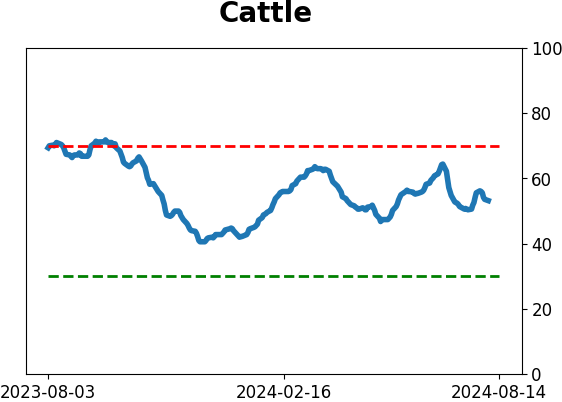
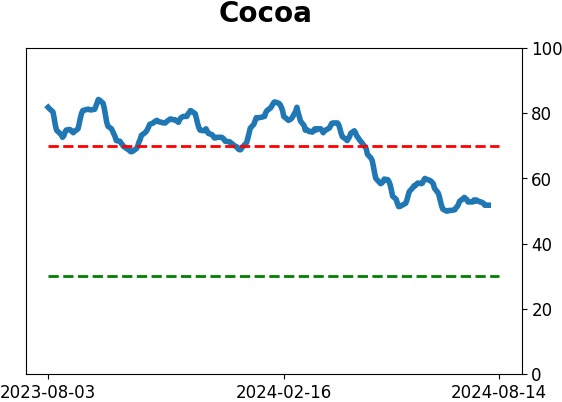
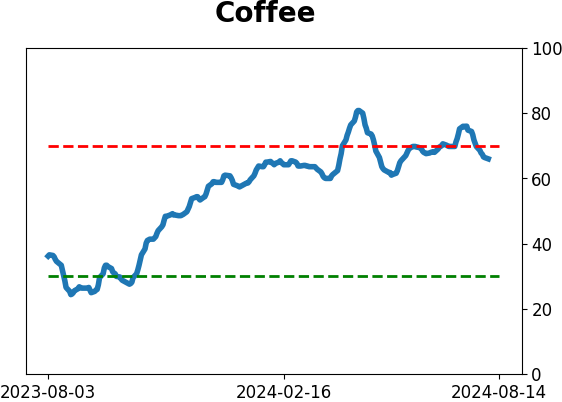
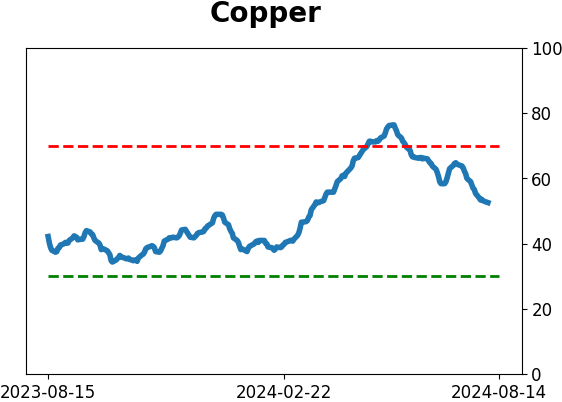
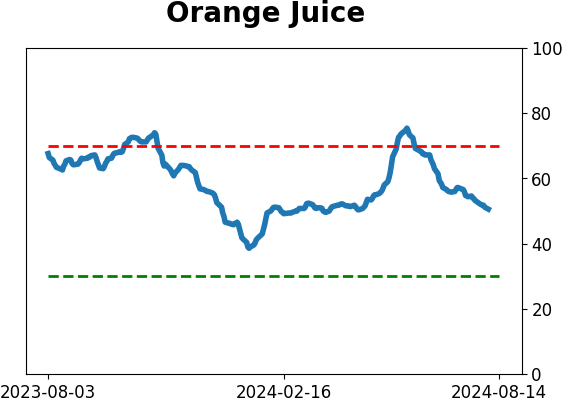
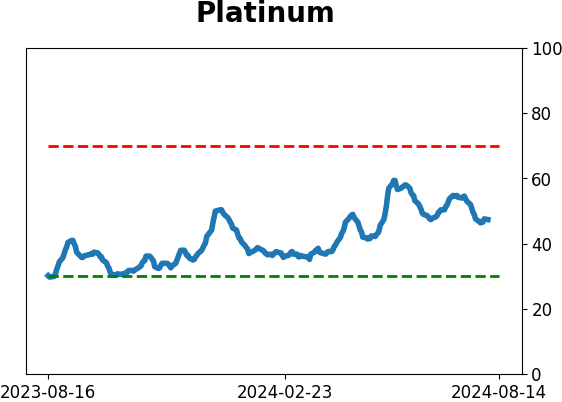
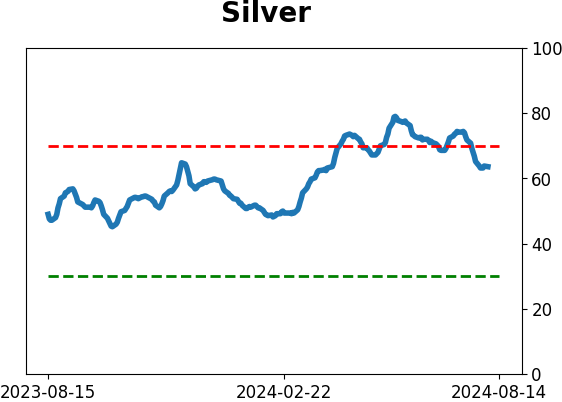
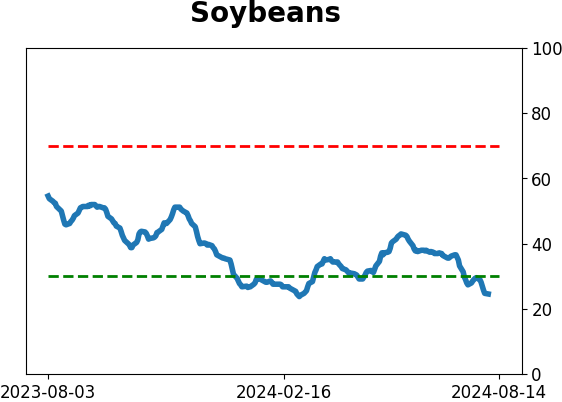
Commodity ETF's - 5-Day Moving Average
|
|