Headlines
|
|
The Nasdaq falls into a correction:
The Nasdaq Composite suffered its first correction since the end of the 2022 bear market, falling more than 10% from its high. The index has suffered more than 30 corrections since its inception, about 1/3 of which morphed into bear markets. For long-term investors, most of them proved to be decent buying opportunities, but not without substantial risk.
|
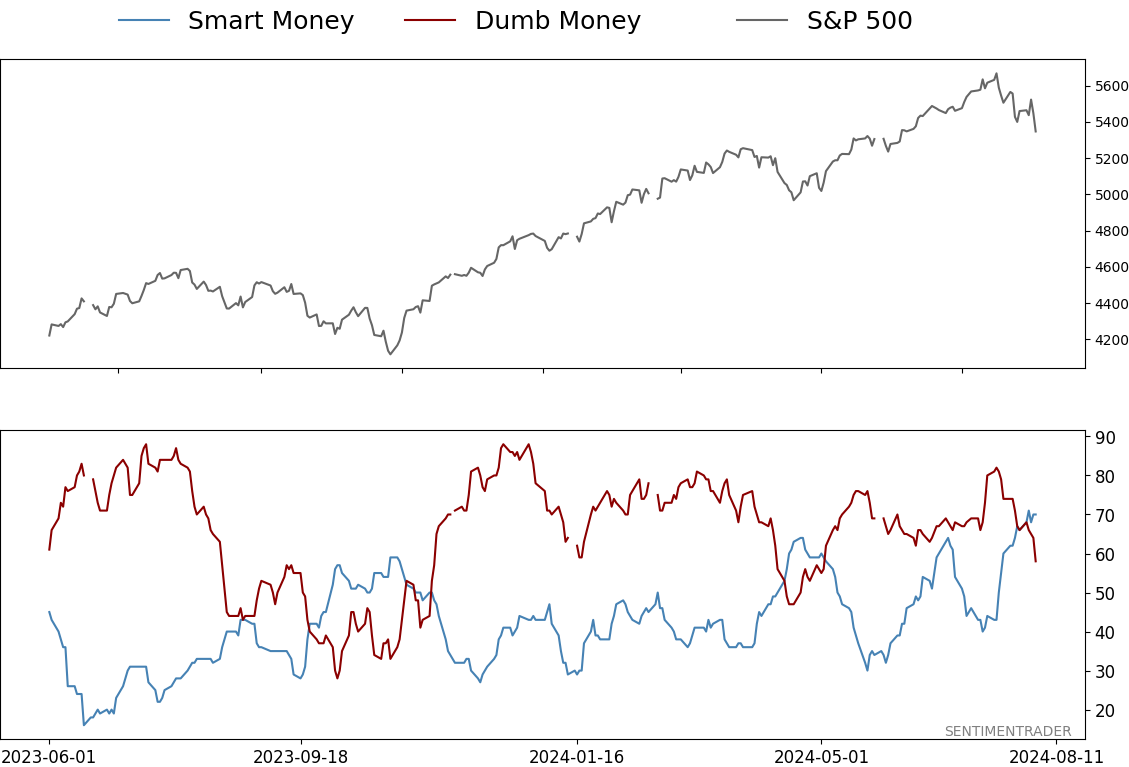
Smart / Dumb Money Confidence
|
Smart Money Confidence: 70%
Dumb Money Confidence: 58%
|
|
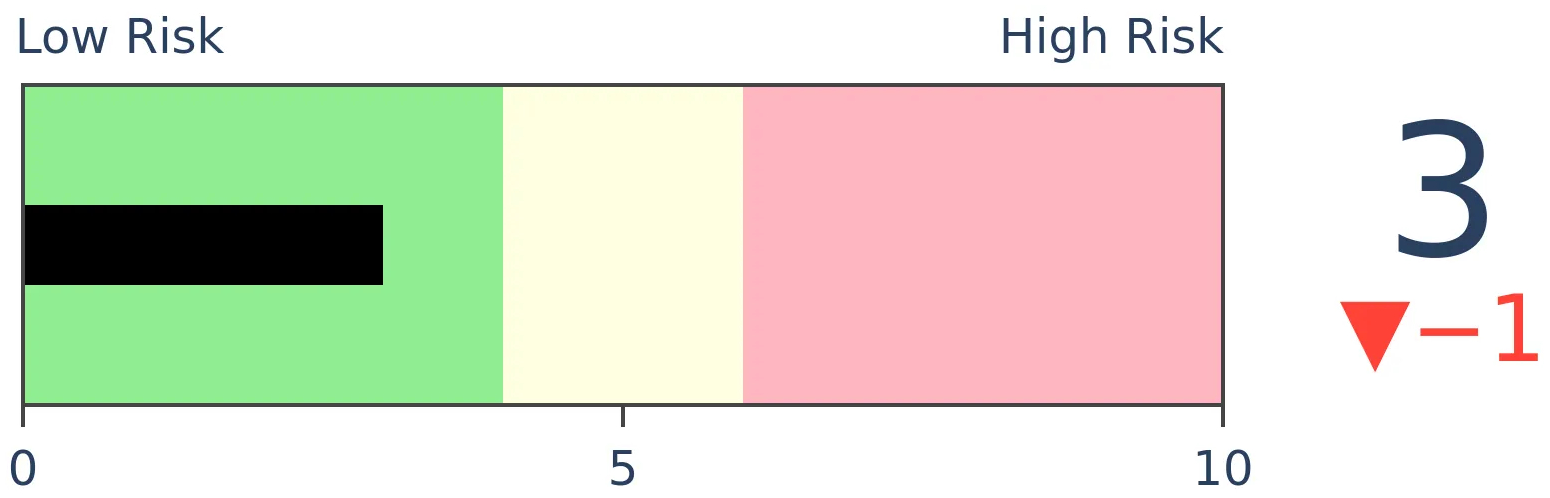
Risk Levels
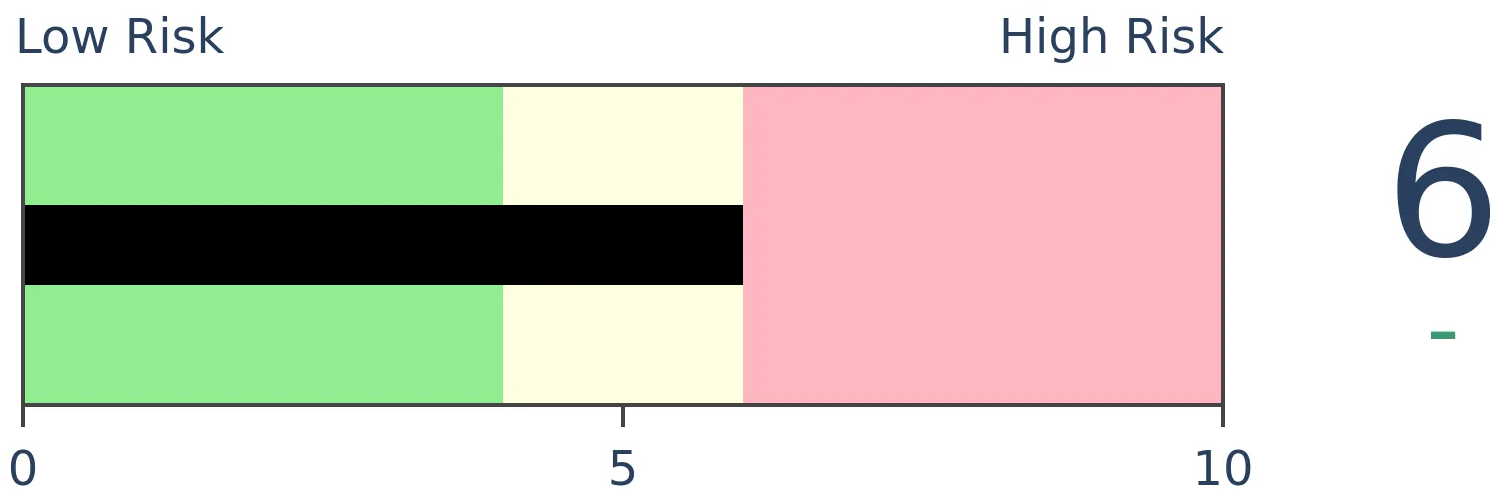
Stocks Short-Term
|
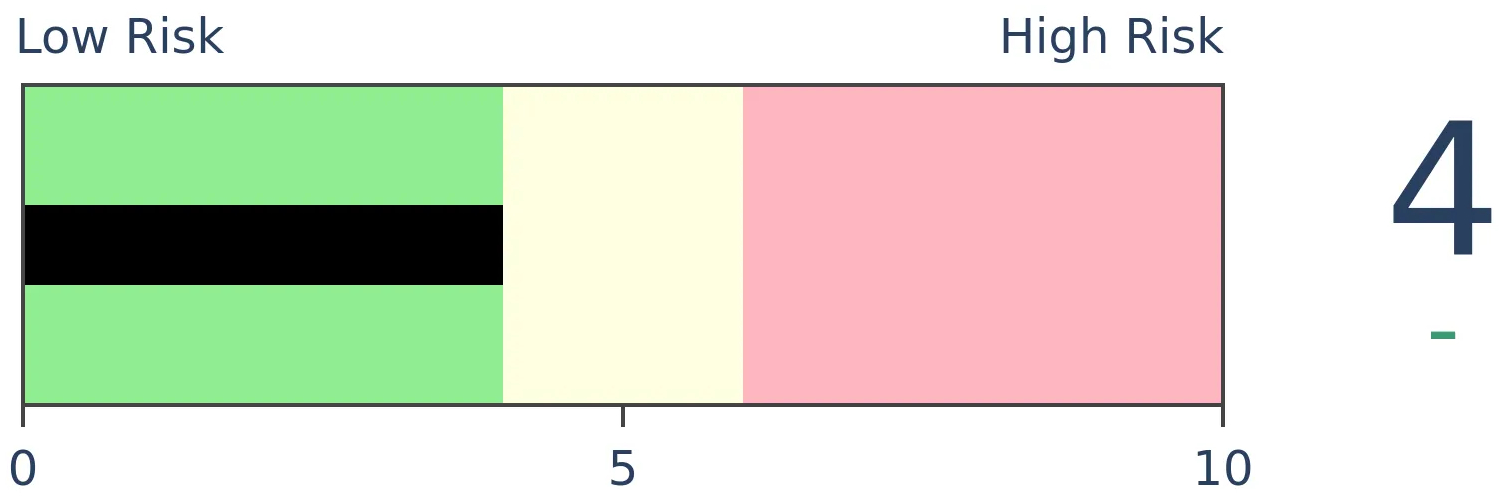
Stocks Medium-Term
|
|
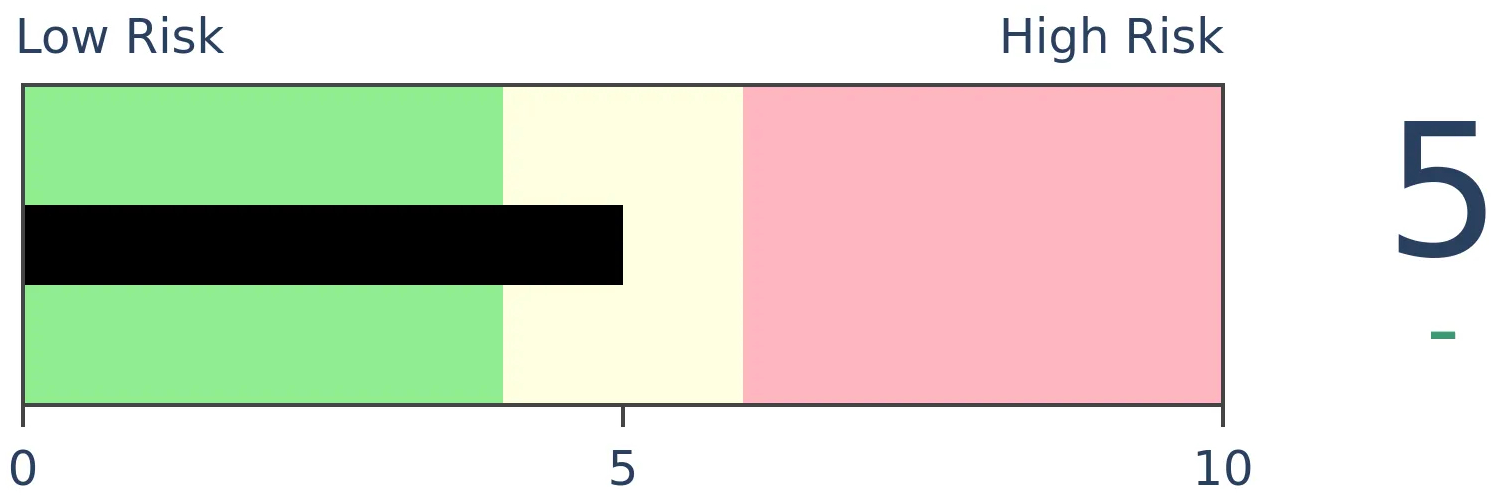
Bonds
|
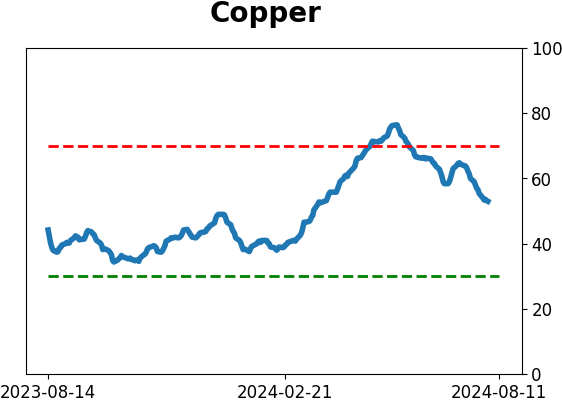
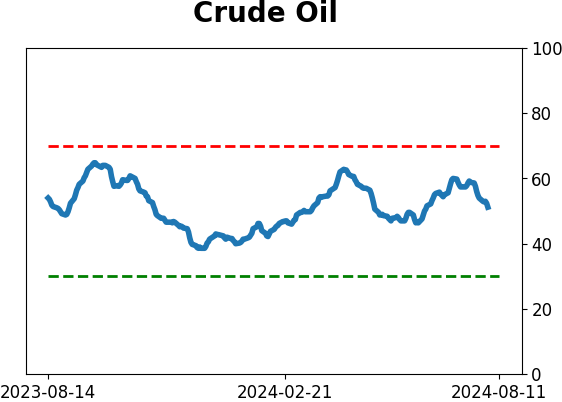
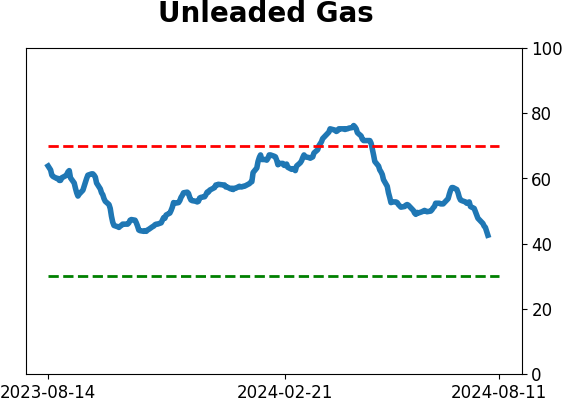
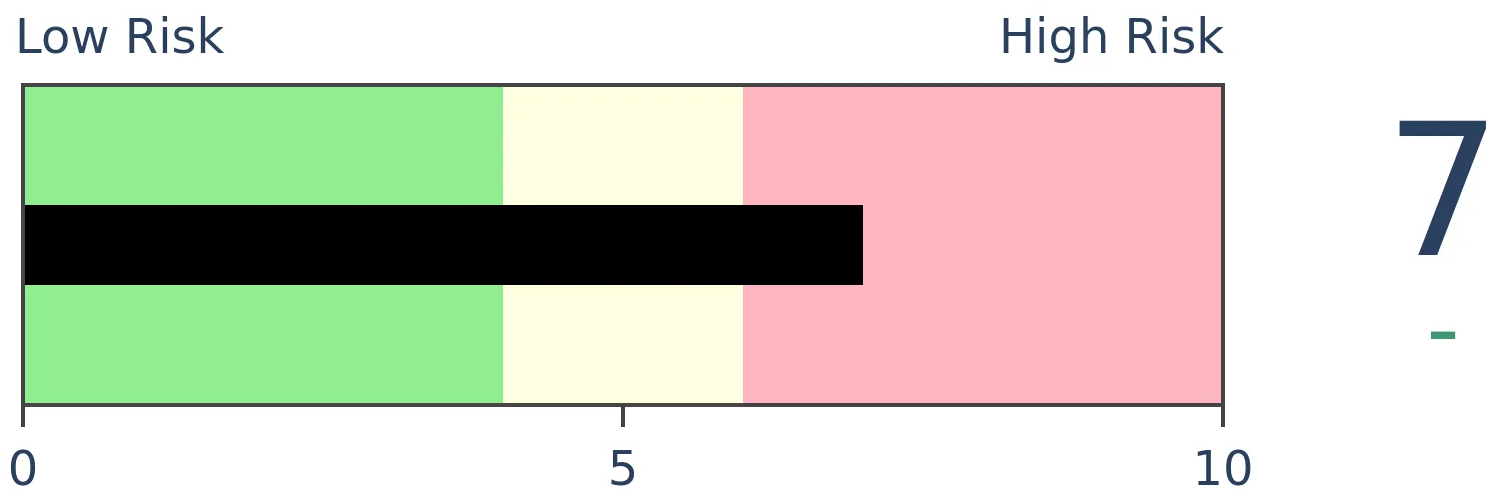
Crude Oil
|
|
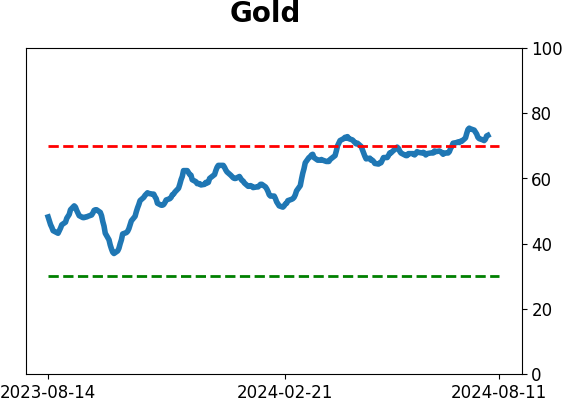
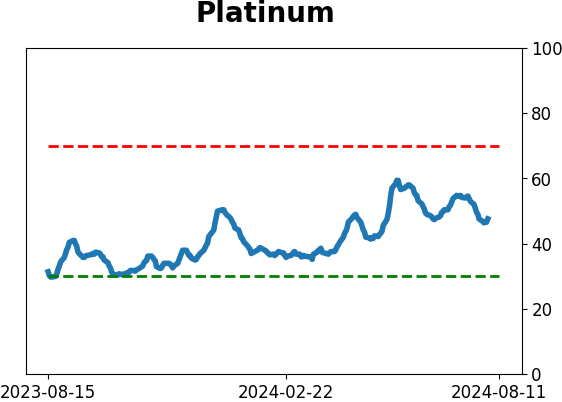
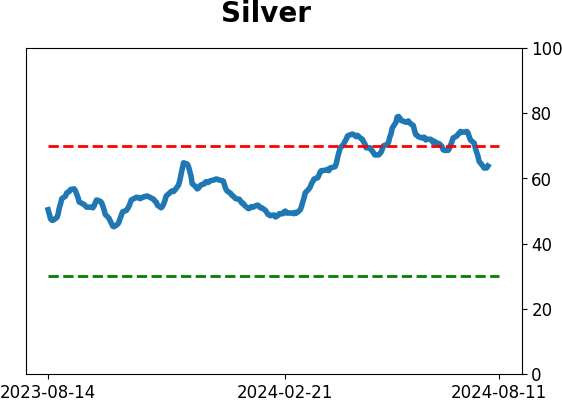
Gold
|
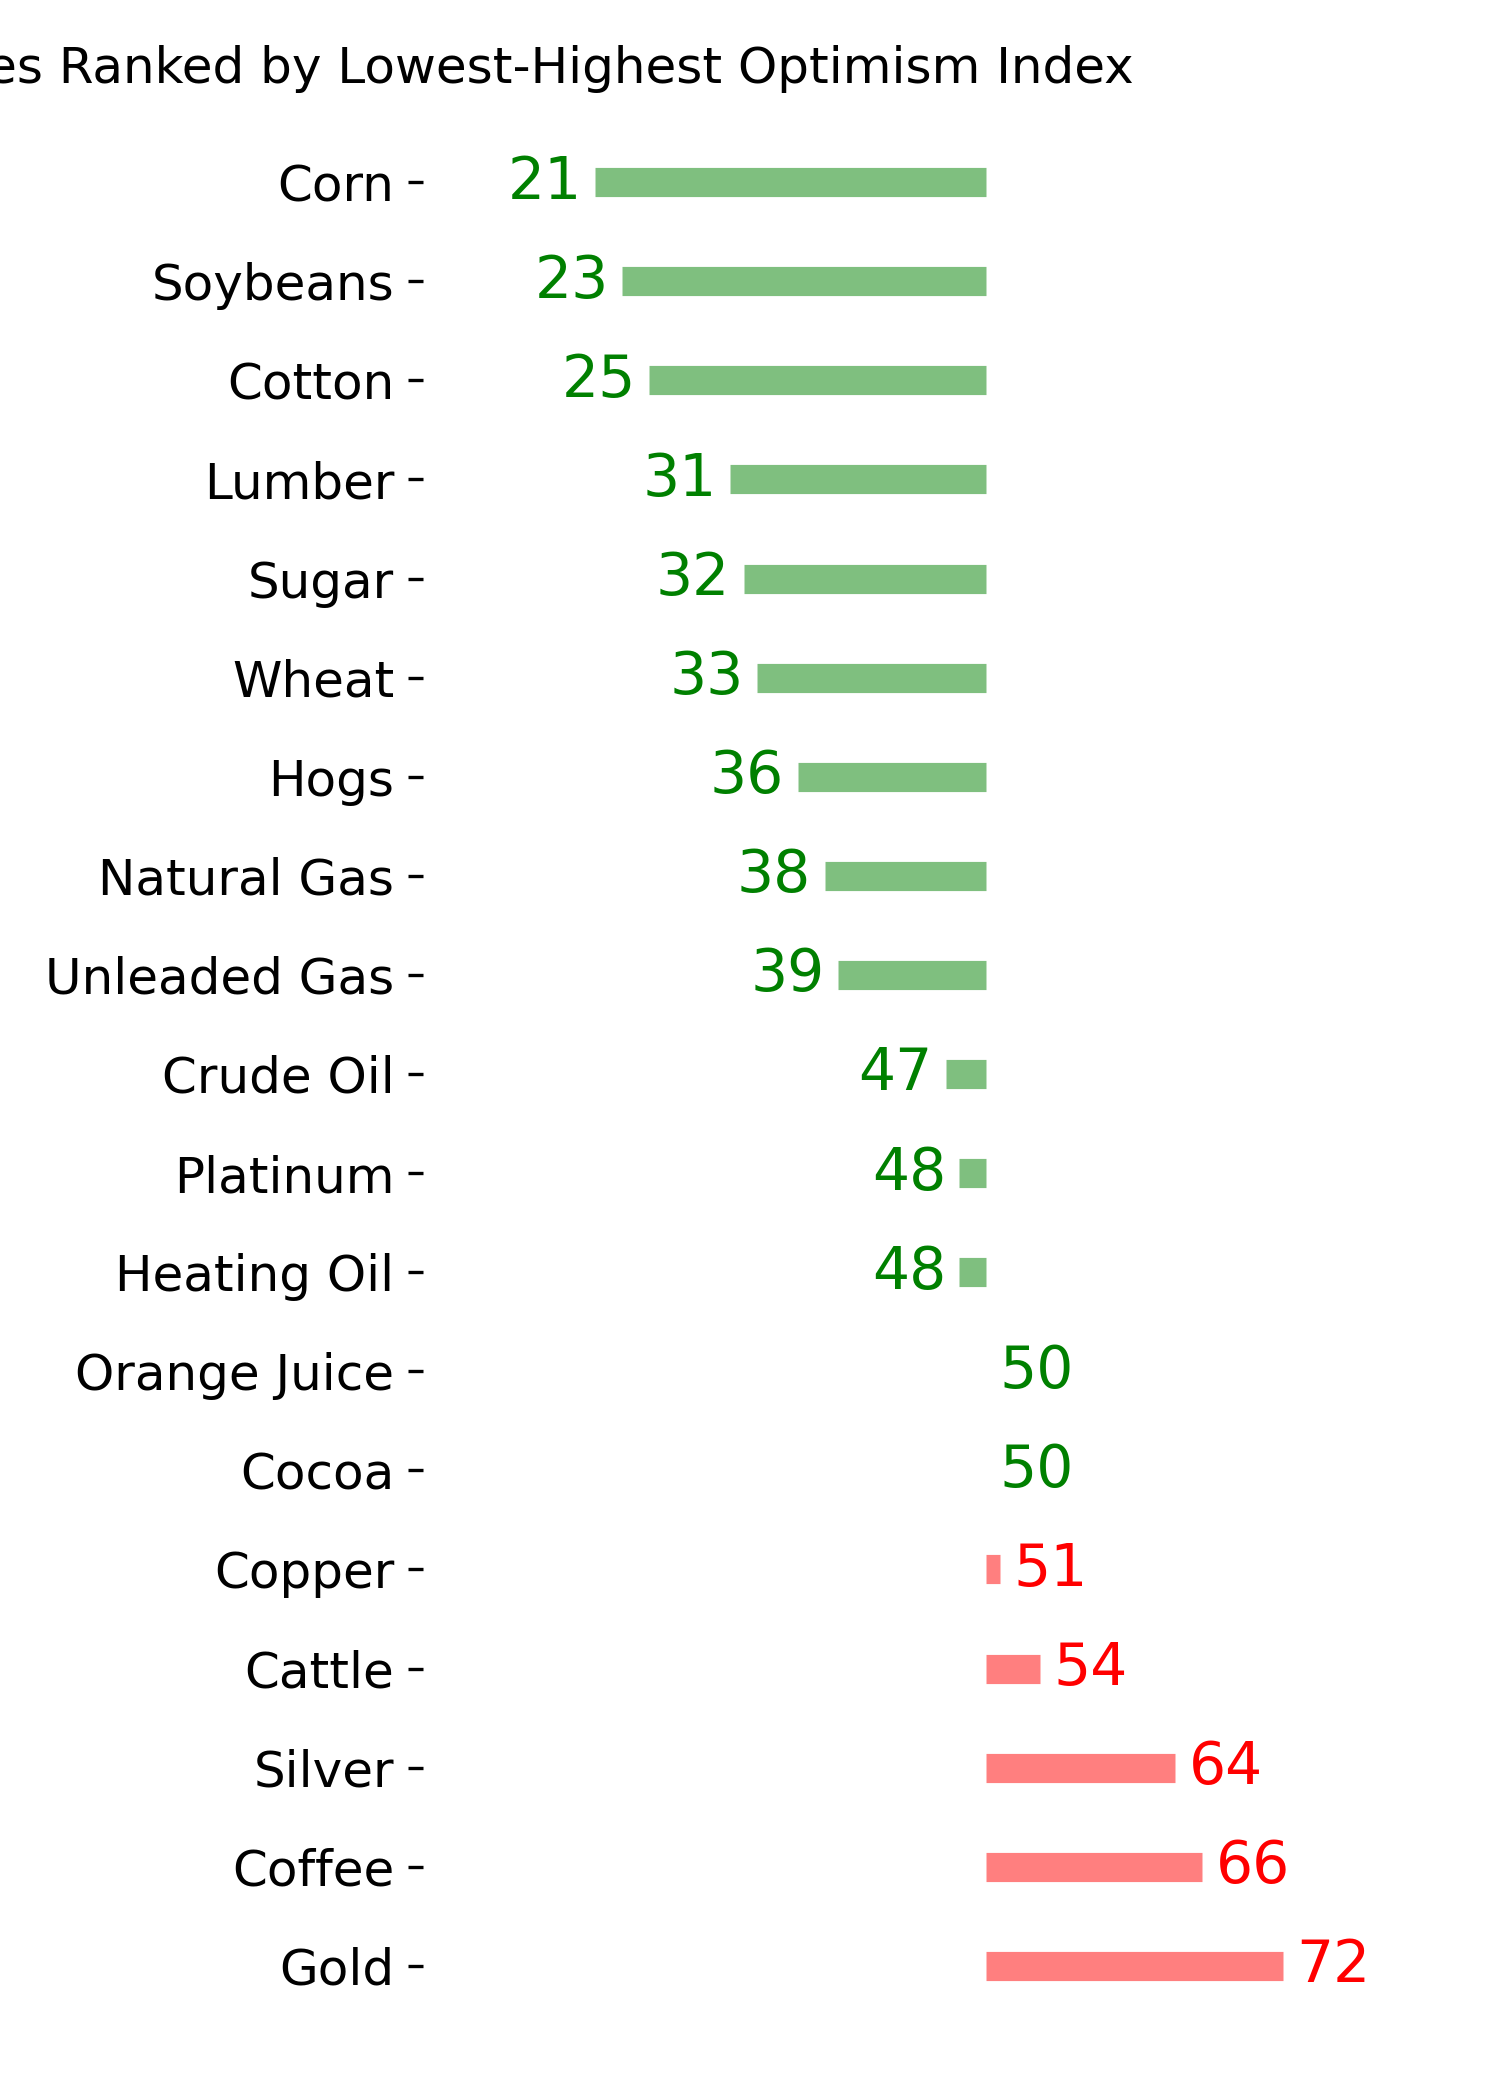
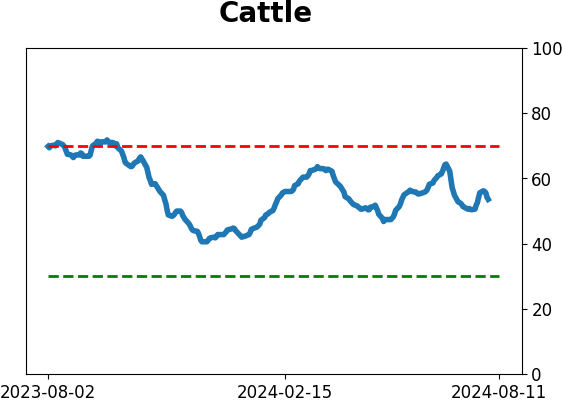
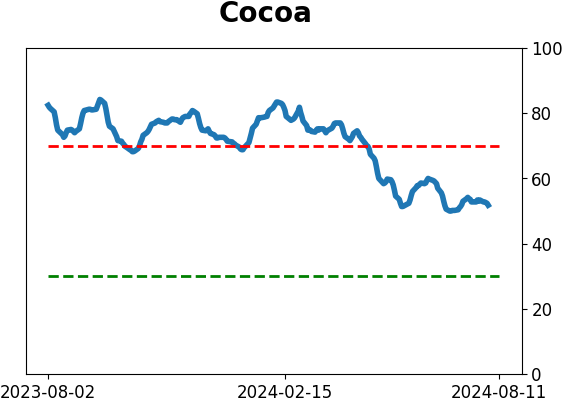
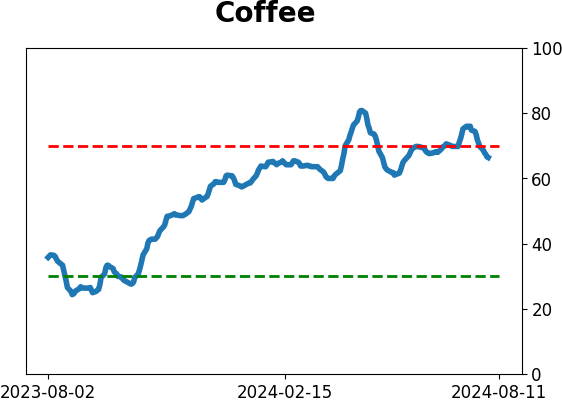
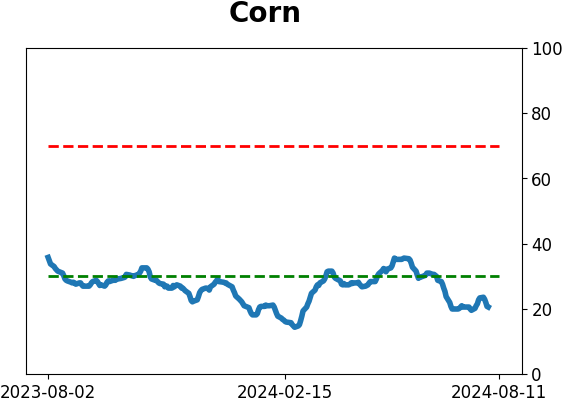
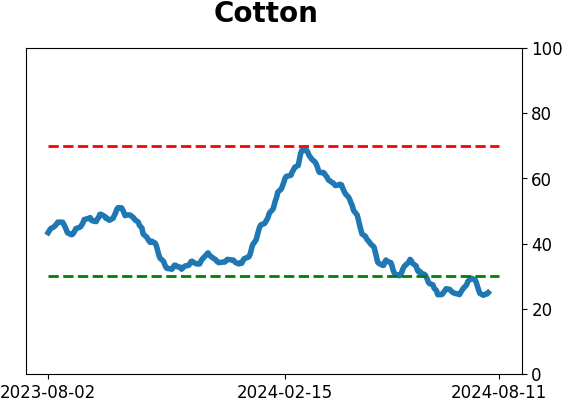
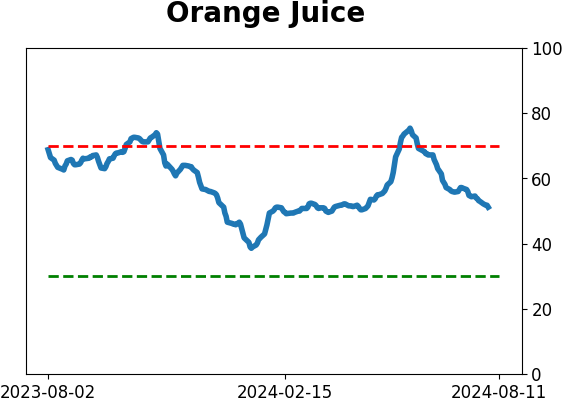
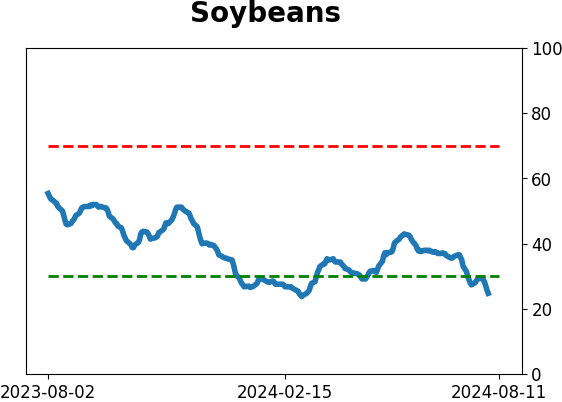
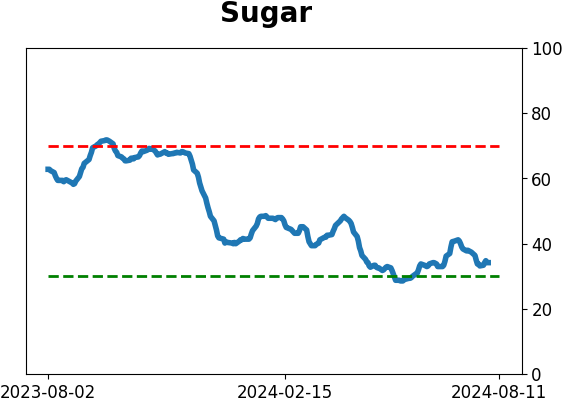
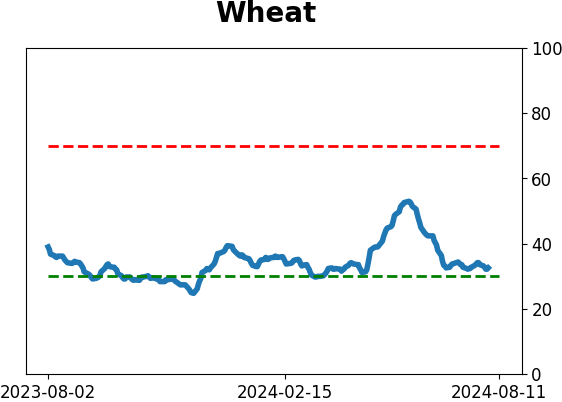
Agriculture

|
|
Research
By Jason Goepfert
BOTTOM LINE
The Nasdaq Composite suffered its first correction since the end of the 2022 bear market, falling more than 10% from its high. The index has suffered more than 30 corrections since its inception, about 1/3 of which morphed into bear markets. For long-term investors, most of them proved to be decent buying opportunities, but not without substantial risk.
FORECAST / TIMEFRAME
None
|
Key points:
- The Nasdaq Composite has dropped more than -10% from its peak after having been at a record high
- The index has fallen into a correction for the 33rd time, many of which have seen limited further selling pressure
- About 1/3 of the corrections have morphed into bear markets, so interim risk was elevated even for long-term investors
Finally, back to correction territory
The "at some point" point has arrived.
Calm and uncorrelated conditions that were likely to lead to an event have reversed sooner rather than later. This consequence happens nearly every time, and nearly every time, people act surprised. This is why we focus so much on sentiment - markets and economies change; people don't.
Former winners are among the hardest-hit in recent days, many of which populate the Nasdaq. The Composite is now down more than 10% from its peak for the sixth time in the past five years, three of which more or less marked the bottom. Once the index hit correction territory, it was the bottom or very nearly so. The two times it didn't bottom quickly, it morphed into tough losses.
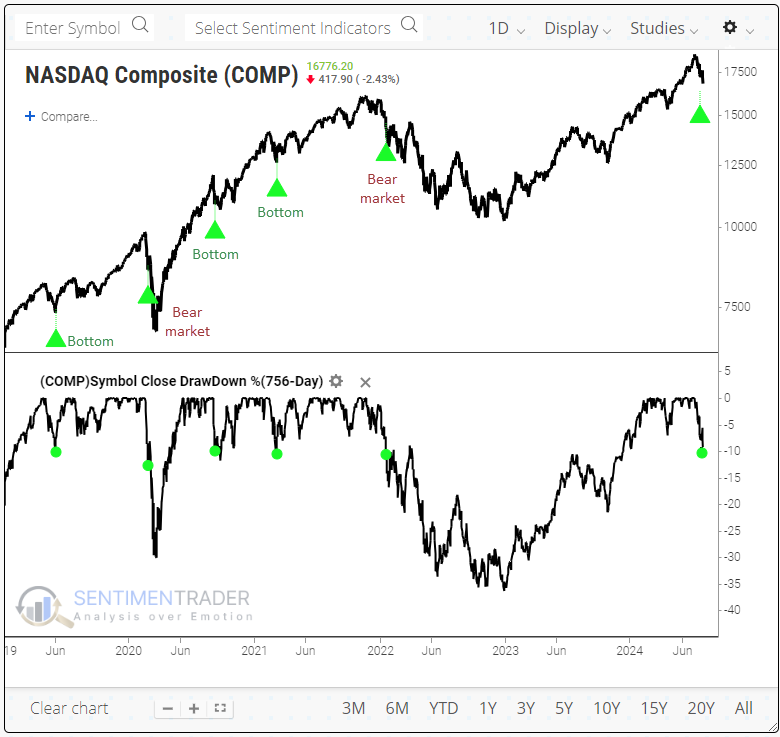
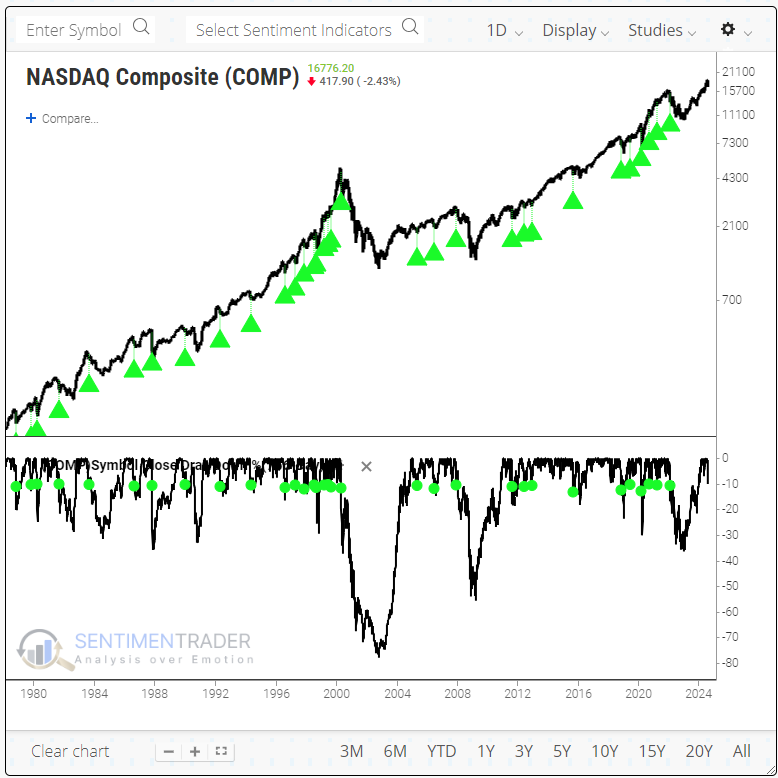
A 10% correction from what had been multi-year highs is a common occurrence for the Nasdaq Composite. Since its inception over 50 years ago, it has been triggered 32 times. Using Backtest Engine 2.0, we can see how often investors have gone through these scares (click here to load the test, then Run Backtest to execute it).
The chart shows every unique time the Nasdaq was at least at a 3-year high and then suffered a -10% drawdown.
Corrections were just-okay entries for long-term investors
The test results show that forward returns for the Nasdaq were mediocre.
It was mostly positive over the following weeks and months, but the win rate was uninspiring. Over the next 6-12 months, there was more of a case to be made to be a buyer. A year later, average risk was -7.0% versus reward of +25.6%, which is above the 3-to-1 reward-to-risk ratio that we prefer to see.
Since the 2008 global financial crisis, these corrections proved to be excellent buying opportunities, even including the pandemic...until the 2022 bear market.
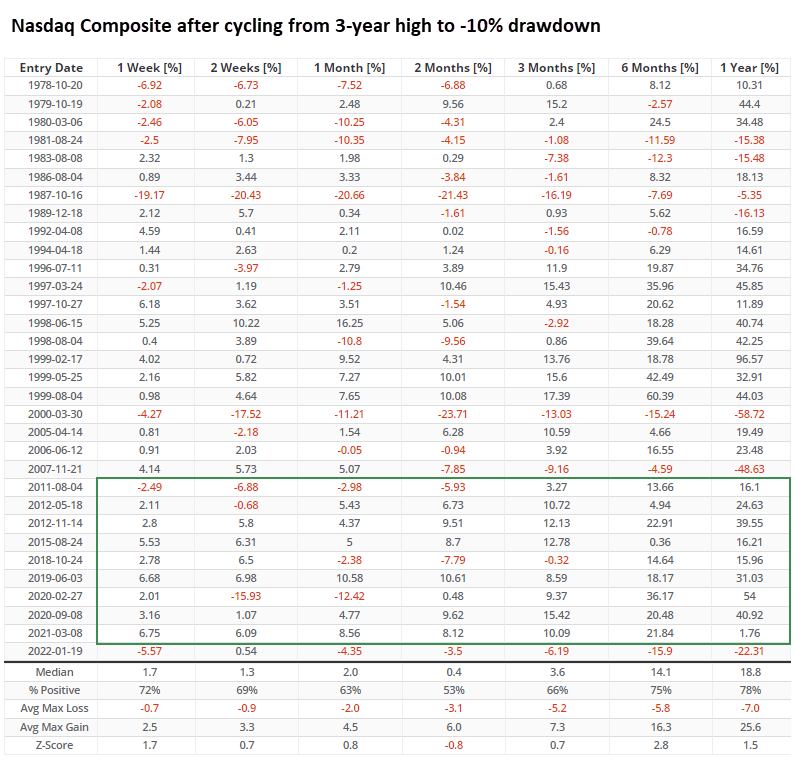
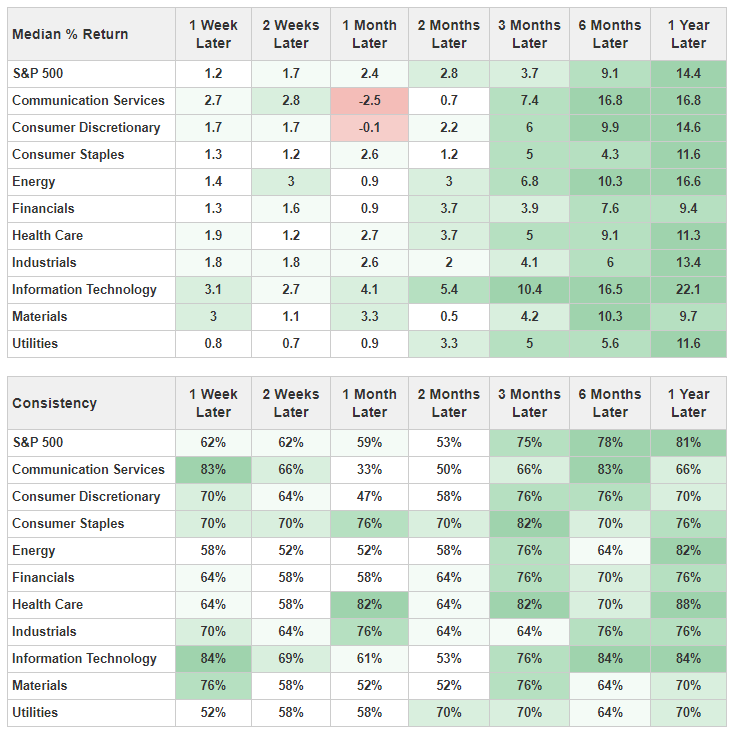
The following table contains a lot of numbers, but it's helpful to see the risk that an investor would have suffered if buying into the initial correction. Within the next three months, the Nasdaq suffered a further 10% or larger loss 11 times. In other words, the corrections morphed into bear markets about 1/3 of the time.
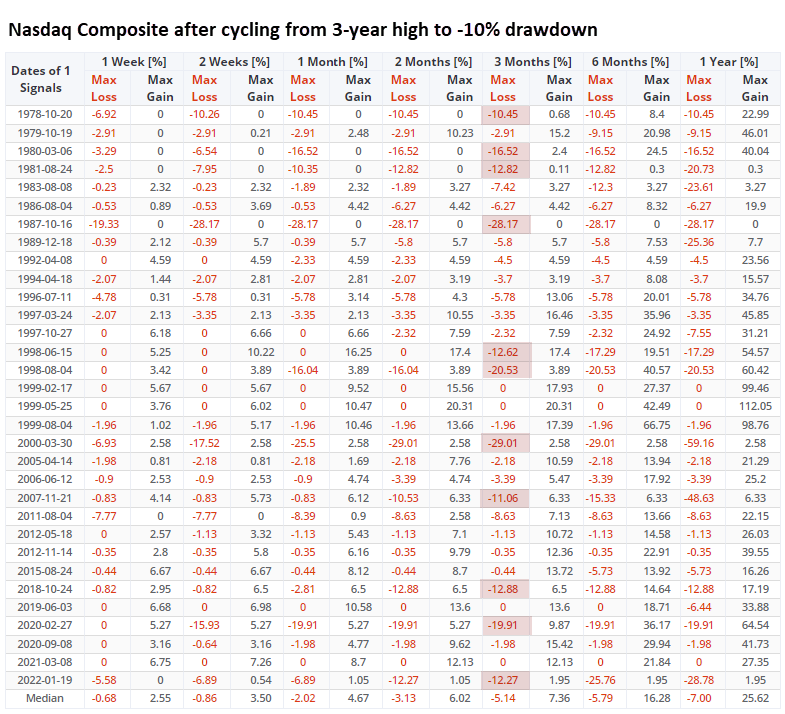
Also, while the average risk was only -7.0%, the Max Loss column over the next year shows that the average hides quite a few large interim losses, and there were some years when the reward was minuscule.
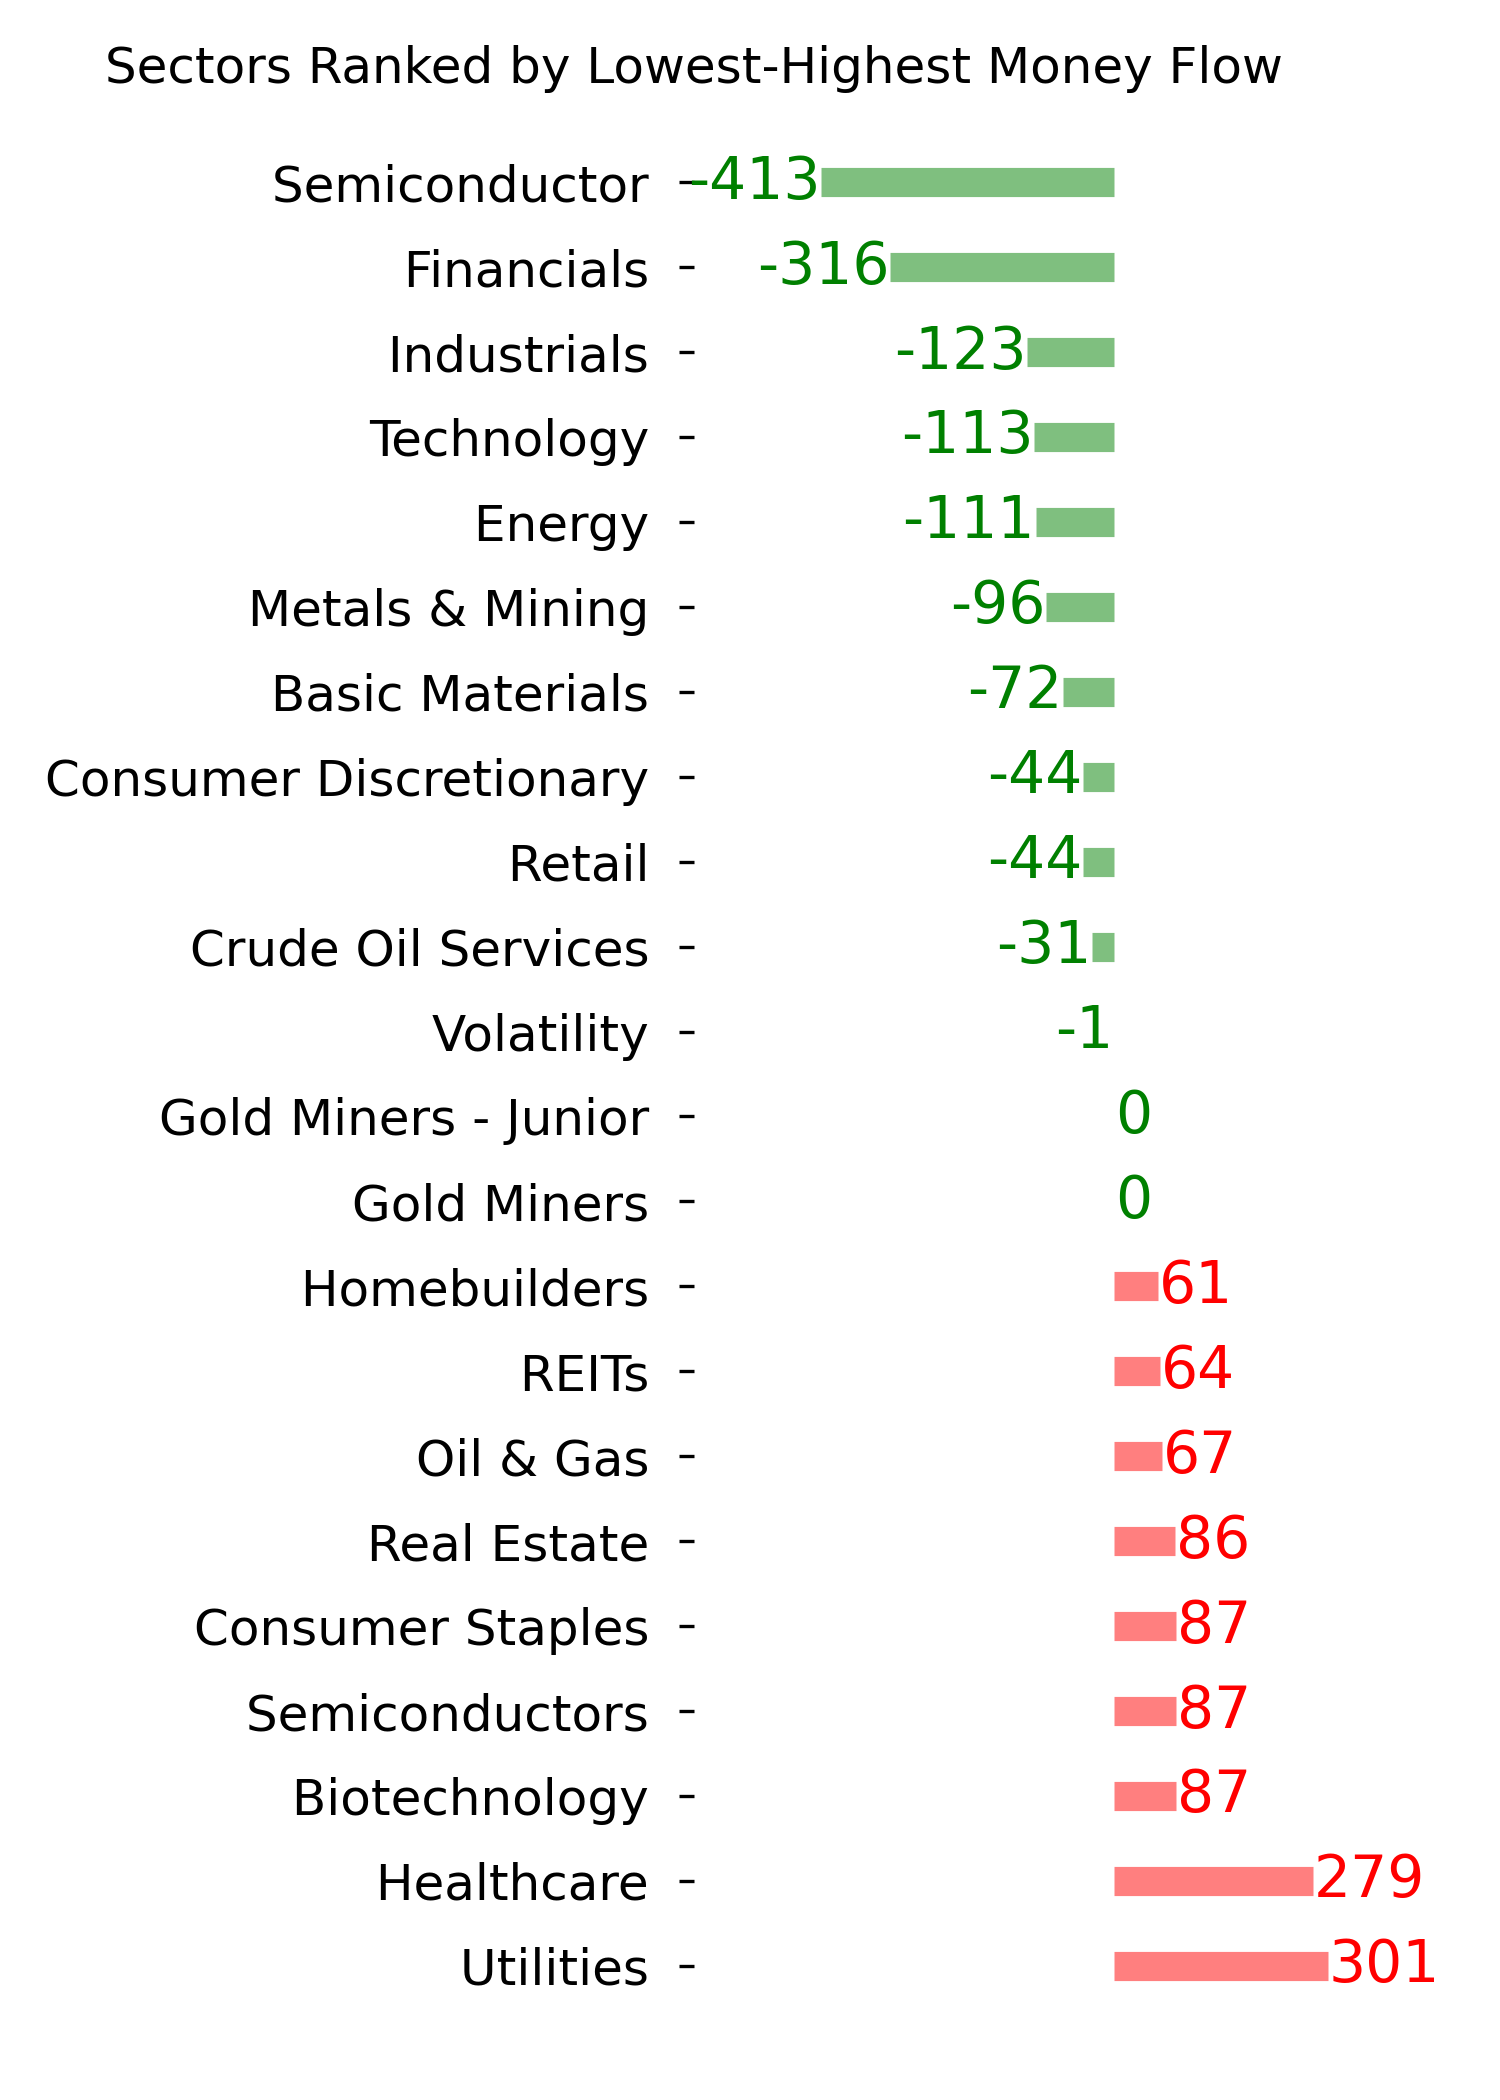
Interestingly, the Major Sectors tab shows us that information technology was the best-performing sector over the next 6-12 months. Over the medium term, however, defensive-leaning sectors like consumer staples and health care showed the most consistent win rate.
What the research tells us...
With early indications of panic, conditions will likely change quickly in the coming days. It's already been a bad sign that tech stocks haven't stopped their losses after a troubling number of them entered corrections and bear markets, so we should watch these figures. It's possible that a day or two of genuinely overwhelming selling pressure could spike these numbers into exhaustive territory, which would suggest the risk/reward would shift more favorably to buyers.
The Nasdaq's initial move into correction territory has not been a compelling buy signal on its own. While the index has turned around almost immediately a handful of times, it has failed to do so too many times to be considered a low-risk entry. For long-term investors, it has usually paid to add some exposure, with the full knowledge that there's a relatively high probability of further losses within the next few months.
Indicators at Extremes
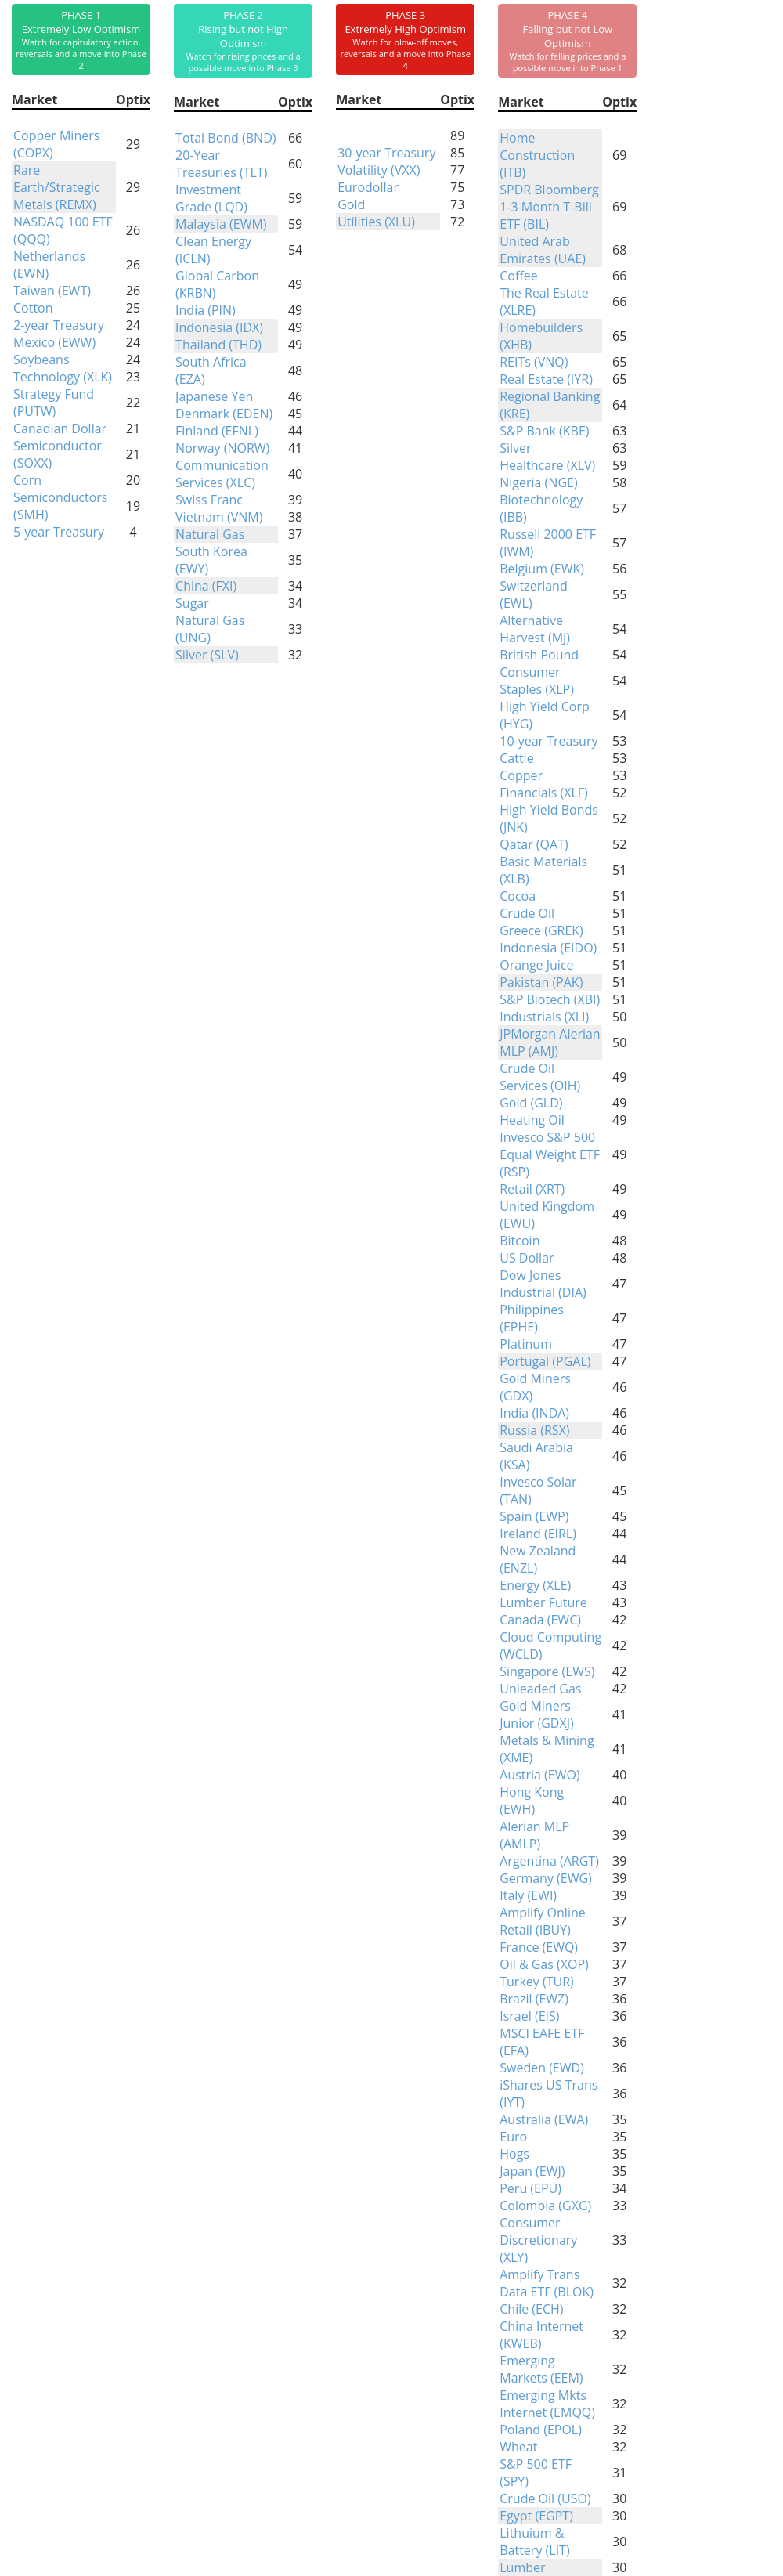
Phase Table
Ranks
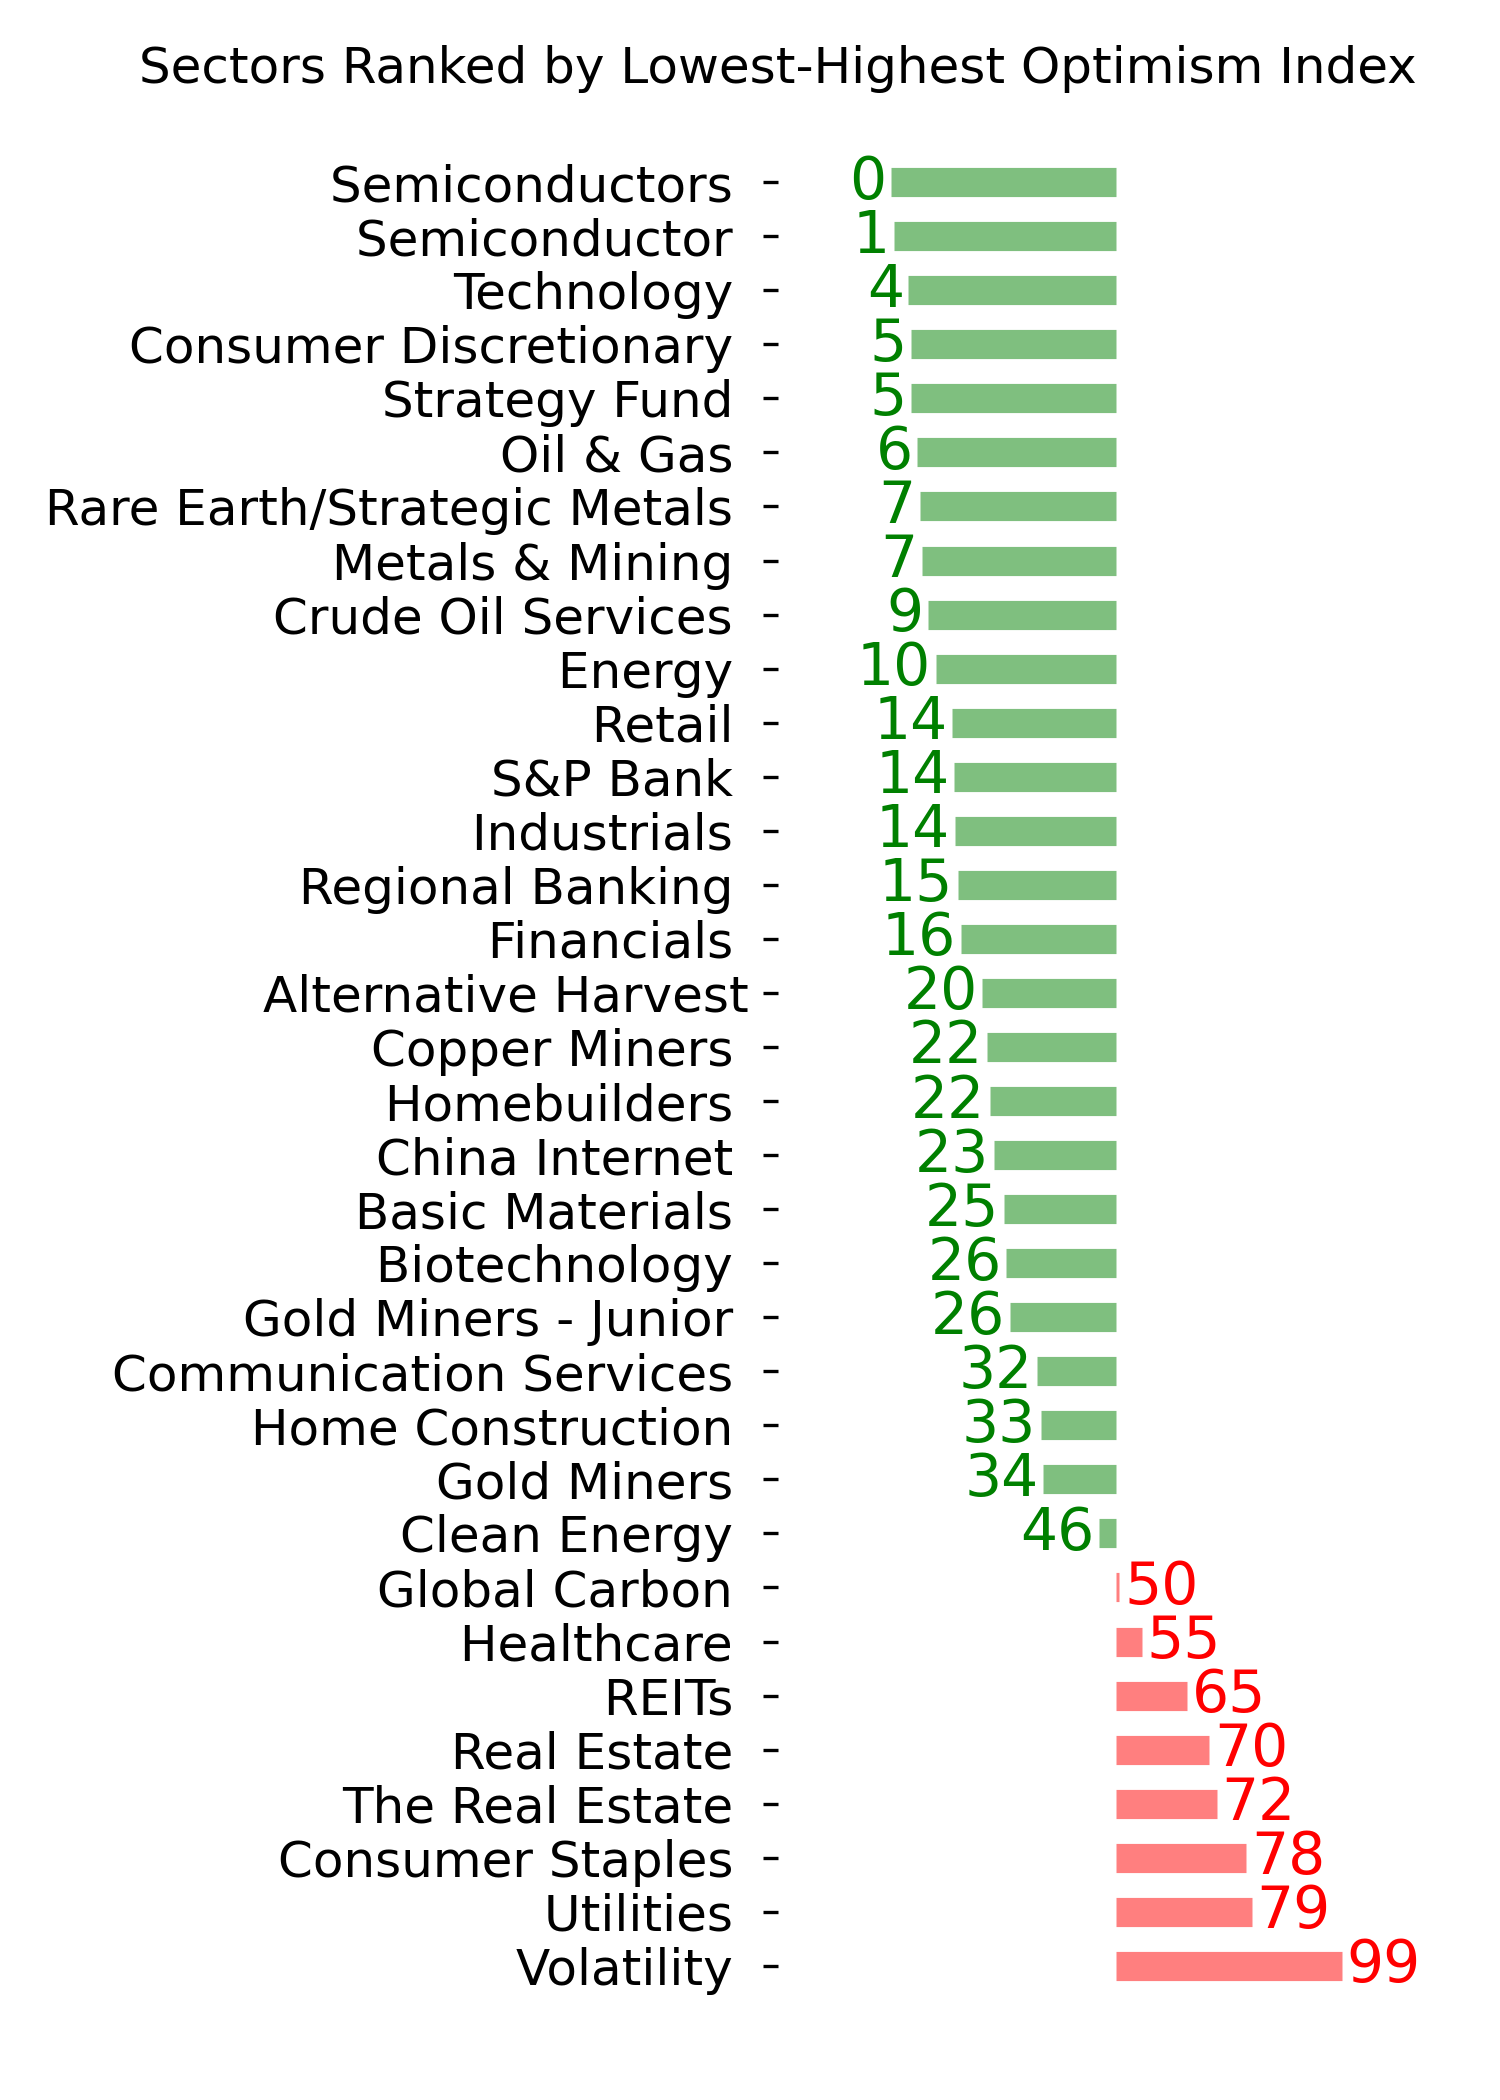
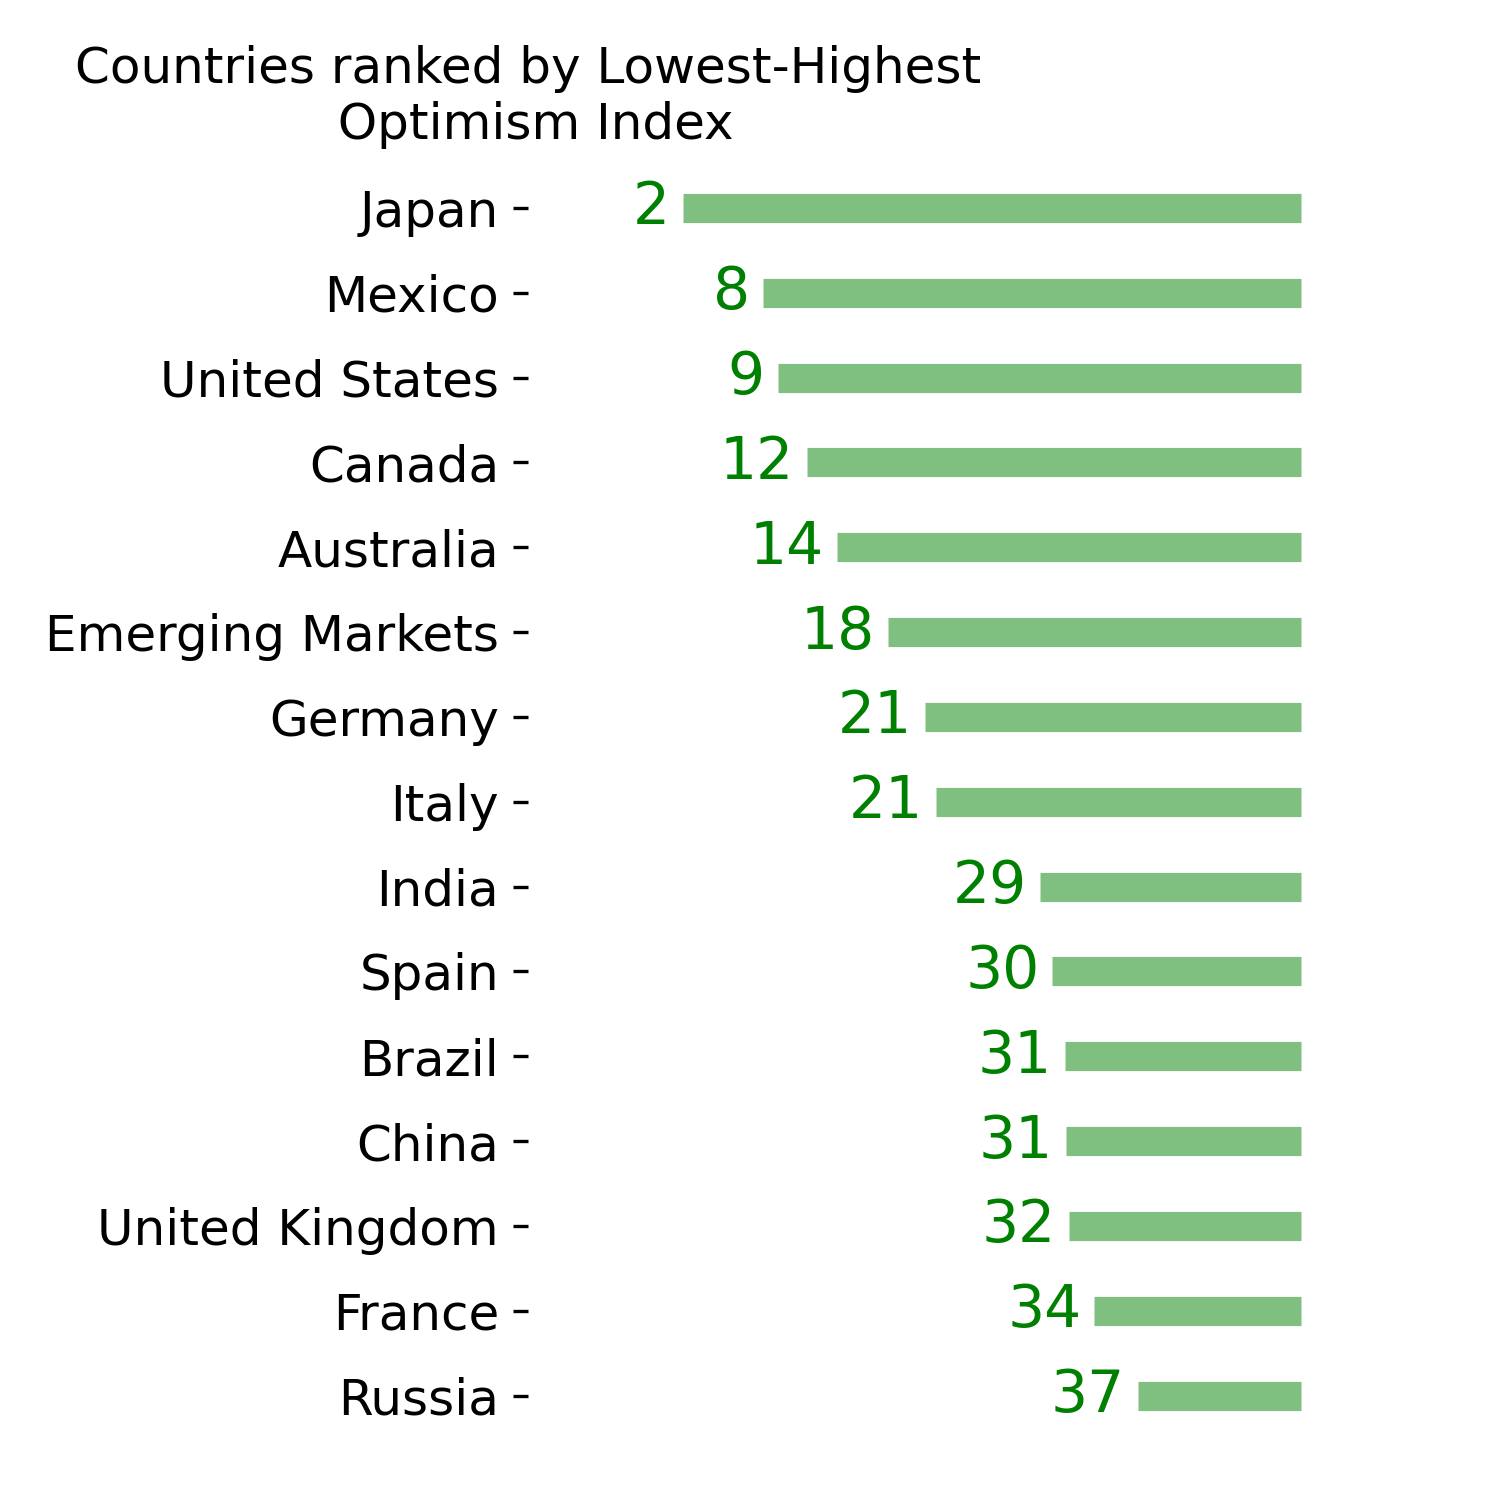
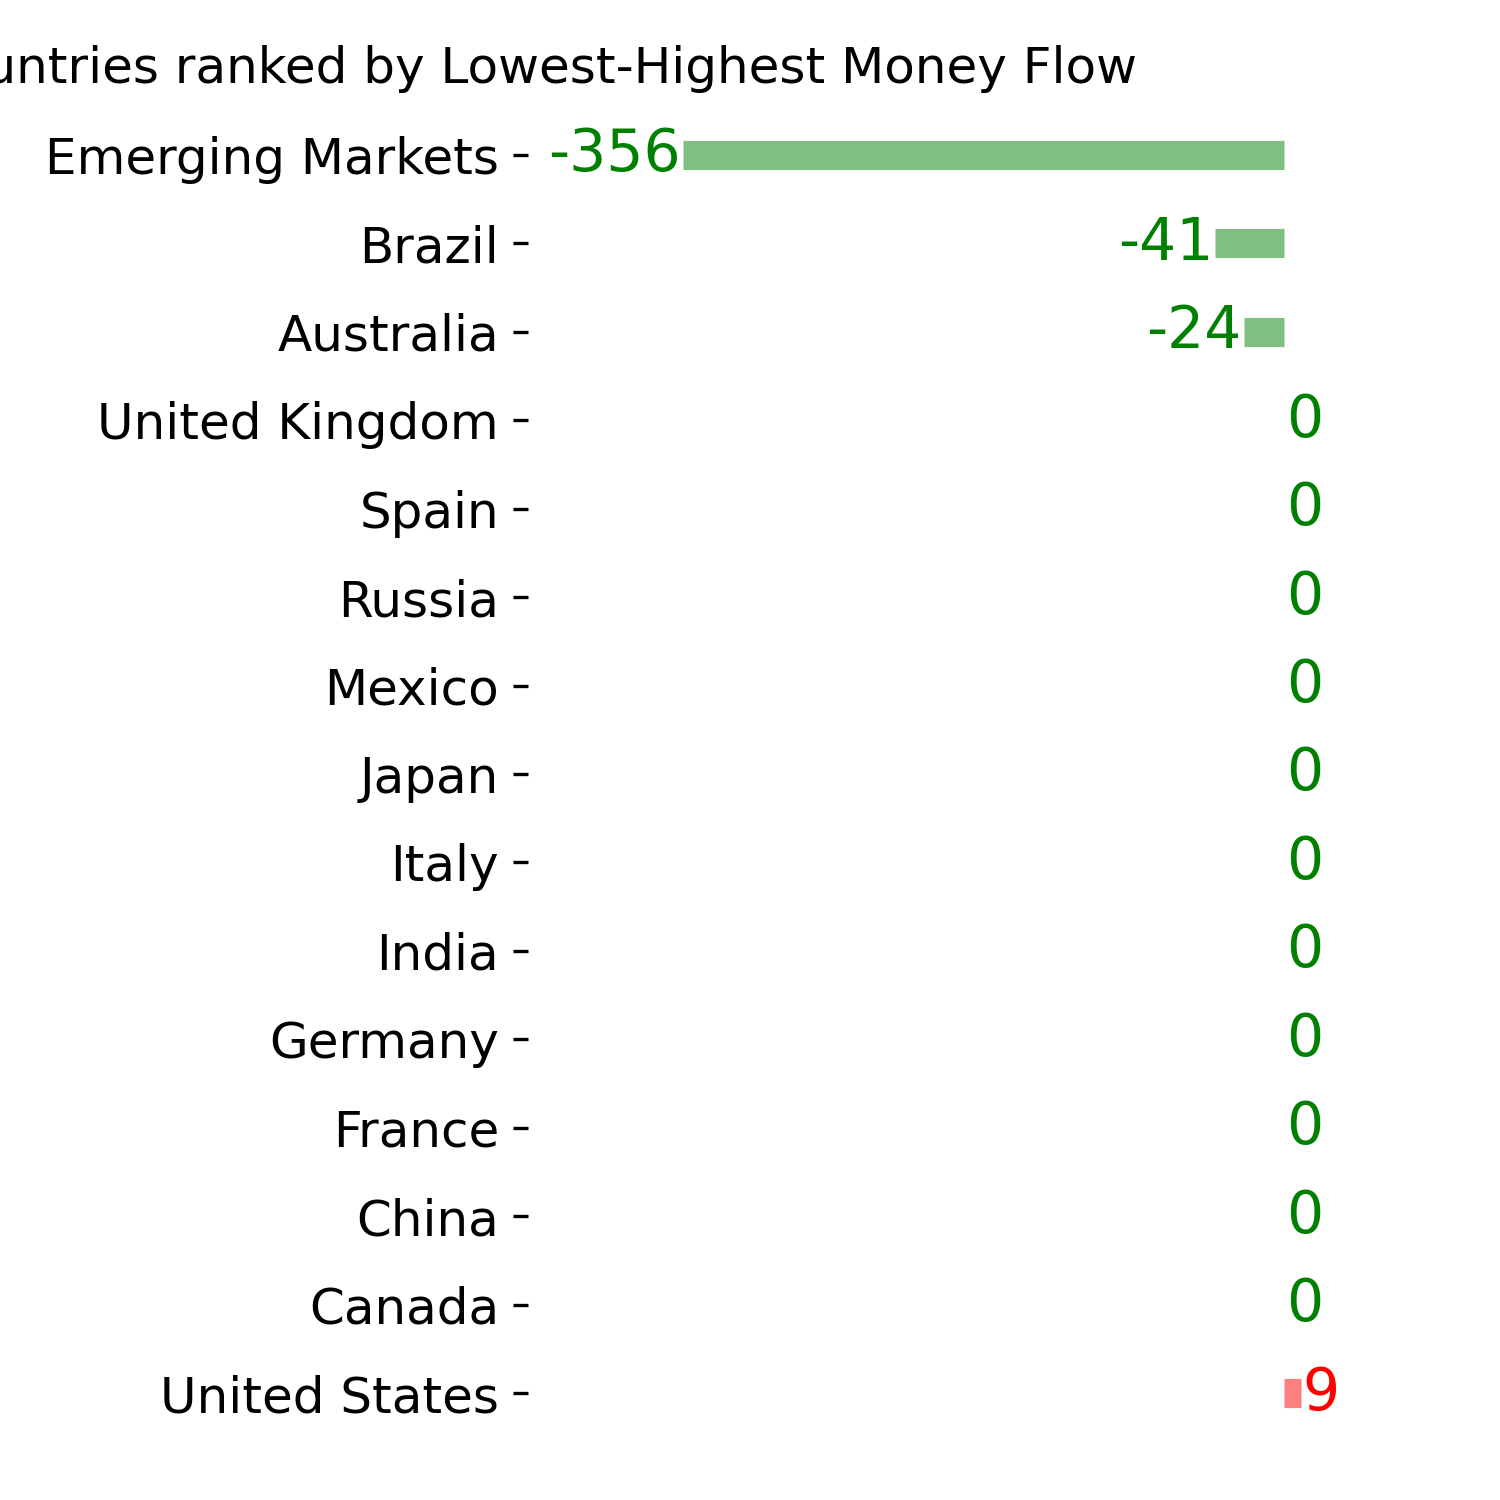
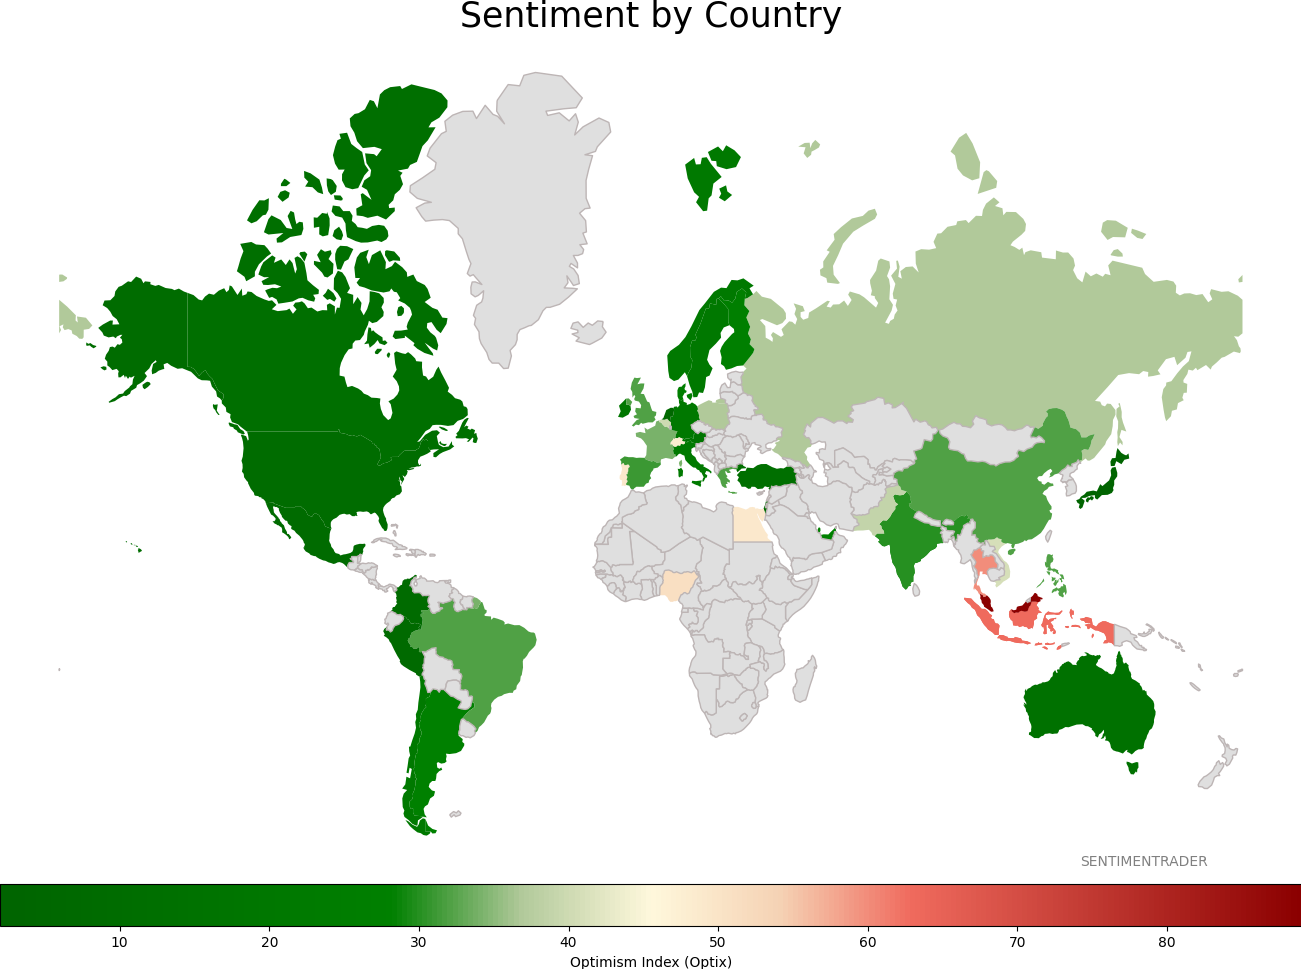
Sentiment Around The World
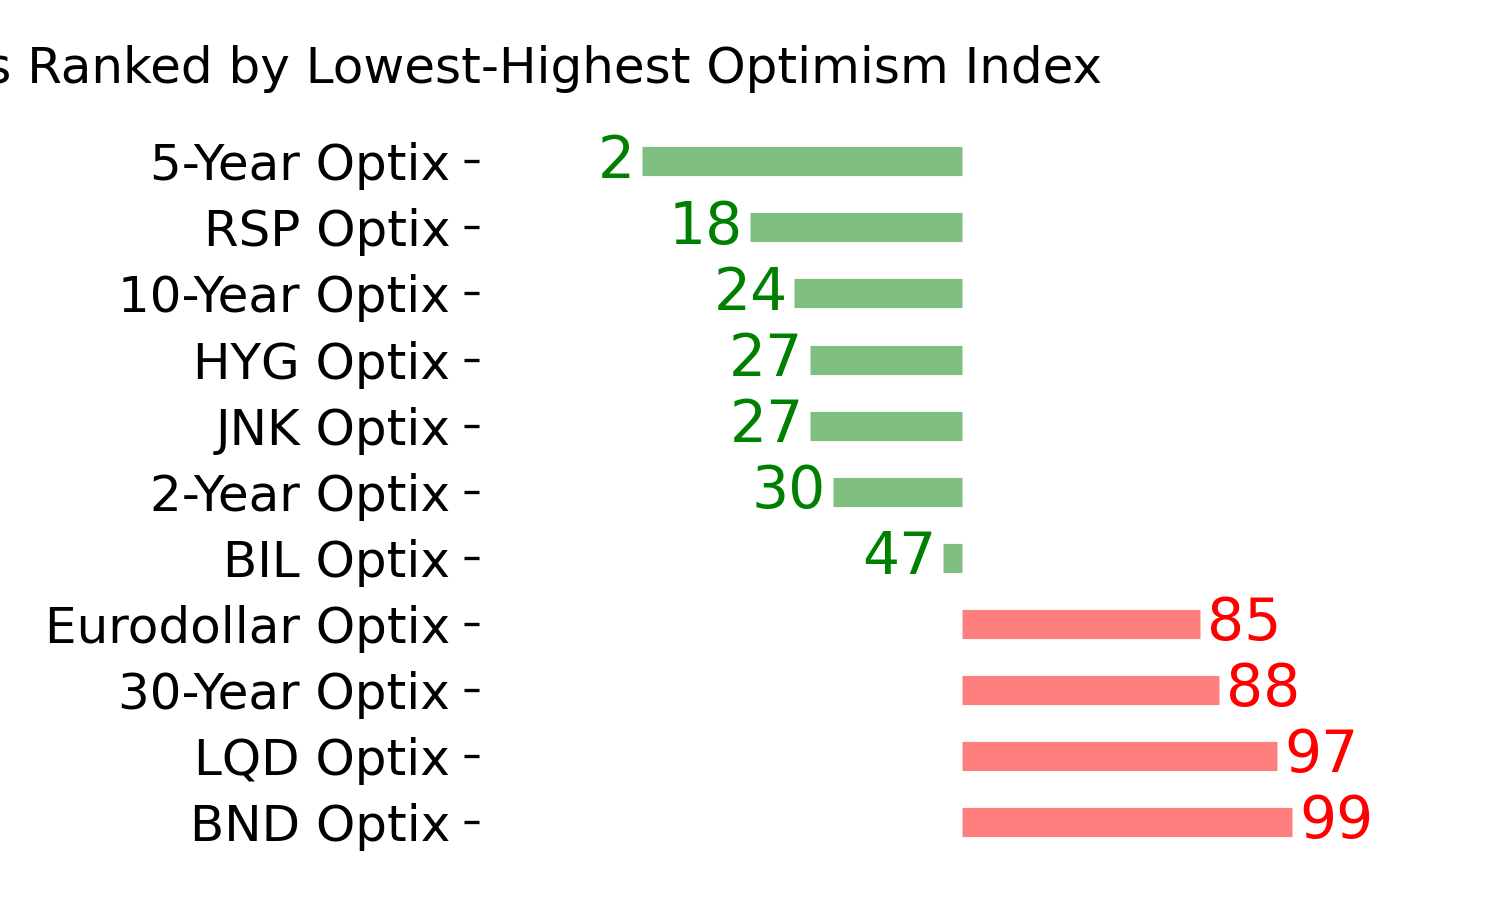
Optimism Index Thumbnails
|
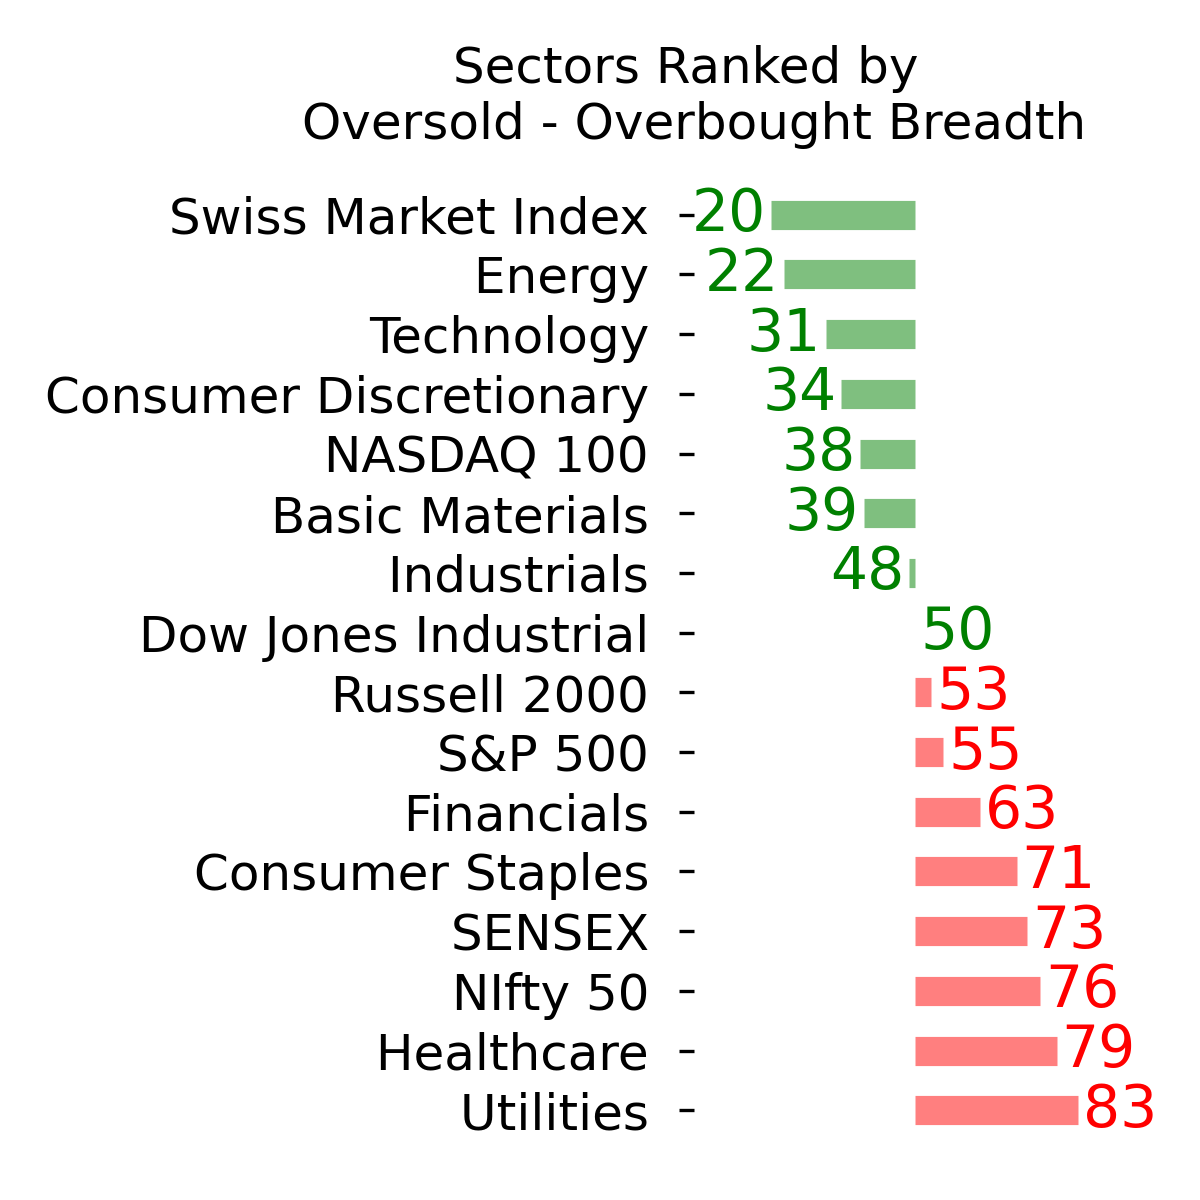
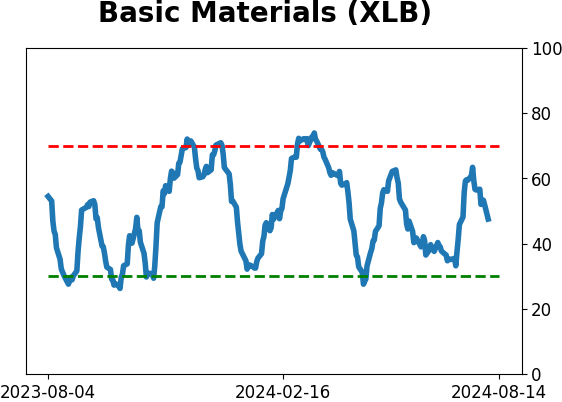
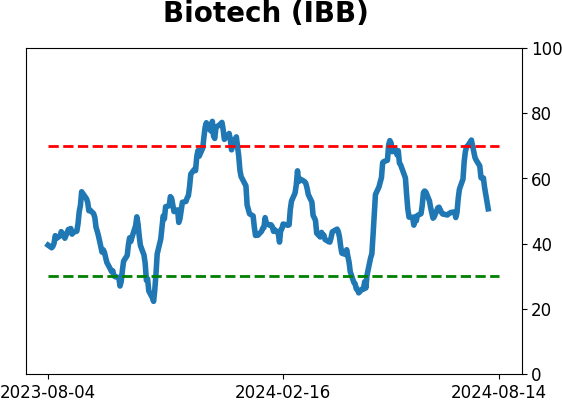
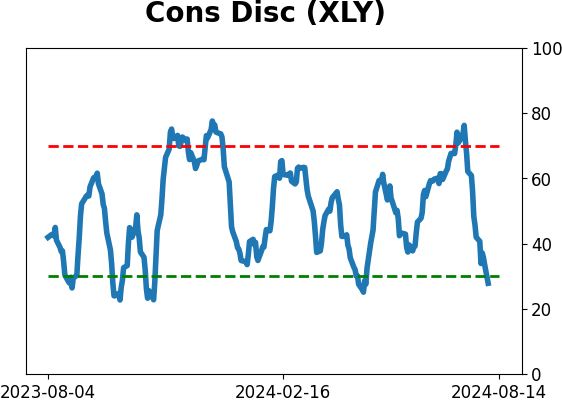
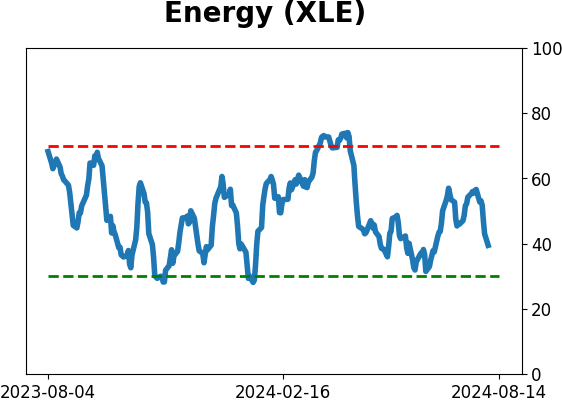
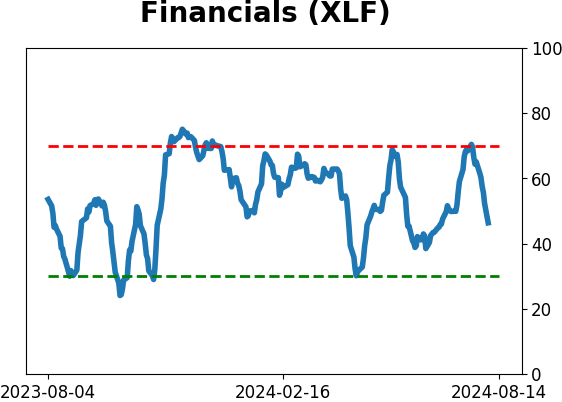
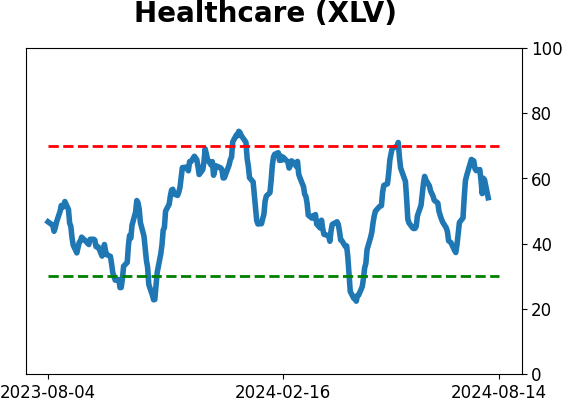
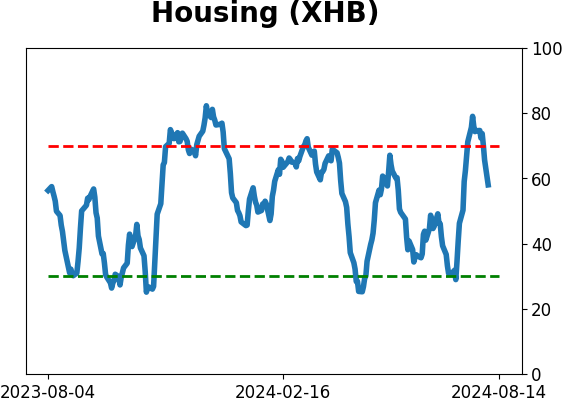
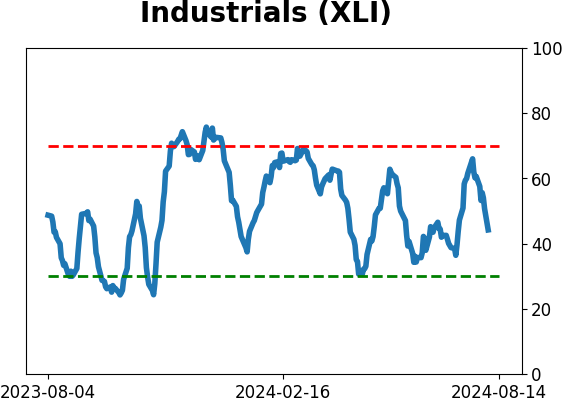
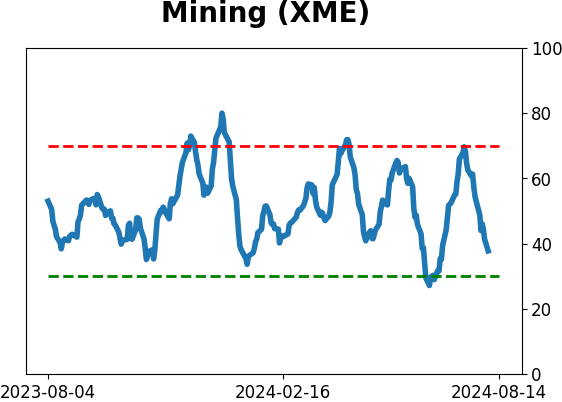
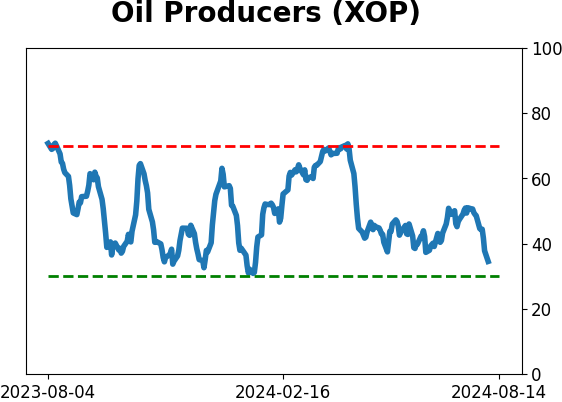
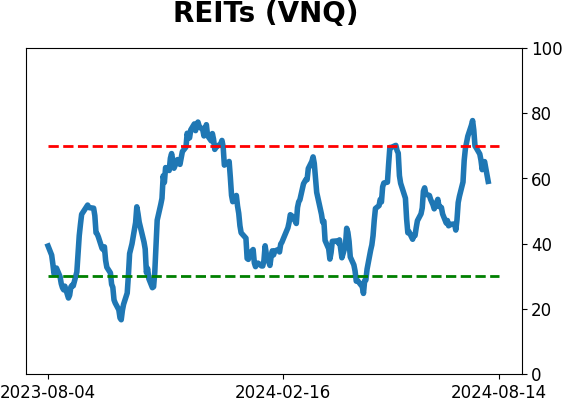
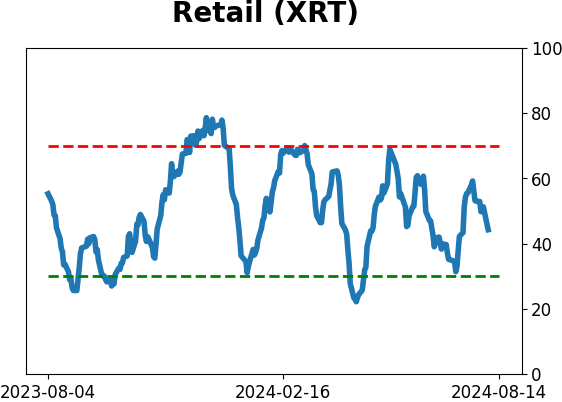
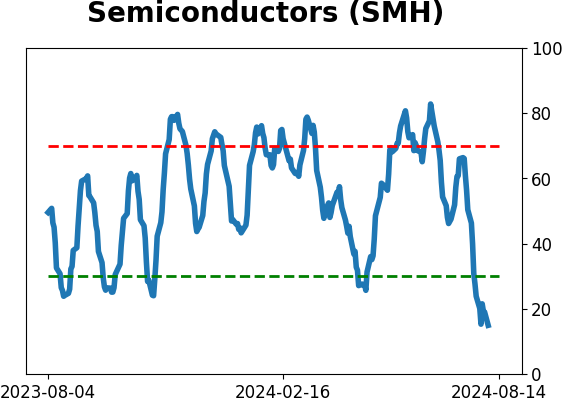
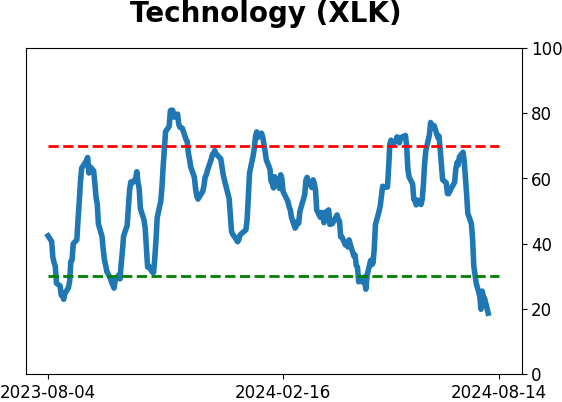
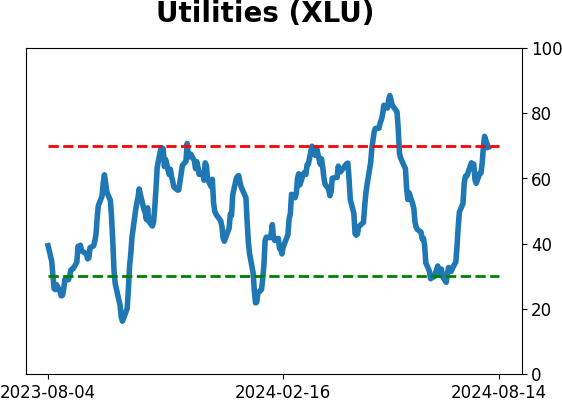
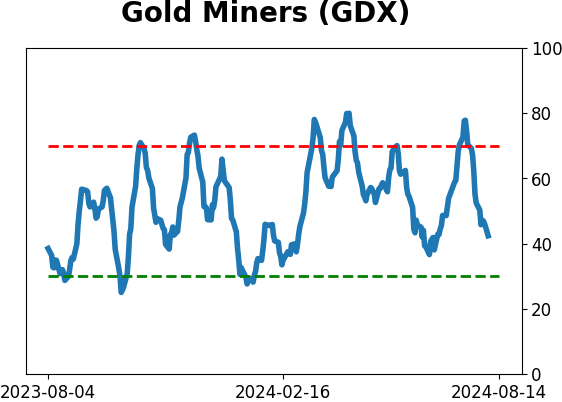
Sector ETF's - 10-Day Moving Average
|
|
|
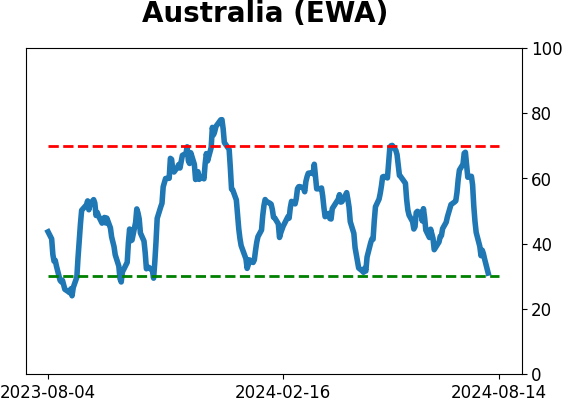
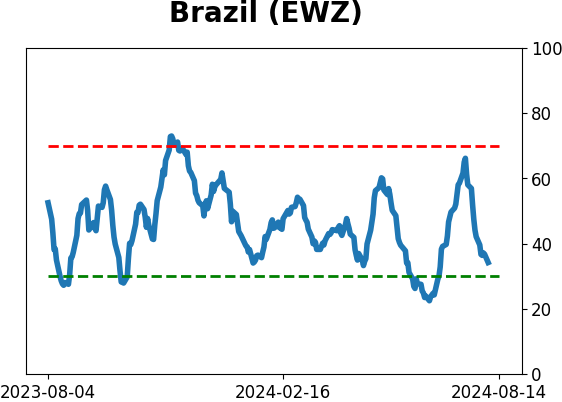
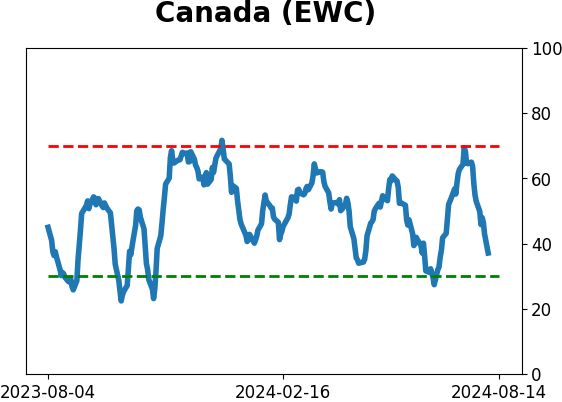
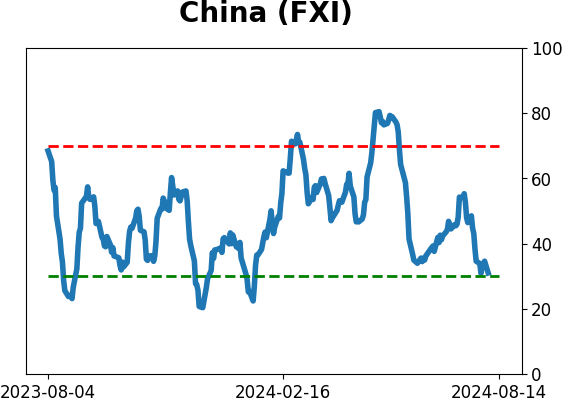
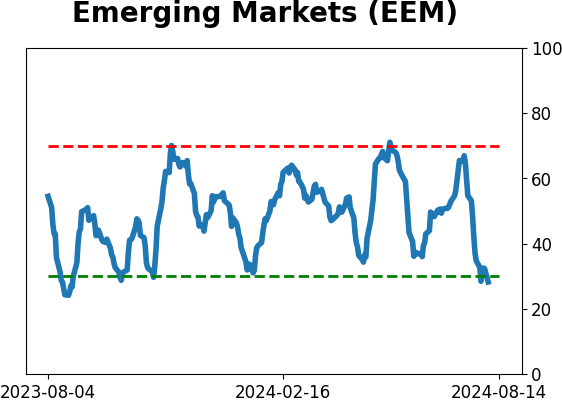
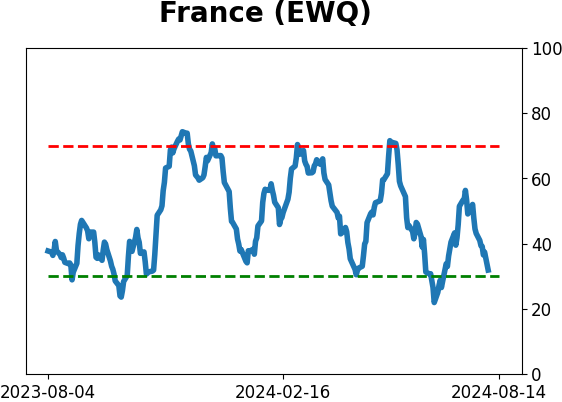
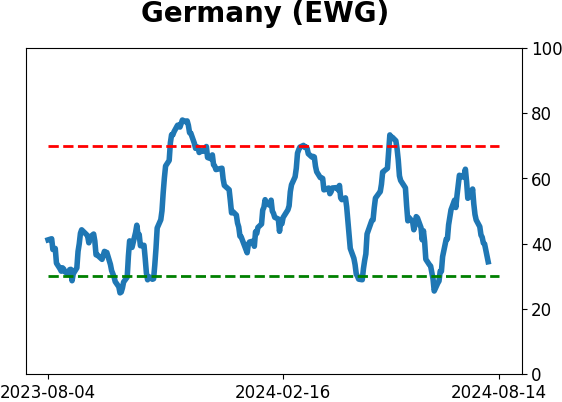
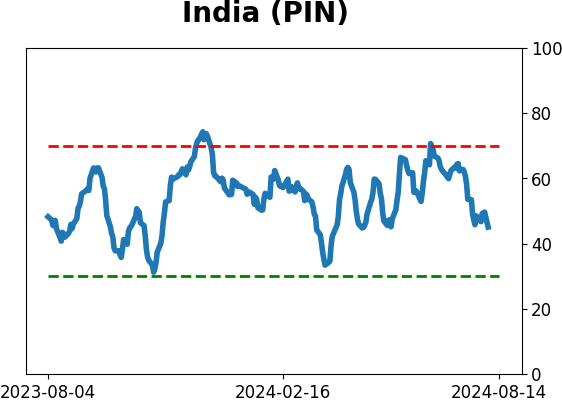
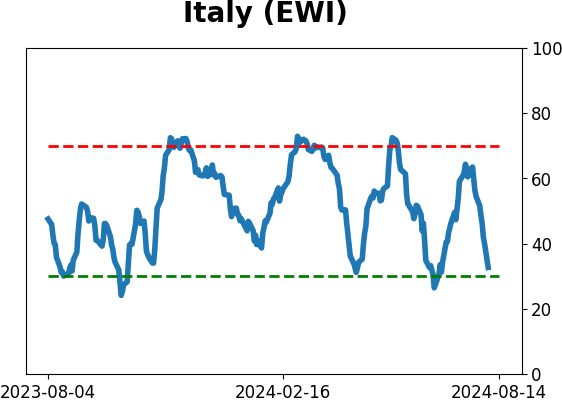
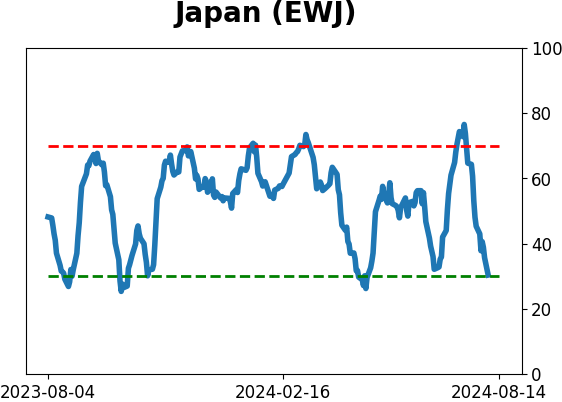
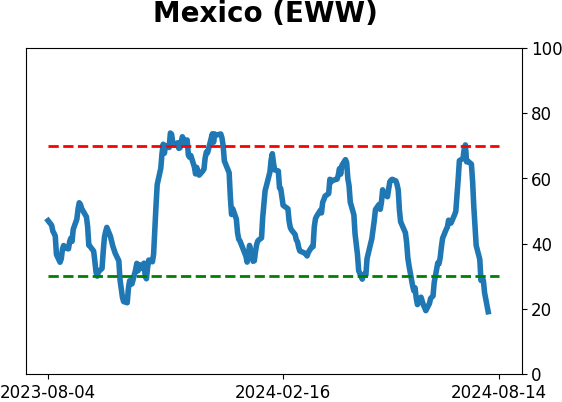
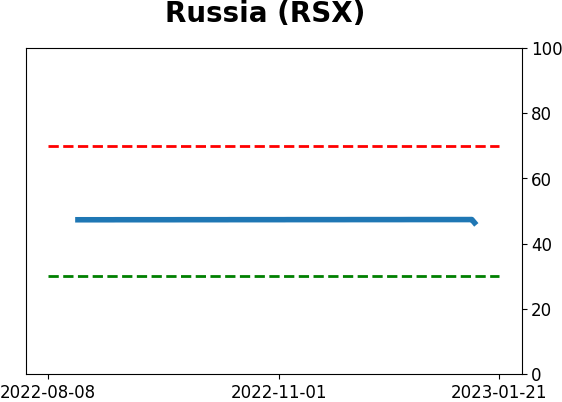
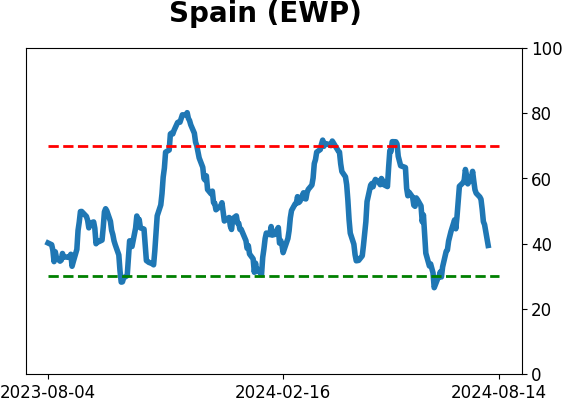
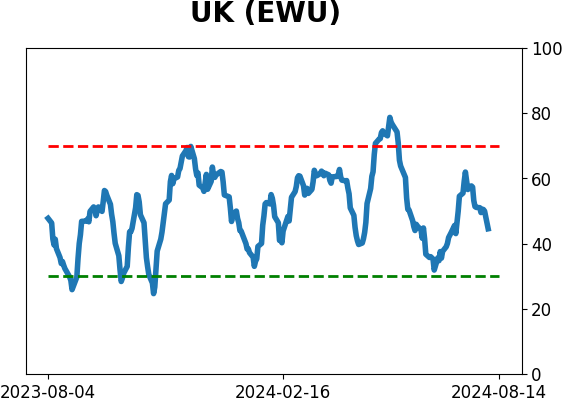
Country ETF's - 10-Day Moving Average
|
|
|
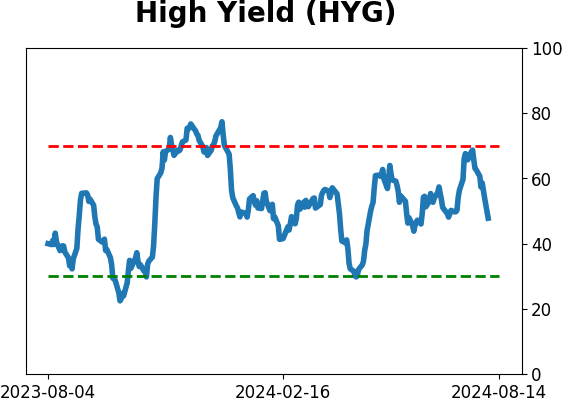
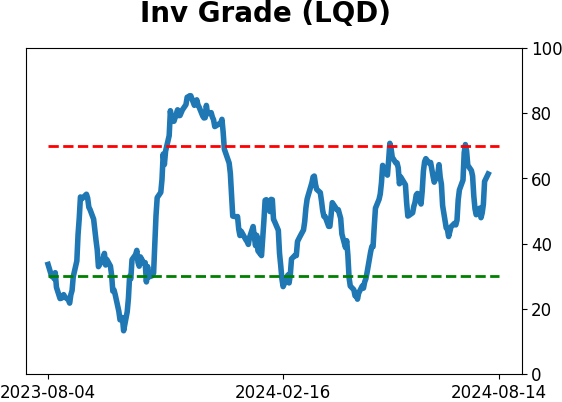
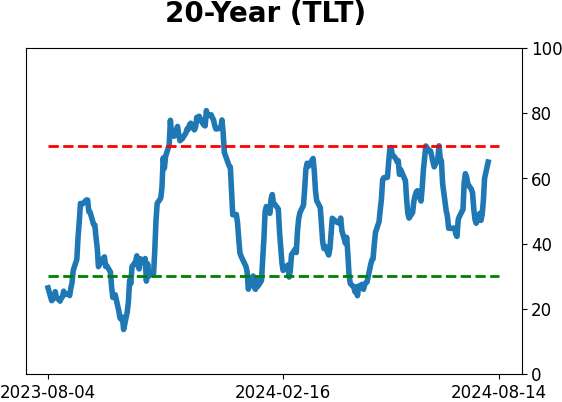
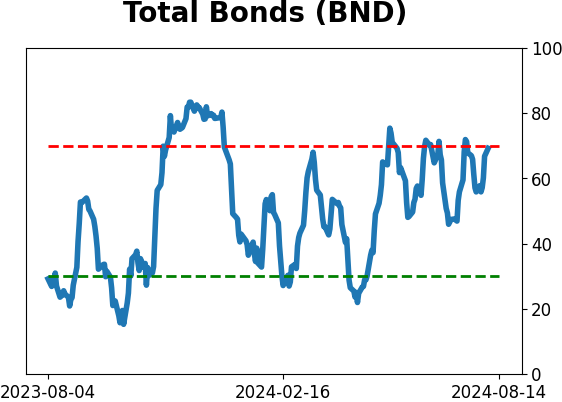
Bond ETF's - 10-Day Moving Average
|
|
|
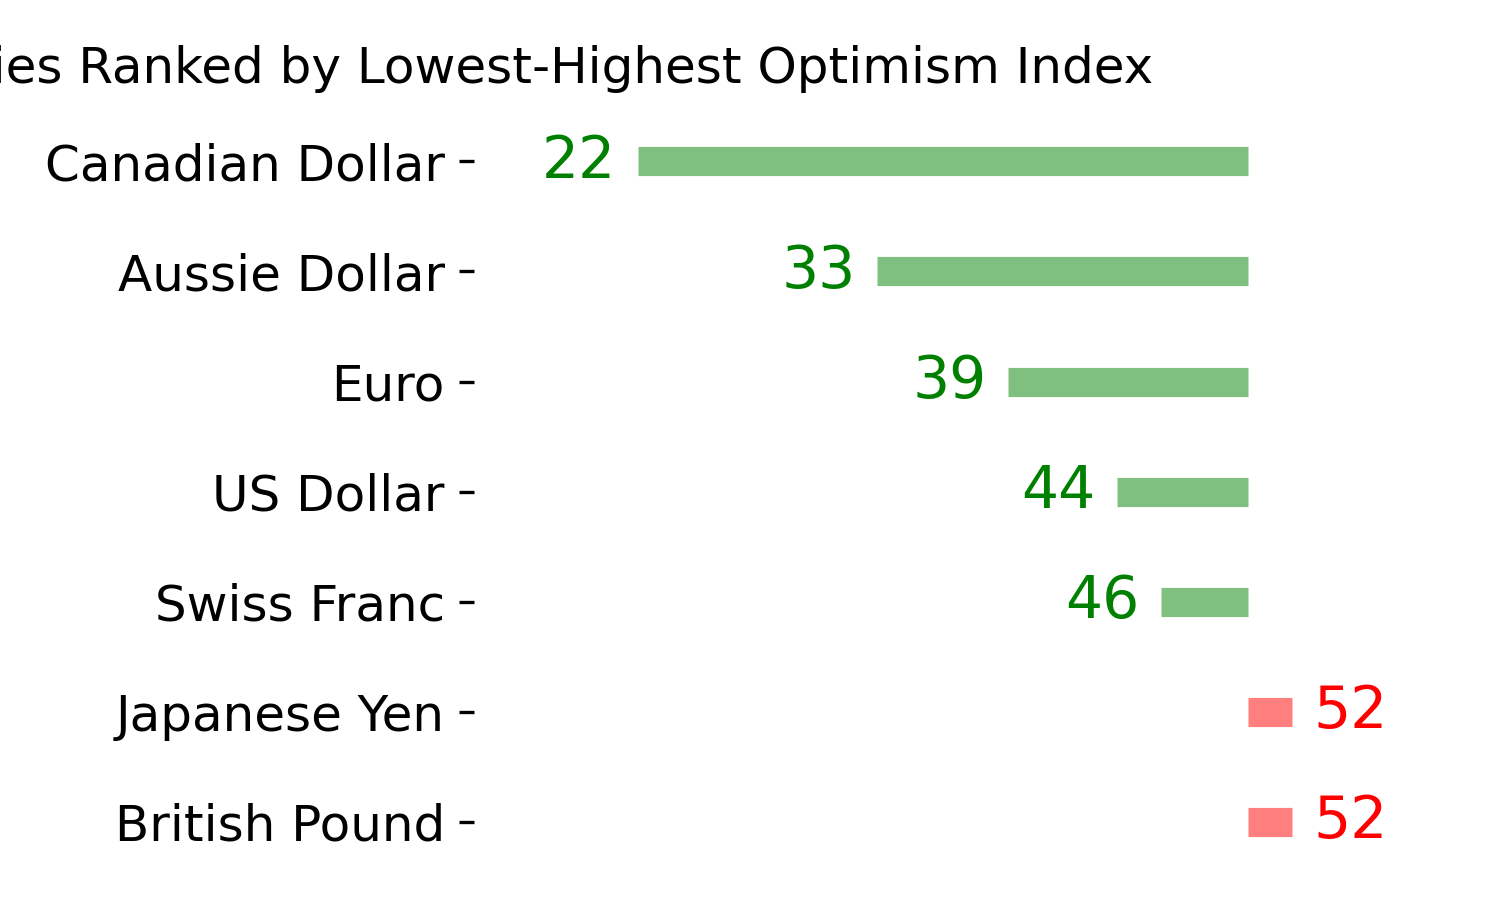
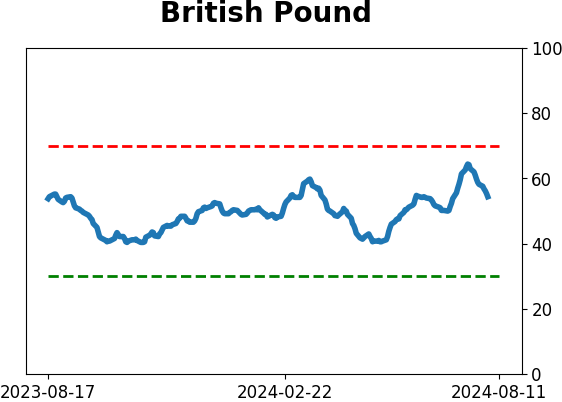
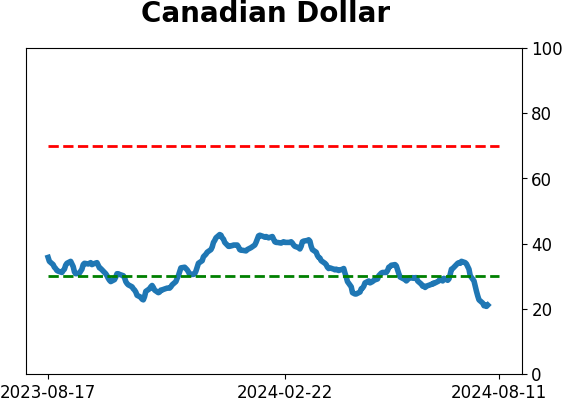
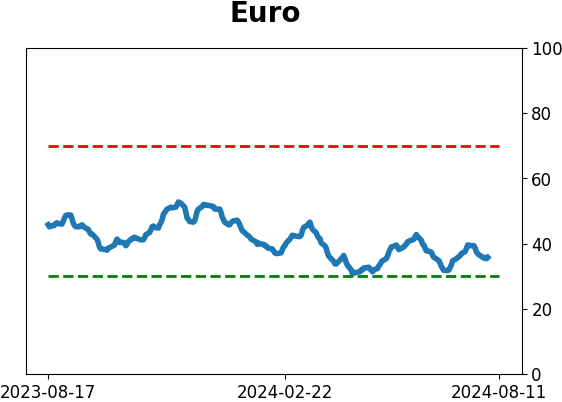
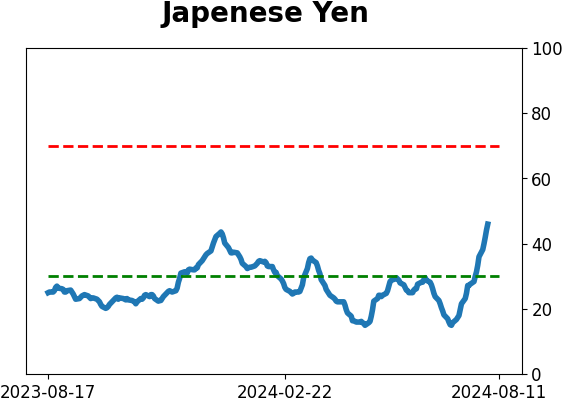
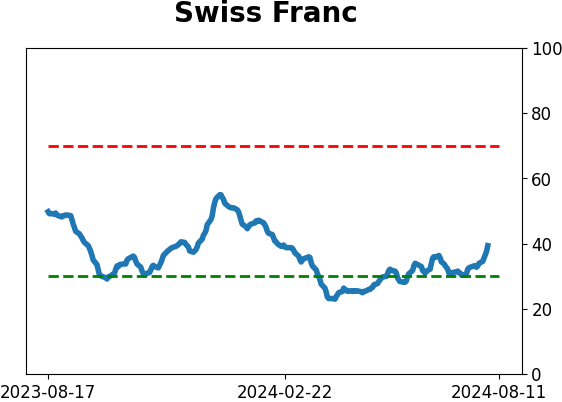
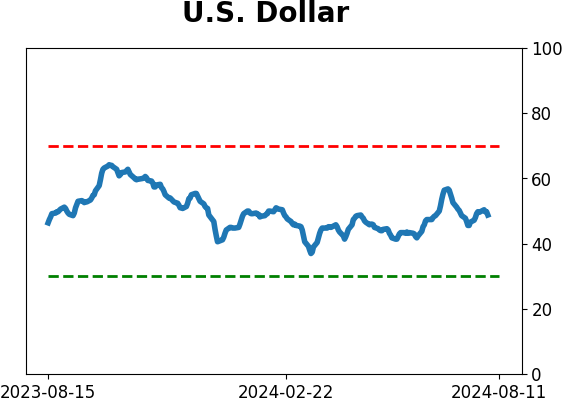
Currency ETF's - 5-Day Moving Average
|
|
|
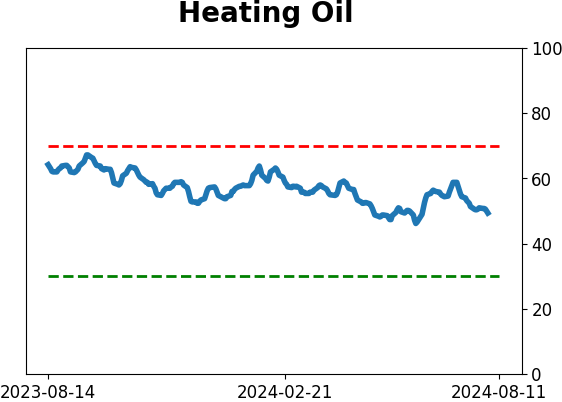
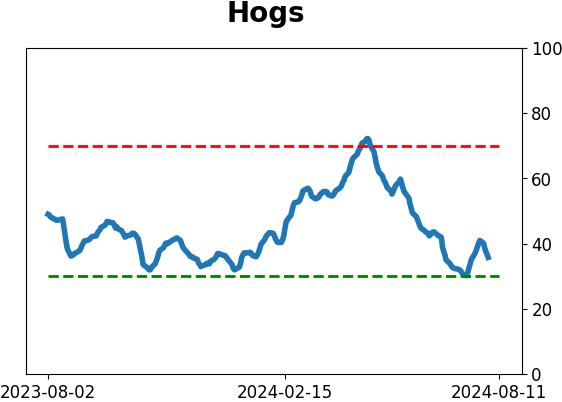
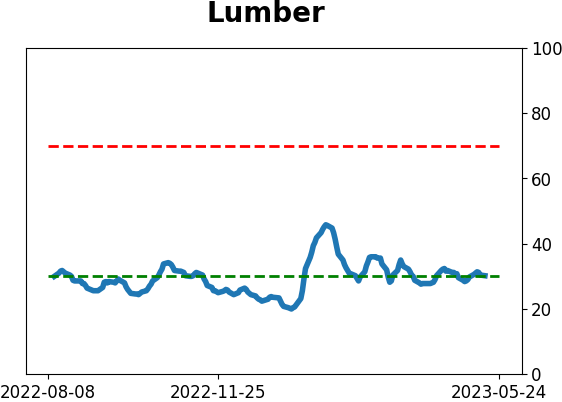
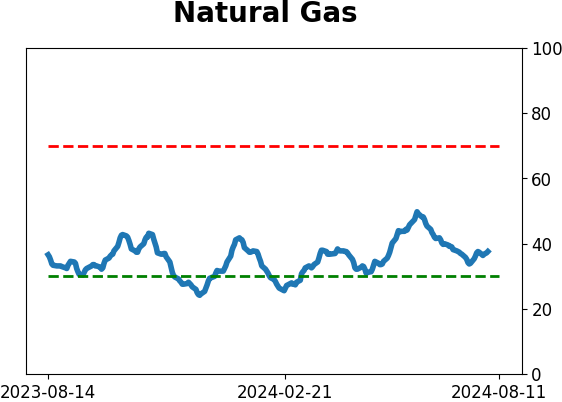
Commodity ETF's - 5-Day Moving Average
|
|