Headlines
|
|
A bullish long-term win streak for the S&P 500:
The 200-day moving average for the S&P 500 has risen for 40 consecutive trading days, triggering a bullish backdrop for the world's most benchmarked index. A year later, the index was higher 92% of the time.
|
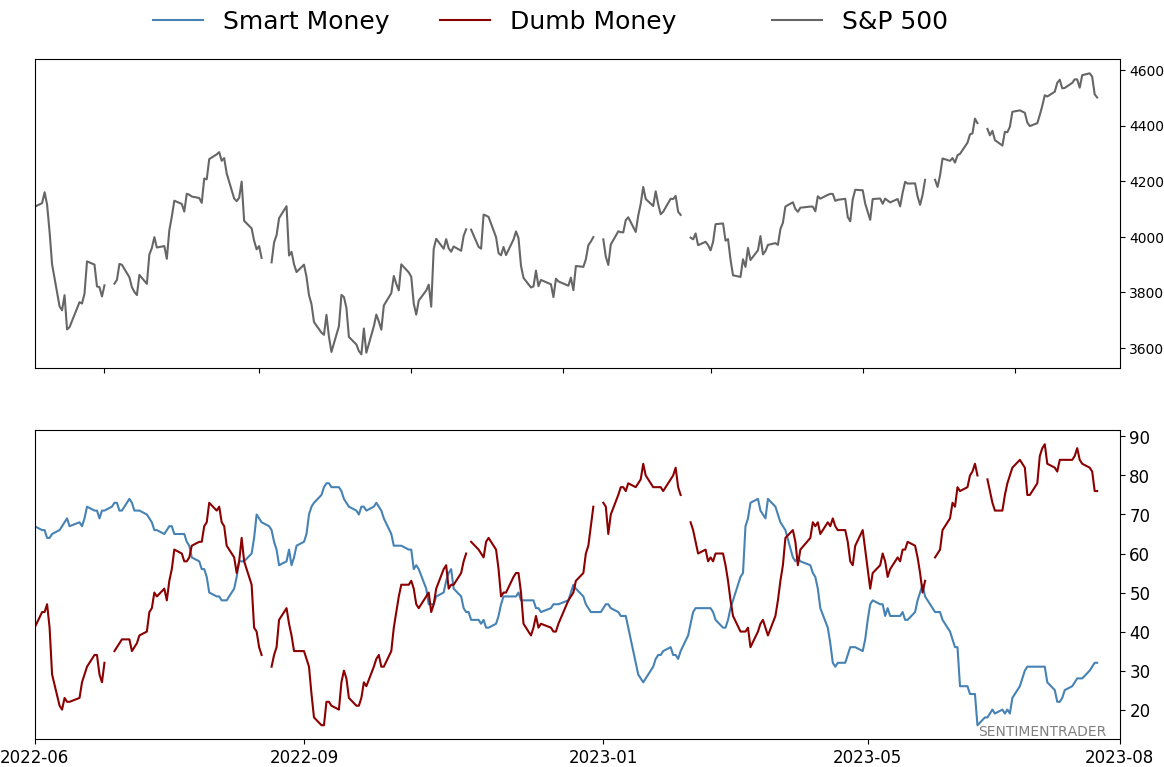
Smart / Dumb Money Confidence
|
Smart Money Confidence: 32%
Dumb Money Confidence: 76%
|
|
Risk Levels
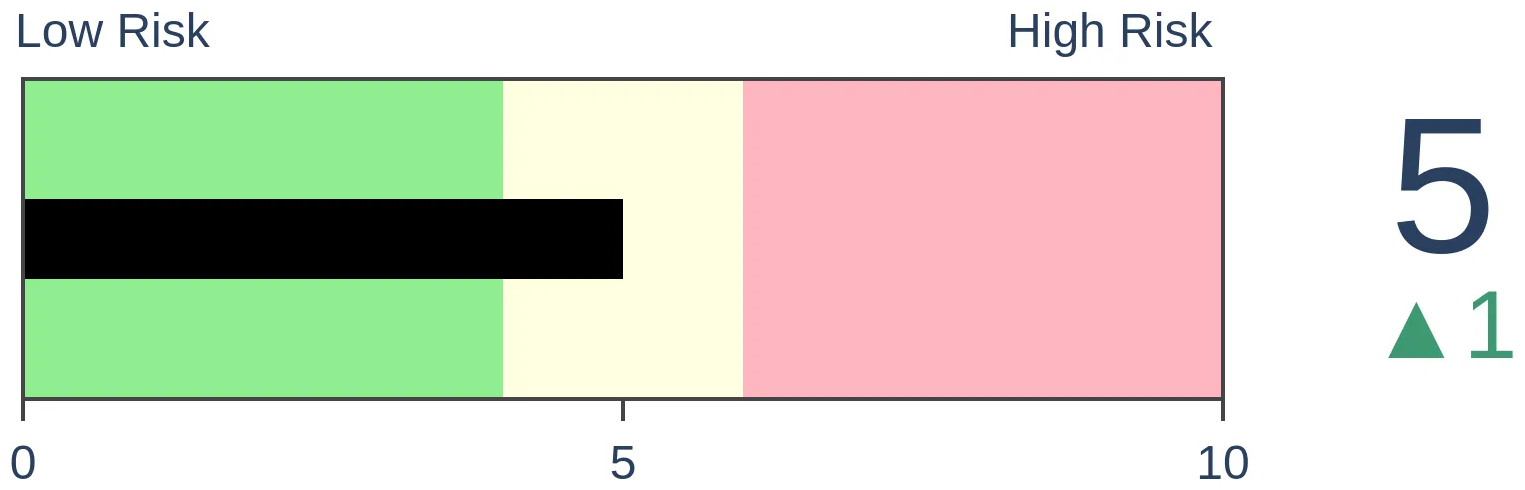
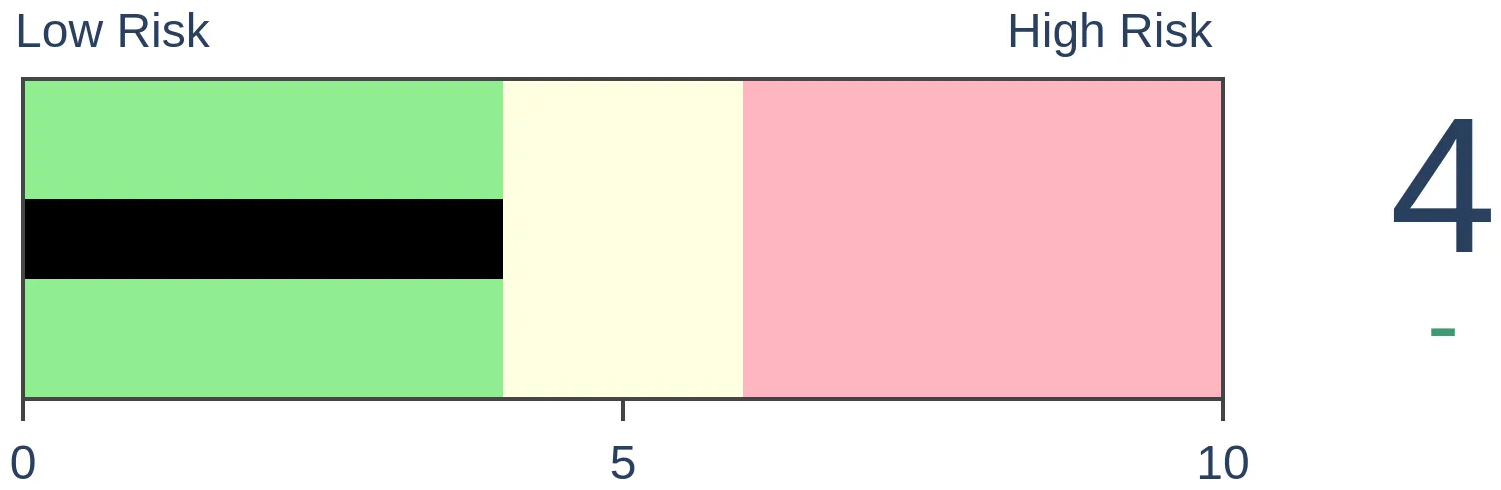
Stocks Short-Term
|
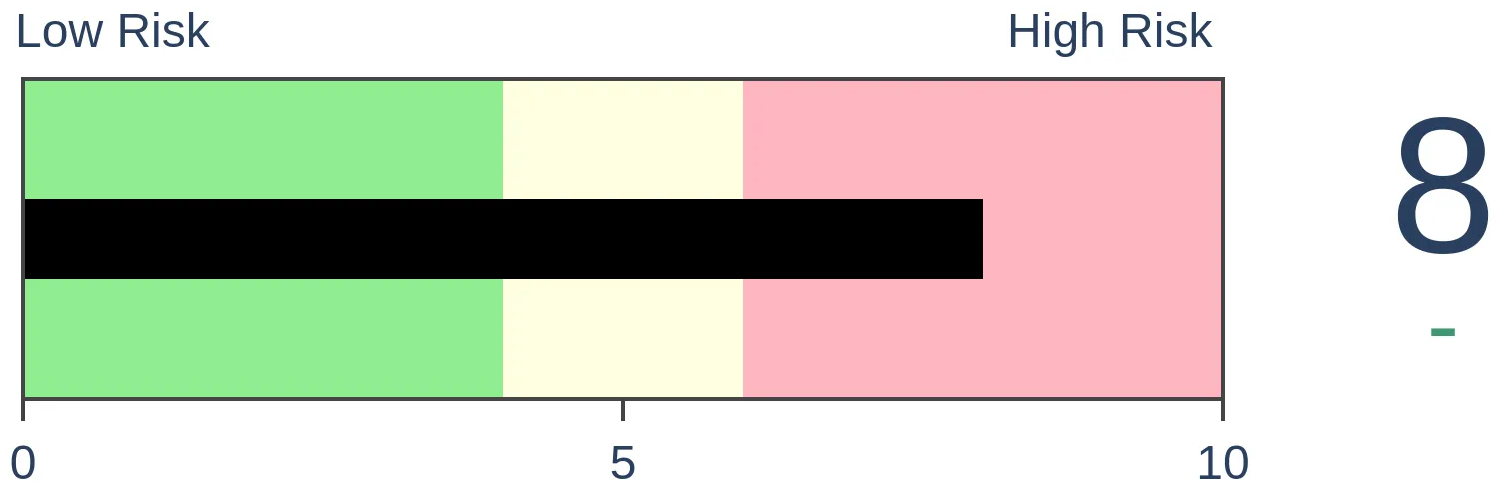
Stocks Medium-Term
|
|
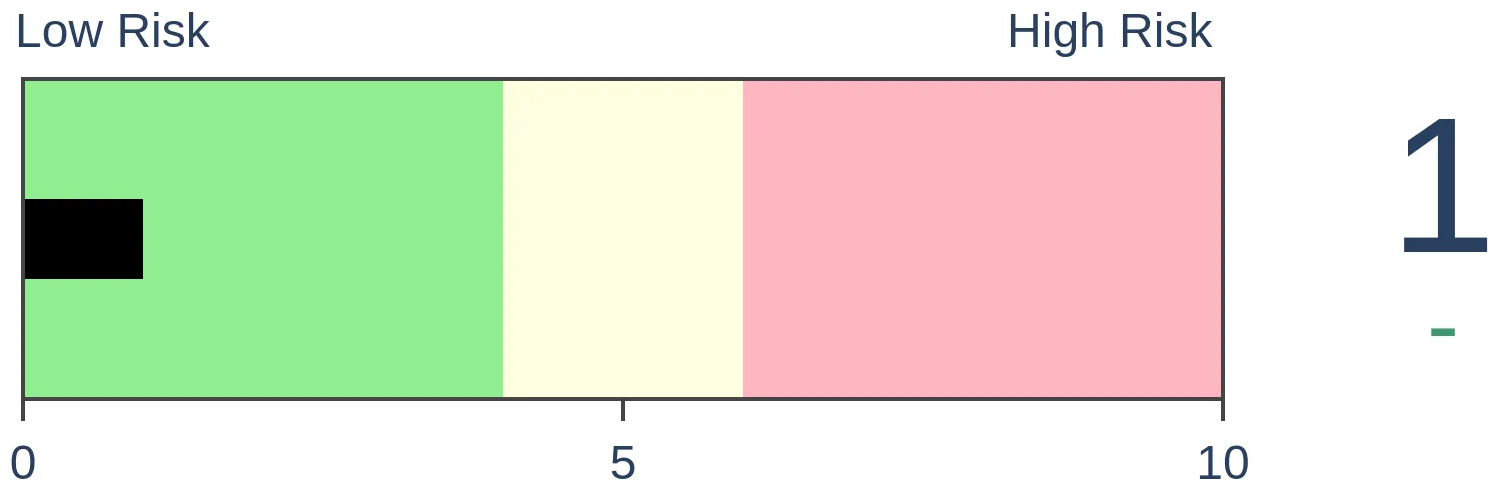
Bonds
|
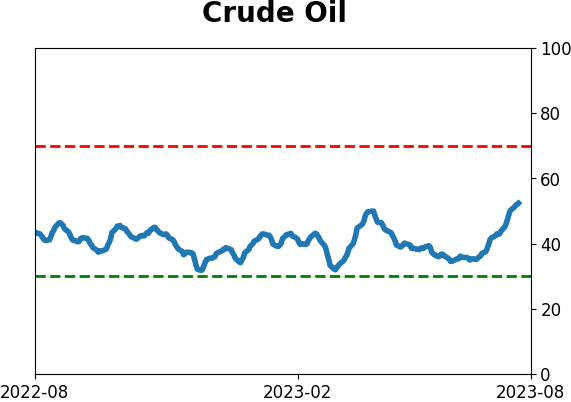
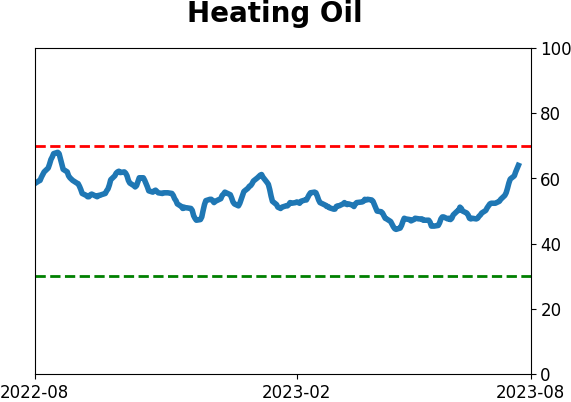
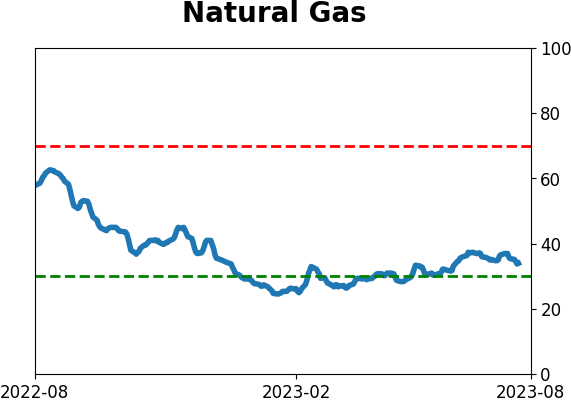
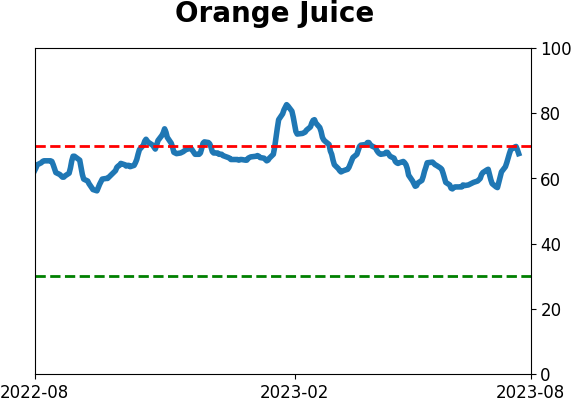
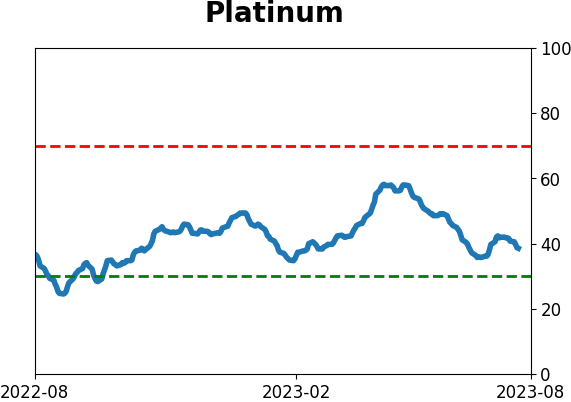
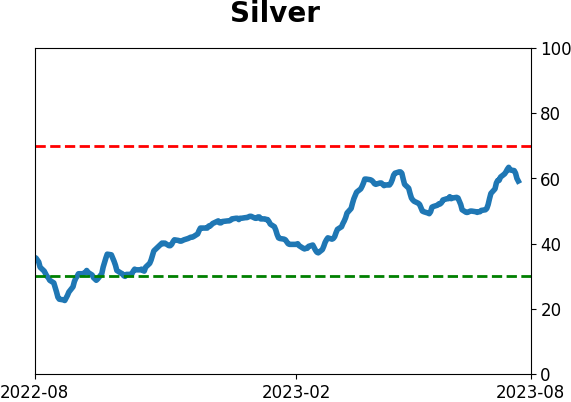
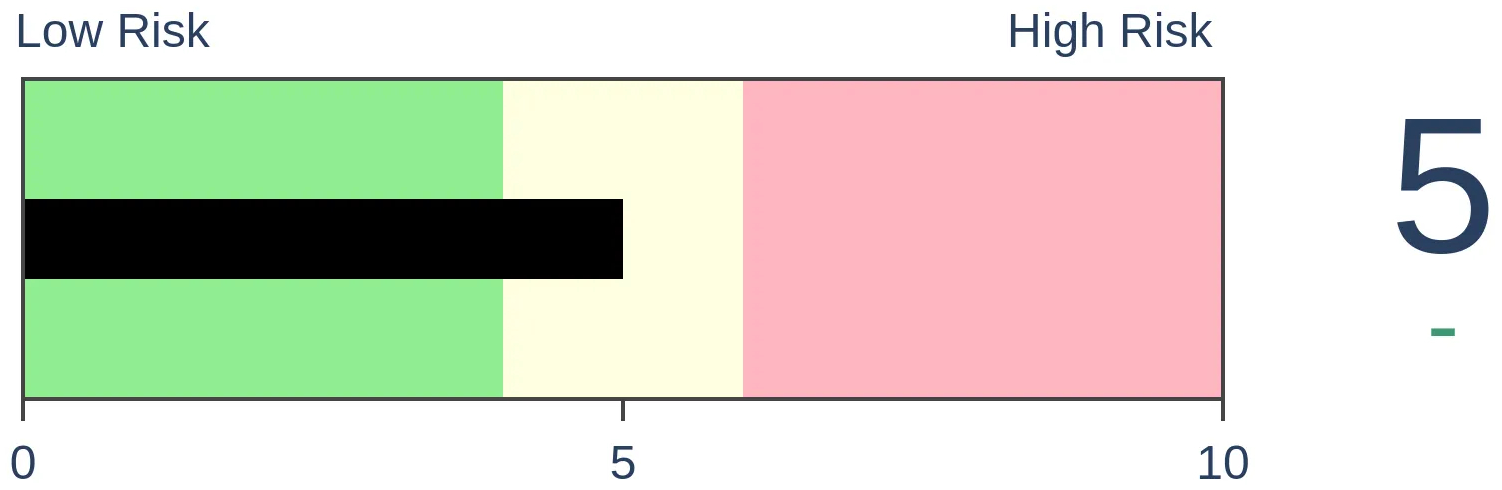
Crude Oil
|
|
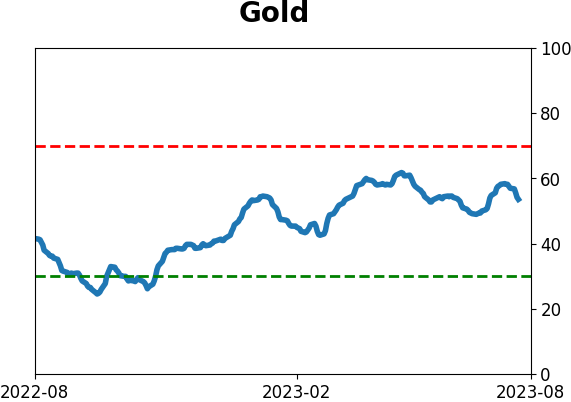
Gold

|
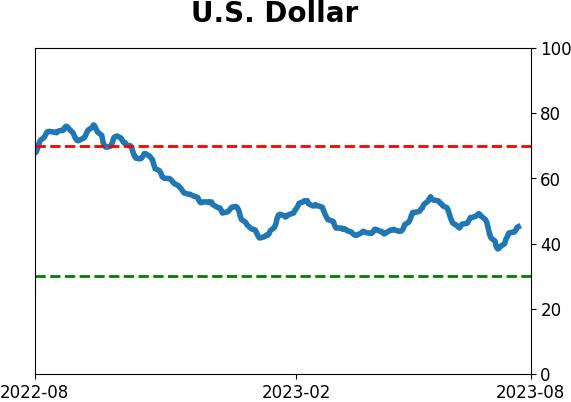
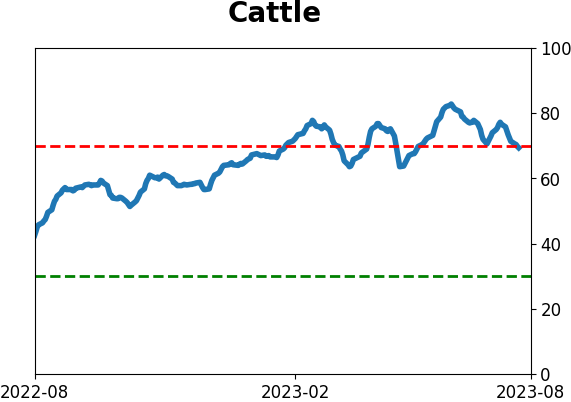
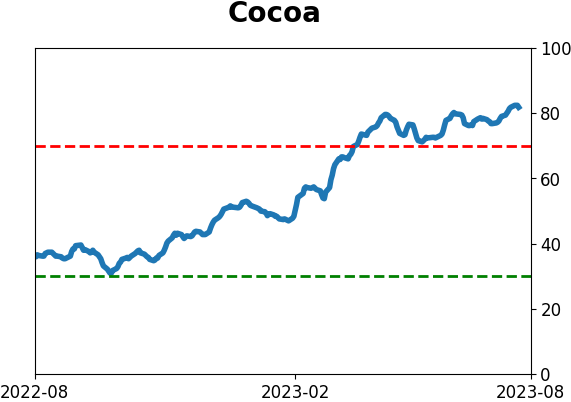
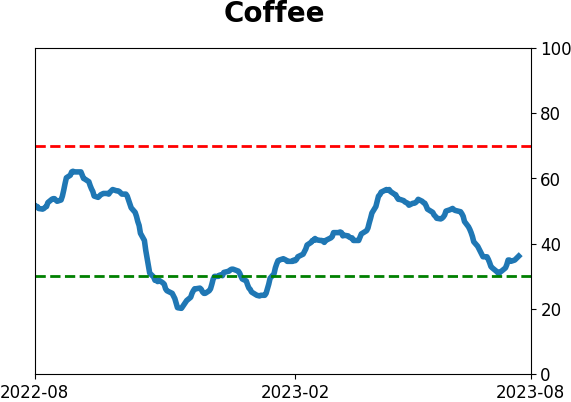
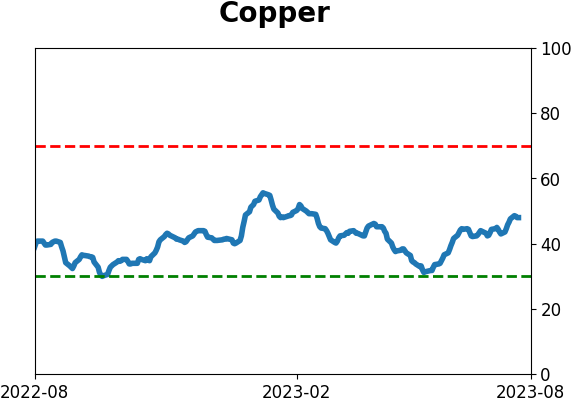
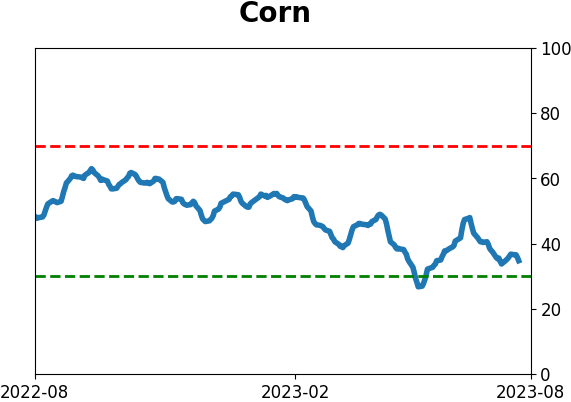
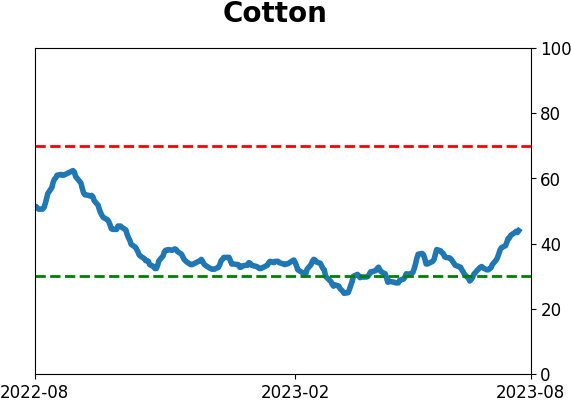
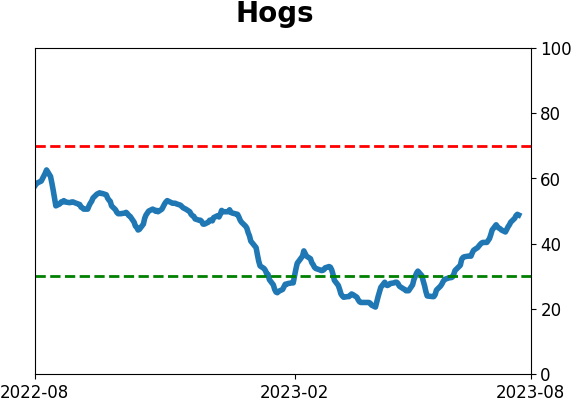
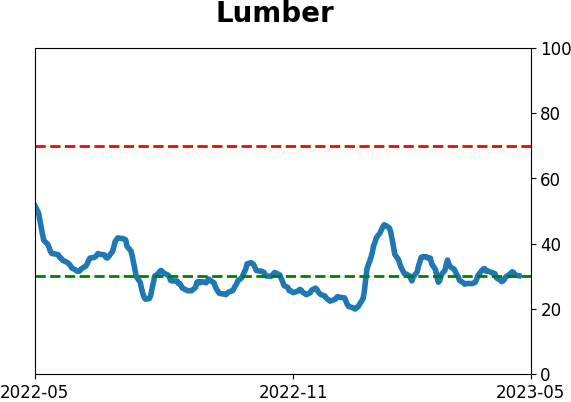
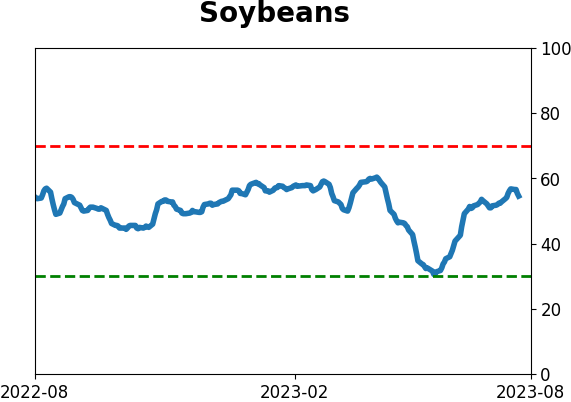
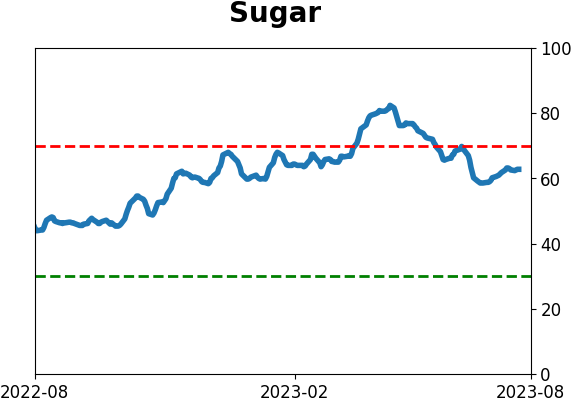
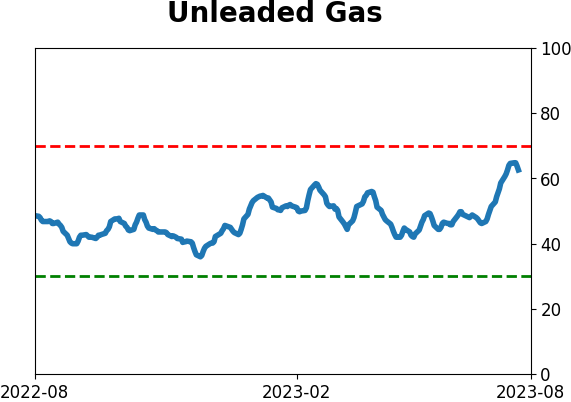
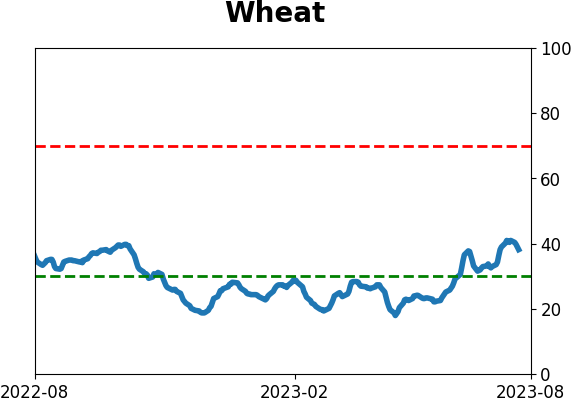
Agriculture
|
|
Research
By Dean Christians
BOTTOM LINE
The 200-day moving average for the S&P 500 has risen for 40 consecutive trading days, triggering a bullish backdrop for the world's most benchmarked index. A year later, the index was higher 92% of the time.
FORECAST / TIMEFRAME
SPY -- Up, Long-Term
|
Key points:
- The 200-day moving average for the S&P 500 has now risen for 40 consecutive trading days
- Similar win streaks preceded above-average returns for the S&P 500 across all time frames
- When win streaks occur after a 1-year low, the S&P 500 was higher 92% of the time a year later
A persistent increase in a long-term trend indicator bodes well for stocks
The 200-day moving average for the S&P 500 has now risen for 40 consecutive trading days, reaching a level that has historically foreshadowed an all-clear sign for stocks.
Whether we analyze short-term, medium-term, or long-term trends, one consistent feature of uptrends is the continuous upward movement of moving averages, distinguishing them from downtrends and broad consolidations.
With the market correction chorus growing louder, let's not lose sight of the big-picture backdrop.
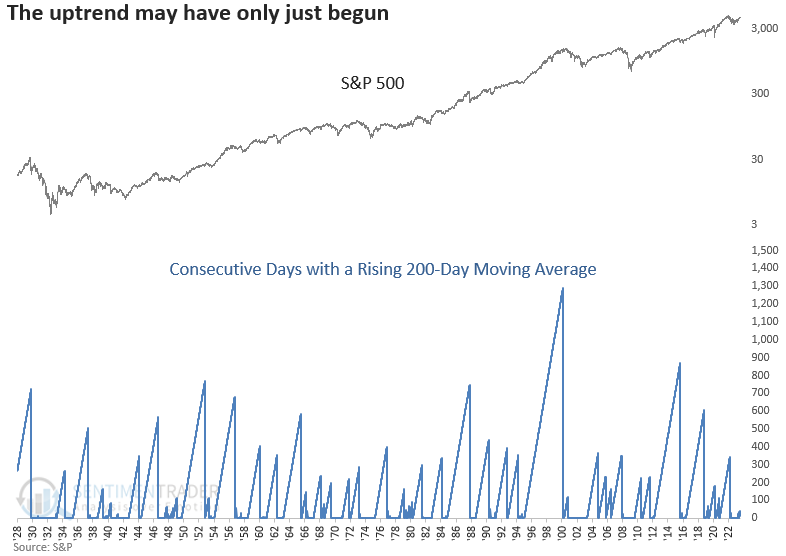
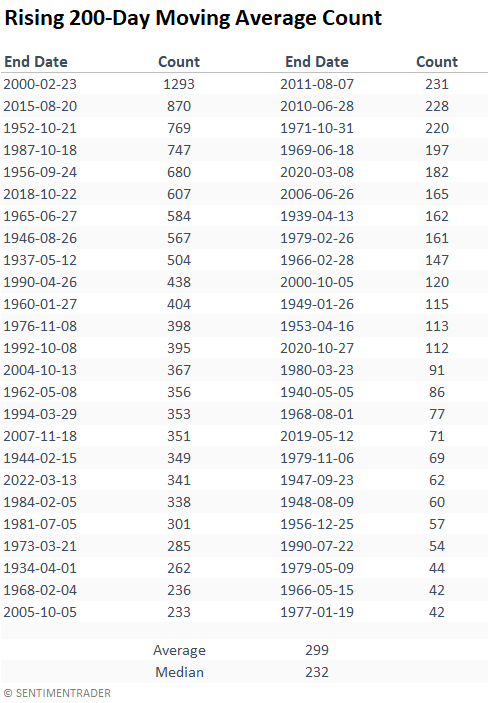
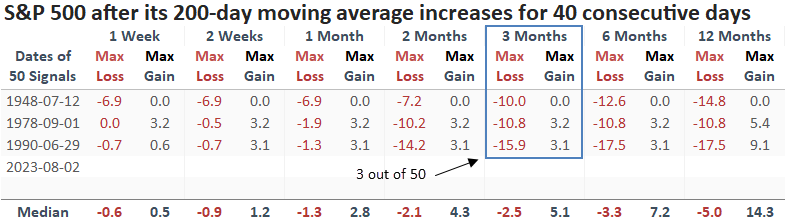
Suppose we buy the S&P 500 every time the 200-day moving average rises for 40 consecutive trading days, like now, and hold until the slope of the average turns negative. In that case, the 200-day average continued to rise for a median duration of 232 trading days.
Similar persistent increases in the 200-day average preceded positive returns
When the 200-day moving average for the S&P 500 rises for 40 consecutive trading days, returns exceed the median return over the study period across all time frames.
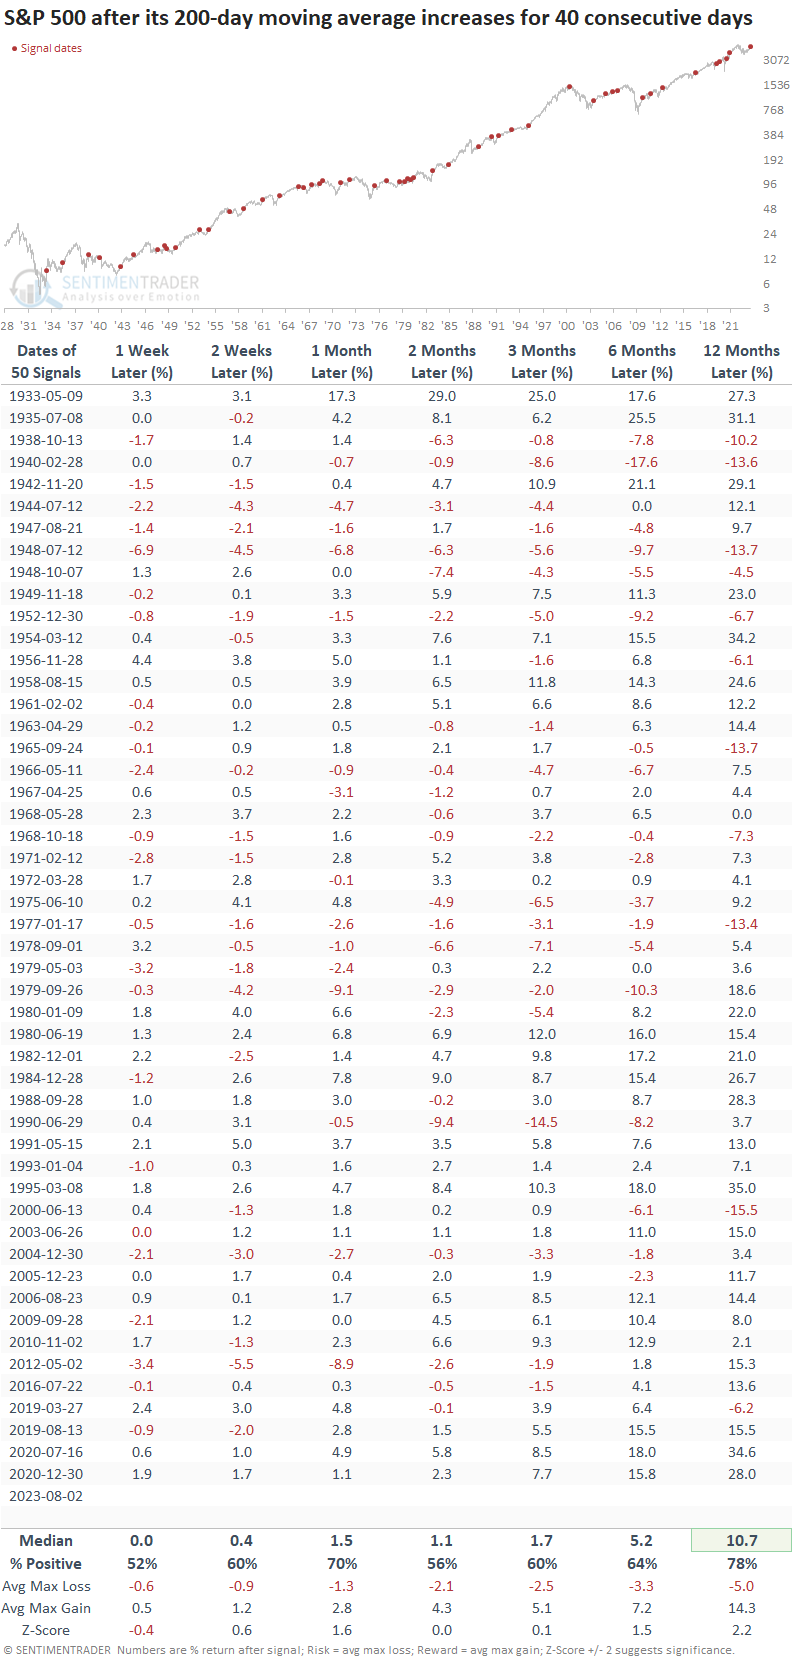
Over the next three months, only 3 out of 50 signals experienced a max loss of greater than -10%, a time frame that would overlap with the seasonally weak months of August and September. Interestingly, all three drawdowns occurred between June and September.
Context is always important
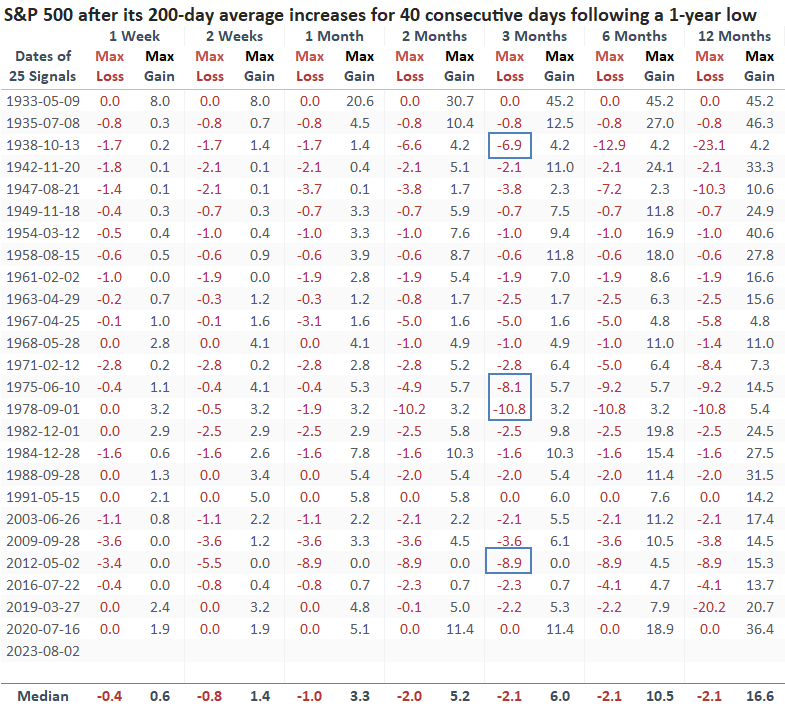
To better understand the current market context, let's analyze signals that occurred after the S&P 500 closed at a 1-year low, creating a similar reference point.
A persistent upward rise in the 200-day moving average immediately after a 1-year low led to outstanding results for the S&P 500. A year later, the world's most benchmarked index was higher in all but two cases.
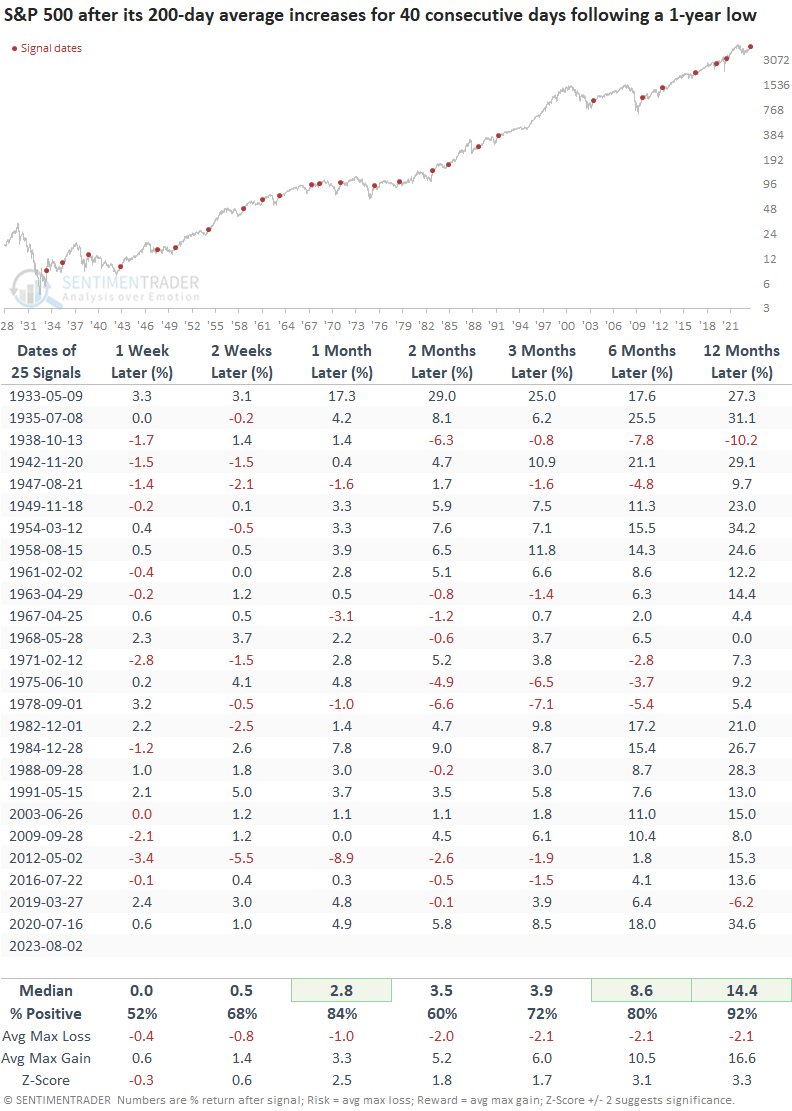
Similar to the original study, significant drawdowns over the next three months were minimal, with only one max loss exceeding -10%.
TCTM Composite Risk Warning Model
With market participation broadening, the probability of a TCTM Composite Risk Warning alert in the near term seems unlikely. If a correction were to occur, some other factor might be responsible for the pullback.
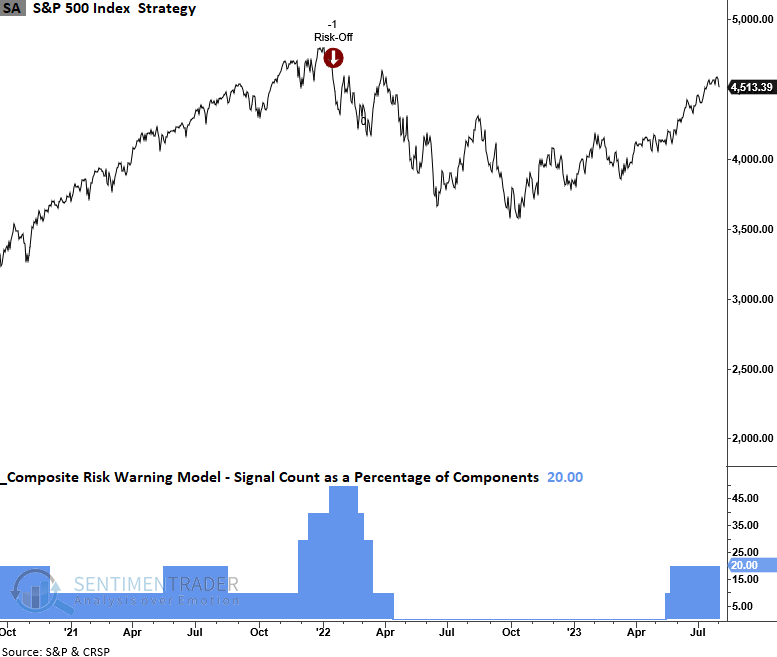
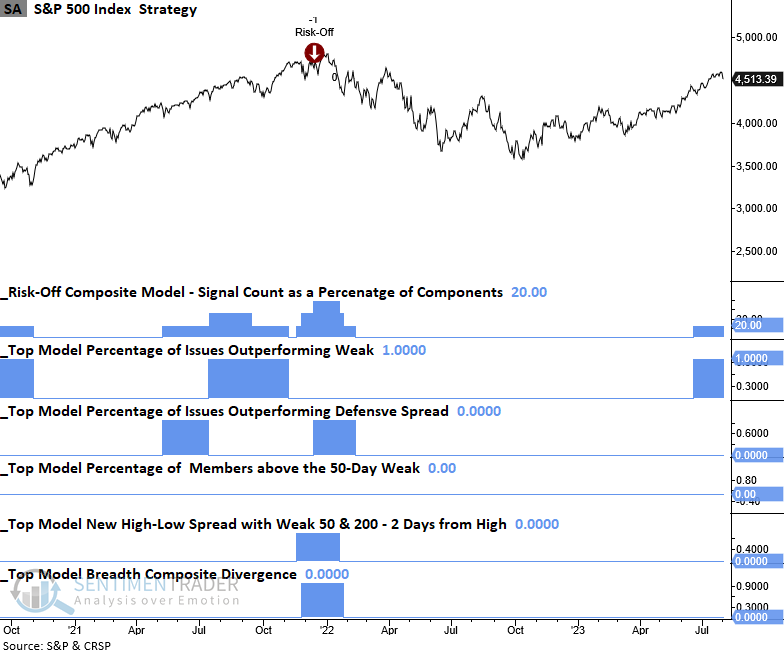
Risk-Off Composite Model
The Risk-Off Composite Model serves as a secondary tool to gauge market participation. Similar to the TCTM model, the odds of a correction appear less likely given the current signal count.
What the research tells us...
The odds of a sustained uptrend in the S&P 500 look likely now that the 200-day moving average for the world's most benchmarked index has risen for 40 consecutive trading days. When the long-term moving average increases after a 1-year low, the index rallied 92% of the time a year later. With market participation broadening, two composite models that measure predominantly market breadth indicators suggest an imminent correction is unlikely.
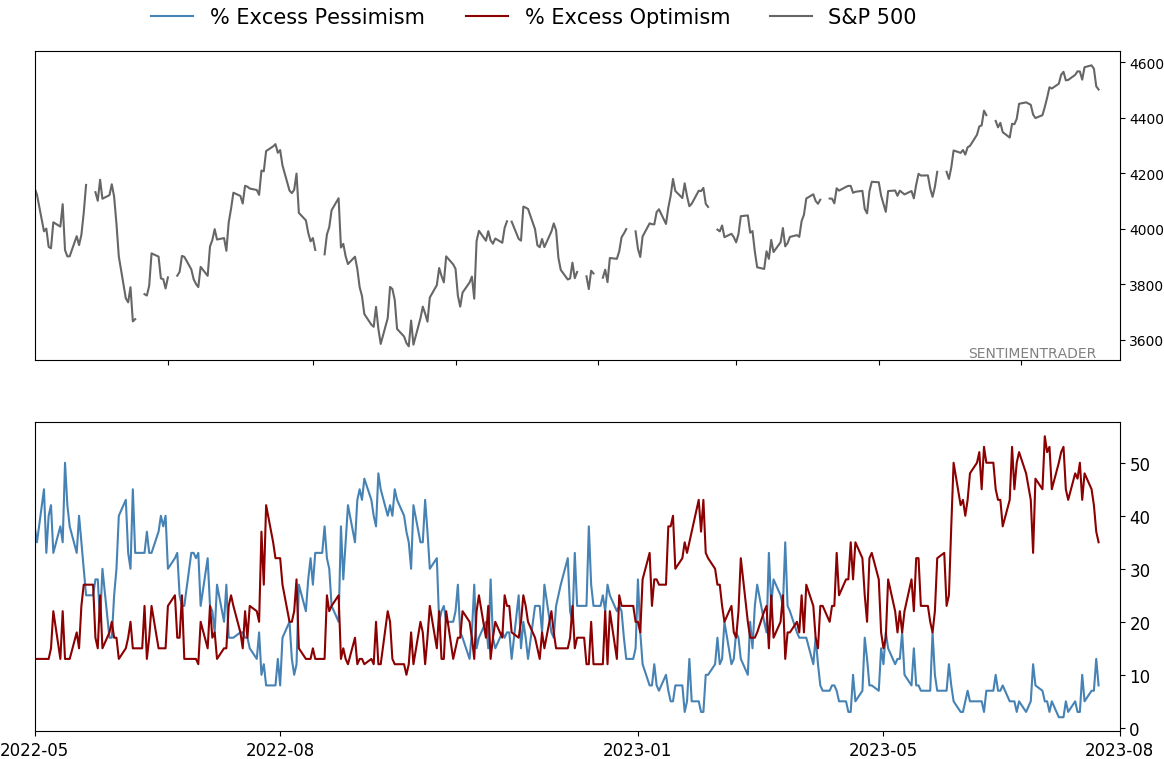
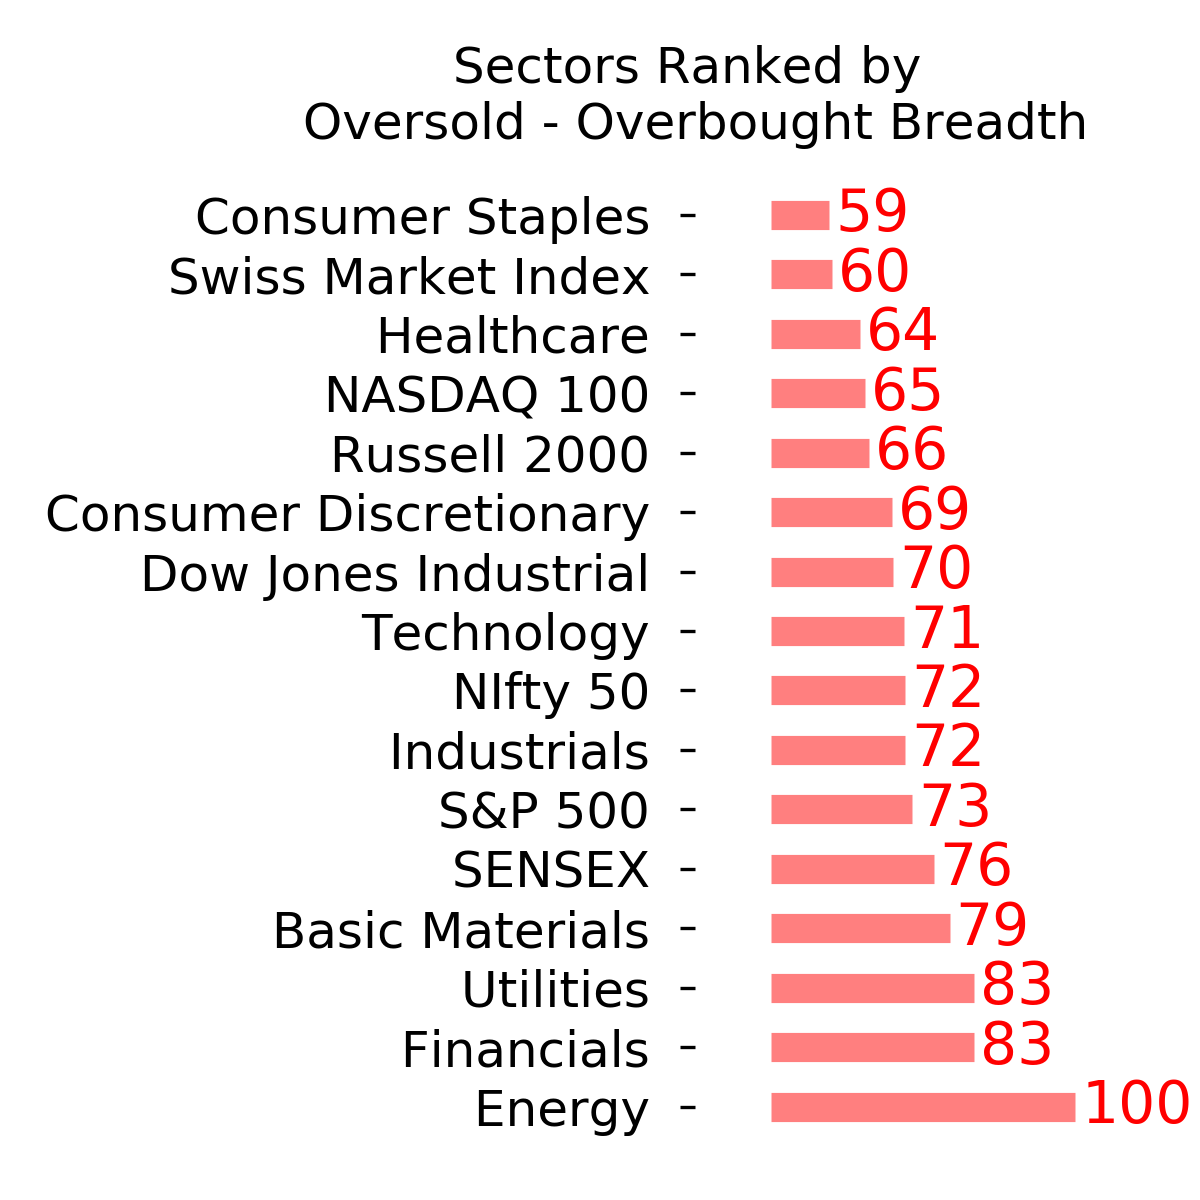
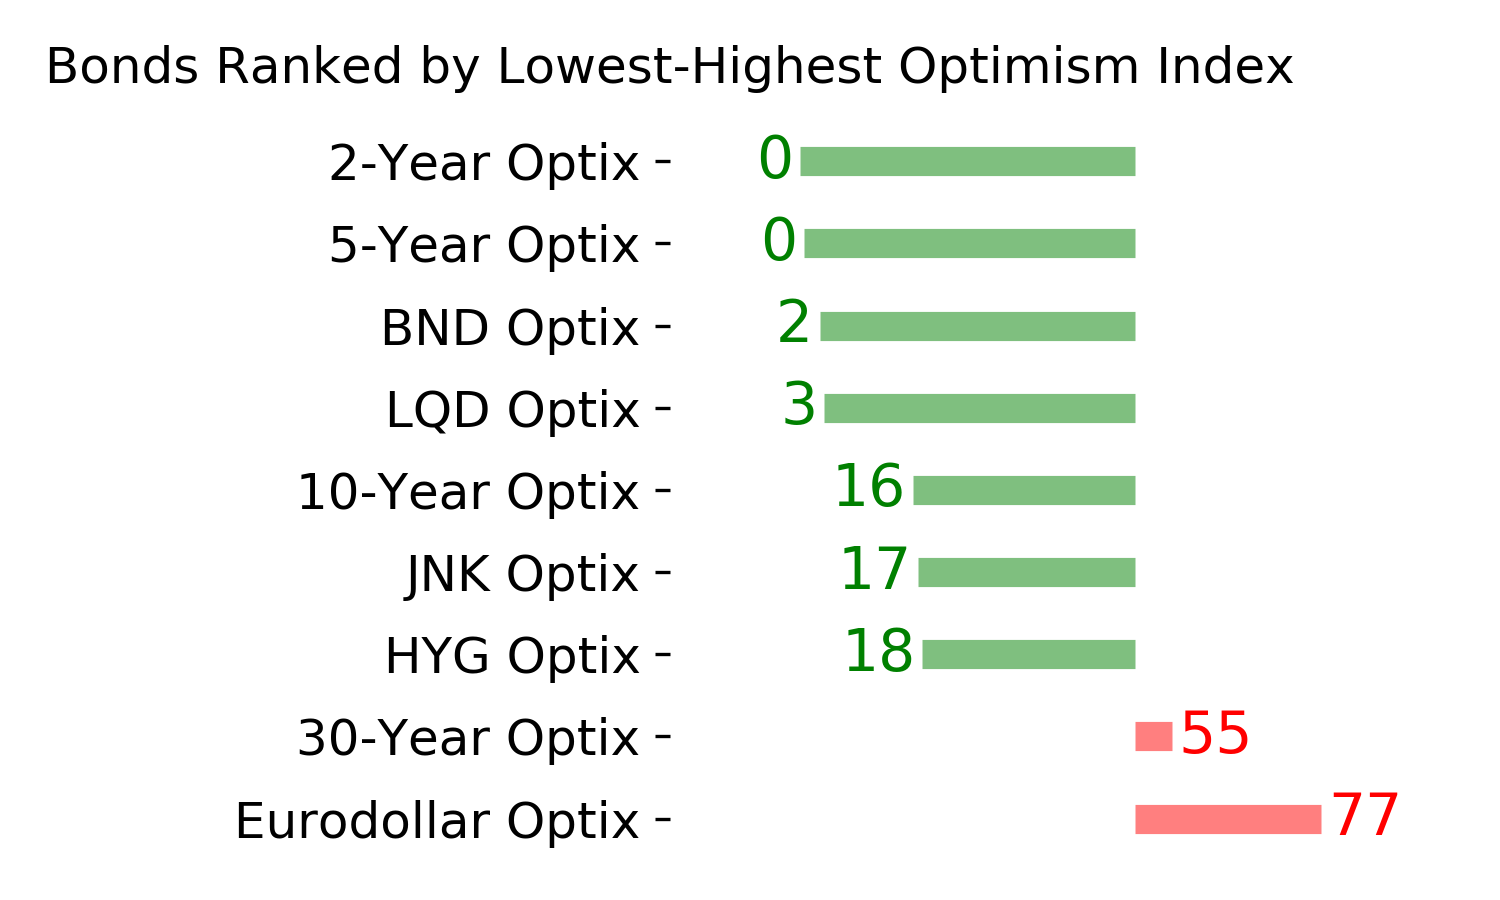
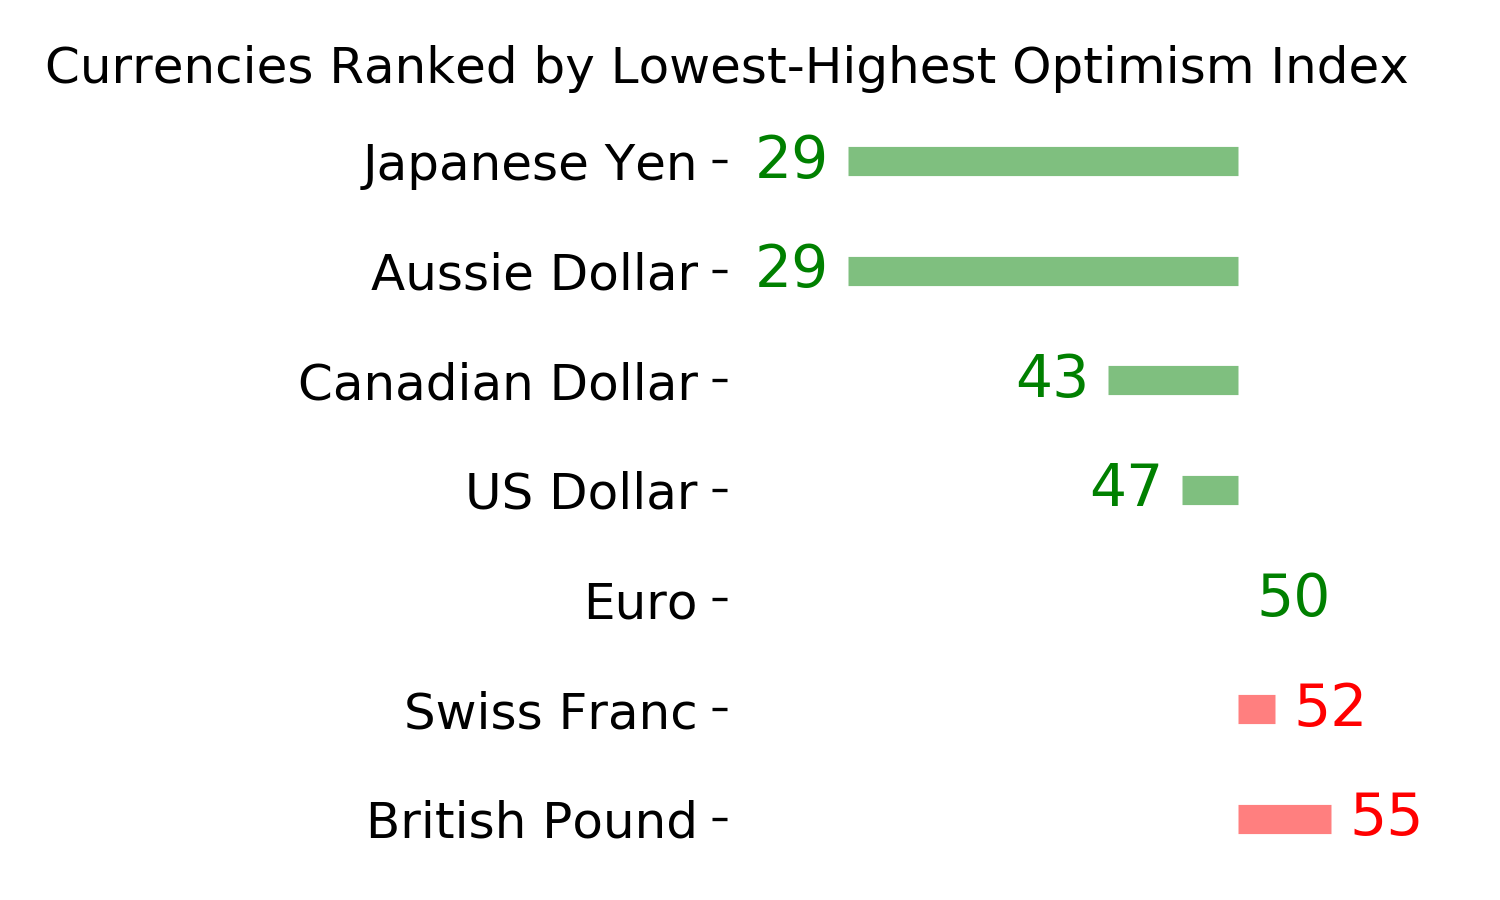
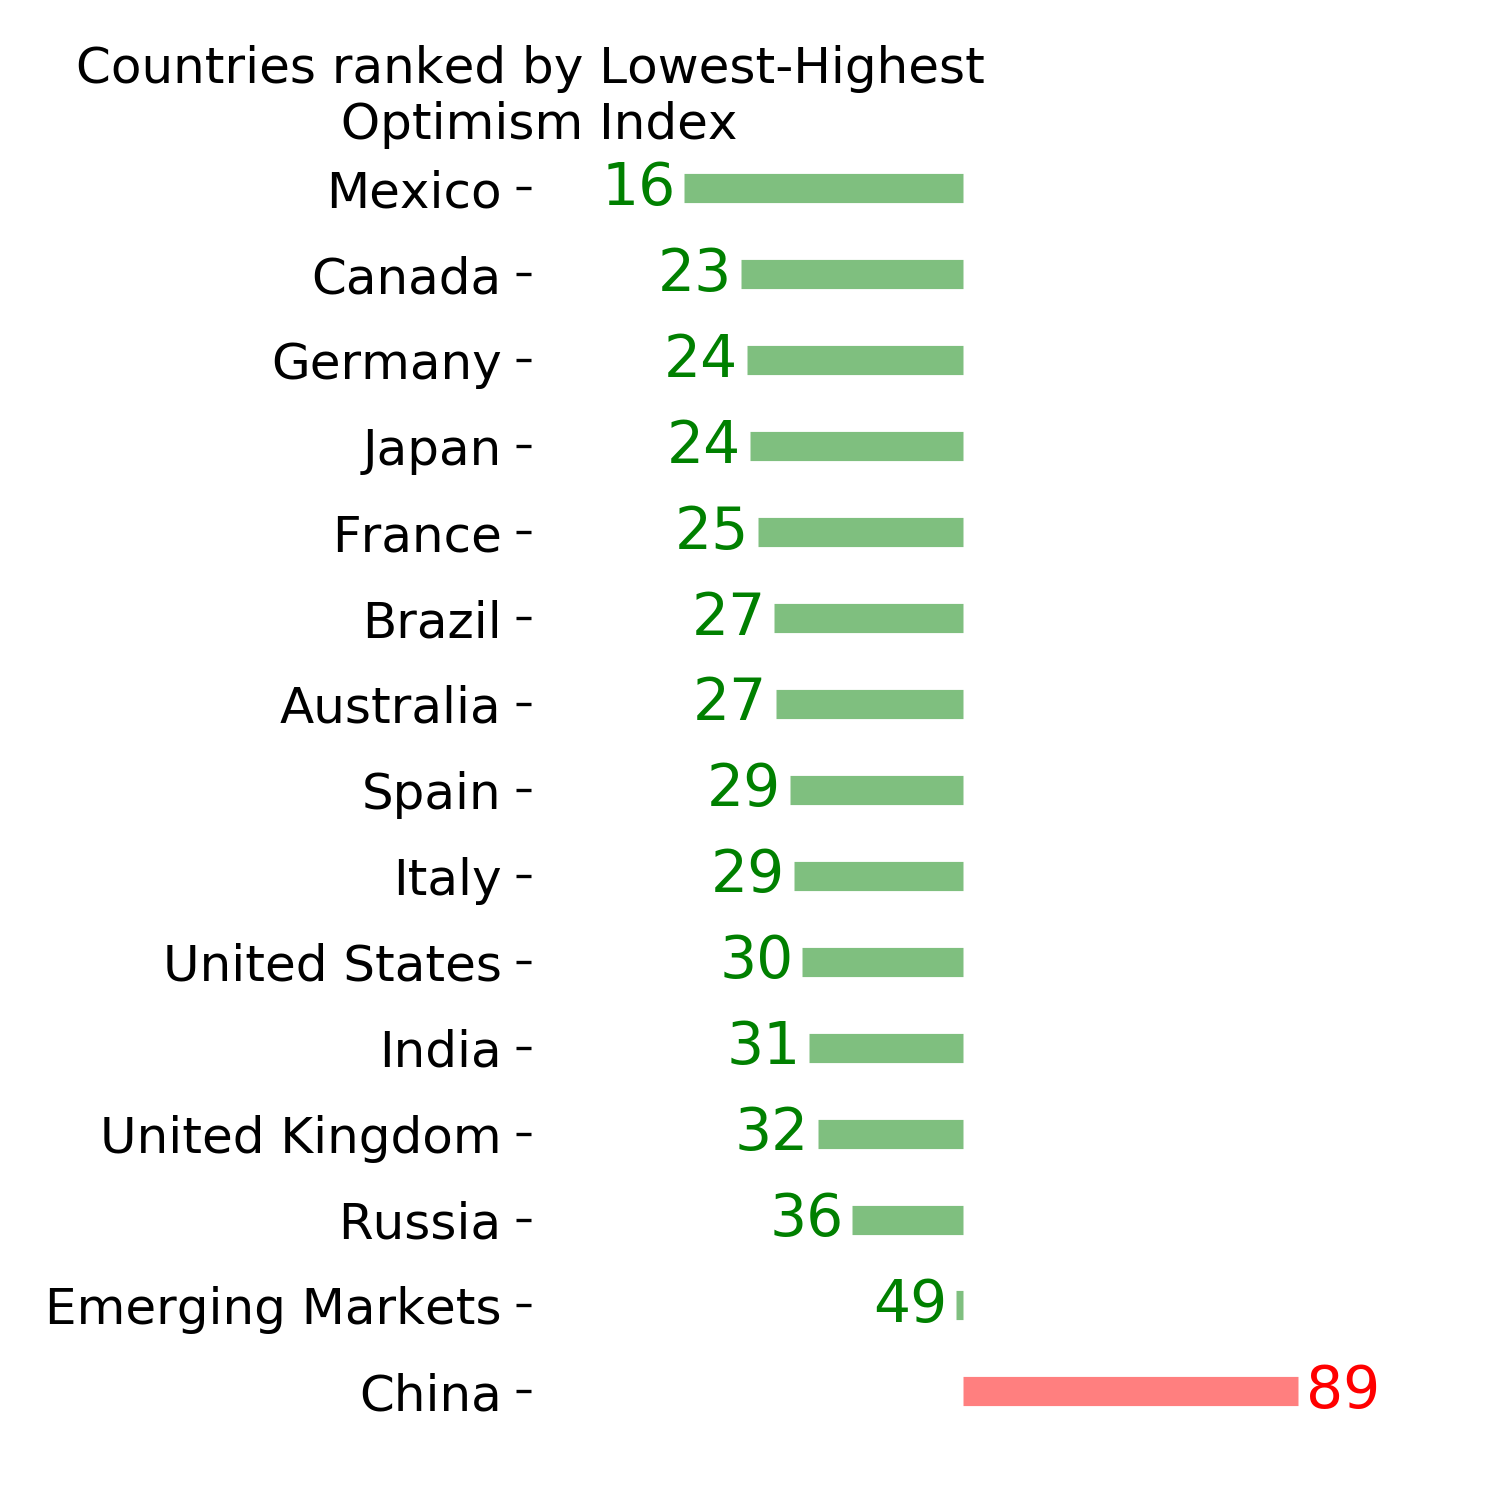
Indicators at Extremes
Phase Table
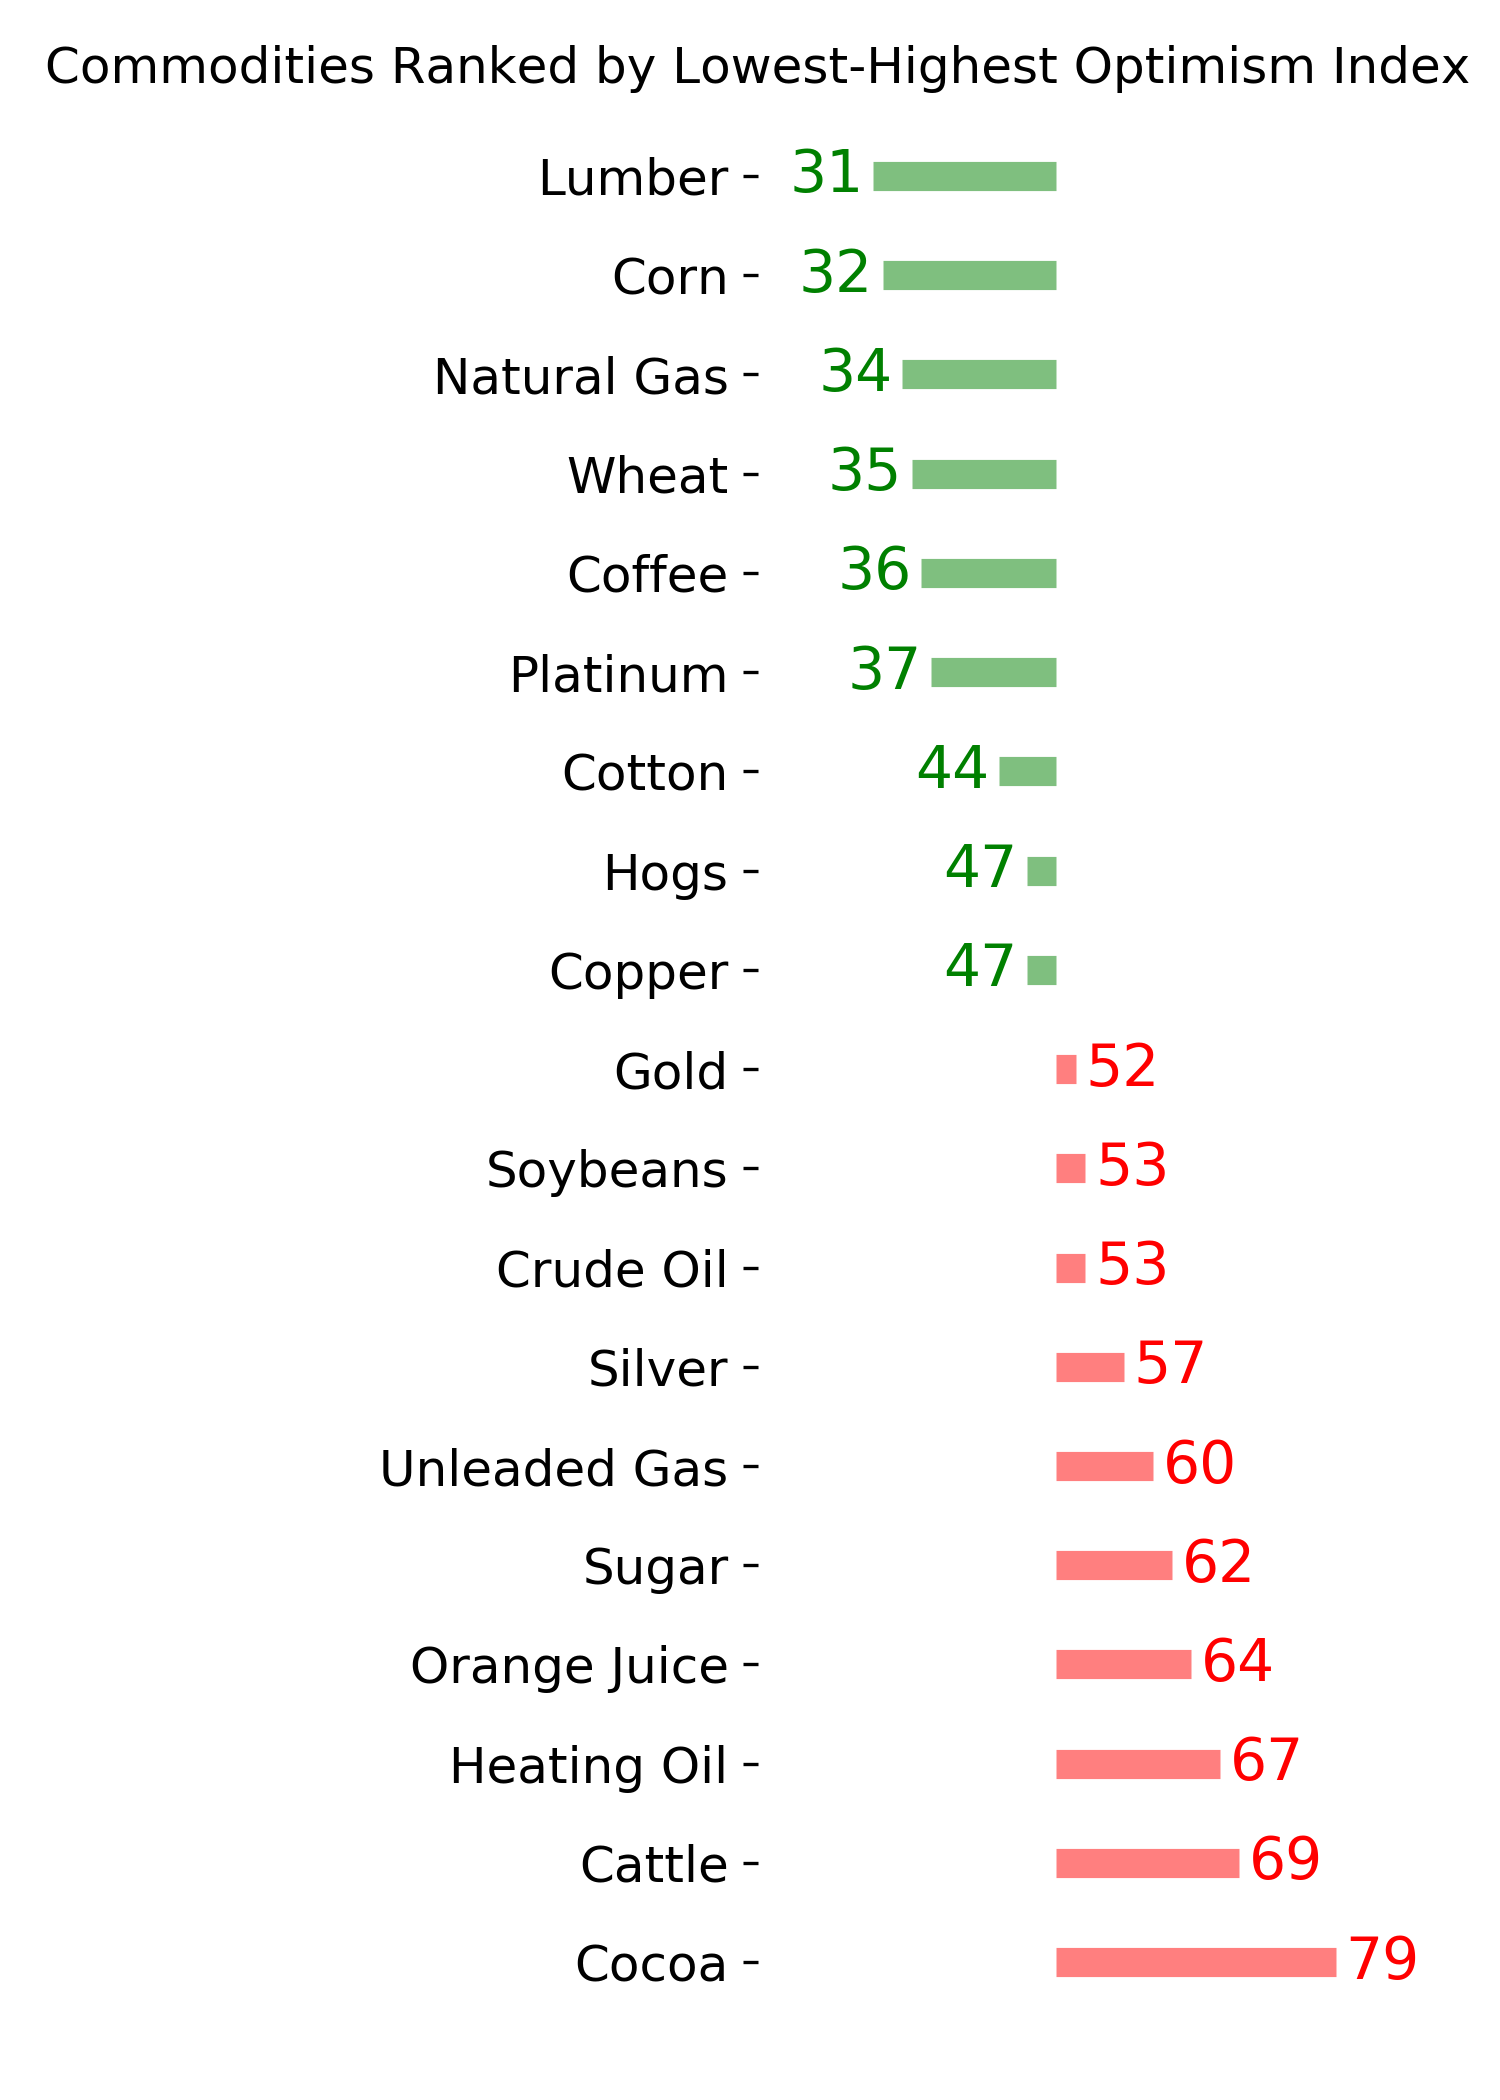
Ranks
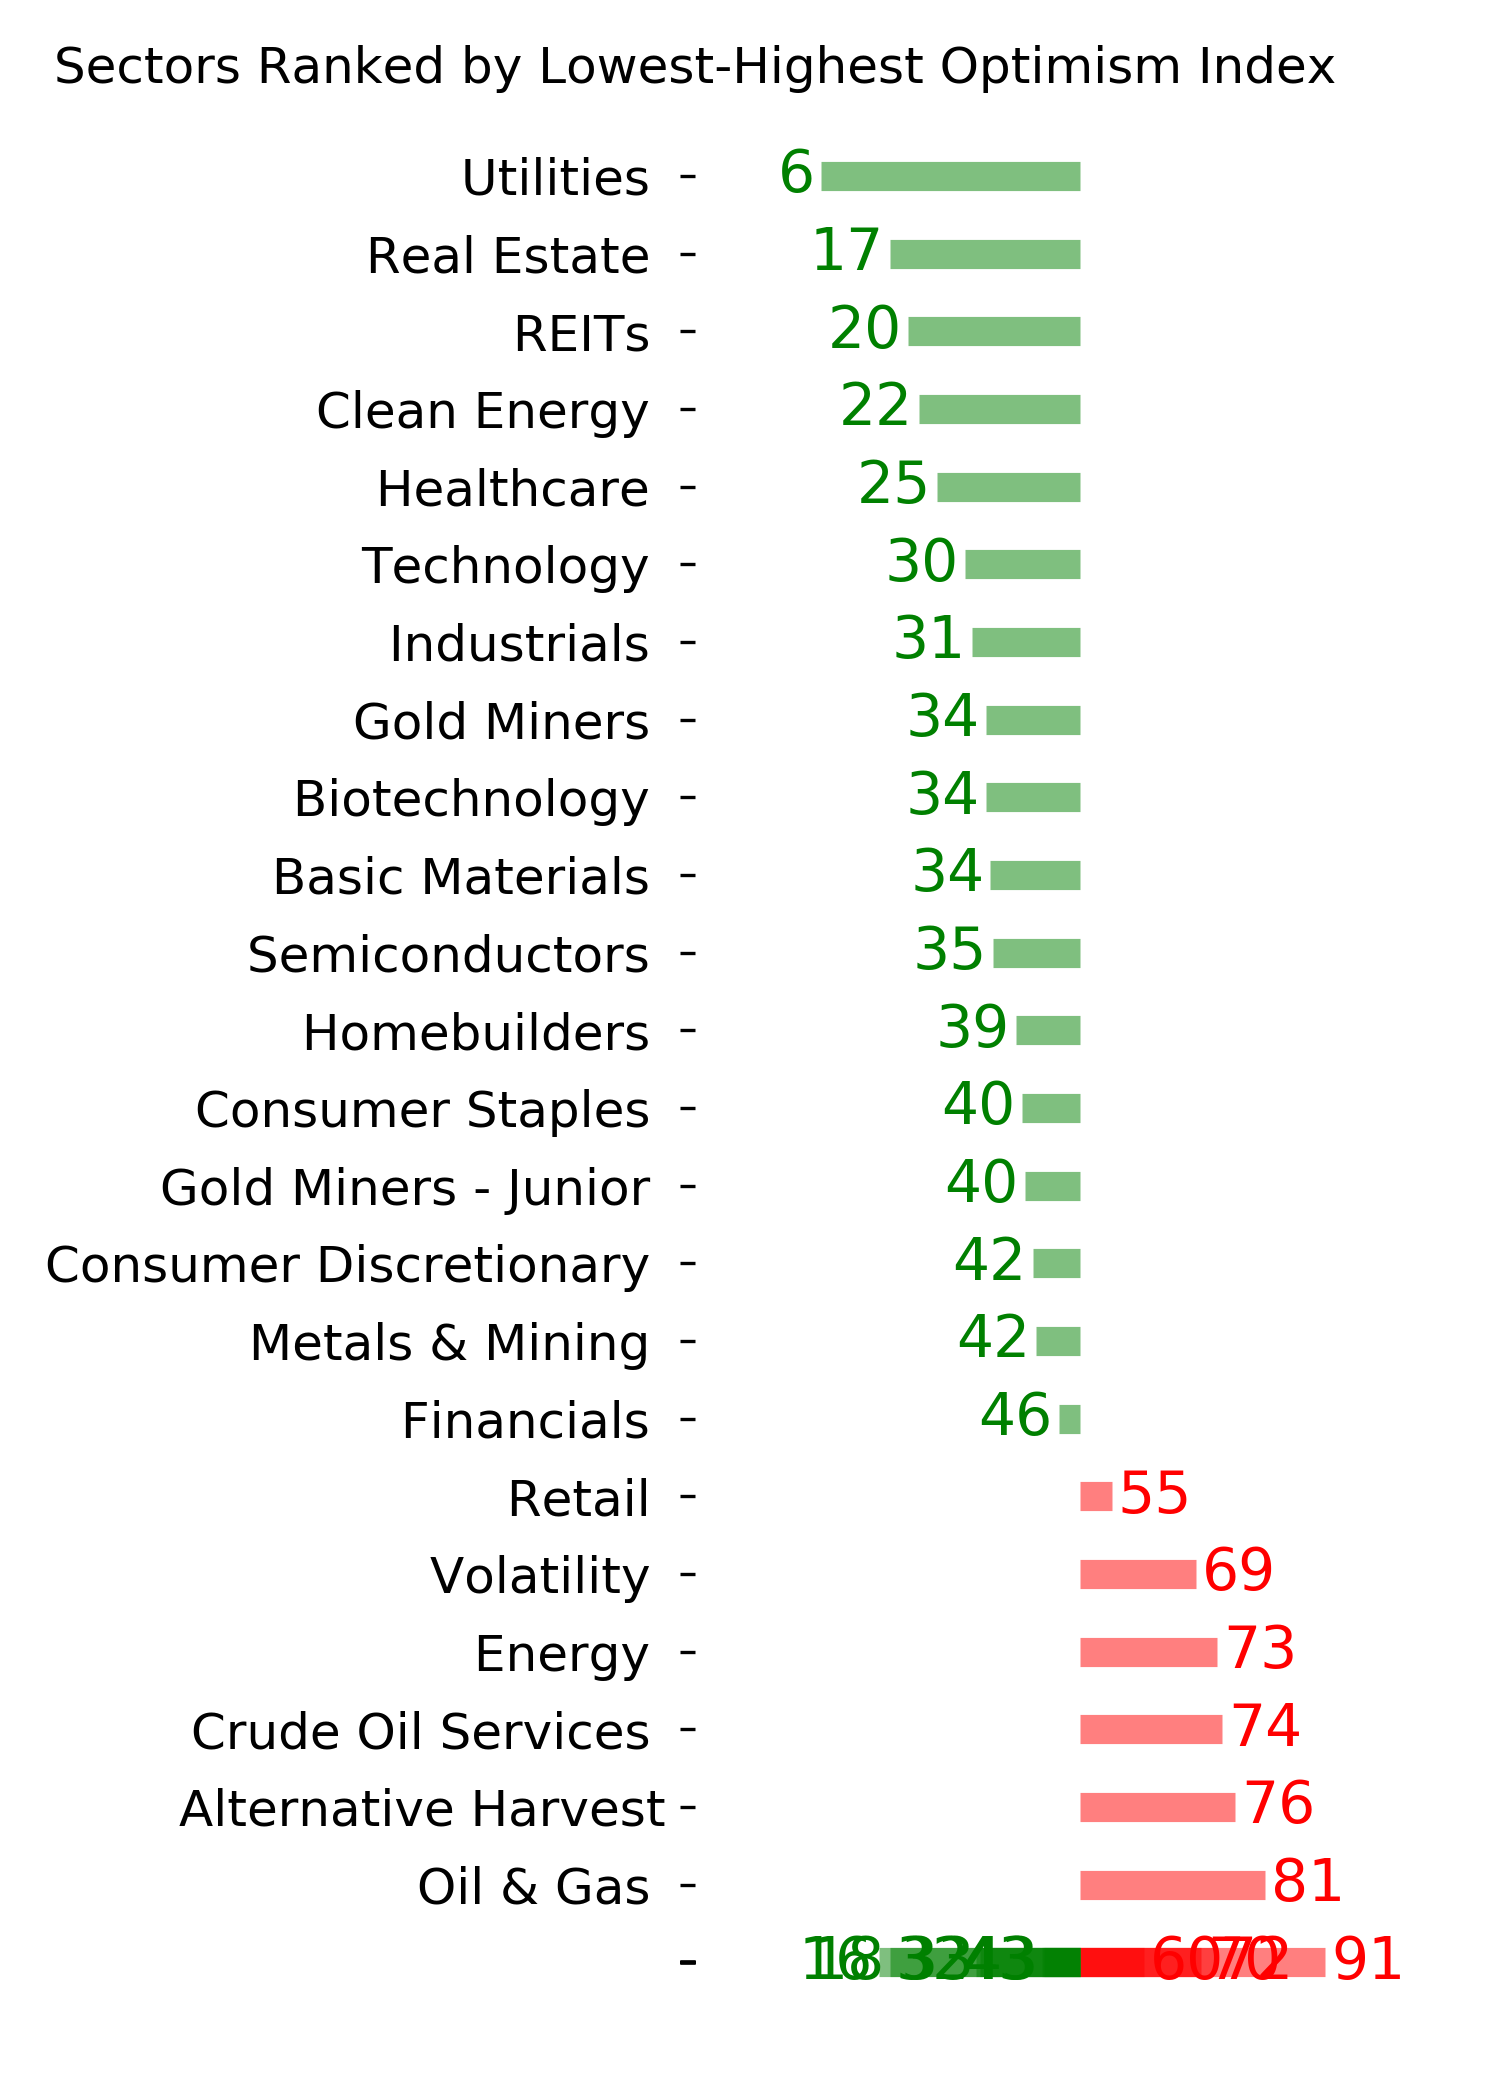
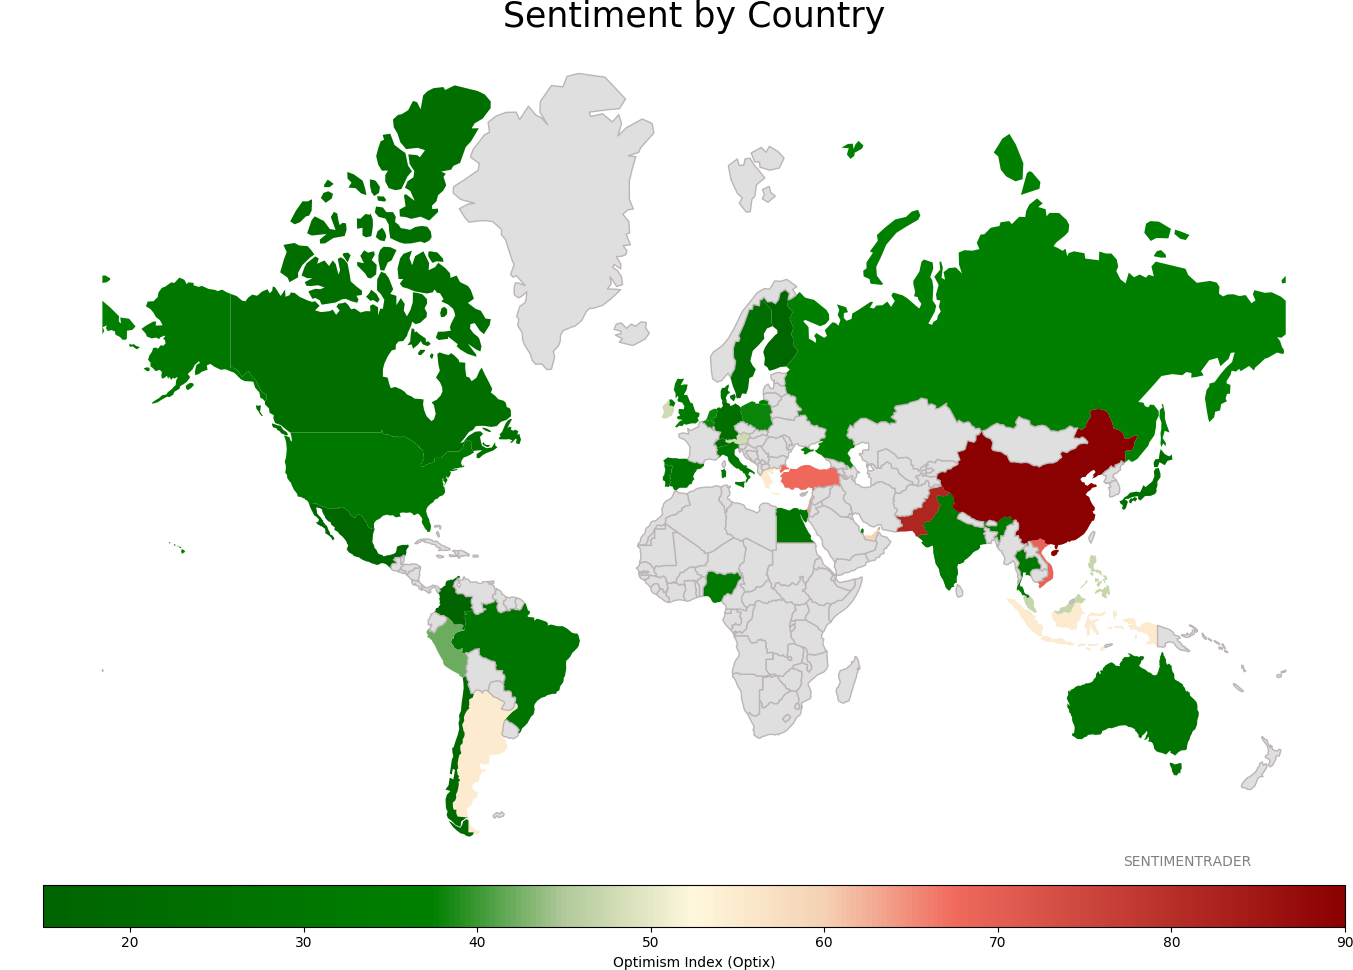
Sentiment Around The World
Optimism Index Thumbnails
|
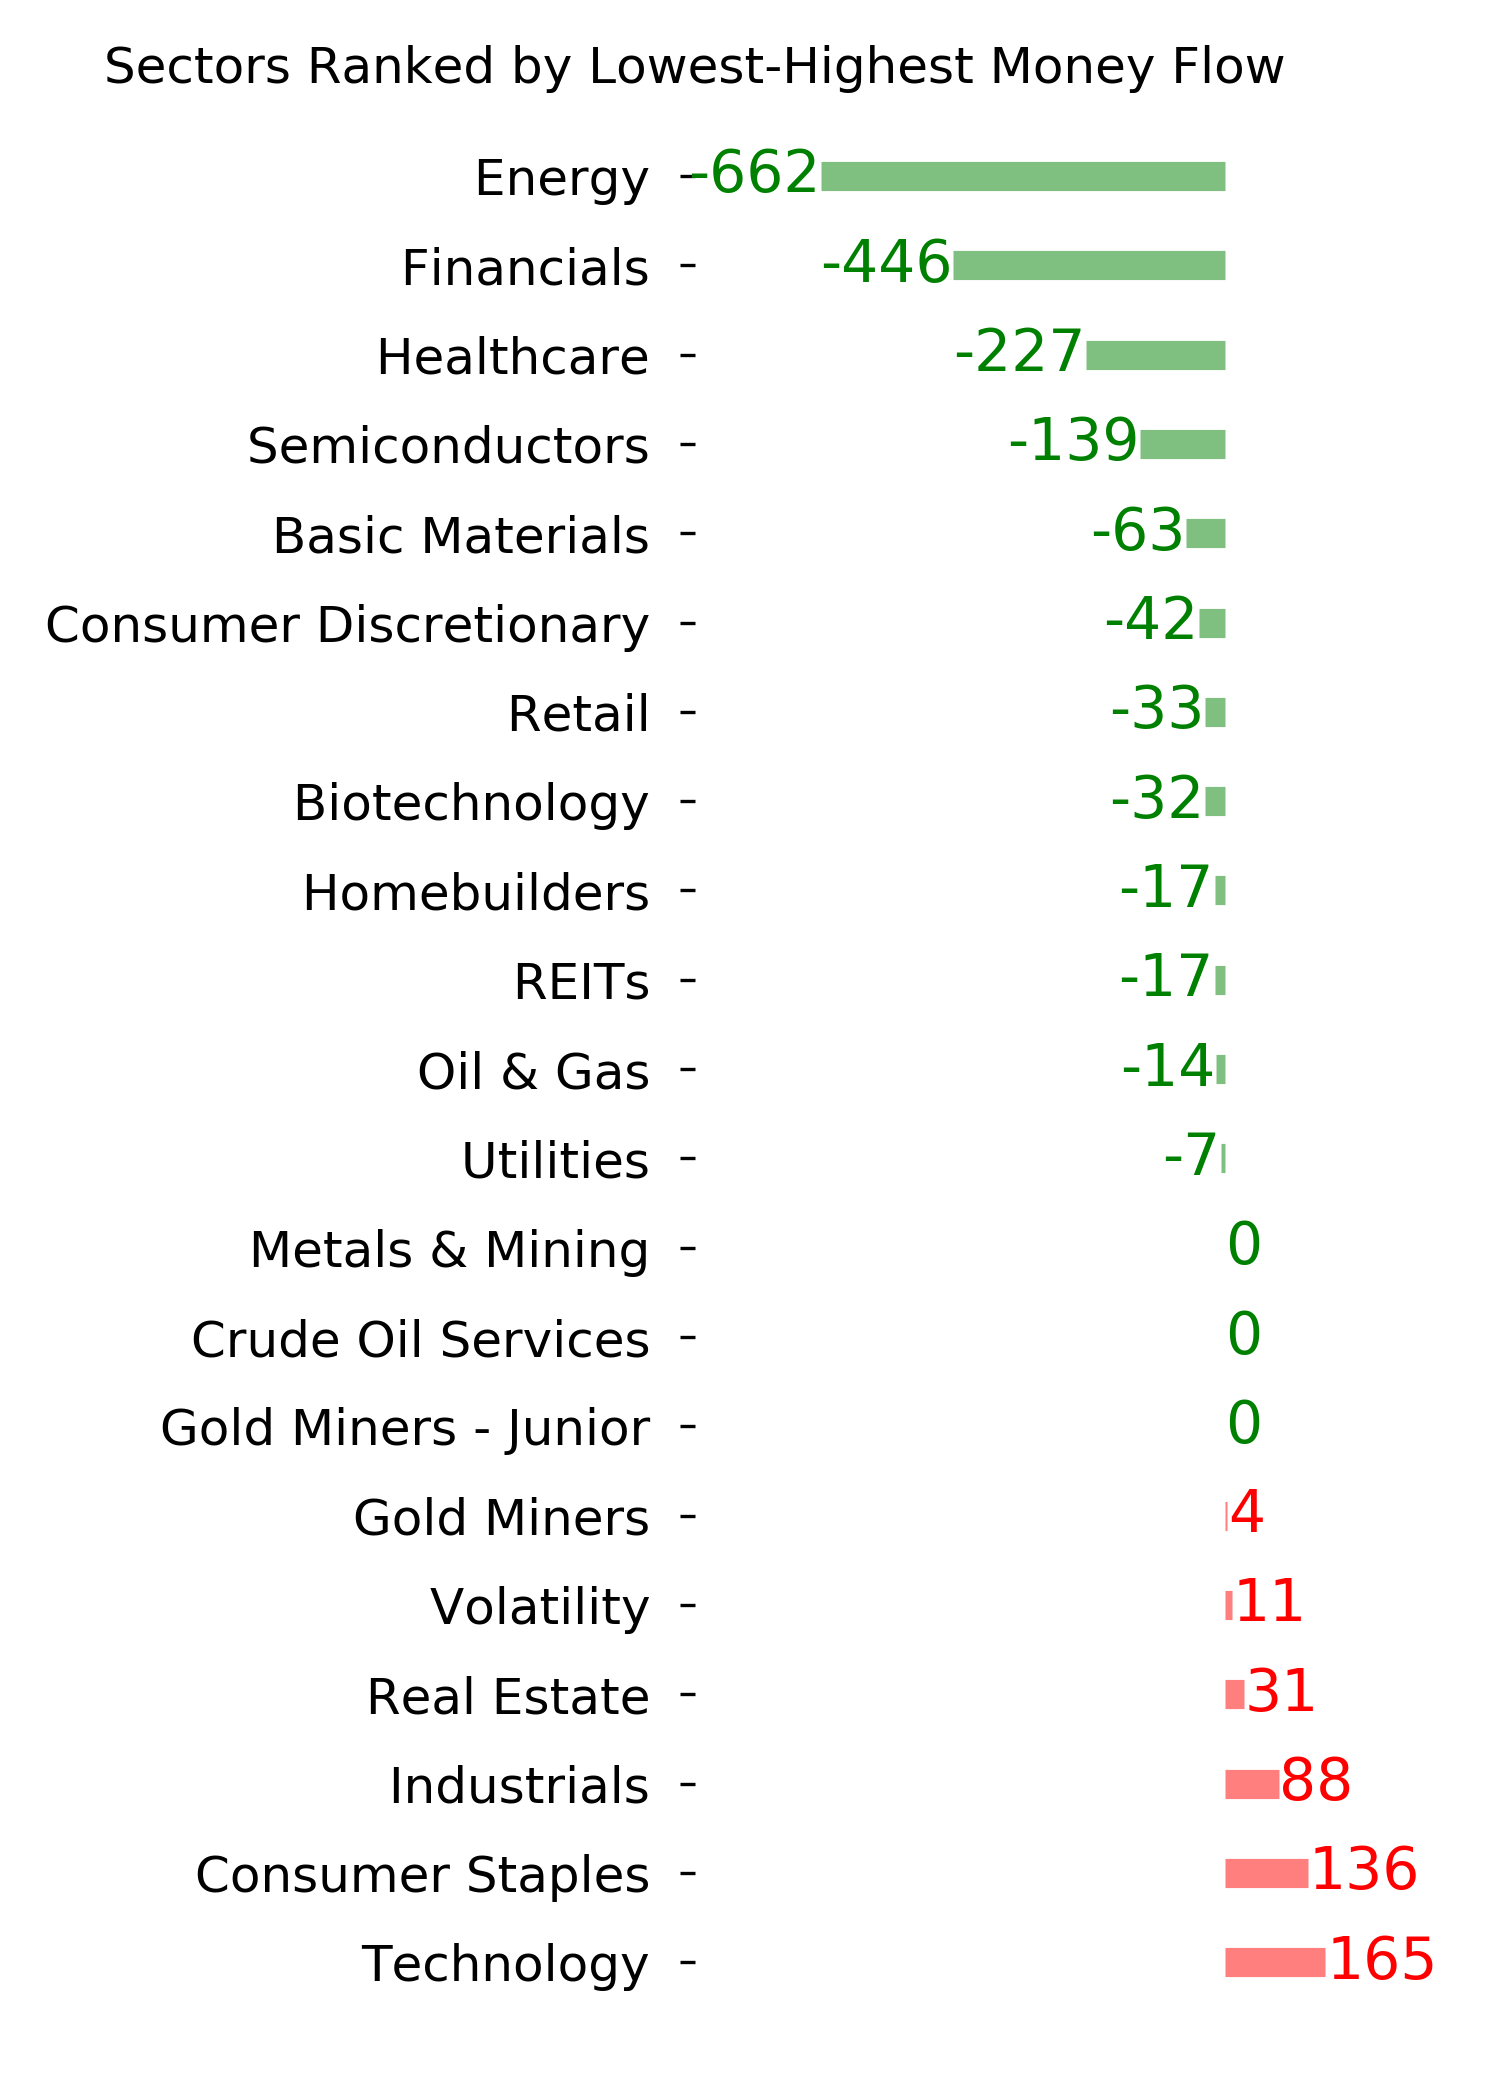
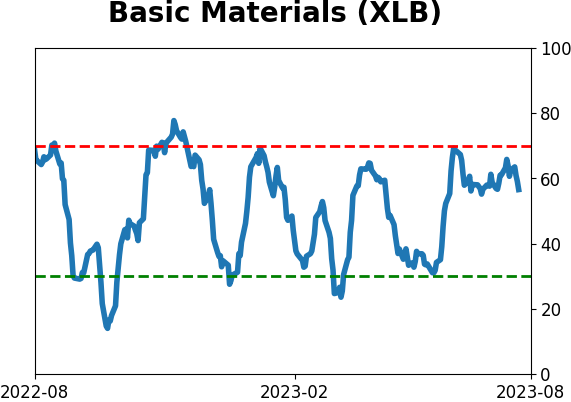
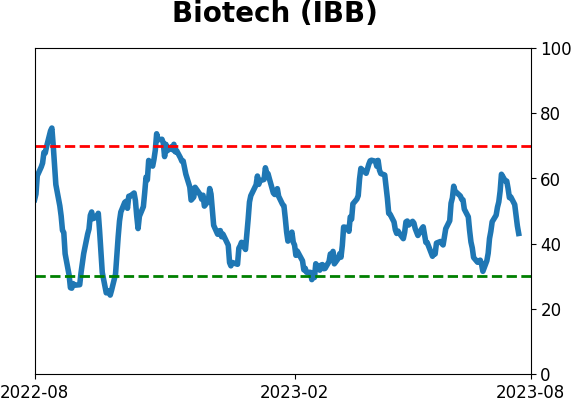
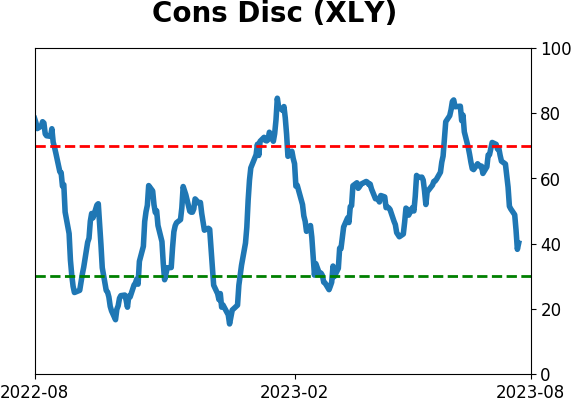
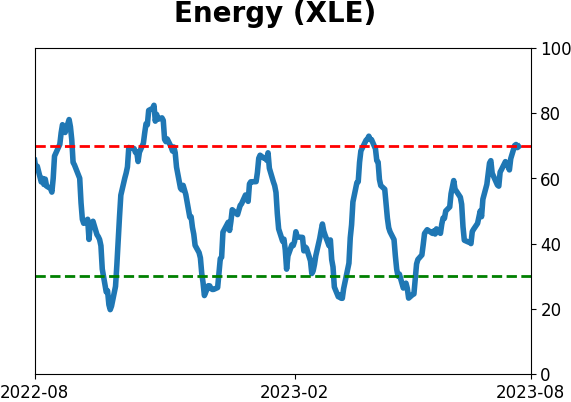
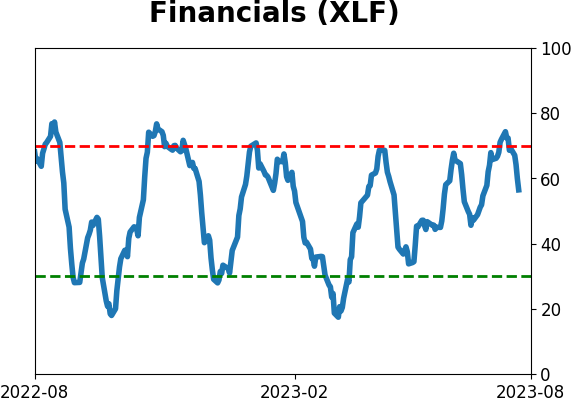
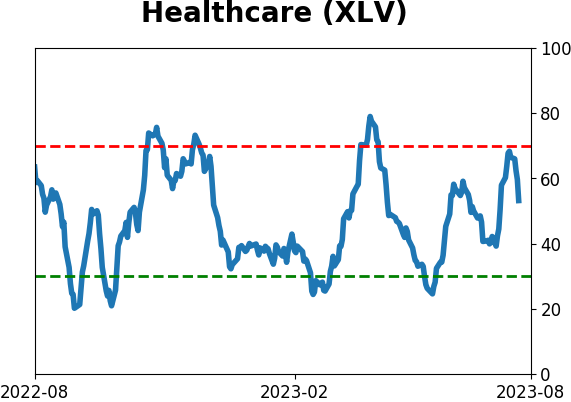
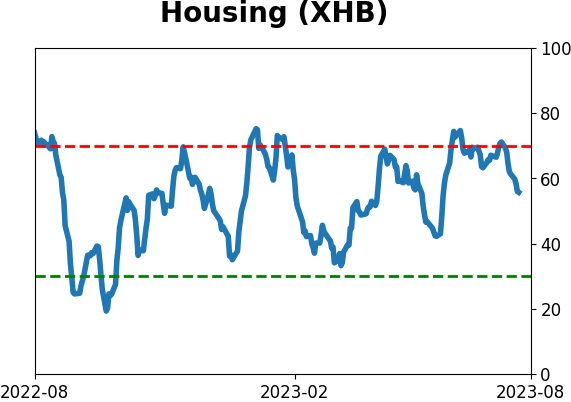
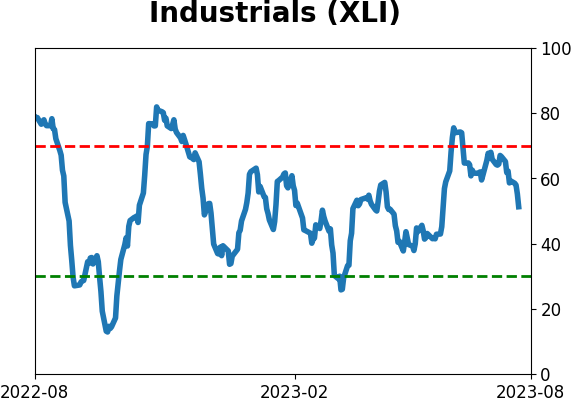
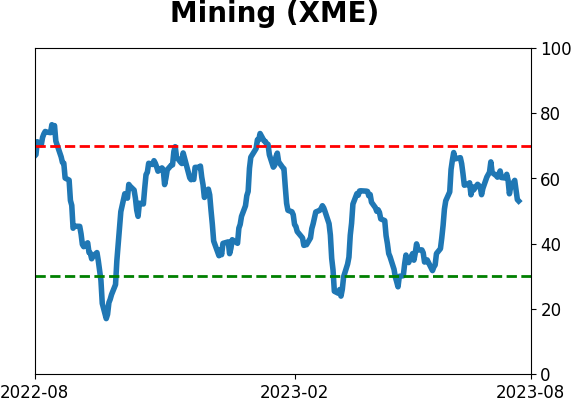
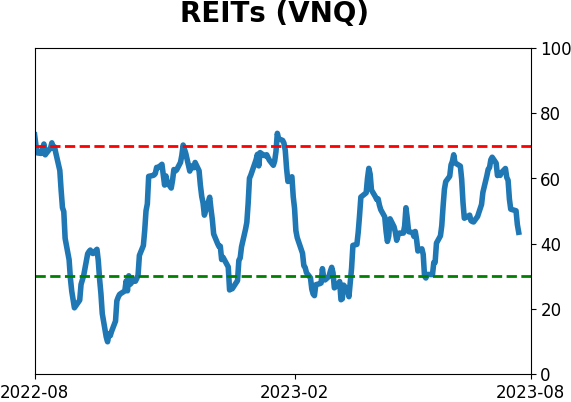
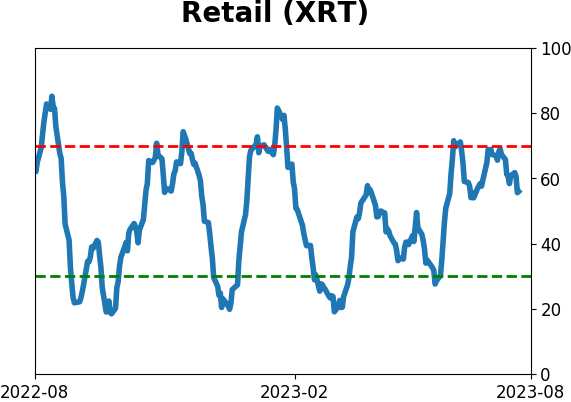
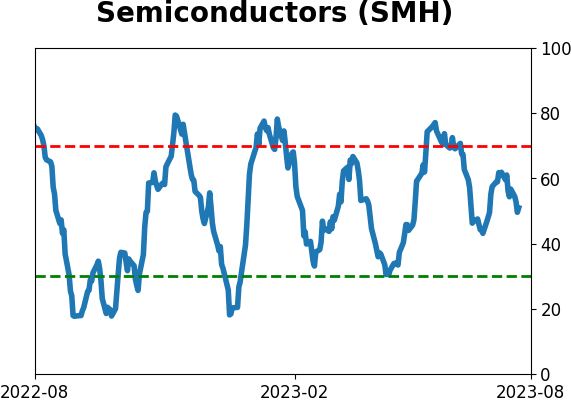
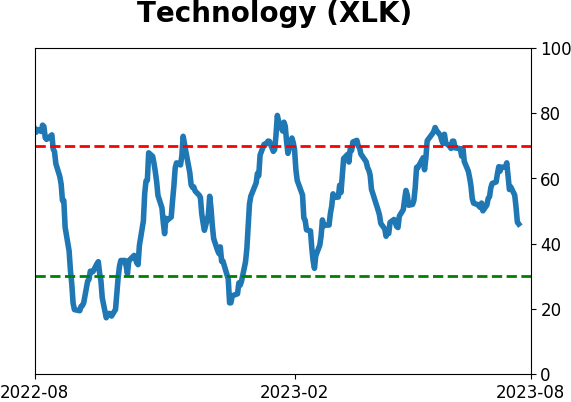
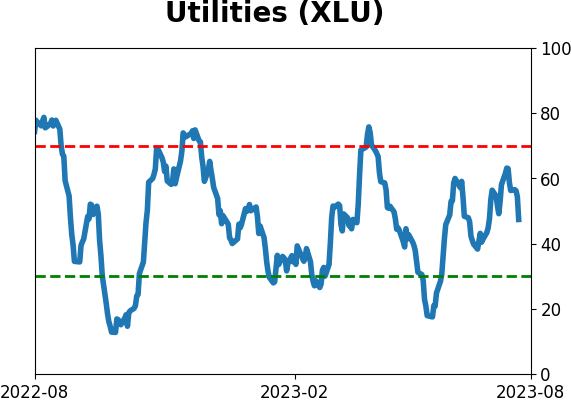
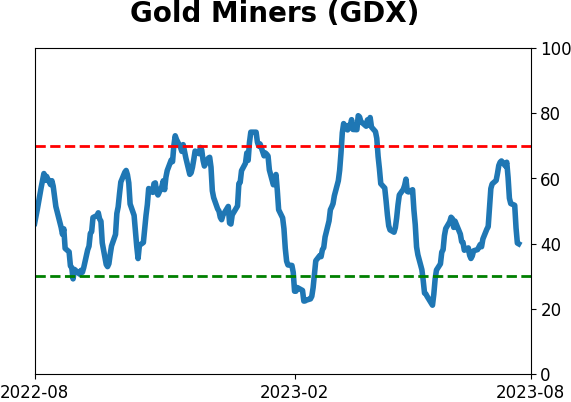
Sector ETF's - 10-Day Moving Average
|
|
|
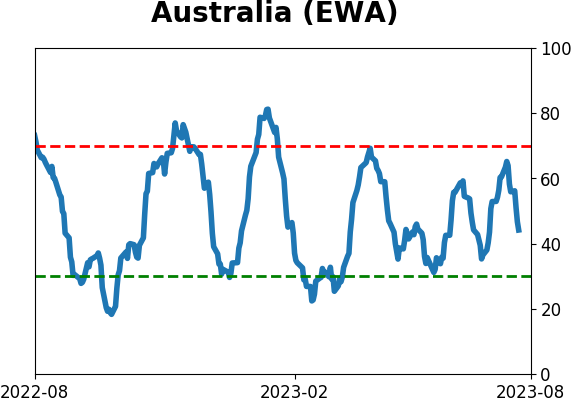
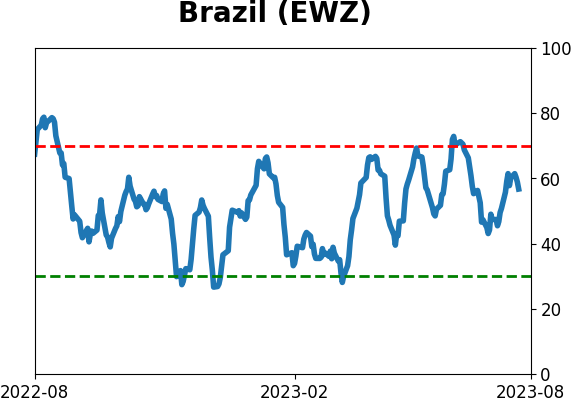
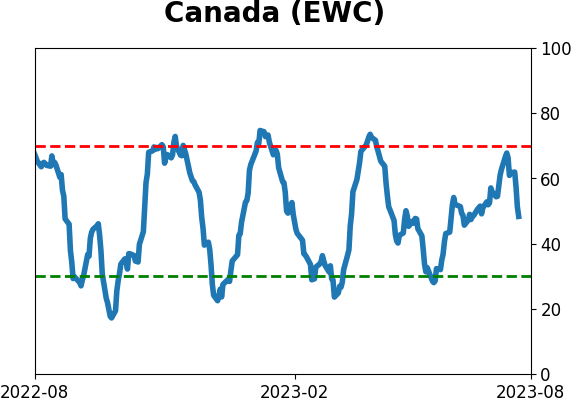
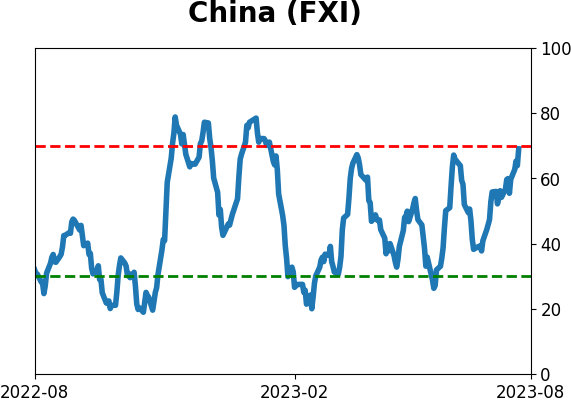
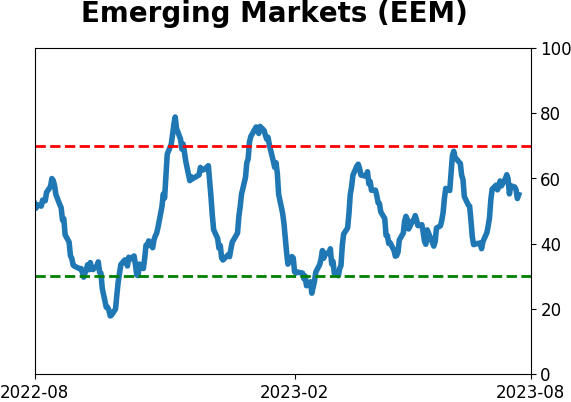
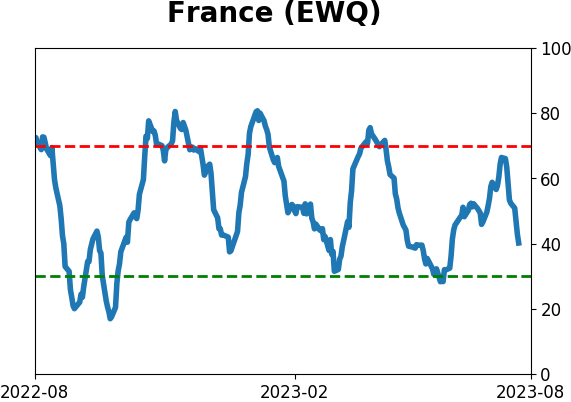
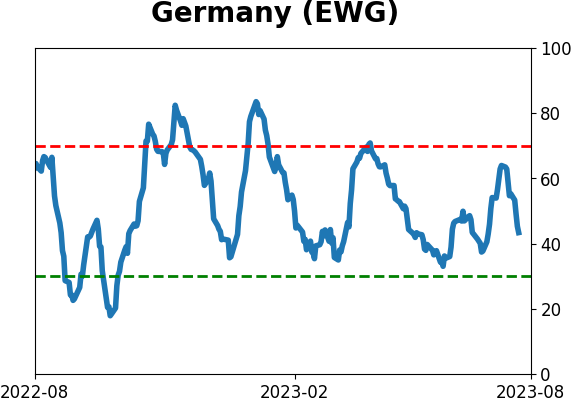
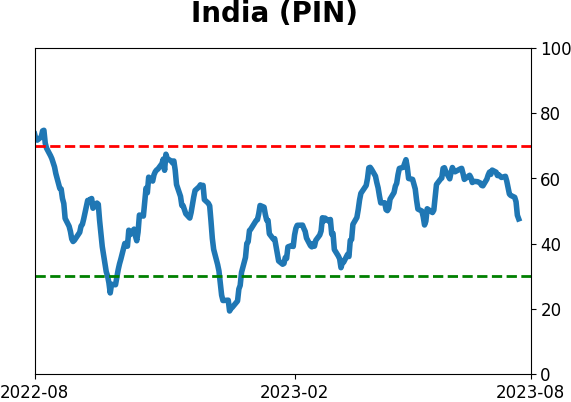
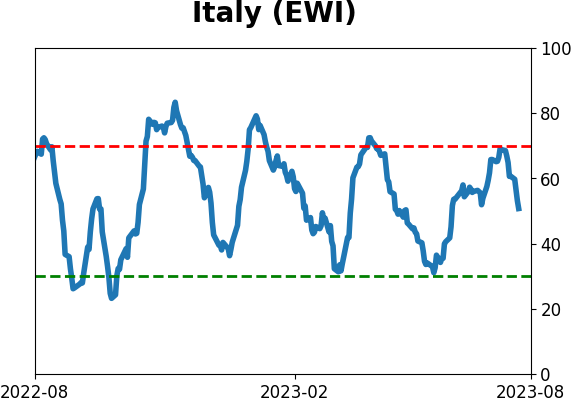
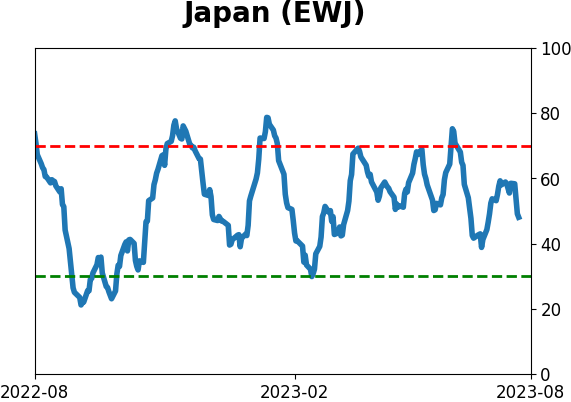
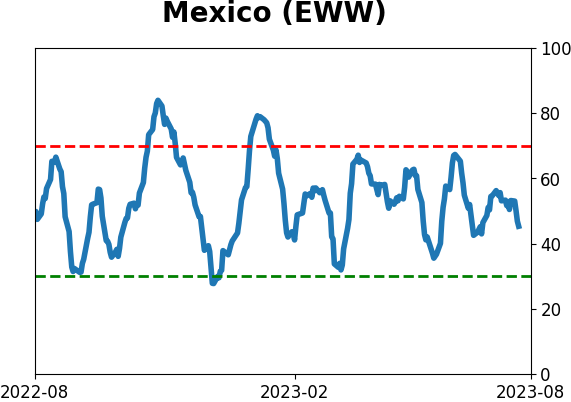
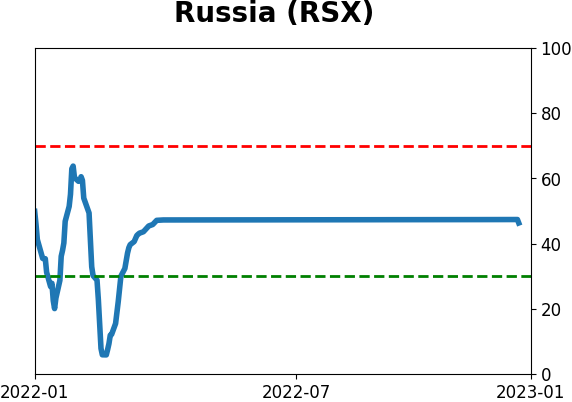
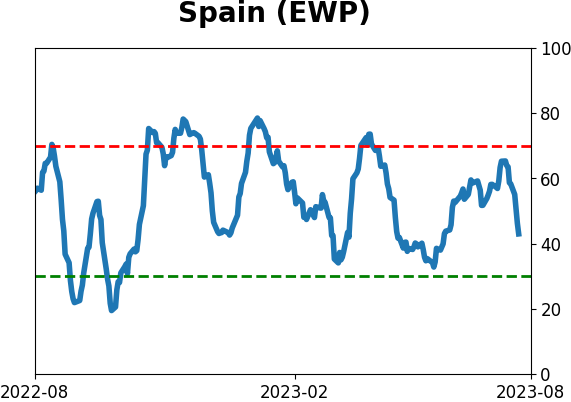
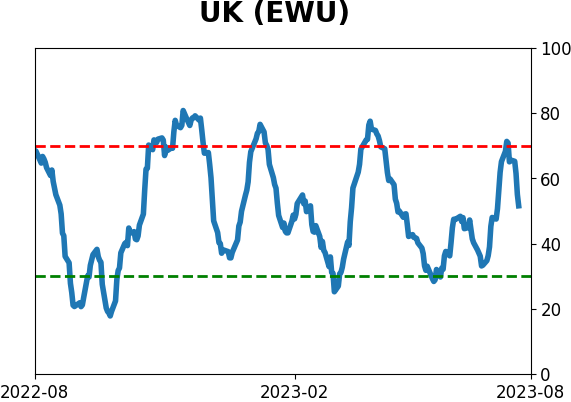
Country ETF's - 10-Day Moving Average
|
|
|
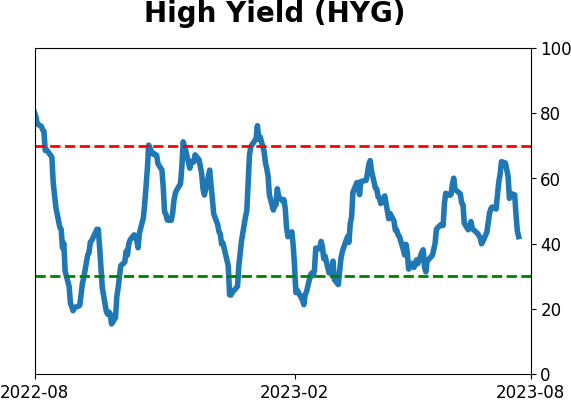
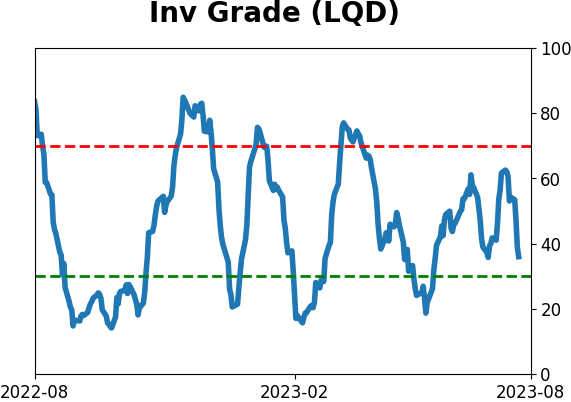
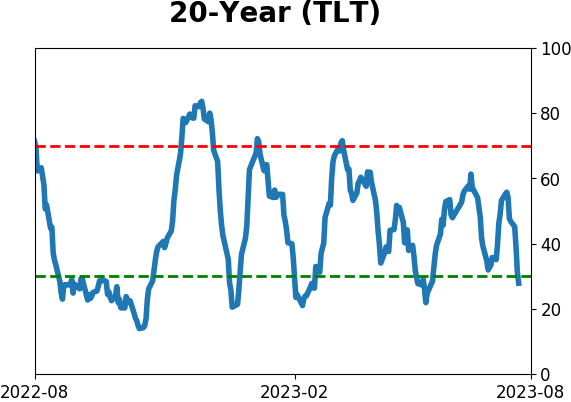
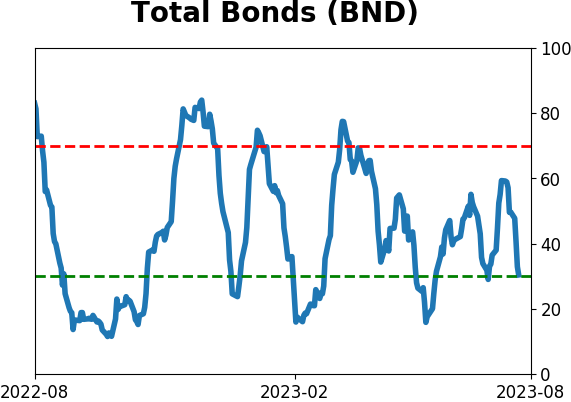
Bond ETF's - 10-Day Moving Average
|
|
|
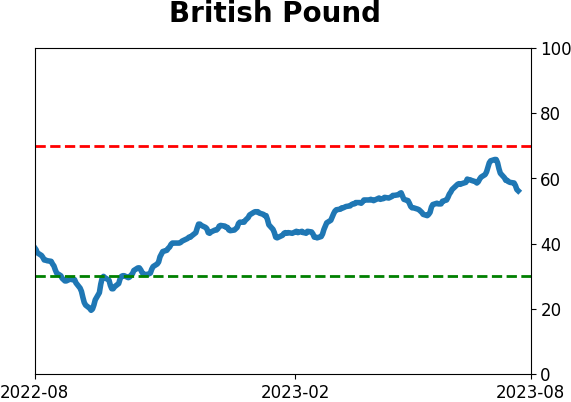
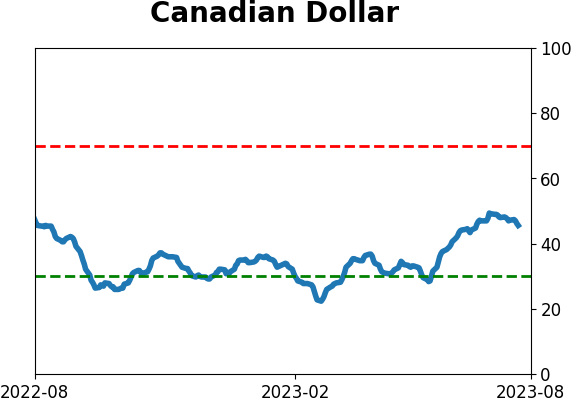
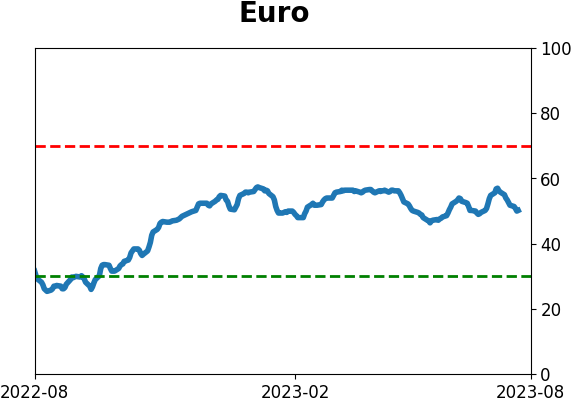
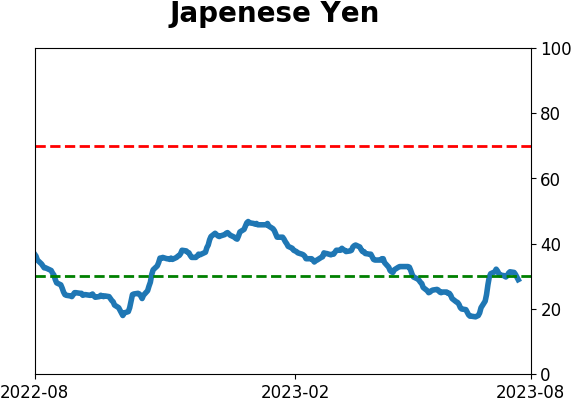
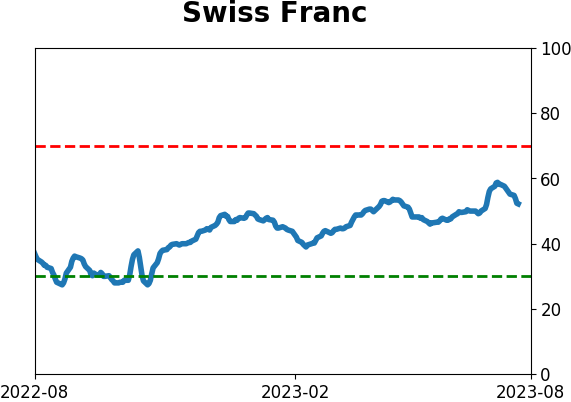
Currency ETF's - 5-Day Moving Average
|
|
|
Commodity ETF's - 5-Day Moving Average
|
|