Headlines
|
|
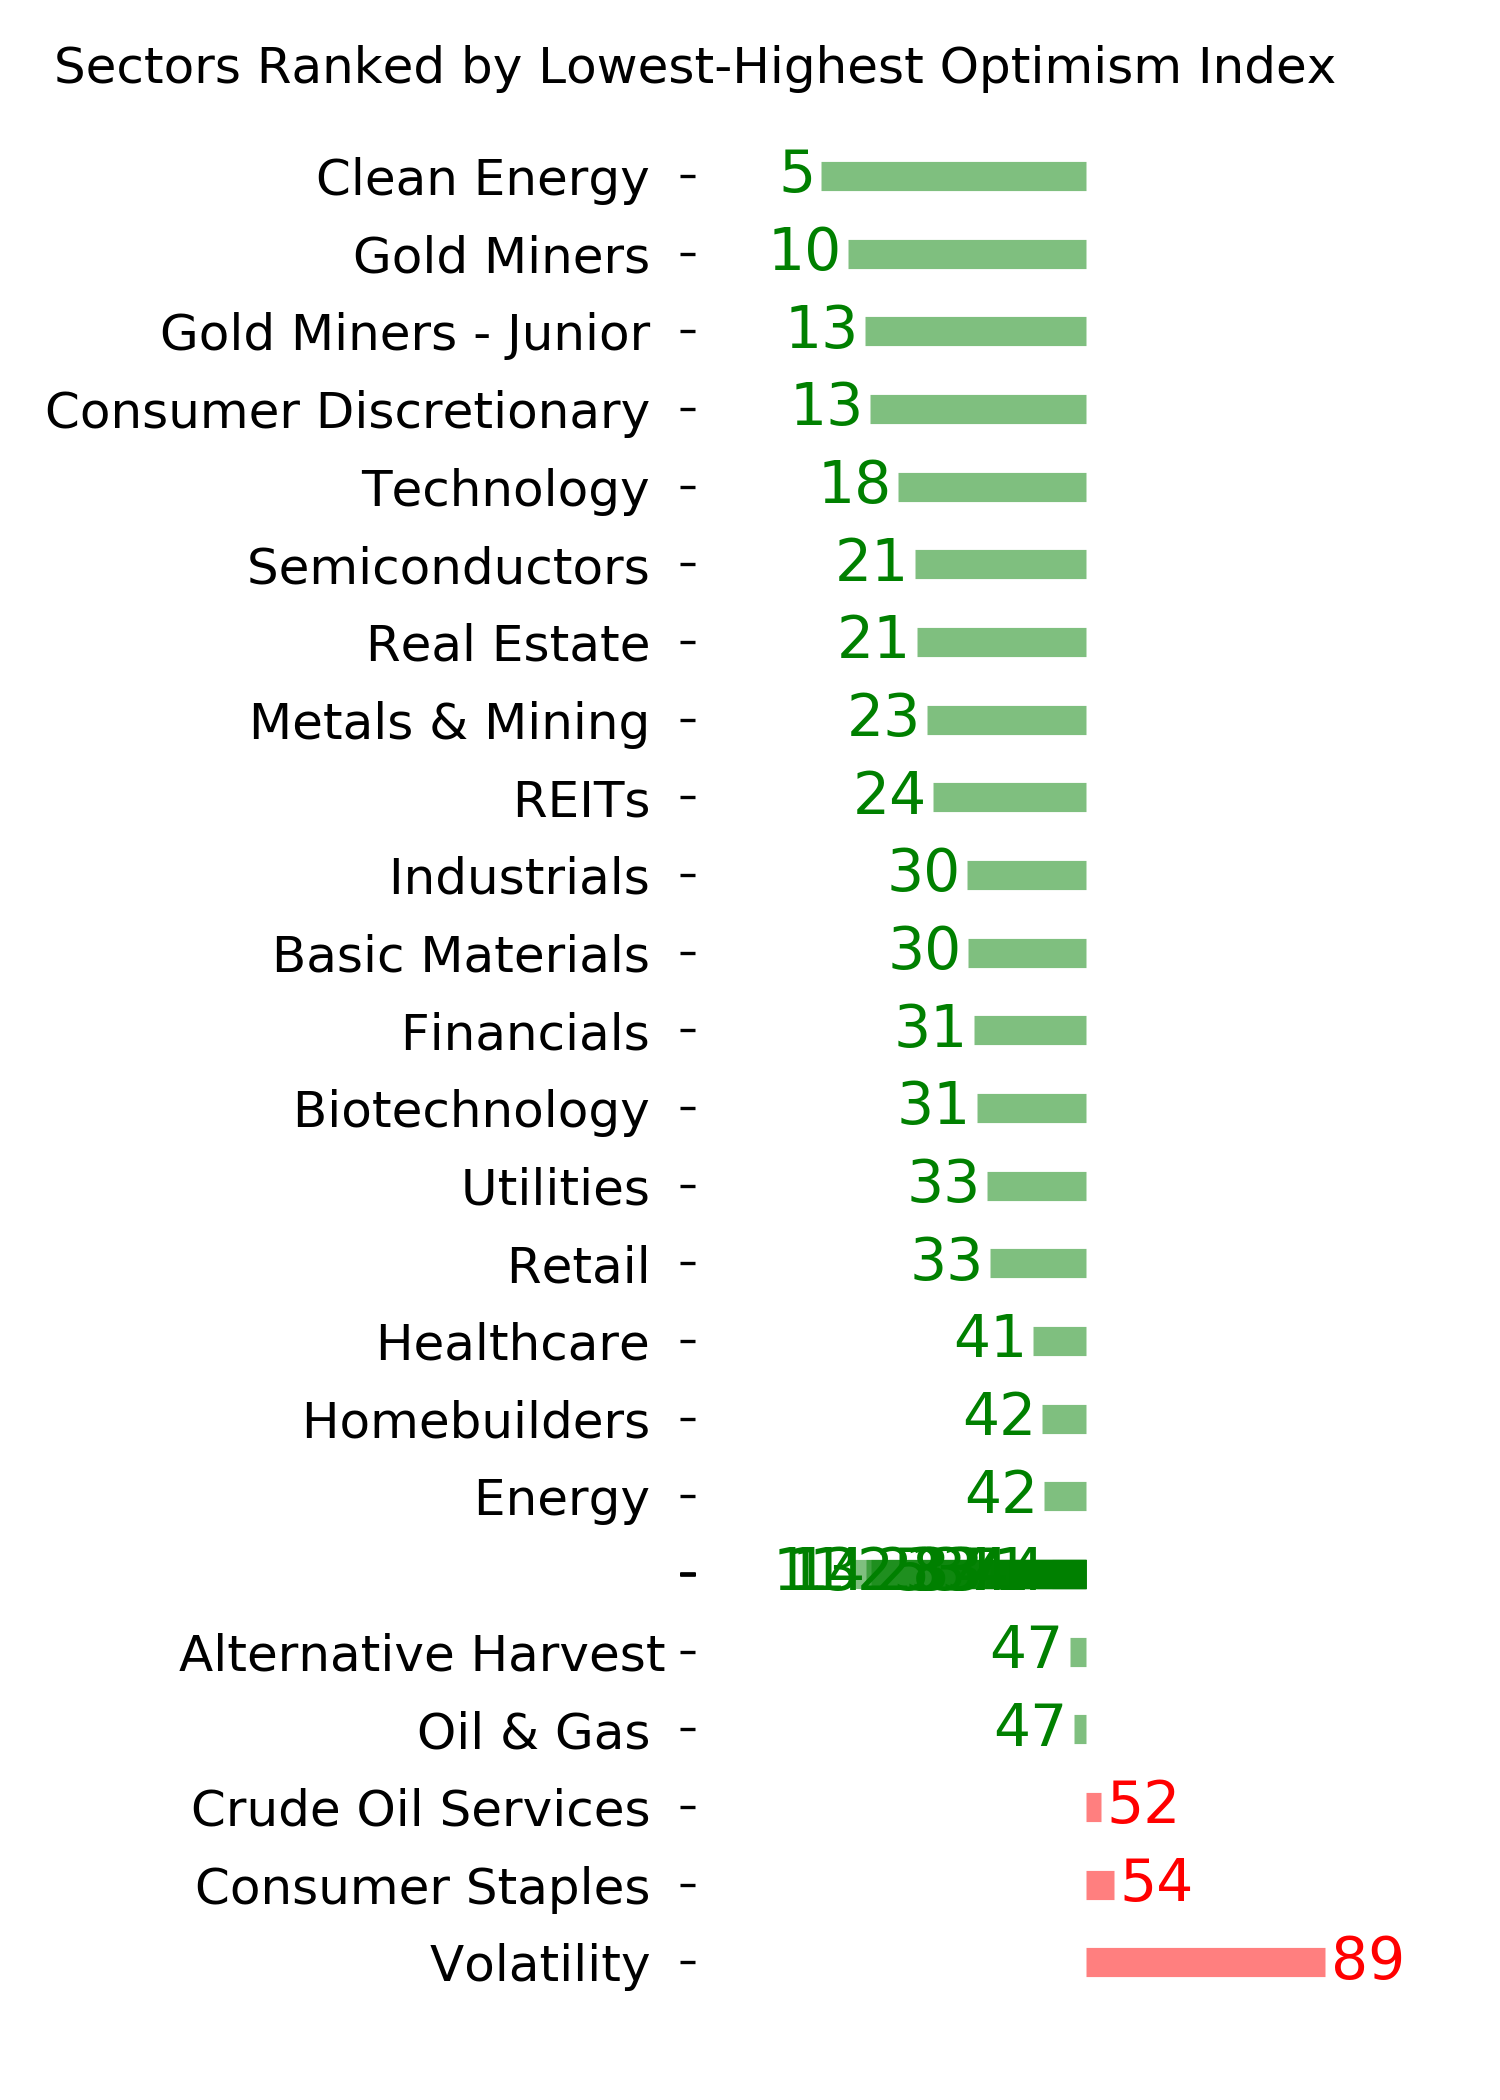
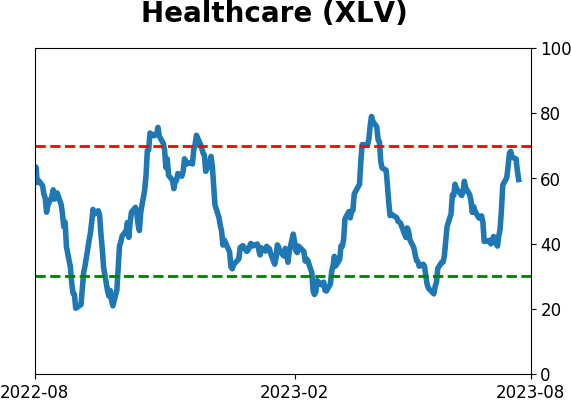
Health Care seasonality and other struggles:
The Health Care sector has underperformed the broad market by a historic degree in 2023, and some indicators suggest that could continue. Seasonality for the sector is entering is worst stretch, participation is showing negative divergences, there are signs of complacency, and insiders aren't buying.
|
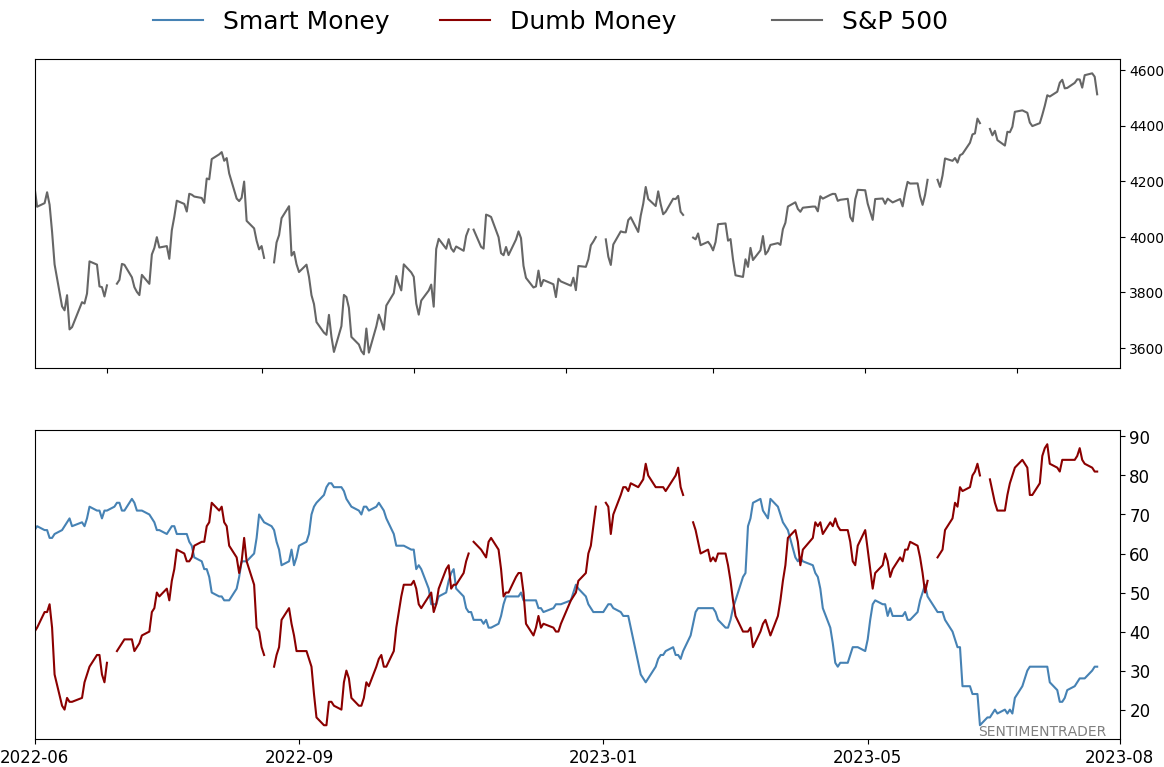
Smart / Dumb Money Confidence
|
Smart Money Confidence: 31%
Dumb Money Confidence: 81%
|
|
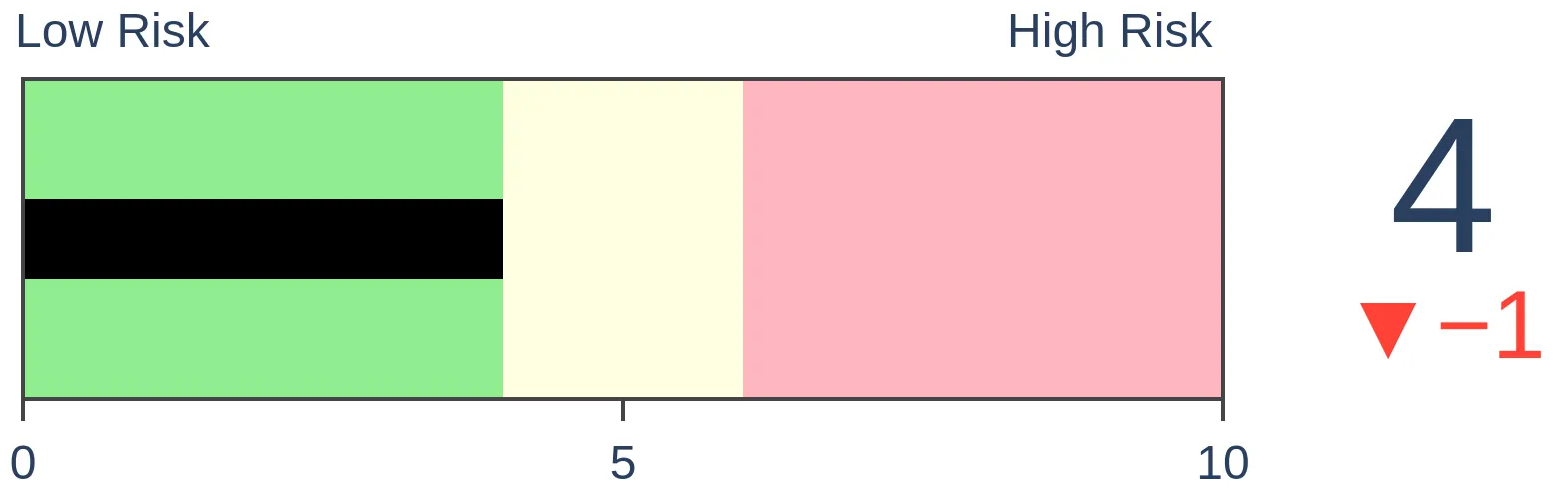
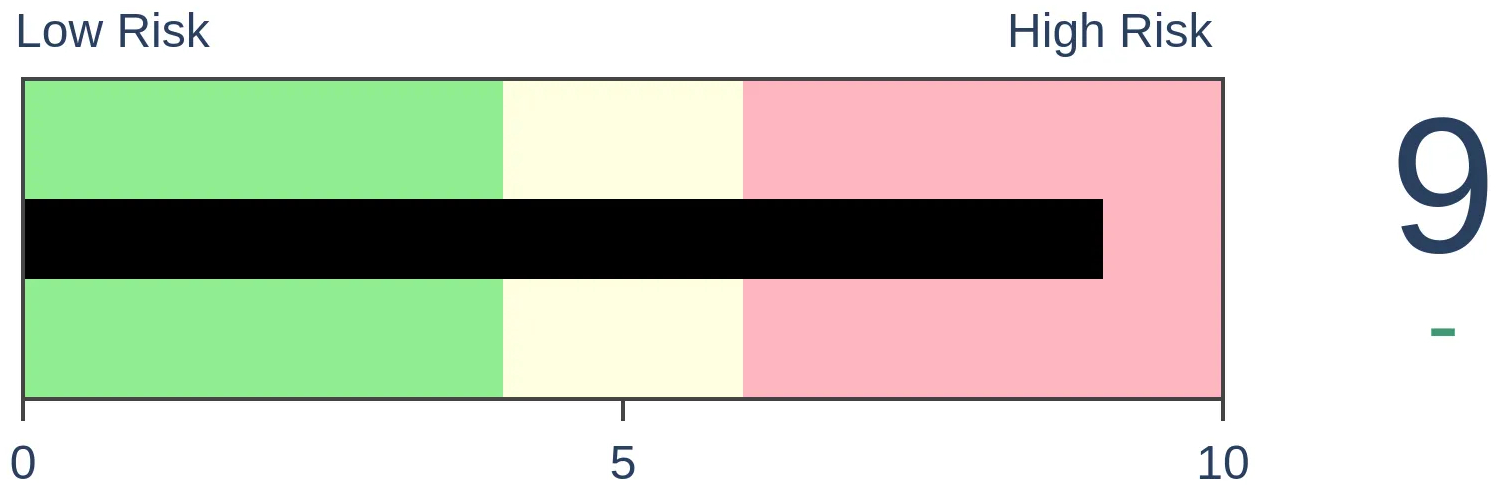
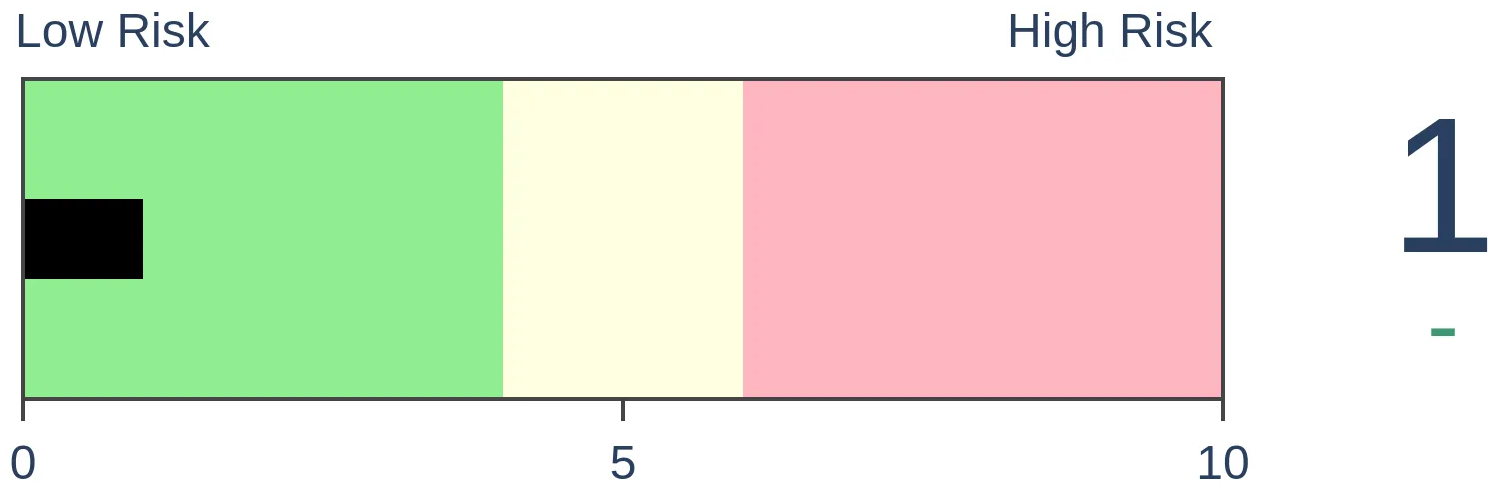
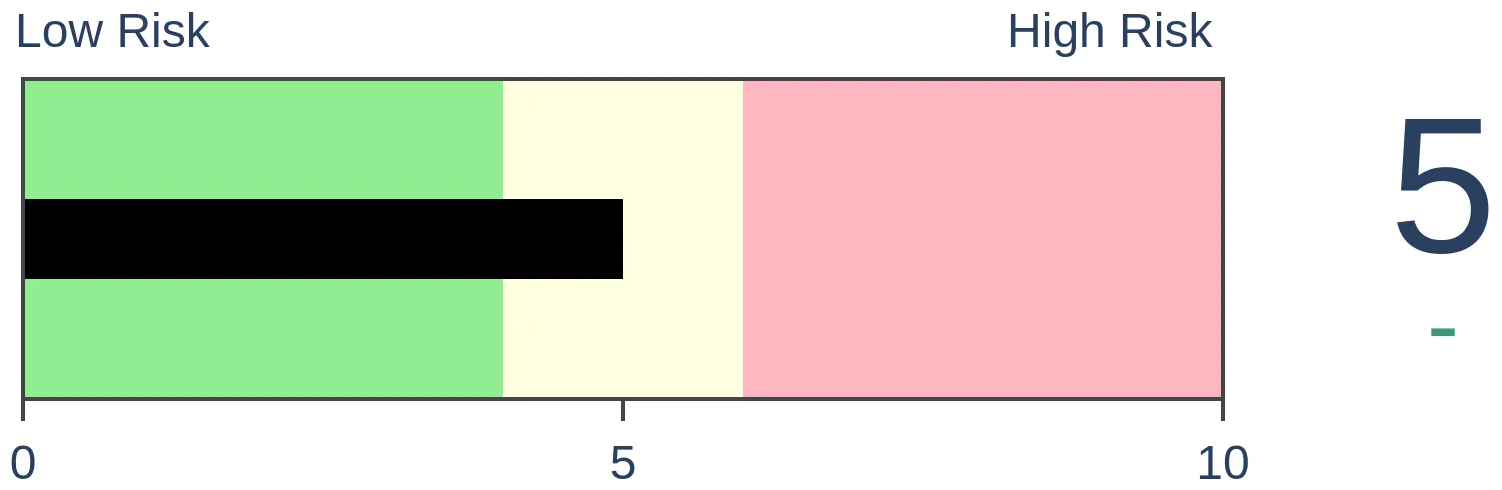
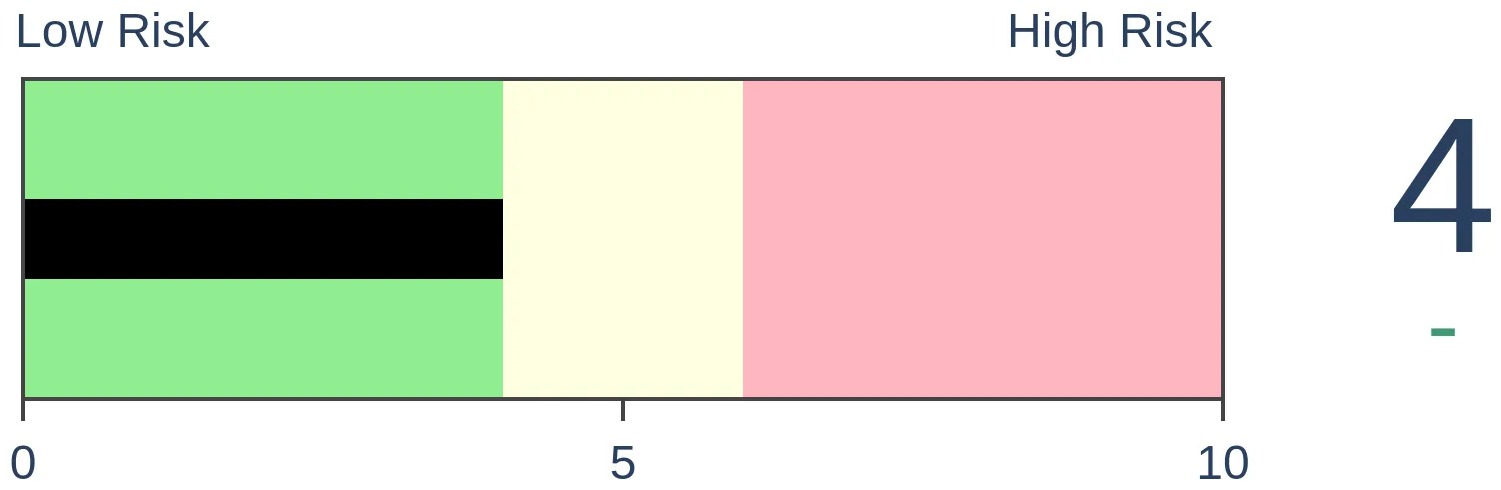
Risk Levels
Stocks Short-Term
|
Stocks Medium-Term
|
|
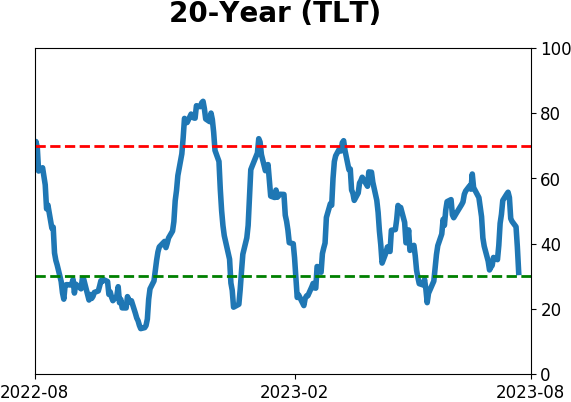
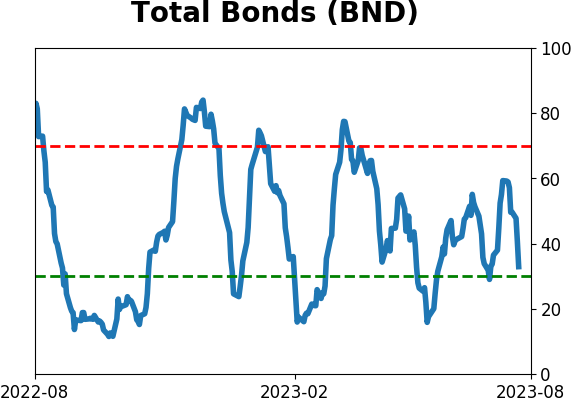
Bonds
|
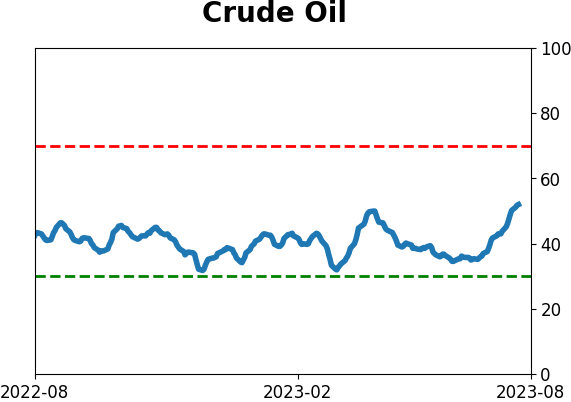
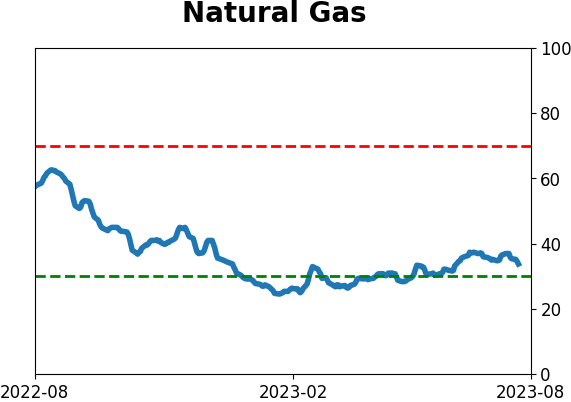
Crude Oil
|
|
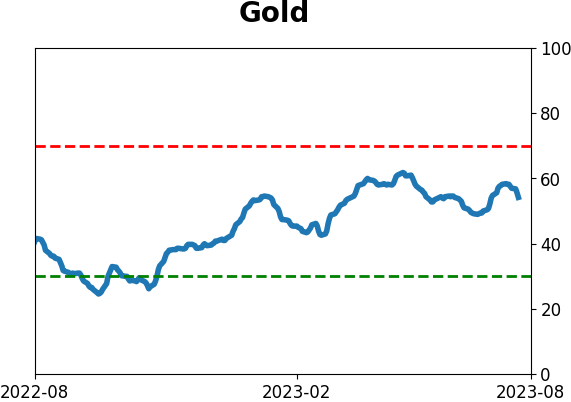
Gold
|
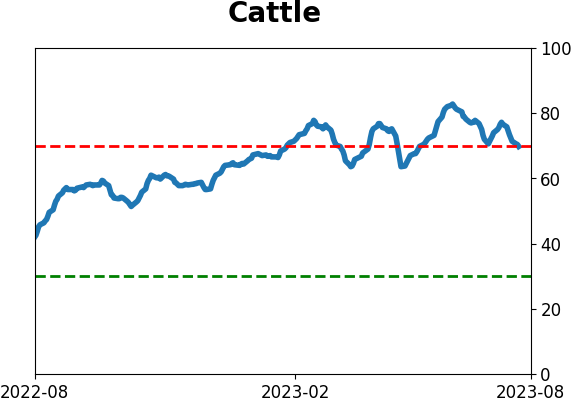
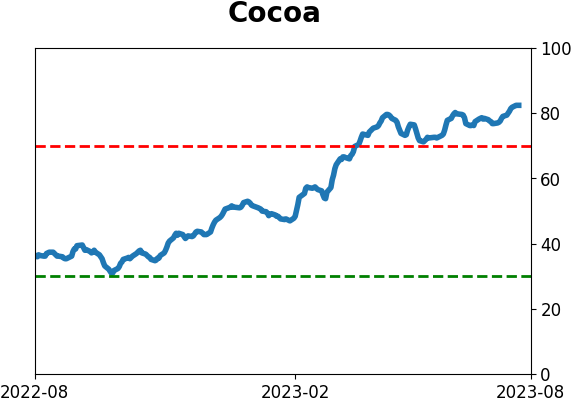
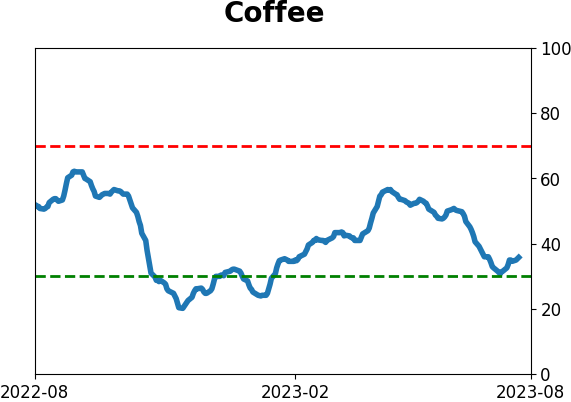
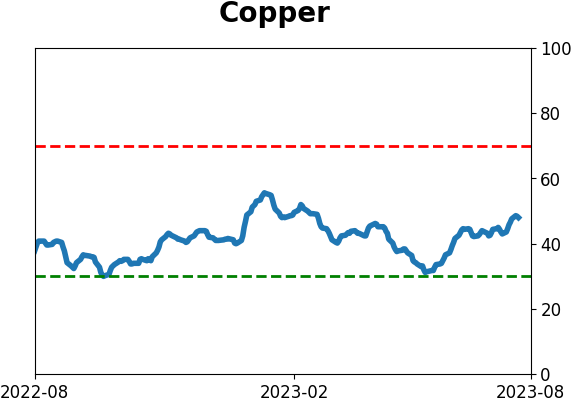
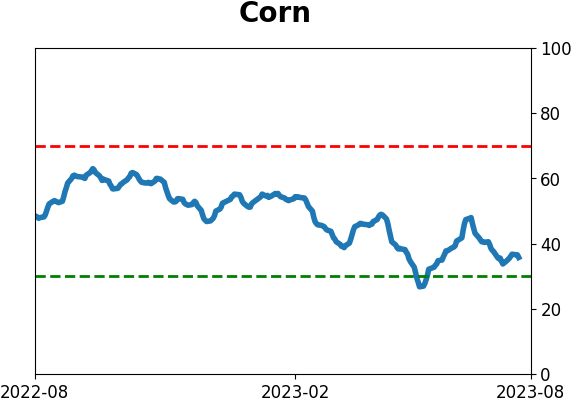
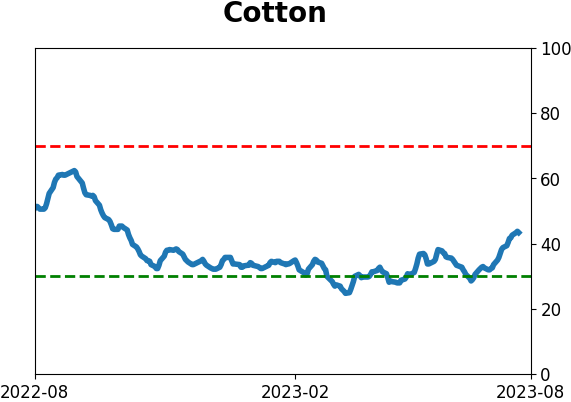
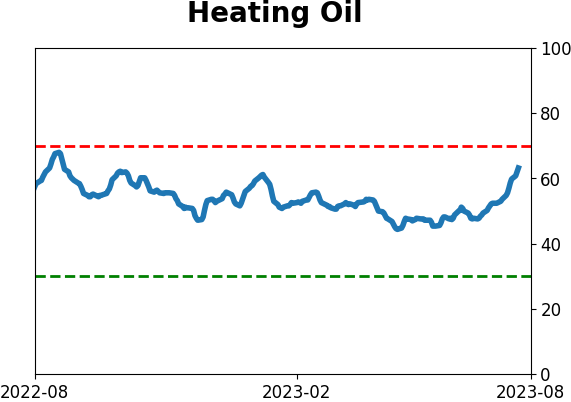
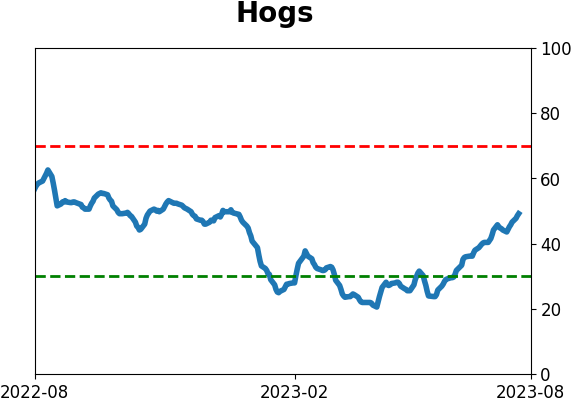
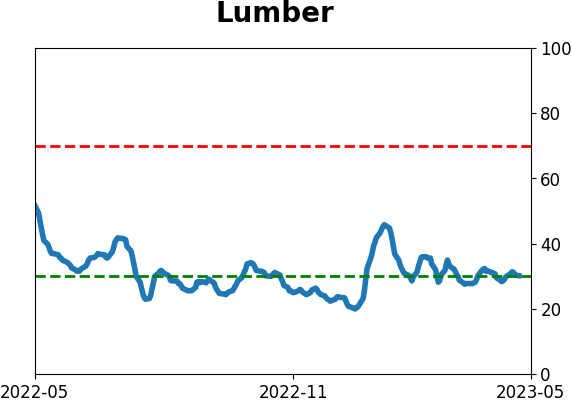
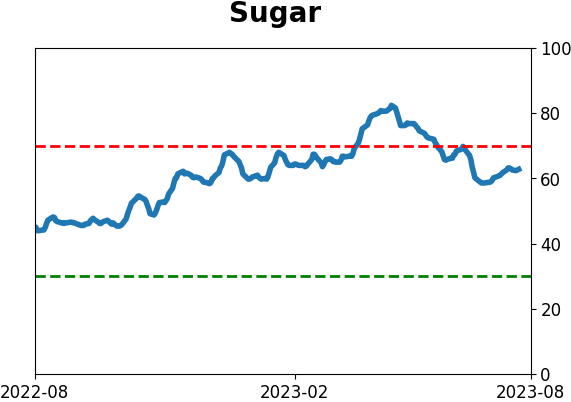
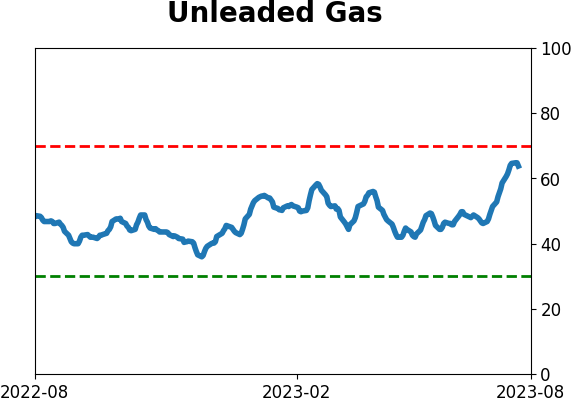
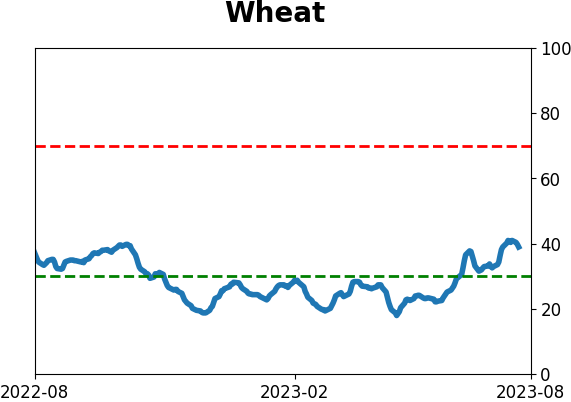
Agriculture

|
|
Research
By Jason Goepfert
BOTTOM LINE
The Health Care sector has underperformed the broad market by a historic degree in 2023, and some indicators suggest that could continue. Seasonality for the sector is entering is worst stretch, participation is showing negative divergences, there are signs of complacency, and insiders aren't buying.
FORECAST / TIMEFRAME
None
|
Key points:
- Health Care is entering what has been its worst seasonal stretch
- Other indicators are showing poor participation and some investor complacency
- Smart money corporate insiders haven't been aggressive in accumulating their shares
Health Care tends to struggle at summer's end
Earlier, we saw that the Health Care sector has underperformed the broader S&P 500 by one of the widest differentials in history. Similar behavior, and some internal indicators, suggest that underperformance may continue.
While it's not a primary consideration, seasonality for the sector is about to enter its worst stretch. August and September for the XLV fund have not been particularly kind.
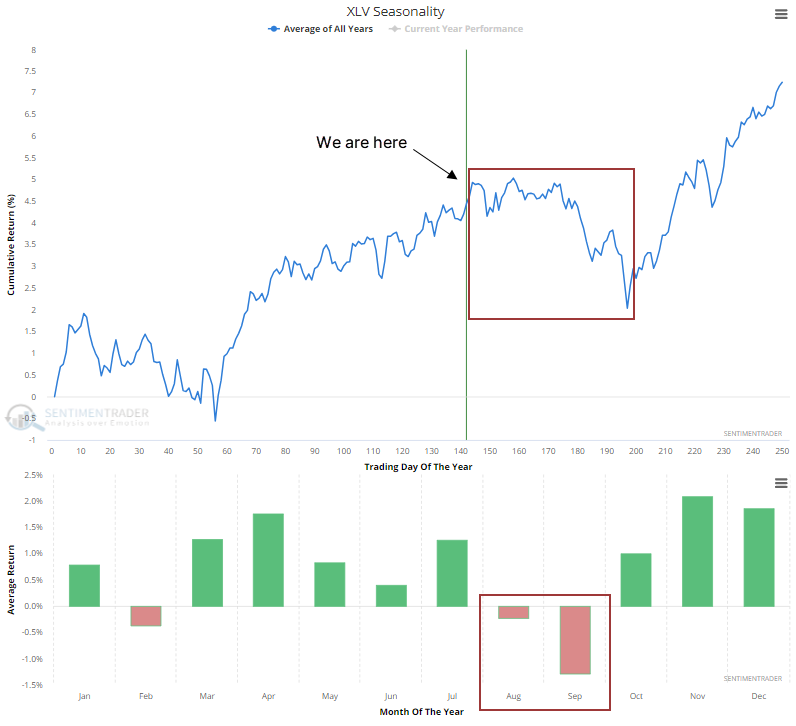
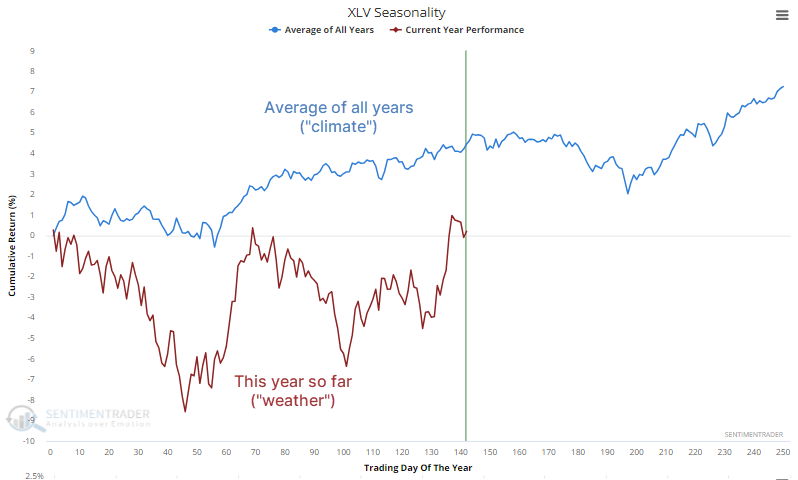
We always suggest taking seasonality with a grain of salt because averages can greatly mask performance during any given year. As Jay is fond of saying, it's climate and not weather. For what it's worth, the weather has followed the climate very well in 2023.
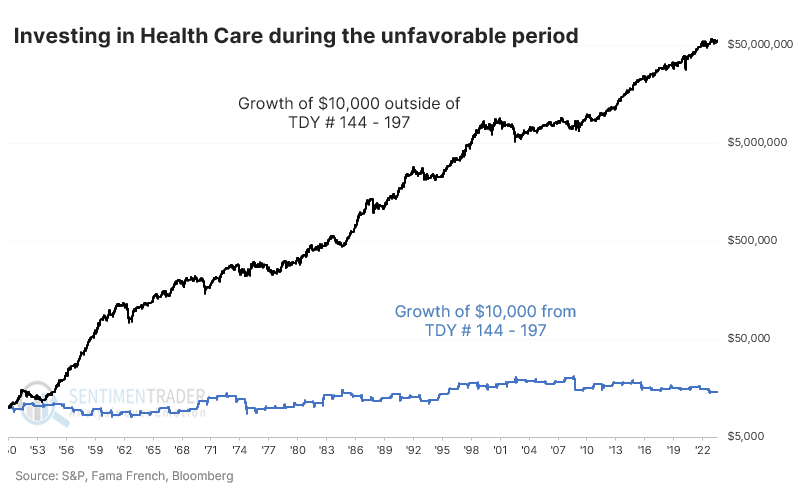
Taking a page out of Jay's playbook, the chart below shows the growth of $10,000 if invested in Health Care only from Trading Day of the Year (TDY) #144 through #197 (blue line) versus the growth of investing in the sector outside of that seasonal window (black line). On a regular scale, the blue line doesn't even show up.
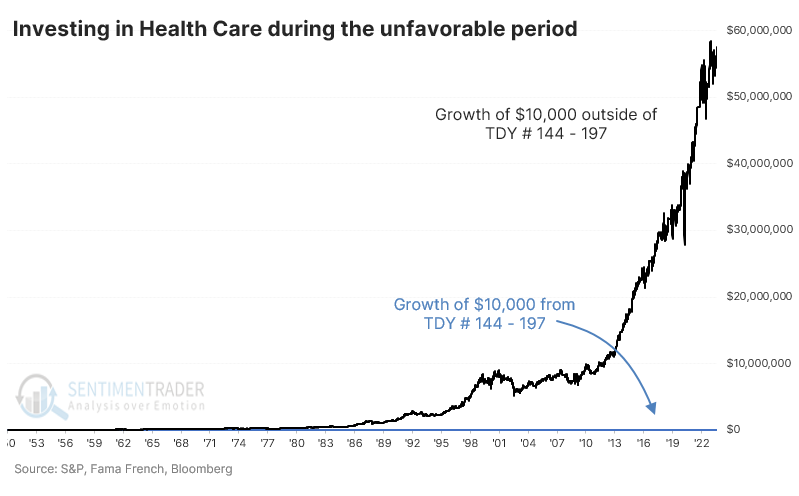
On a log scale, we can see that since 1950, investing during the weak seasonal window treaded water while the sector consistently made headway during the rest of the year. The "other" window should vastly outperform because it encompasses many more trading days, but one didn't miss much by staying out during the roughly 50-day seasonally weak periods.
Some technical worries
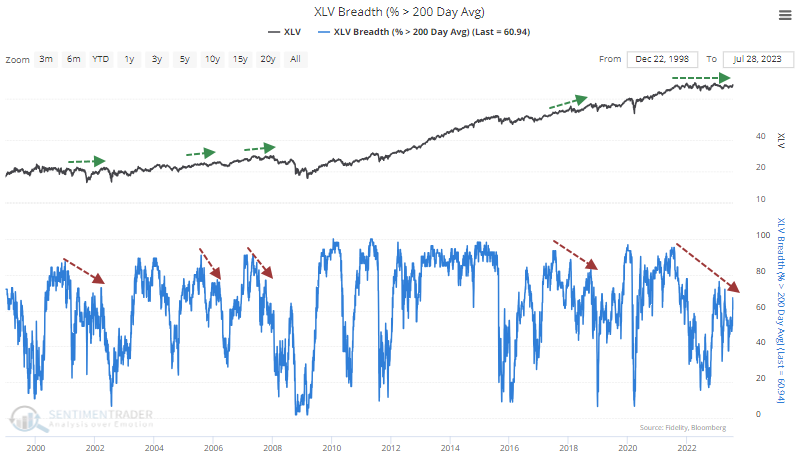
Even though the XLV fund has been making some headway, the percentage of stocks in the sector in long-term uptrends hasn't broken out. There is a divergence in the percentage of stocks in the sector that have managed to hold above their 200-day moving averages. While the index has climbed, fewer members have held above their average.
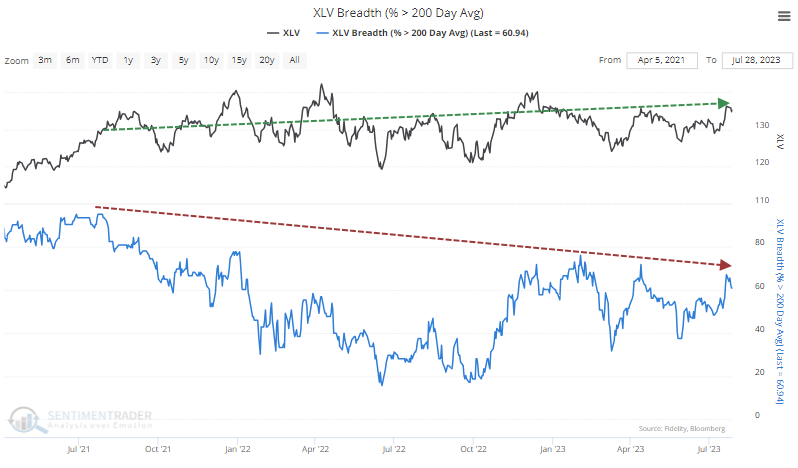
Divergences are tricky things and tend to flash false signals. Still, some of the more memorable declines in the sector were preceded by falling participation.
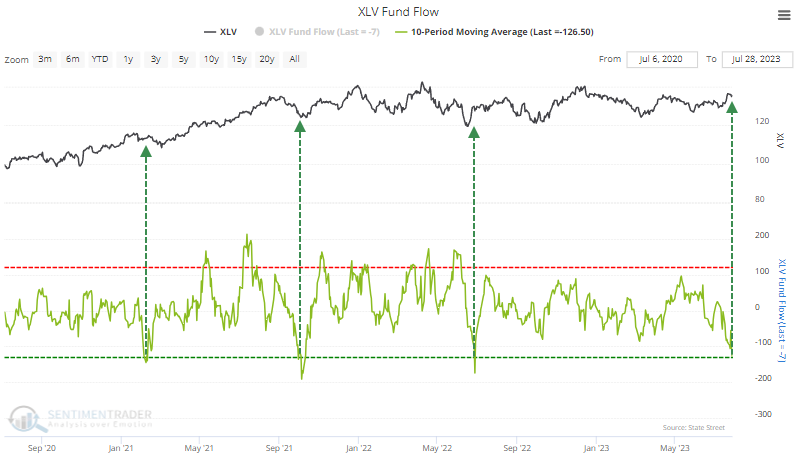
Investors have given up, with XLV suffering an outflow of more than $125 million per day over the past month. This could be considered a contrarian bullish sign...as long as investors are willing to return. The average outflow over the past two weeks is heavy enough that it compares with other oversold conditions and bottoms in XLV,
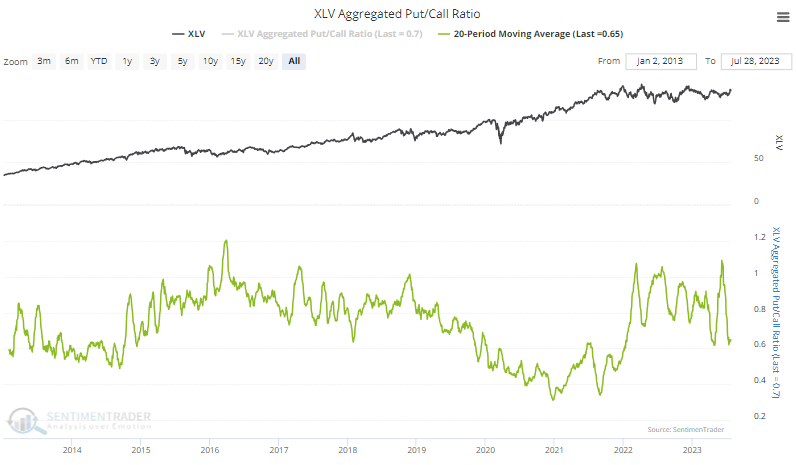
After spiking to one of the highest levels in over a decade earlier this year, the put/call ratio of members in the sector has dropped dramatically and is hovering near the lowest level in over a year. Low put/call ratios can lead to below-average returns, but the 2020-21 option frenzy threw a wrench into many options-related measures.
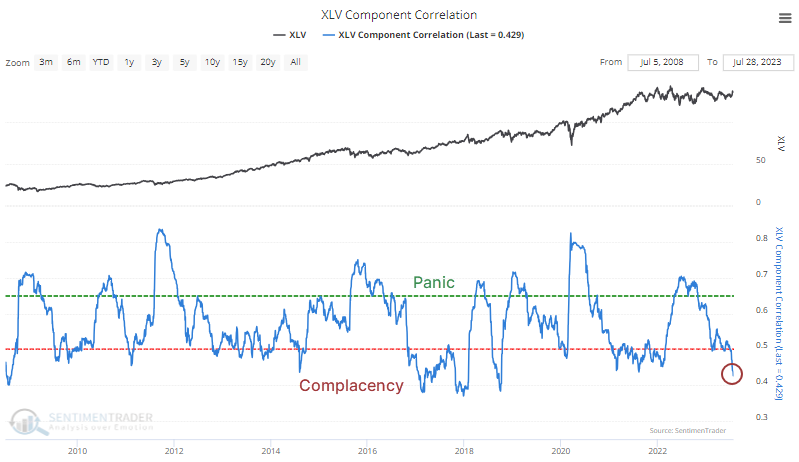
The correlation among stocks in the sector has plunged, suggesting investor confidence in stock picking. Correlations tend to increase when investors panic, as they buy and sell everything together regardless of individual merits. When correlations decrease, investors are more comfortable considering each stock's potential, with less concern for broad declines. The correlations have recently declined to the lowest since October 2018 as the sector peaked.
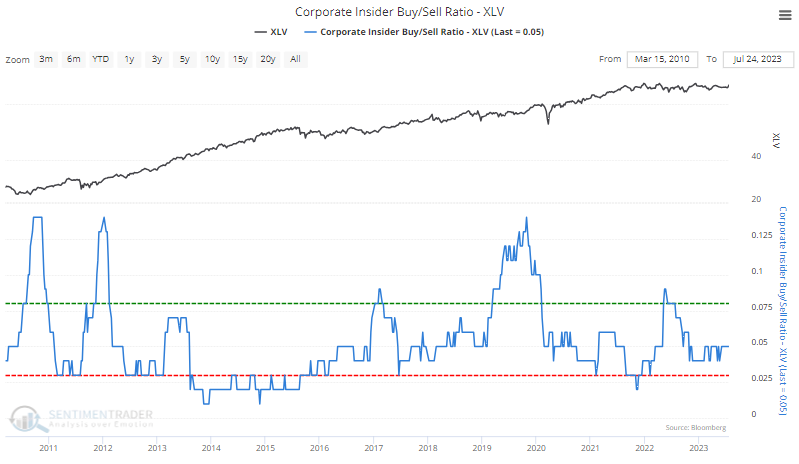
Corporate insiders have not been eager to buy as the Buy/Sell Ratio remains stuck near the lower end of its historical range. A spike in buying interest tends to be a consistently helpful bullish signal. Spikes in selling pressure are less consistent as a bearish signal but can still be useful. The current level isn't extreme, though for bulls, it would be better to see the smart money more interested in their shares.
What the research tells us...
The Health Care sector has underperformed the broader market to a historic degree this year. In other years when it lagged badly through late July, it tended to keep underperforming. A few indicators suggest selling pressure in the sector is or recently was extreme. Still, most are showing generally weak internal participation, some sense of investor complacency, and a lack of urgent interest from insiders in accumulating their shares. All that adds up to a mediocre outlook at best for these stocks.
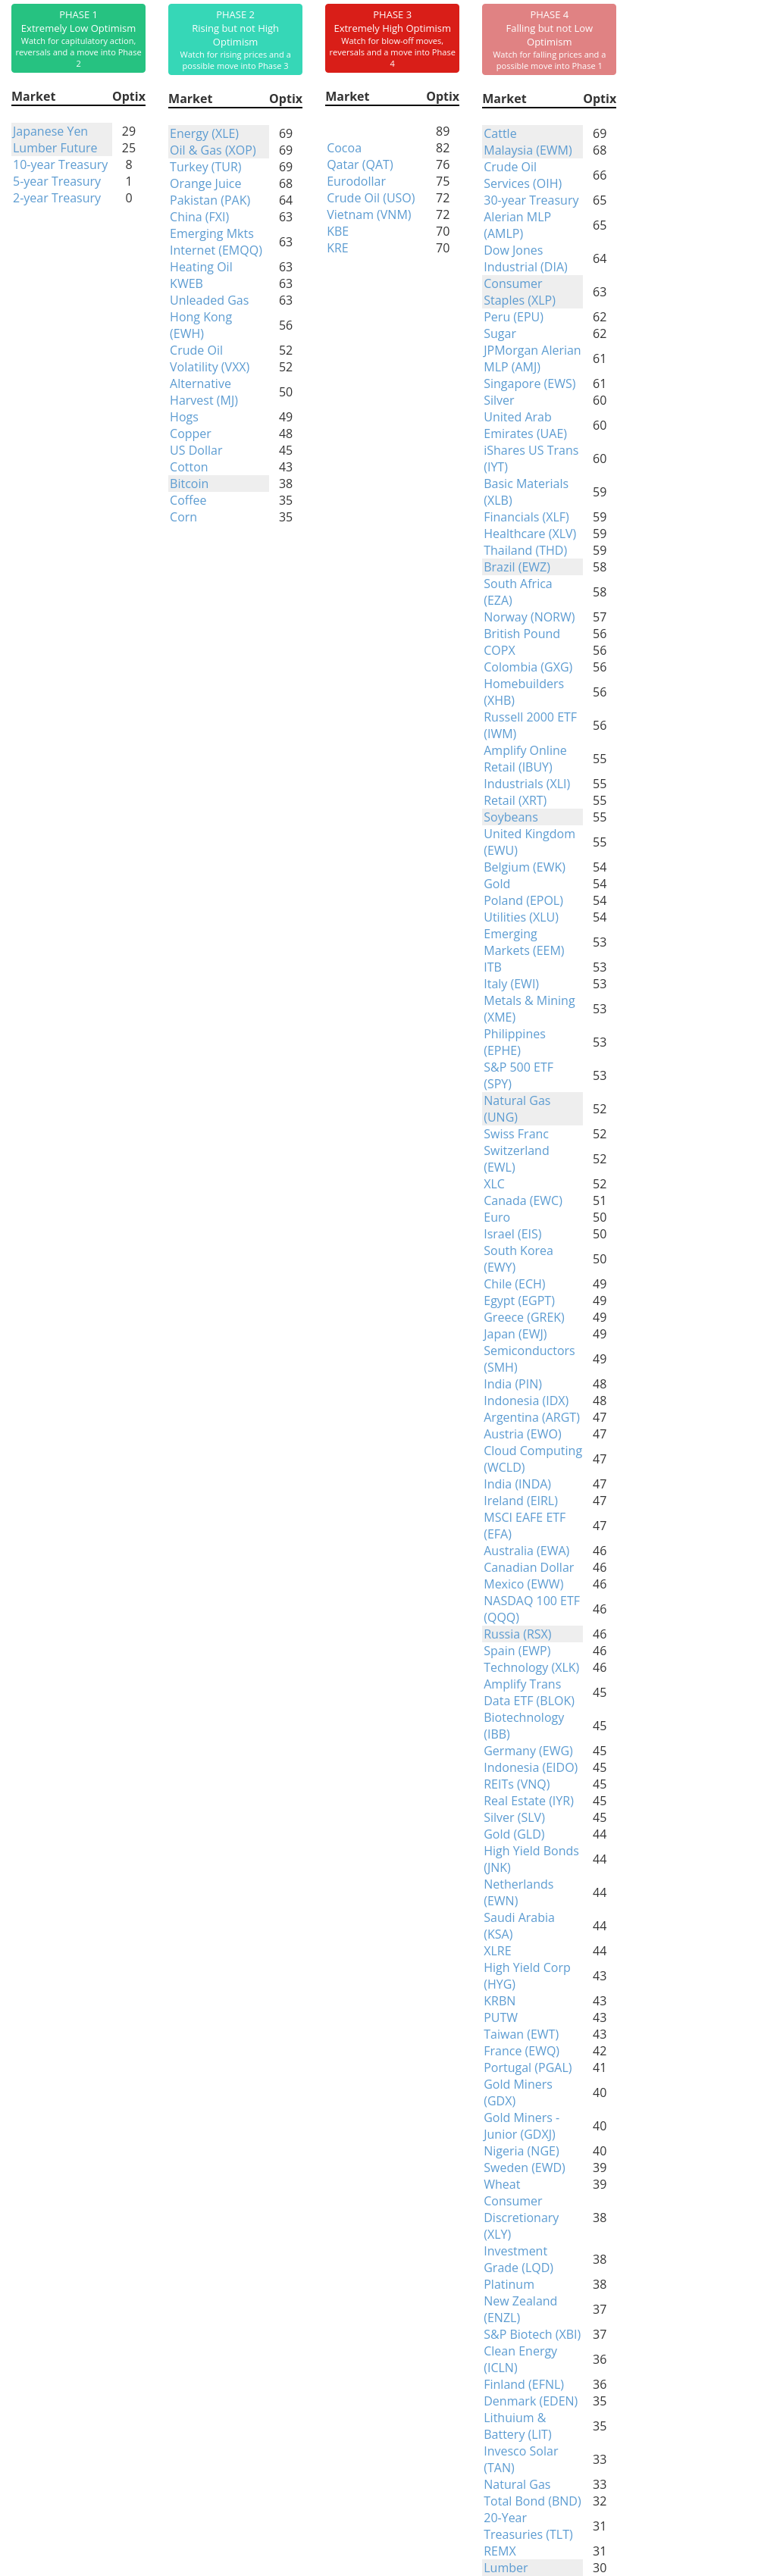
Indicators at Extremes
Phase Table
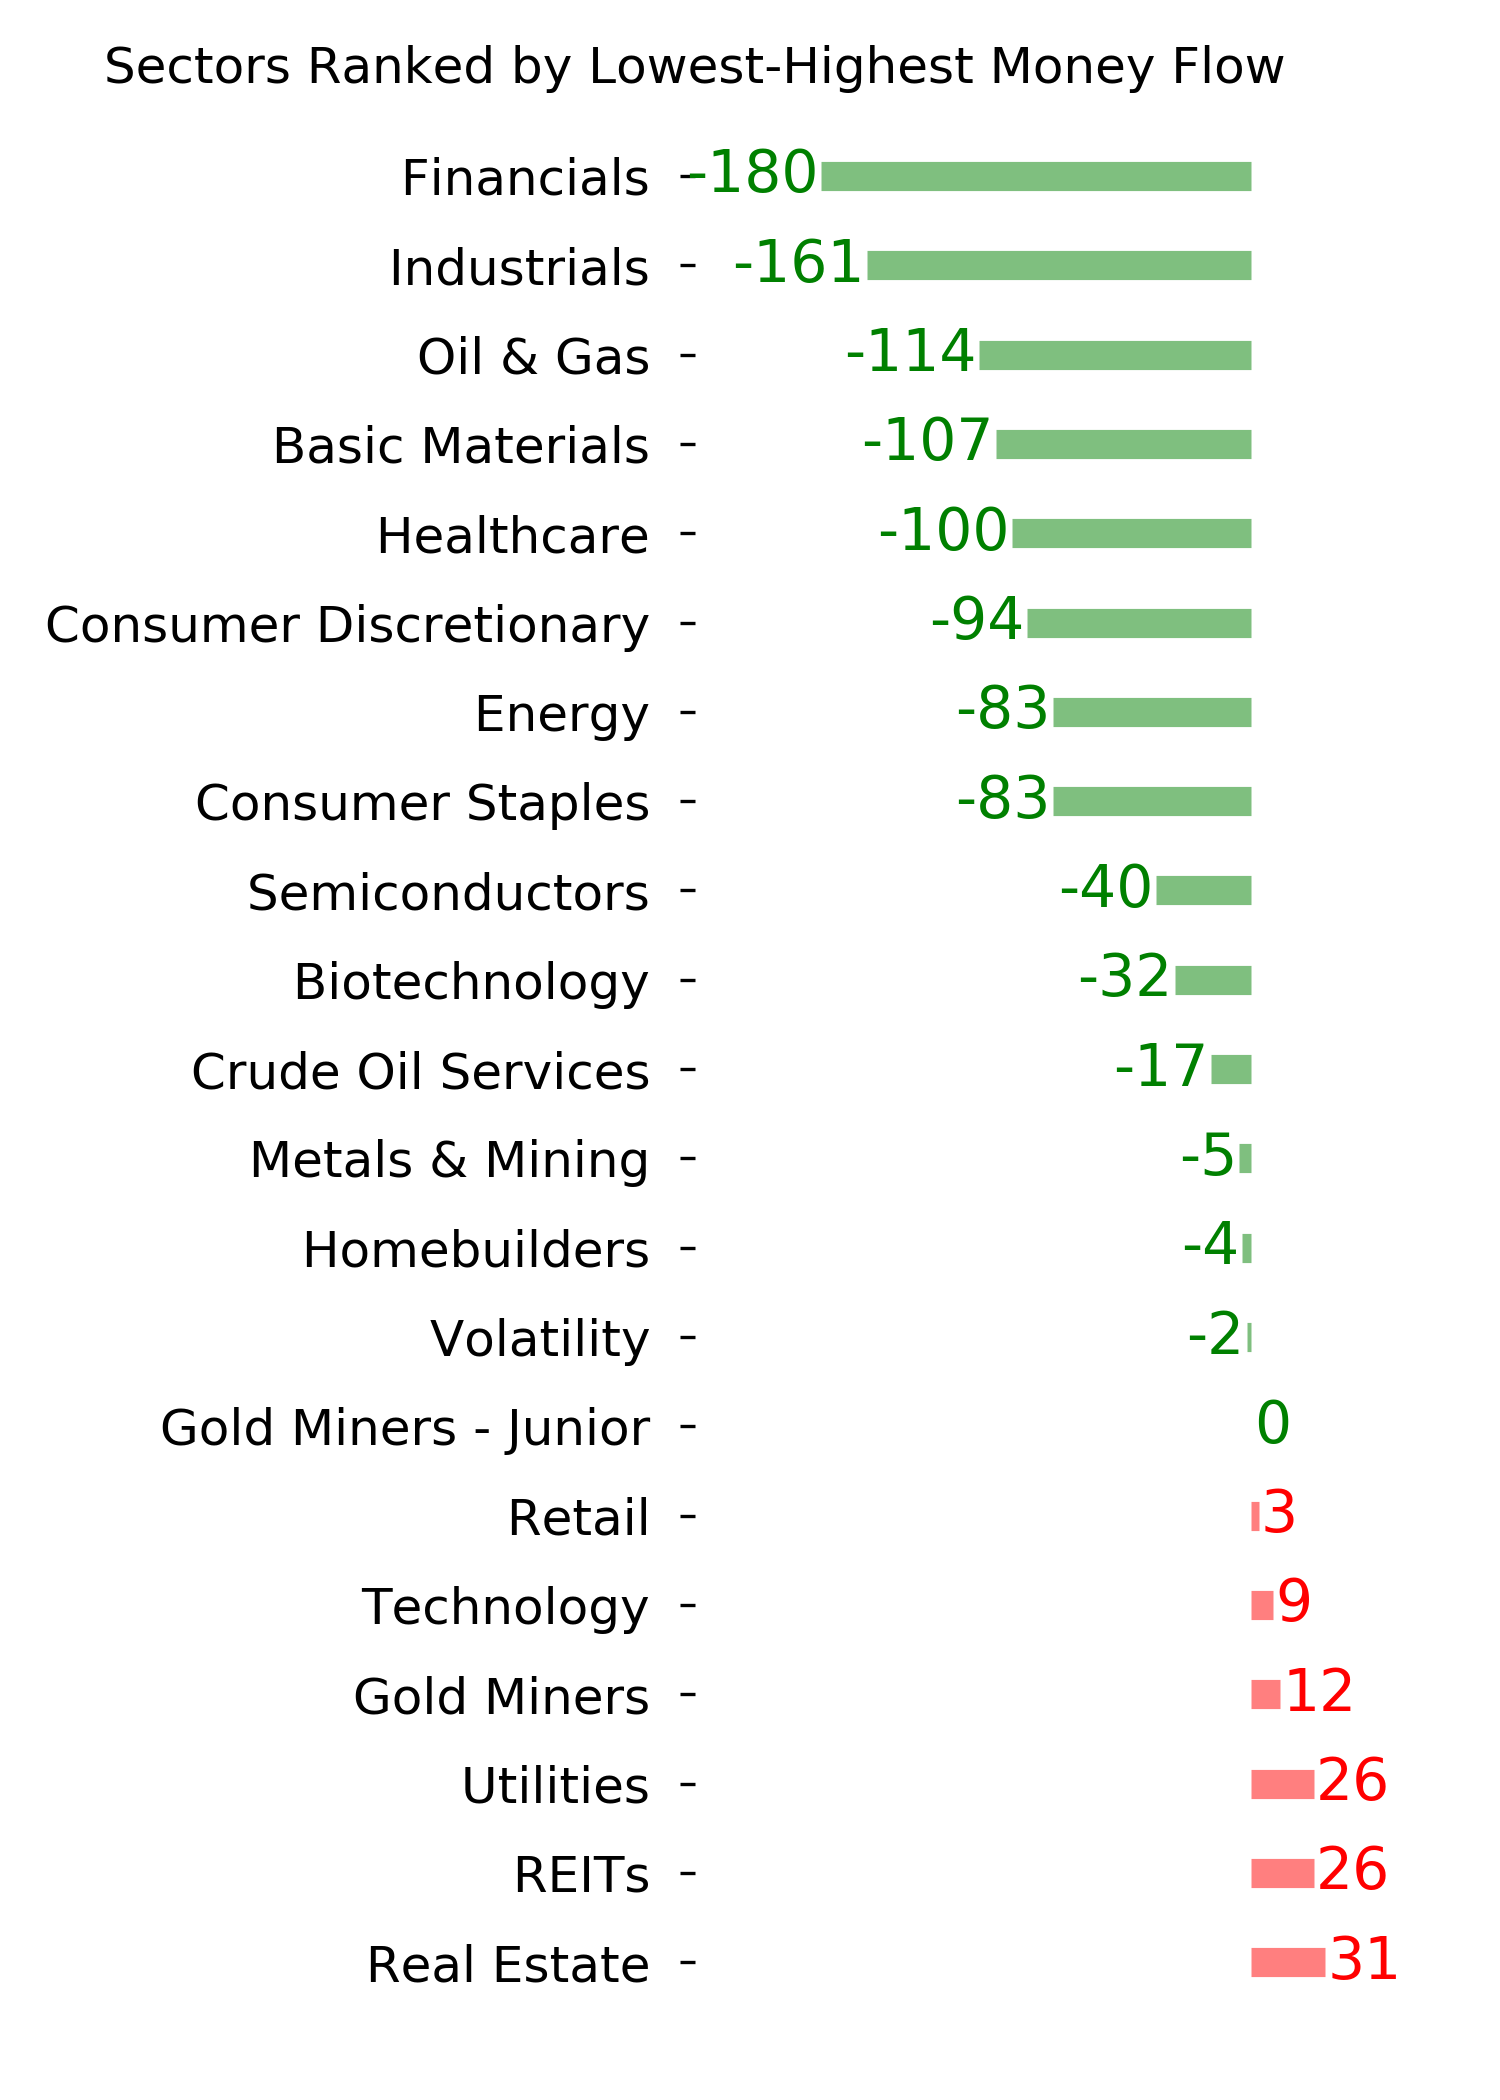
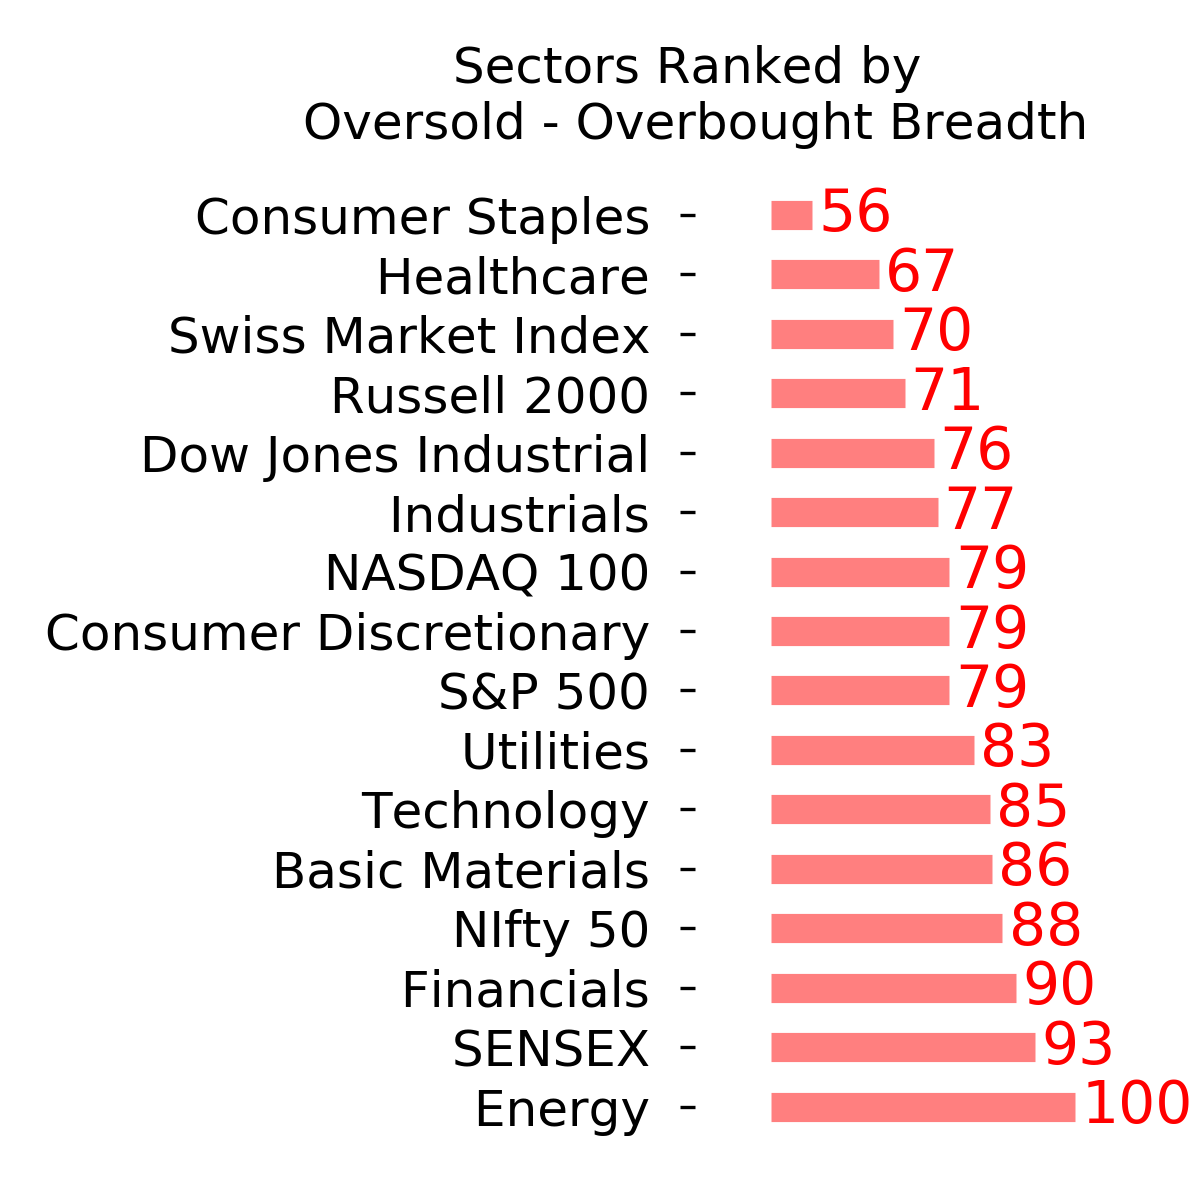
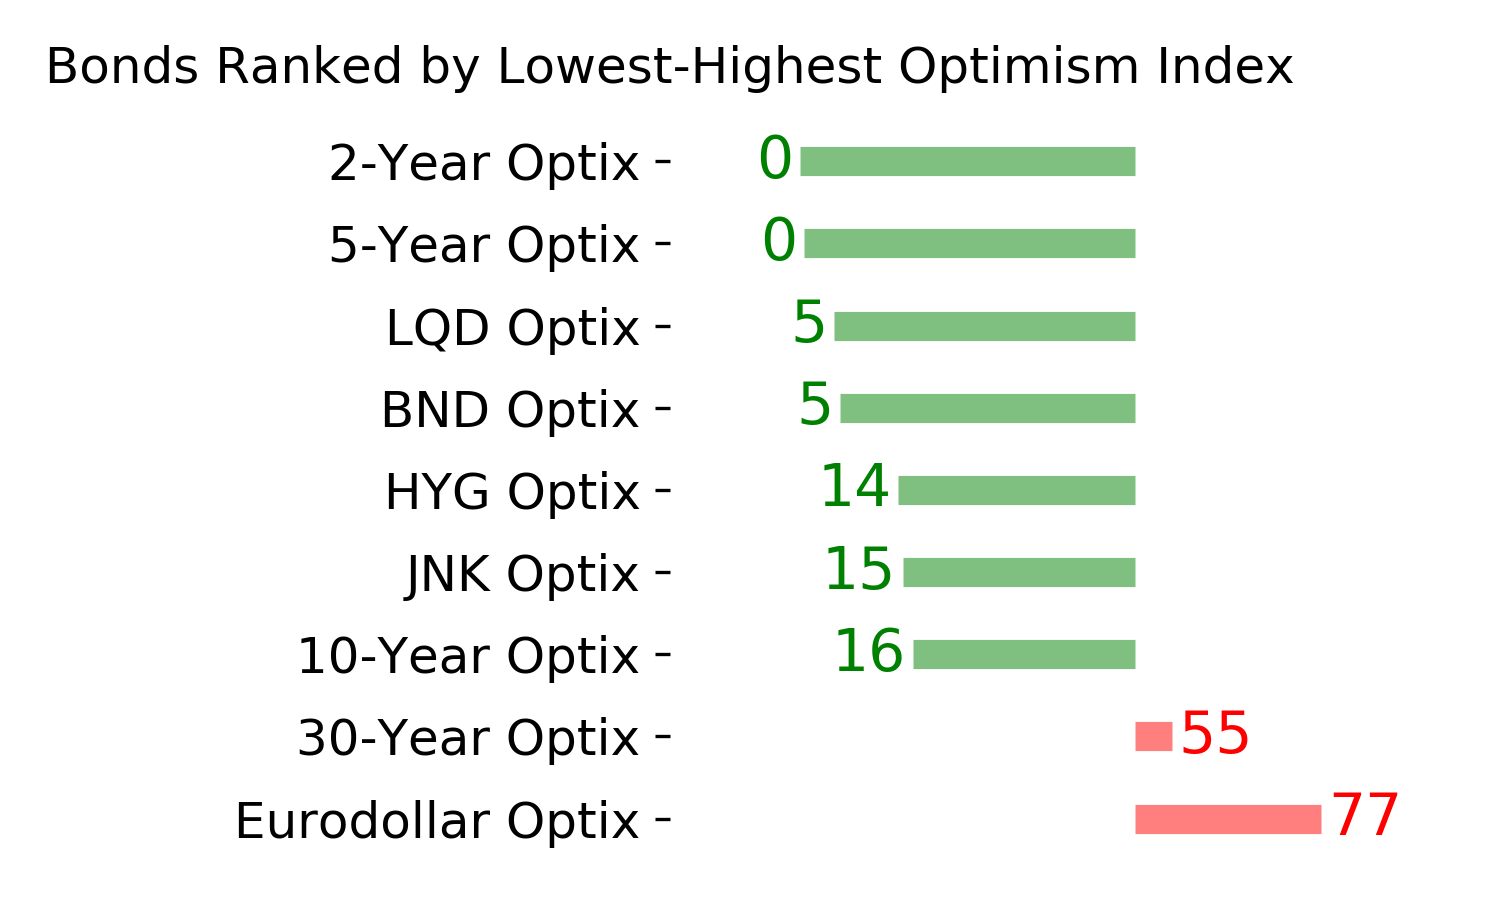
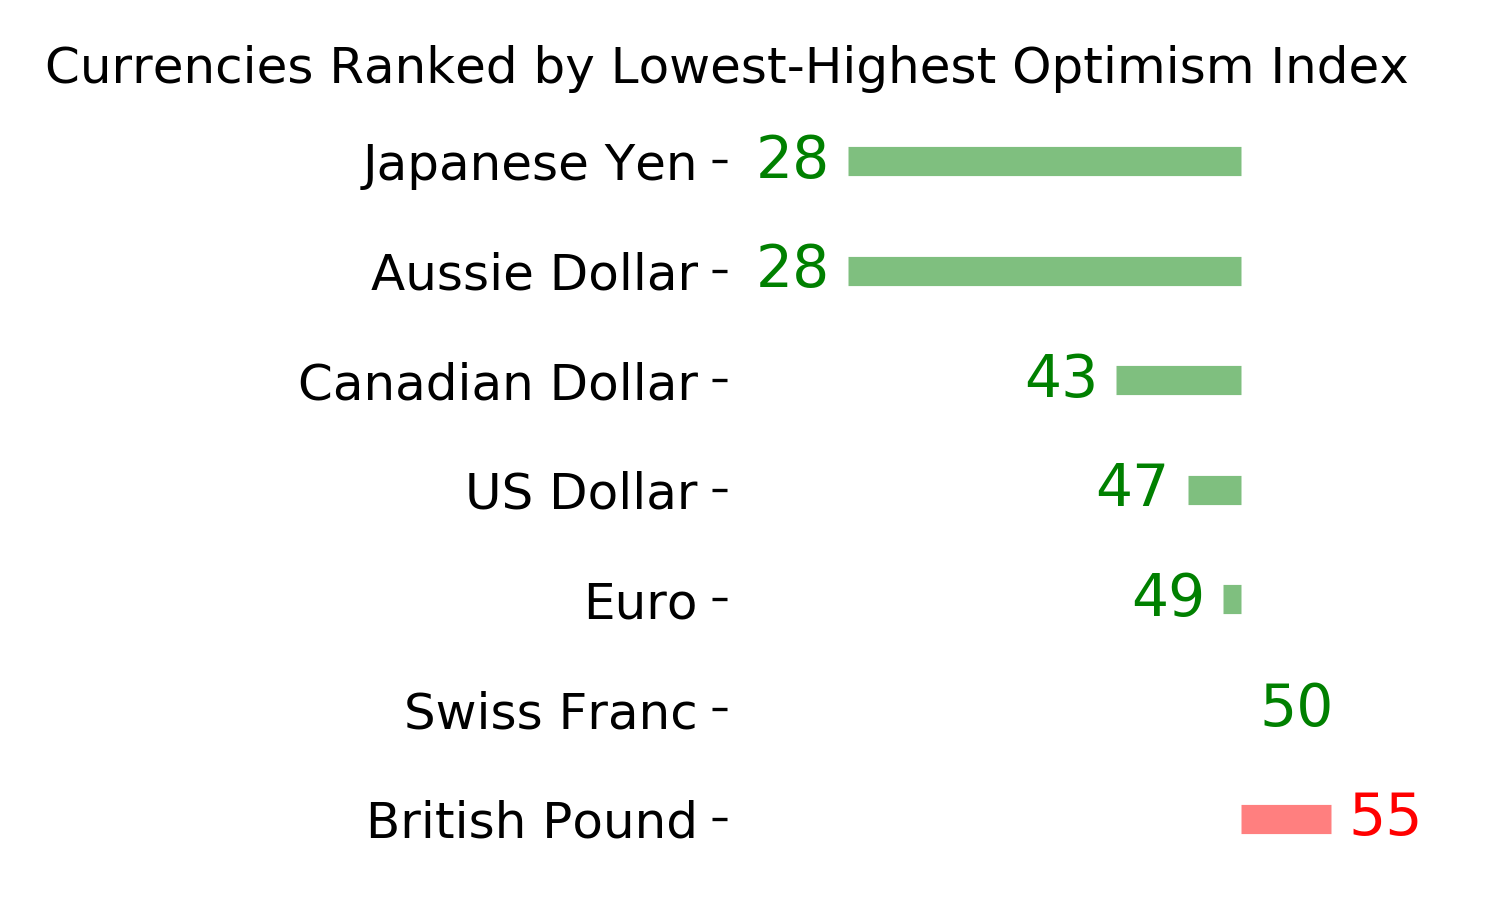
Ranks
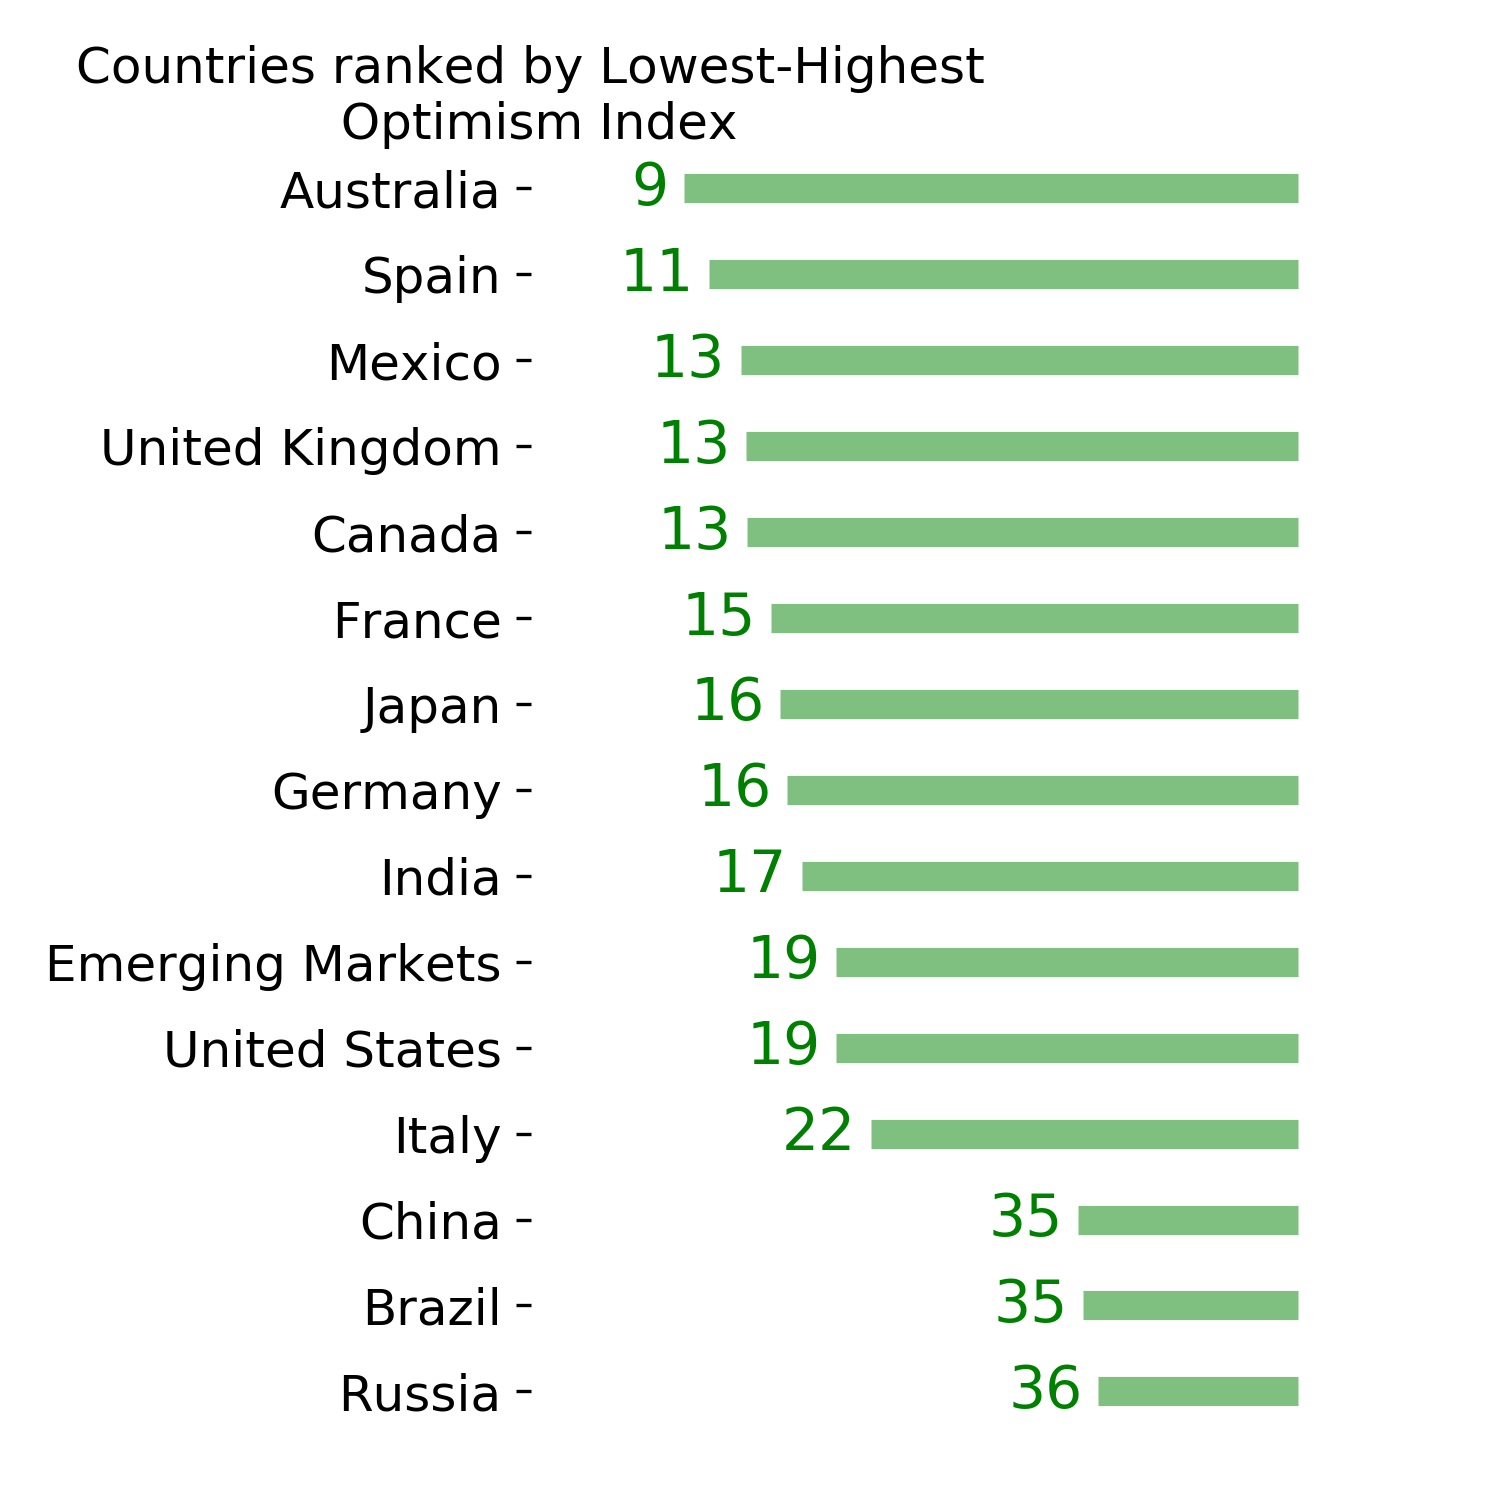
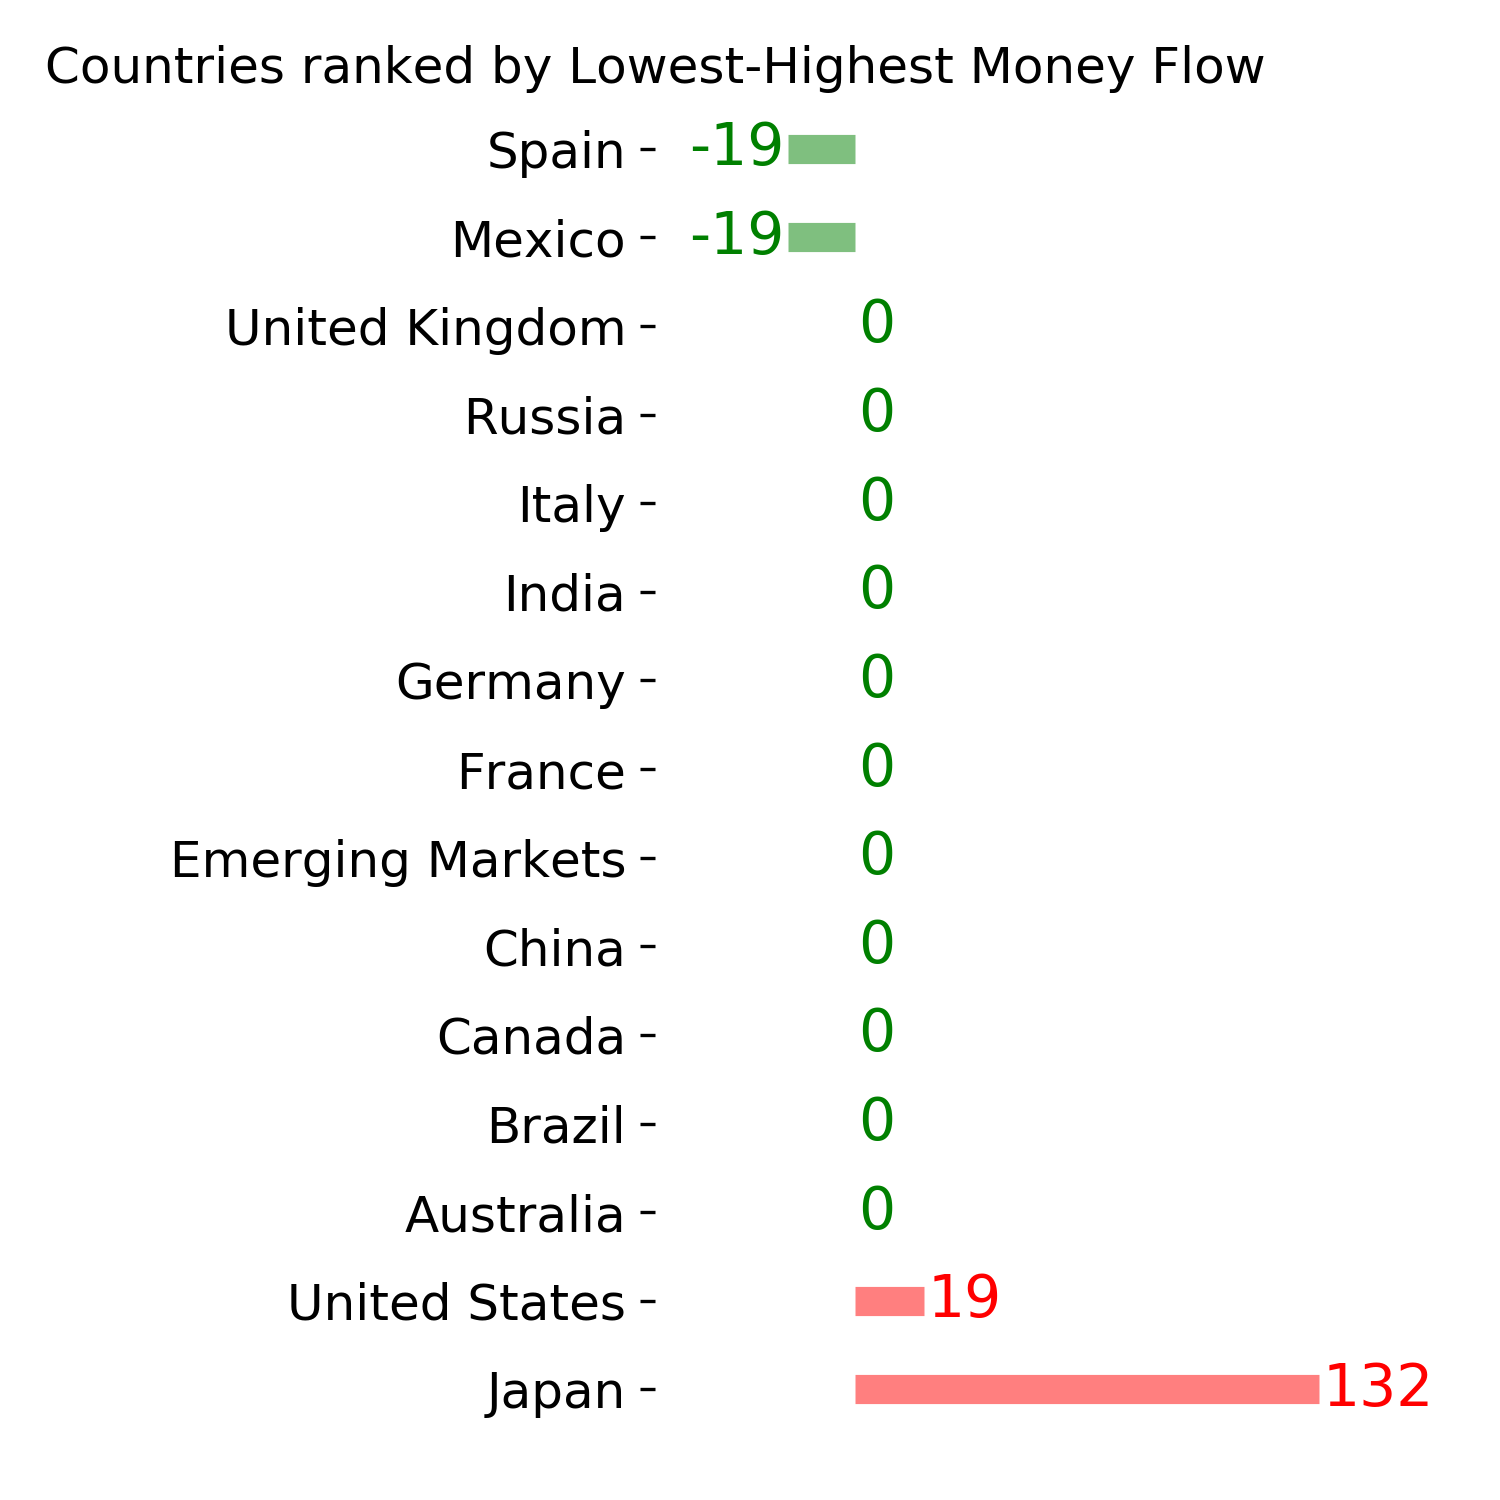
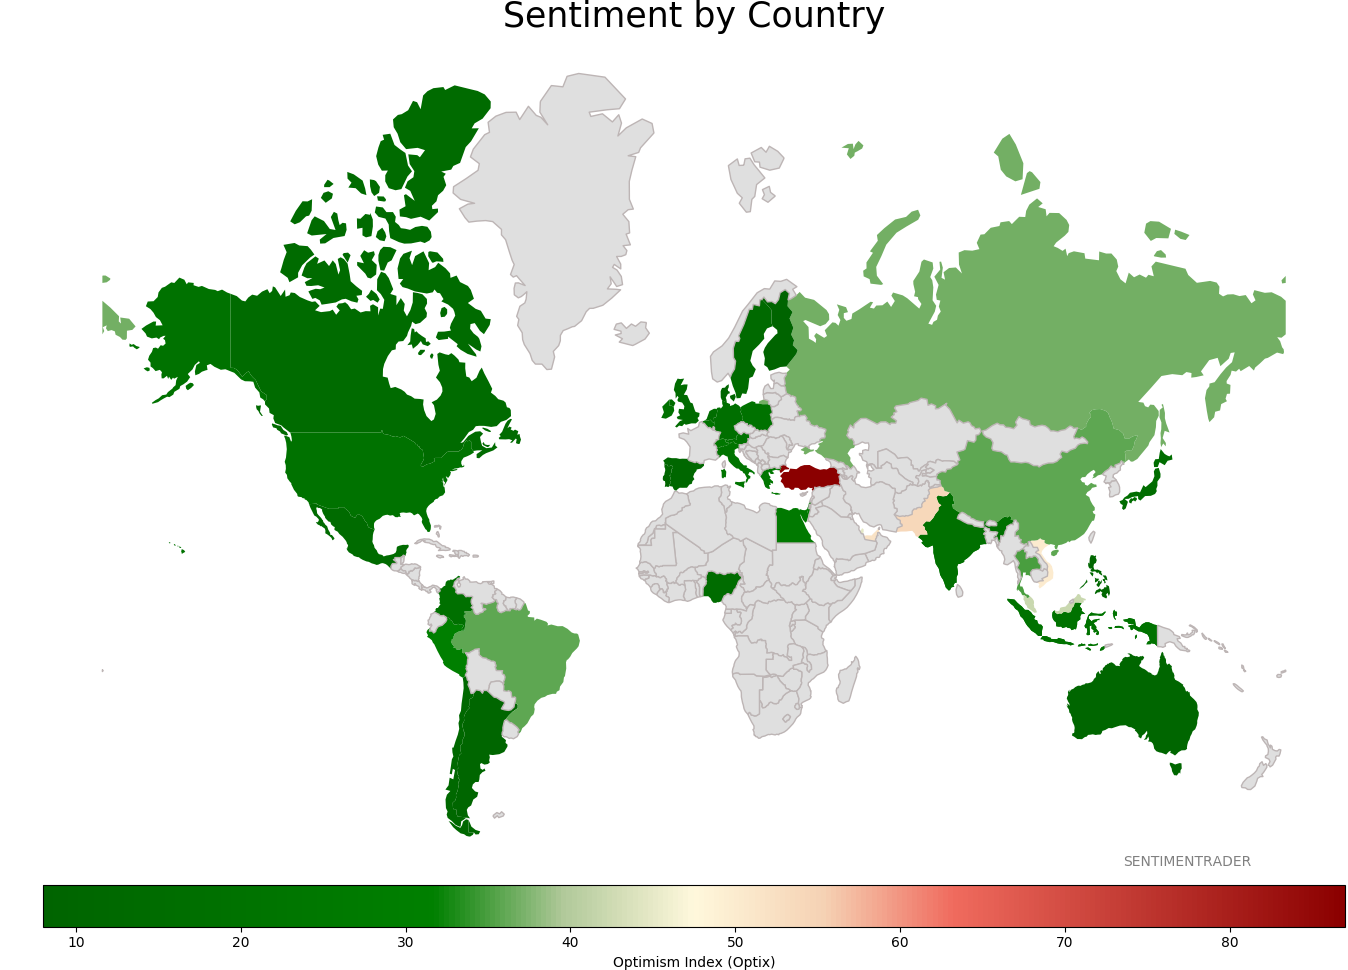
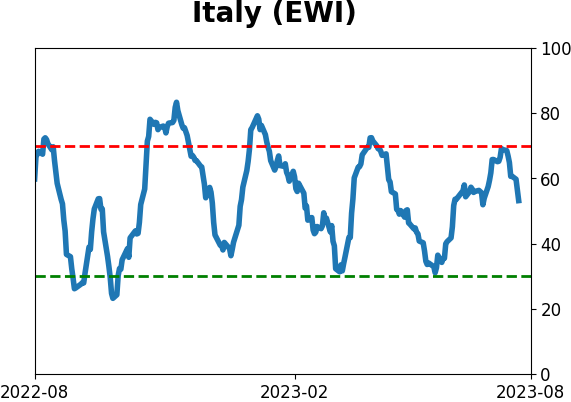
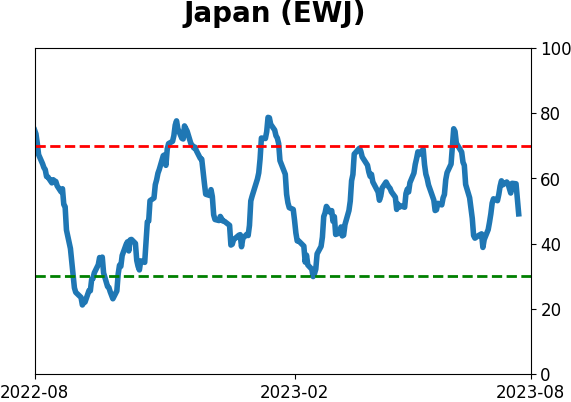
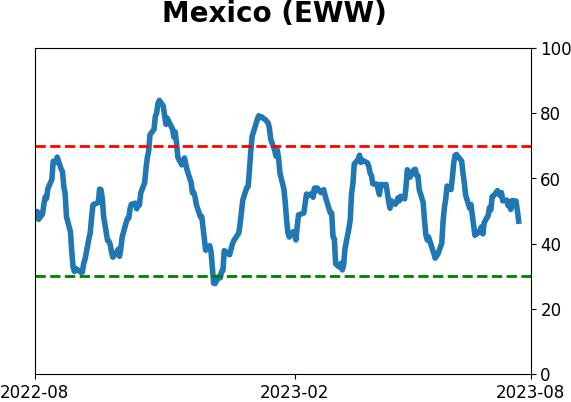
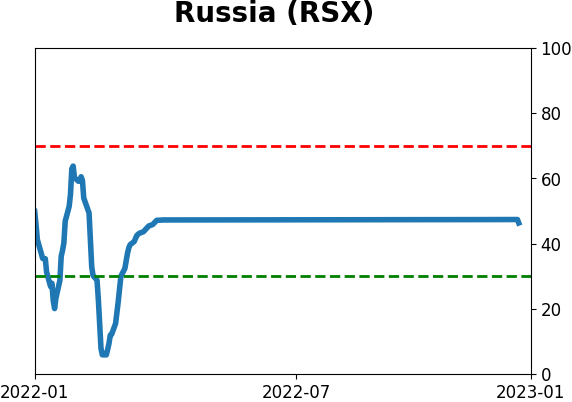
Sentiment Around The World
Optimism Index Thumbnails
|
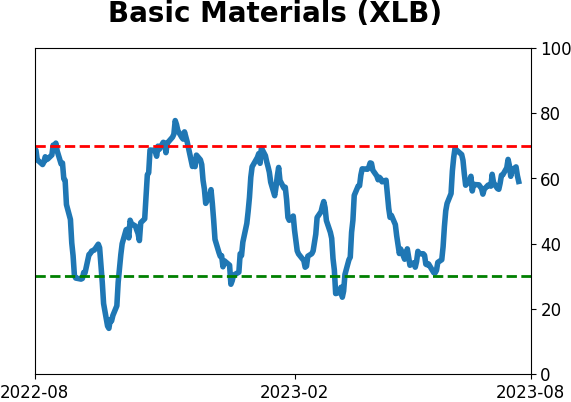
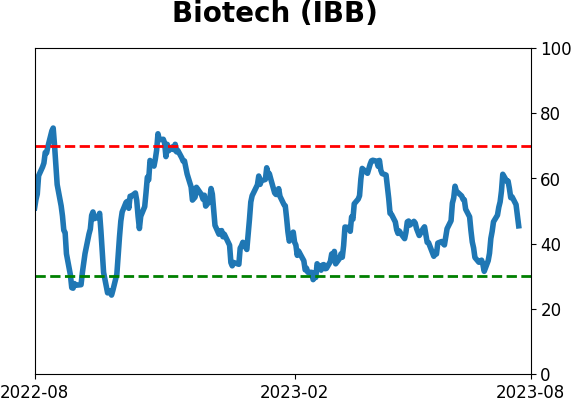
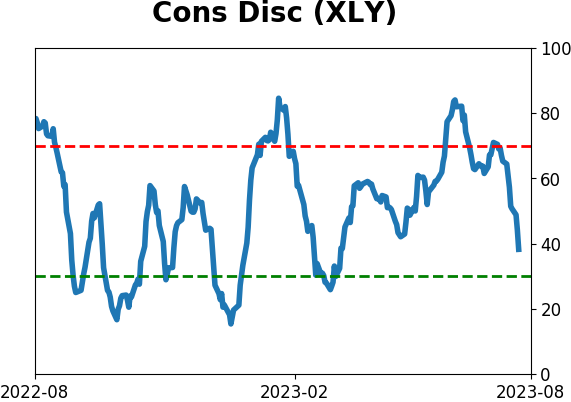
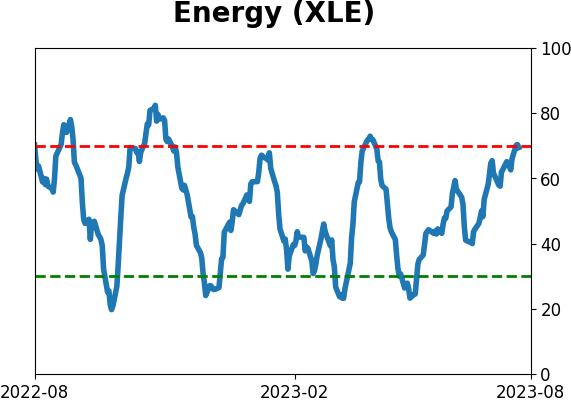
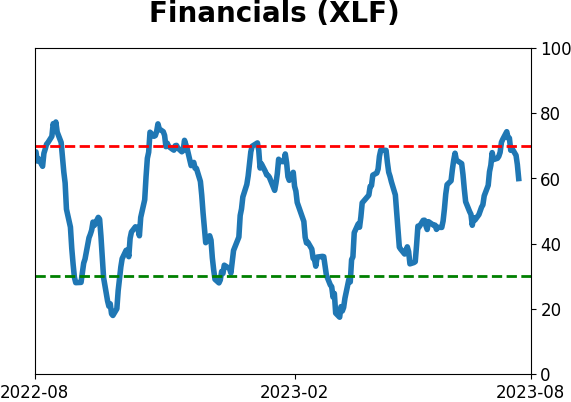
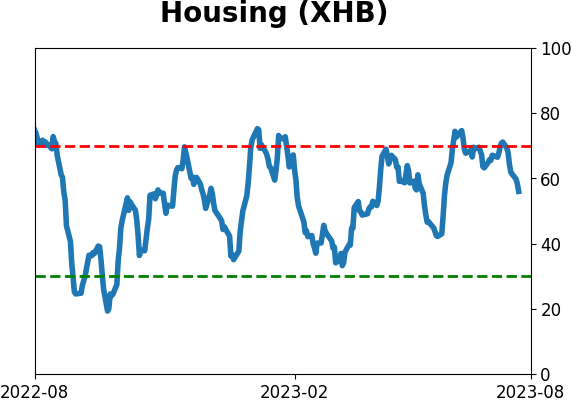
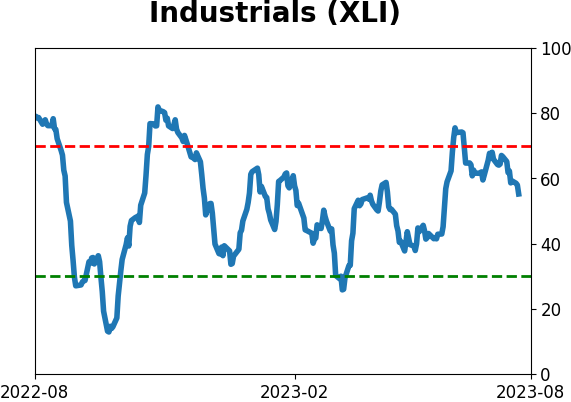
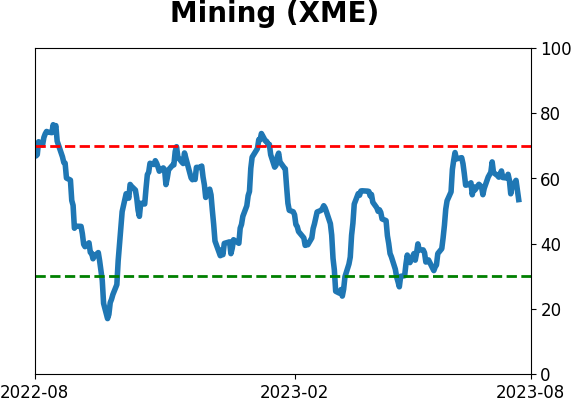
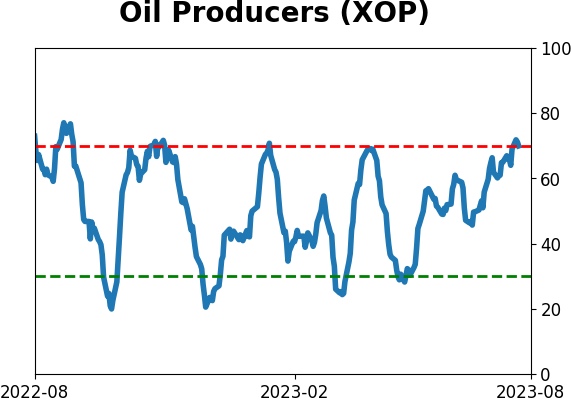
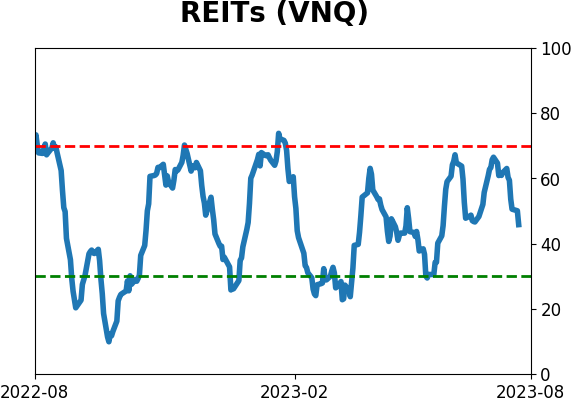
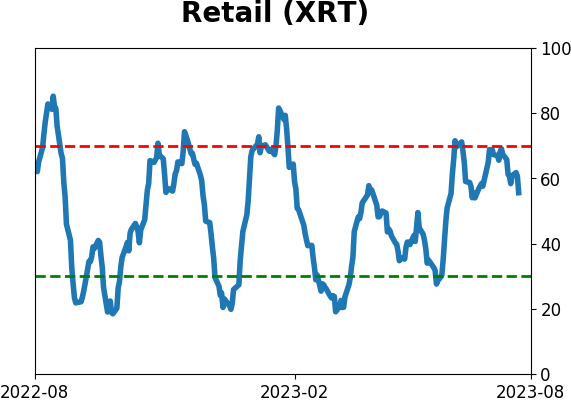
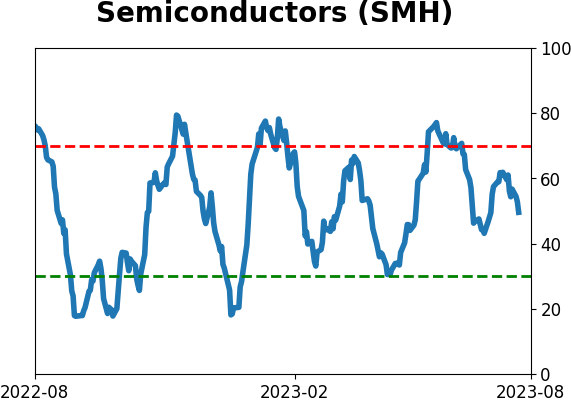
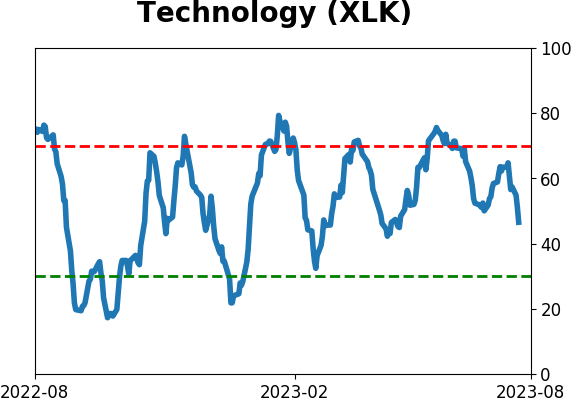
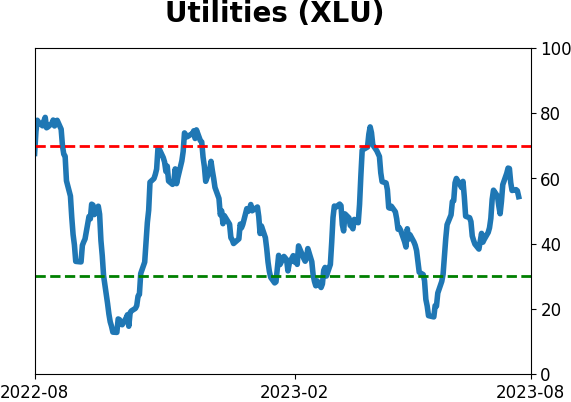
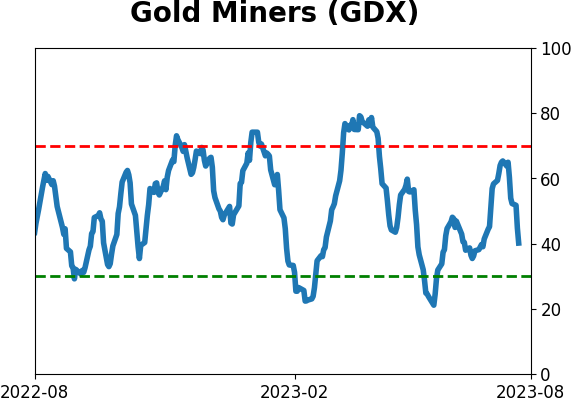
Sector ETF's - 10-Day Moving Average
|
|
|
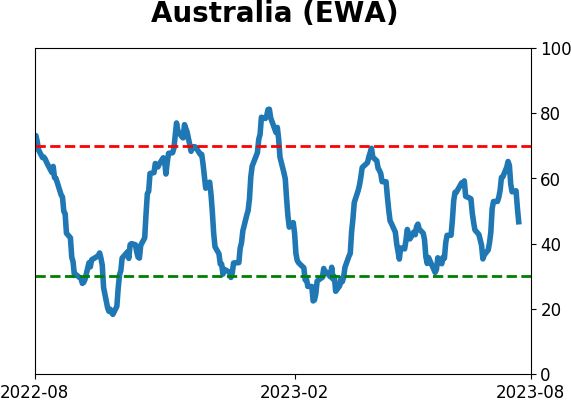
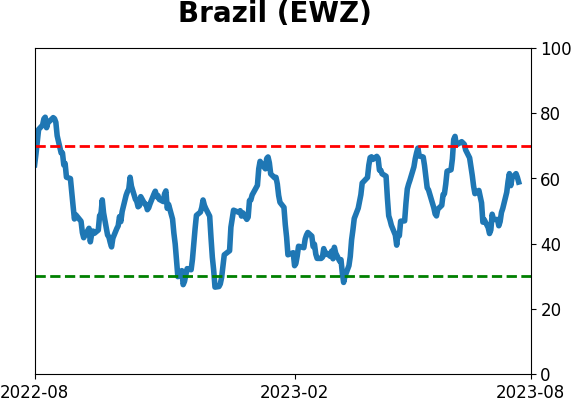
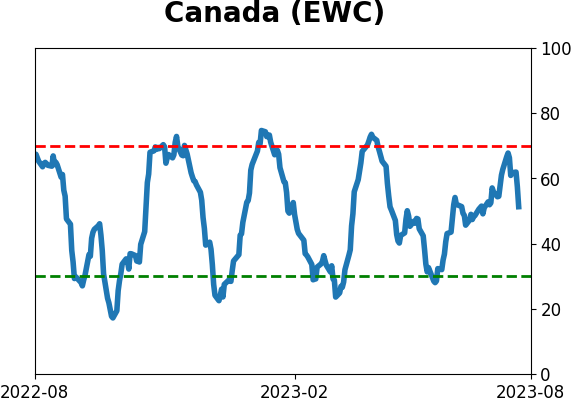
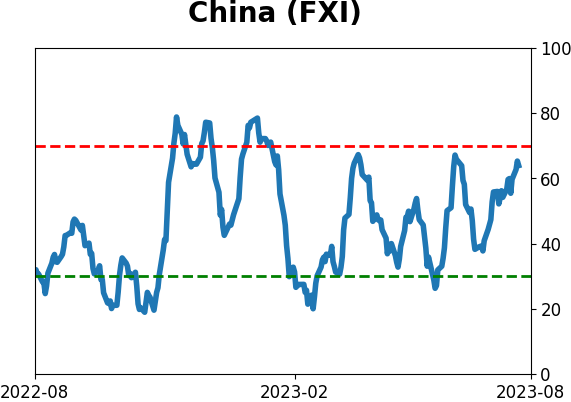
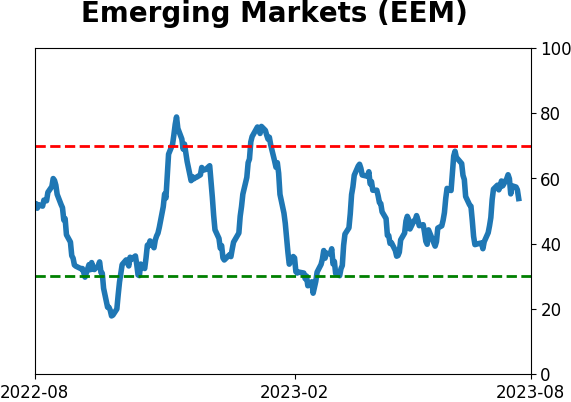
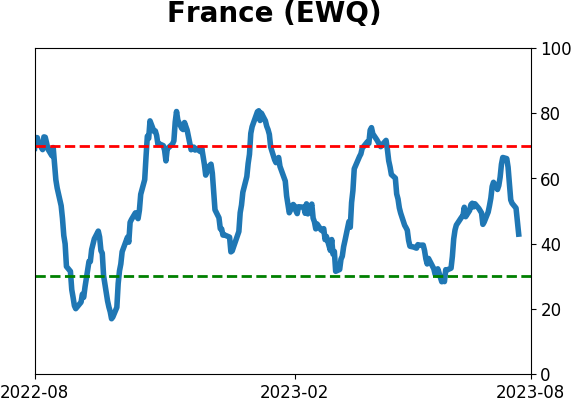
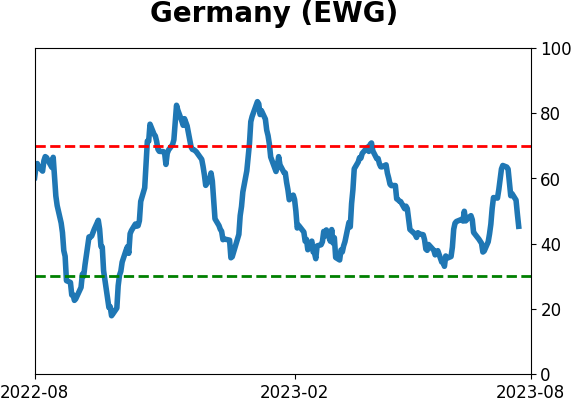
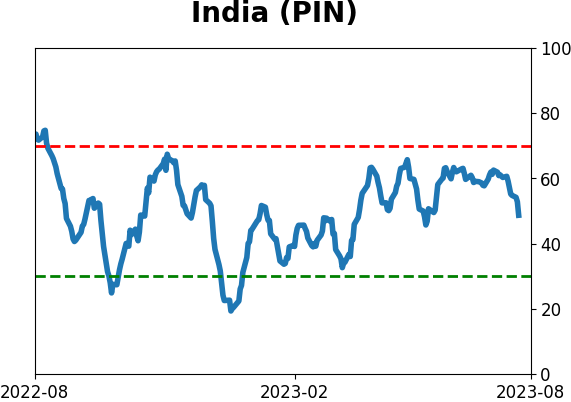
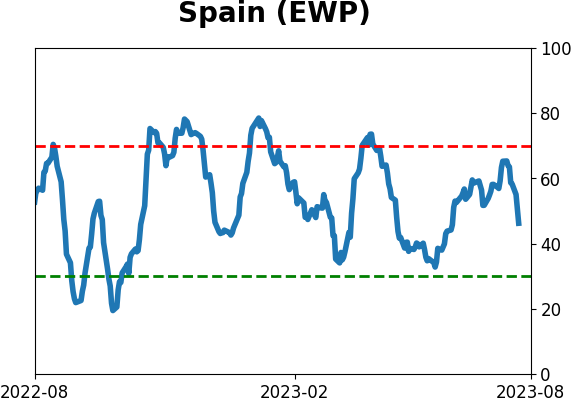
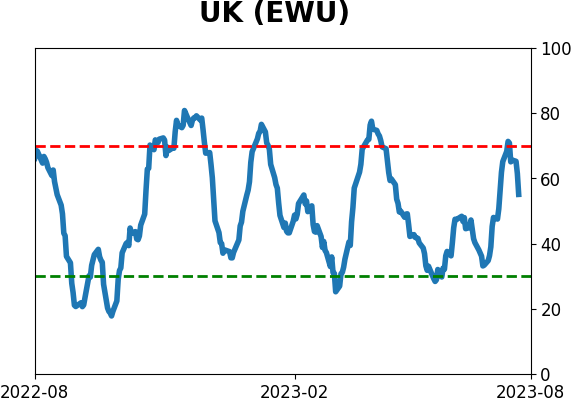
Country ETF's - 10-Day Moving Average
|
|
|
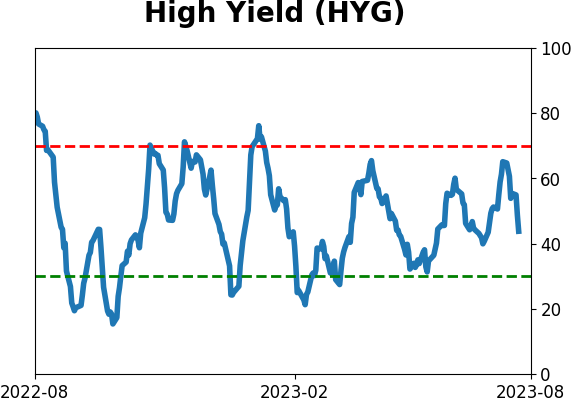
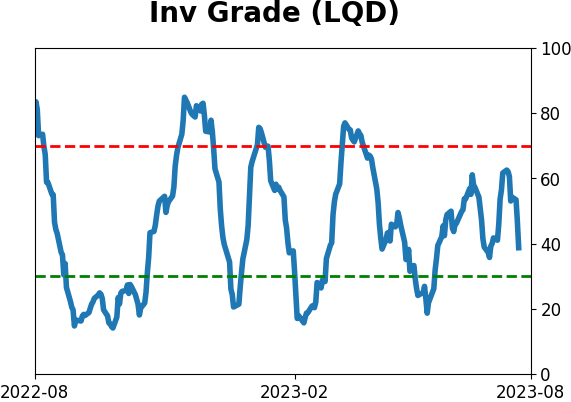
Bond ETF's - 10-Day Moving Average
|
|
|
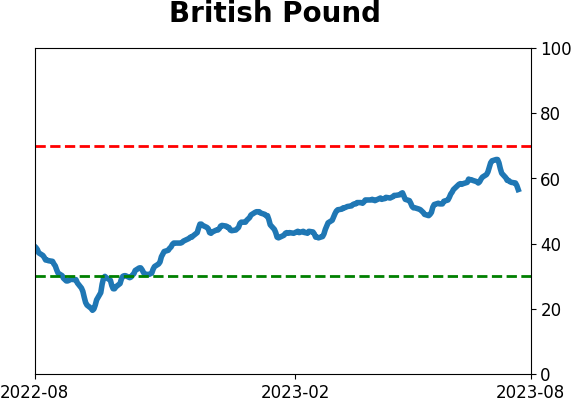
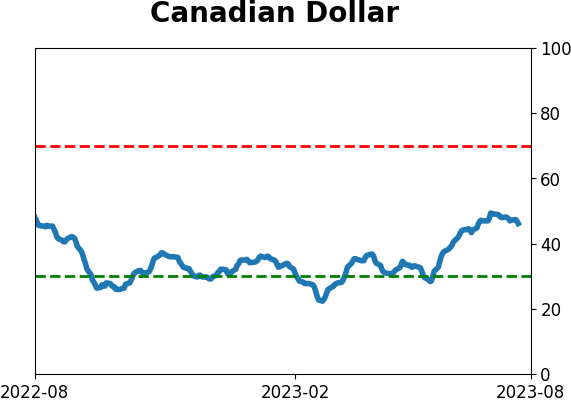
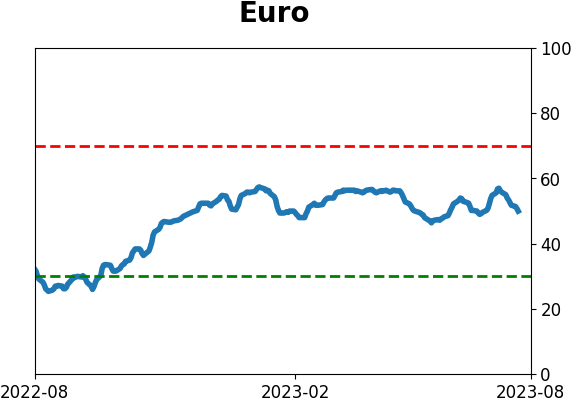
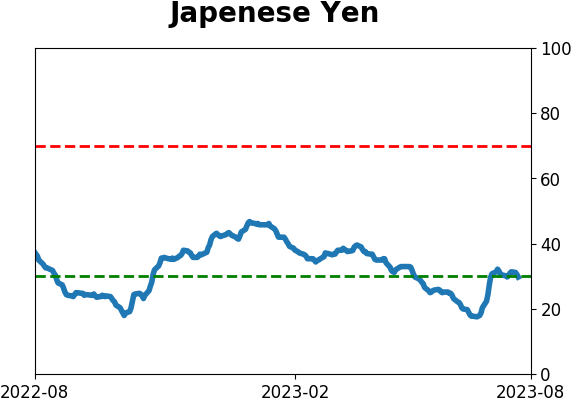
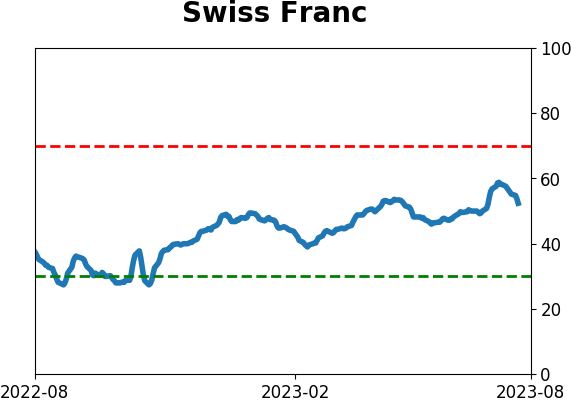
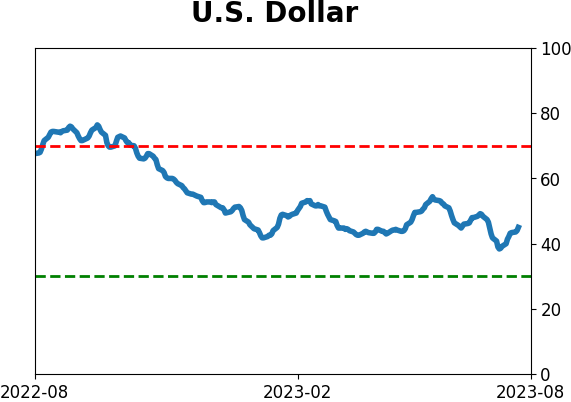
Currency ETF's - 5-Day Moving Average
|
|
|
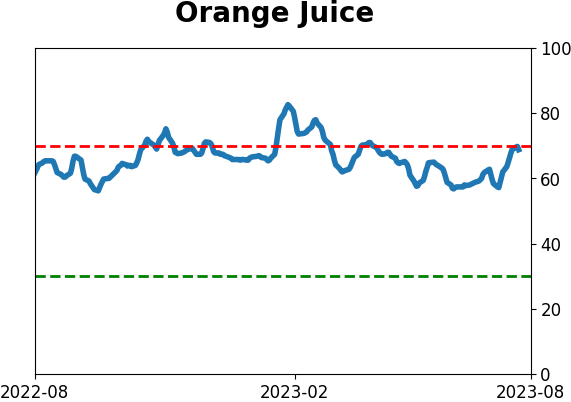
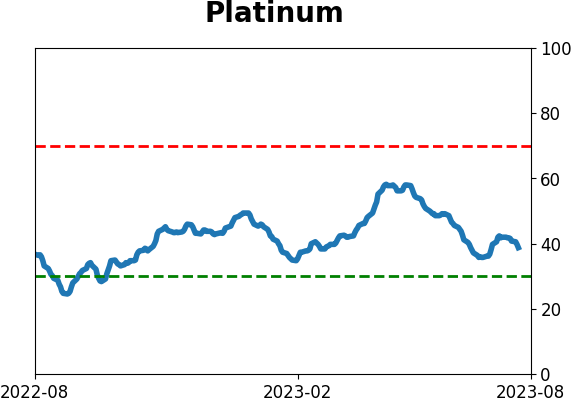
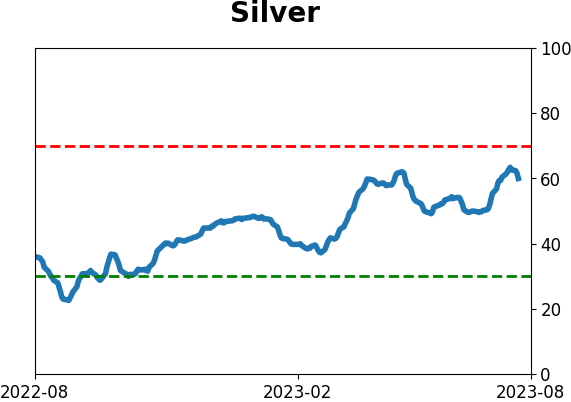
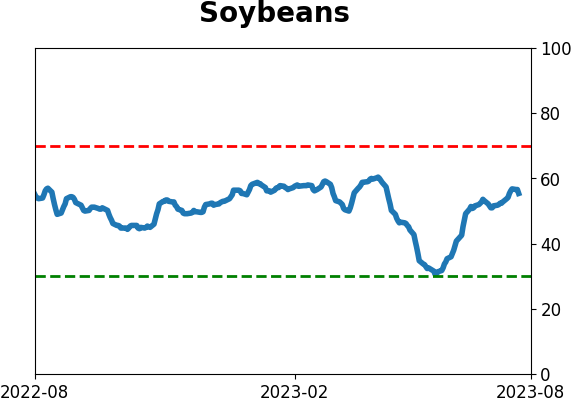
Commodity ETF's - 5-Day Moving Average
|
|