Headlines
|
|
A little rain for the late summer stock market parade:
Since 1946, the S&P has shown an August/September gain 54% of the time but has somehow managed to lose almost 60% in the process. We review the somewhat sordid history herein.
|
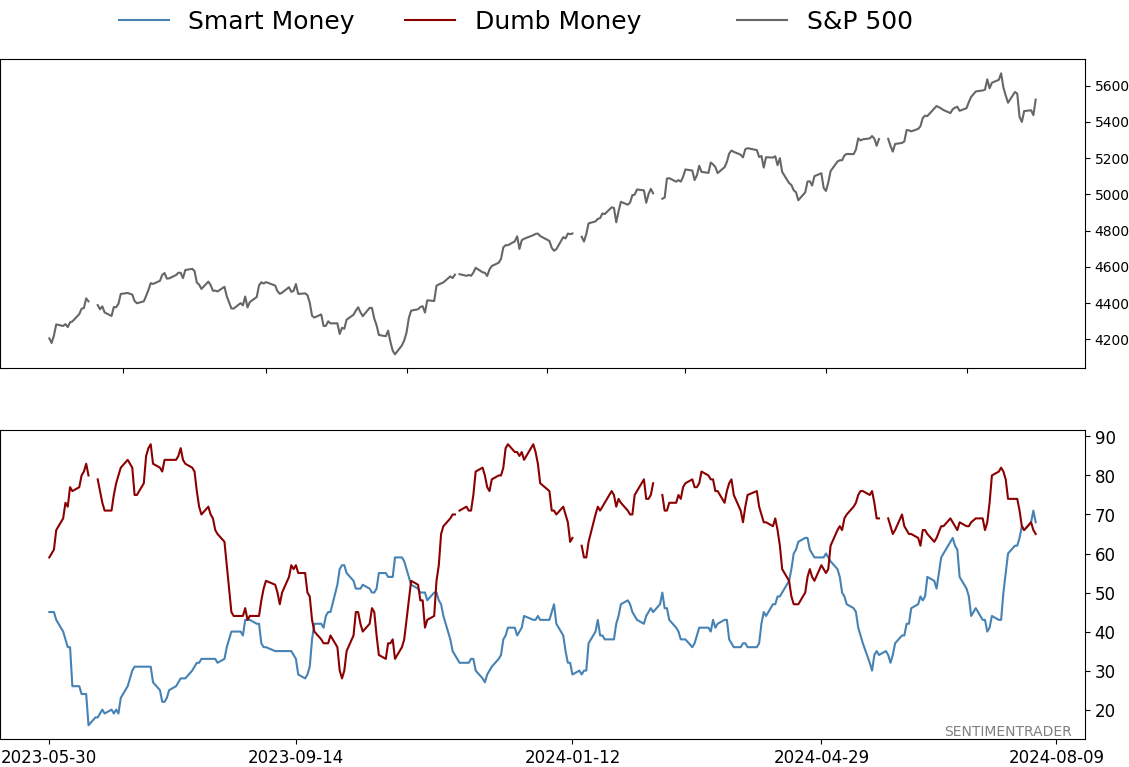
Smart / Dumb Money Confidence
|
Smart Money Confidence: 68%
Dumb Money Confidence: 65%
|
|
Risk Levels
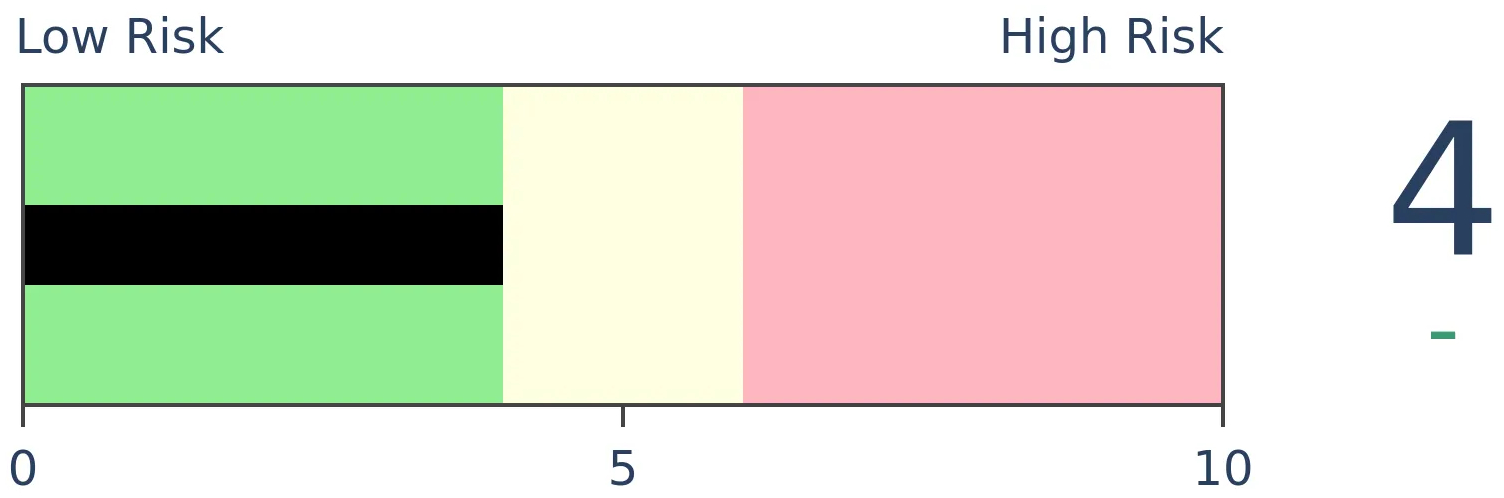
Stocks Short-Term
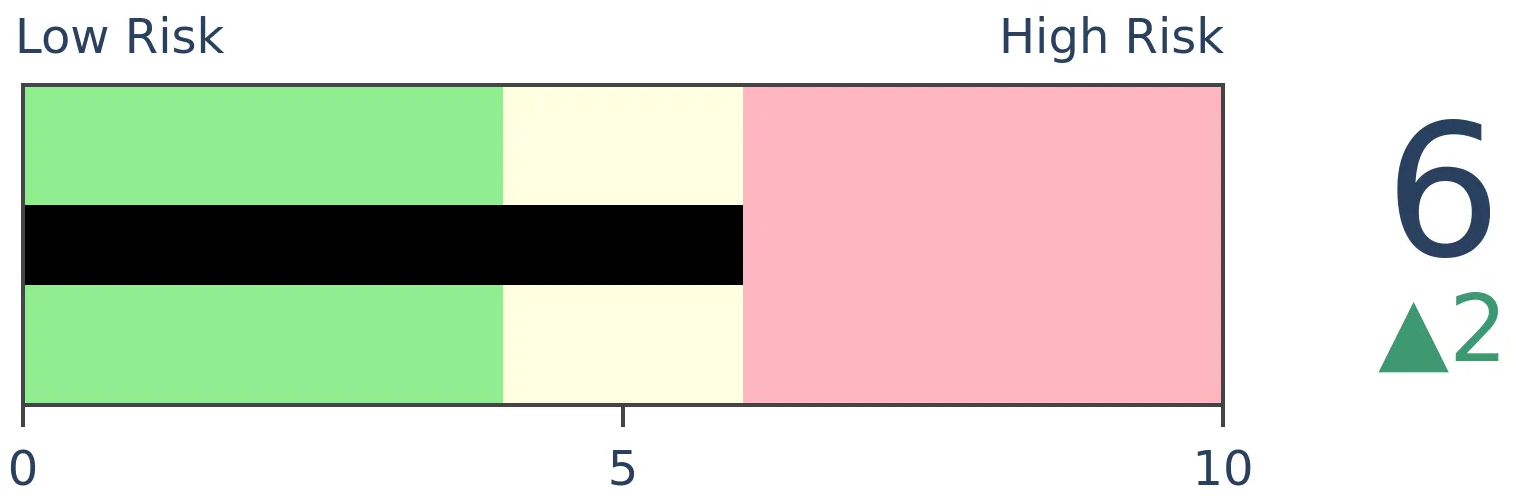
|
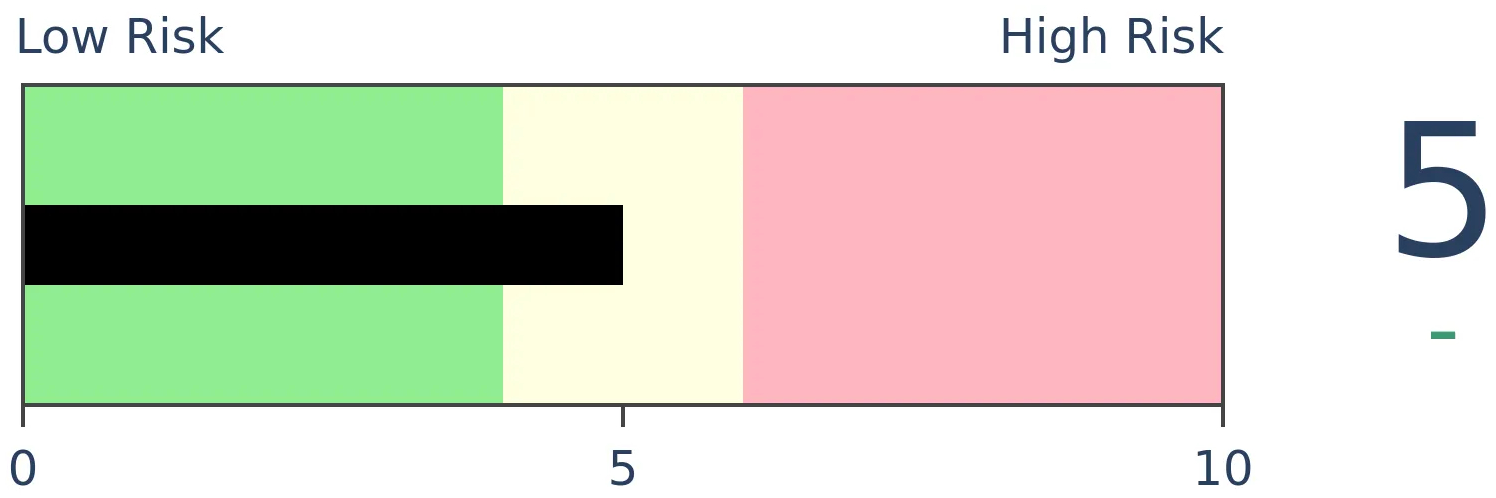
Stocks Medium-Term
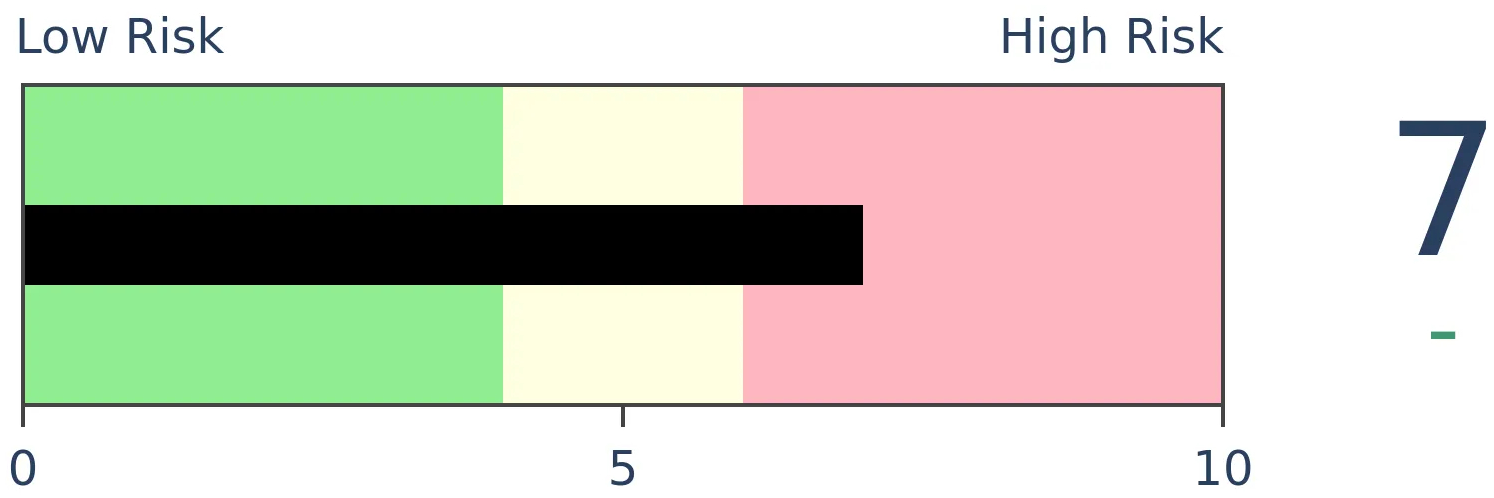
|
|
Bonds
|
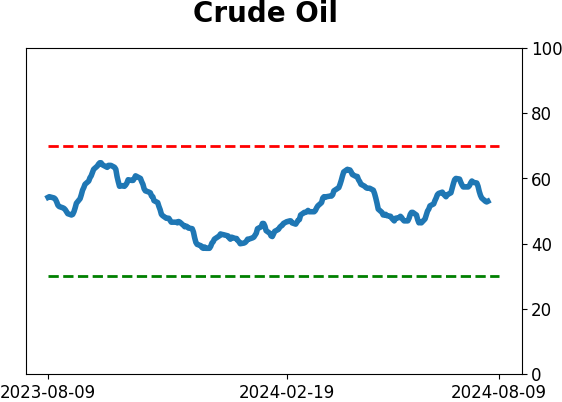
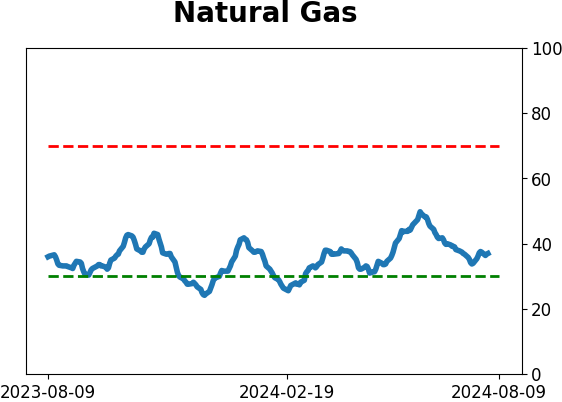
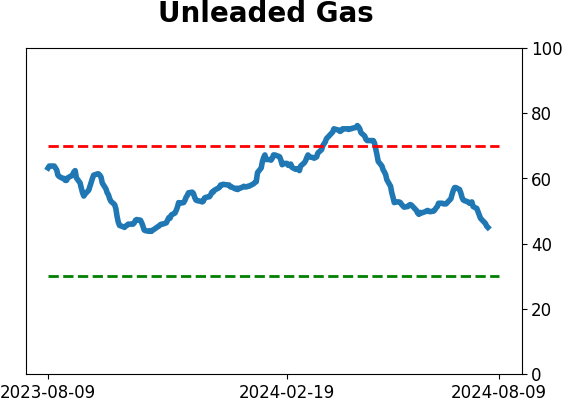
Crude Oil

|
|
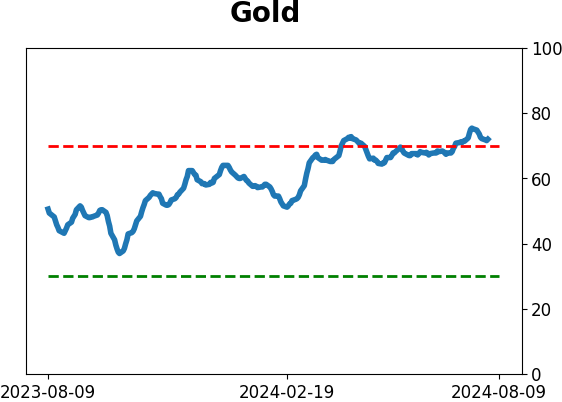
Gold

|
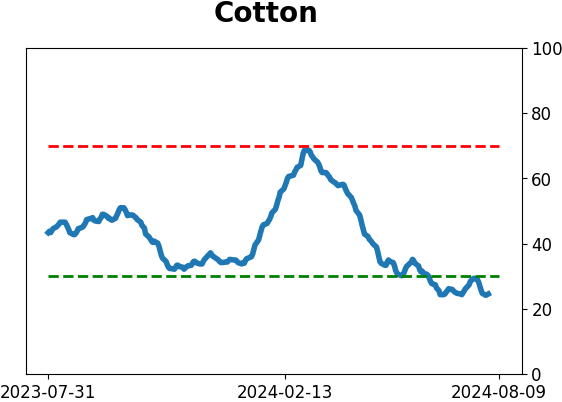
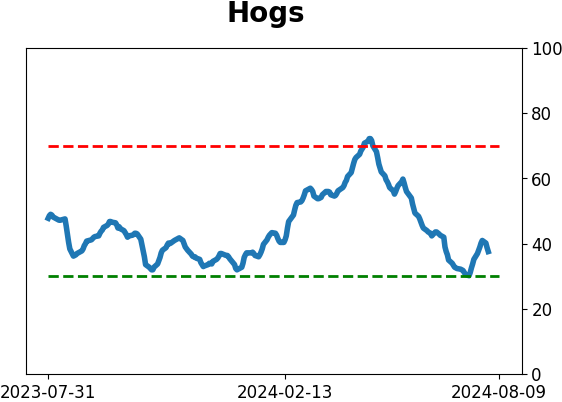
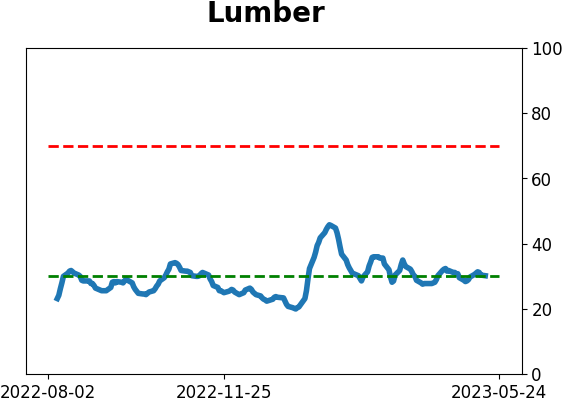
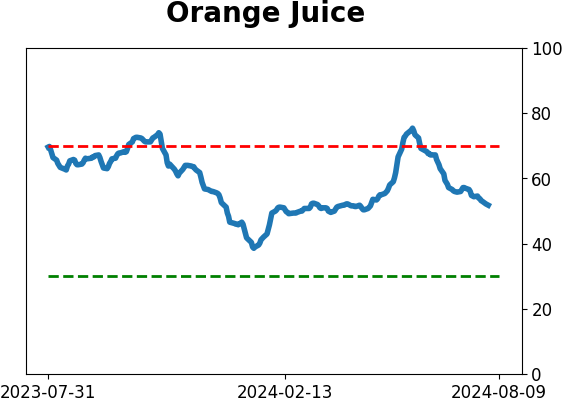
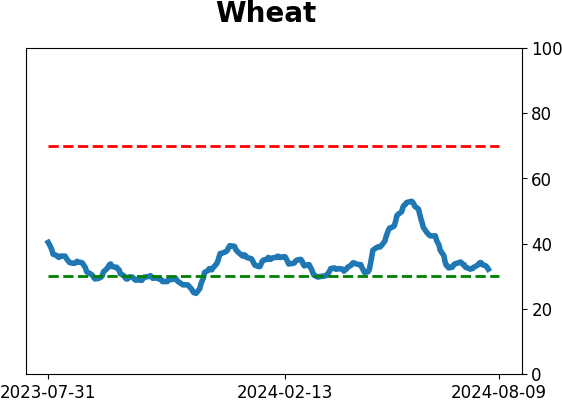
Agriculture
|
|
Research
By Jay Kaeppel
BOTTOM LINE
Since 1946, the S&P has shown an August/September gain 54% of the time but has somehow managed to lose almost 60% in the process. We review the somewhat sordid history herein.
FORECAST / TIMEFRAME
None
|
Important Note: The original emailed version of this piece had two figures that referenced "September and October" in error. ALL references in this article involve August and September only and NOT October.
Key points
- Historically, stocks have been higher during August and September combined more often than they have been lower
- However, the cumulative return for the S&P 500 during these two months since 1946 is almost -60%
- There is no reason presently to fight the favorable trend in stock price, but investors should not be surprised if the stock market struggles in the months directly ahead
A closer look at August and September
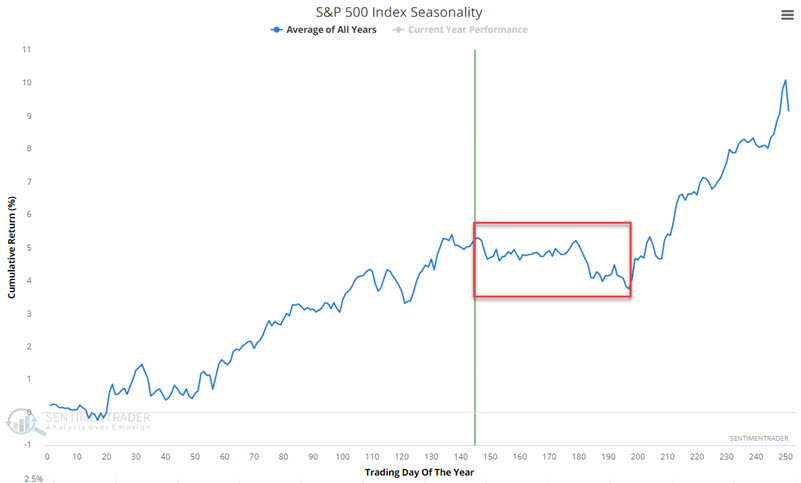
The chart below displays the annual seasonal trend for the S&P 500 Index over the past 30 years. We see that the next several months are generally a period when the stock market can struggle to make gains and is the time of year most likely to witness a pullback.
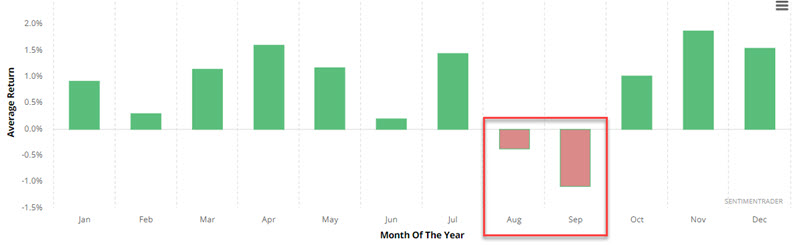
The chart below displays average returns for every month over the same time period. Note that August and September are the only two months with an average decline.
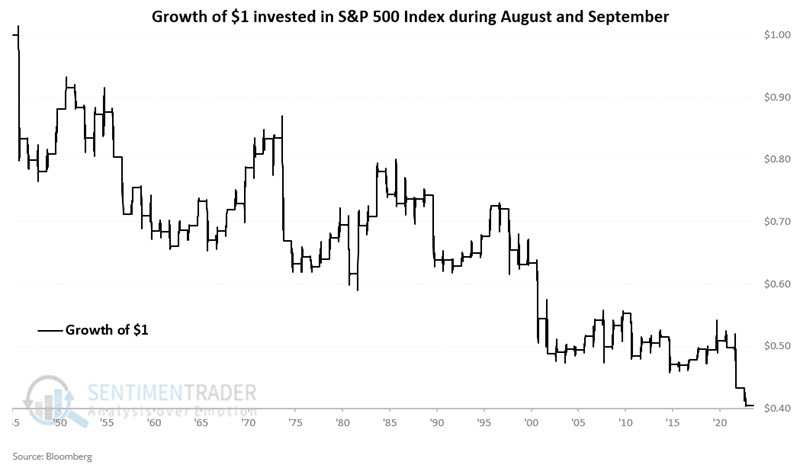
The chart below displays the cumulative growth of $1 invested in the S&P 500 Index (price data only, not total return) during August and September every year starting post-World War II in 1946.
The table below summarizes performance.
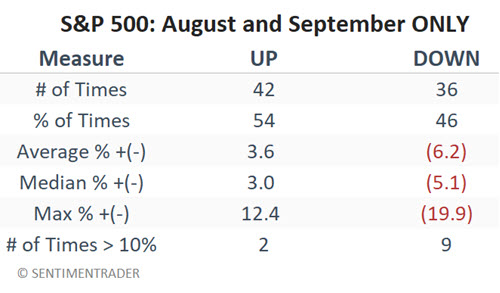
There are a couple of interesting things to note here:
- The net result is a cumulative loss of -59.6%
- The Win Rate is slightly favorable at 54%
- Two-month moves of 10% or more have skewed negatively by a factor of 9-to-2
What the research tells us…
The bottom line is that it is not technically accurate to say that August/September is "bearish" for stocks, as stock prices have increased more often than they have gone down during this period. Nevertheless, investors should stand forewarned that performance during unfavorable years is substantially worse than during favorable years. We cannot use this history to "predict" what will happen in the months ahead. Nevertheless, we should not be surprised if the market struggles in the months ahead. If an investor is inclined to hedge - or a trader is inclined to try to play the short side - now would be the time to prepare a plan of action.
Indicators at Extremes
Phase Table
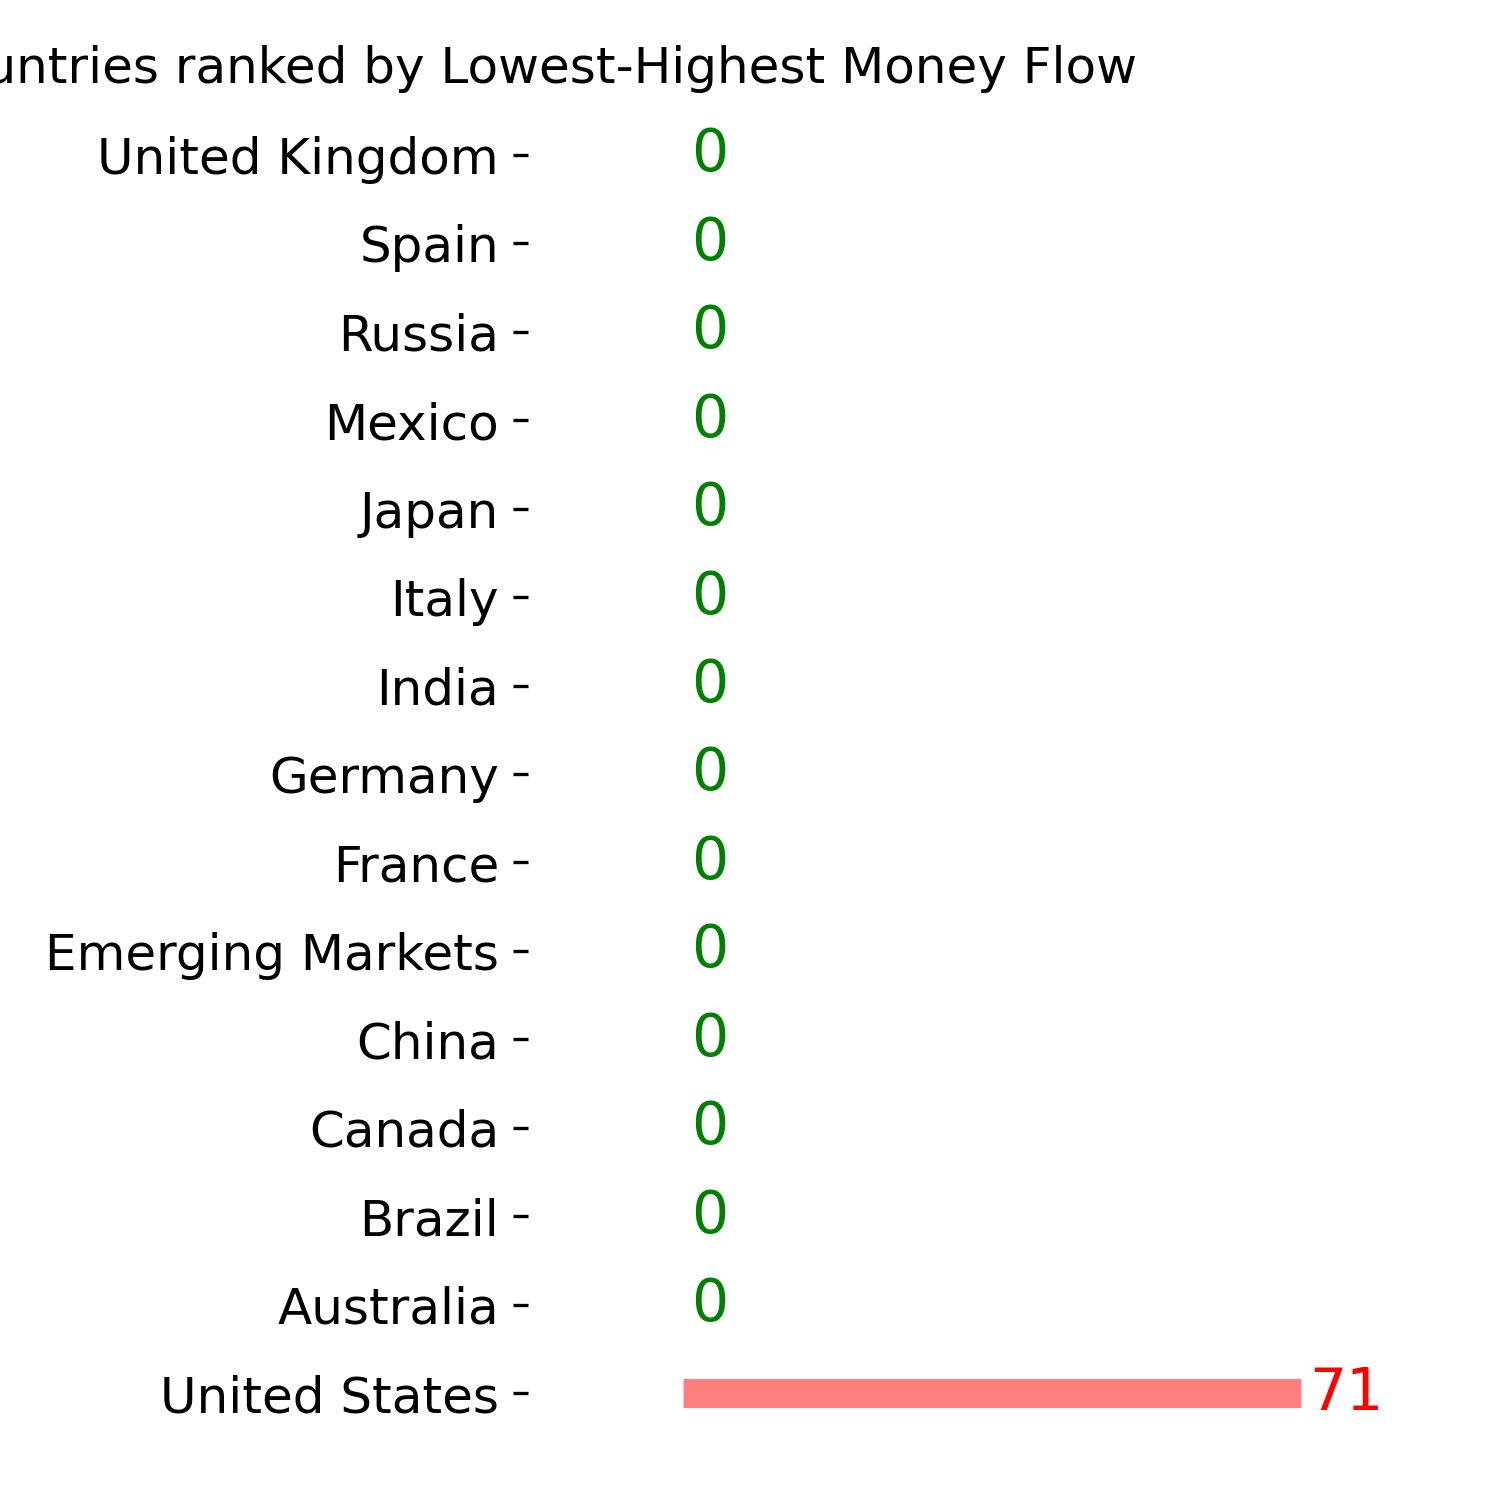
Ranks
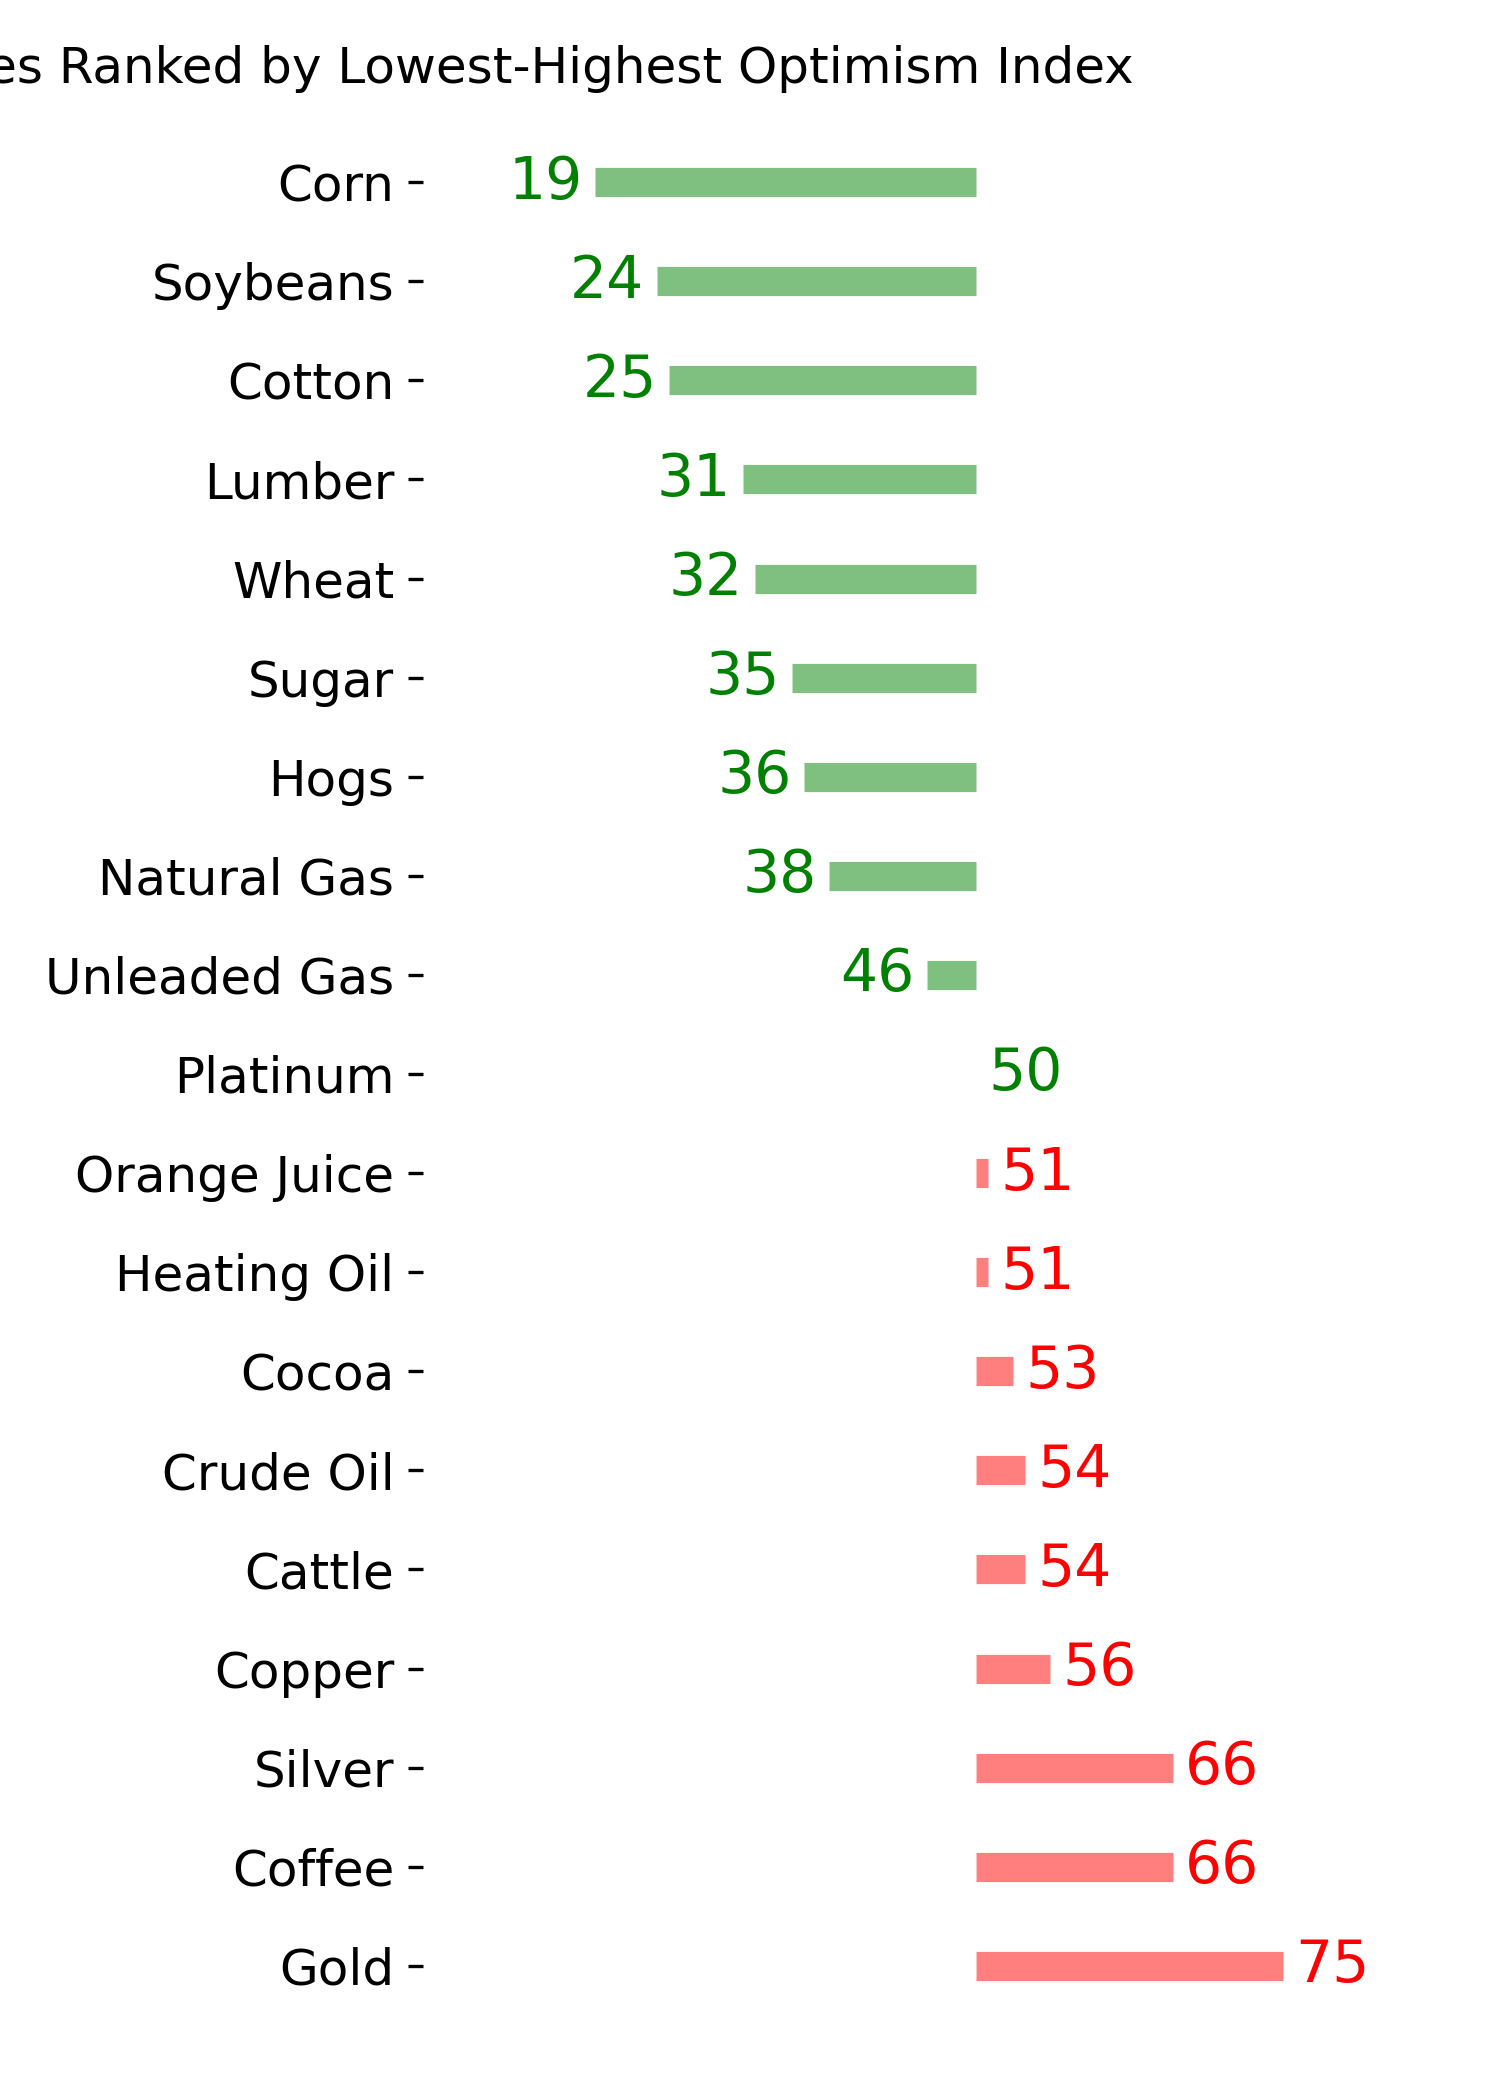
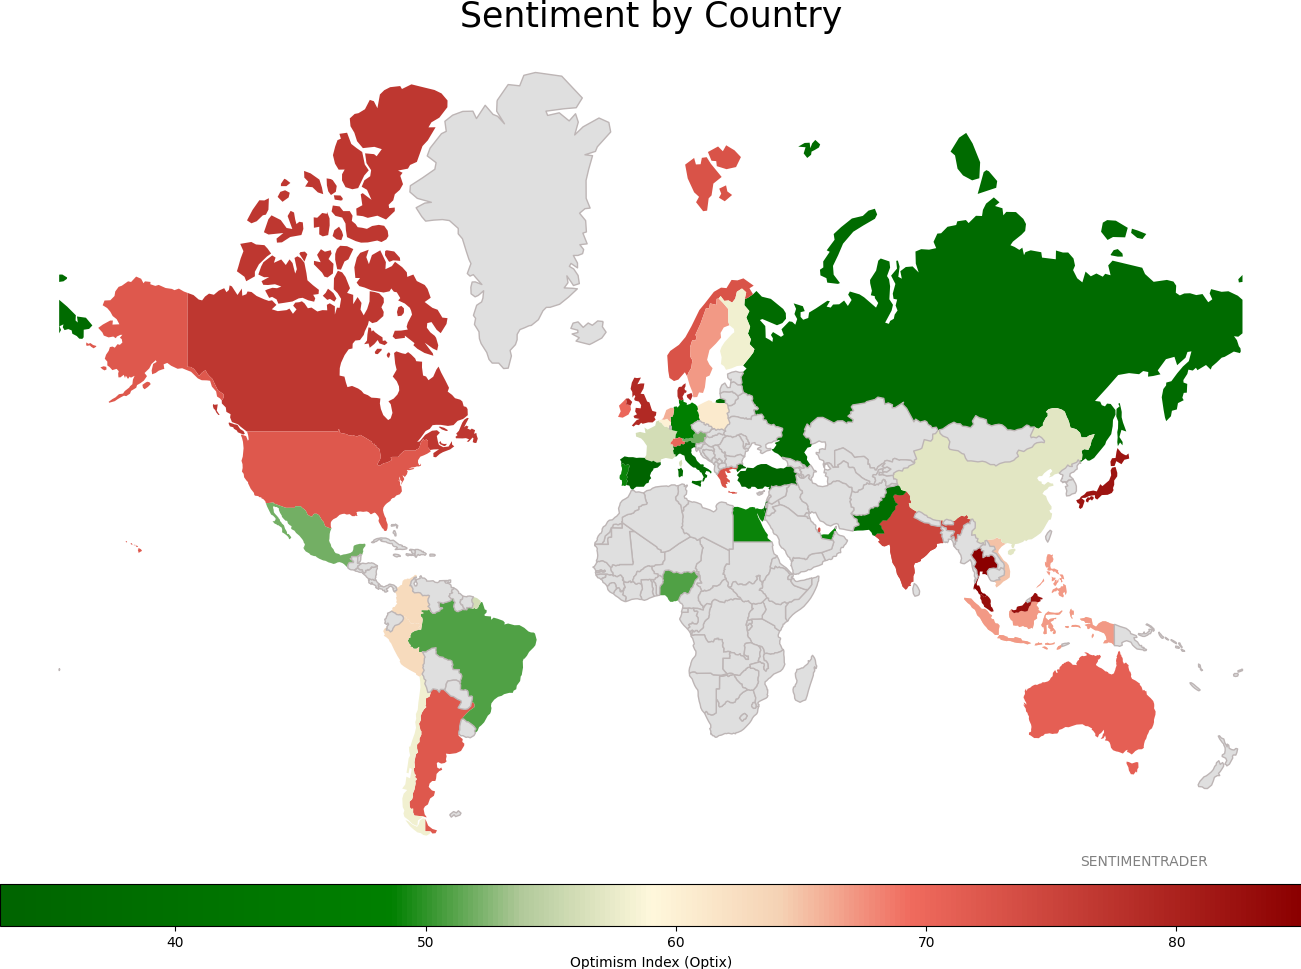
Sentiment Around The World
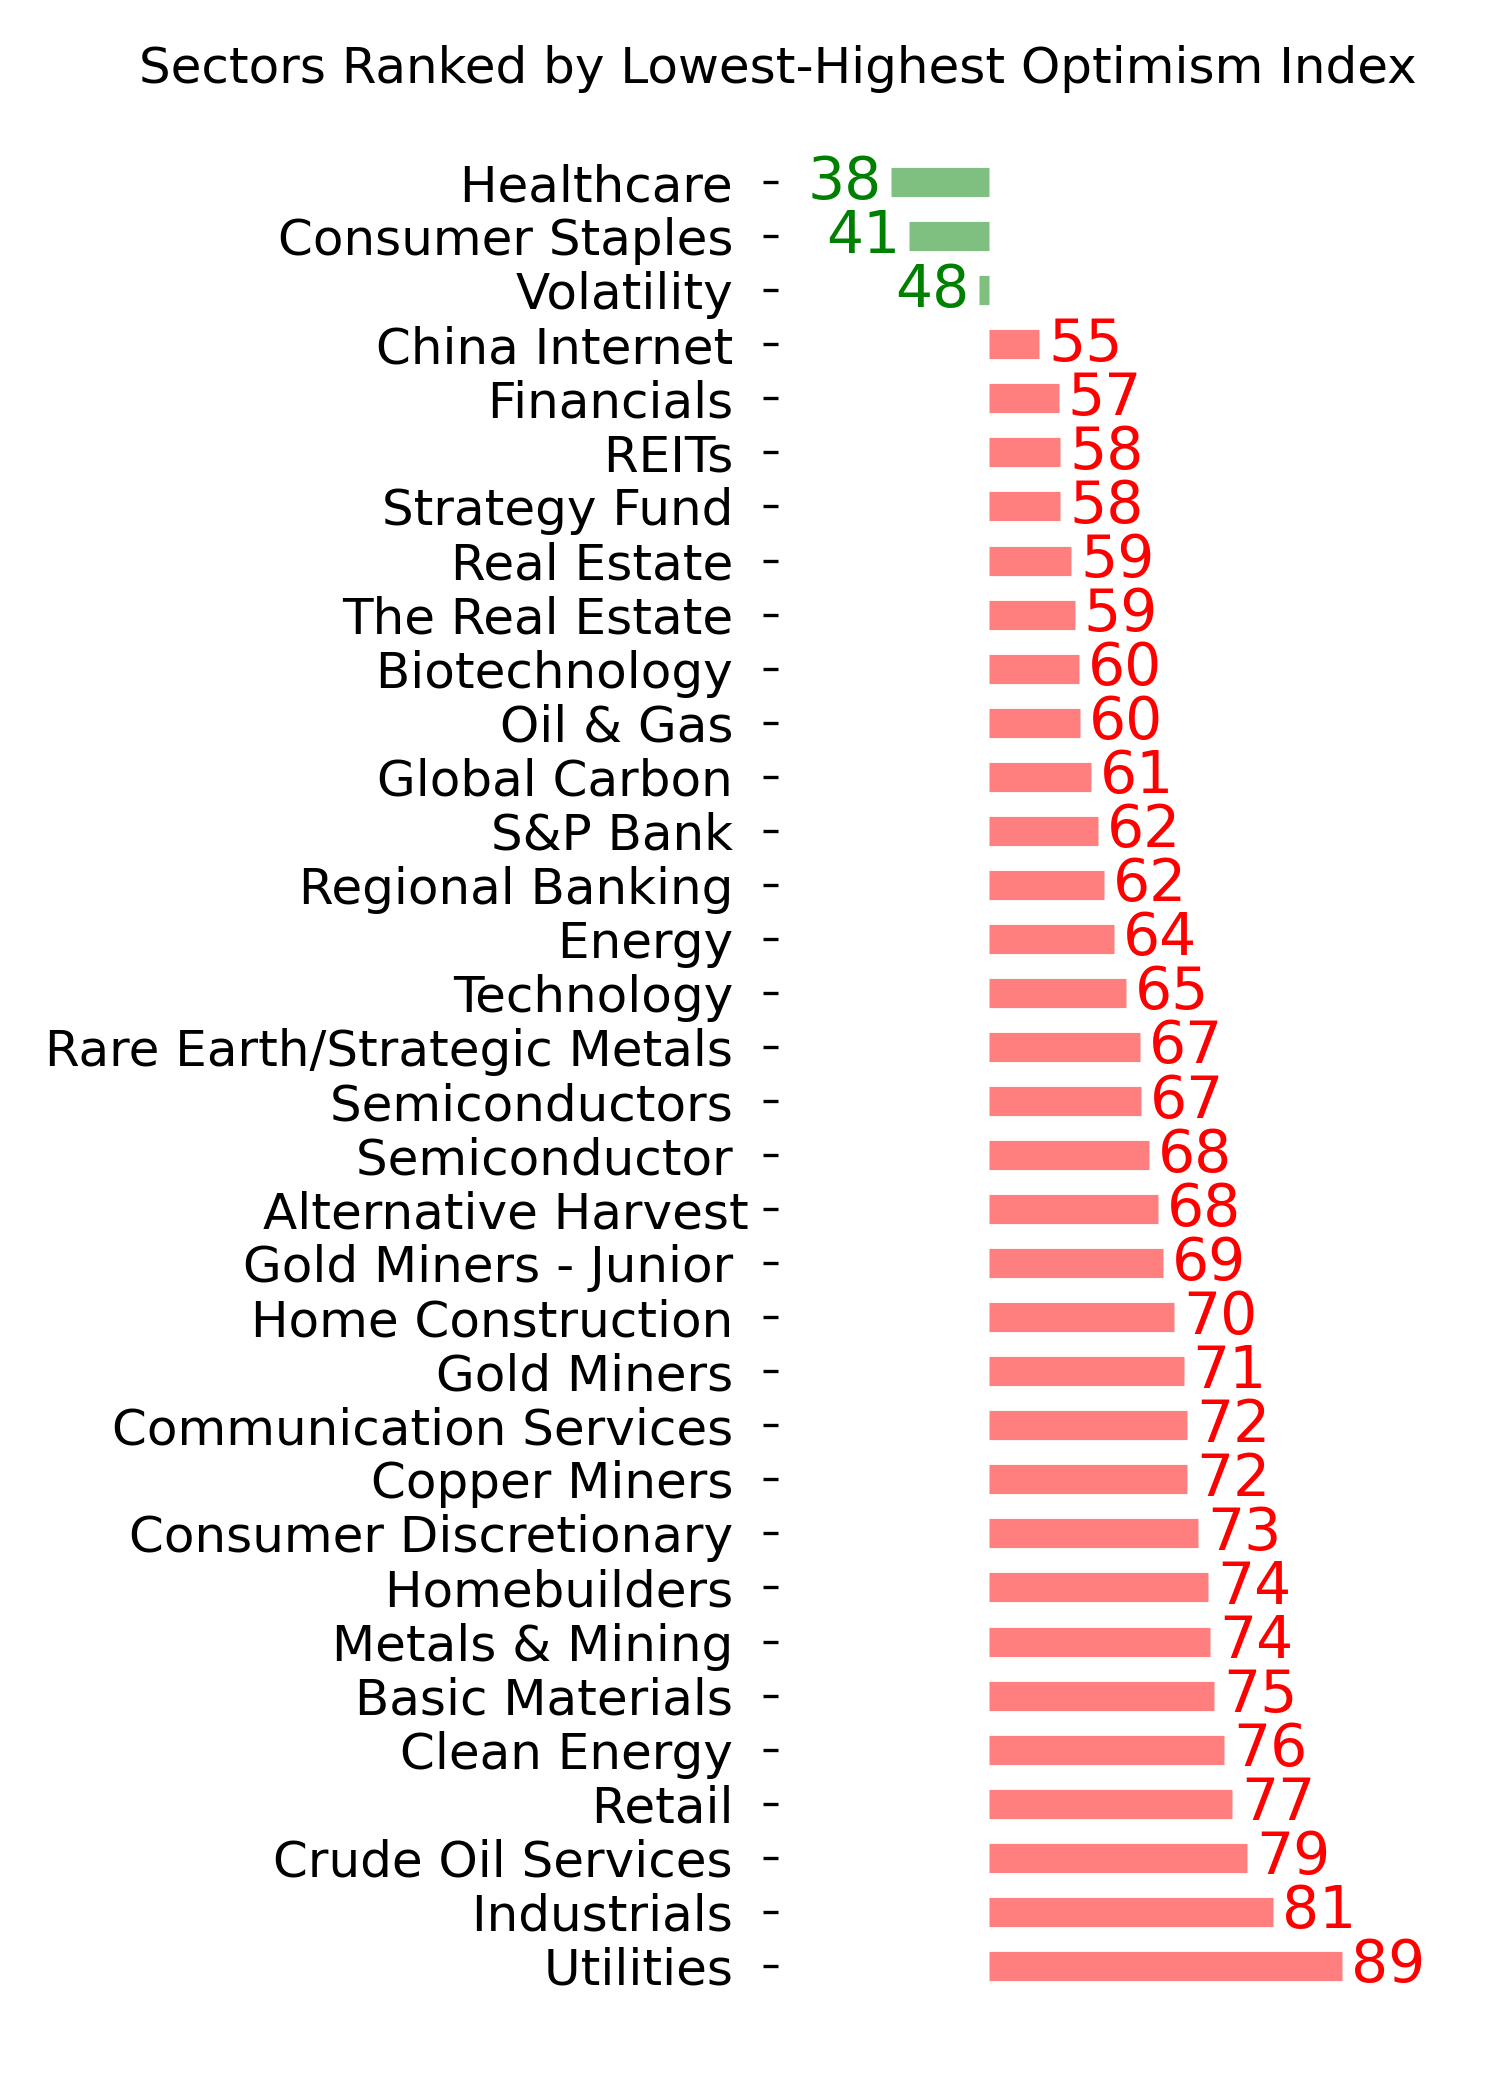
Optimism Index Thumbnails
|
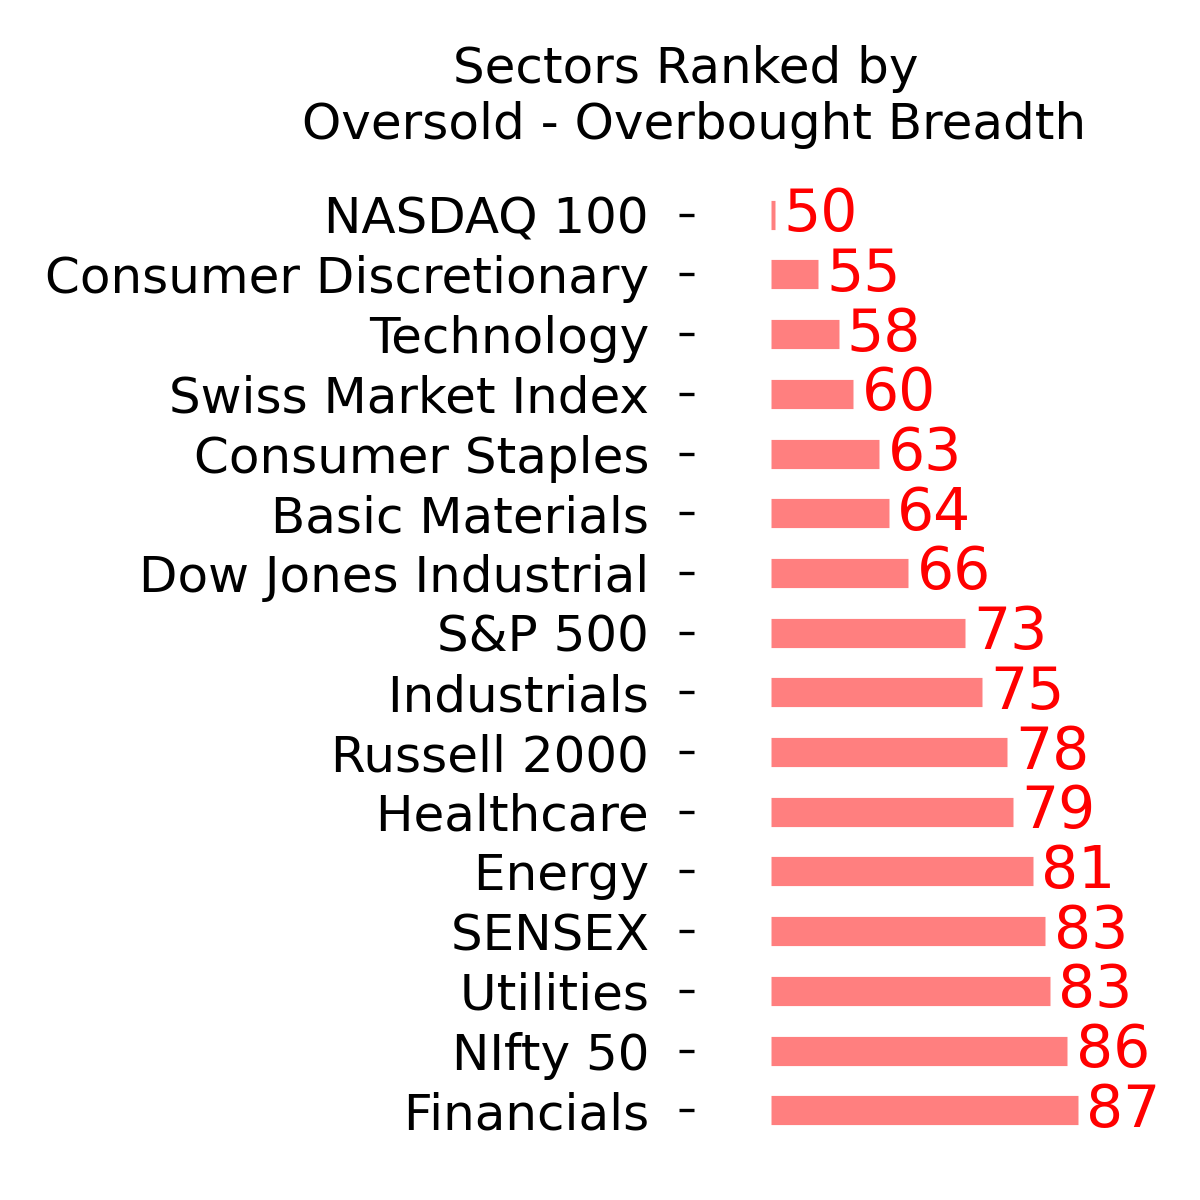
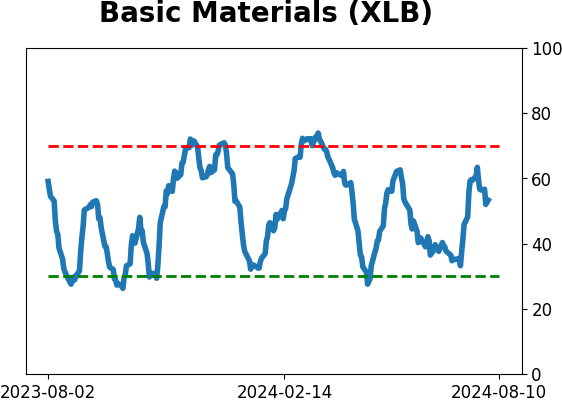
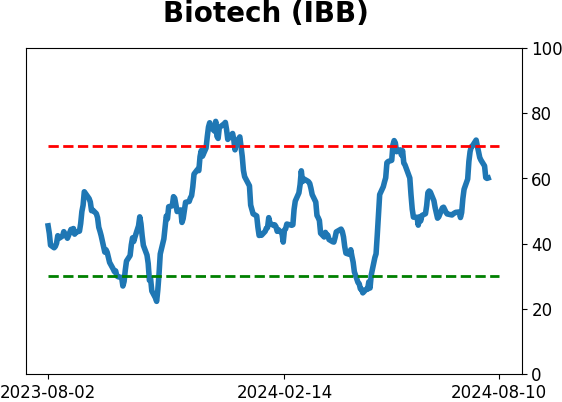
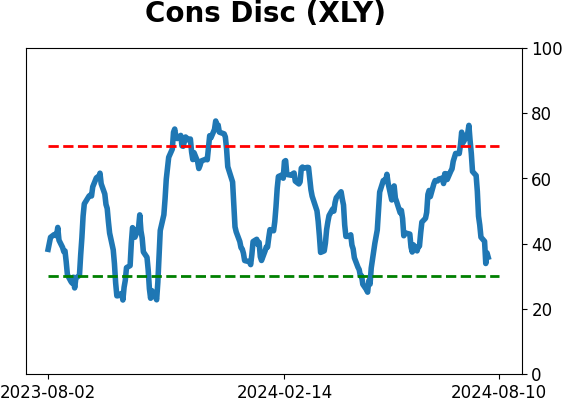
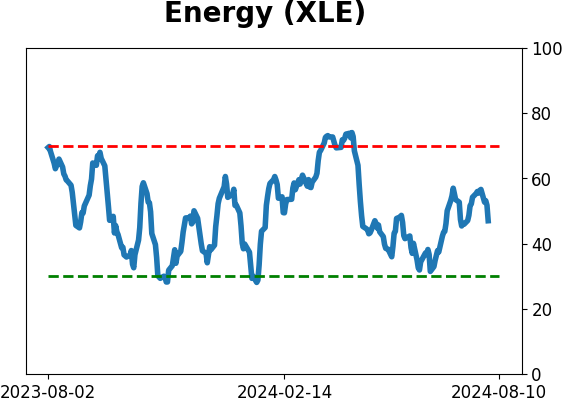
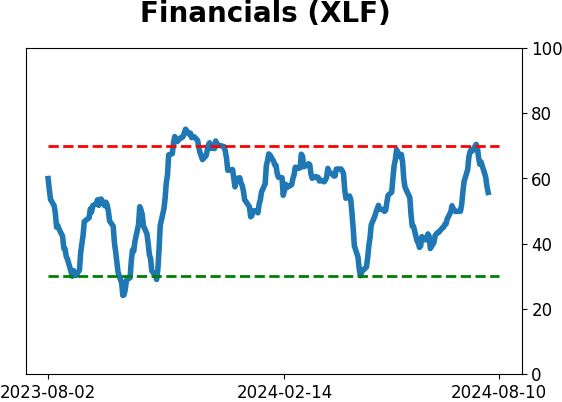
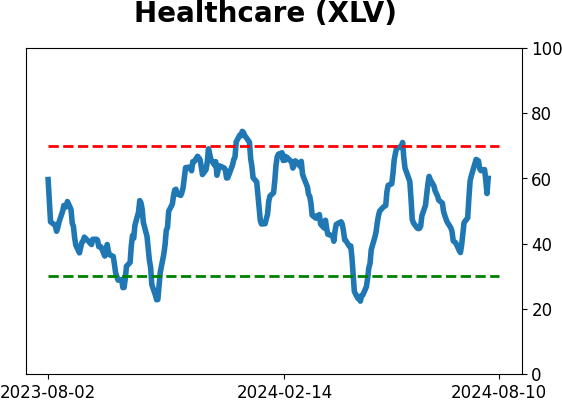
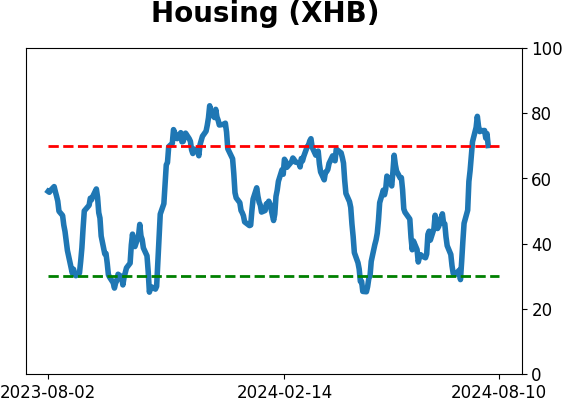
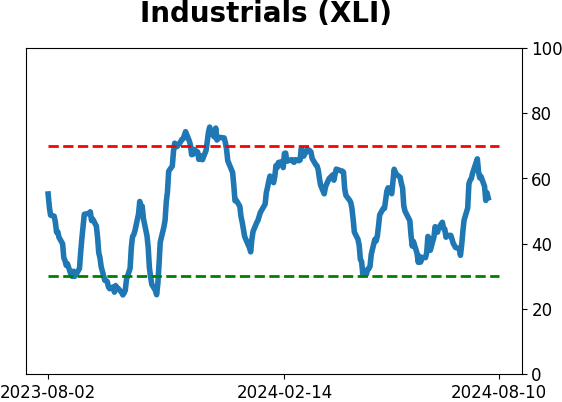
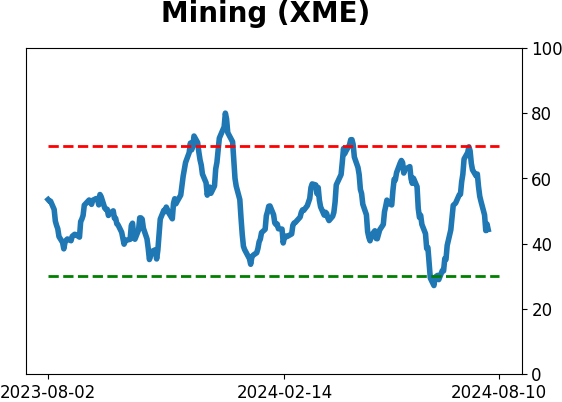
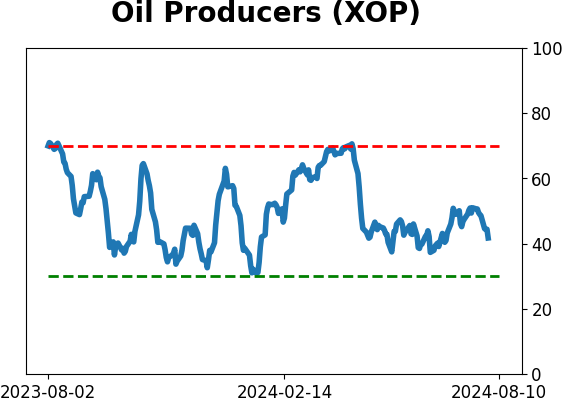
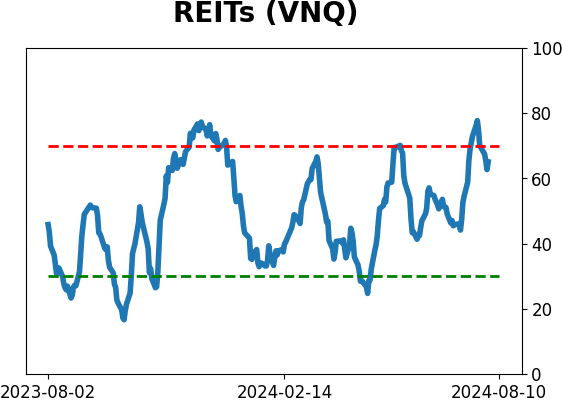
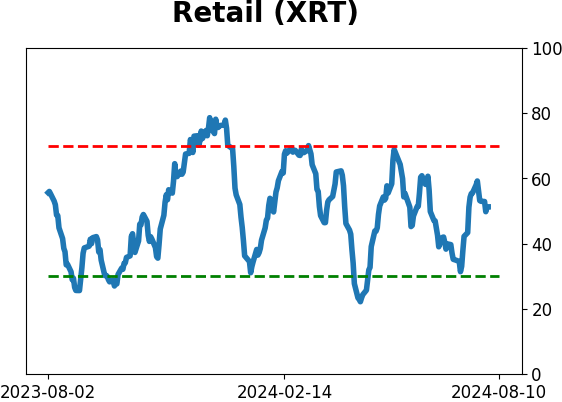
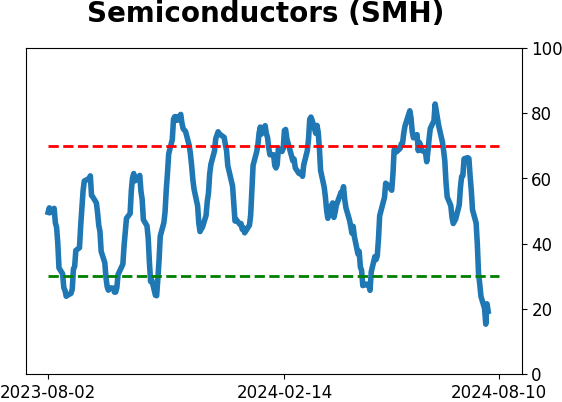
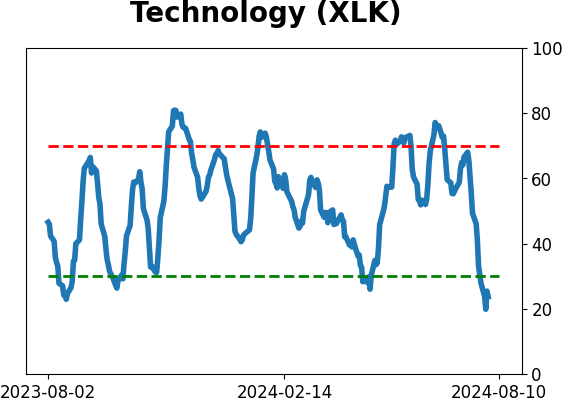
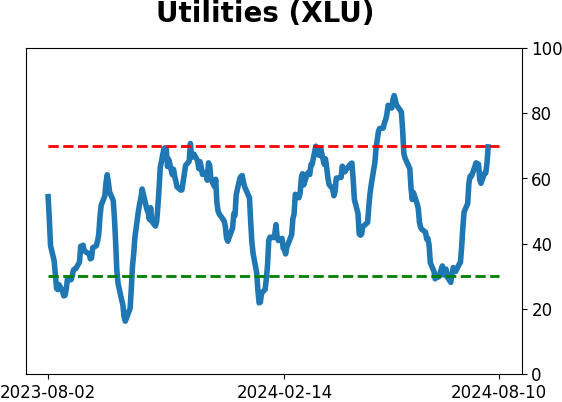
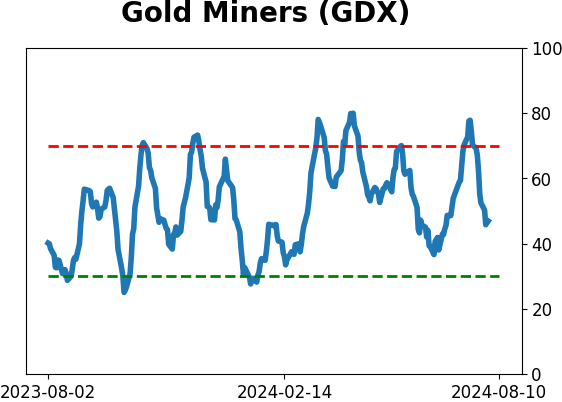
Sector ETF's - 10-Day Moving Average
|
|
|
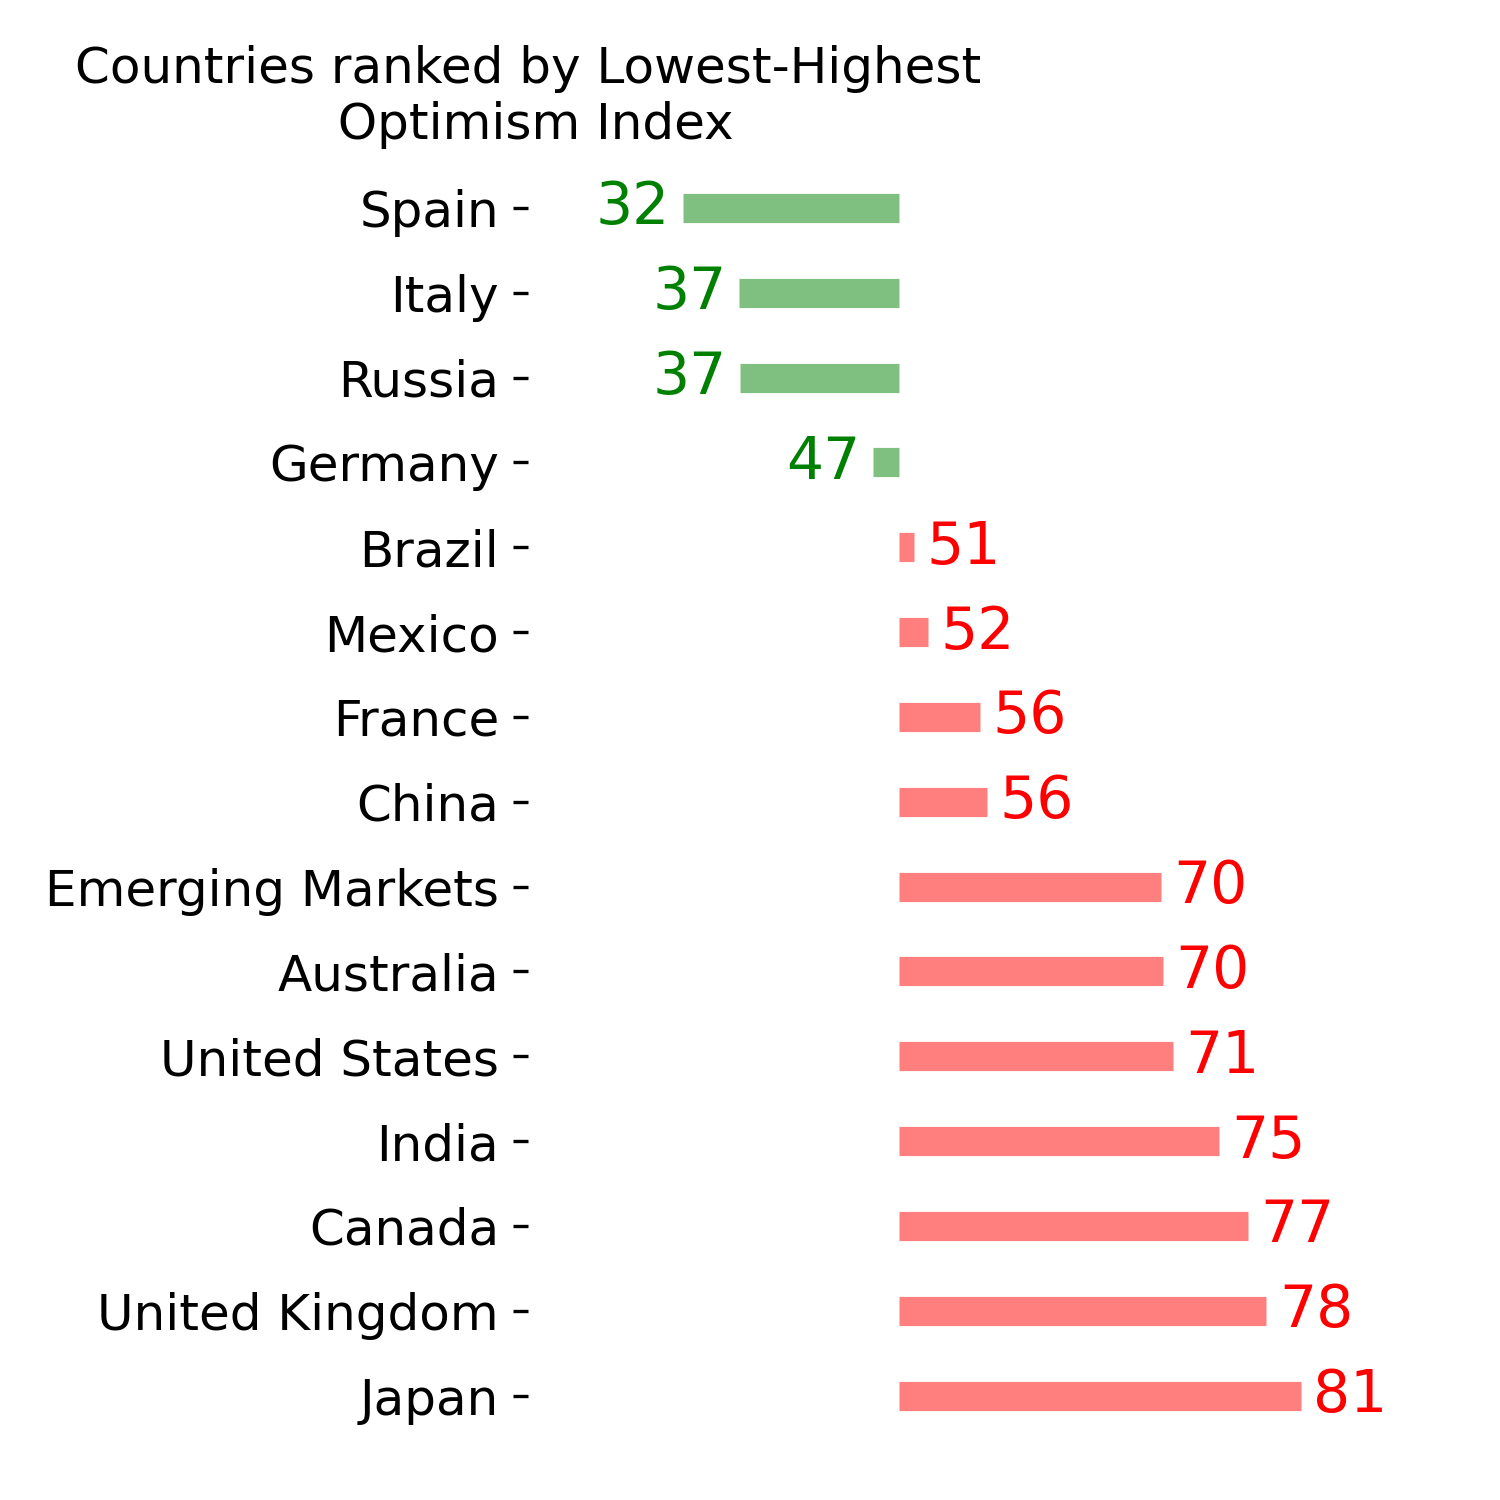
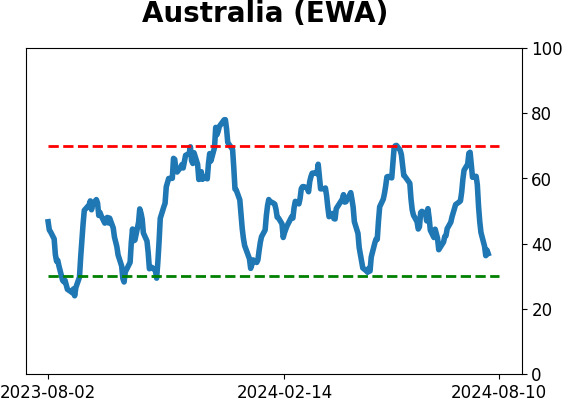
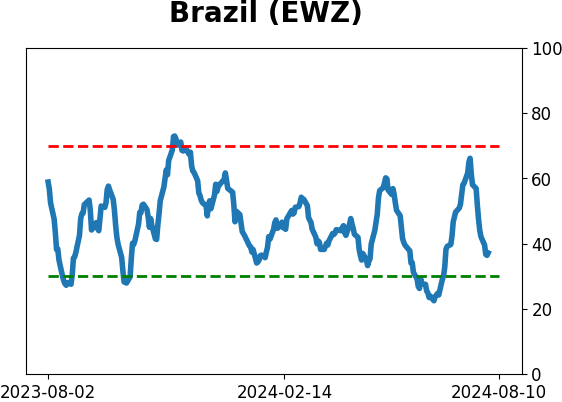
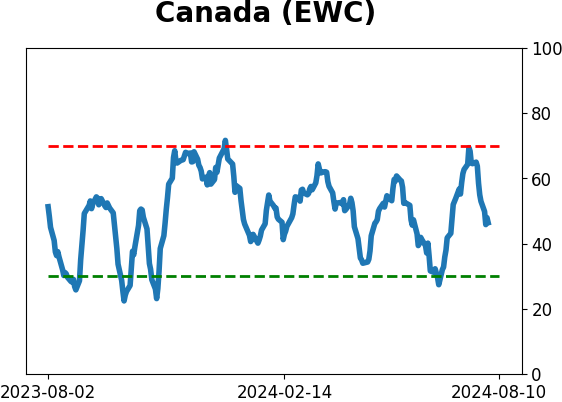
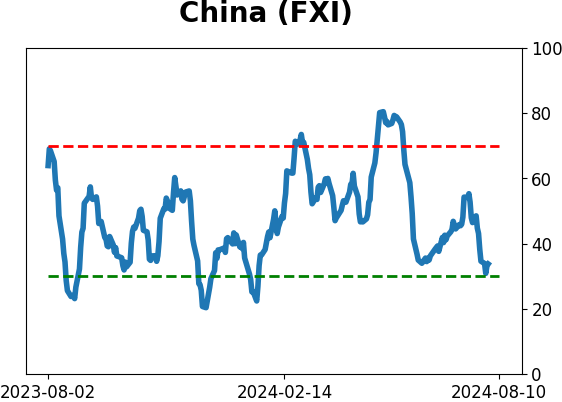
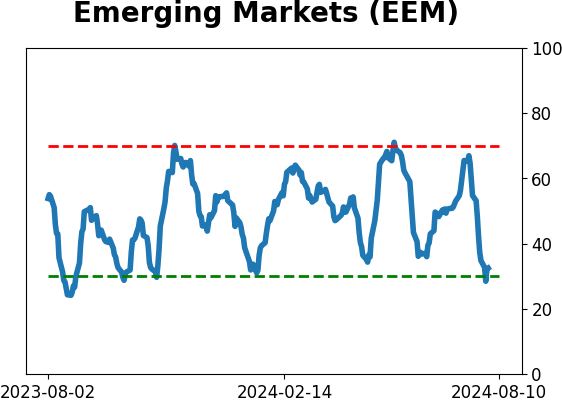
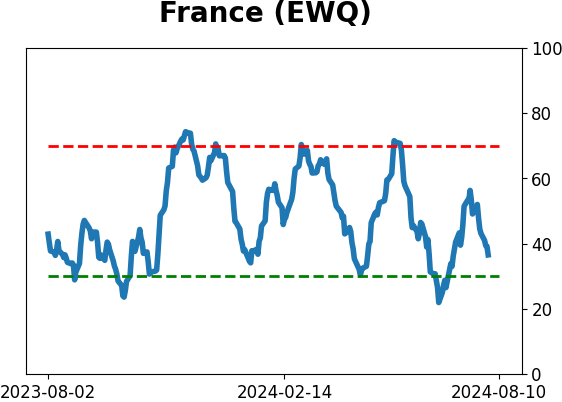
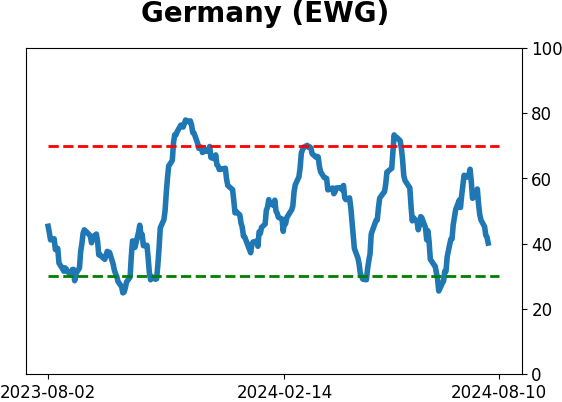
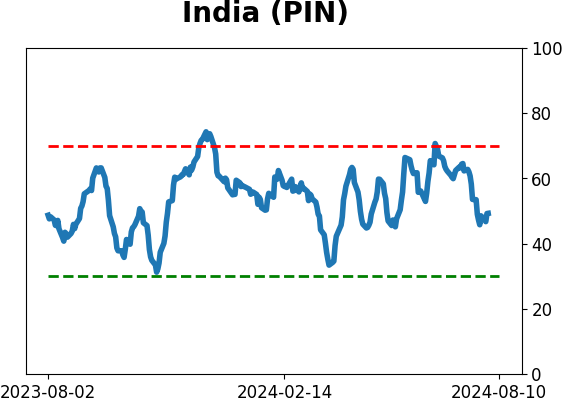
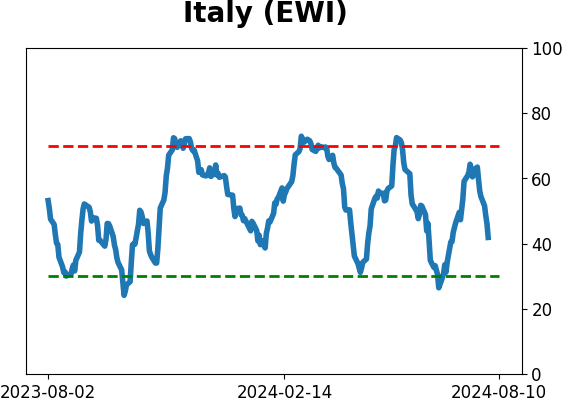
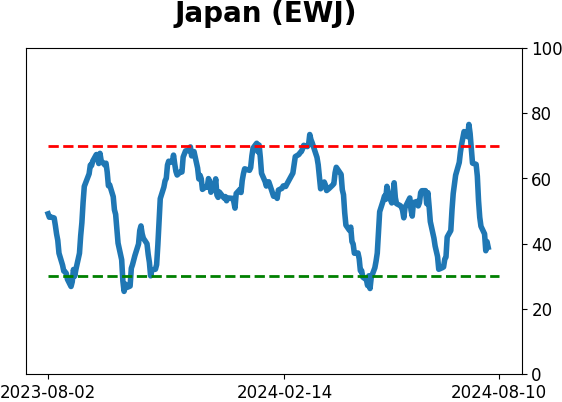
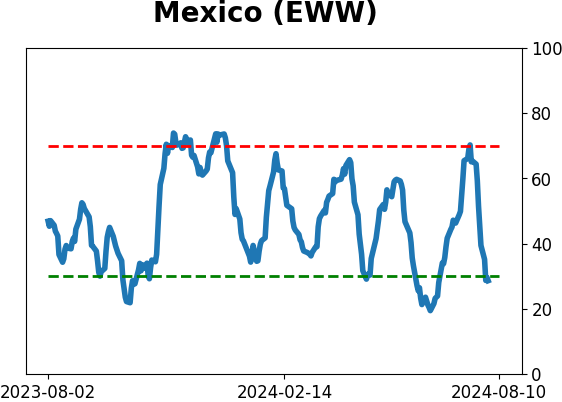
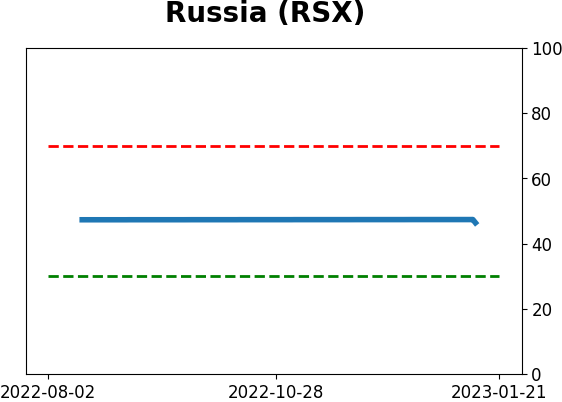
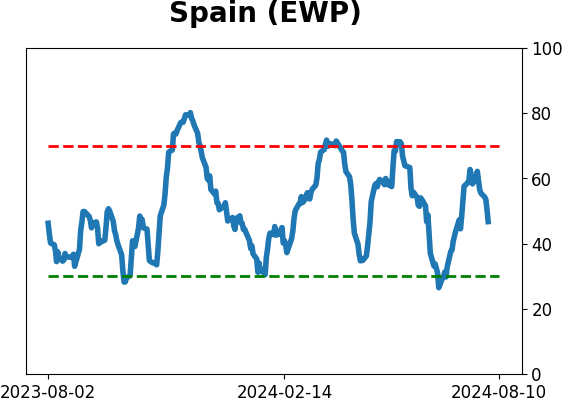
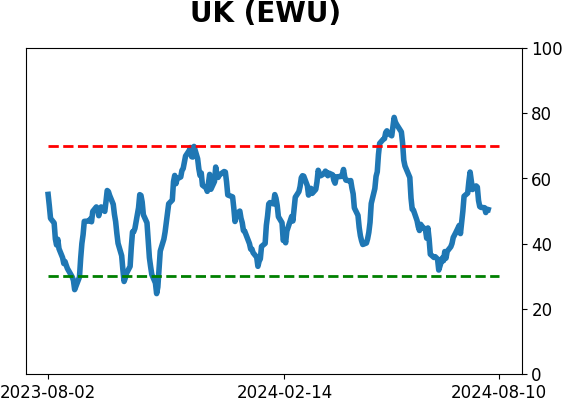
Country ETF's - 10-Day Moving Average
|
|
|
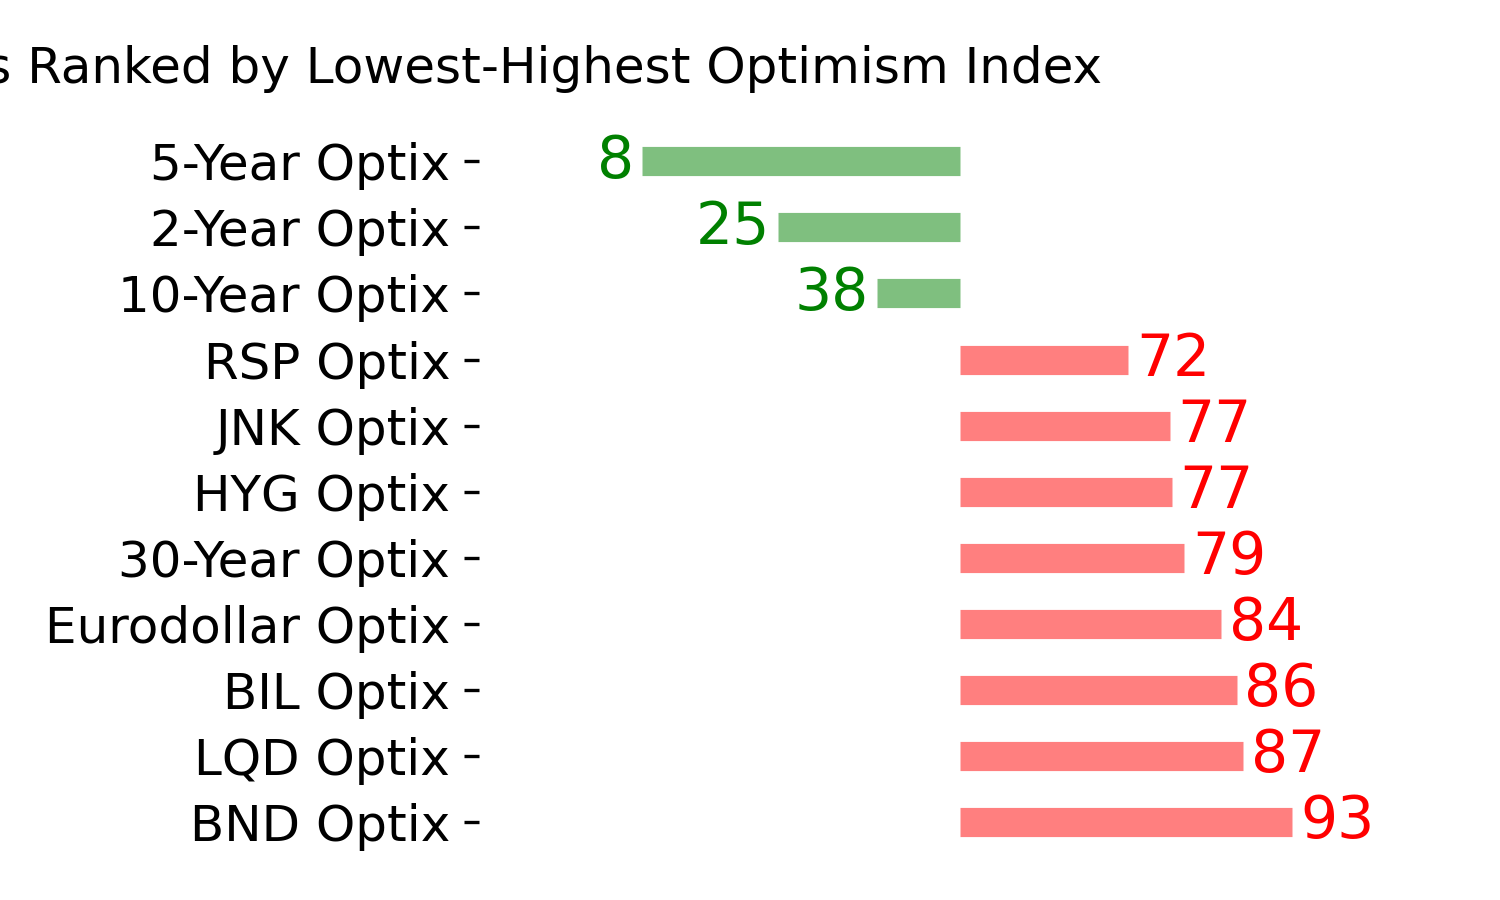
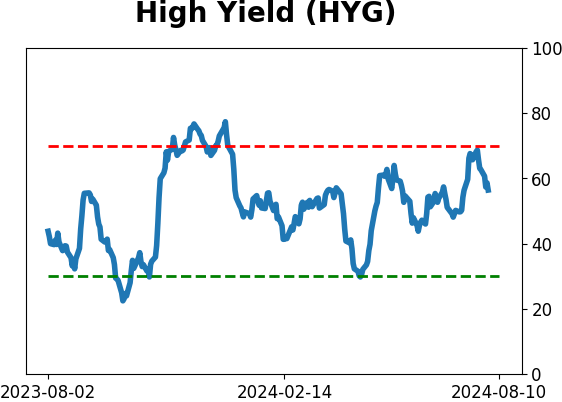
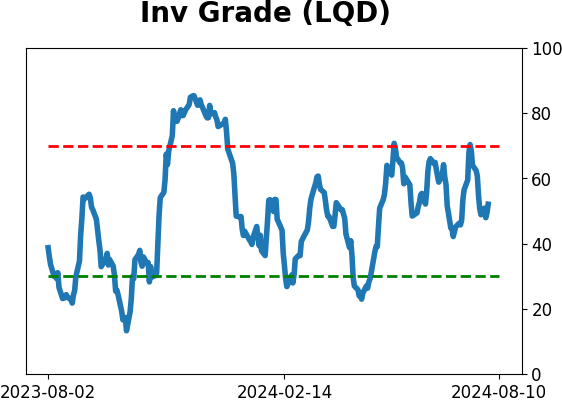
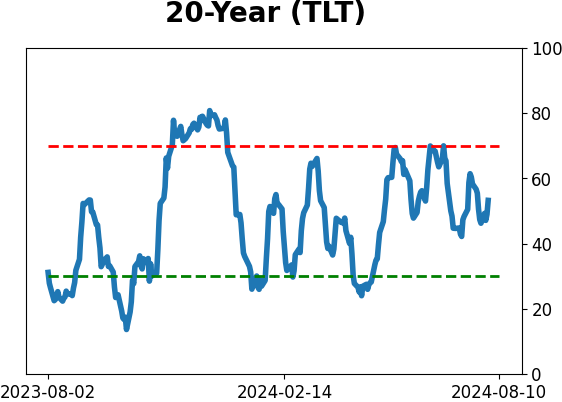
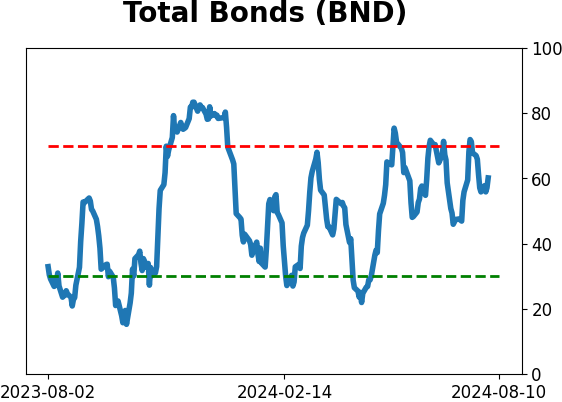
Bond ETF's - 10-Day Moving Average
|
|
|
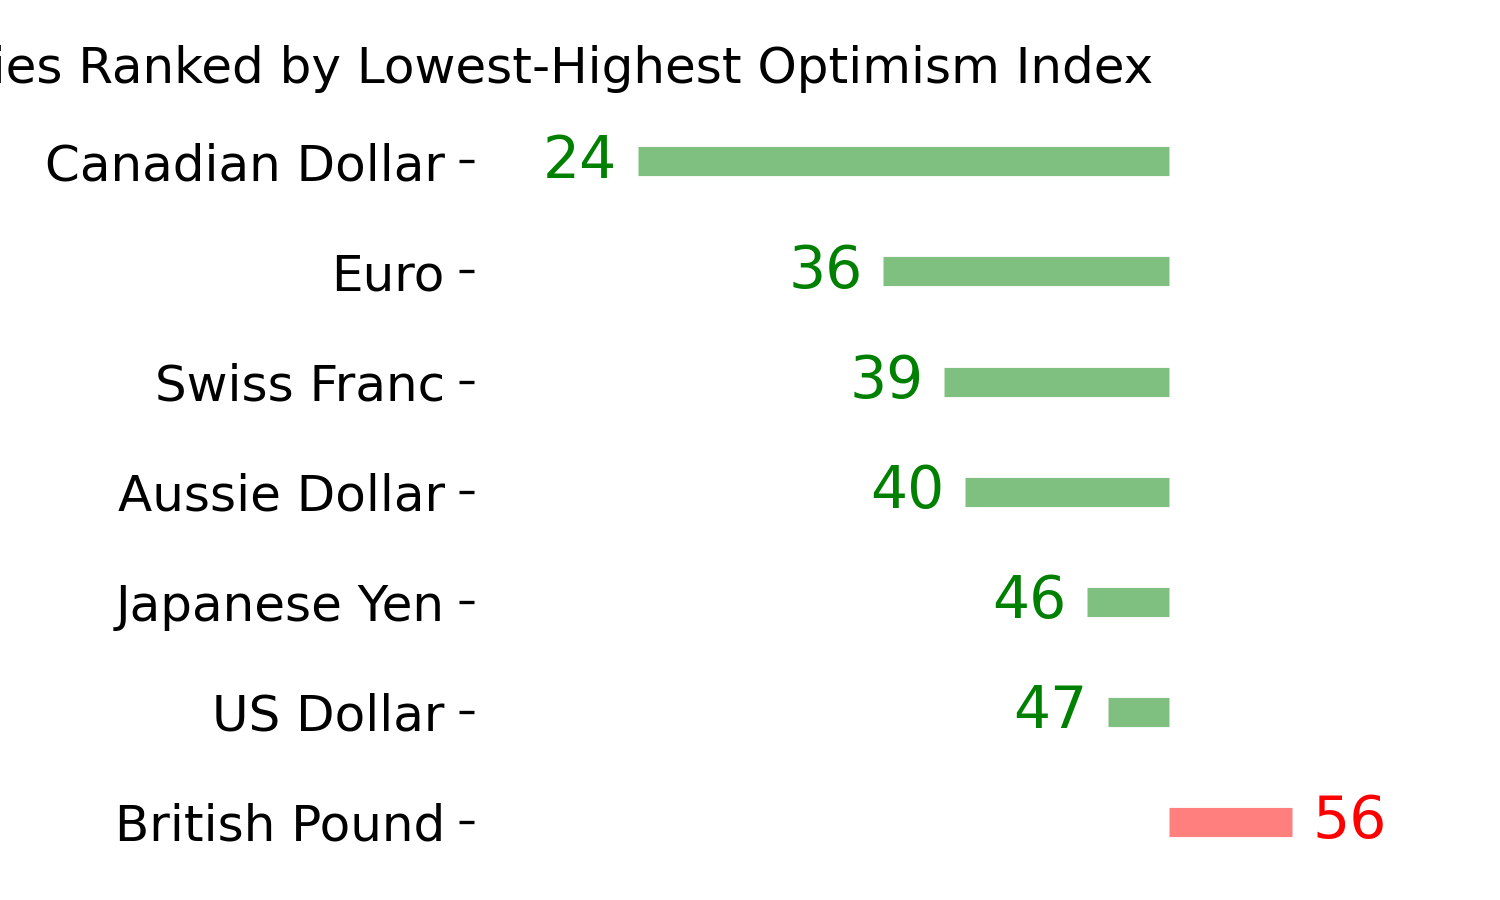
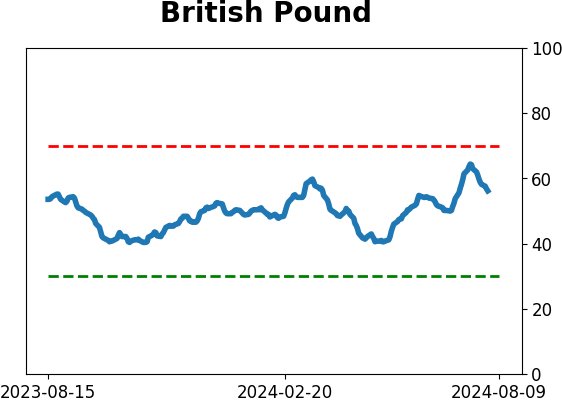
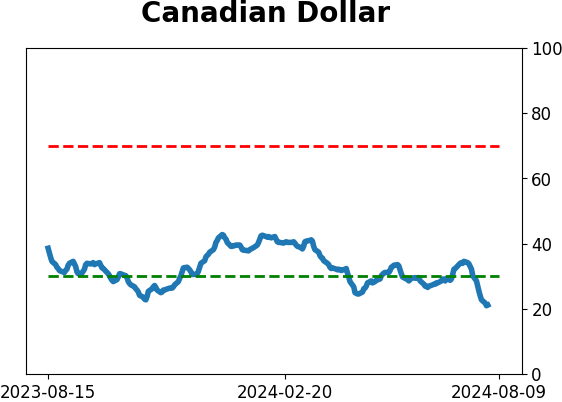
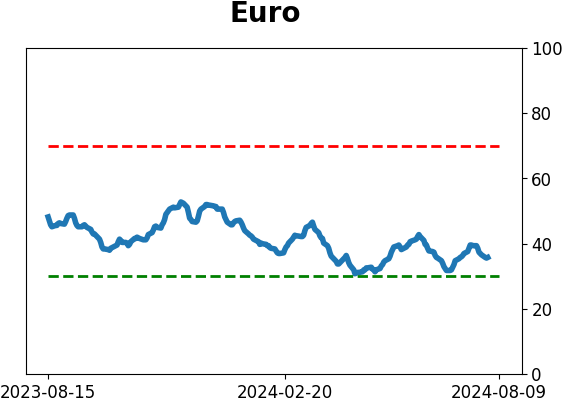
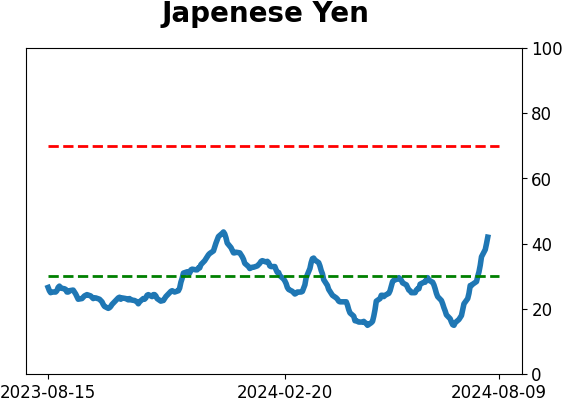
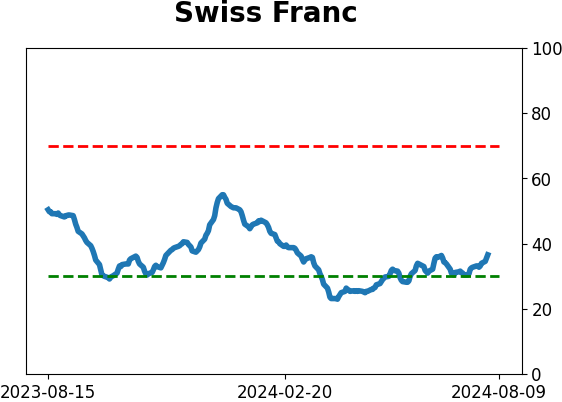
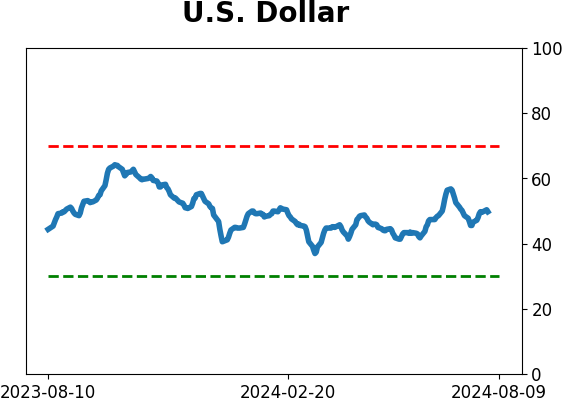
Currency ETF's - 5-Day Moving Average
|
|
|
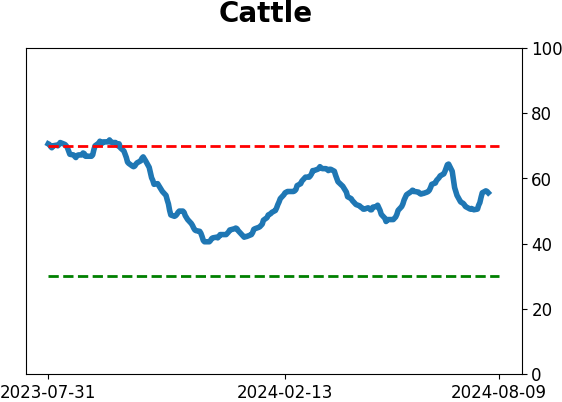
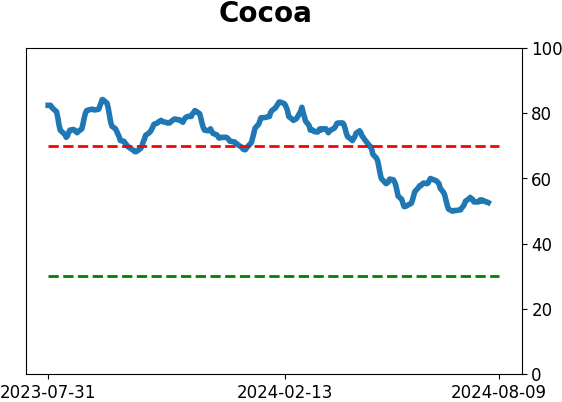
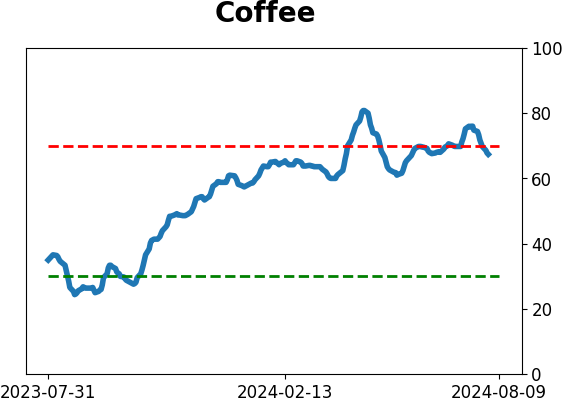
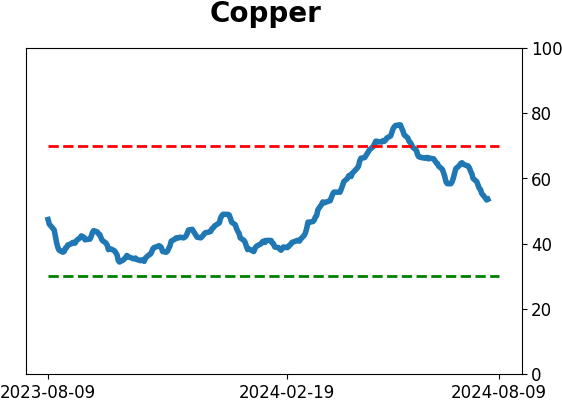
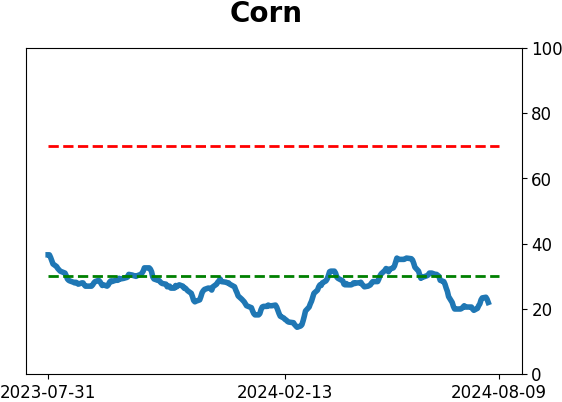
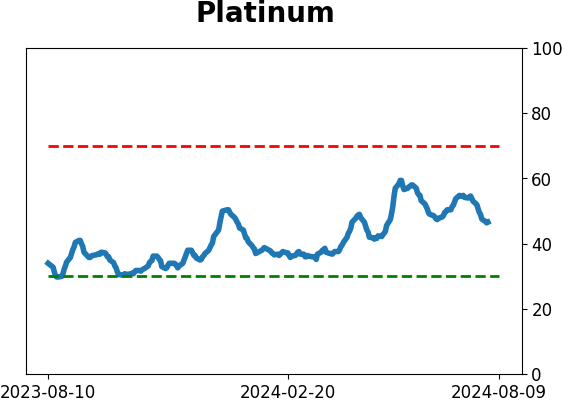
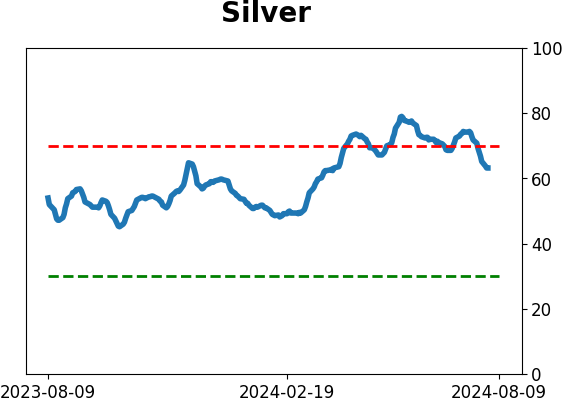
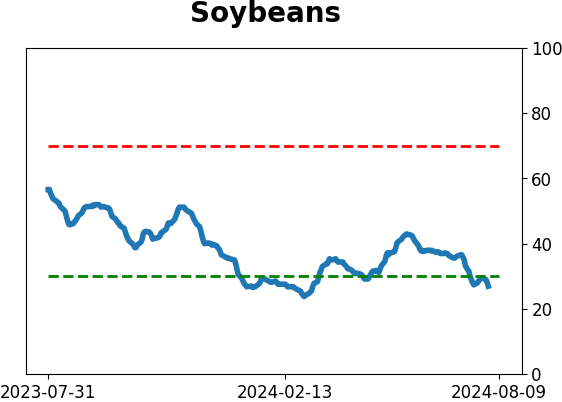
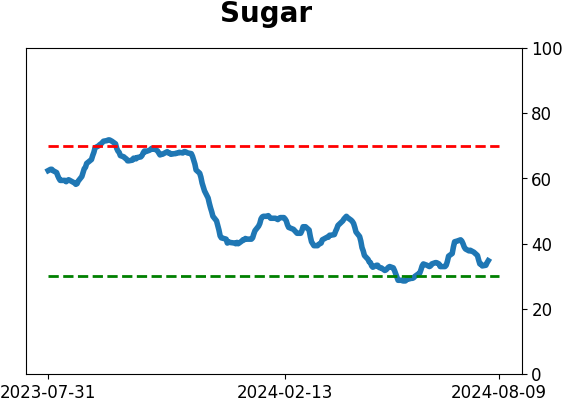
Commodity ETF's - 5-Day Moving Average
|
|