Headlines
|
|
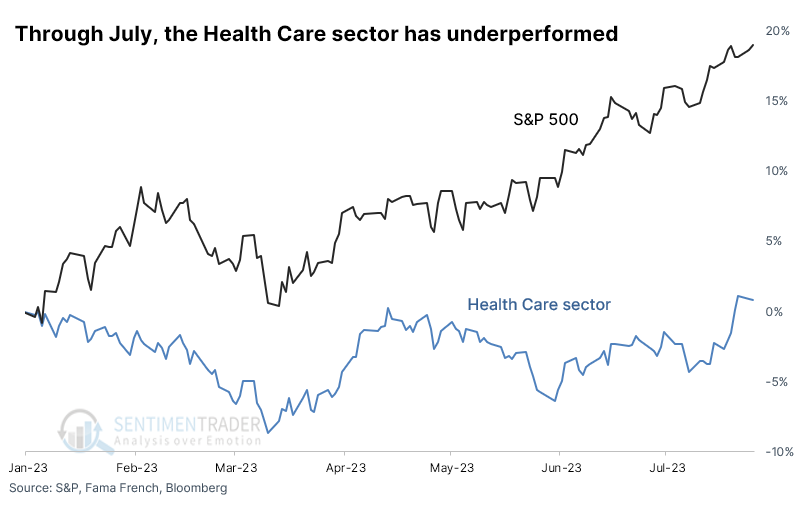
A near record bout of underperformance by Health Care:
Investors in broad market funds have enjoyed a great first six months of the year, but not all sectors participated. Health Care has underperformed by more than 18%, the 2nd-worst ever. Other years when the sector underperformed the S&P by a large amount, it tended to keep underperforming.
|
Smart / Dumb Money Confidence
|
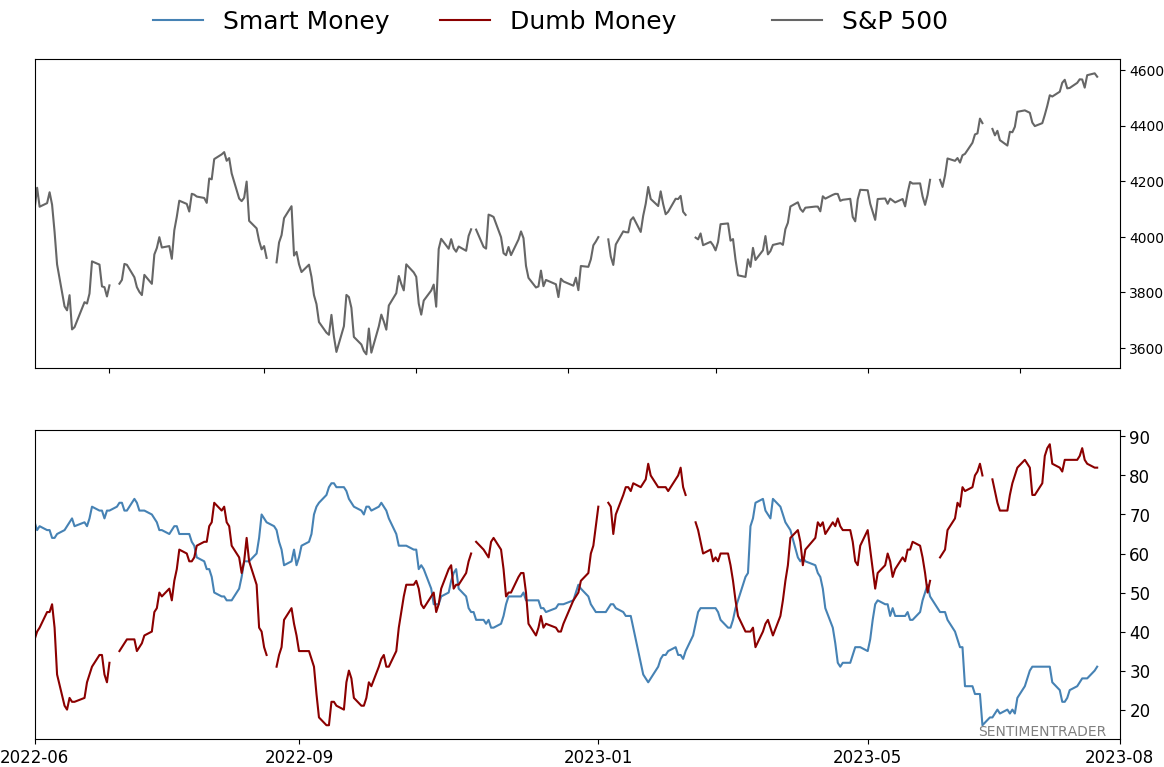
Smart Money Confidence: 31%
Dumb Money Confidence: 82%
|
|
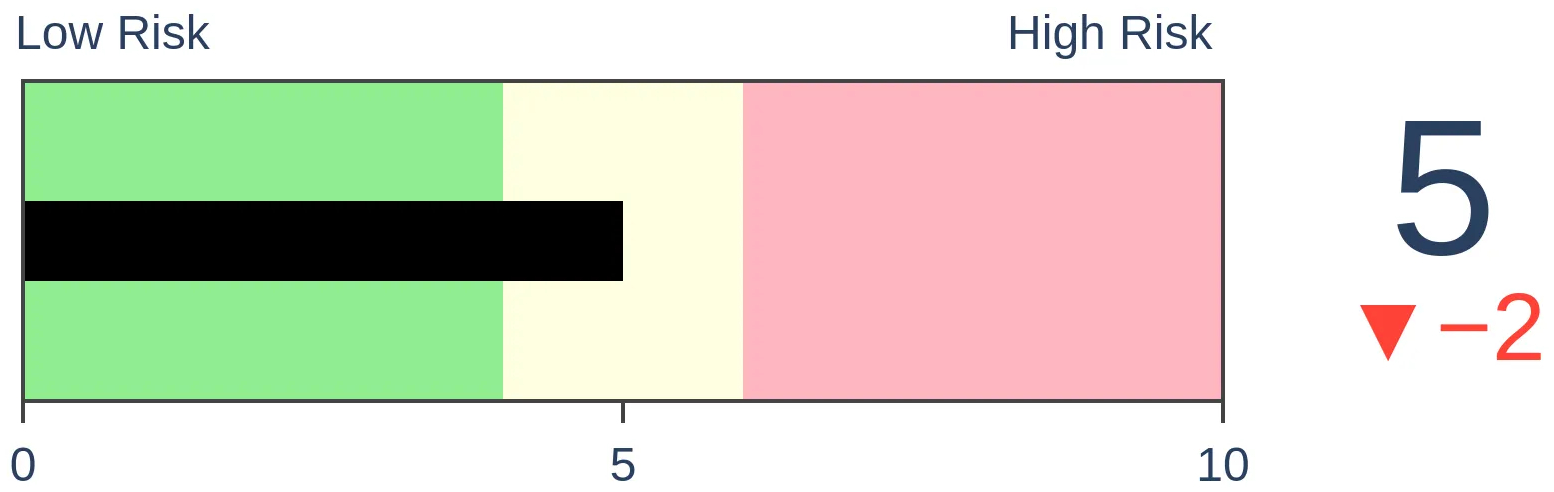
Risk Levels
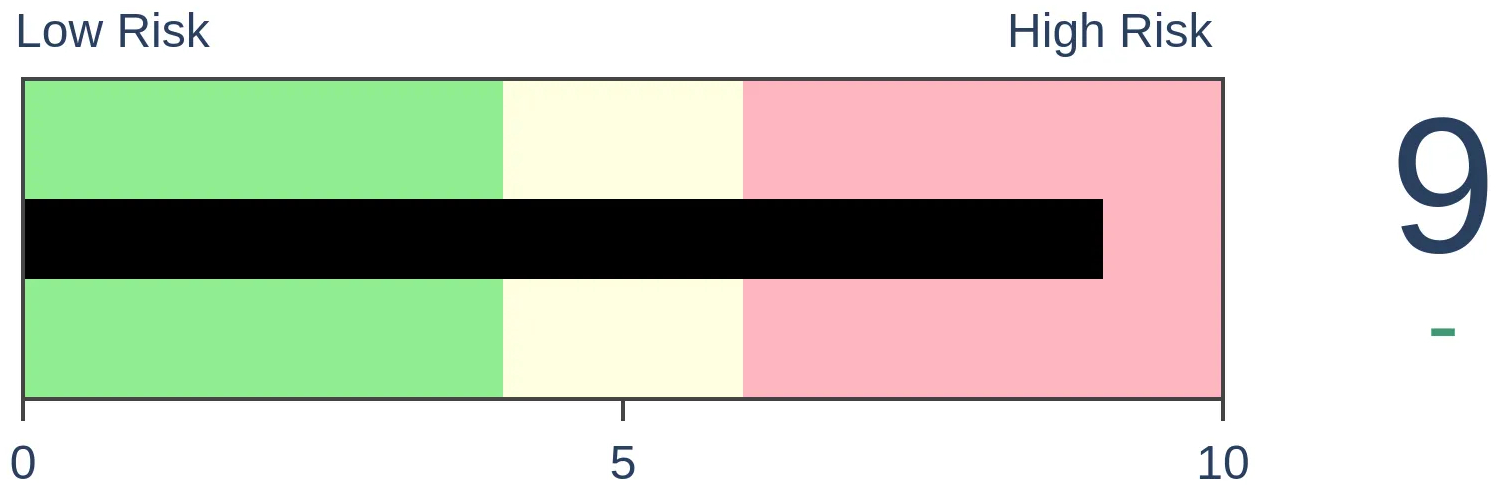
Stocks Short-Term
|
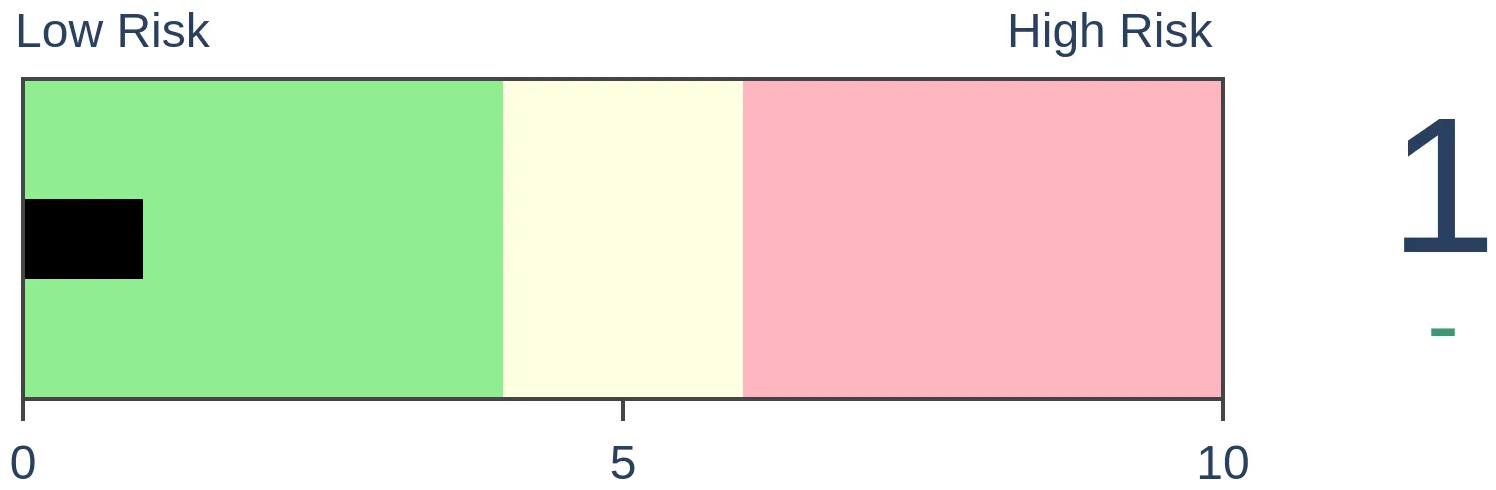
Stocks Medium-Term
|
|
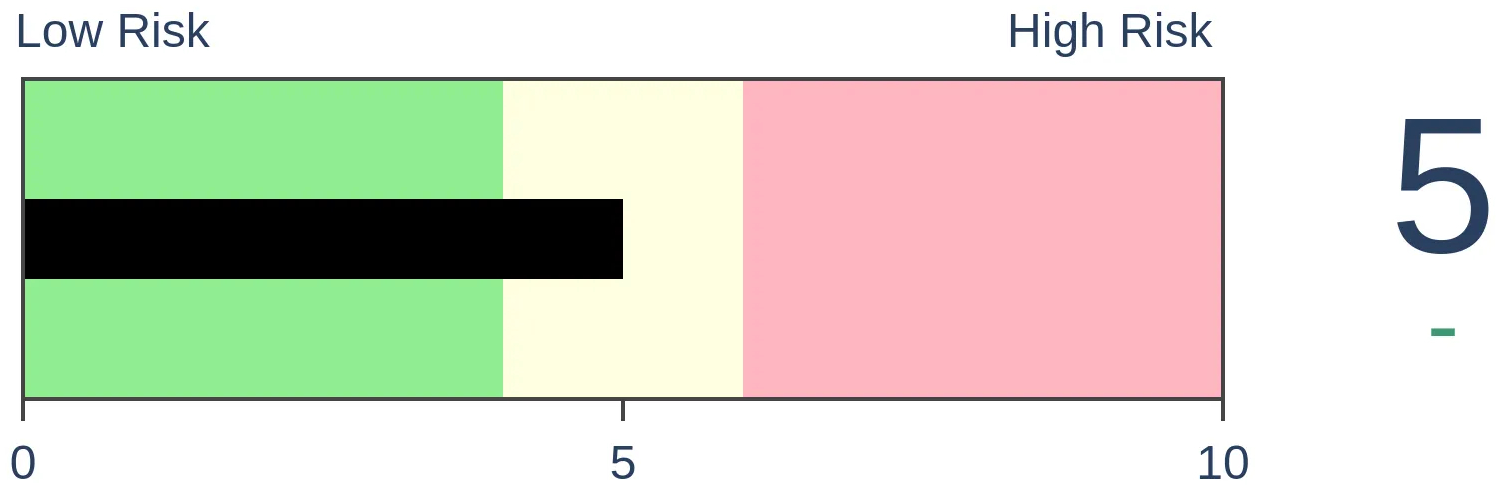
Bonds
|
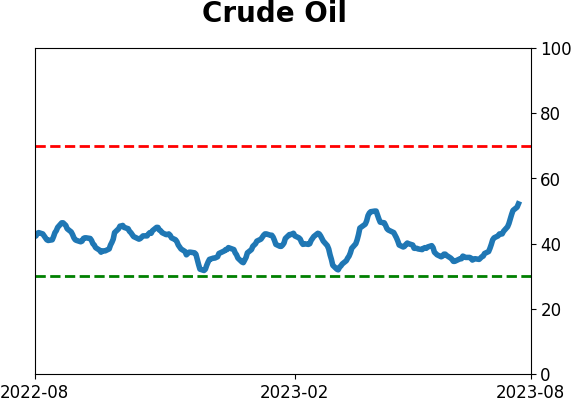
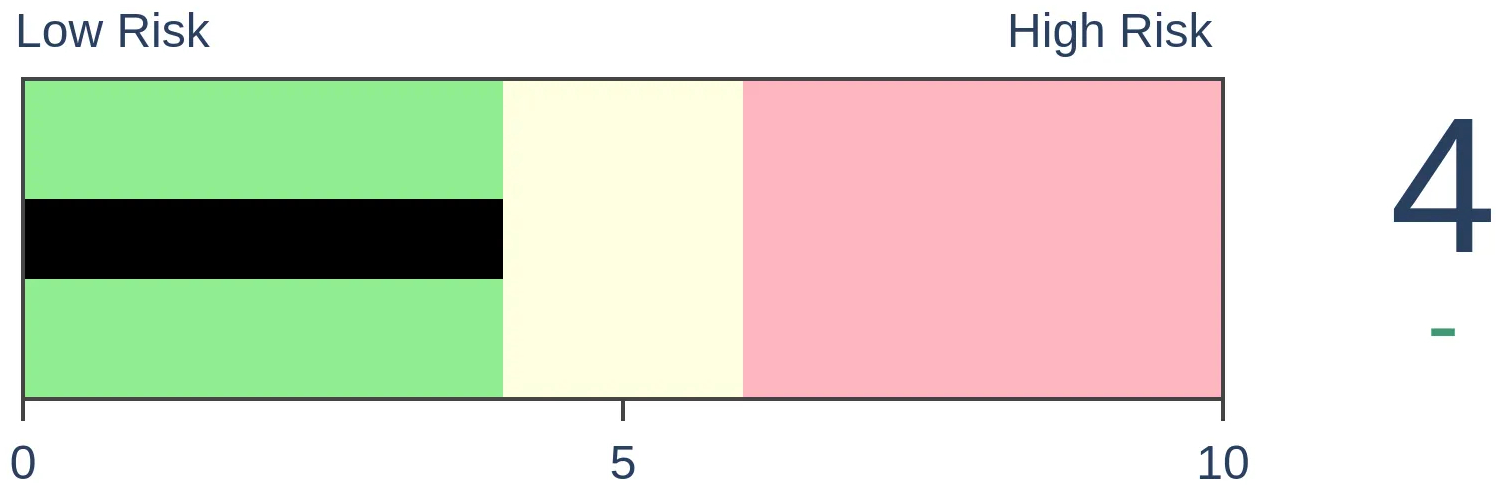
Crude Oil
|
|
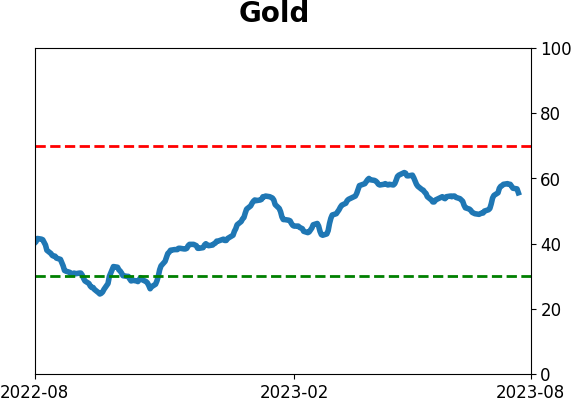
Gold

|
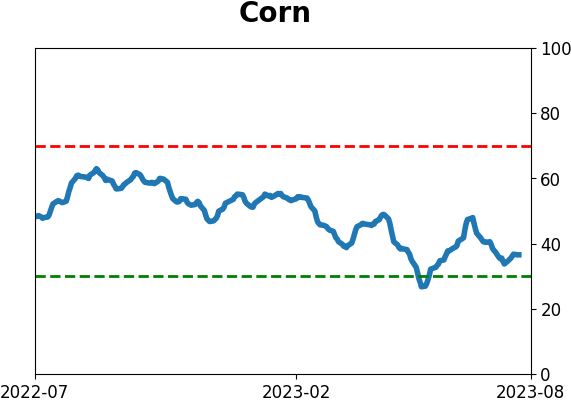
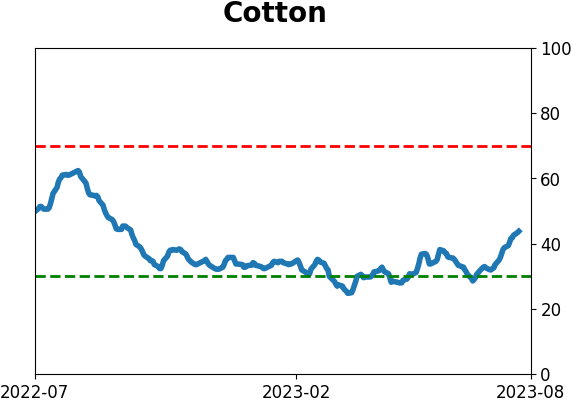
Agriculture
|
|
Research
By Jason Goepfert
BOTTOM LINE
Investors in broad market funds have enjoyed a great first six months of the year, but not all sectors participated. Health Care has underperformed by more than 18%, the 2nd-worst ever. Other years when the sector underperformed the S&P by a large amount, it tended to keep underperforming.
FORECAST / TIMEFRAME
None
|
Key points:
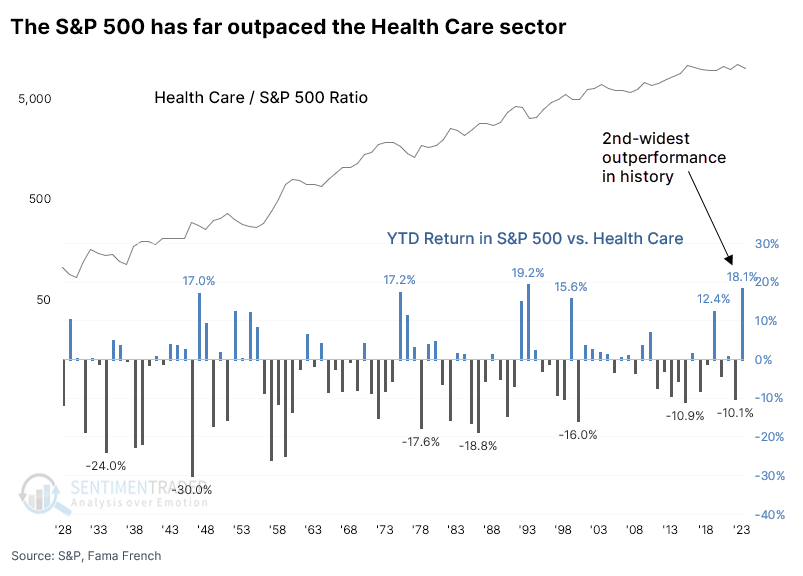
- Through 140 trading days of the year, Health Care underperformed the S&P 500 by 18%
- That's the 2nd-widest underperformance since 1928
- In other years when the sector underperformed by a lot, it tended to keep underperforming
Health Care stocks have greatly underperformed the broader market
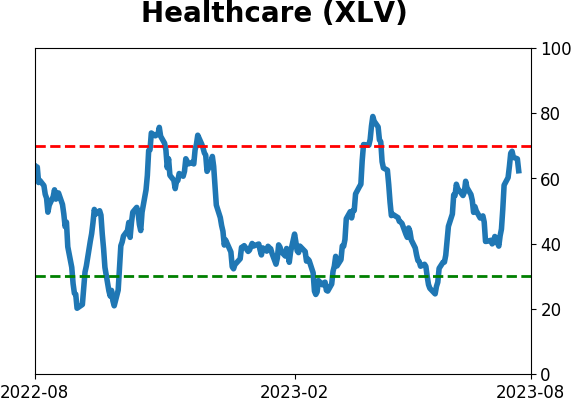
This year has been healthy for the S&P 500 but not so much for its Health Care sector. Out of the major sectors, Health Care has the fewest percentage of members trading above their 200-day moving averages.
Because of the differences in fortunes, the broader S&P index has outperformed the Health Care sector by nearly 20% year-to-date.
Through this many trading days of the year, this is the 2nd-widest spread in performance since 1928. With the broad S&P index outperforming Health Care by more than 18%, only 1993 saw a larger outperformance by the index, and that was because the index gained slightly while investors sold Health Care heavily.
Underperforming Health Care showed lackluster signs of reversing
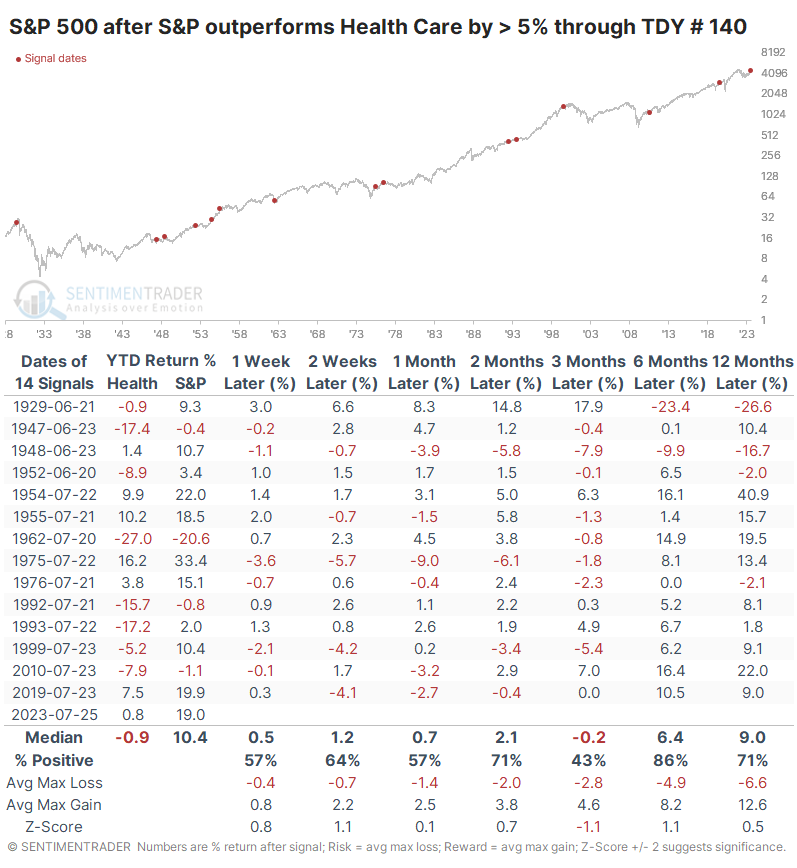
For the broad S&P 500, these bouts of outperformance tended to be a good sign, with above-average returns across almost all time frames. While its returns over the next three months were unimpressive, the index was higher 86% of the time by six months later. Every signal since the index became a 500-stock index showed a gain over the next six months.
For the Health Care sector, it wasn't such a rosy story. There was not much mean-reversion after the stocks underperformed the index by so much. Over the next six months, the sector gained only 43% of the time, with a negative median return and average risk of more than -9%.
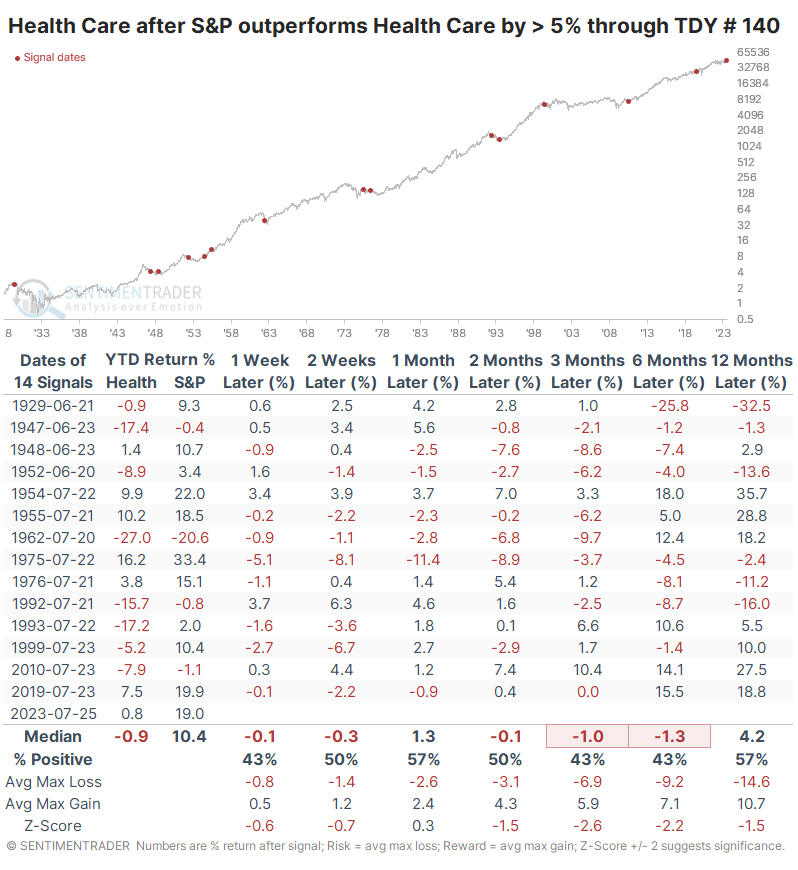
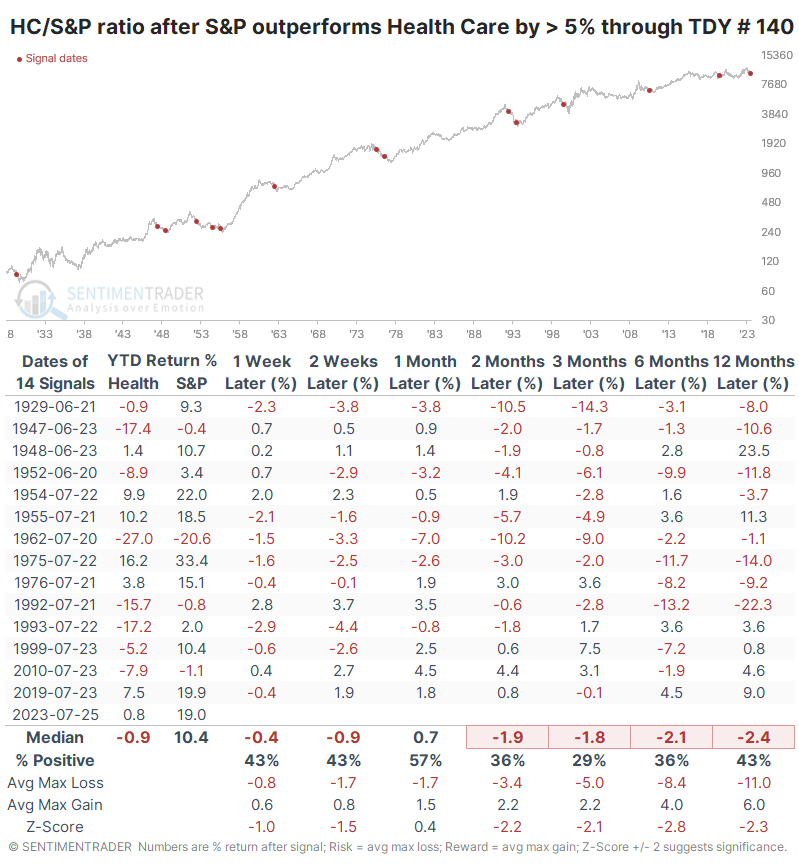
The ratio of the S&P 500 to the Health Case sector shows this relationship more clearly. The sector's relative returns were inferior over the next two to six months, with a low win rate, poor median return, and an unappetizing risk versus reward profile.
What the research tells us...
When a sector greatly under- (or out-) performs a broader index, contrarian investors tend to believe that mean-reversion is only a matter of time. Sometimes it works consistently, but it depends on the sector, the time frame, and the magnitude of the performance differential. When it comes to the Health Care sector, when it has modestly to severely underperformed the S&P 500 through the latter part of July, it has struggled to show consistent signs of mean reversion. Most often, it continued to underperform for the year.
Indicators at Extremes
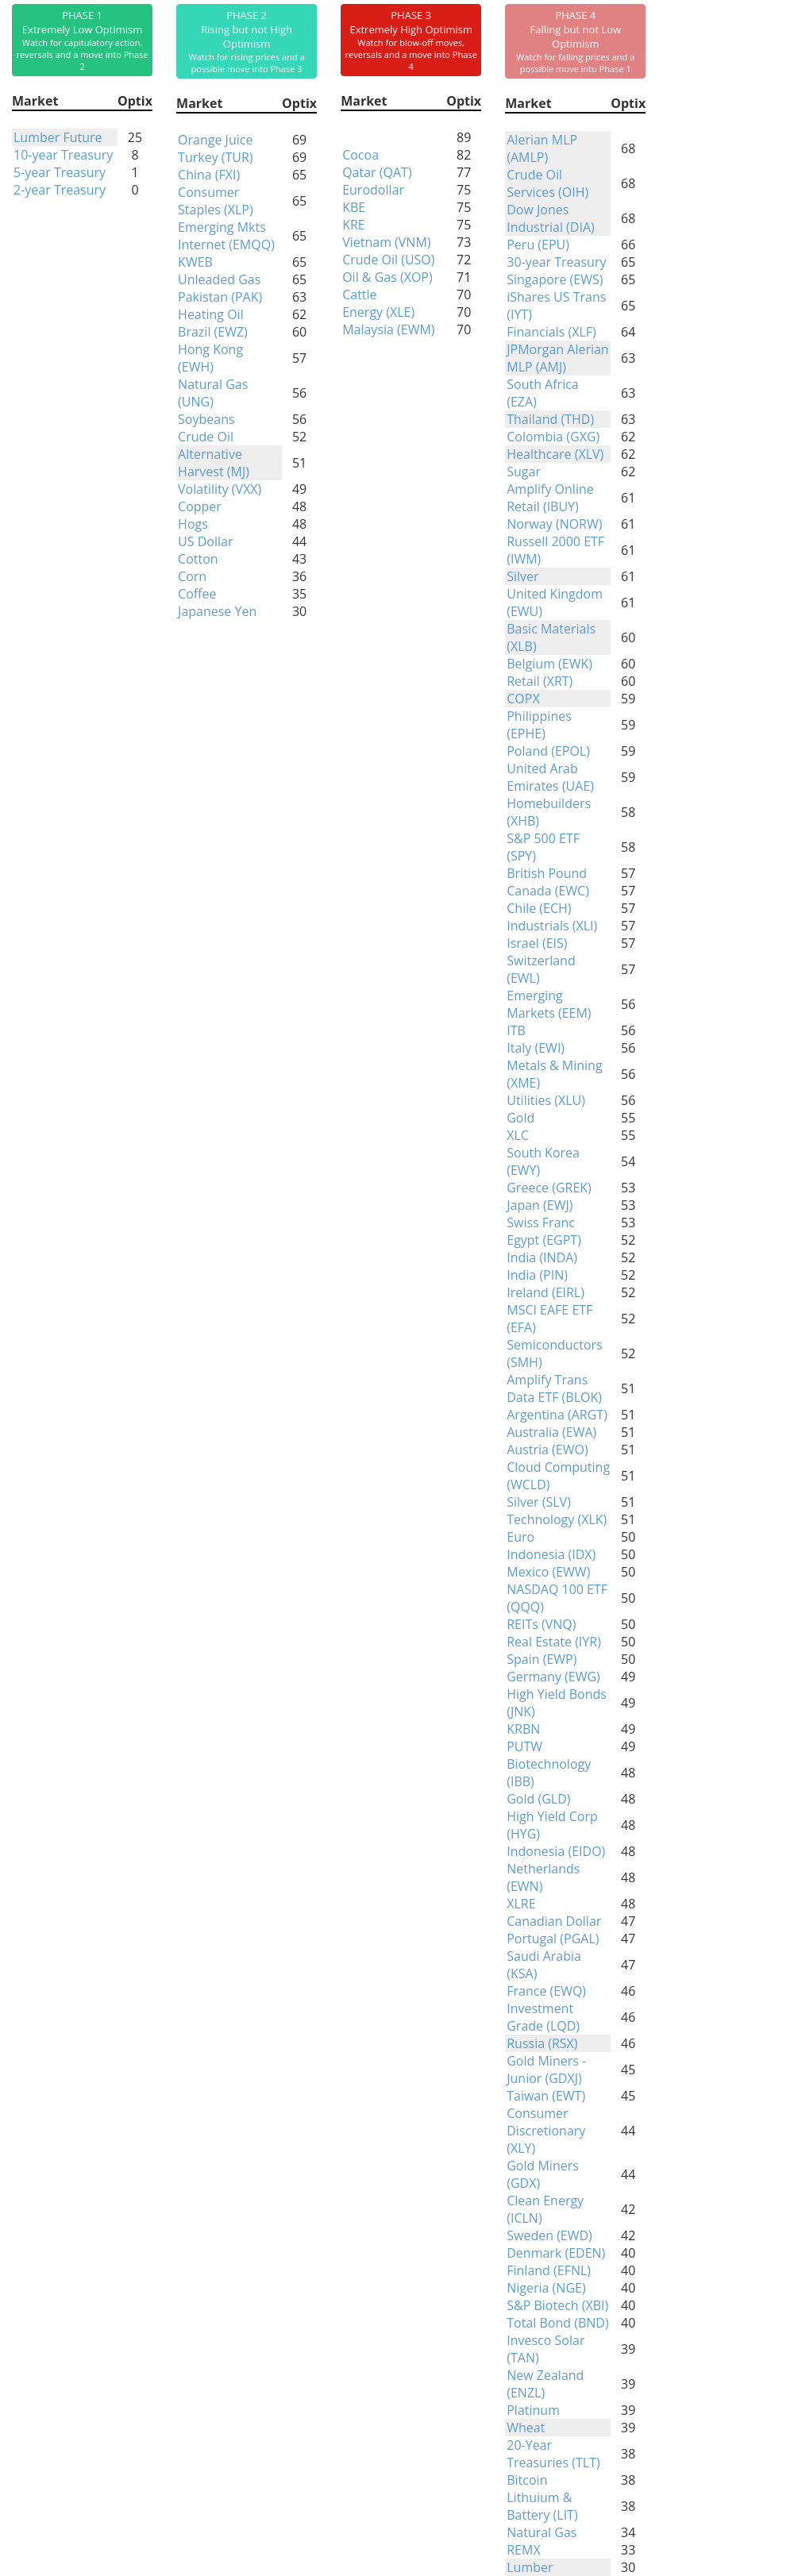
Phase Table
Ranks
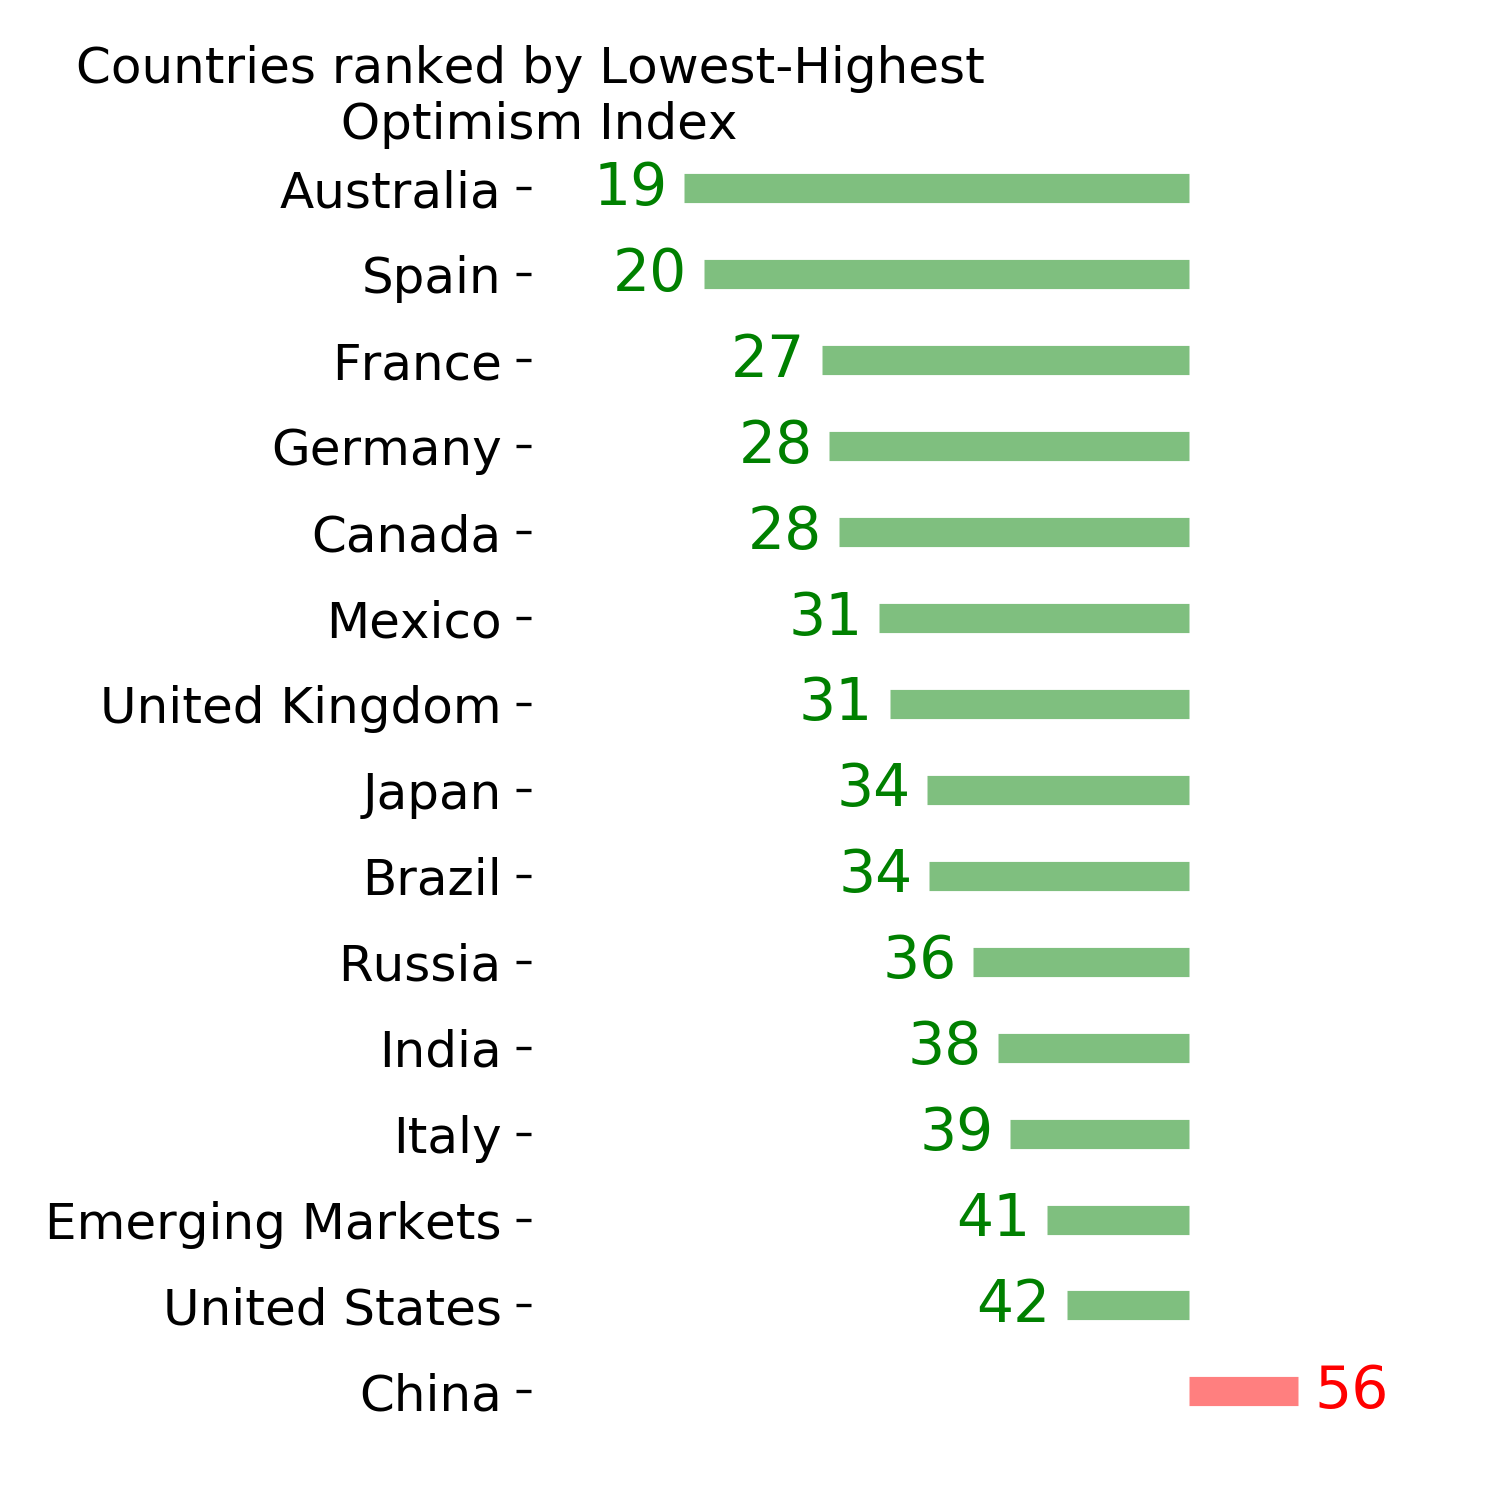
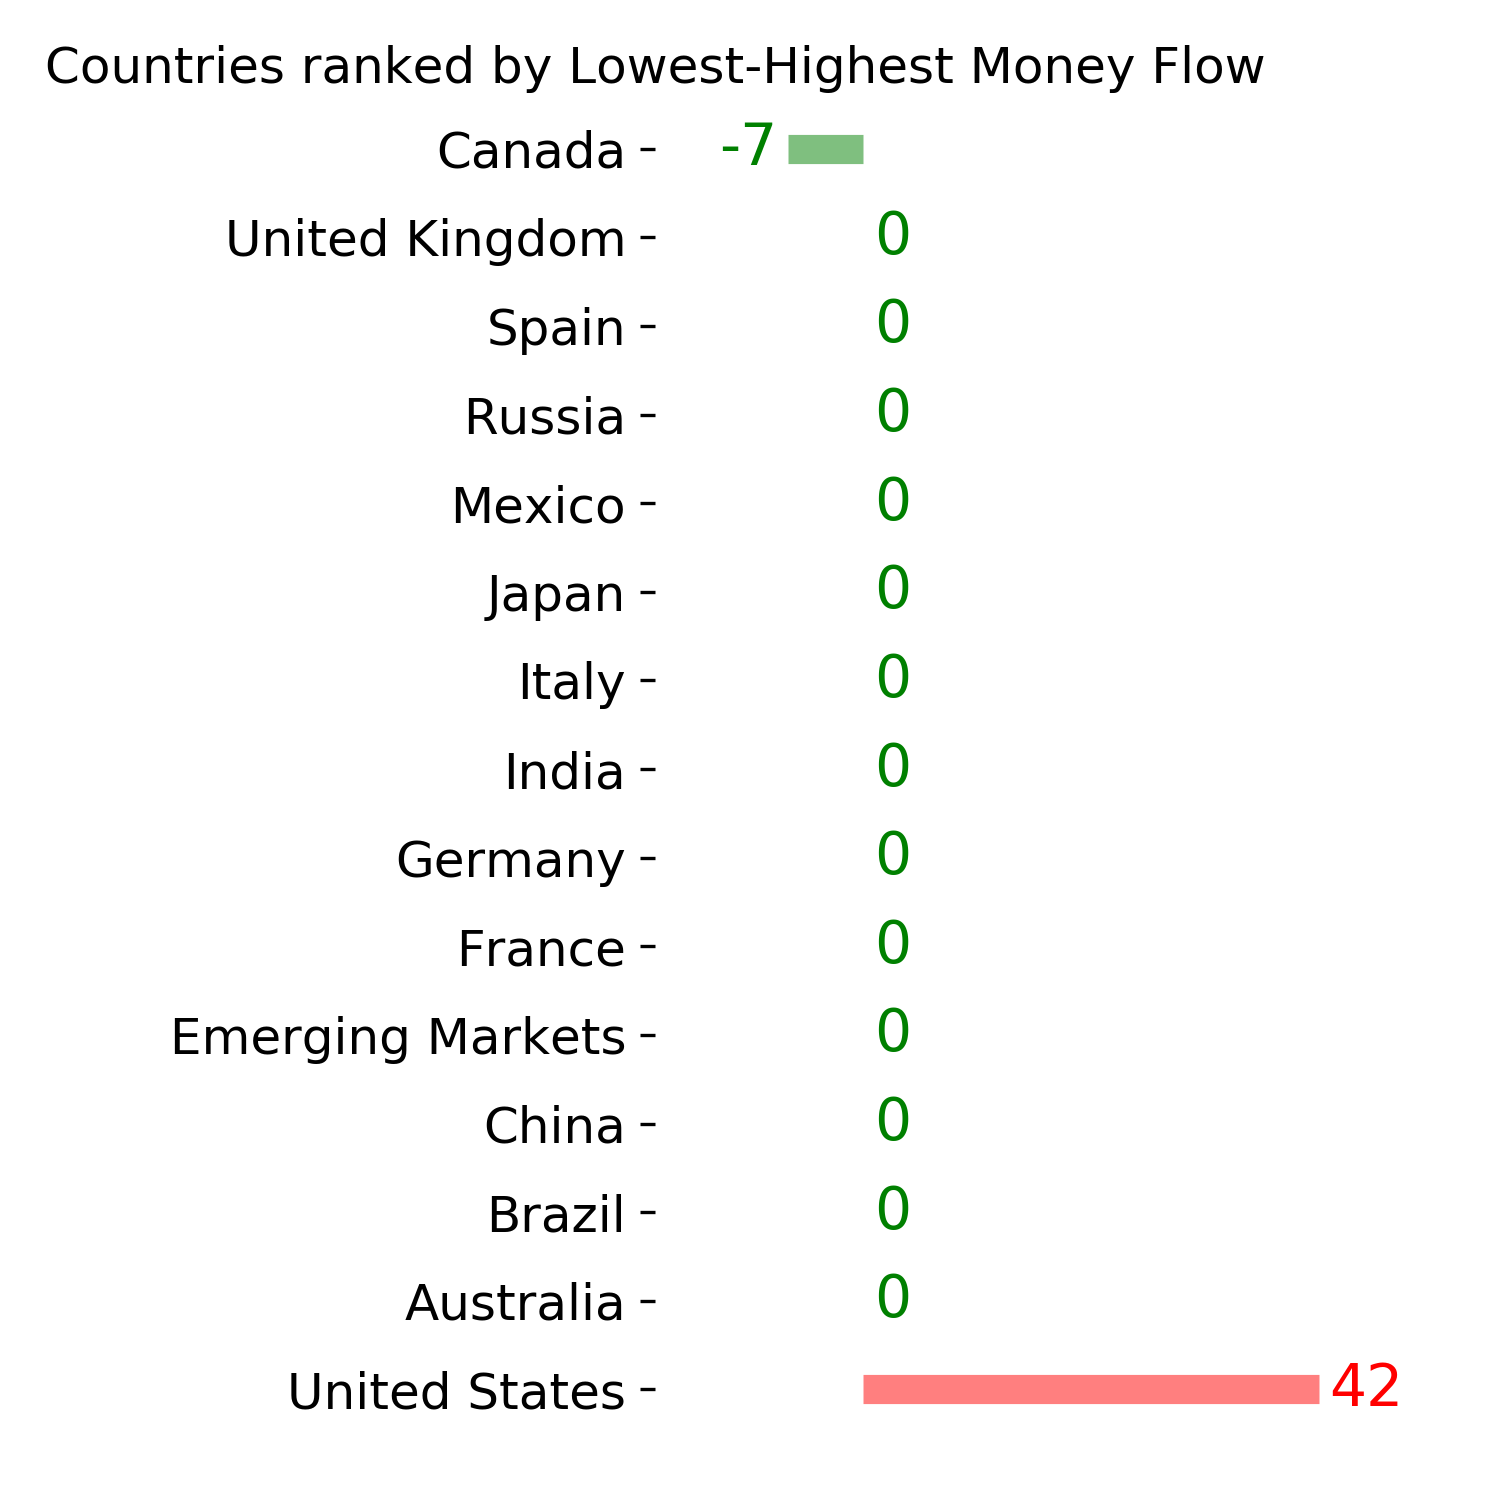
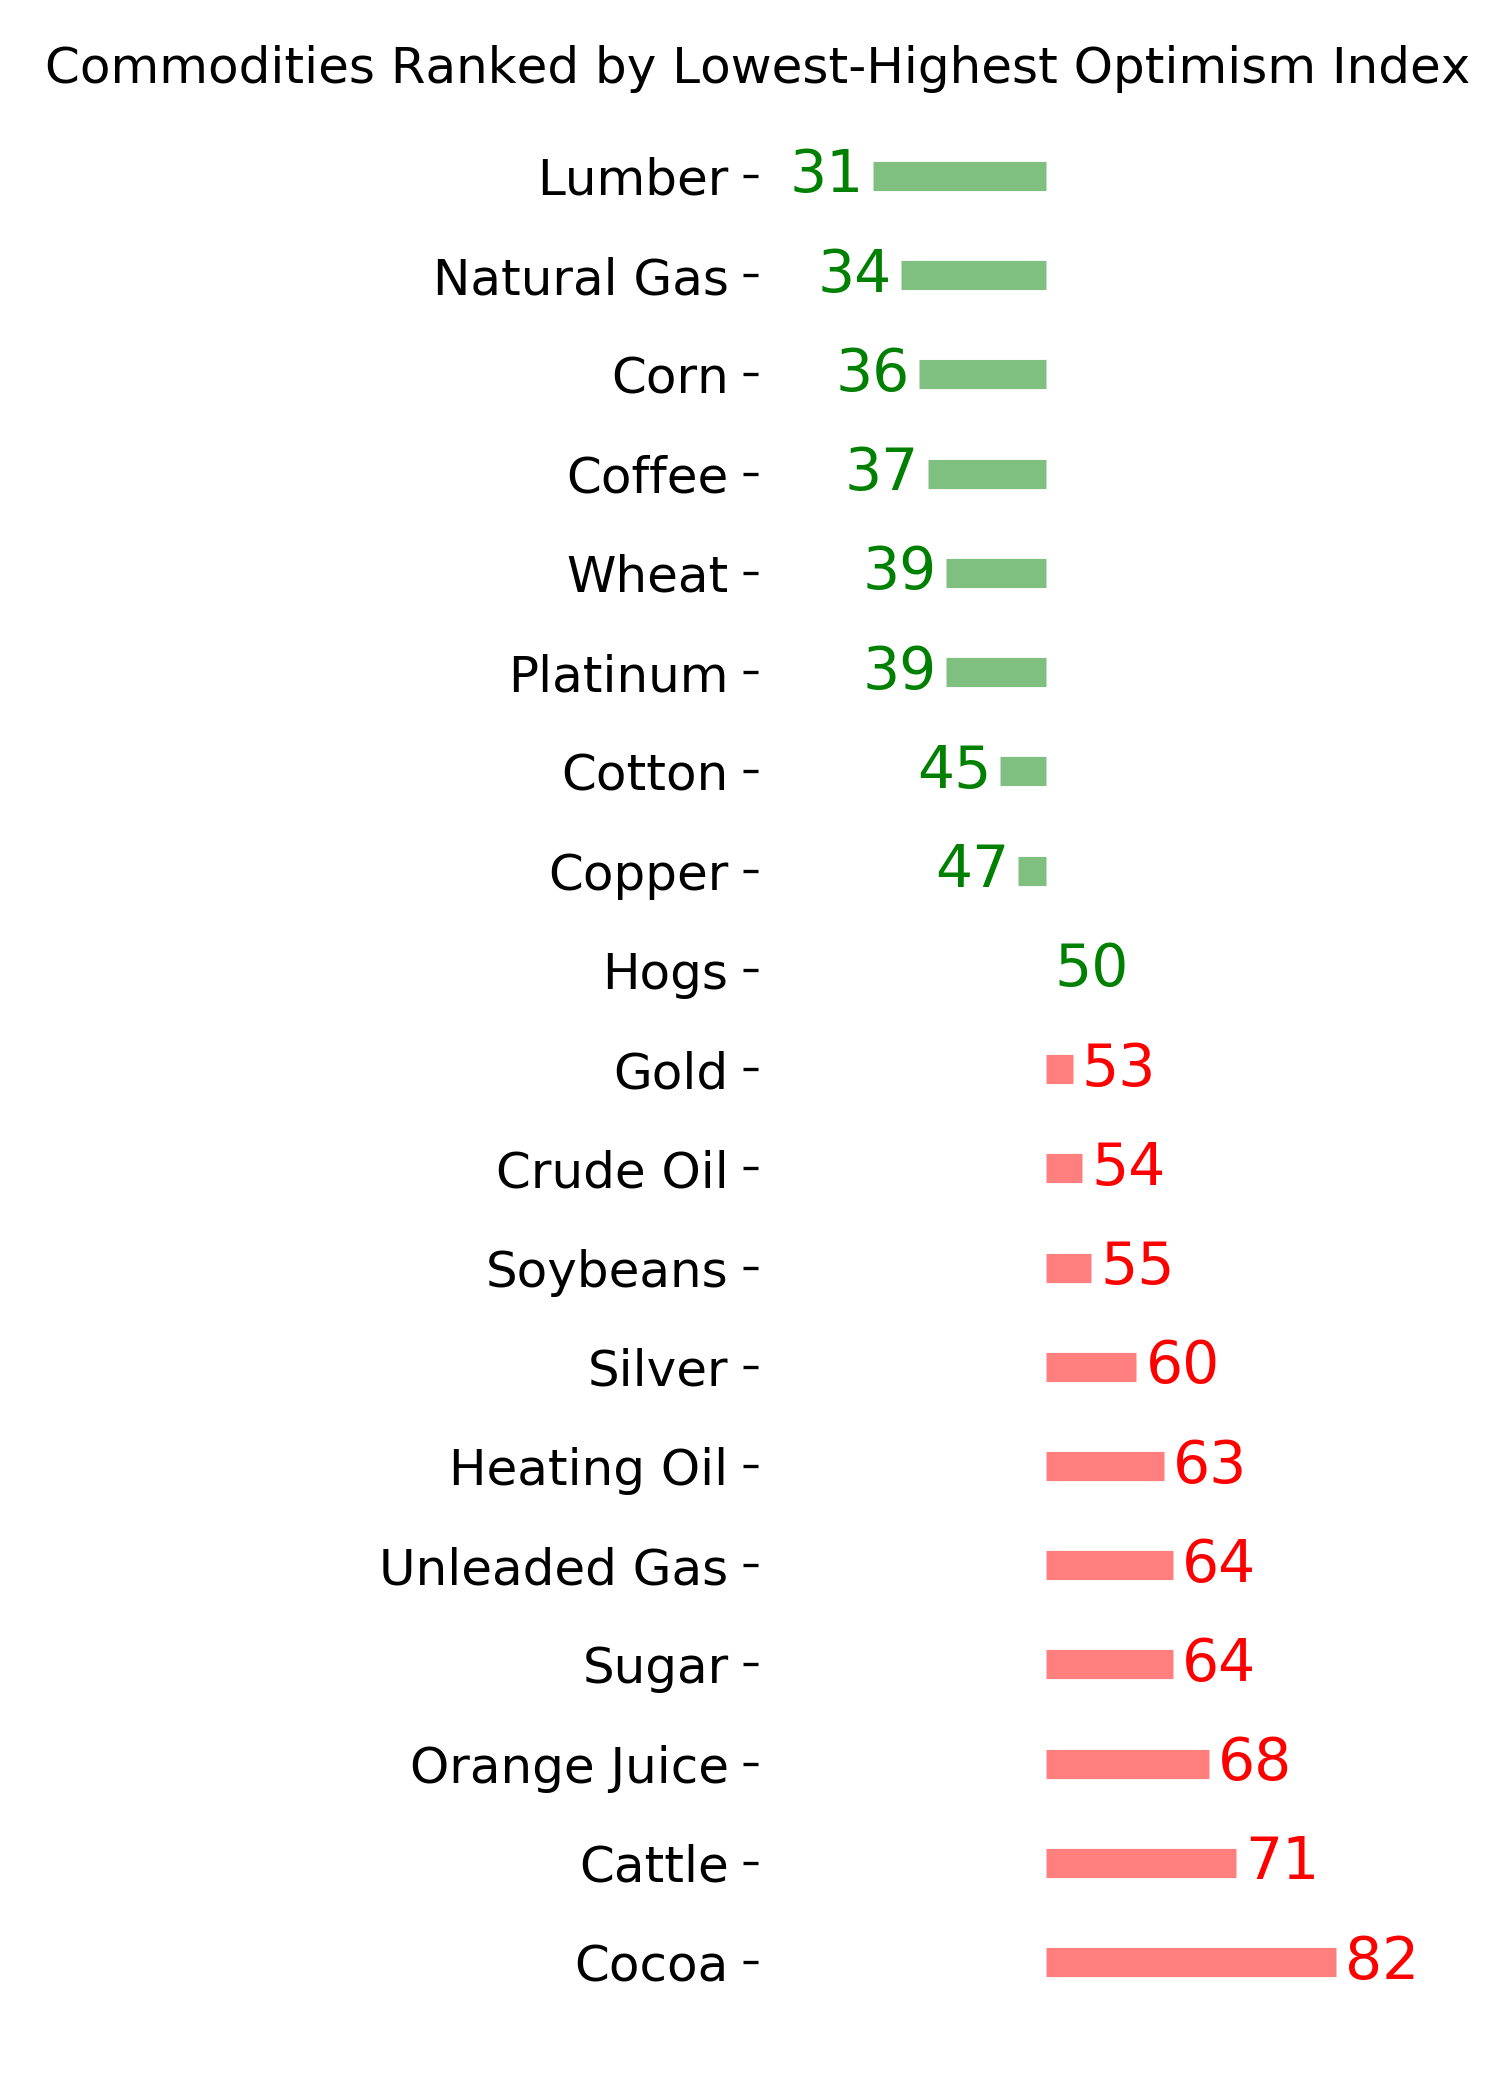
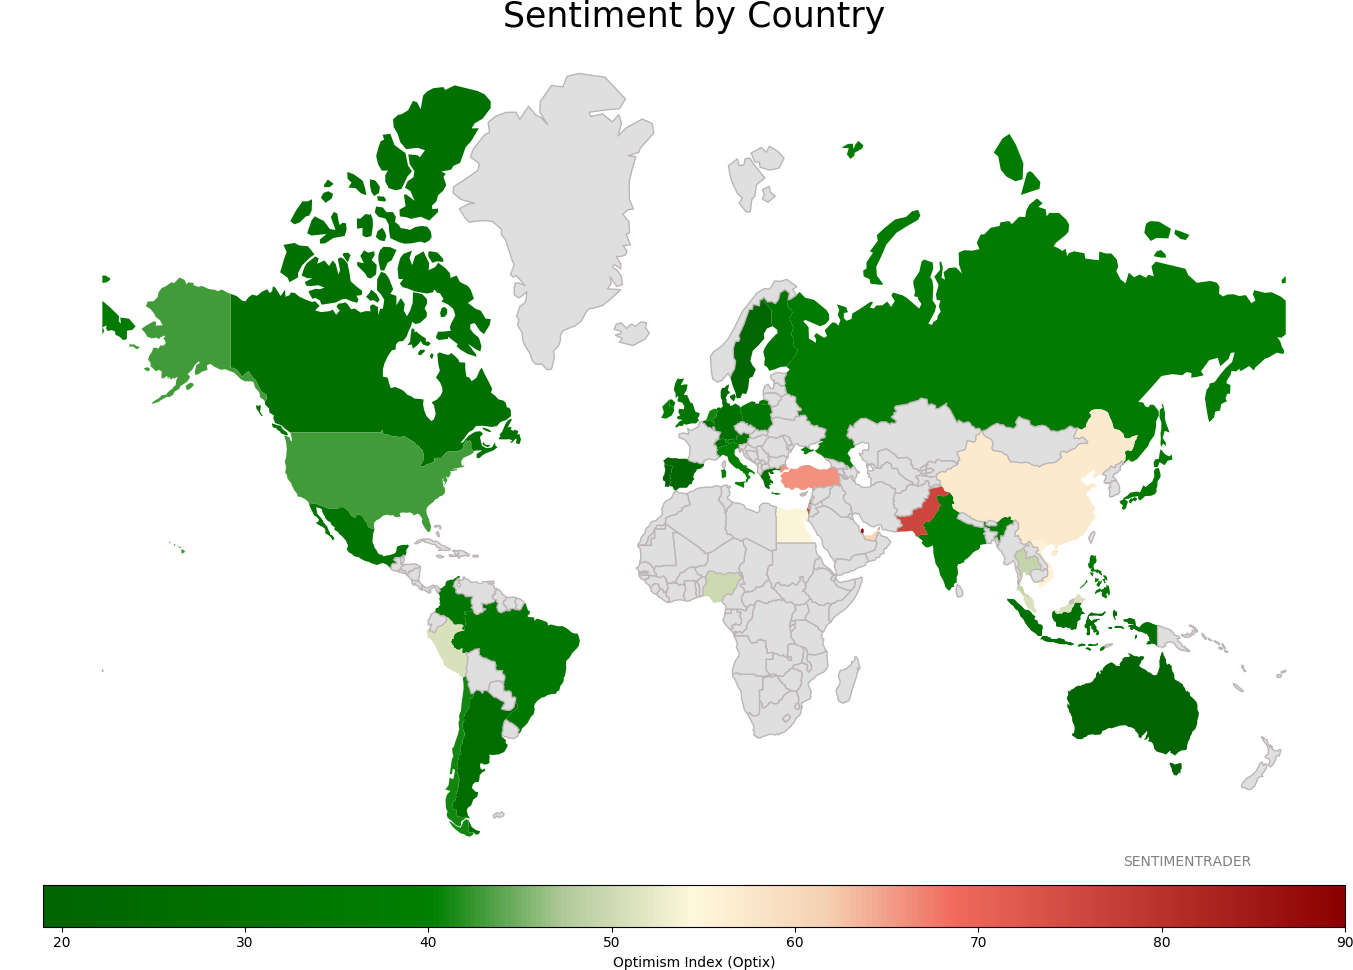
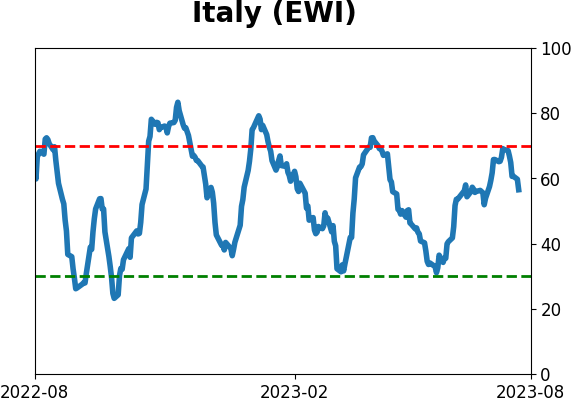
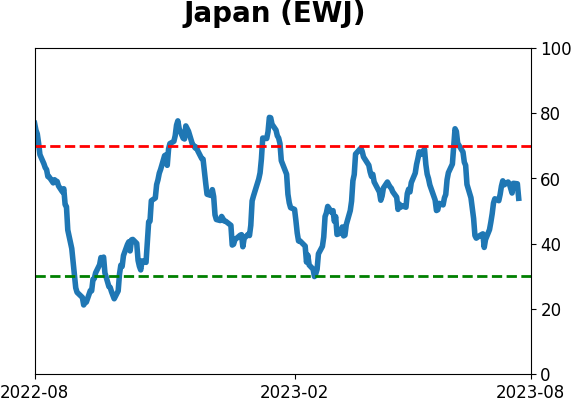
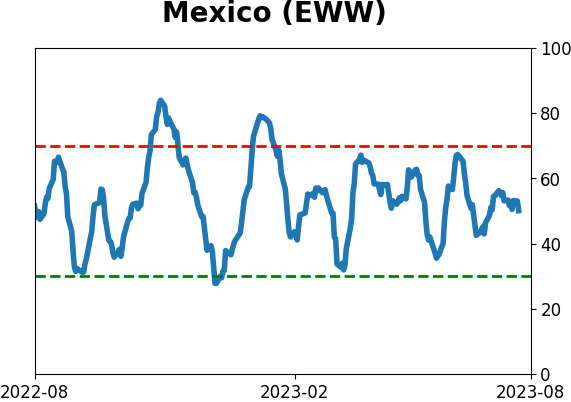
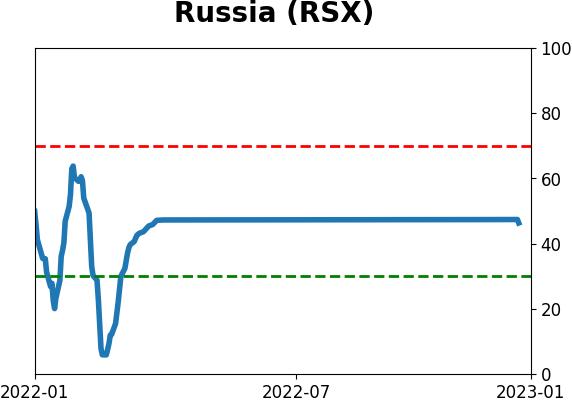
Sentiment Around The World
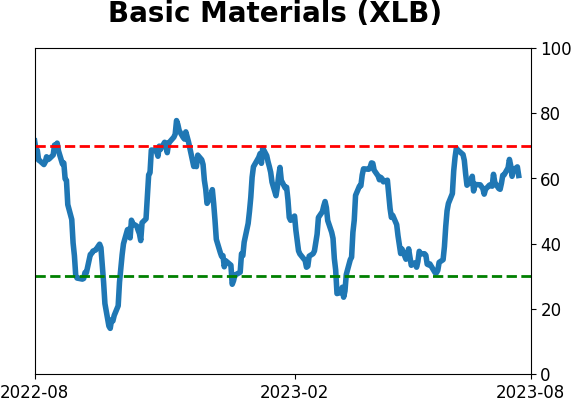
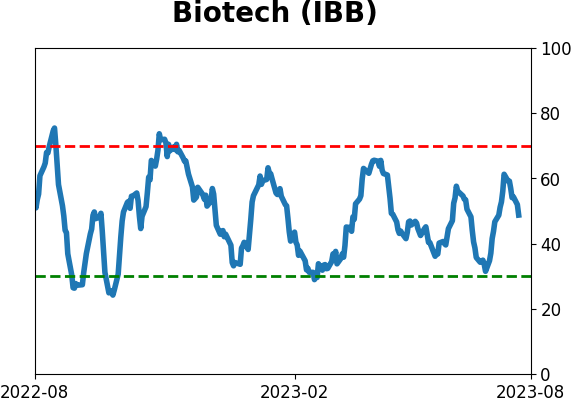
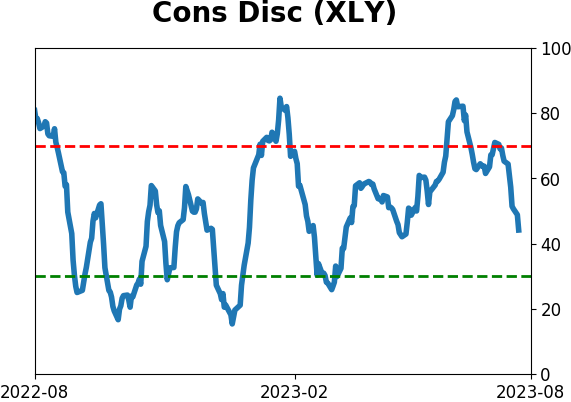
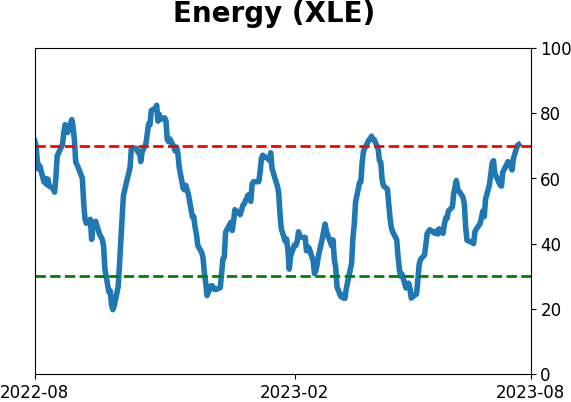
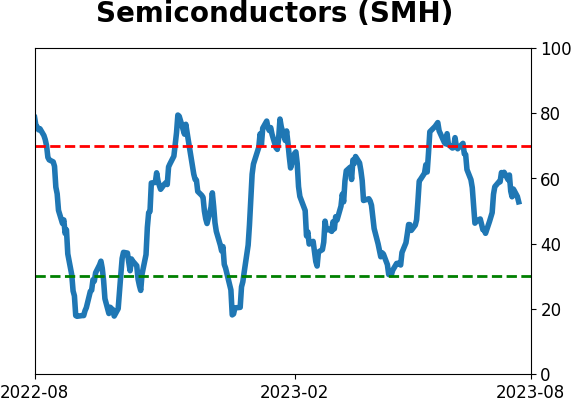
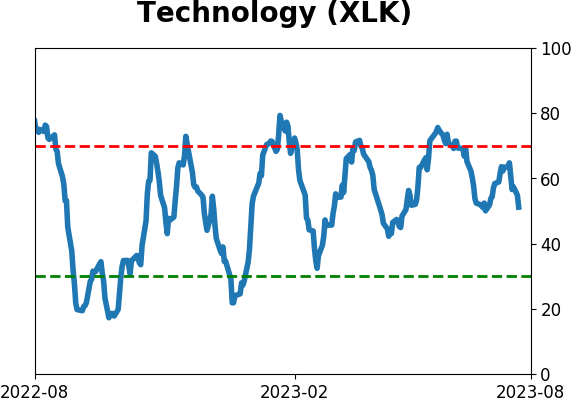
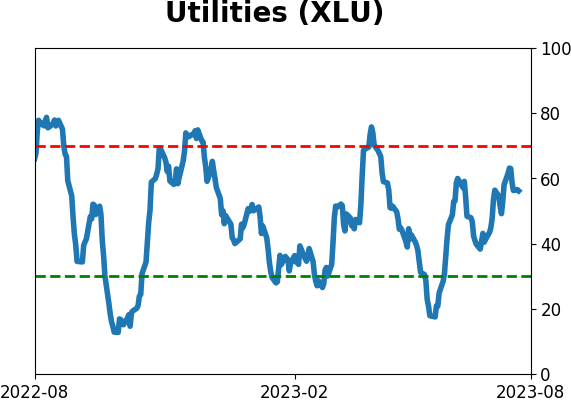
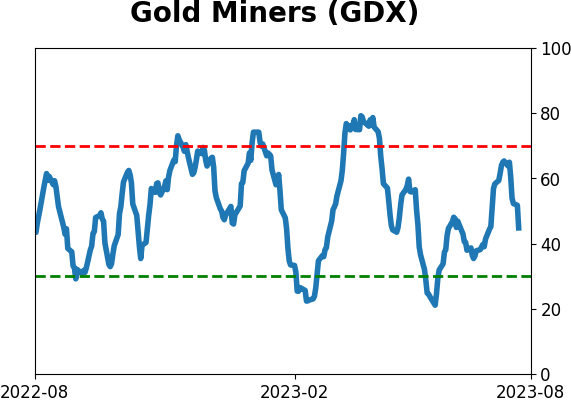
Optimism Index Thumbnails
|
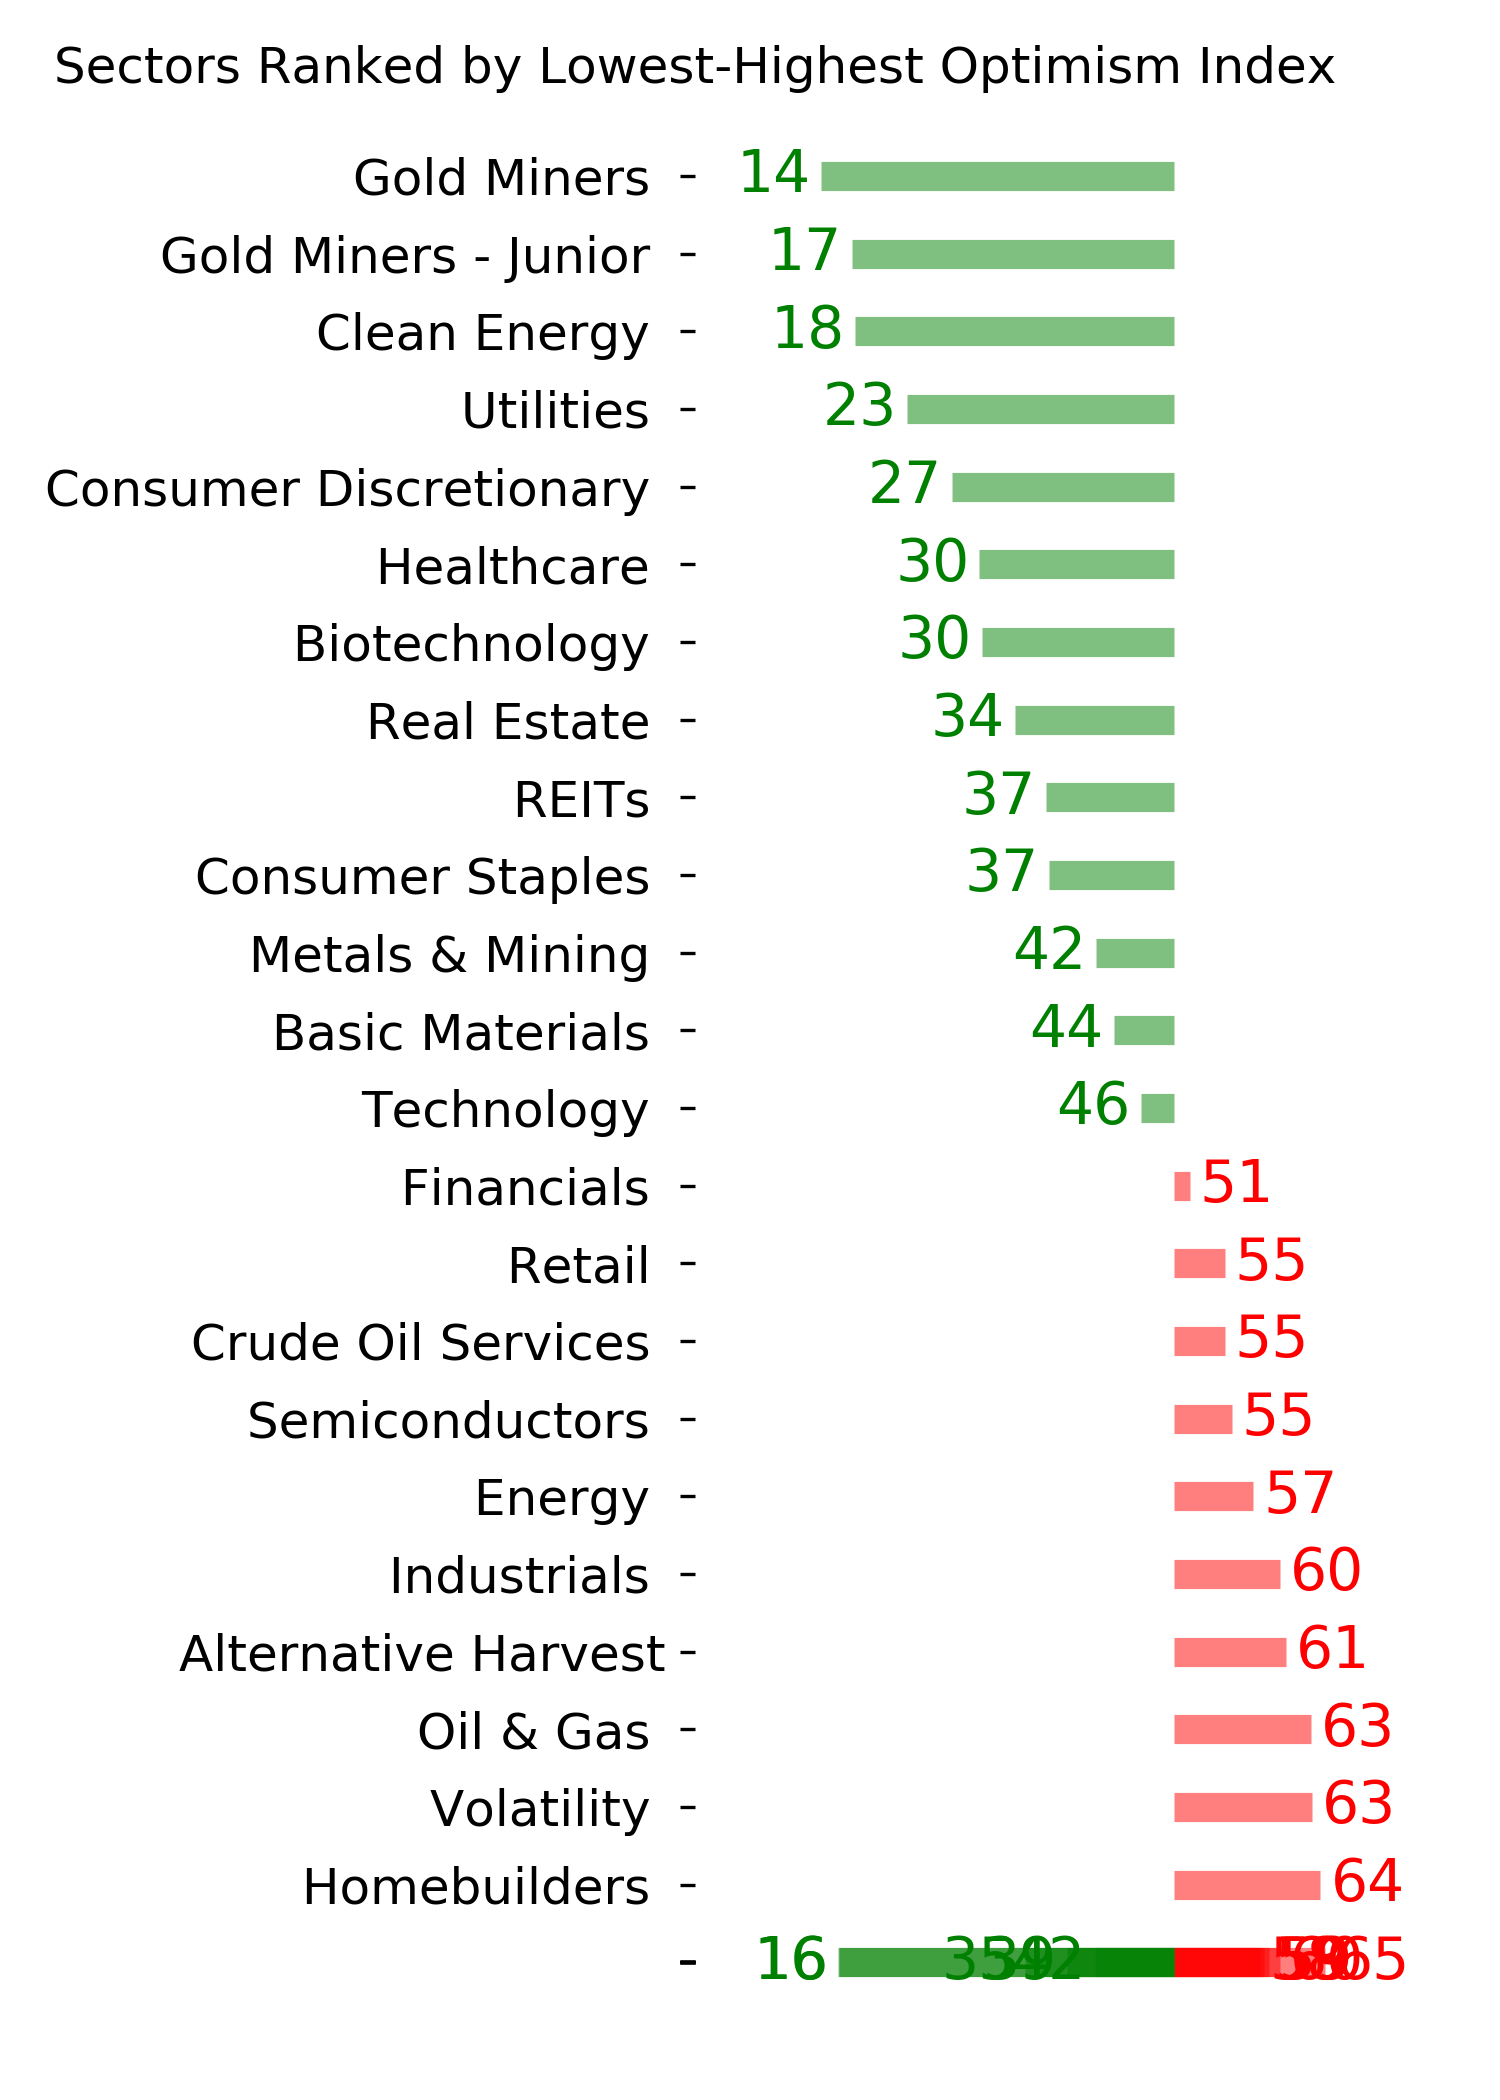
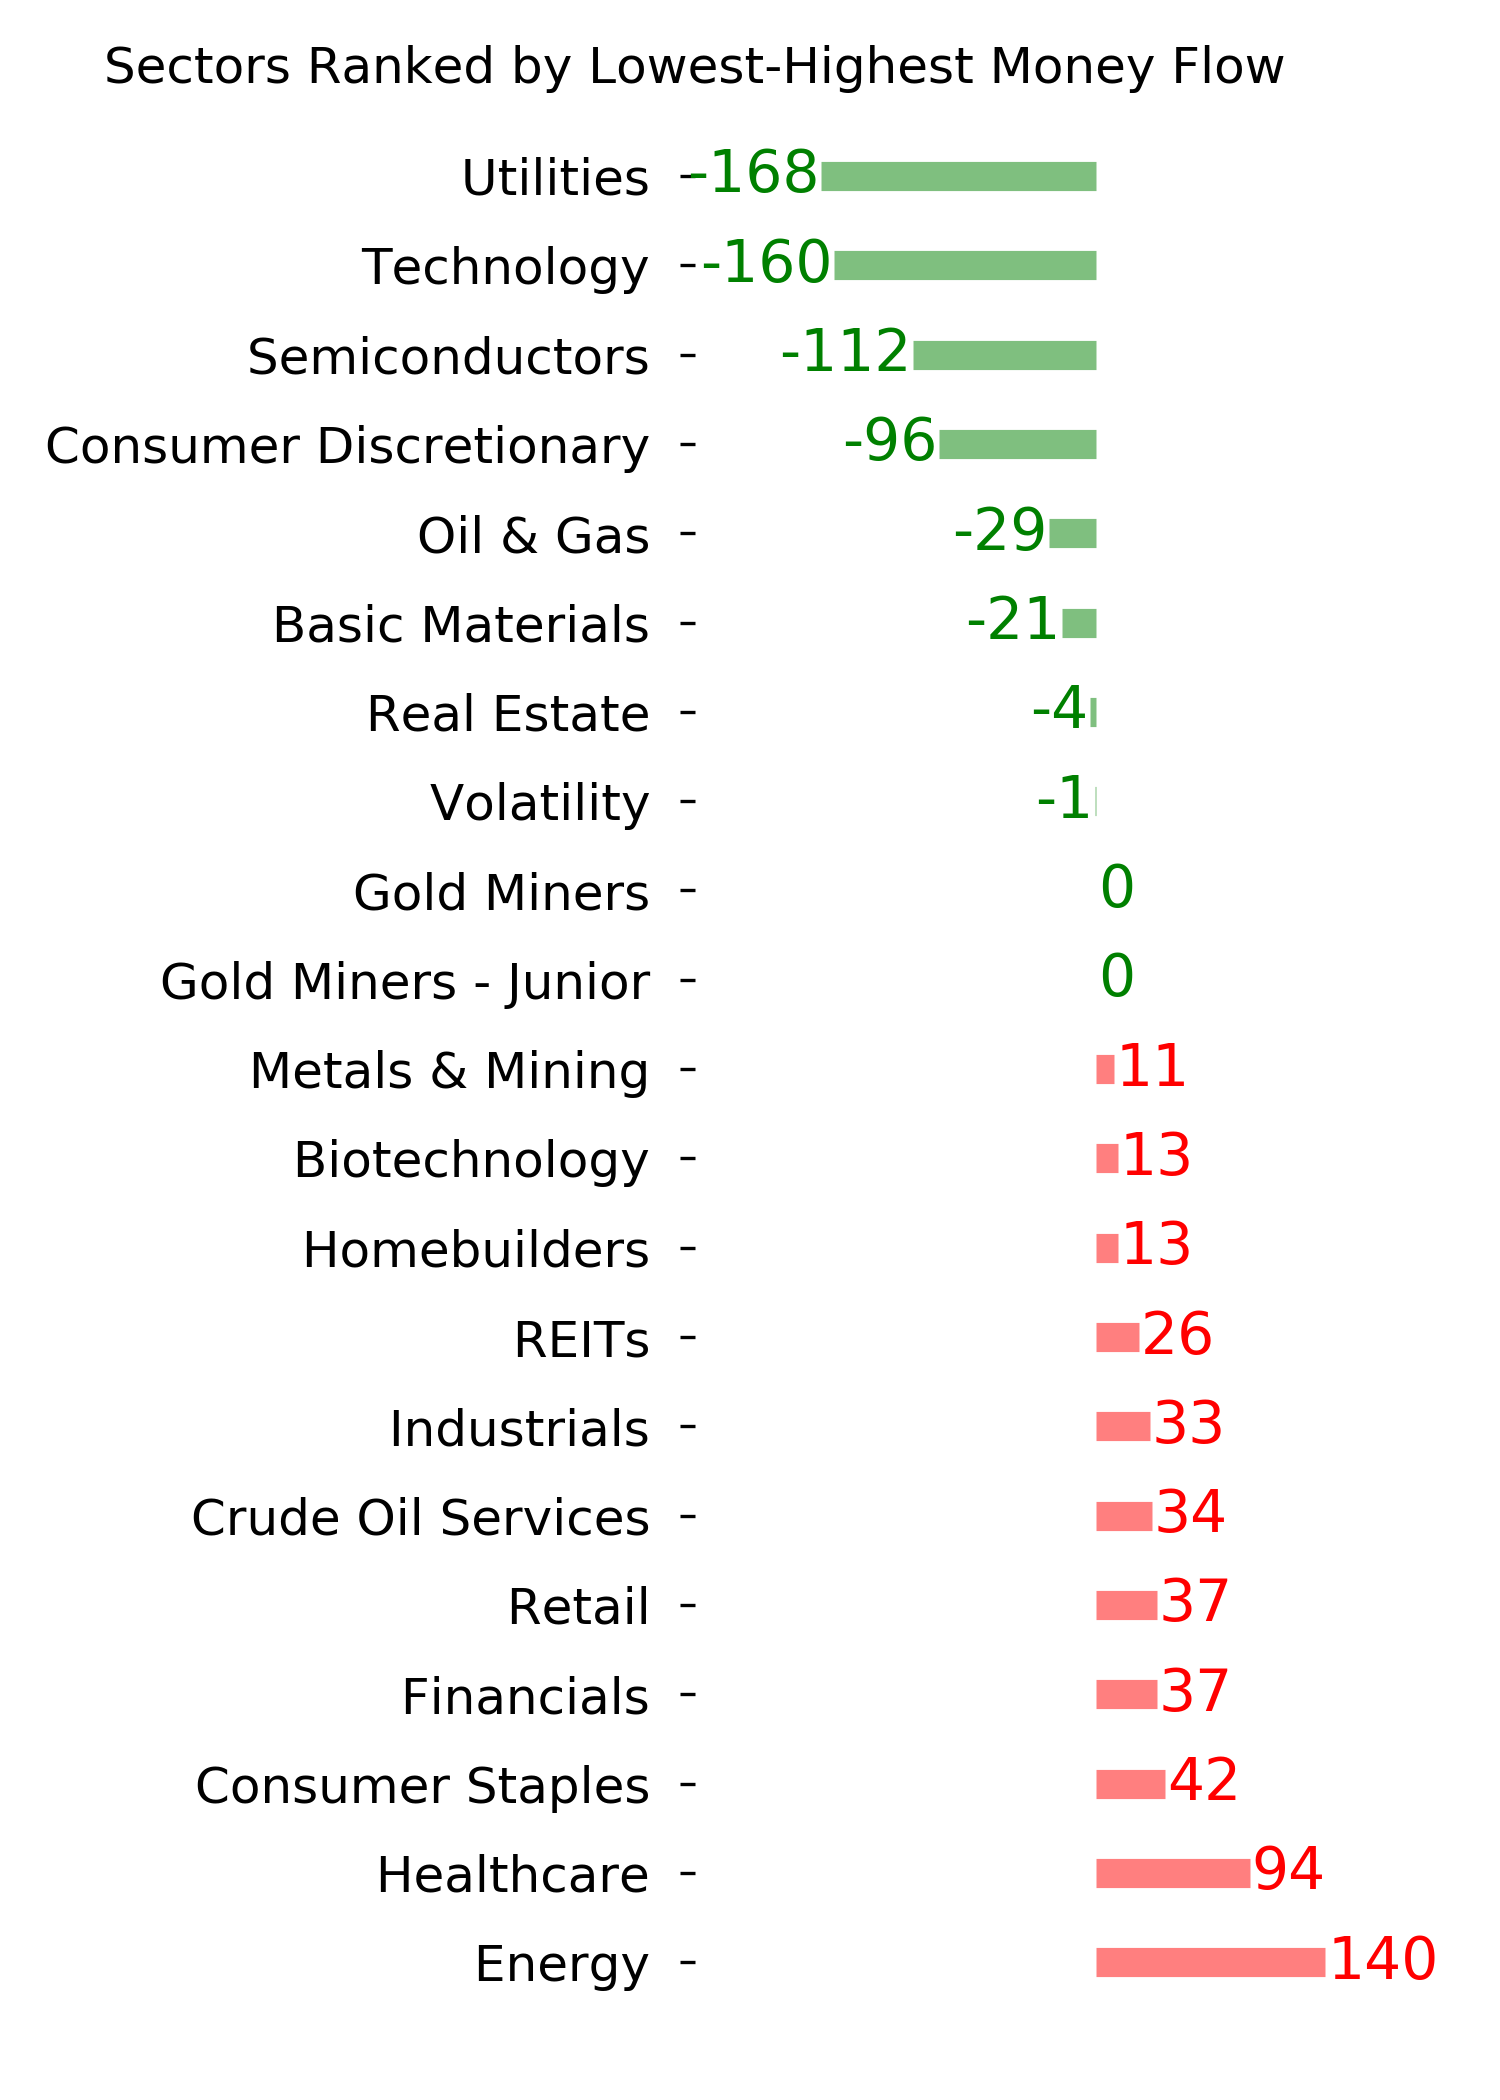
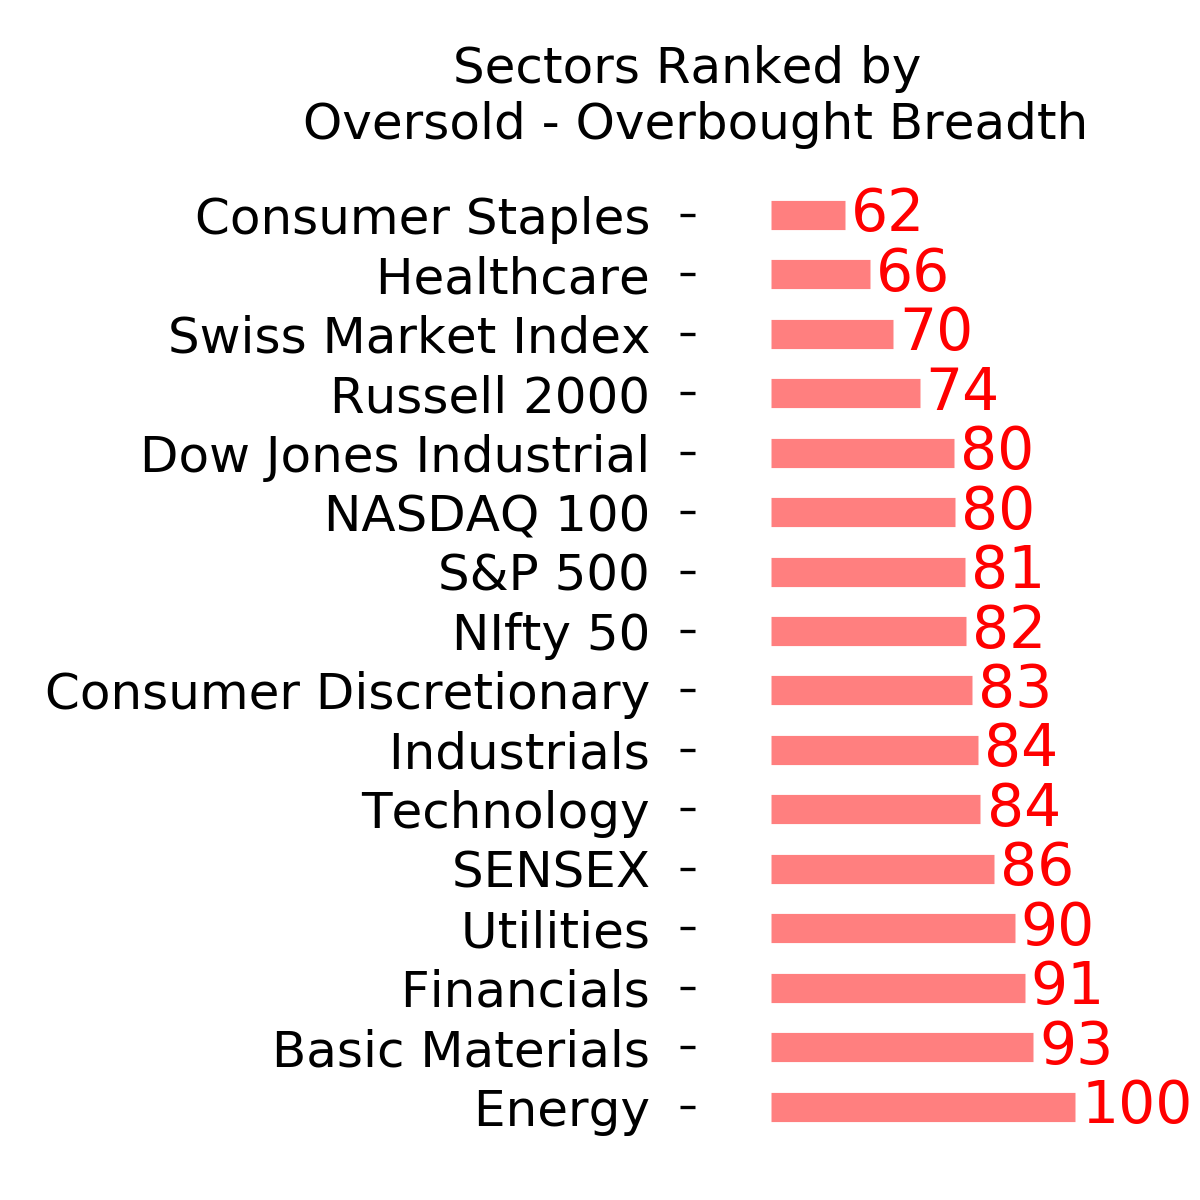
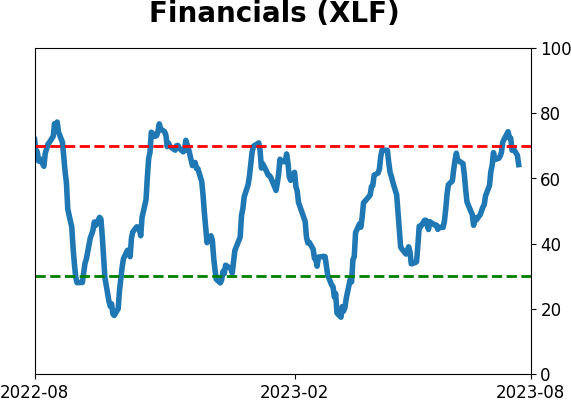
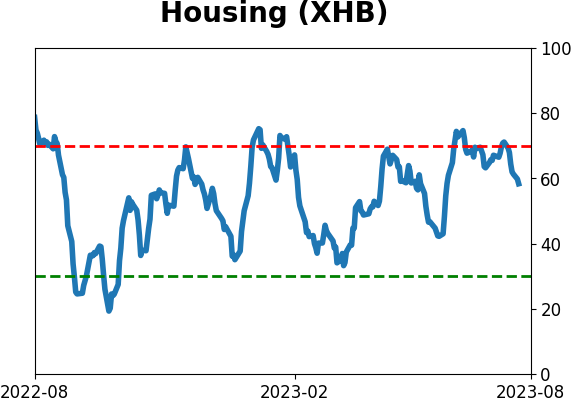
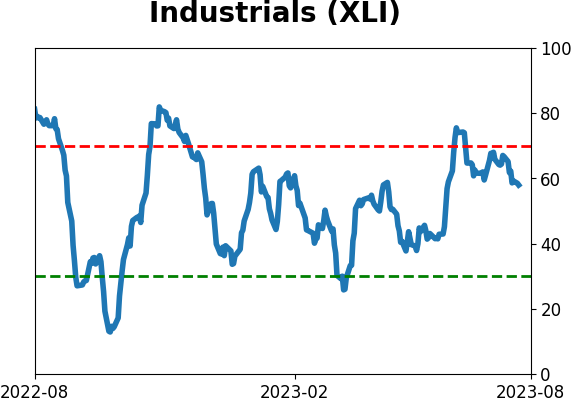
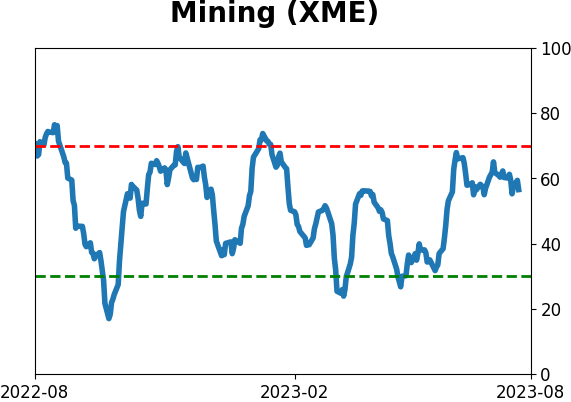
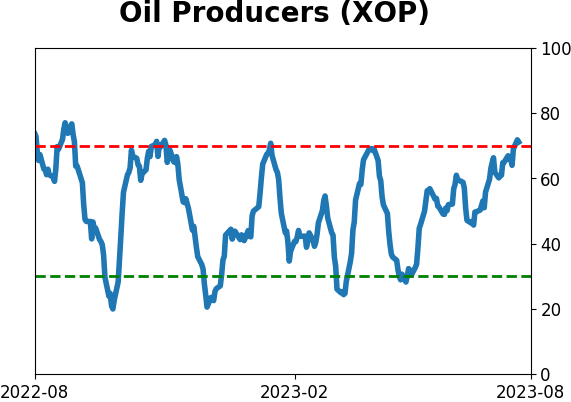
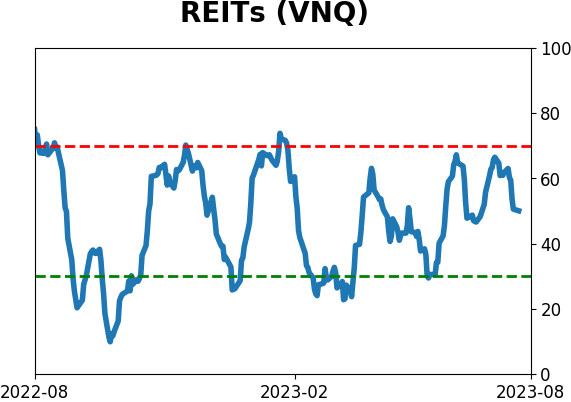
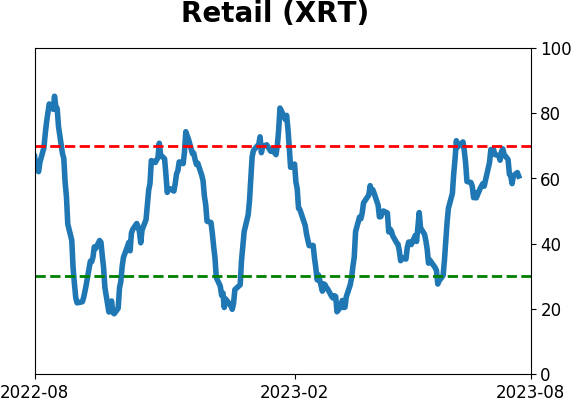
Sector ETF's - 10-Day Moving Average
|
|
|
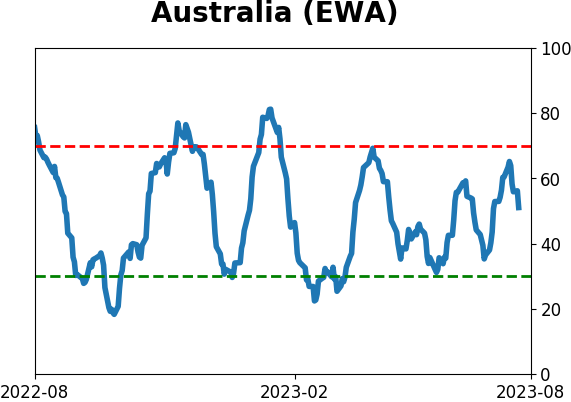
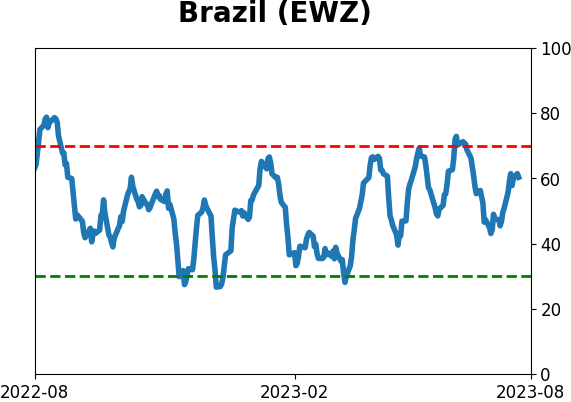
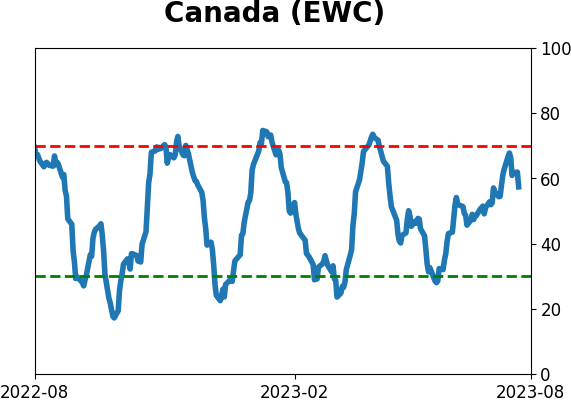
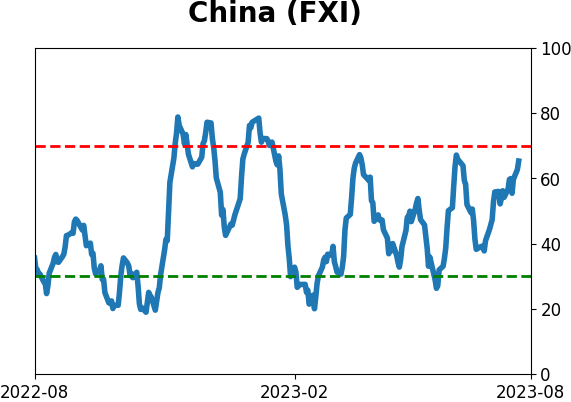
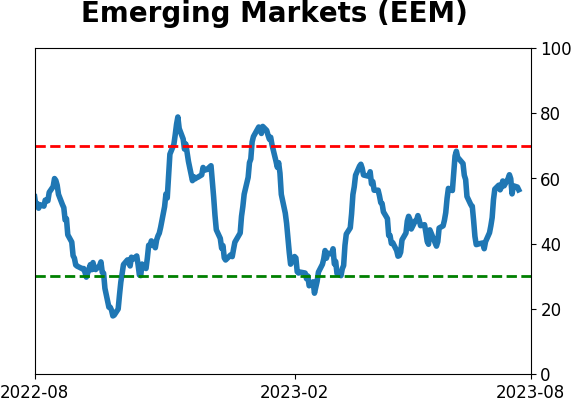
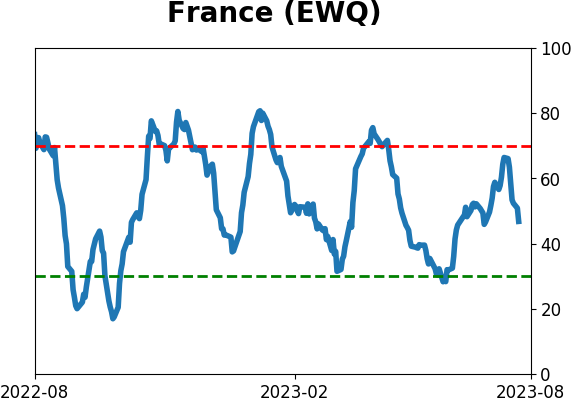
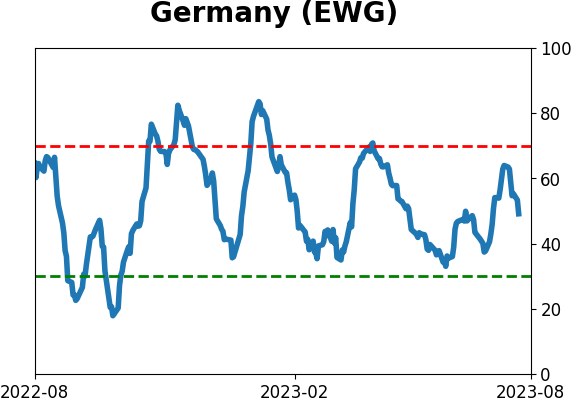
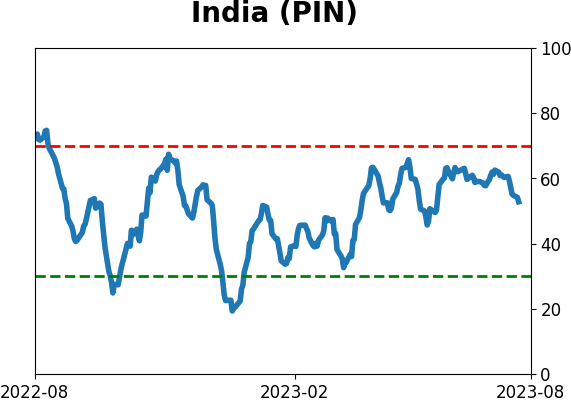
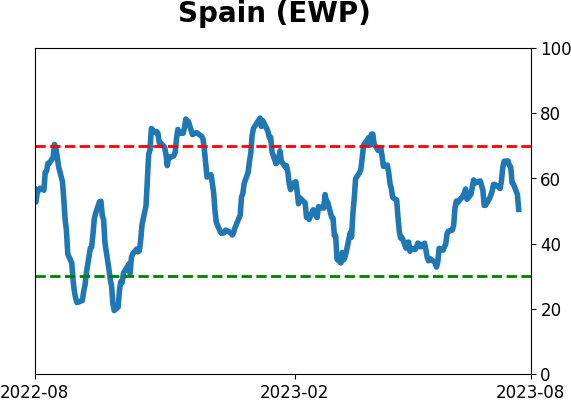
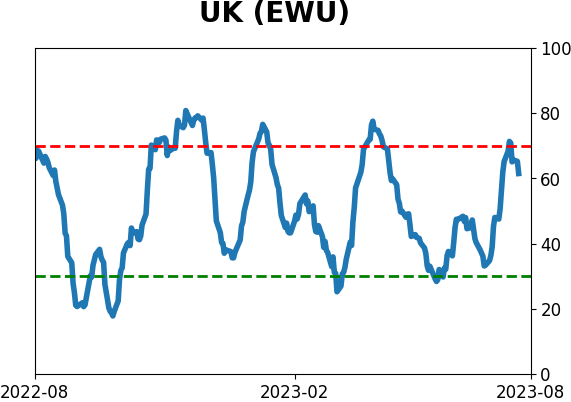
Country ETF's - 10-Day Moving Average
|
|
|
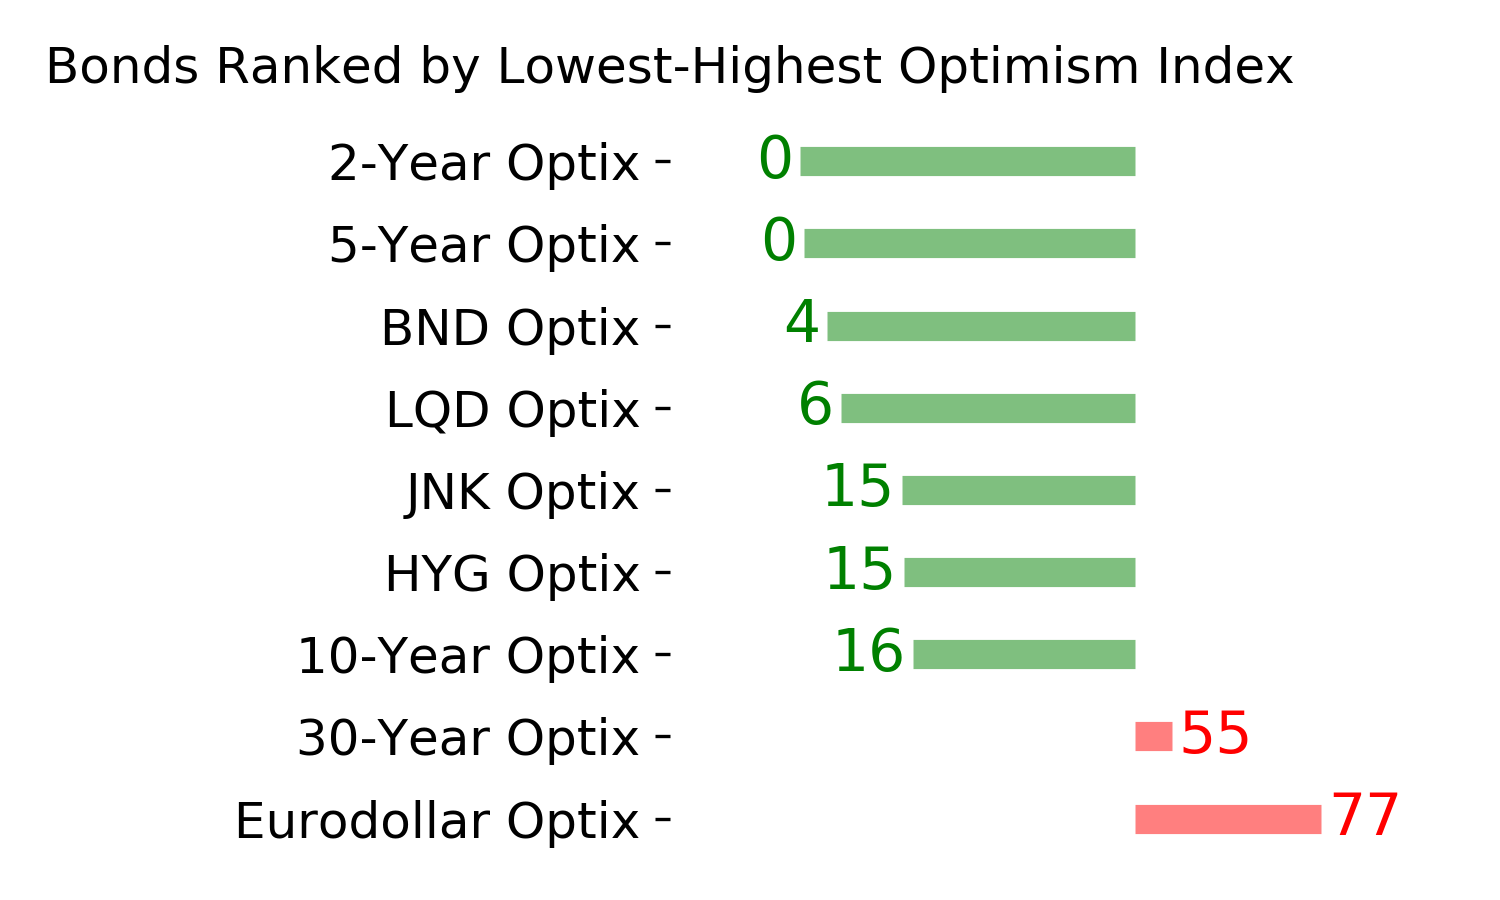
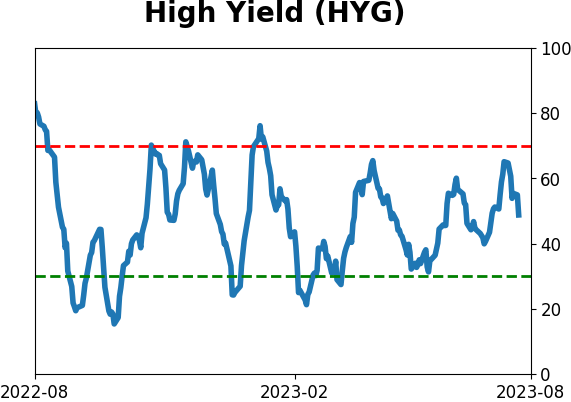
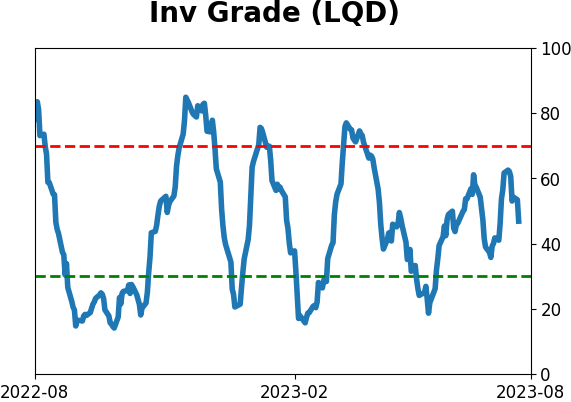
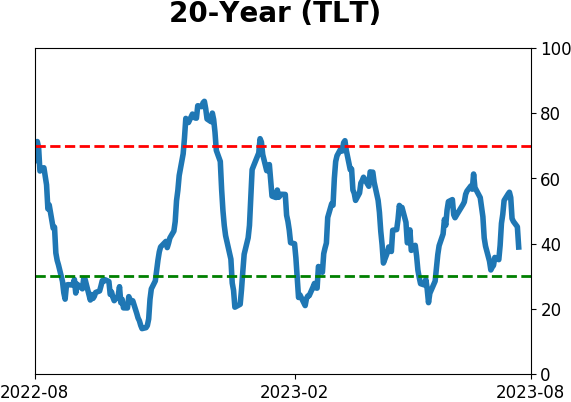
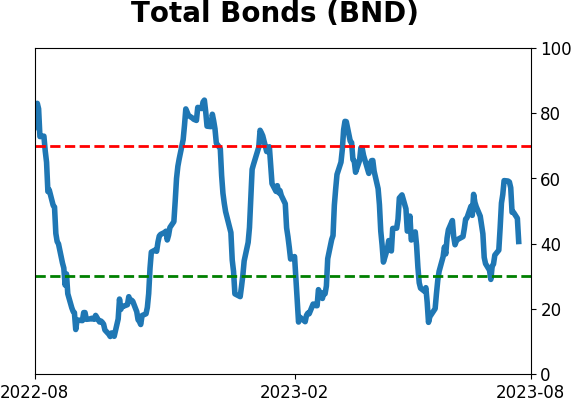
Bond ETF's - 10-Day Moving Average
|
|
|
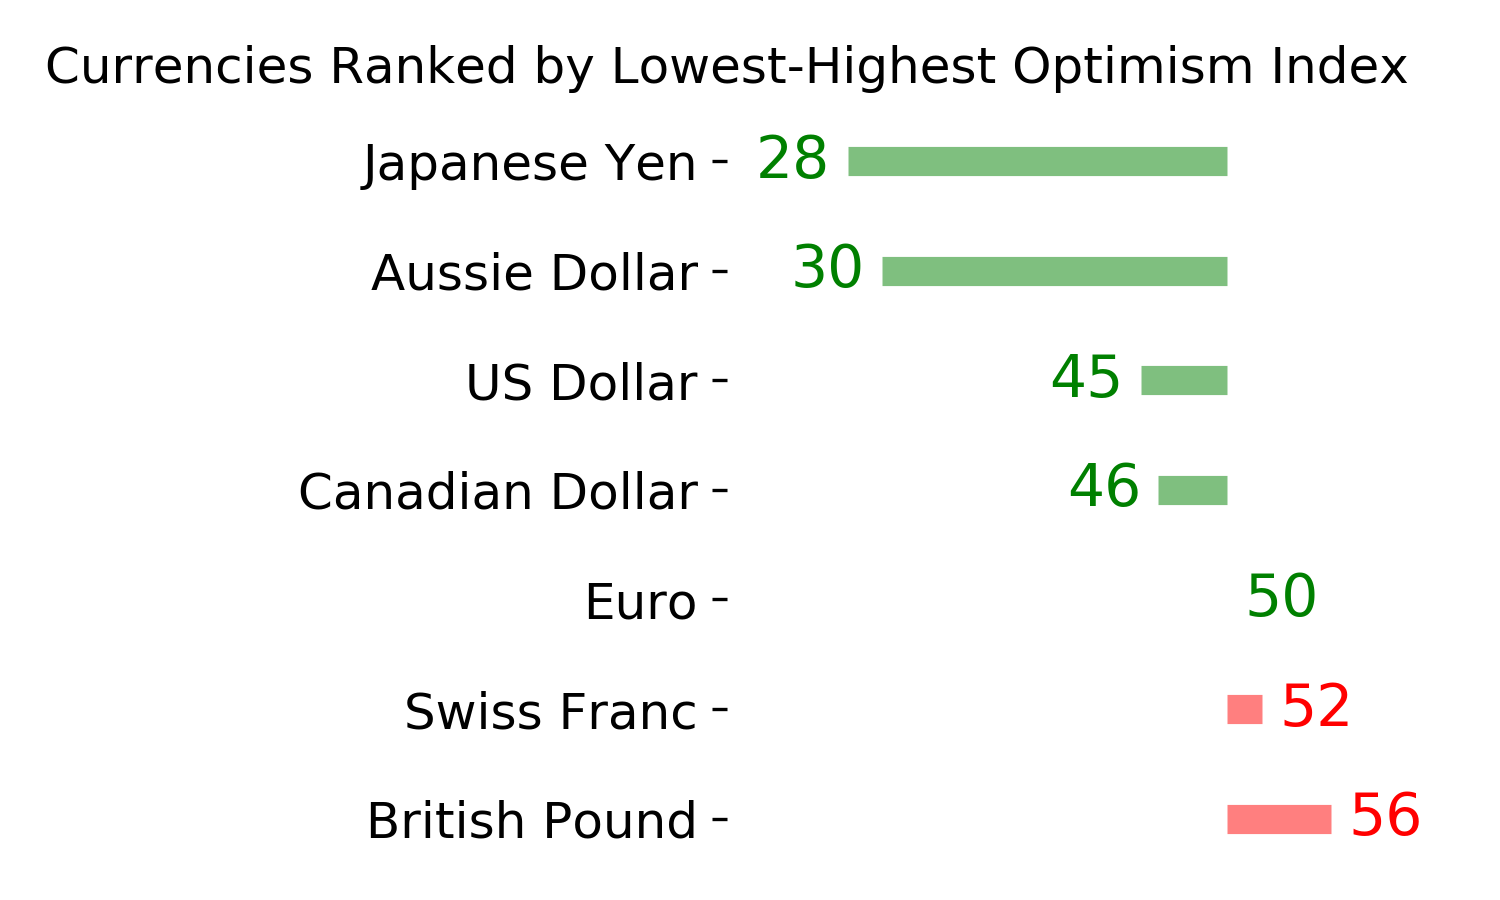
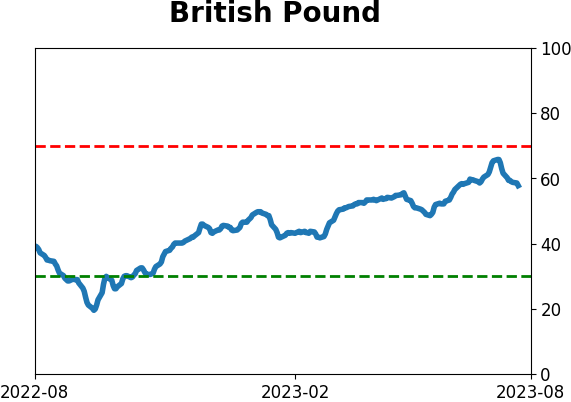
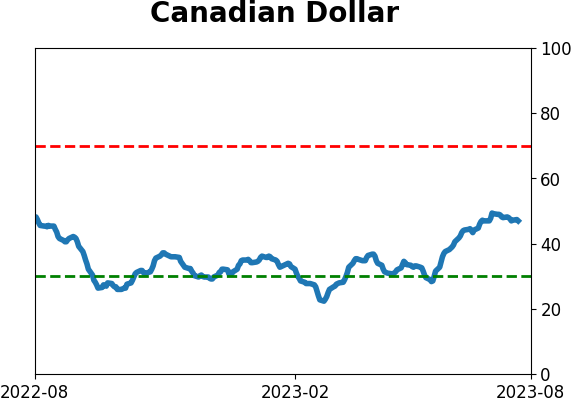
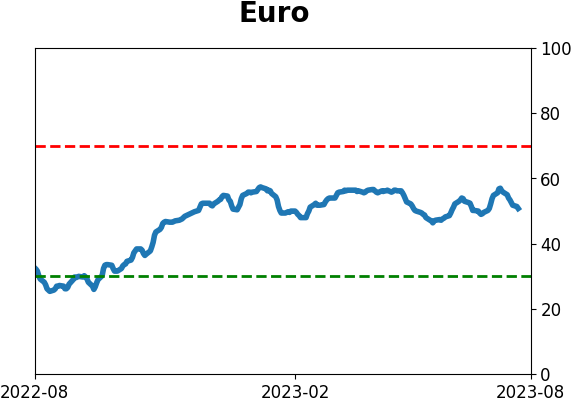
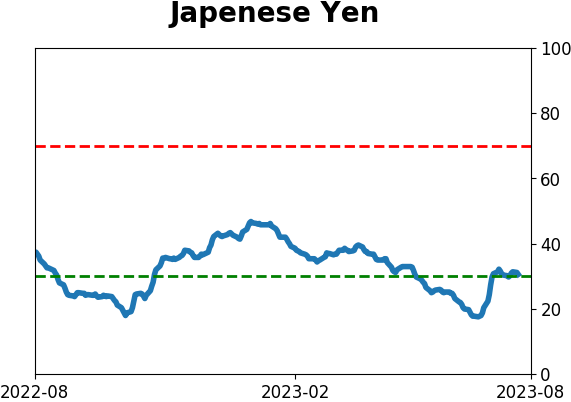
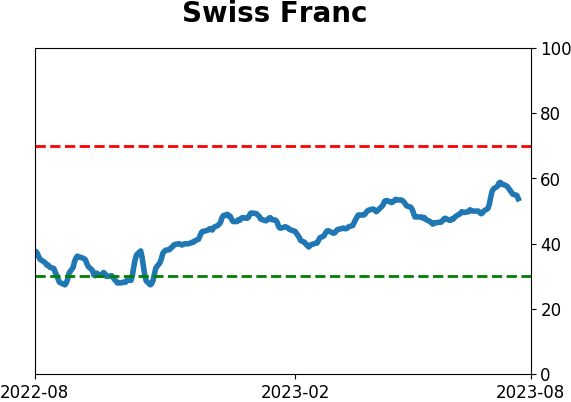
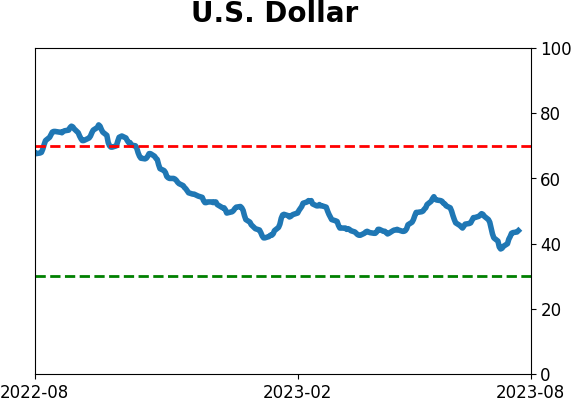
Currency ETF's - 5-Day Moving Average
|
|
|
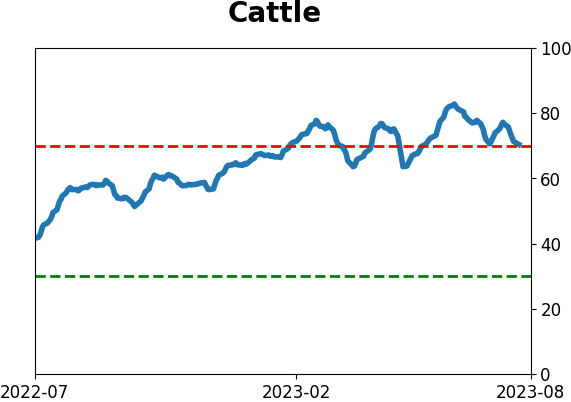
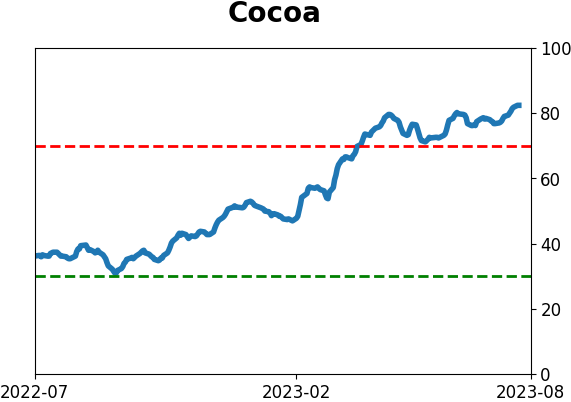
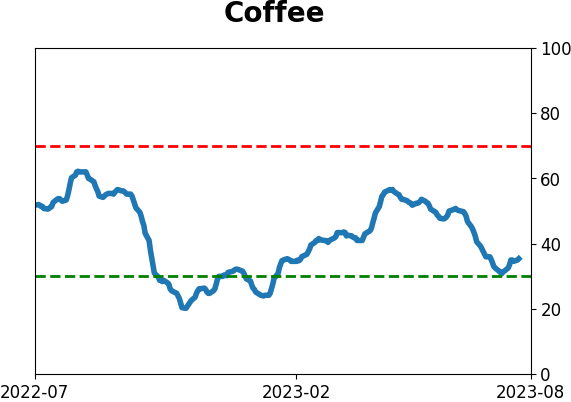
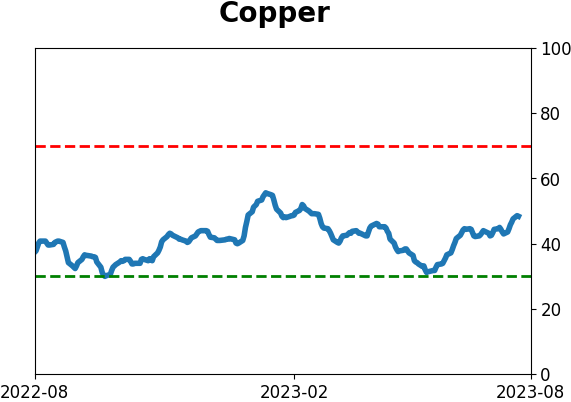
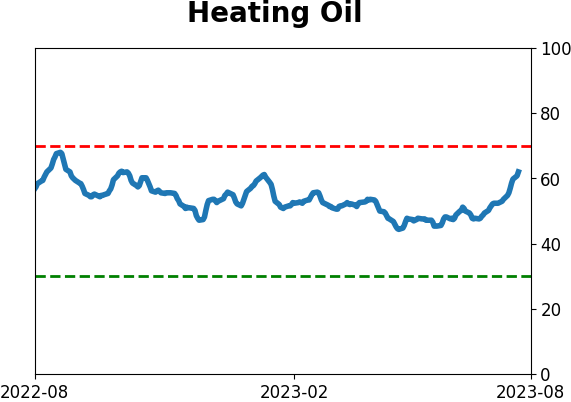
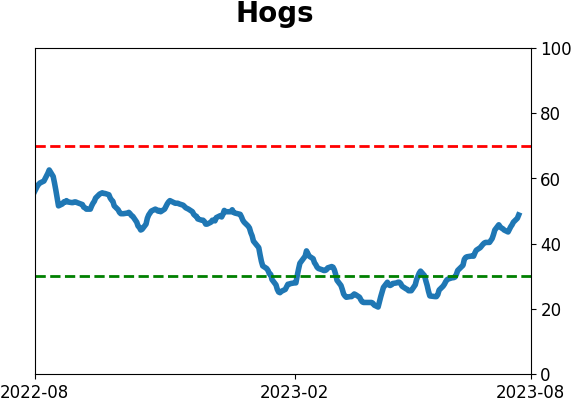
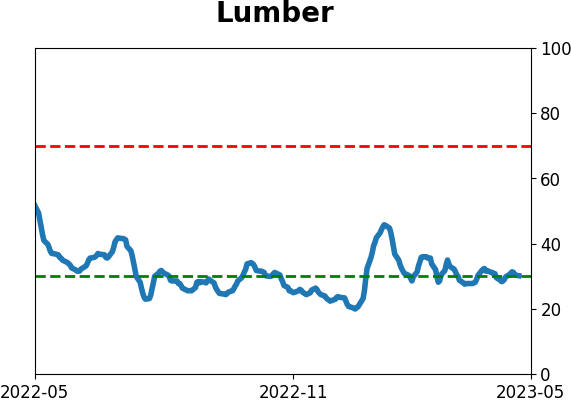
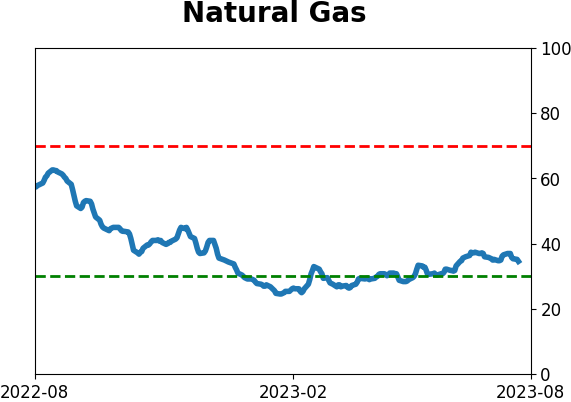
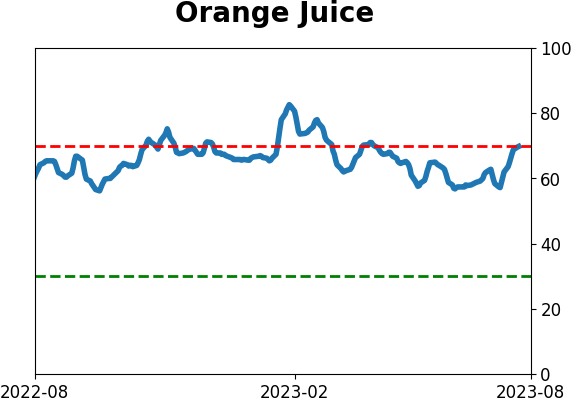
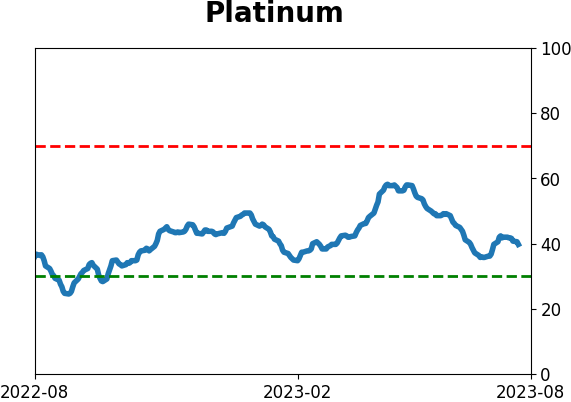
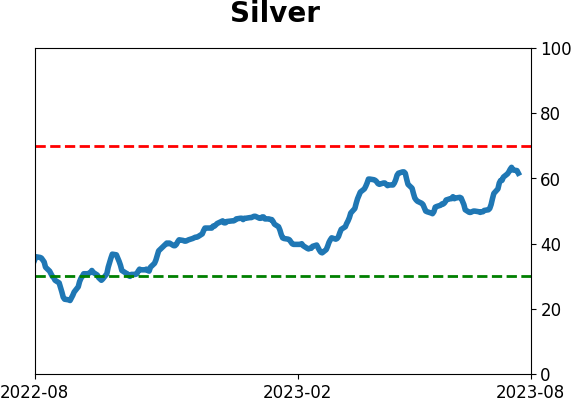
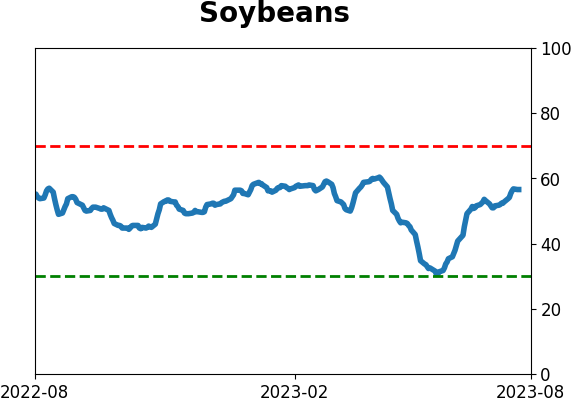
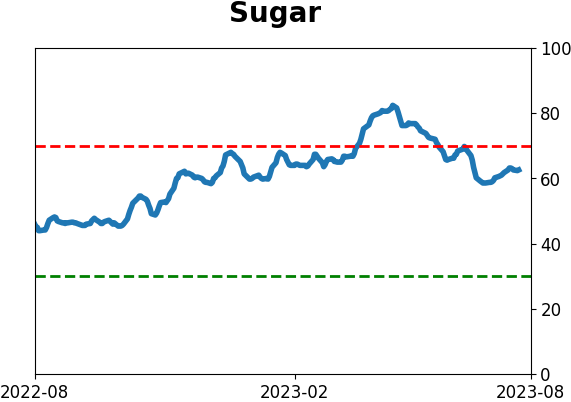
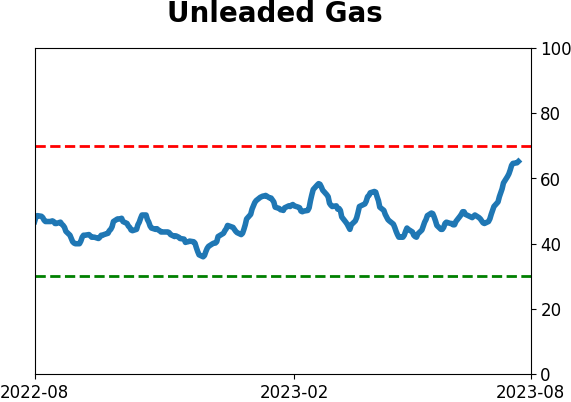
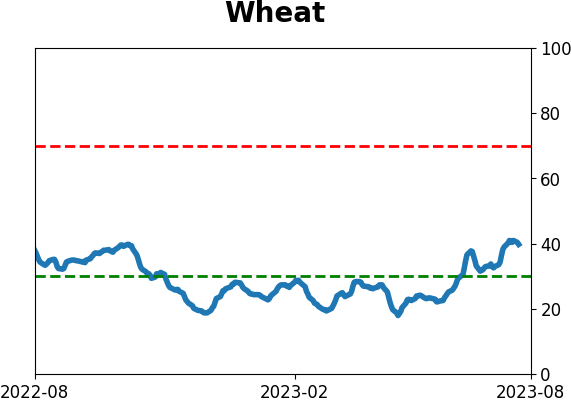
Commodity ETF's - 5-Day Moving Average
|
|