Headlines
|
|
Excess optimism eases from a historical extreme and a bullish Fed study :
A diverse composite measuring excess optimism reversed from above 50% to below 30%, signaling a retreat in exuberance. Similar reversals in optimism resulted in an S&P 500 rally 83% of the time over the subsequent month. The S&P 500 has fallen over the last ten days, setting up an extremely bullish scenario for stocks heading into the FOMC decision.
|
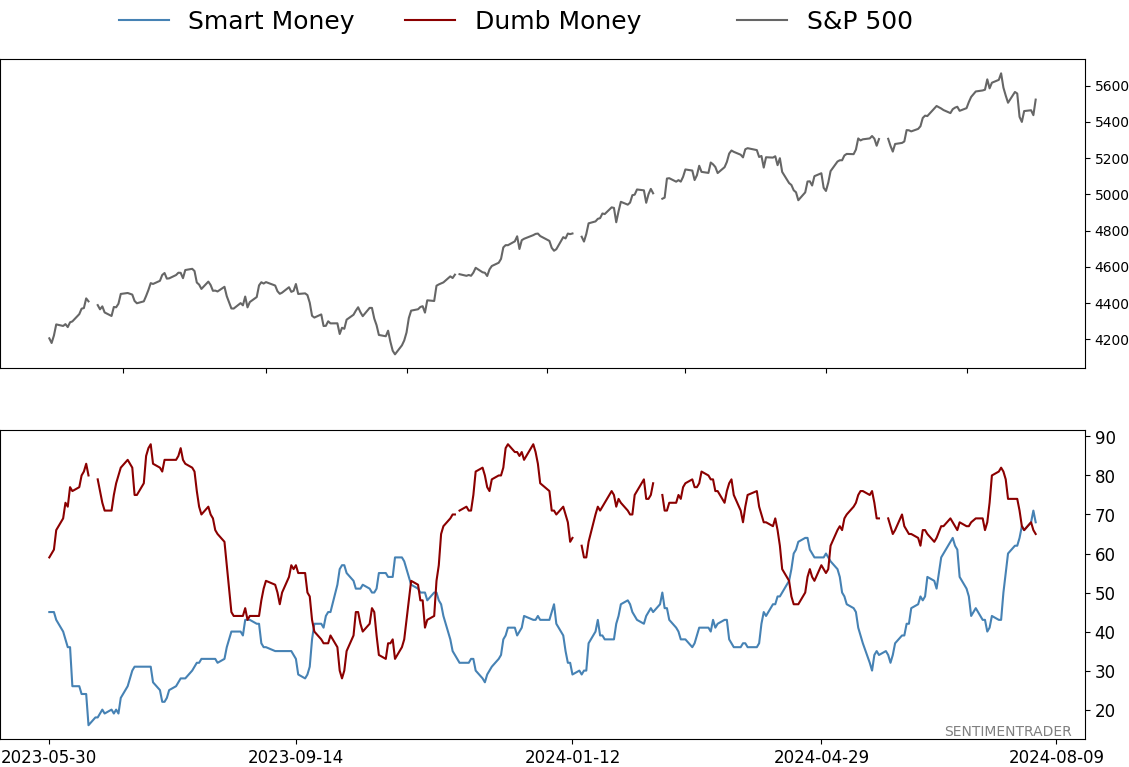
Smart / Dumb Money Confidence
|
Smart Money Confidence: 68%
Dumb Money Confidence: 65%
|
|
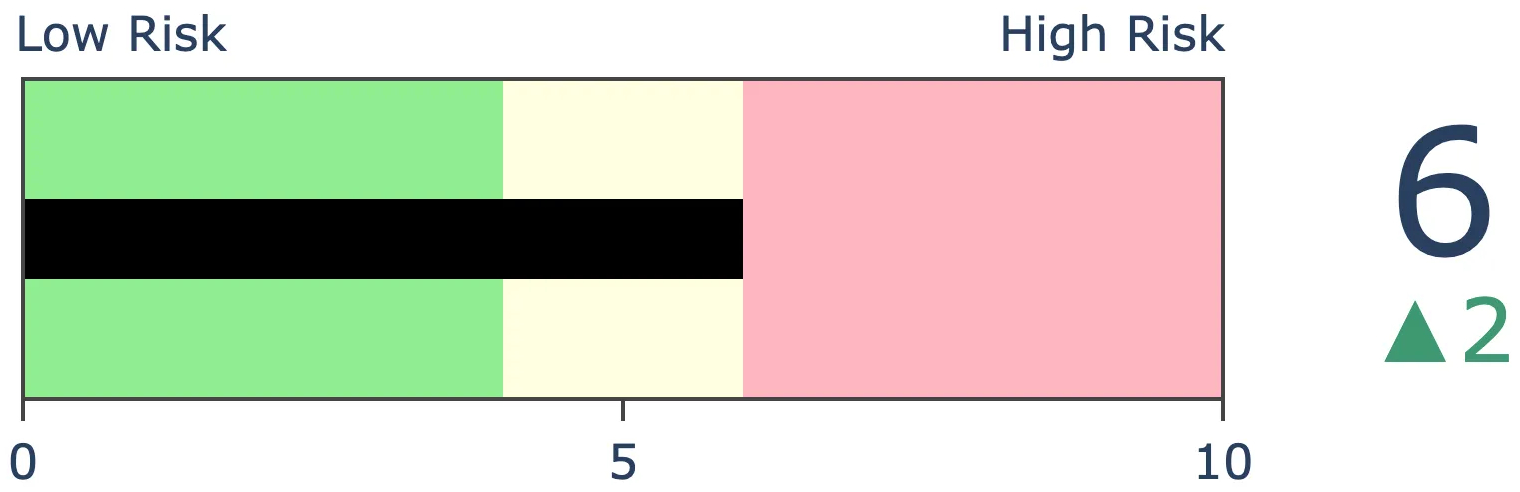
Risk Levels
Stocks Short-Term
|
Stocks Medium-Term

|
|
Bonds
|
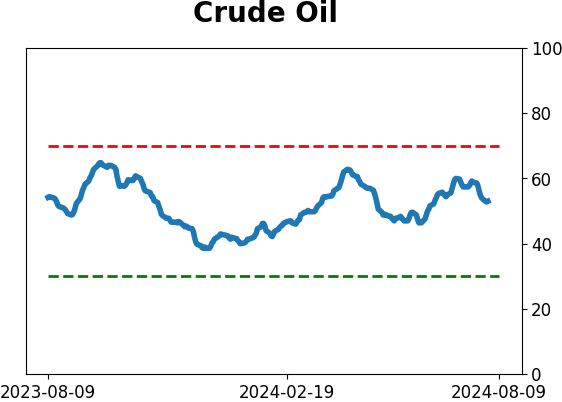
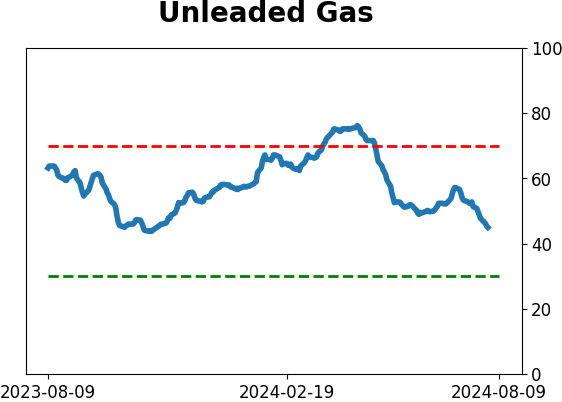
Crude Oil
|
|
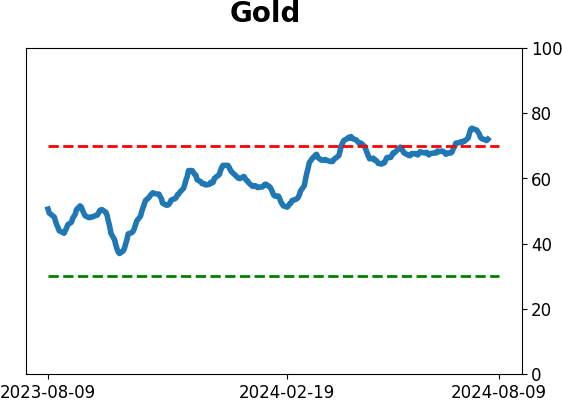
Gold
|
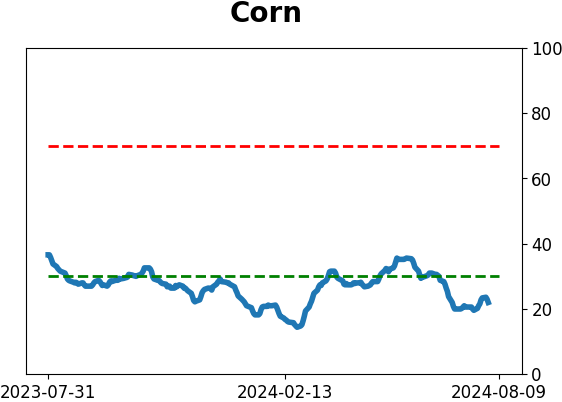
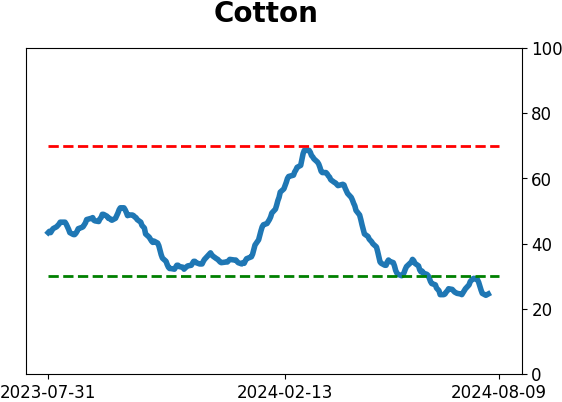
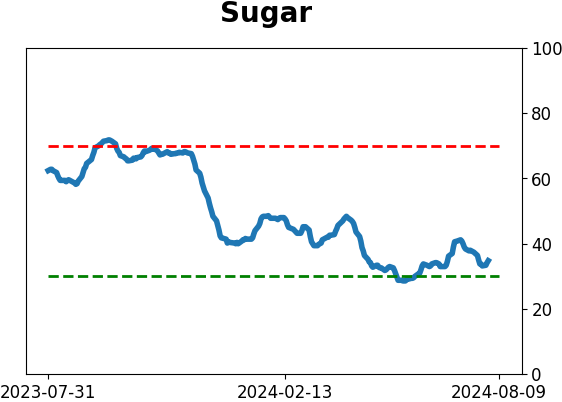
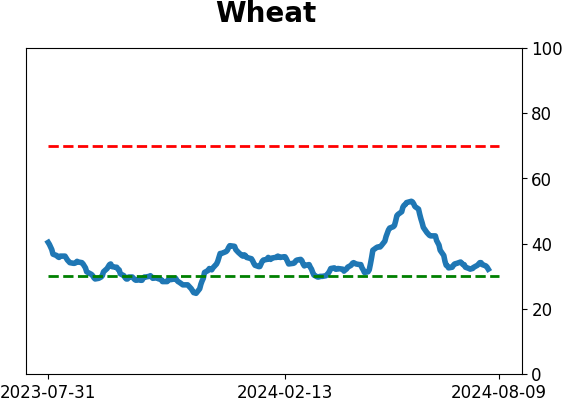
Agriculture

|
|
Research
By Dean Christians
BOTTOM LINE
A diverse composite measuring excess optimism reversed from above 50% to below 30%, signaling a retreat in exuberance. Similar reversals in optimism resulted in an S&P 500 rally 83% of the time over the subsequent month. The S&P 500 has fallen over the last ten days, setting up an extremely bullish scenario for stocks heading into the FOMC decision.
FORECAST / TIMEFRAME
SPY -- Up, Medium-Term
|
Key points:
- A composite measuring excess optimism retreated from an extreme level
- The S&P 500 rallied 83% of the time in the subsequent month following similar reversals in optimism
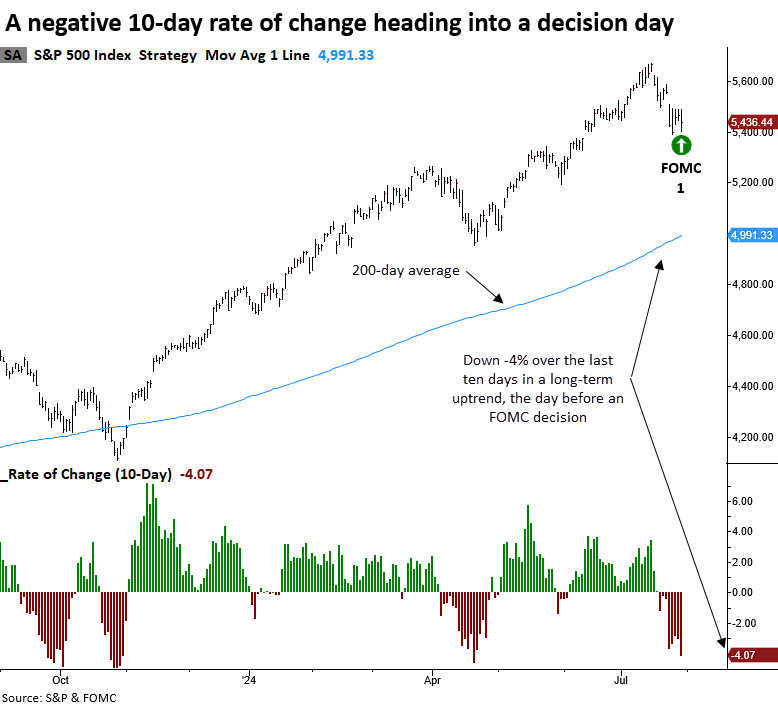
- Over the last ten sessions, the S&P 500 has fallen over 4%, coinciding with the day before an FOMC decision
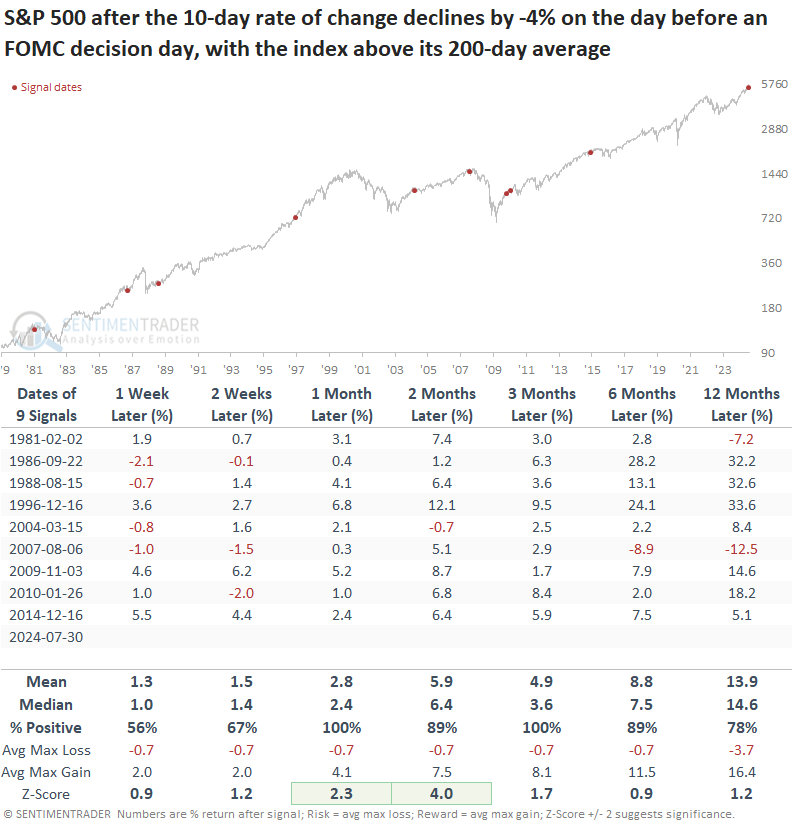
- Similar Fed scenarios produced a 100% win rate for the S&P 500 over the ensuing one and three months
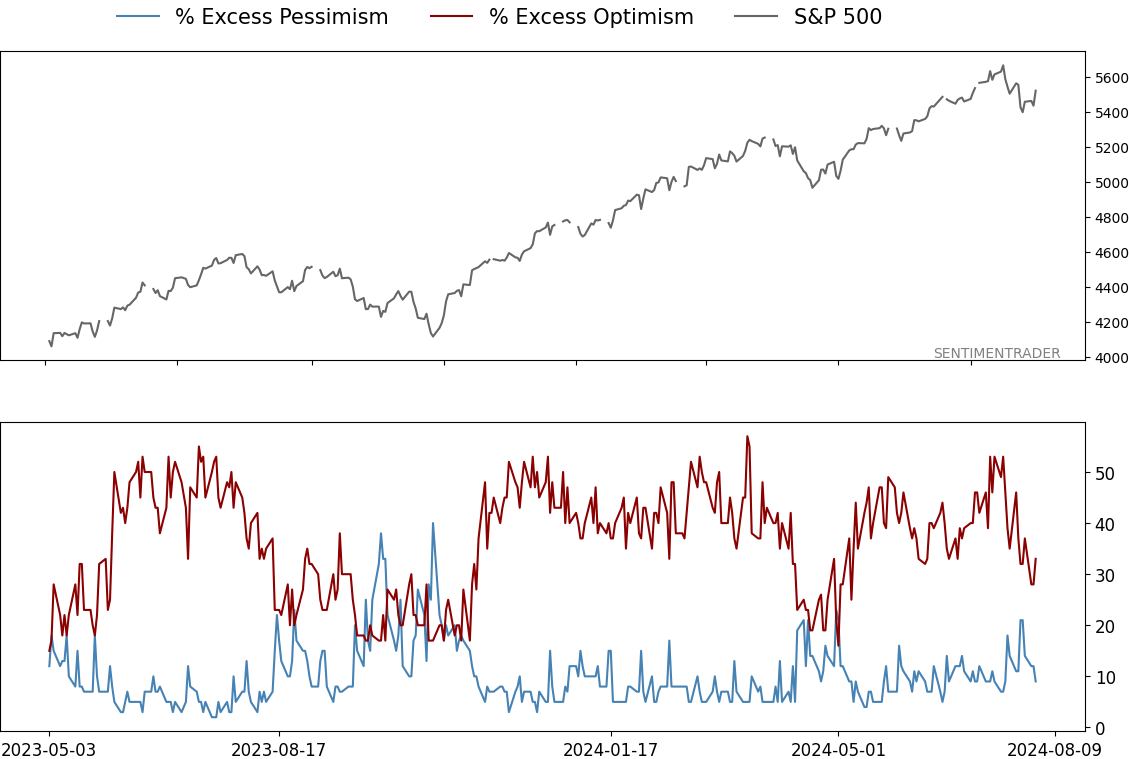
A composite exhibits considerably fewer signs of extreme optimism
After reaching one of the most optimistic levels in history, a mark attained in just 2% of trading sessions since 2000, the % Showing Excess Optimism indicator cycled from 53% to 28%, signaling a substantial easing in excess optimism for a proprietary composite that contains 57 diverse indicators.
As mentioned in my study from last week regarding the 50-day average reversal, buying the dip tends to yield positive outcomes when indicators quickly reverse to the downside in a long-term uptrend.
The previous reversal in excessive optimism occurred in April, leading to a 9.9% gain in the S&P 500 over the following three months.
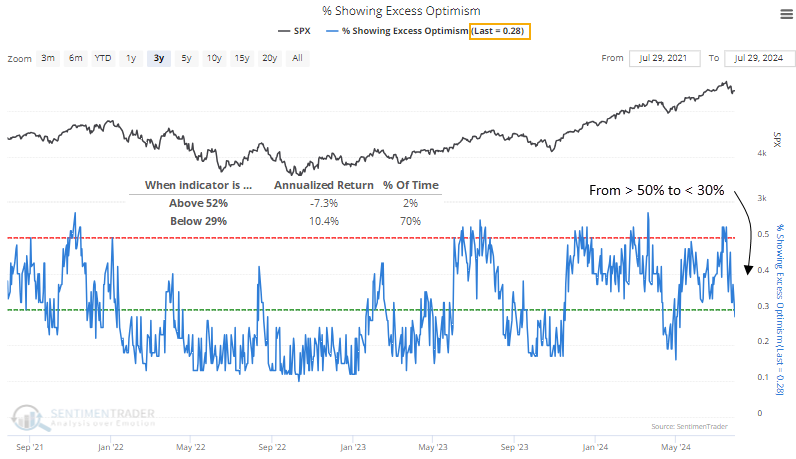
Comparable reversals in optimism preceded positive returns
Whenever the percentage of indicators showing excess optimism cycled from above 50% to below 30%, the S&P 500 showed a solid tendency to rally over the subsequent month, rising 83% of the time. Over this same horizon, the world's most benchmarked index produced a gain at some point in 16 out of 18 precedents.
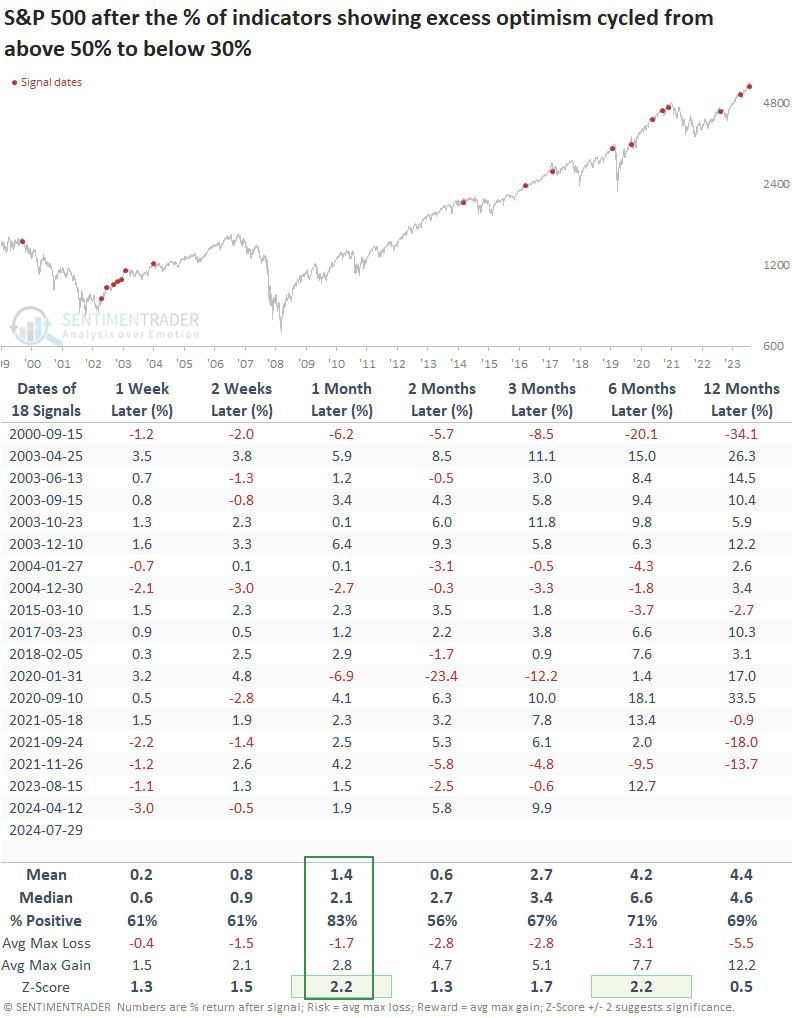
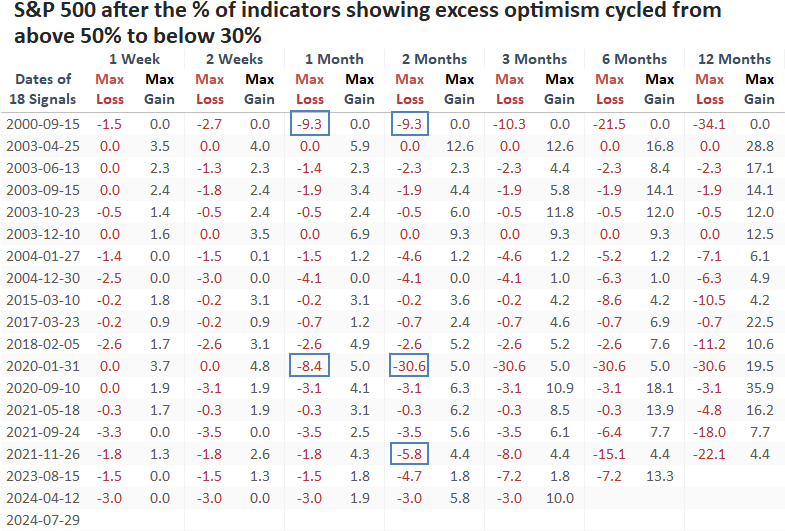
Over the next two months, a maximum loss exceeding -5% was limited to only a few instances, one of which was linked to the rare COVID shutdown.
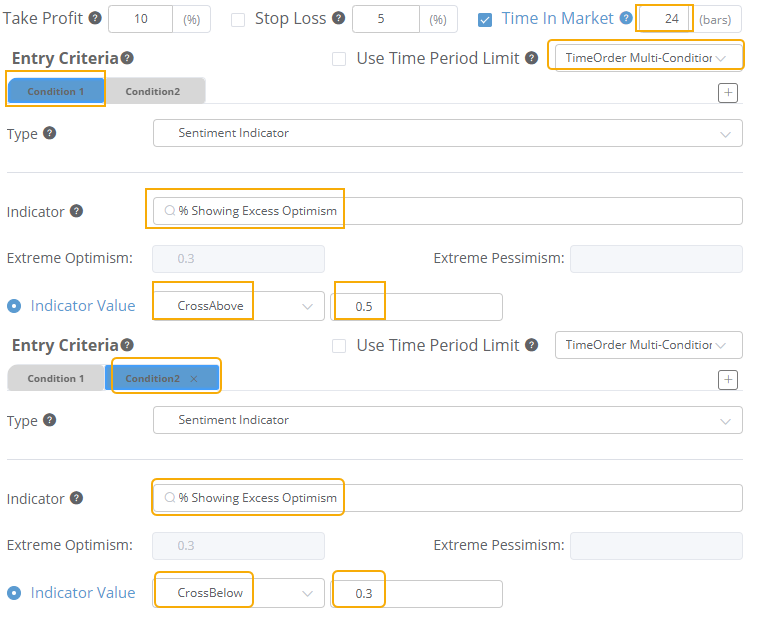
Backtest Engine
Utilizing the Backtest Engine 2.0, you can generate and track trading signals such as this one. The table below outlines the setup for when the % Showing Excess Optimism indicator transitioned from above 50% to below 30%.
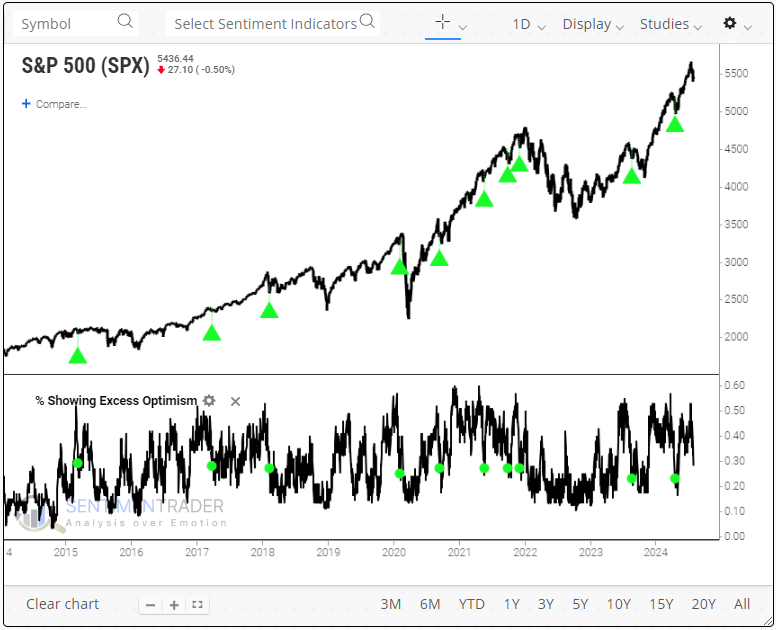
The BackTest Engine 2.0 functionality displays a green up-arrow on a chart where a signal occurred, providing users with a historical visualization. As the chart shows, a reversal in excess optimism generally occurs during corrections in uptrends.
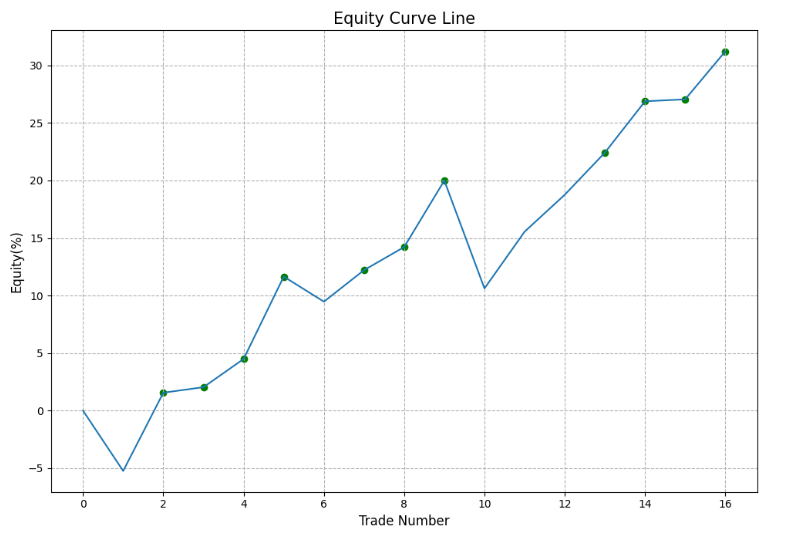
The summary section on the results page includes an equity curve. It provides a visual representation of a trading signal's performance through time, conveying a wealth of information. Favorable systems will show a curve that trends steadily from the lower left to the upper right, a pattern demonstrated by the % Showing Excess Optimism signal.
A bullish Fed study
Over the last ten trading sessions, the S&P 500 has fallen over 4%. While not unusual, this scenario coincided with the session before a FOMC decision day, with the world's most benchmarked index trading above its 200-day average.
A pullback in the S&P 500 before a Fed decision day preceded excellent returns
Similar Fed decision day conditions preceded outstanding returns and consistency for the S&P 500 over the following year, especially one and three months later, with both exhibiting a 100% win rate.
What the research tells us...
A composite that measures excess optimism for more than 50 diverse indicators has eased considerably from a historical extreme. To be clear, this does not mean that sentiment or breadth measures have reached a pessimistic extreme; it just means that most are no longer exhibiting exuberance. Remember, in bull markets, optimism tends to persist near elevated levels for an extended period. It takes bulls to have a bull market. Typically, when the % Showing Excess Optimism indicator eased from above 50% to below 30%, the S&P 500 displayed a solid tendency to rally over the subsequent month. As always, it's imperative to use a weight-of-the-evidence approach. Therefore, I will monitor other short-term trading signals like this one for confirmation that the correction has run its course. A fed study suggests the S&P 500 emerges from its corrective phase.
Indicators at Extremes
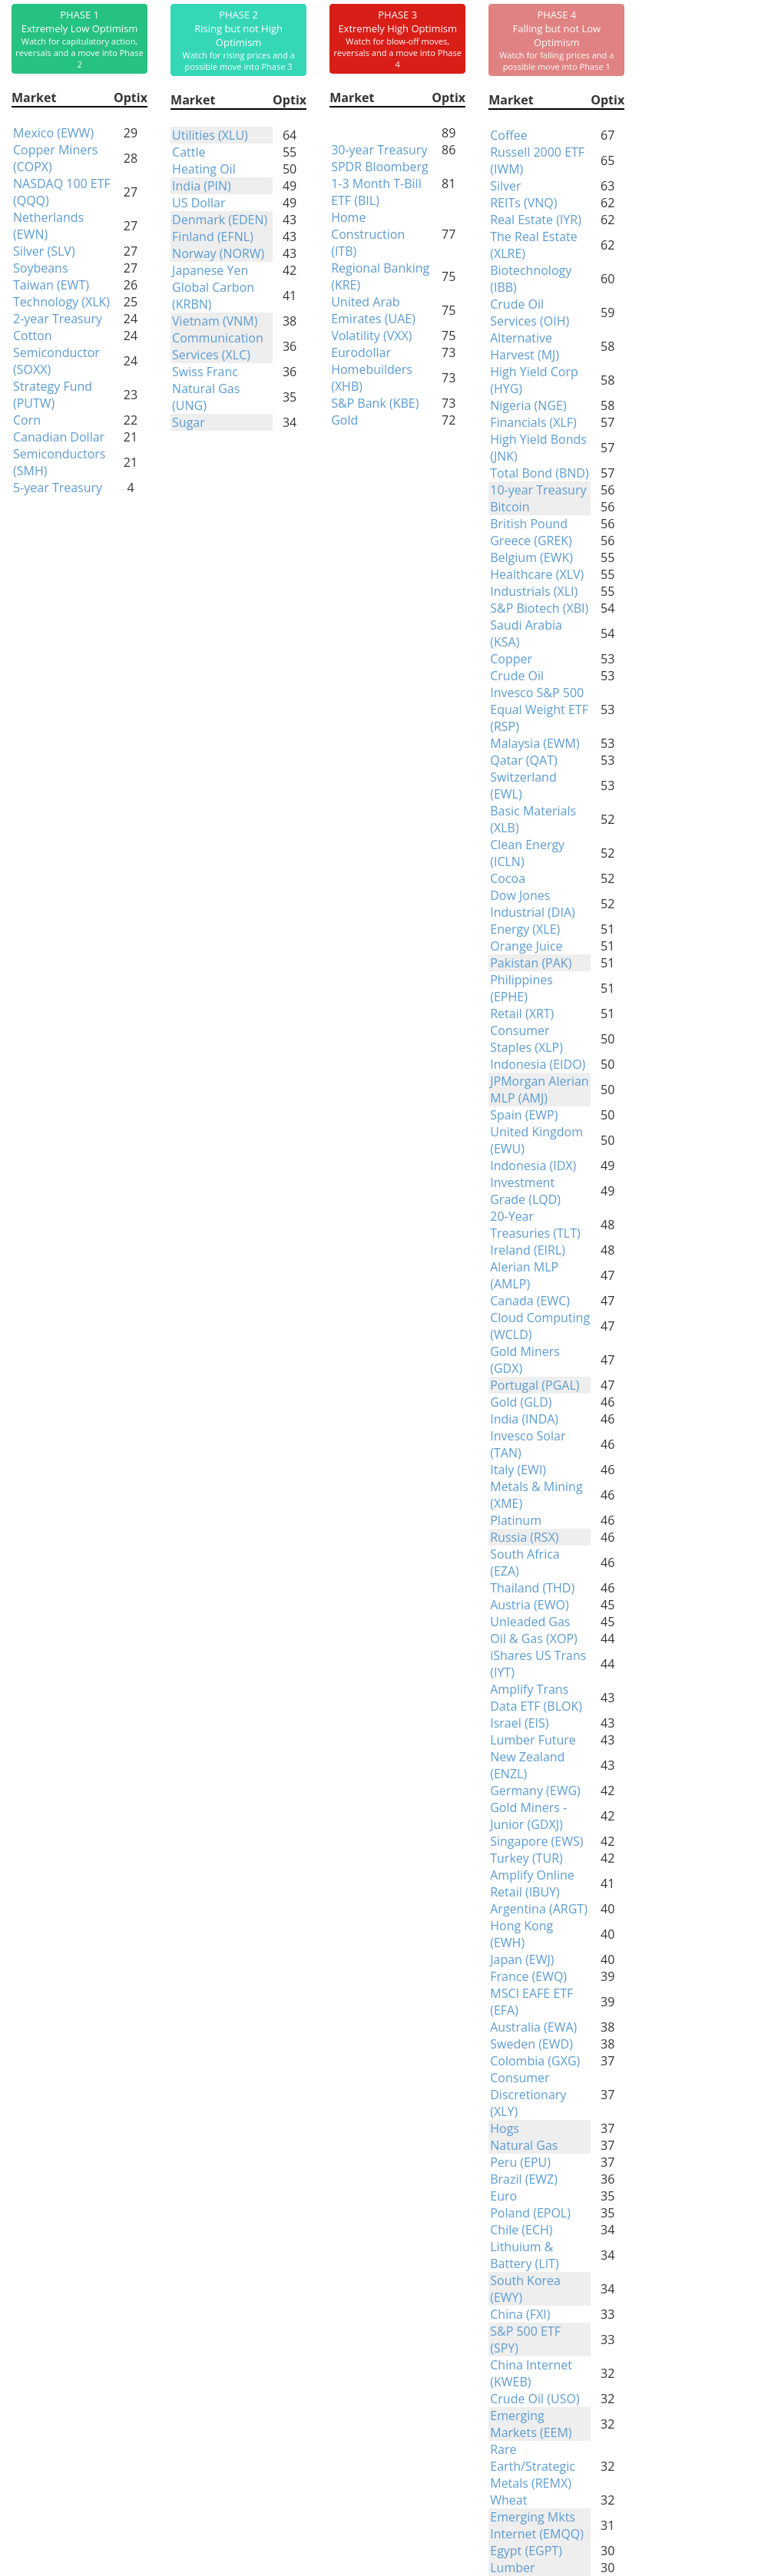
Phase Table
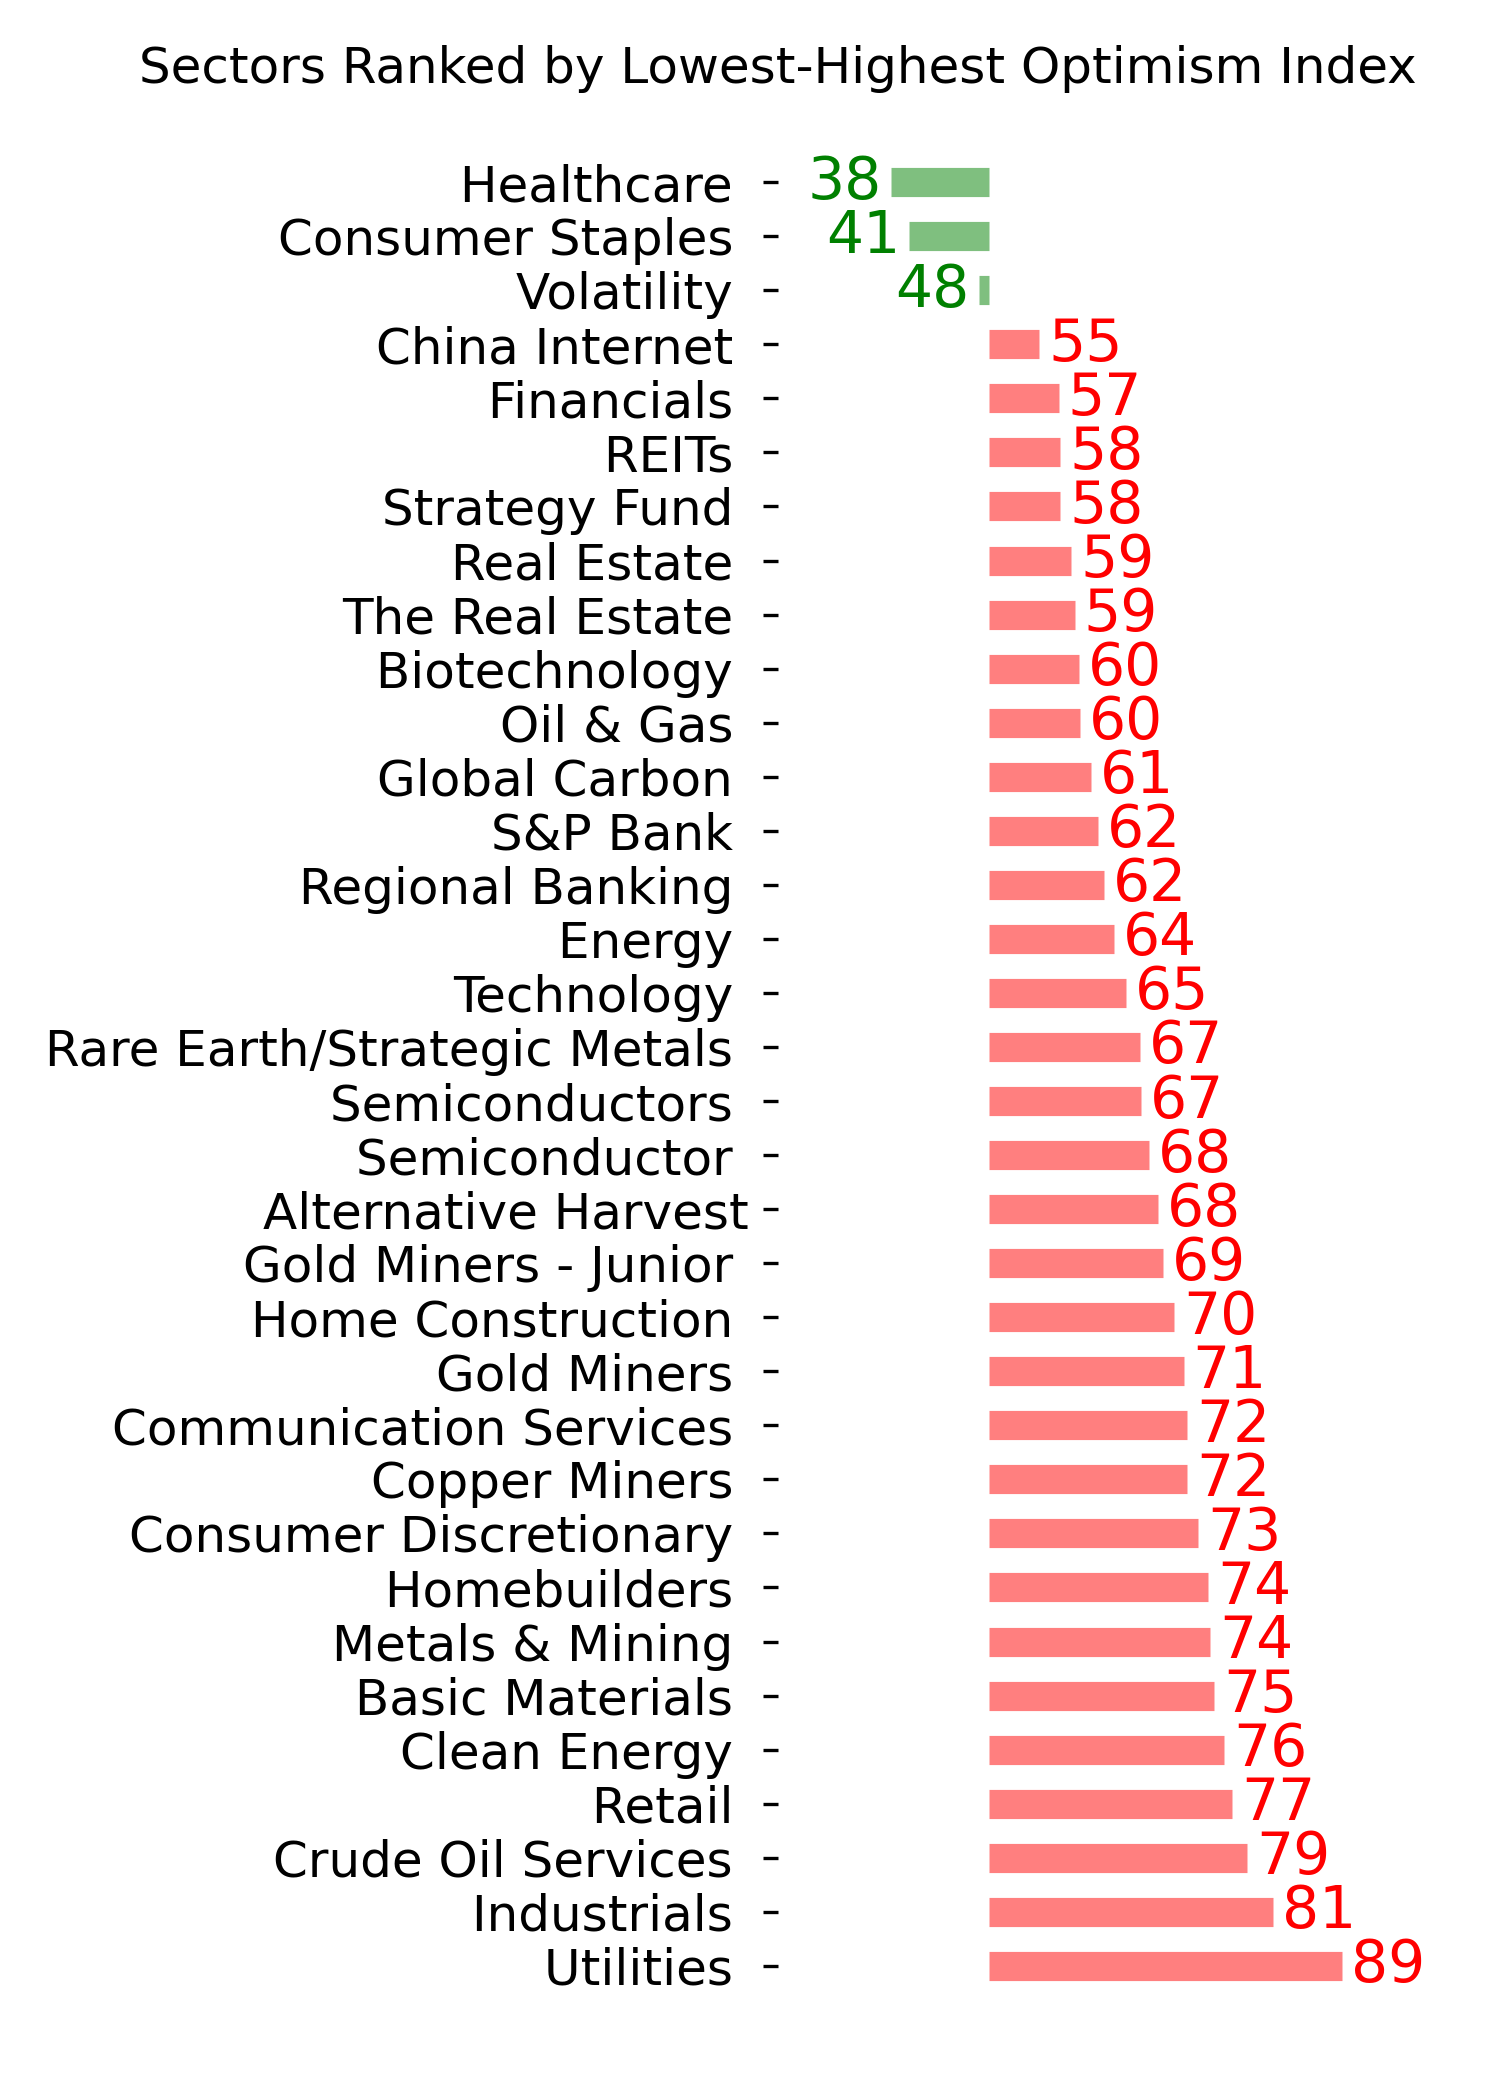
Ranks
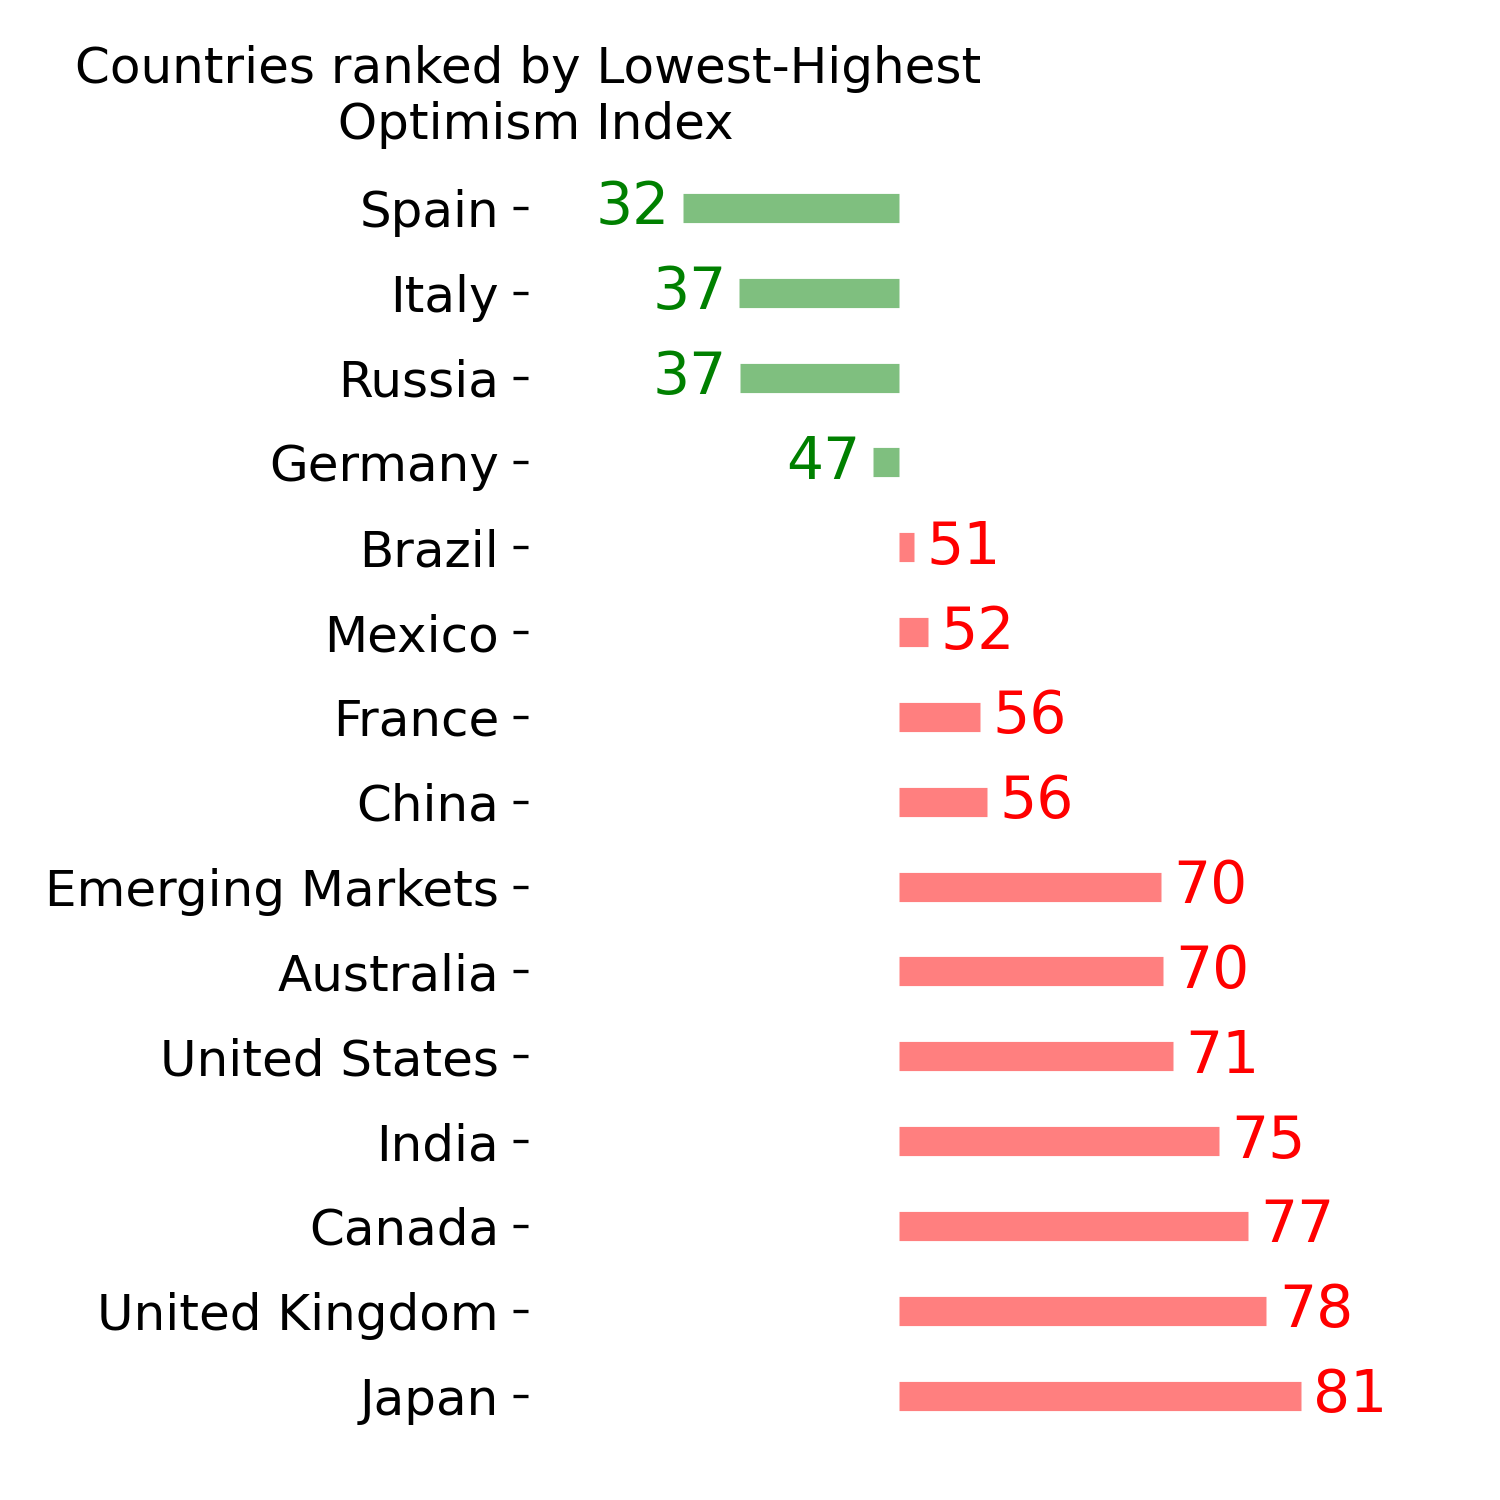
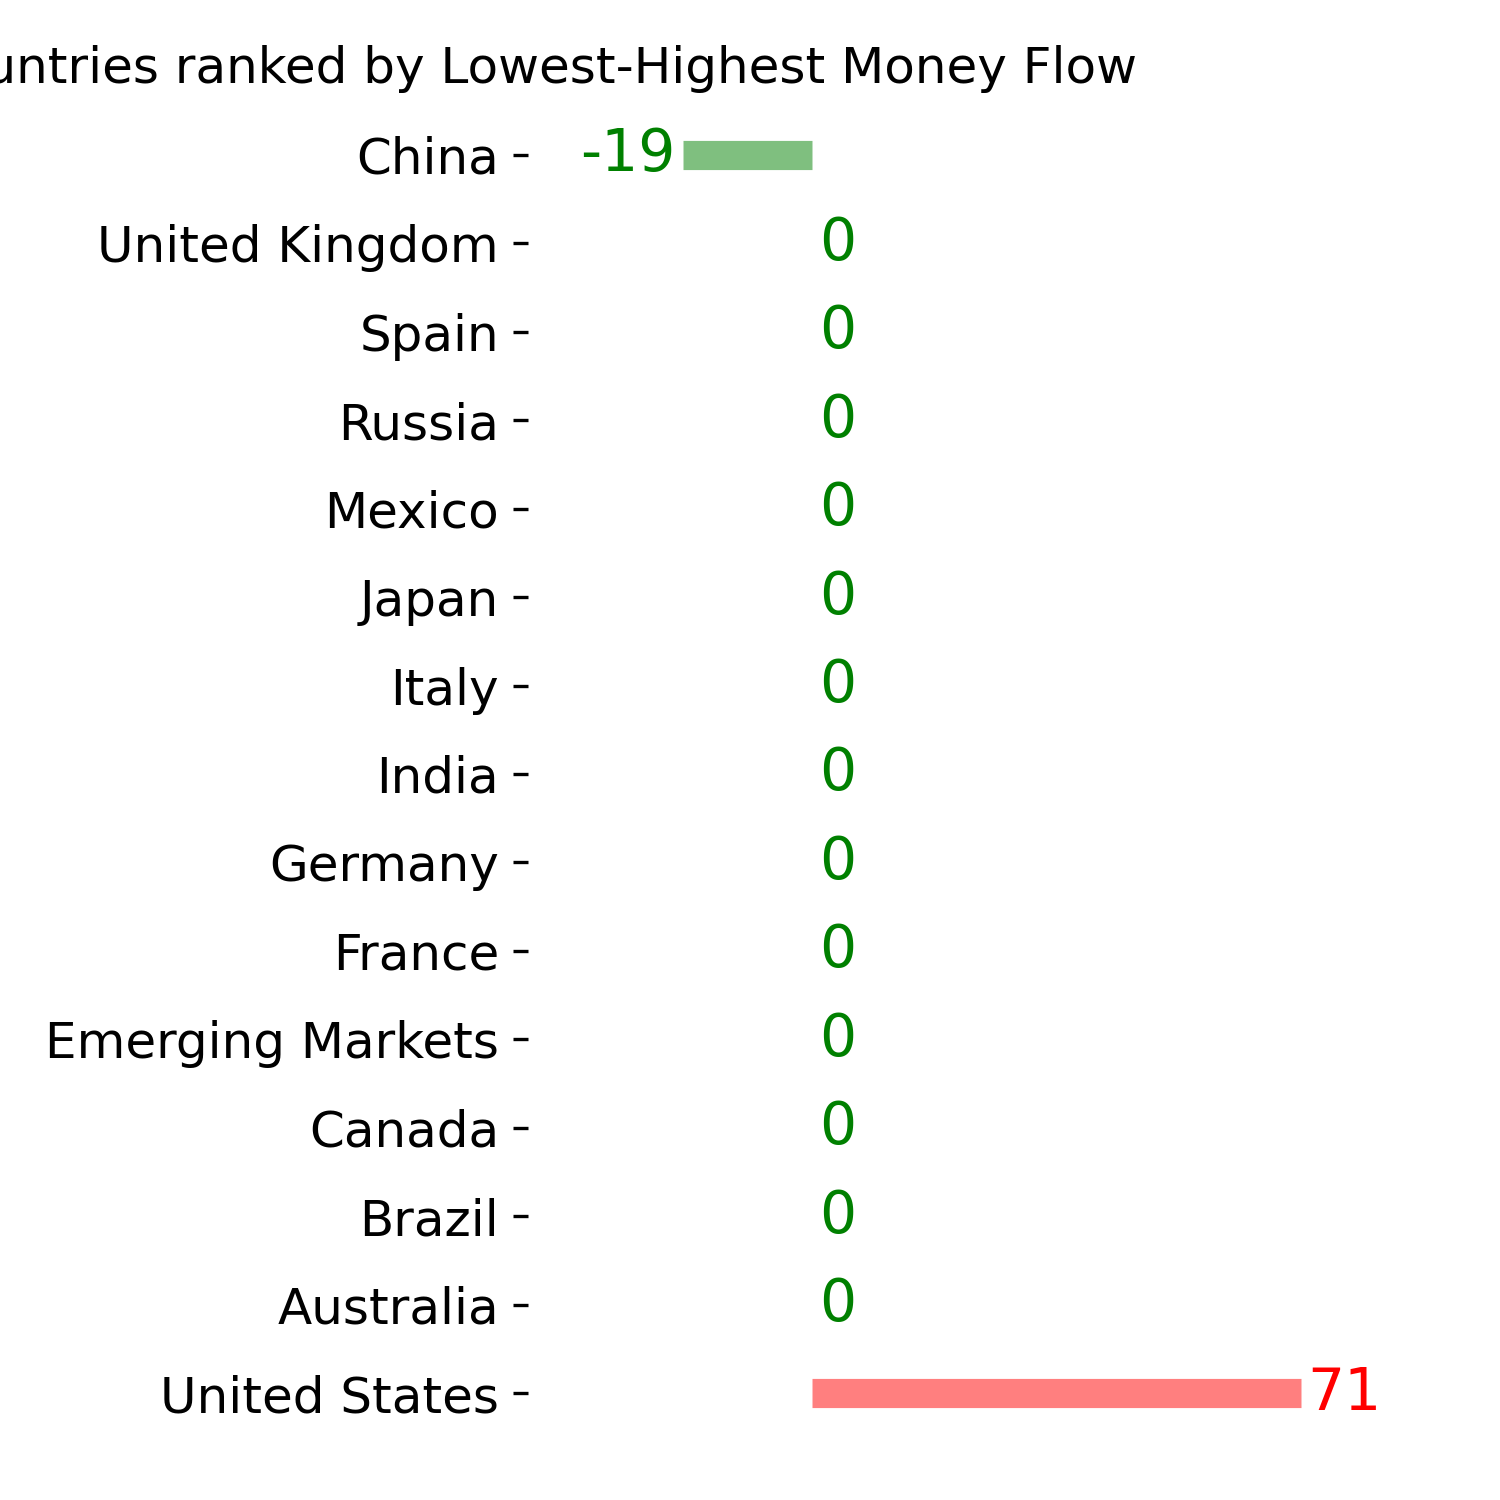
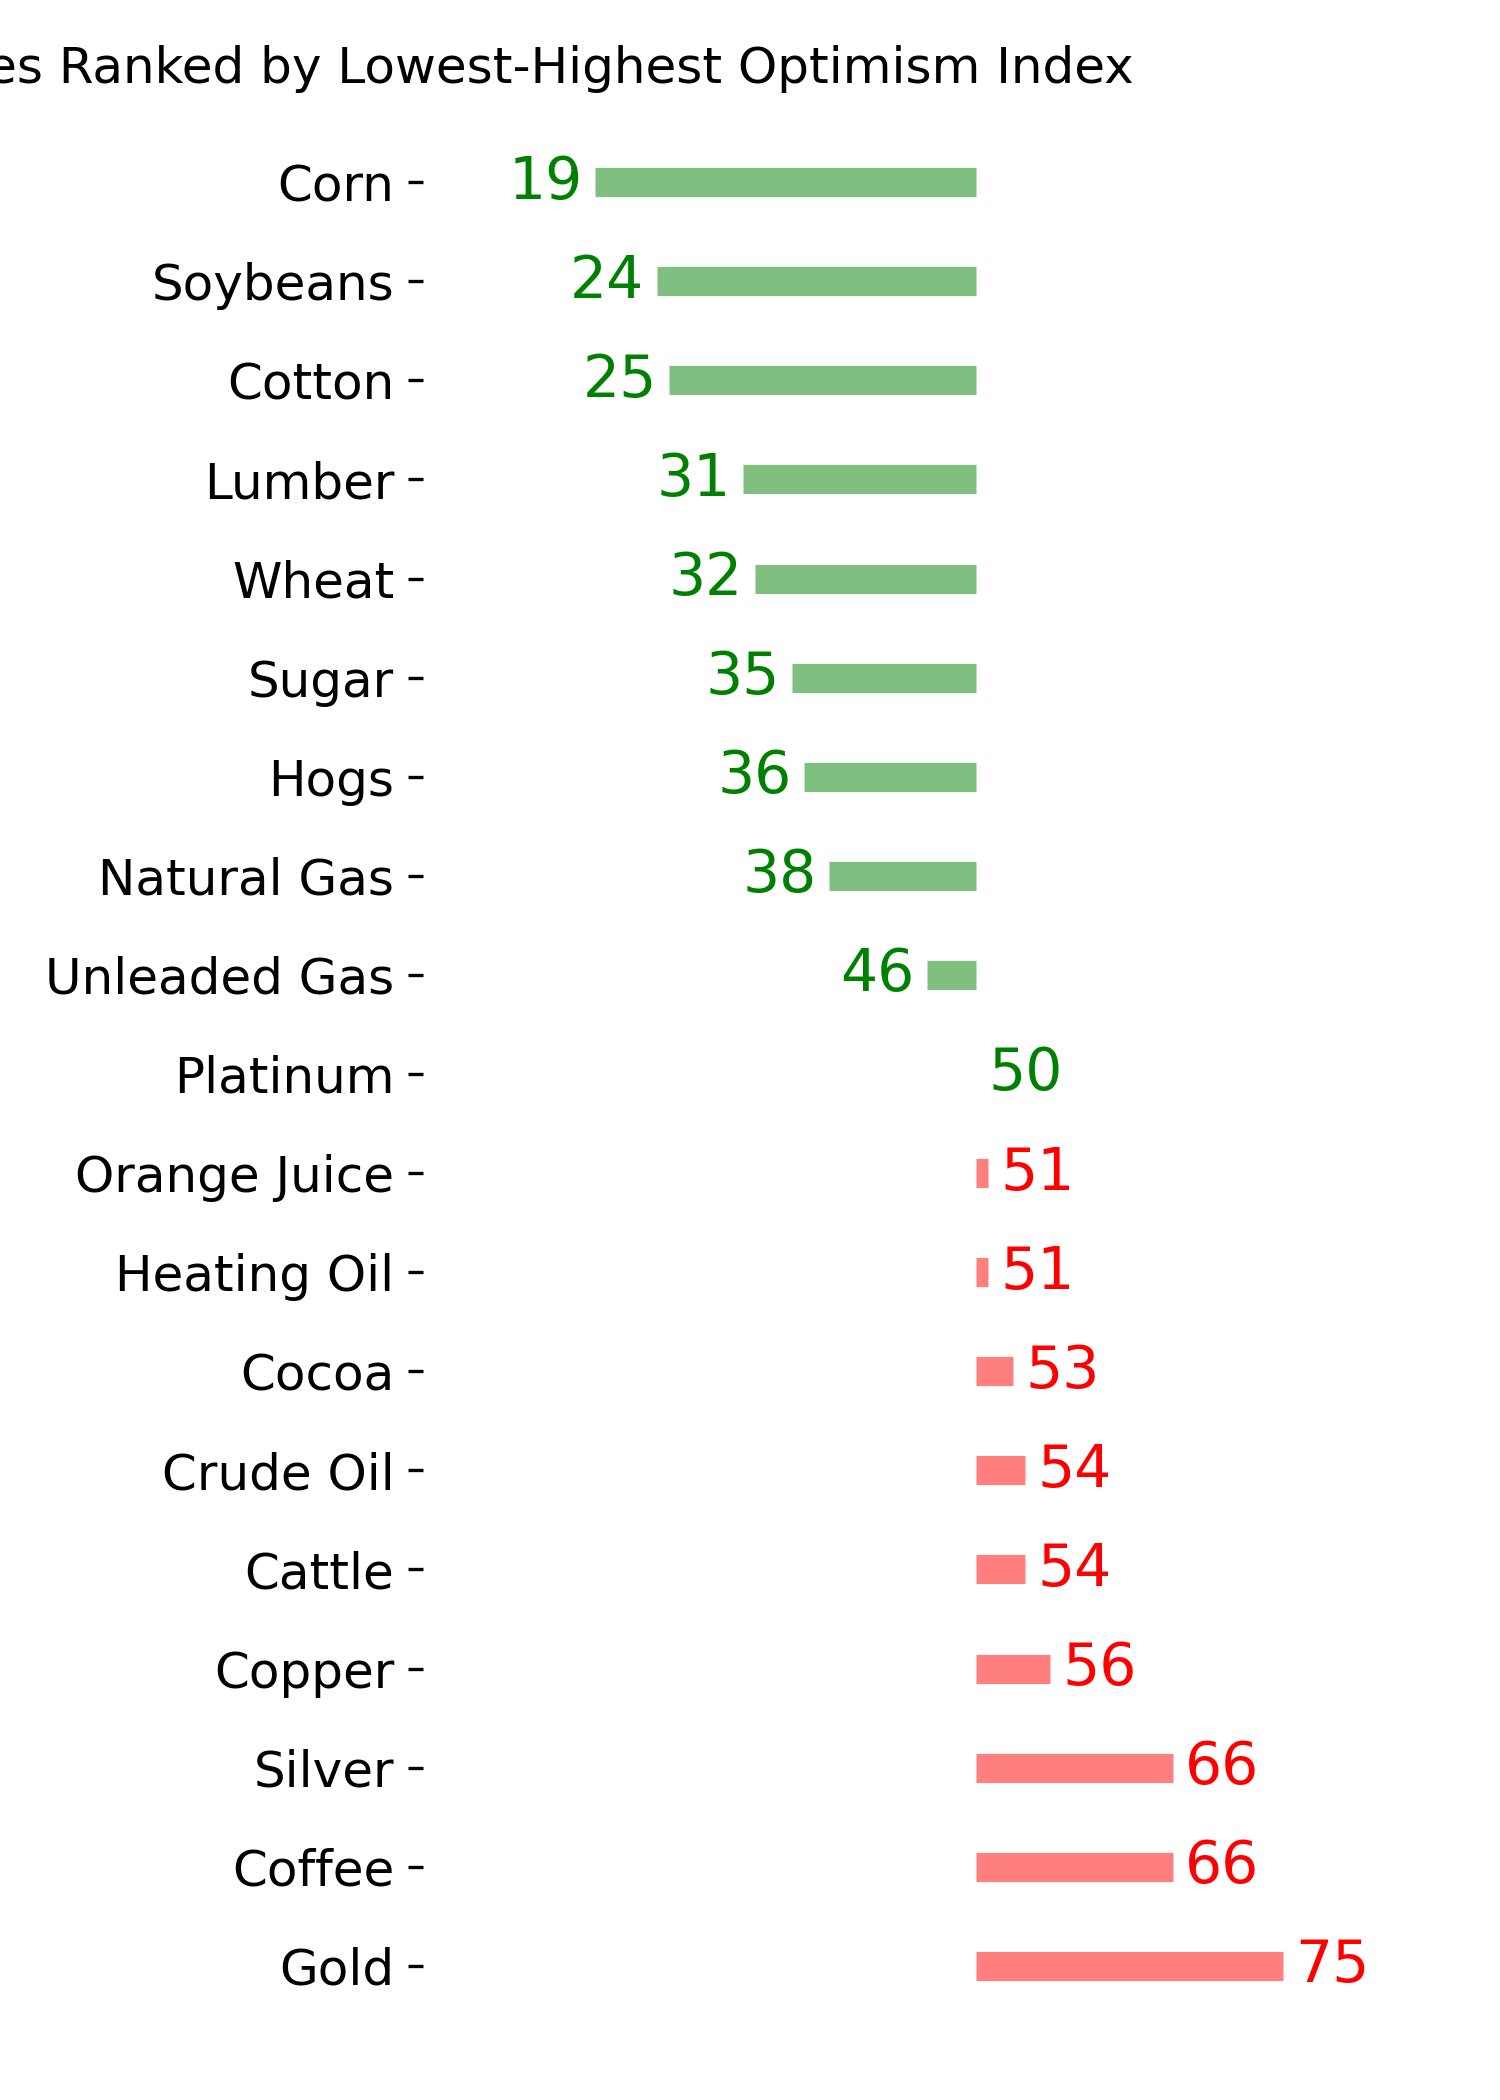
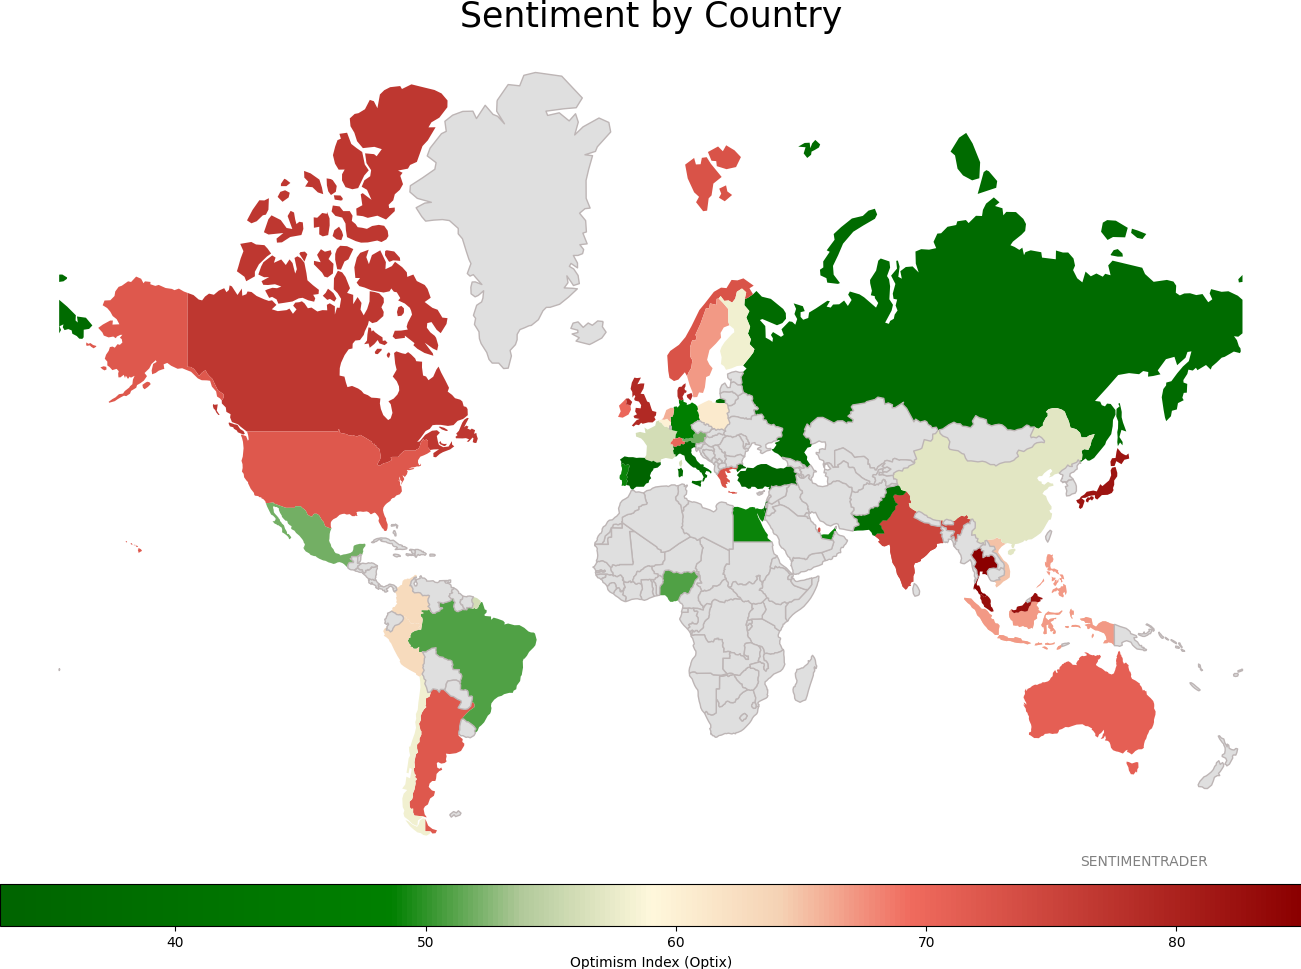
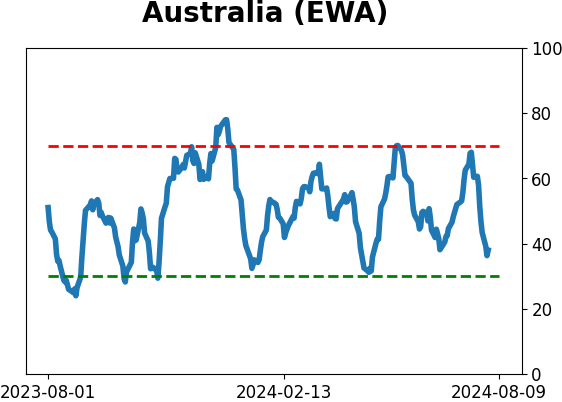
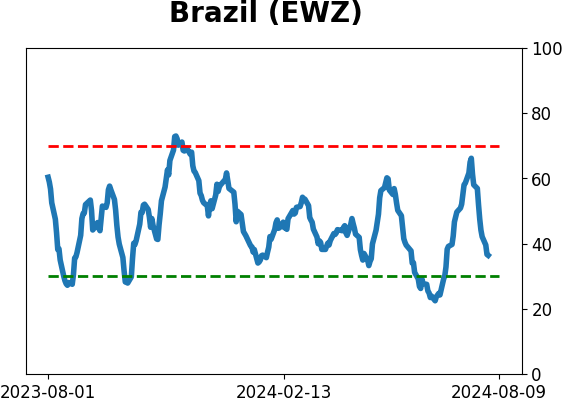
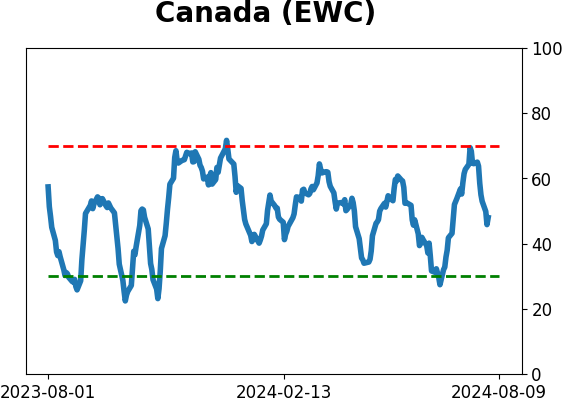
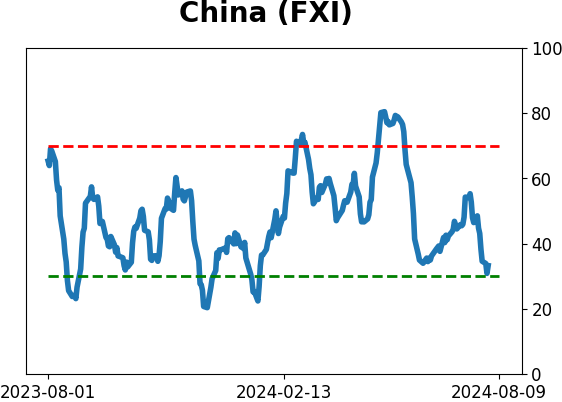
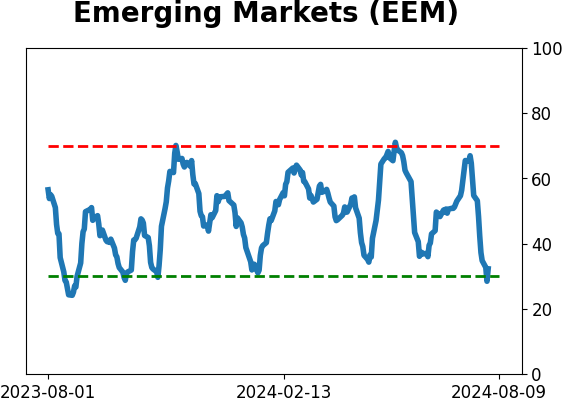
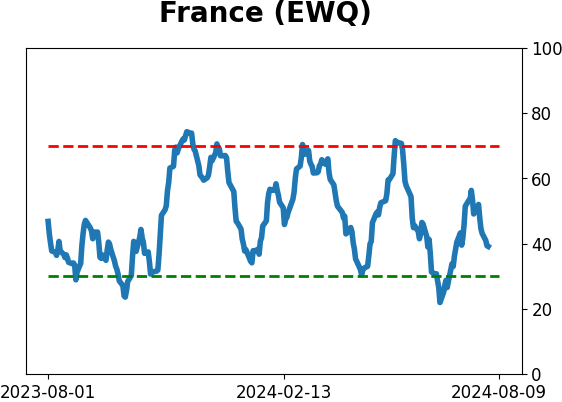
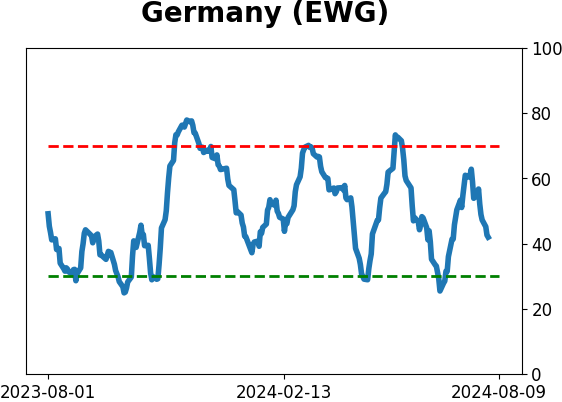
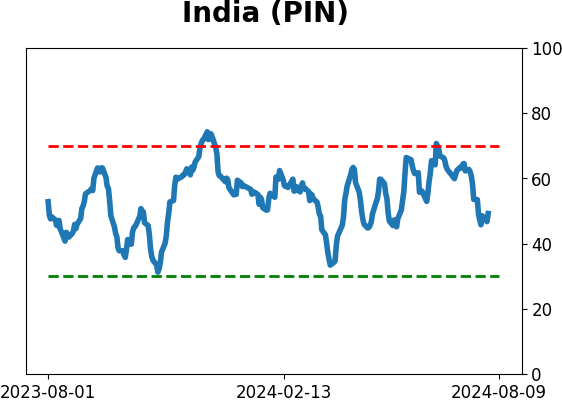
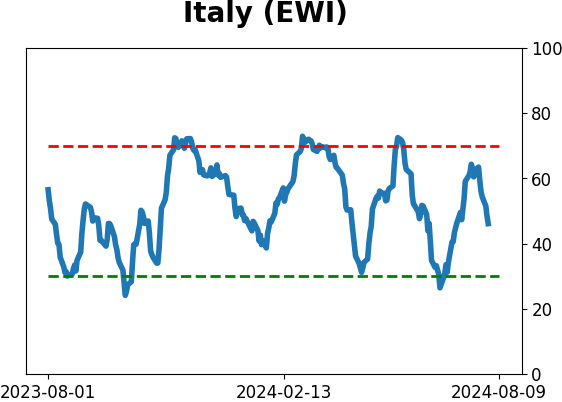
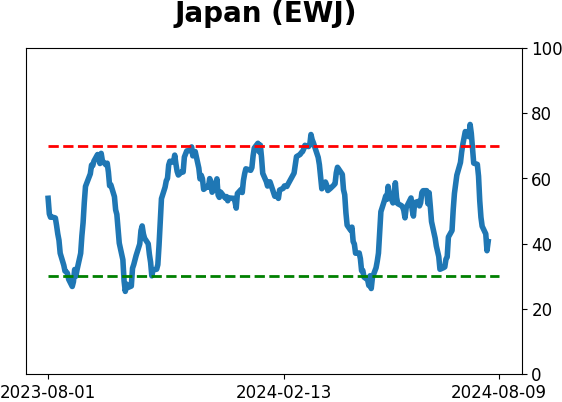
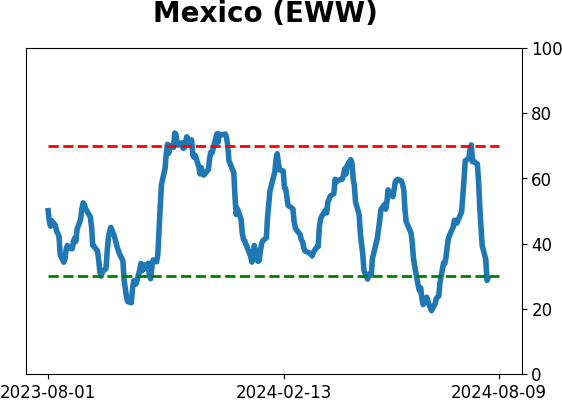
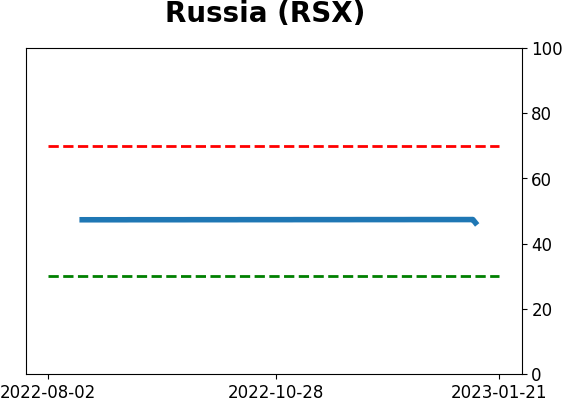
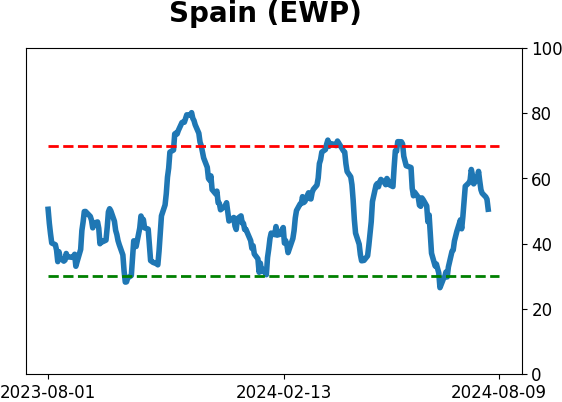
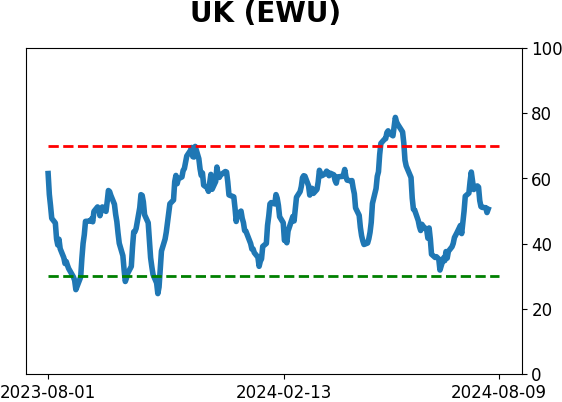
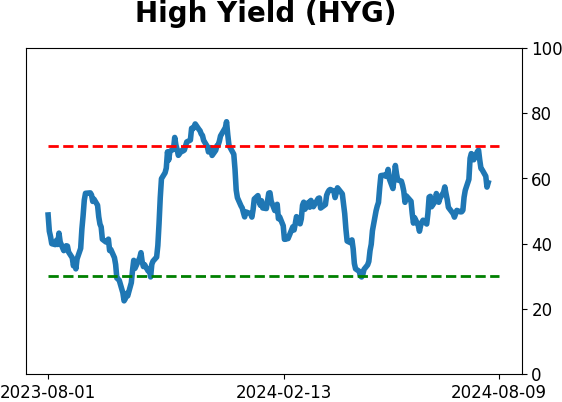
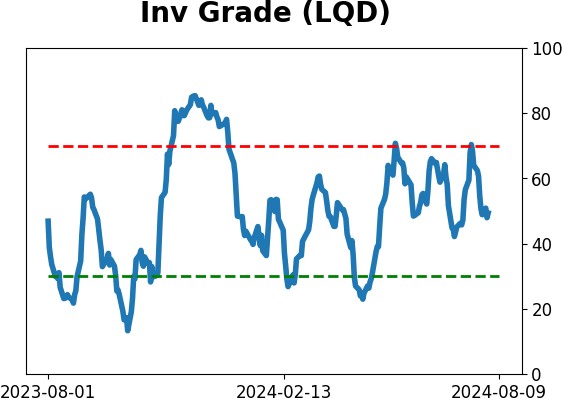
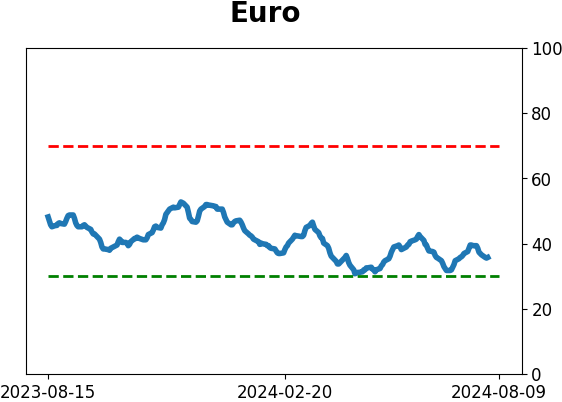
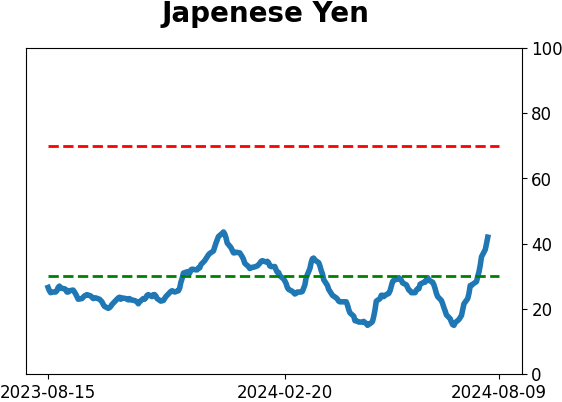
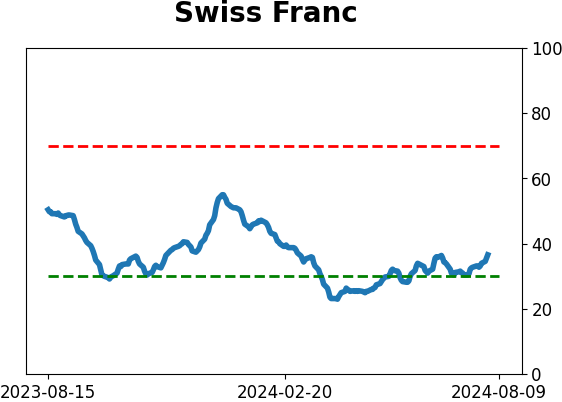
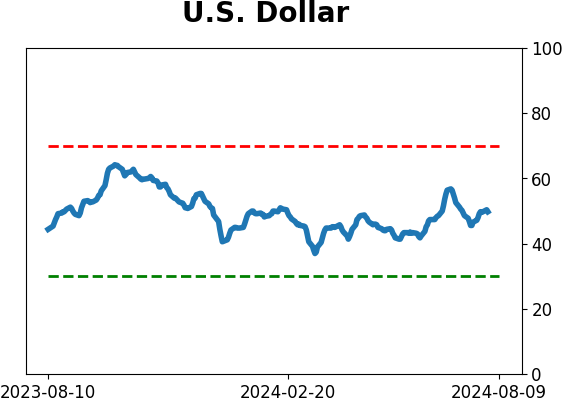
Sentiment Around The World
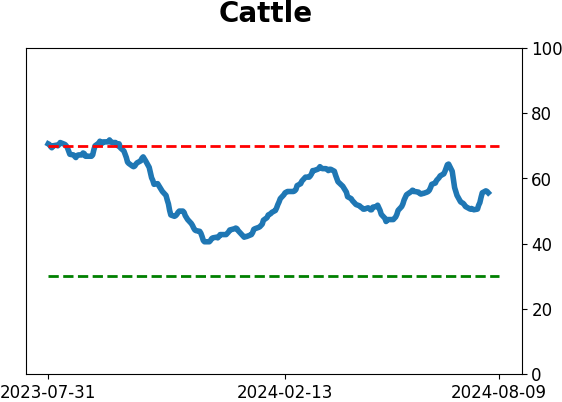
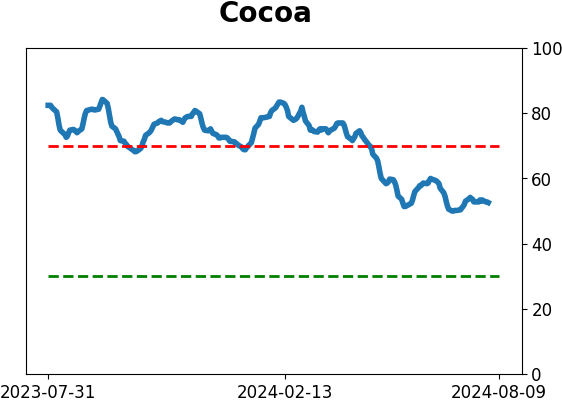
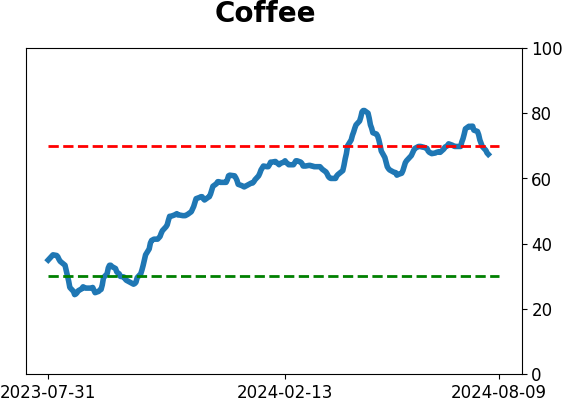
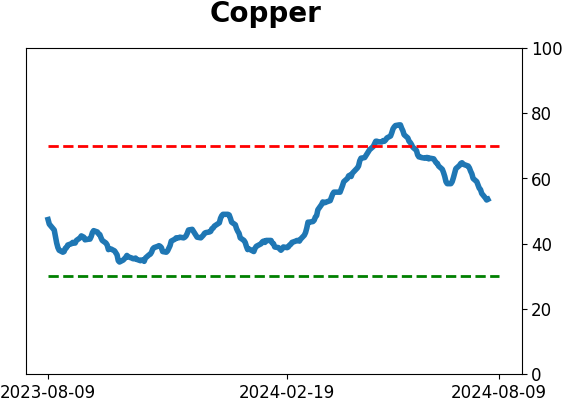
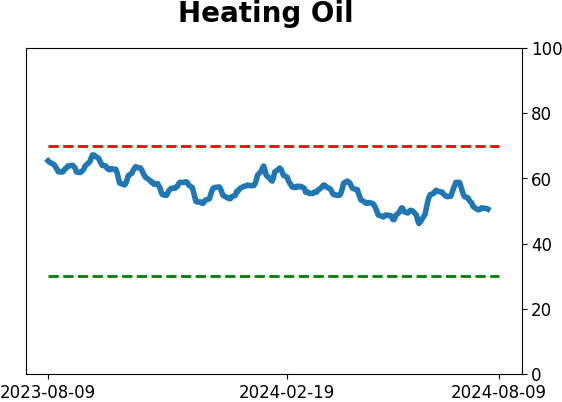
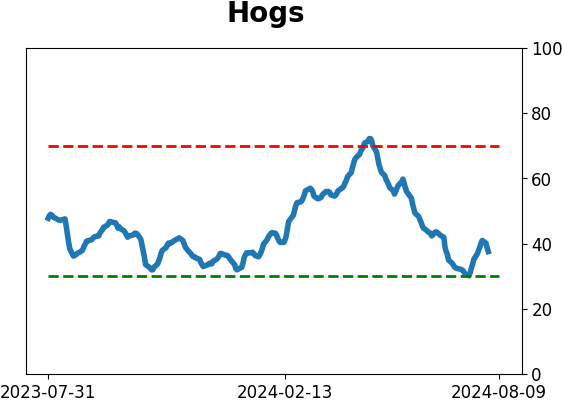
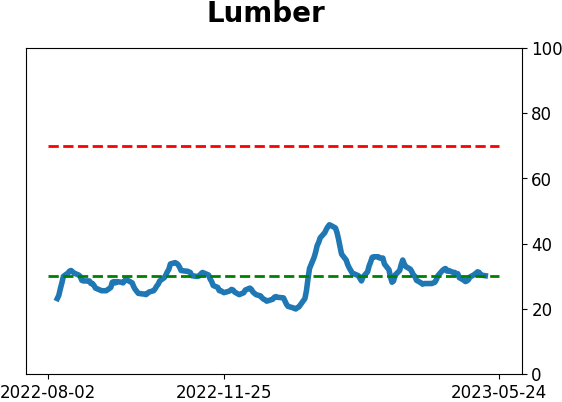
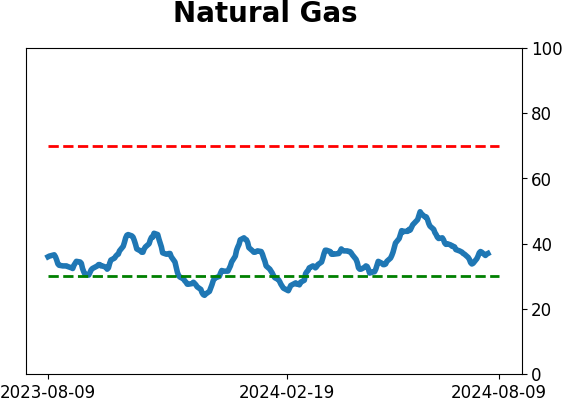
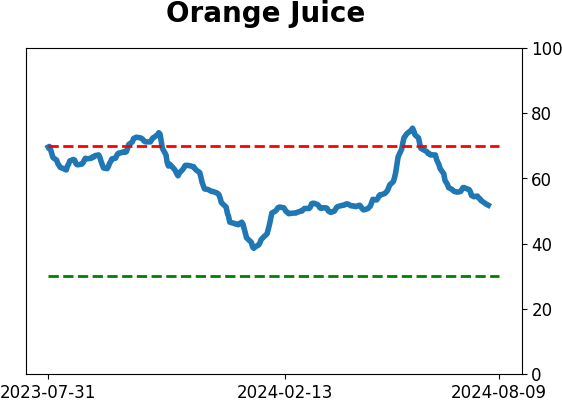
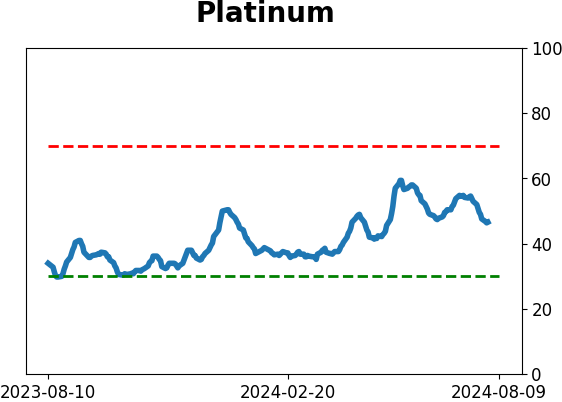
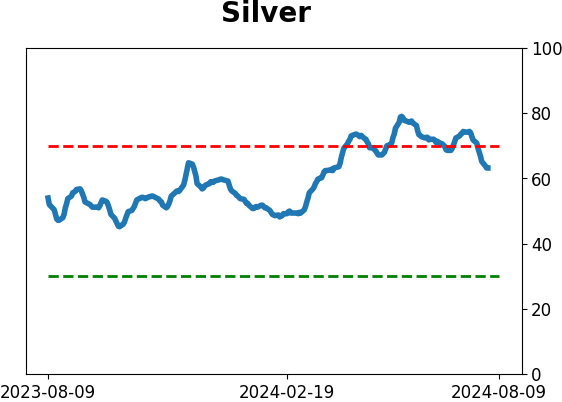
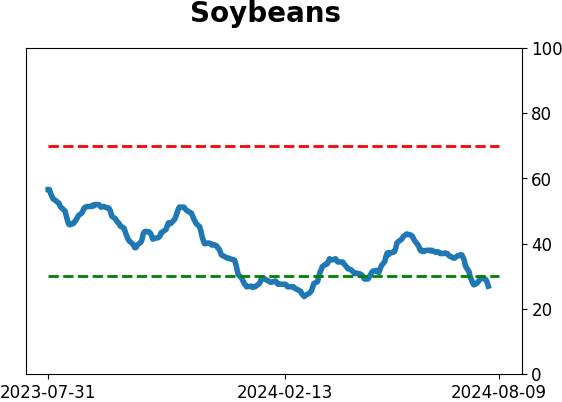
Optimism Index Thumbnails
|
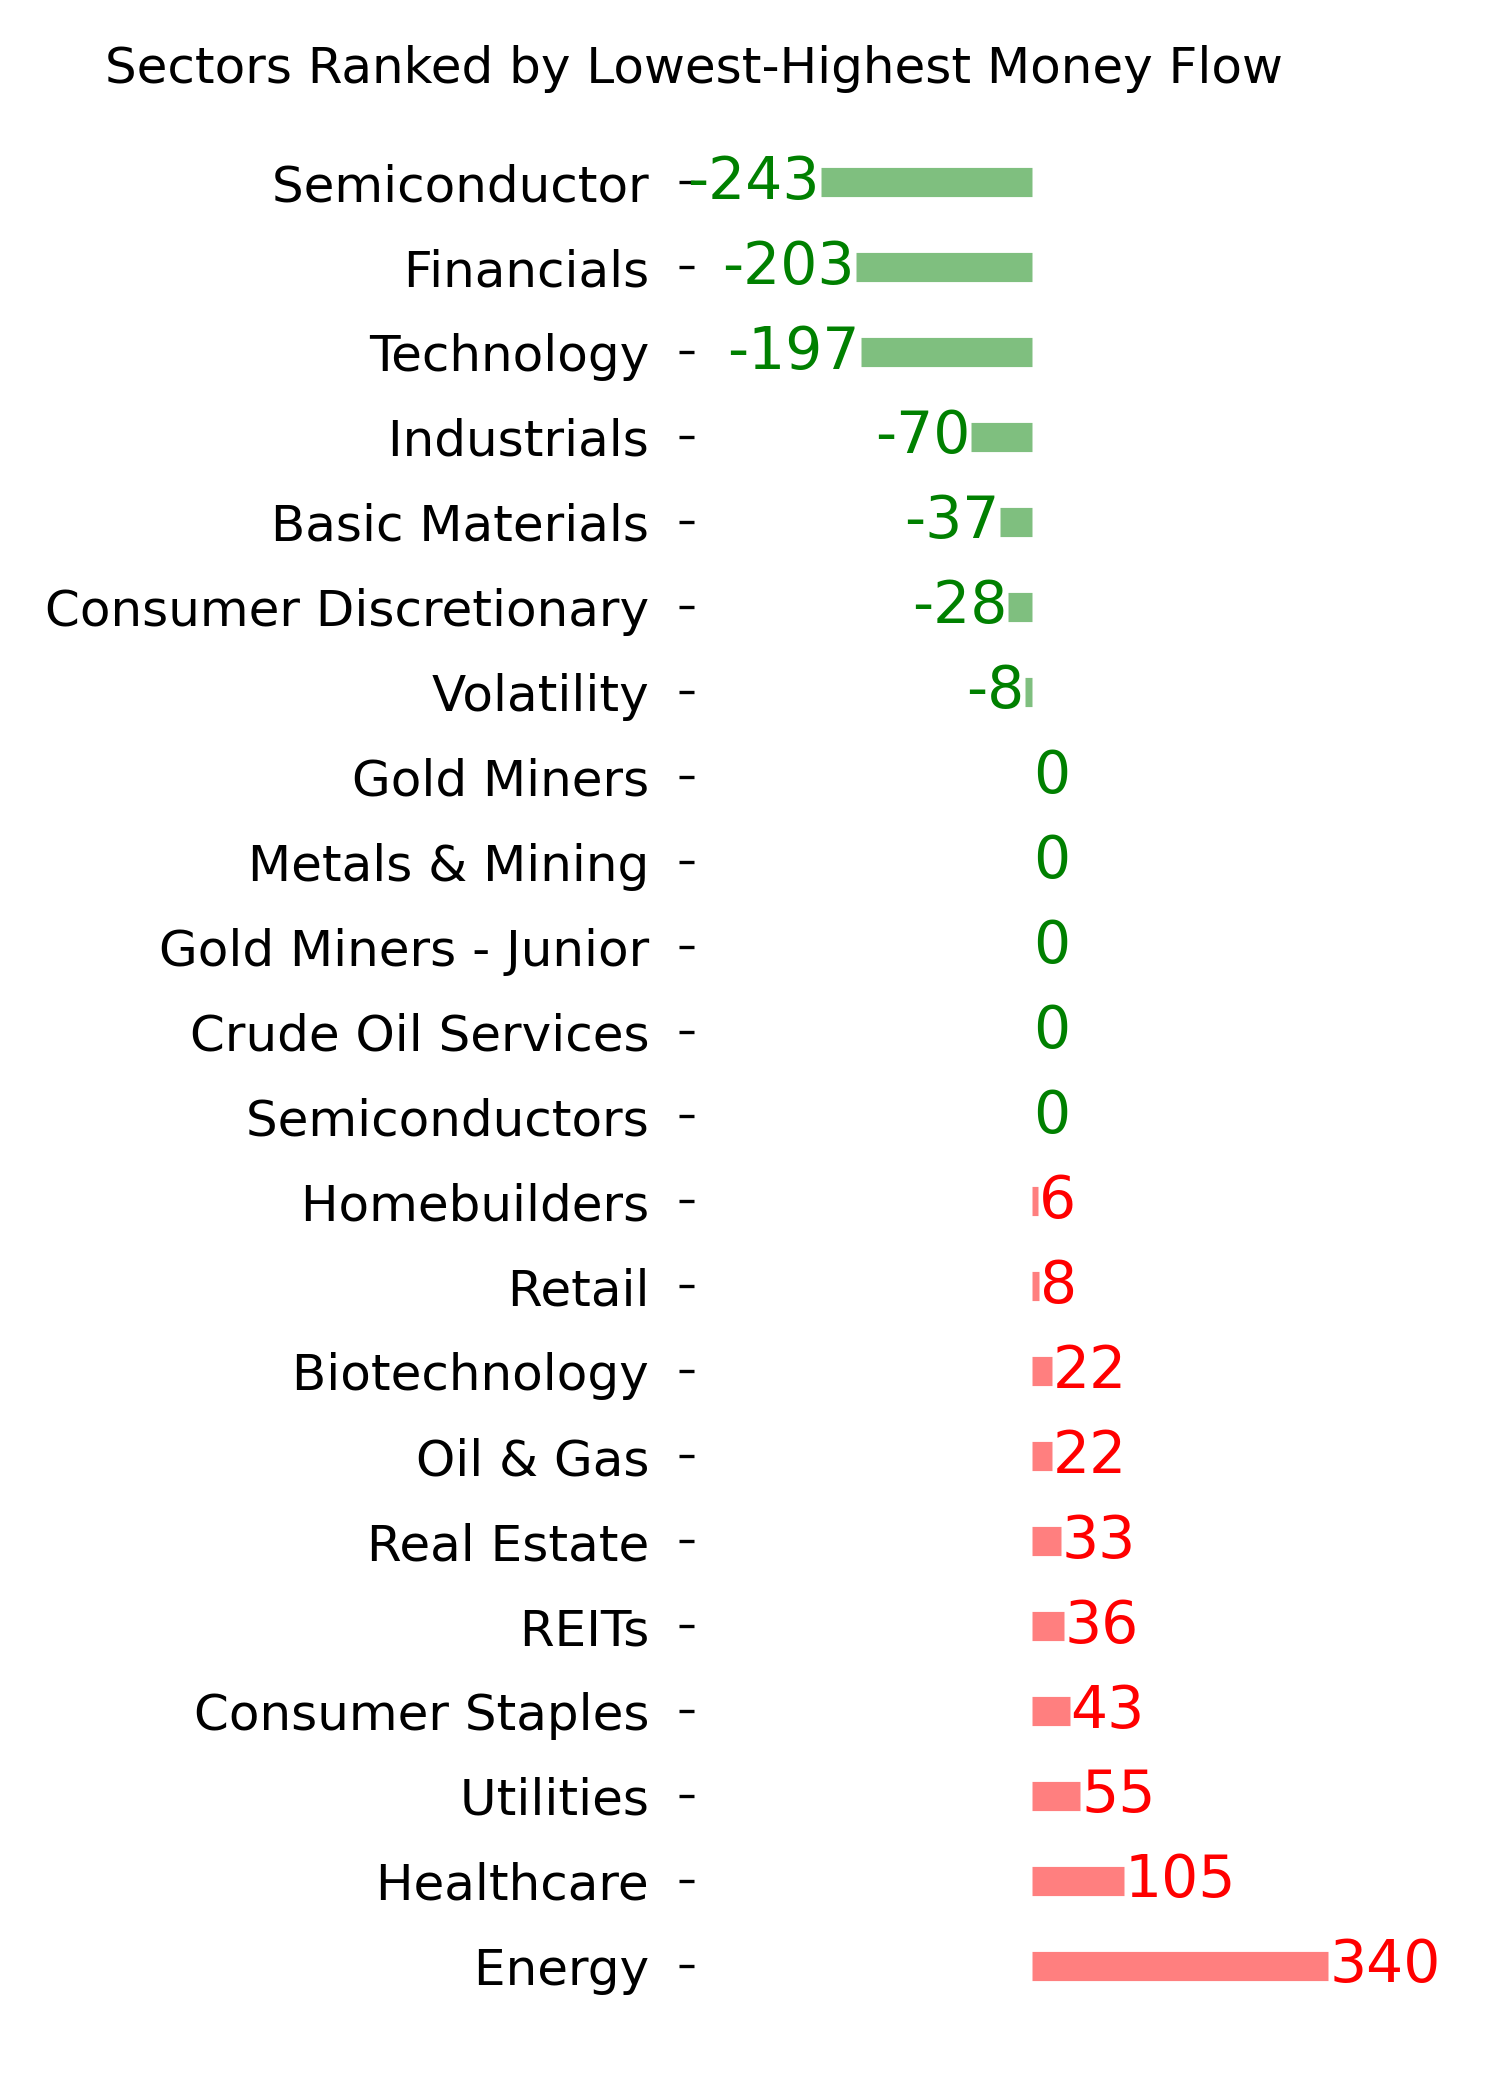
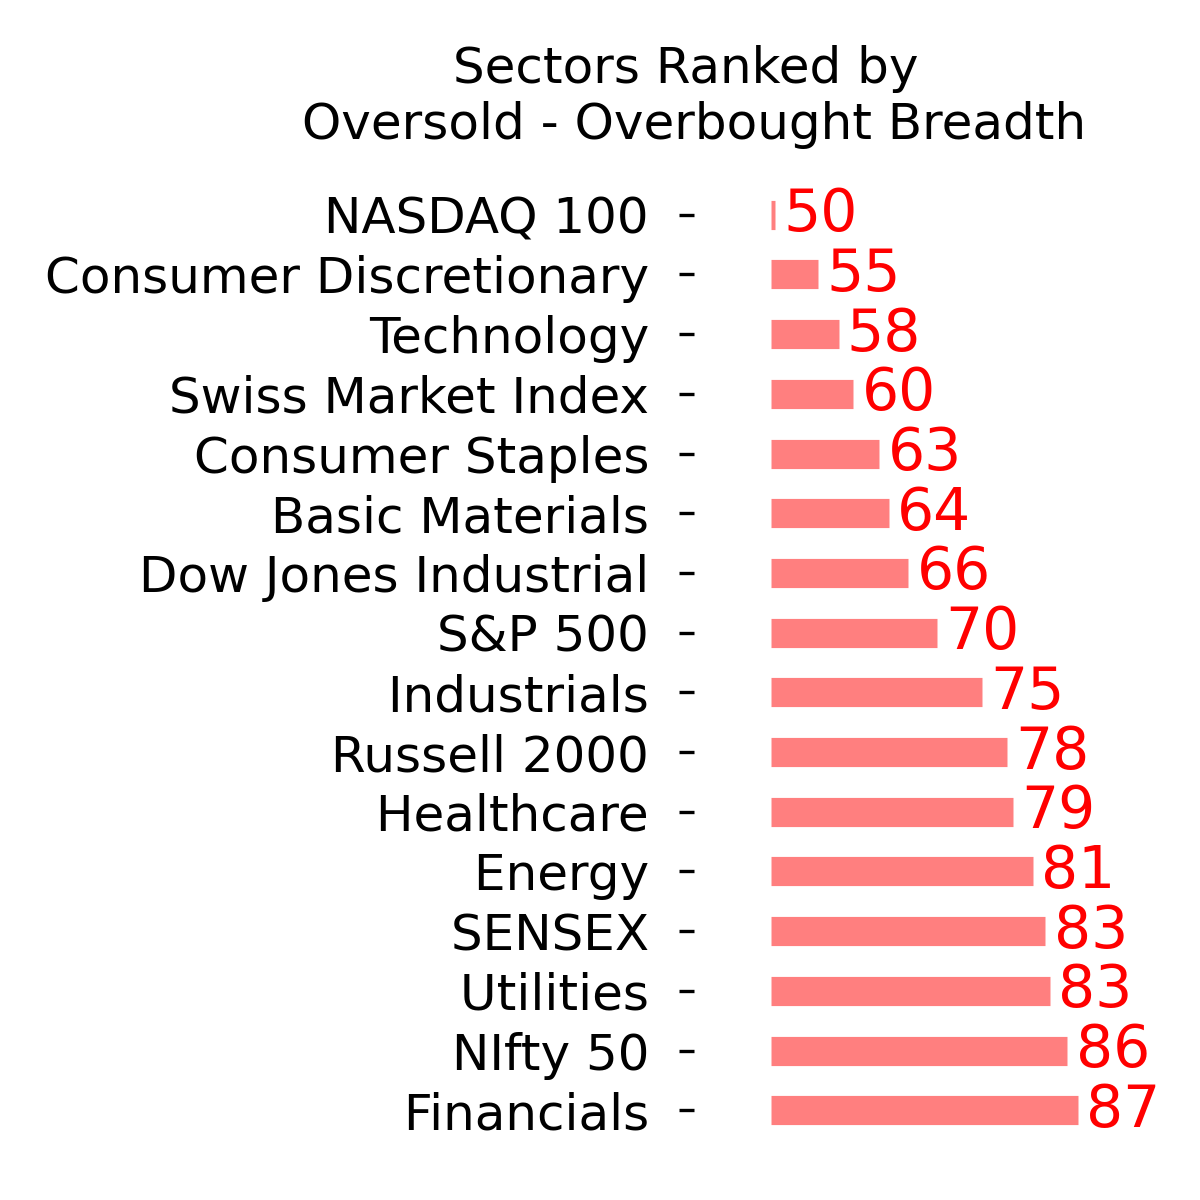
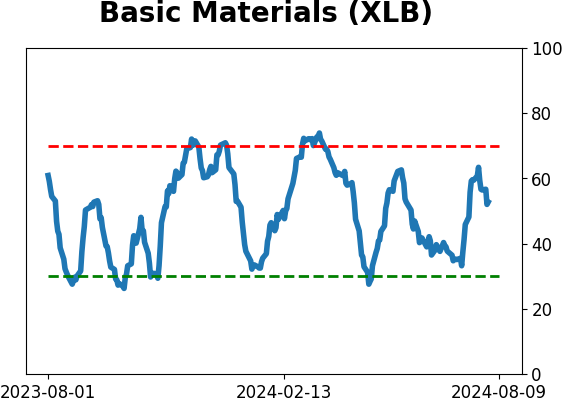
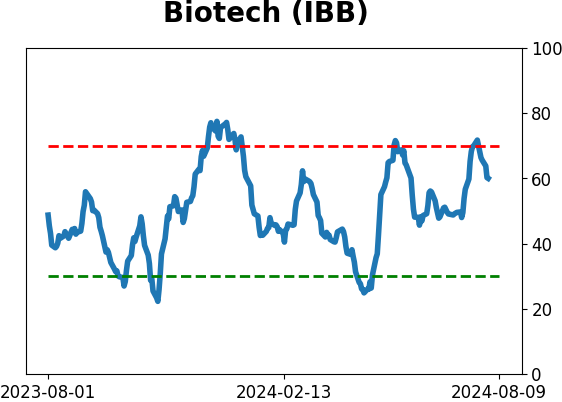
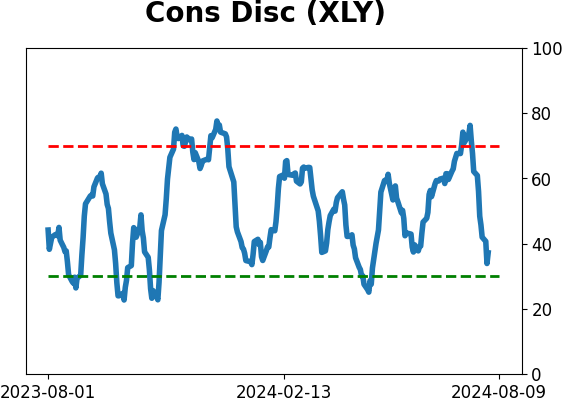
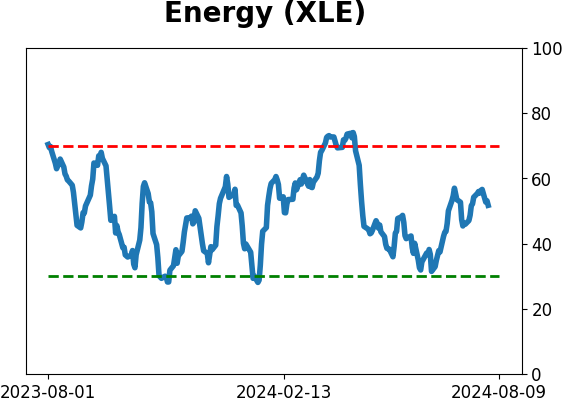
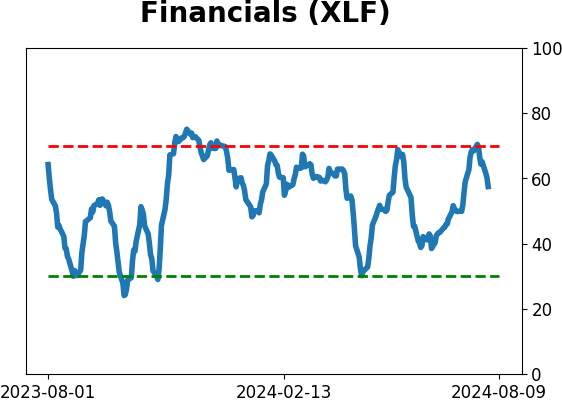
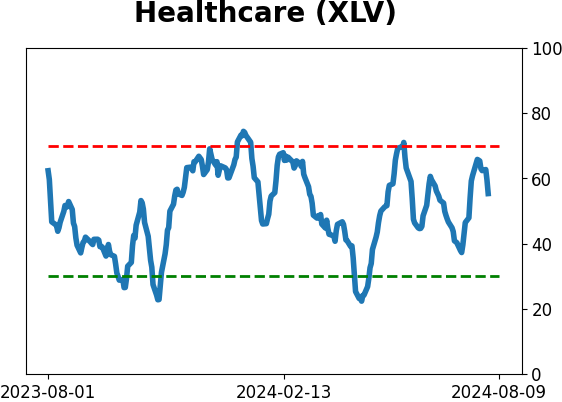
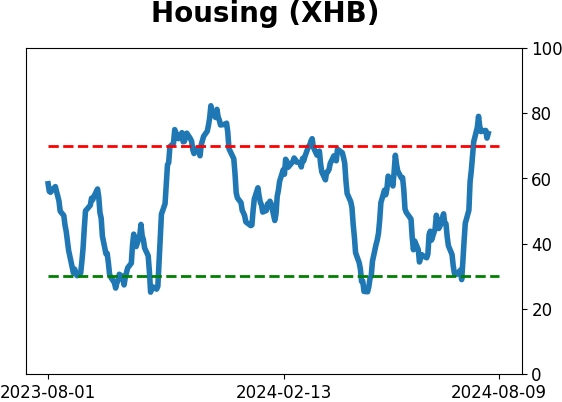
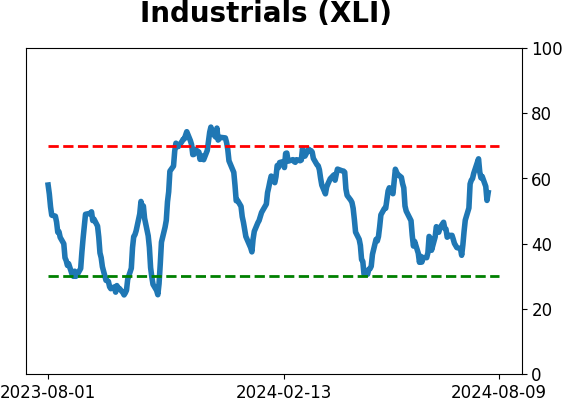
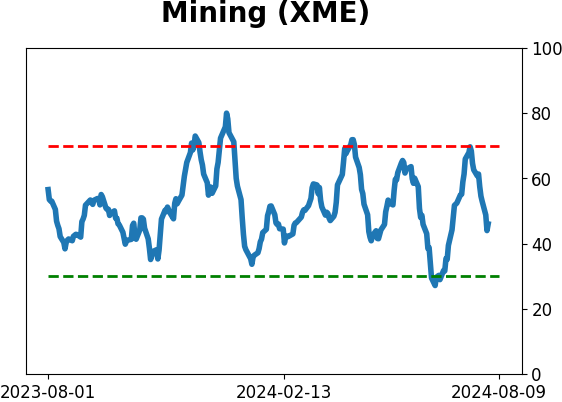
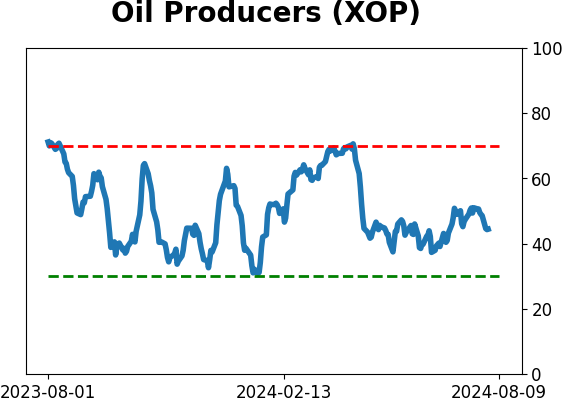
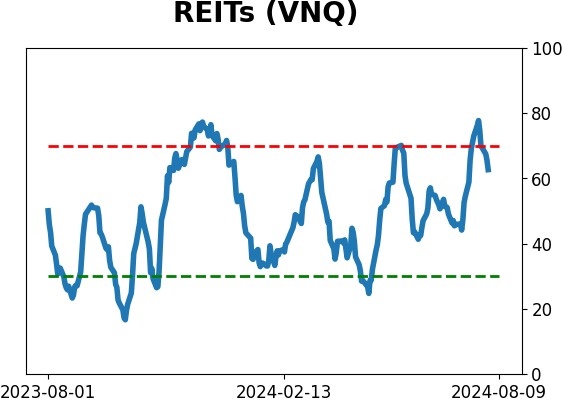
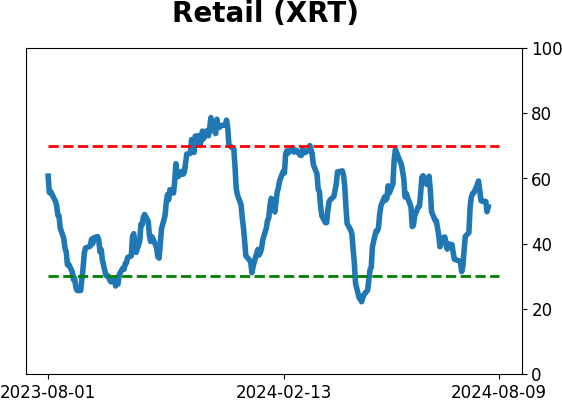
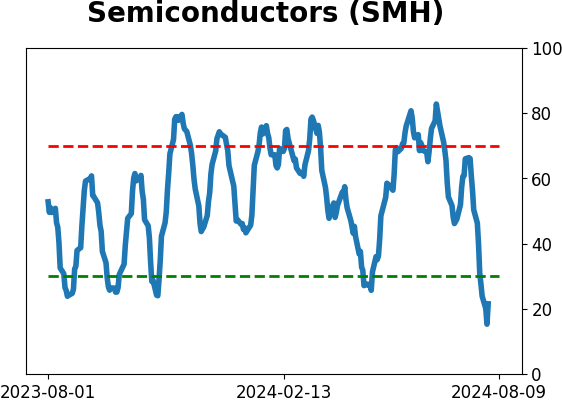
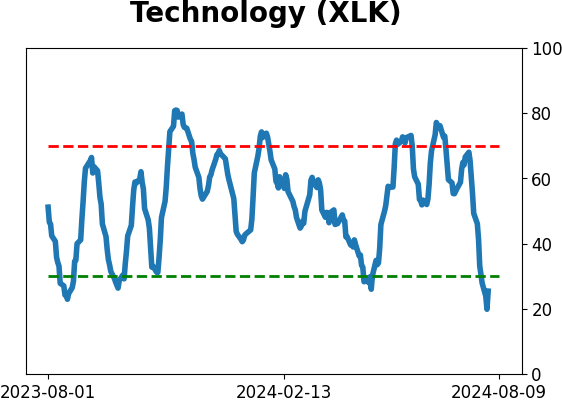
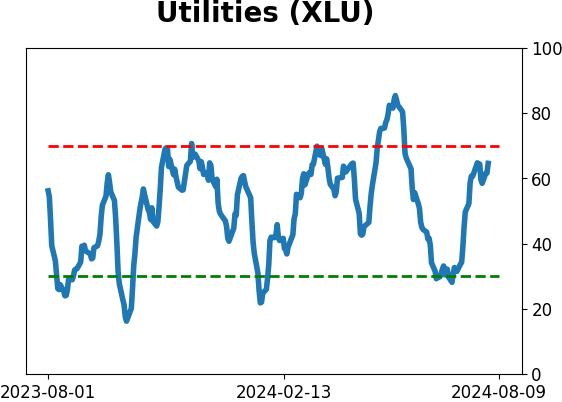
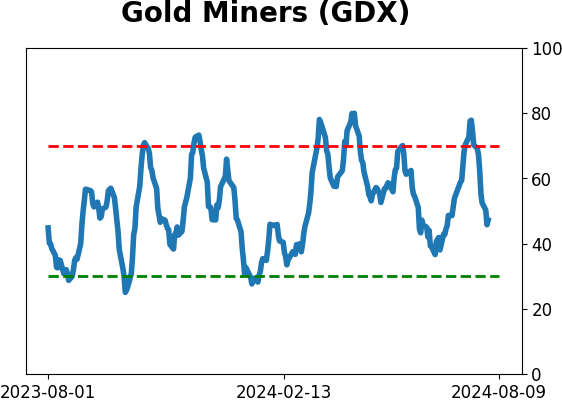
Sector ETF's - 10-Day Moving Average
|
|
|
Country ETF's - 10-Day Moving Average
|
|
|
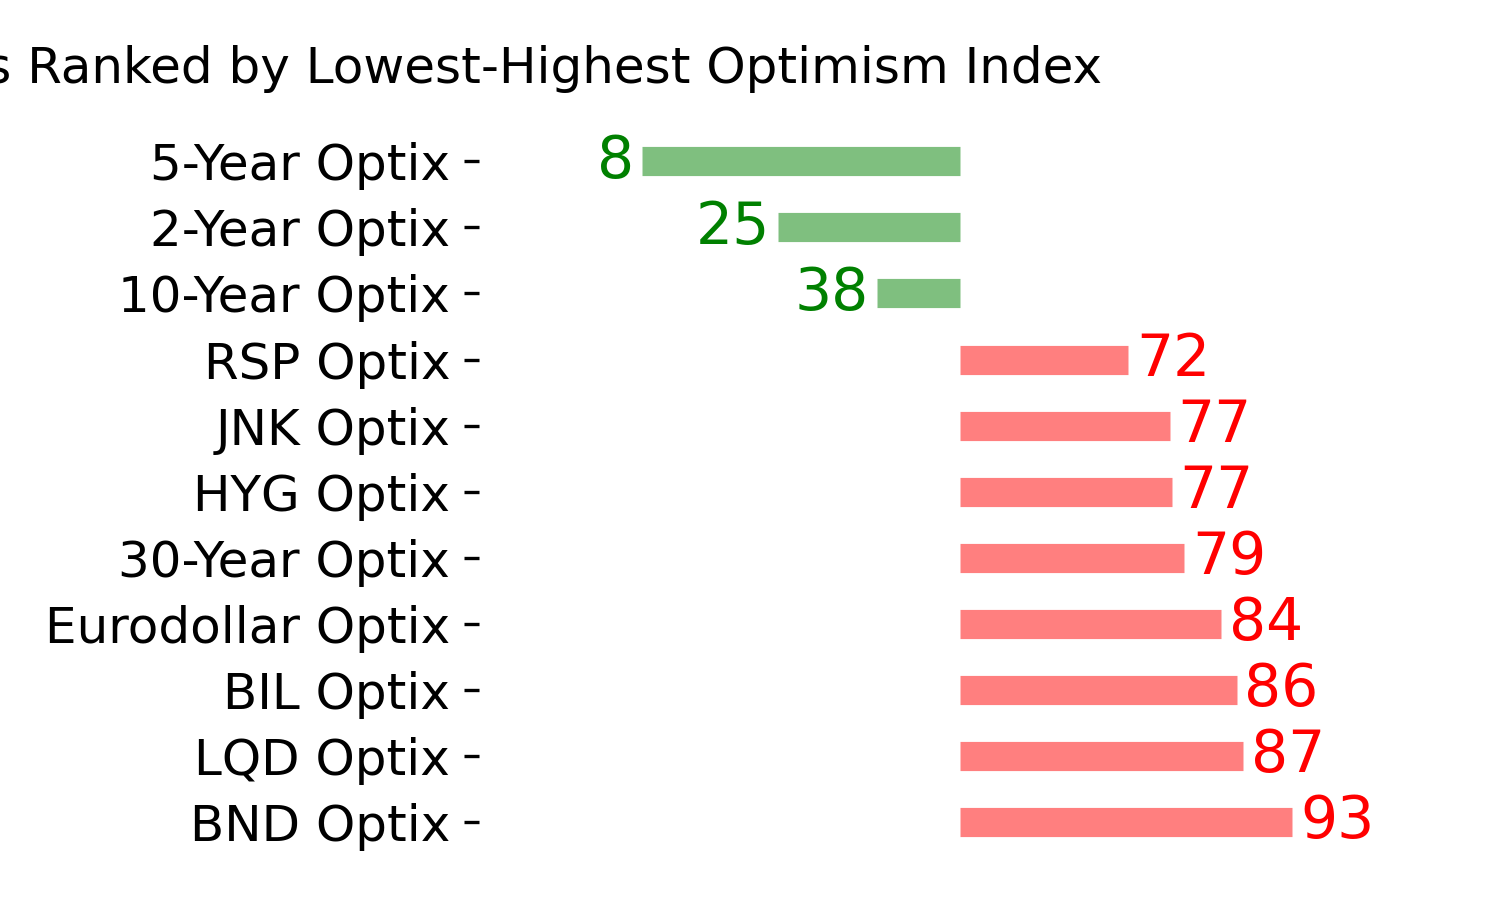
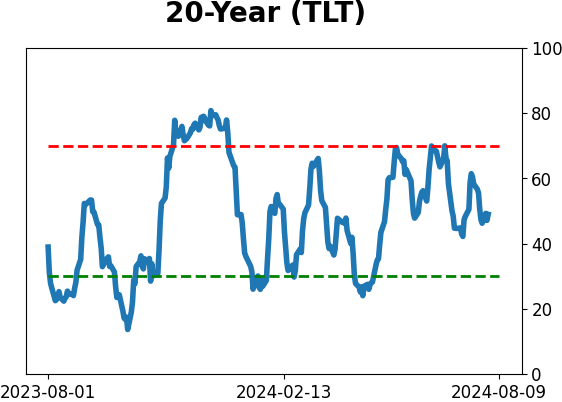
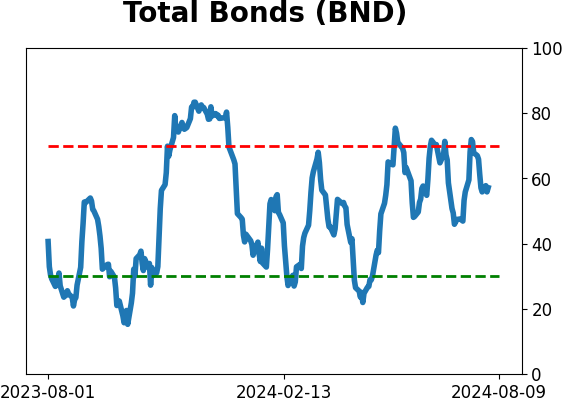
Bond ETF's - 10-Day Moving Average
|
|
|
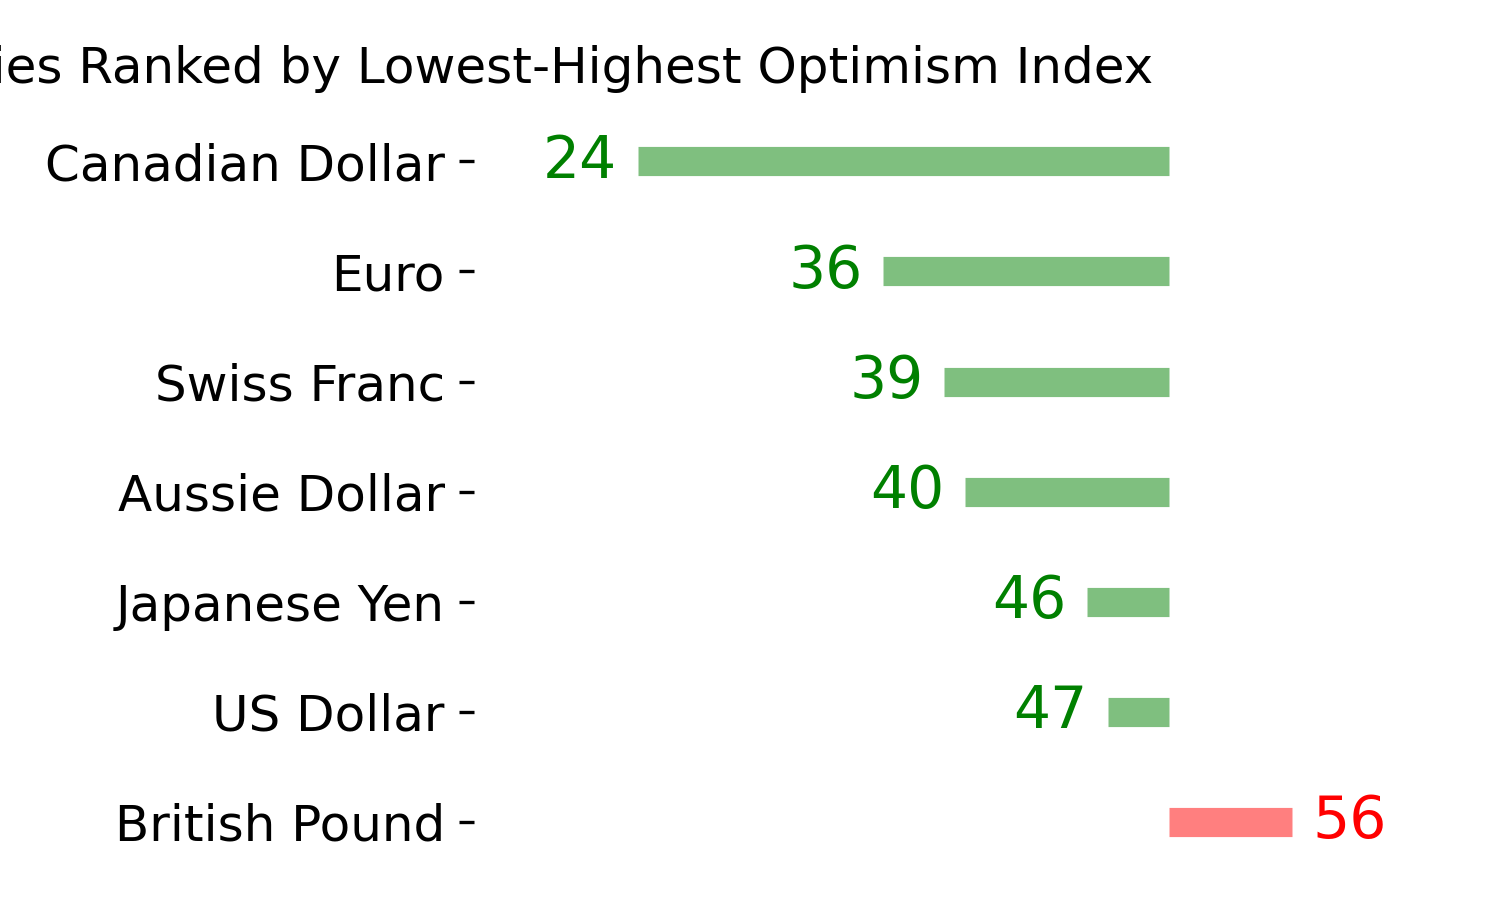
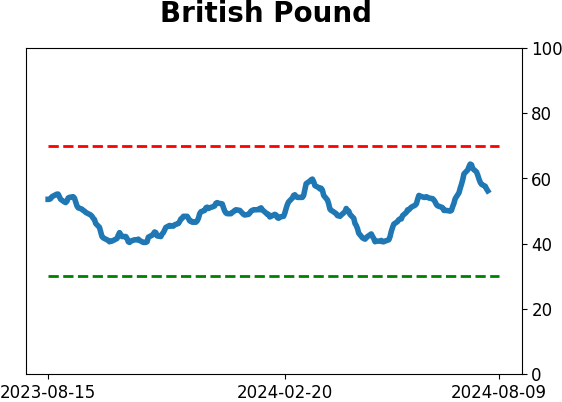
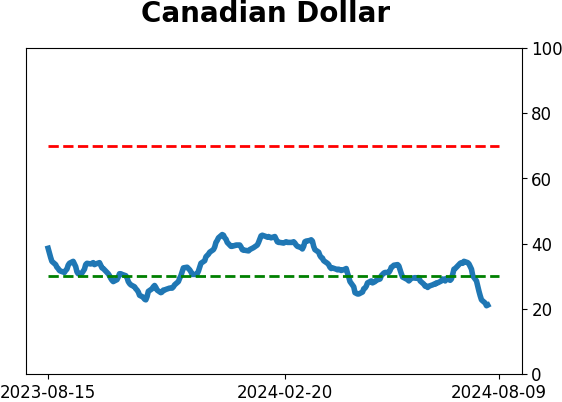
Currency ETF's - 5-Day Moving Average
|
|
|
Commodity ETF's - 5-Day Moving Average
|
|