Headlines
|
|
After more than a year, the S&P exits a pullback:
The S&P 500 has climbed to within 5% of its all-time high, ending a streak of more than 300 trading days in a pullback. After the index ended other long pullback streaks, it took an average of about two months to reach a new all-time high. Its returns going forward were good, with minimal risk.
|
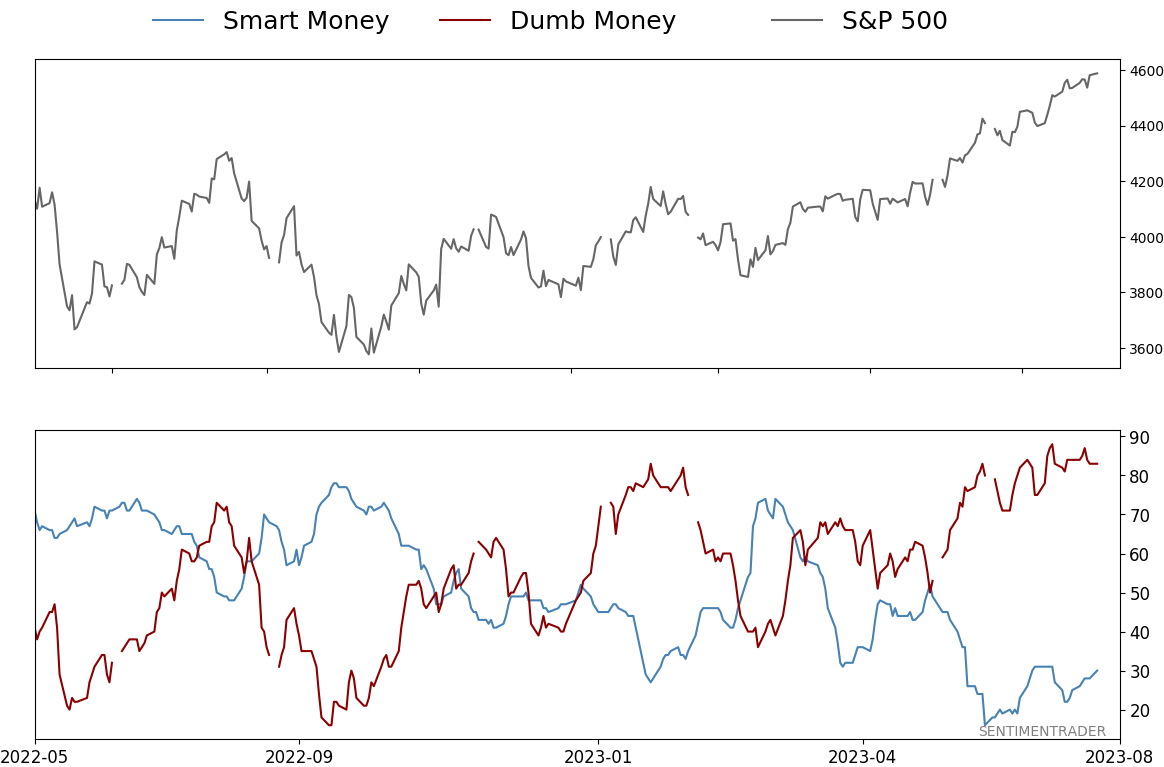
Smart / Dumb Money Confidence
|
Smart Money Confidence: 30%
Dumb Money Confidence: 83%
|
|
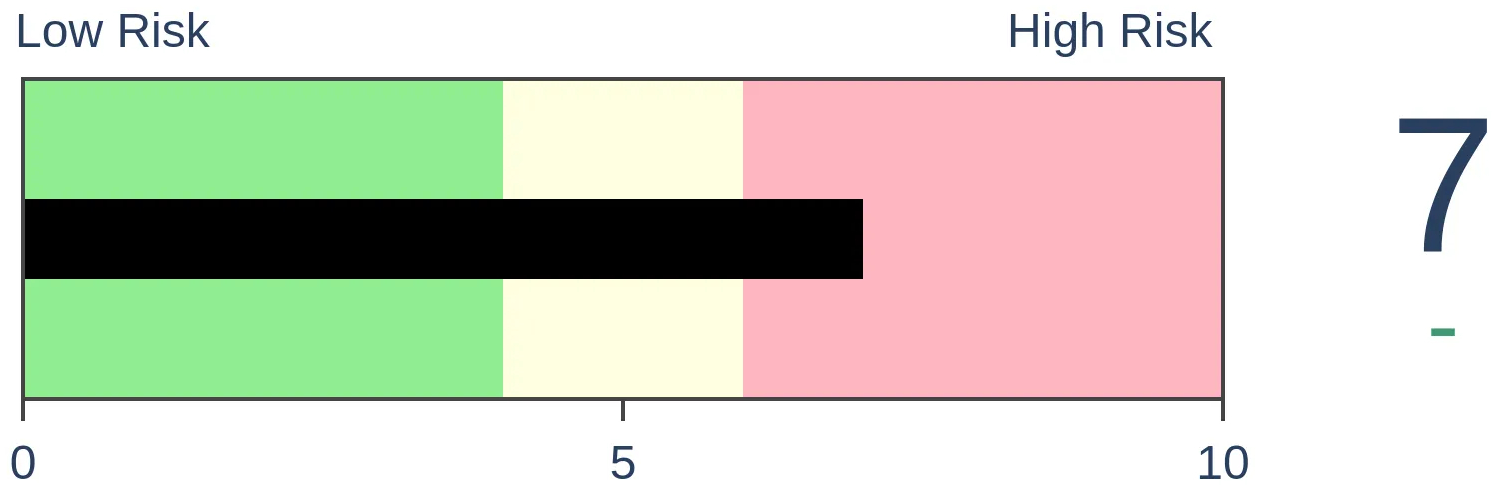
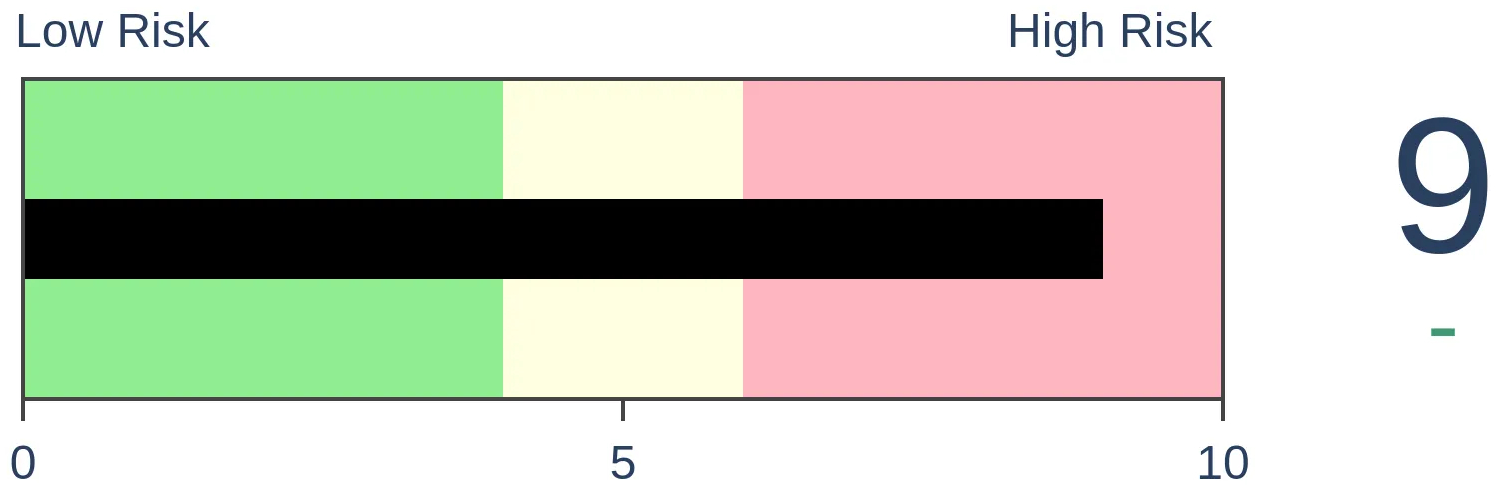
Risk Levels
Stocks Short-Term
|
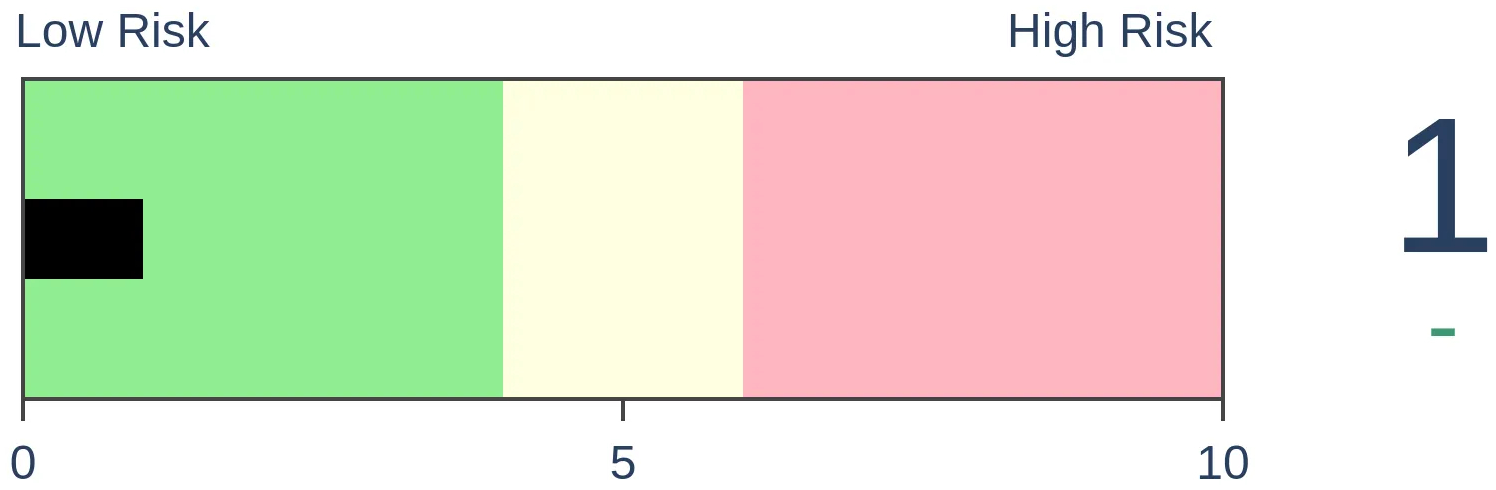
Stocks Medium-Term
|
|
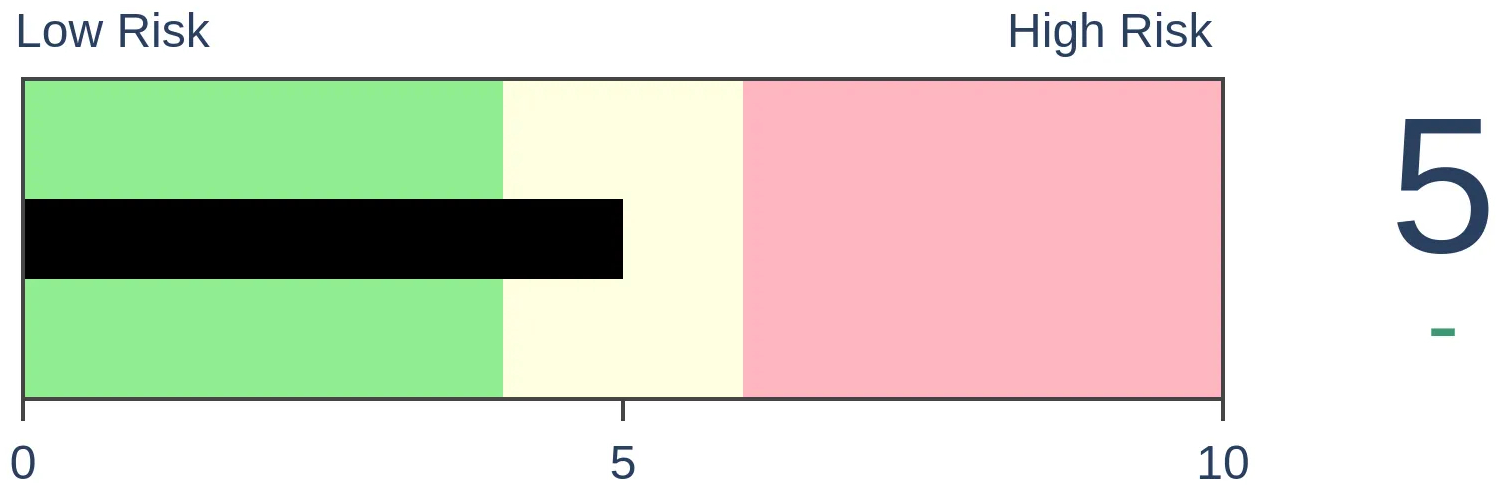
Bonds
|
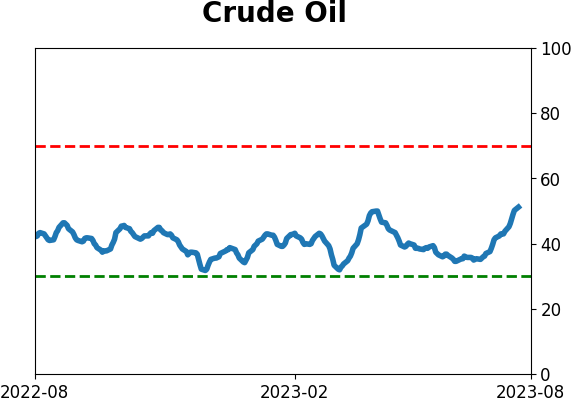
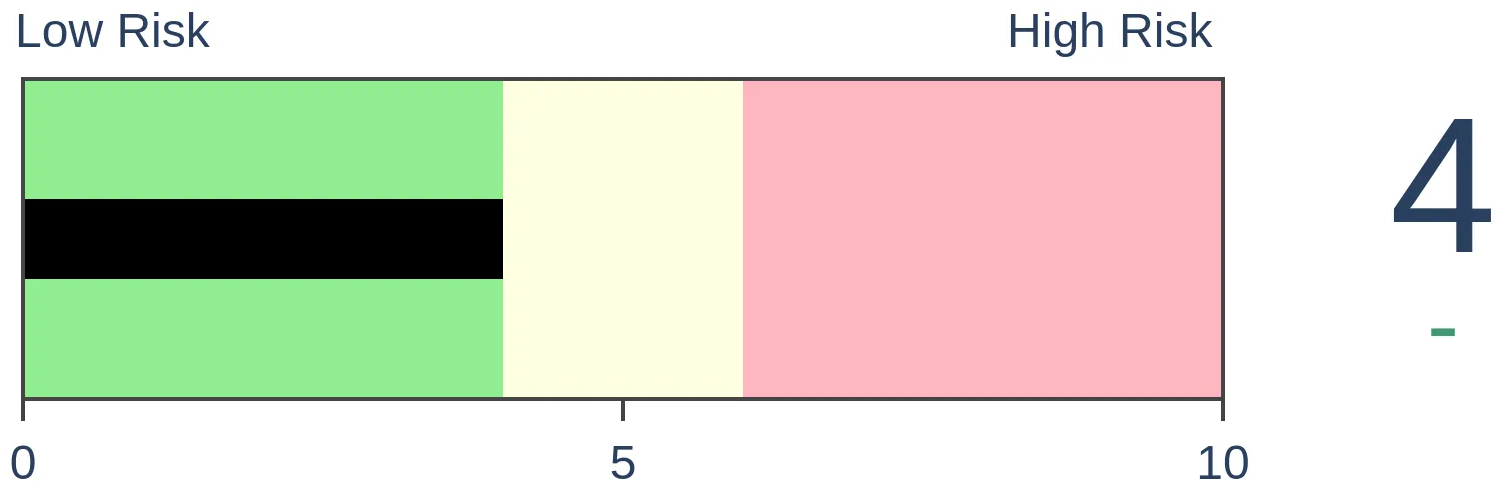
Crude Oil
|
|
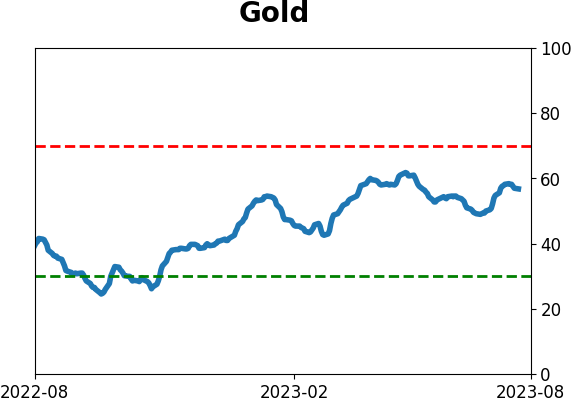
Gold

|
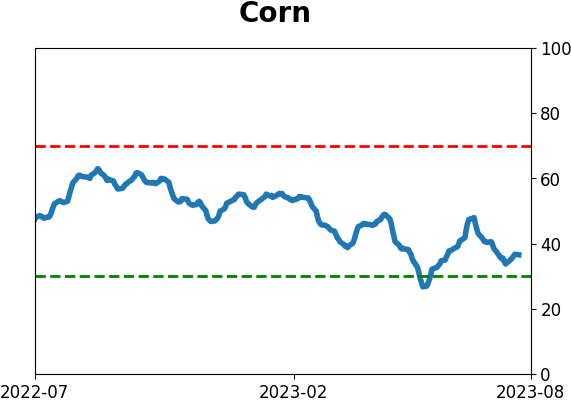
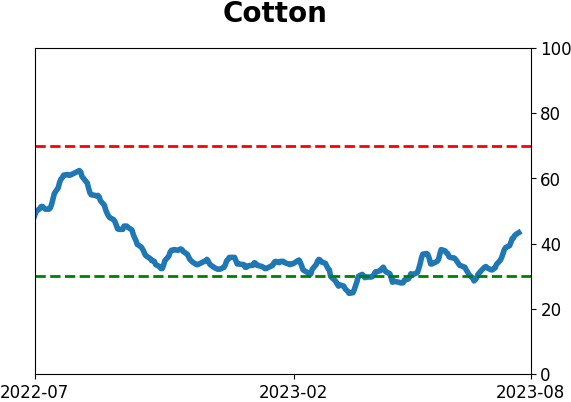
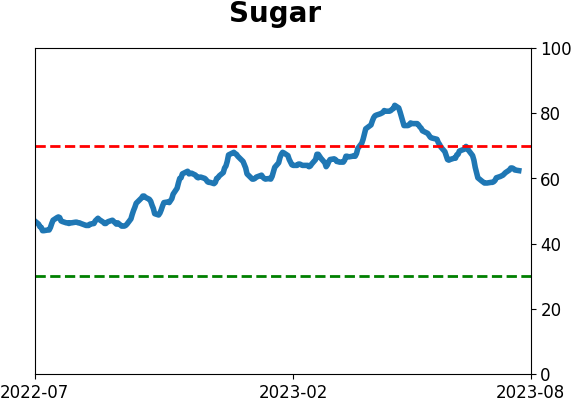
Agriculture
|
|
Research
By Jason Goepfert
BOTTOM LINE
The S&P 500 has climbed to within 5% of its all-time high, ending a streak of more than 300 trading days in a pullback. After the index ended other long pullback streaks, it took an average of about two months to reach a new all-time high. Its returns going forward were good, with minimal risk.
FORECAST / TIMEFRAME
None
|
Key points:
- The S&P 500 has moved within 5% of its all-time high, ending a long streak in a pullback
- The ends of other very long streaks in a pullback preceded more gains in the index every time
- It took an average of a little over two months for the S&P to close the gap and hit a new all-time high
The most important index is nearing its most important price
Last week, the most benchmarked index in the world climbed out of pullback territory. That's a subjective term denoting a decline of at least 5% from a recent high. We've waited a few days to see how the index has reacted, and so far, the reaction has been muted.
The S&P 500 pulling back to within 5% of its all-time high ended a streak of more than 300 trading days that the index was at least in a pullback.
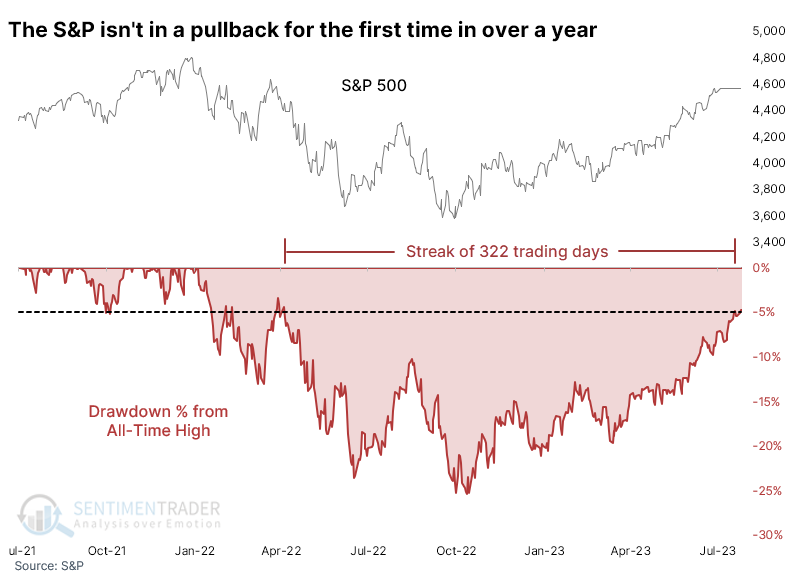
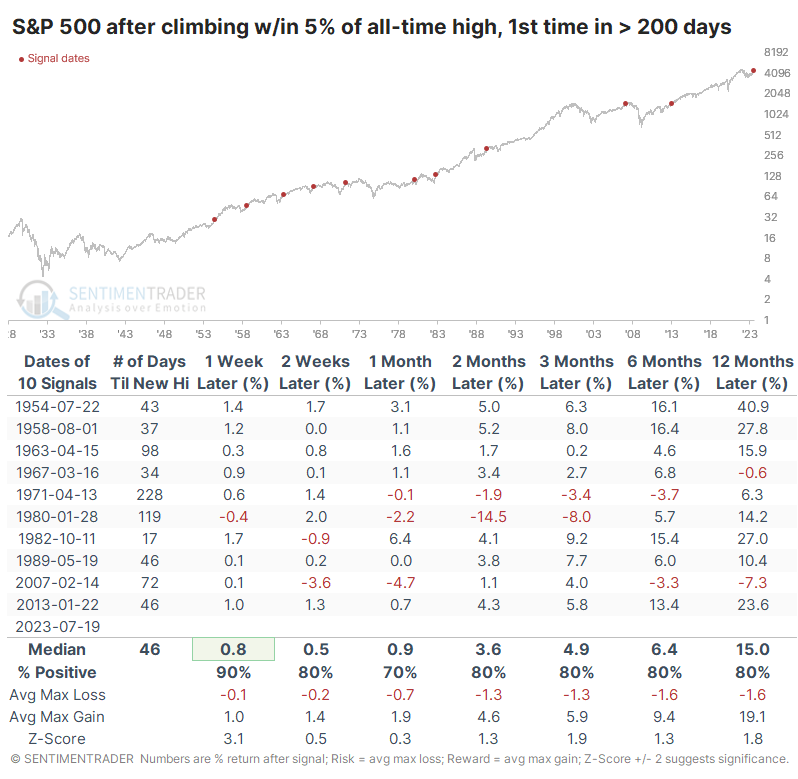
The table below shows how the index performed after ending long stretches in a pullback or worse. After ending streaks of at least 200 days in a pullback, the S&P took a median of 46 trading days before it closed the remaining gap and closed at a new all-time high. Four signals took longer than that, with two taking longer than 100 sessions.
Still, its returns were quite good in the months ahead, with two losses across most time frames, and only one of those, on one time frame, was double-digits. This behavior ended up leading to the financial crisis, but that took a long time to unfold.
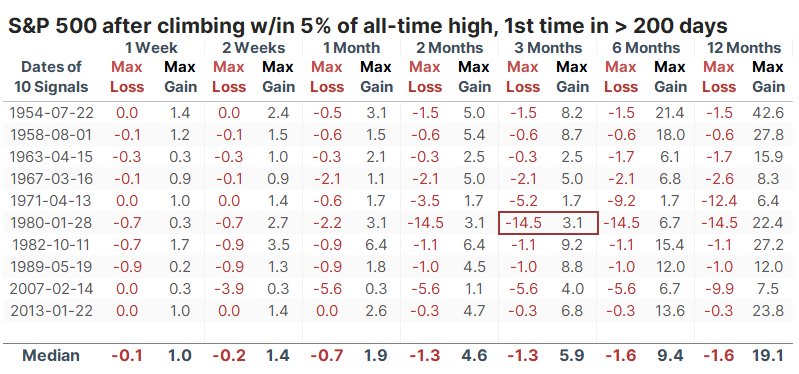
The table of maximum gains and losses across time frames shows how minimal the risk was over the next few months. Only a single signal lost more than -5.6% within the first three months while five signals preceded gains larger than +5.6%.
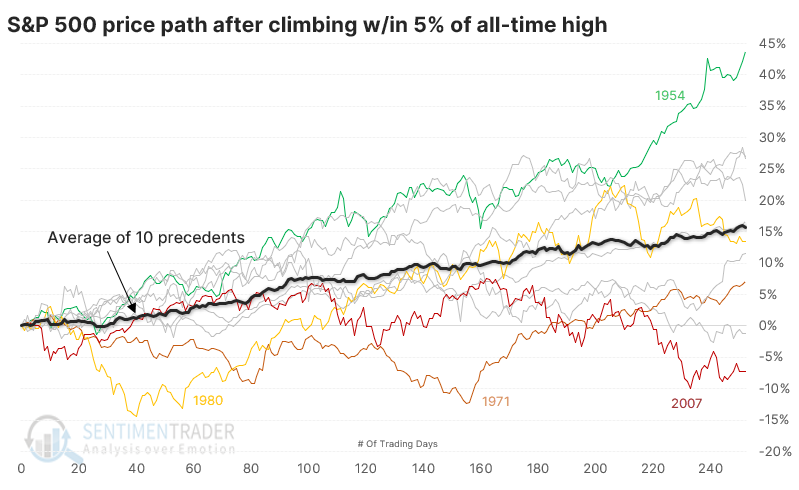
After these signals, the S&P's price path shows a consistent trend from the lower left to the upper right. Three signals lost more than -10% (or nearly so) within the next year, but those were clear outliers.
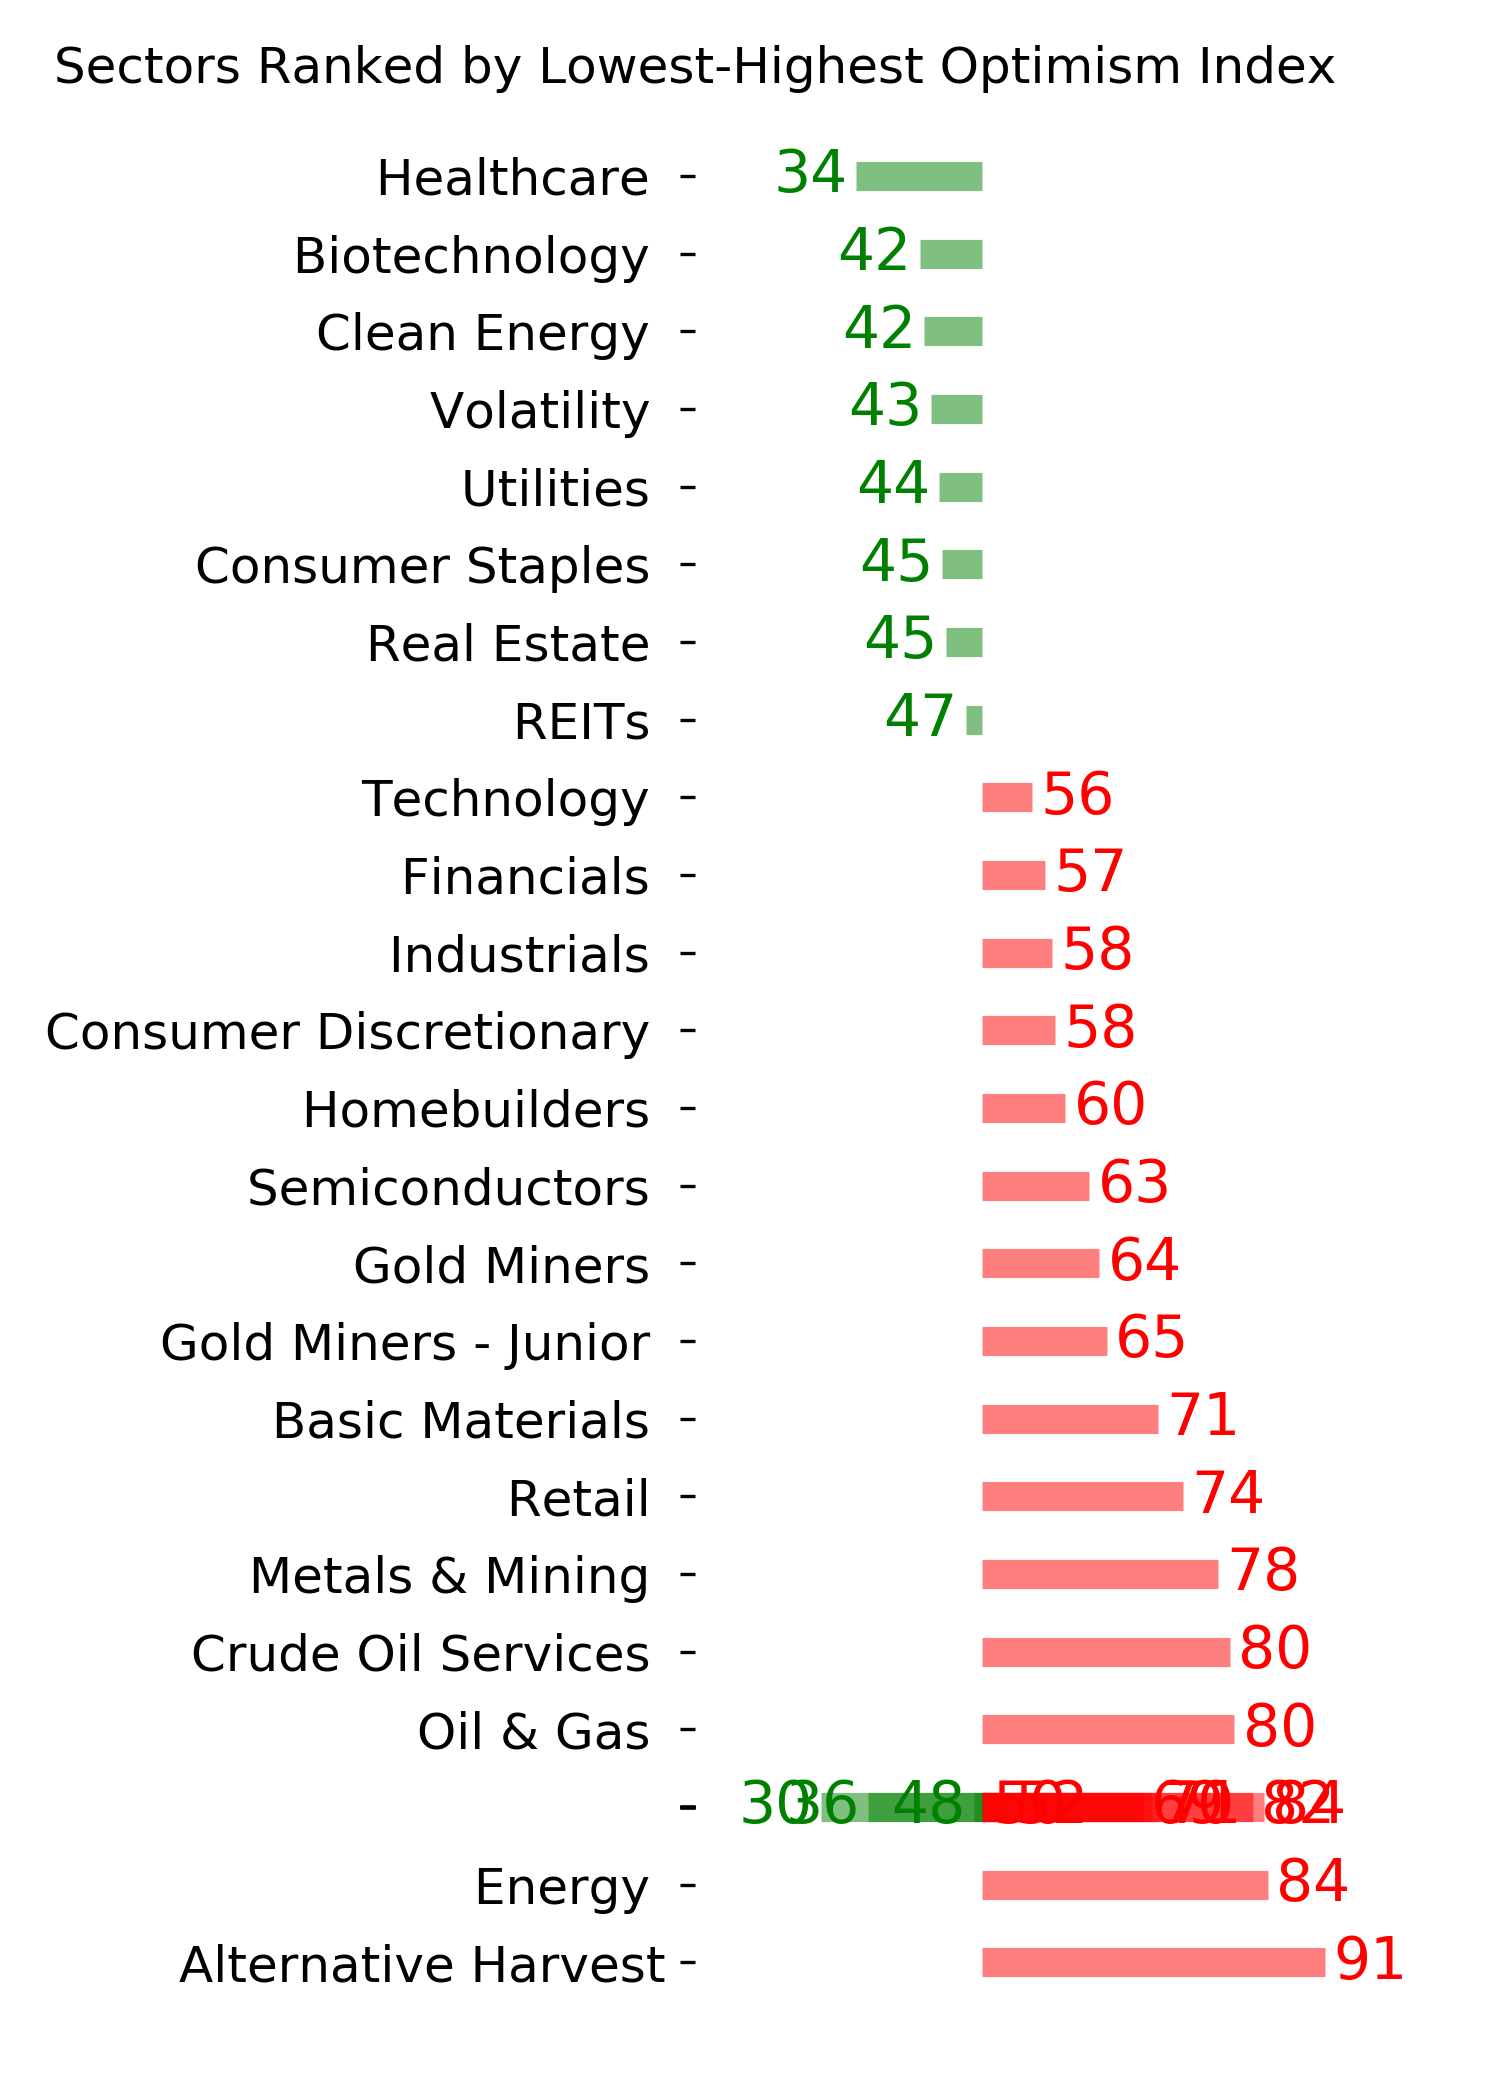
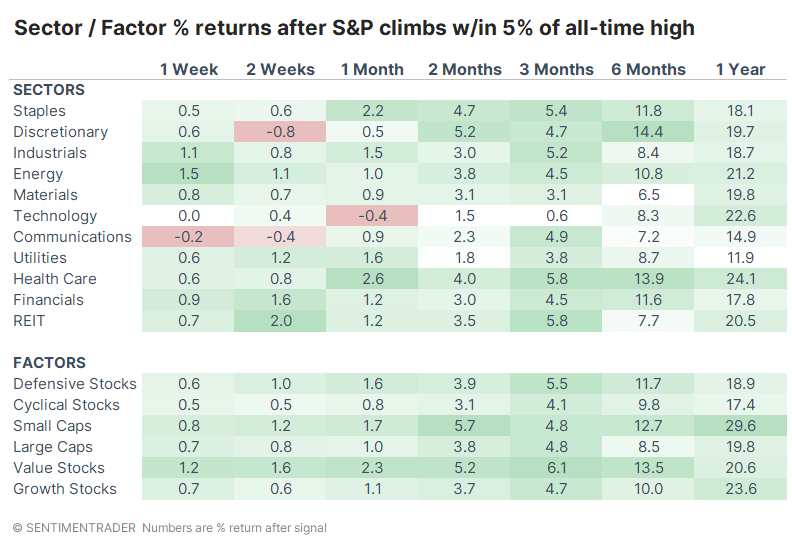
Returns among sectors and factors showed some interesting twists. Technology was relatively weak over the next 2-3 months, but the 3-month time frame was by far the most consistently positive across all sectors. Staples and Health Care did well across almost all time frames, as did Small Caps and Value stocks.
What the research tells us...
When a stock or index nears a previous high, chart watchers will send alerts about "resistance." The theory is that when prices return to an obvious turning point, those who bought at that peak will see their chance to get out at breakeven. Like most technical analysis, it makes for a good story and looks cool on a chart, but it doesn't work in practice. Over 20 years of testing, we've never once been able to confirm that resistance is a valid concept. Stocks are just as likely (more likely, actually) to move past resistance as they are to be turned away. We can see that with the above, as well. While the S&P hasn't yet made it close enough to its previous high, we are already hearing about resistance from the 2021 peak. Take it with a gigantic grain of salt.
Indicators at Extremes
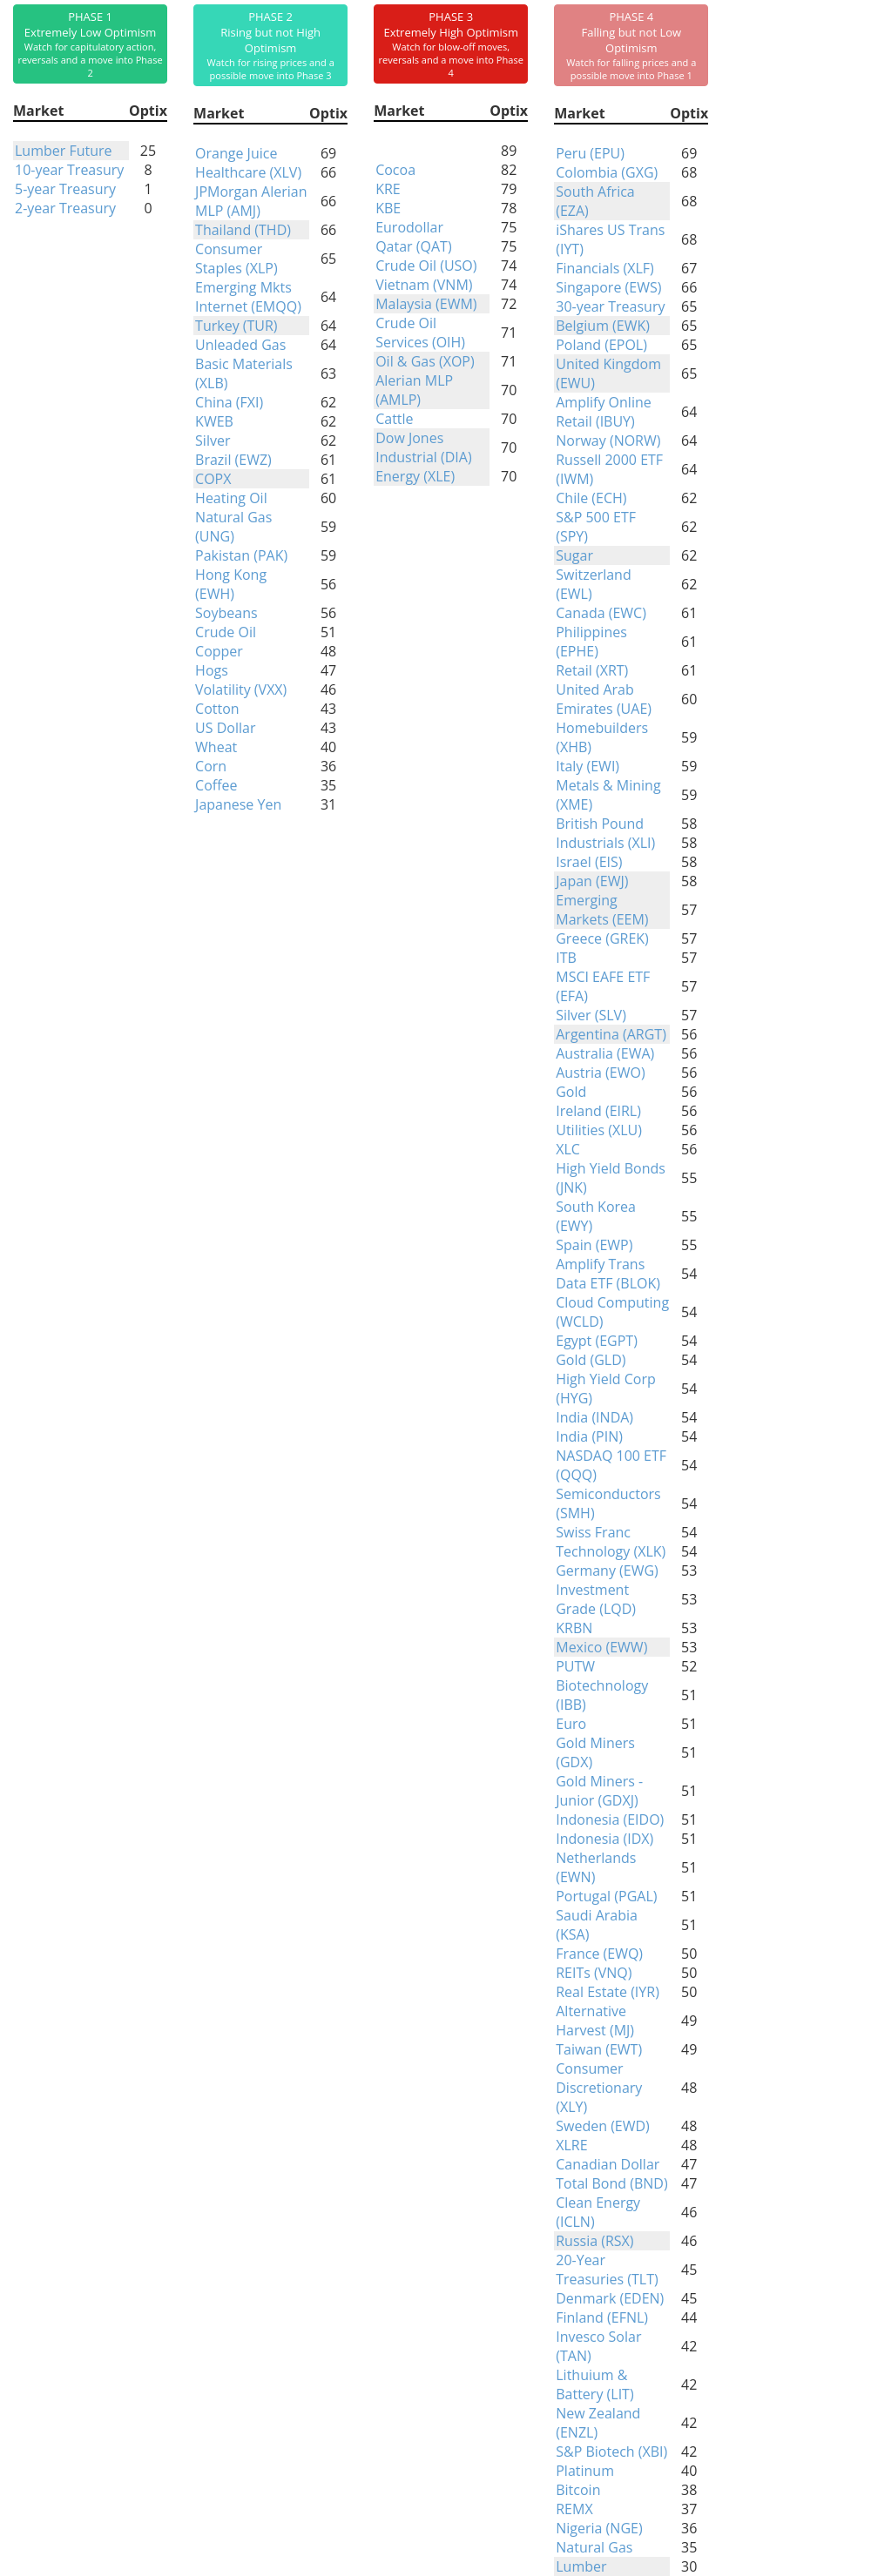
Phase Table
Ranks
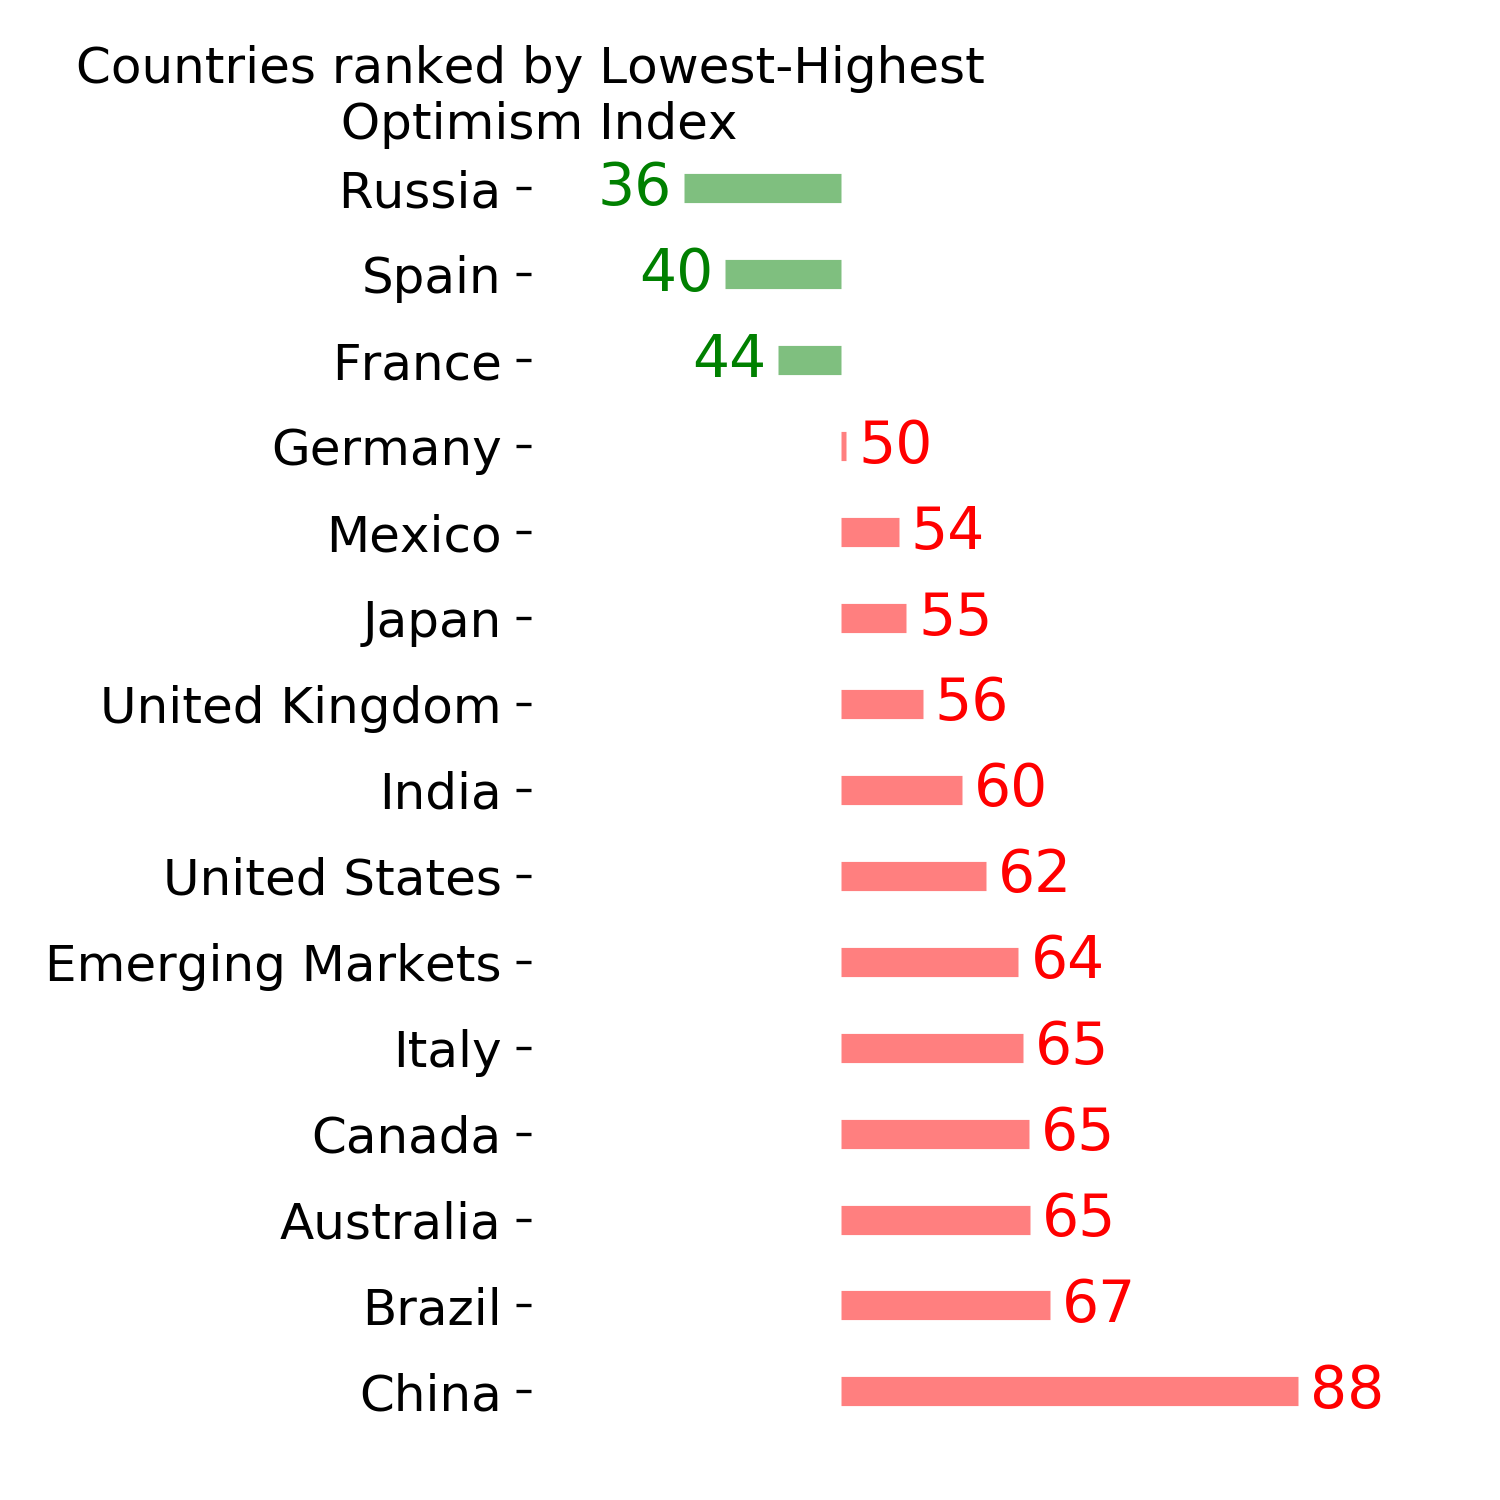
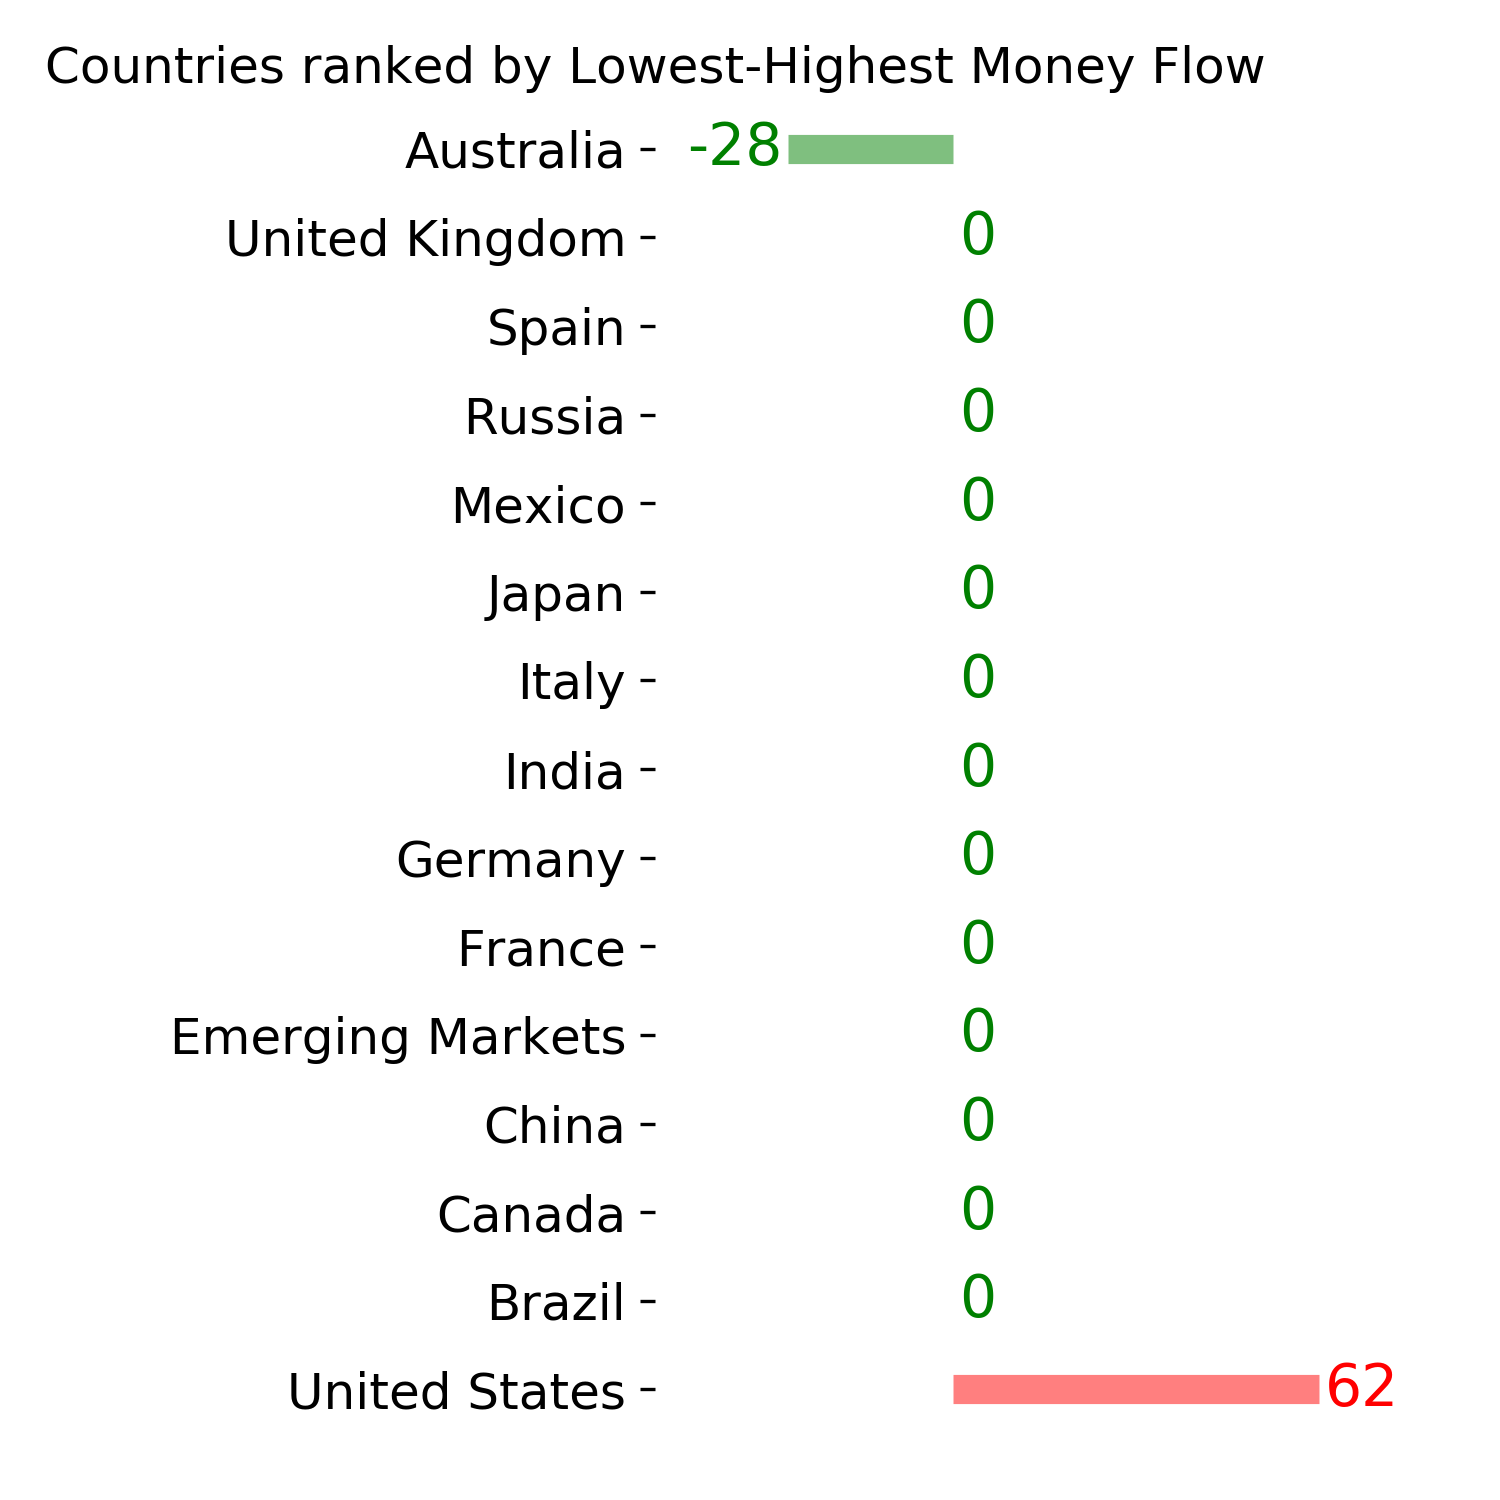
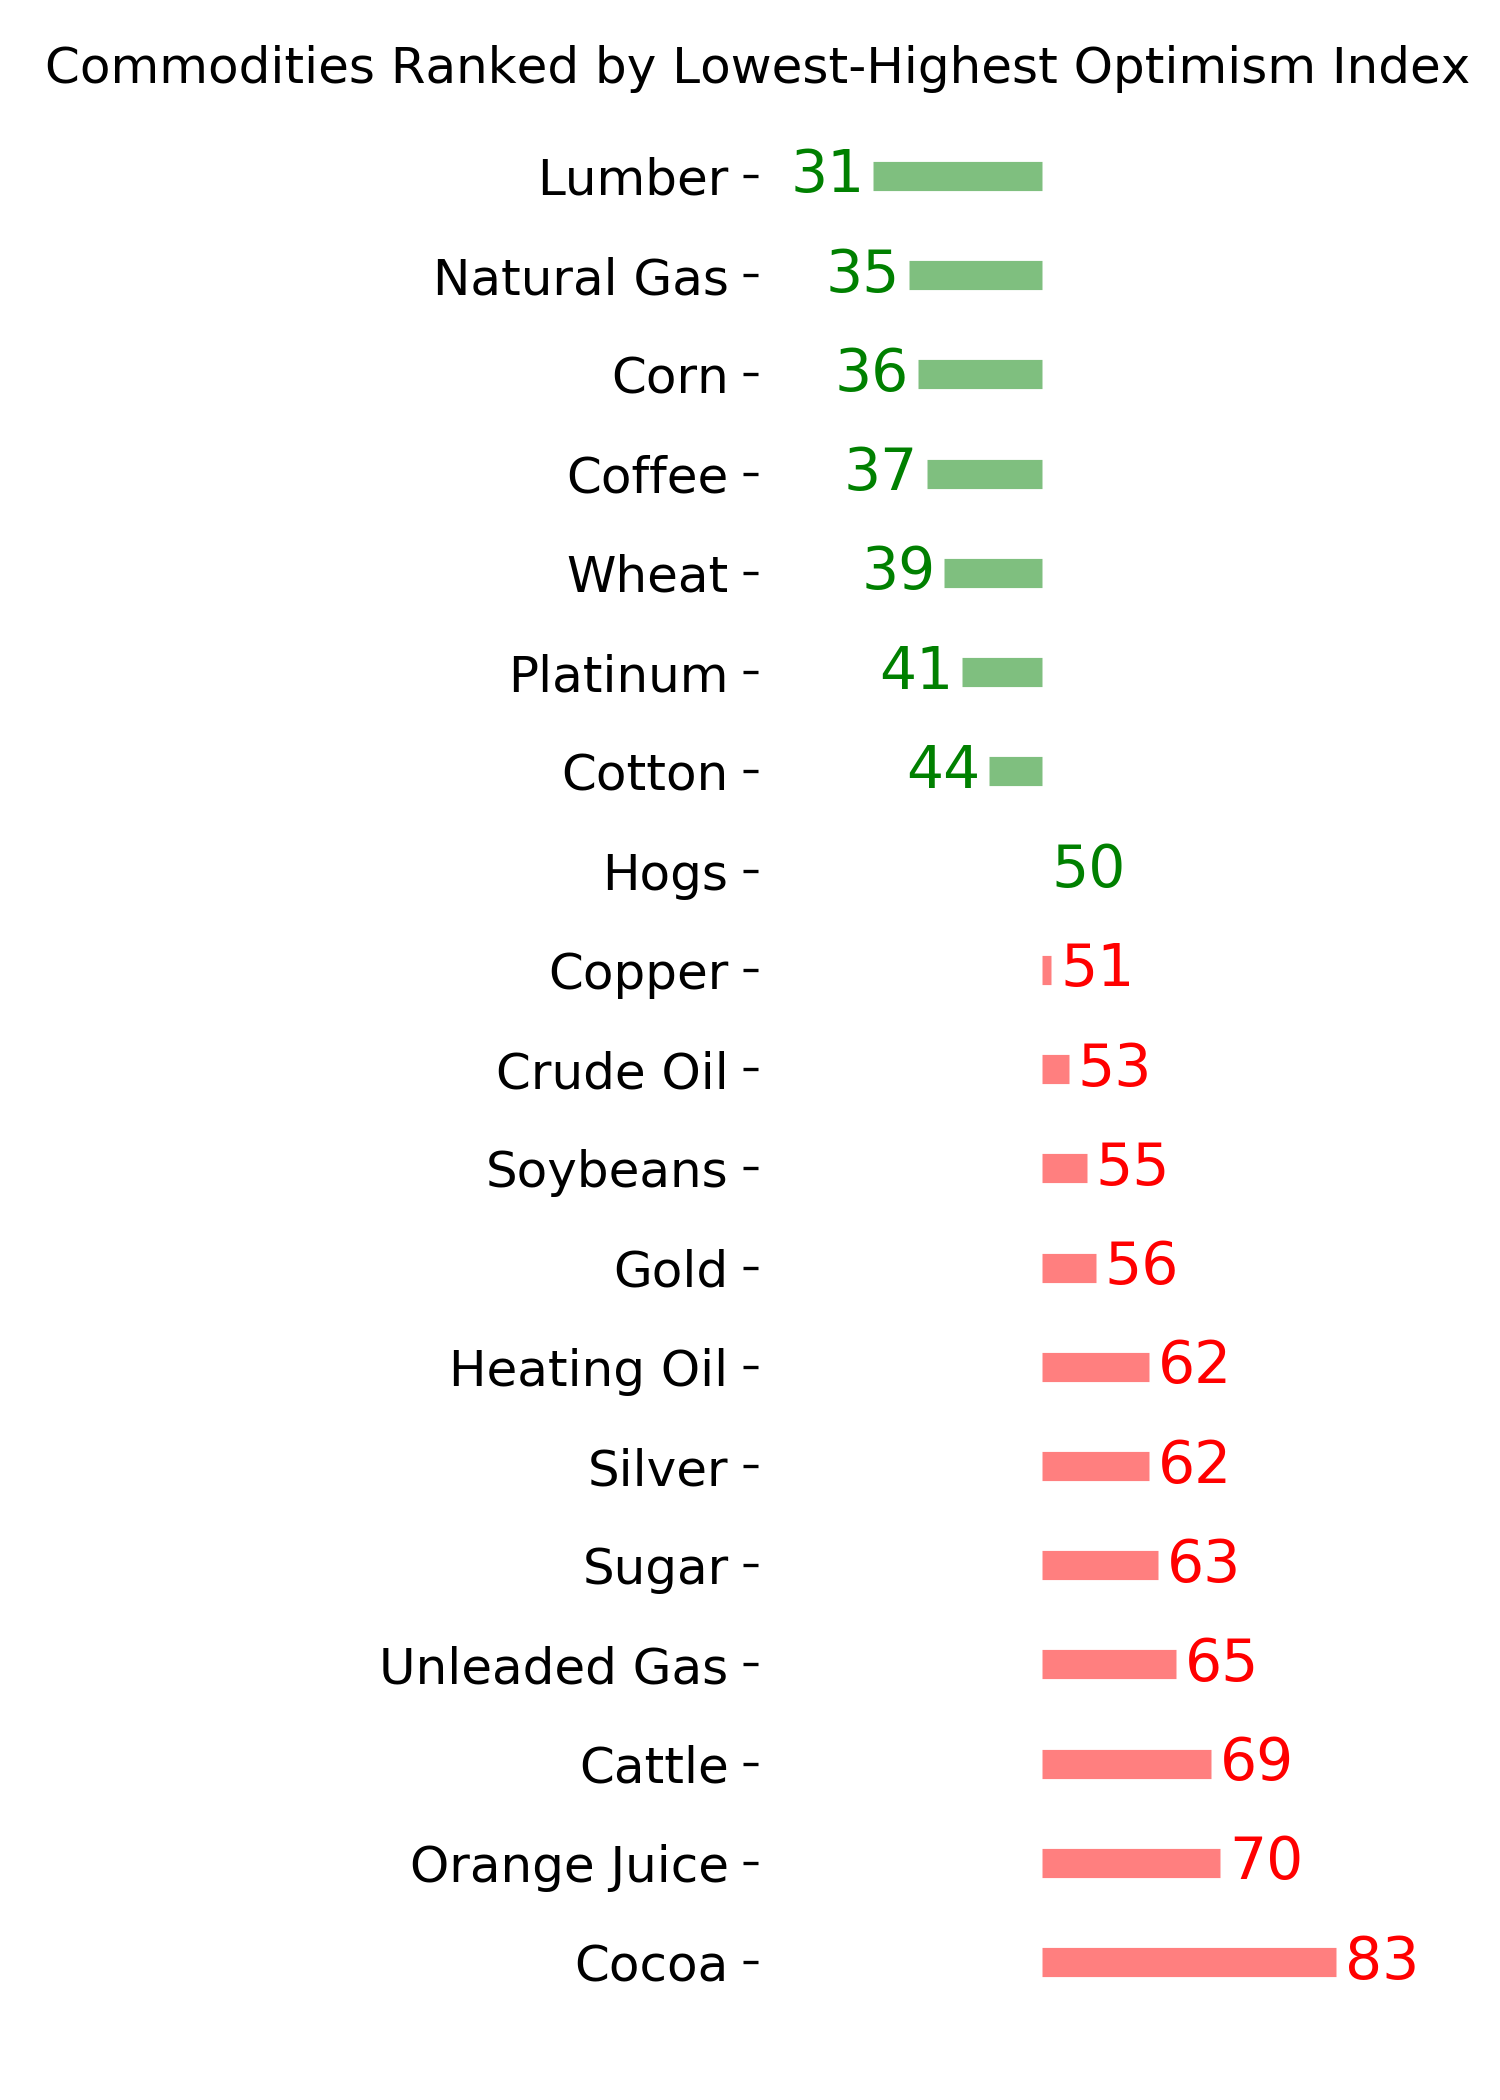
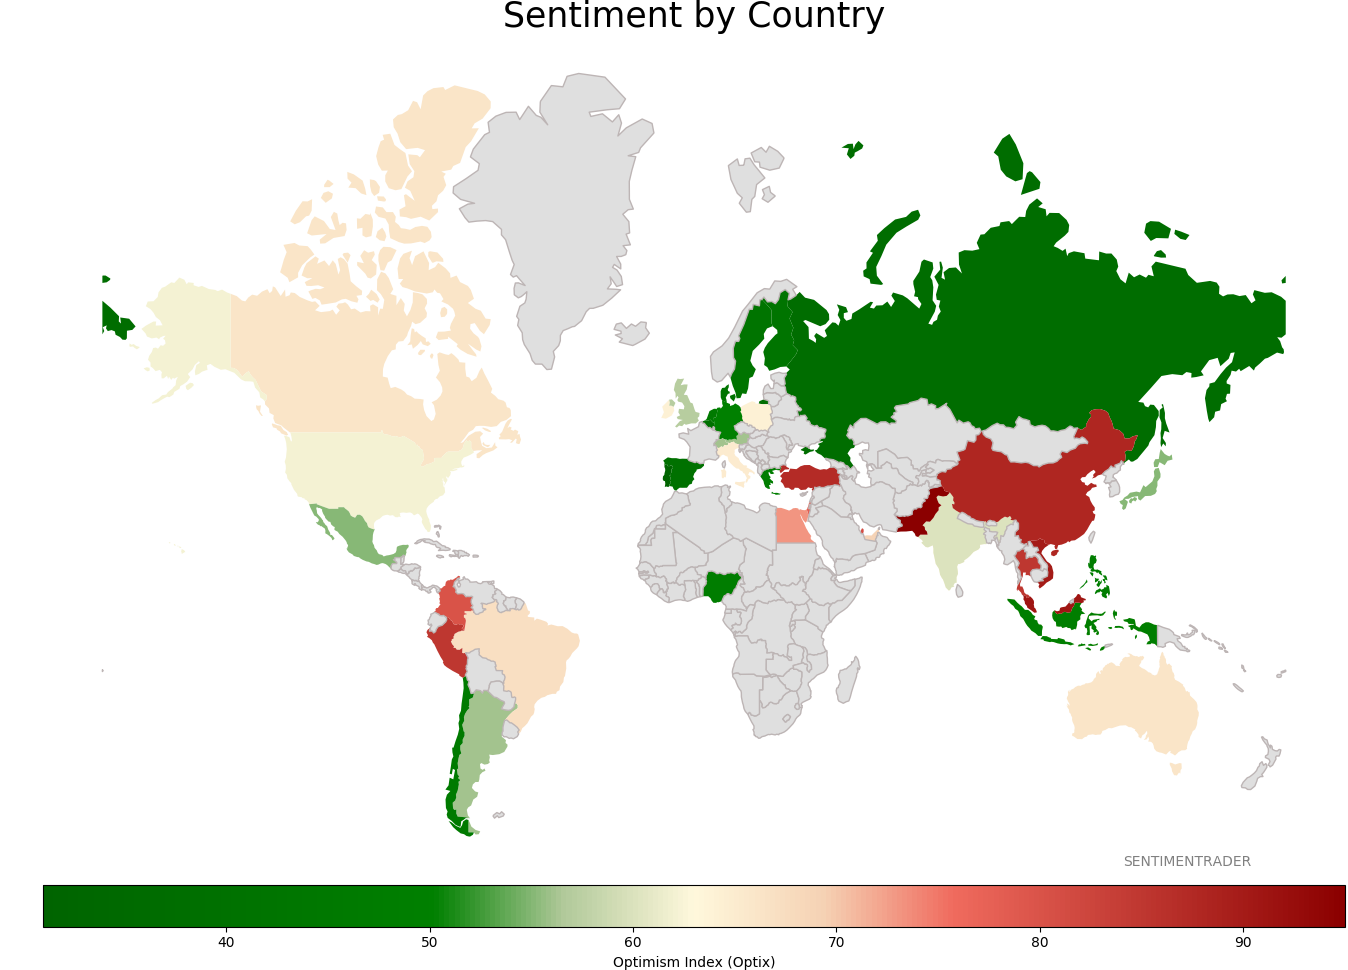
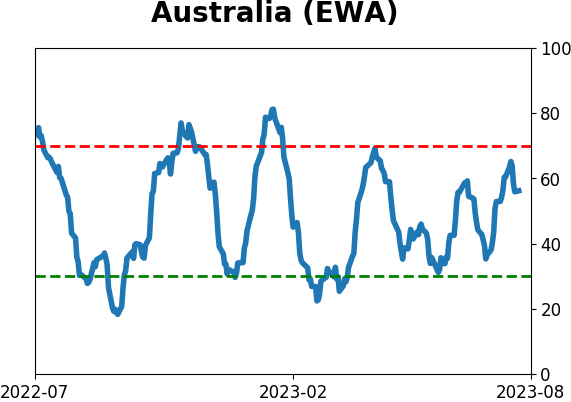
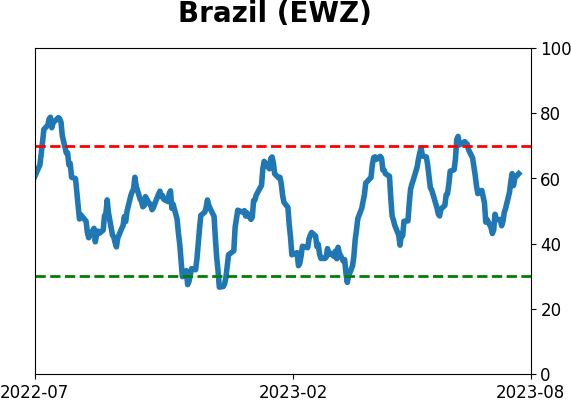
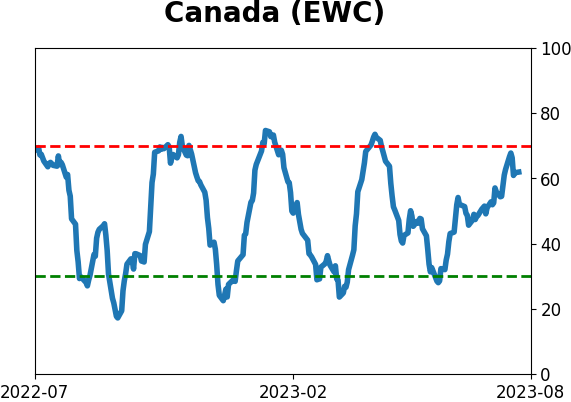
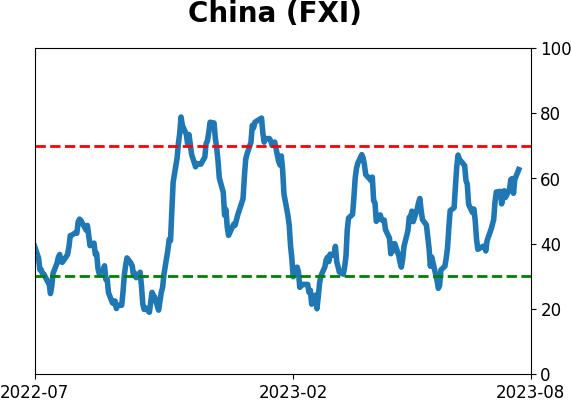
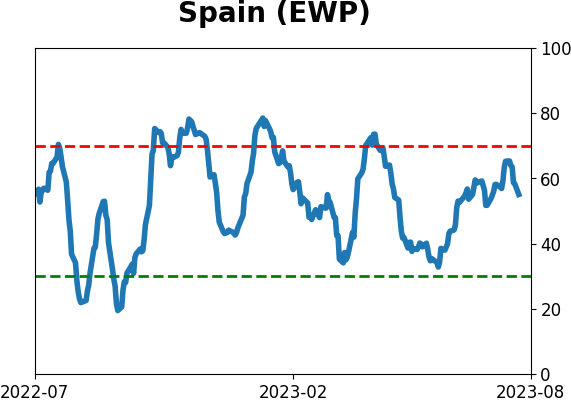
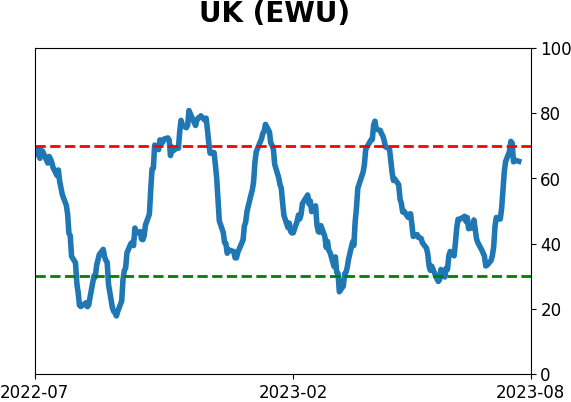
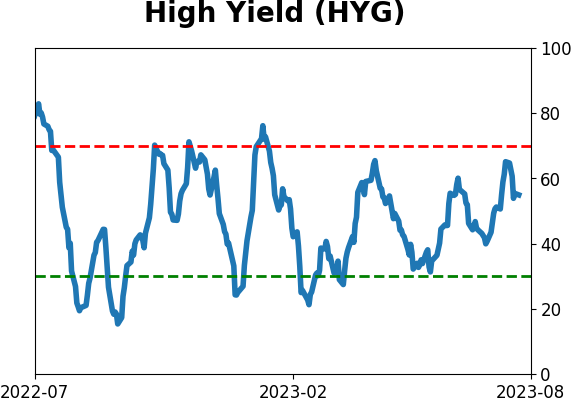
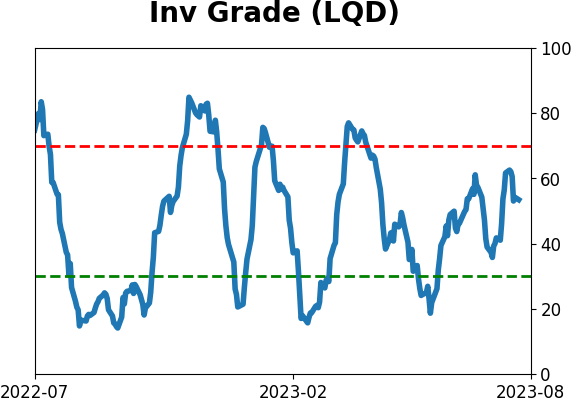
Sentiment Around The World
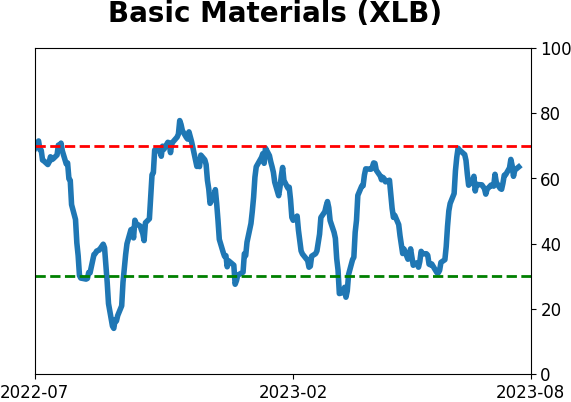
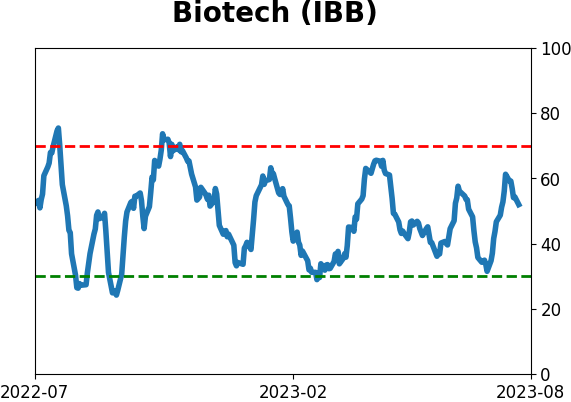
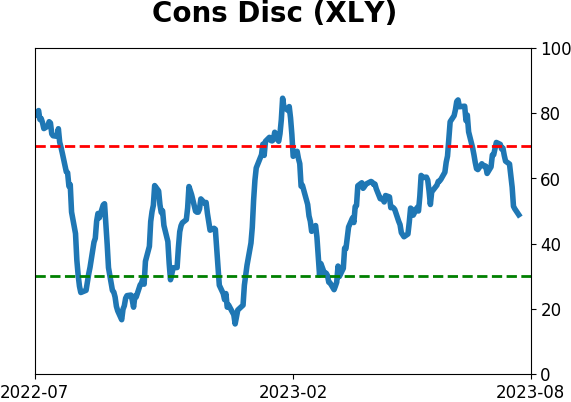
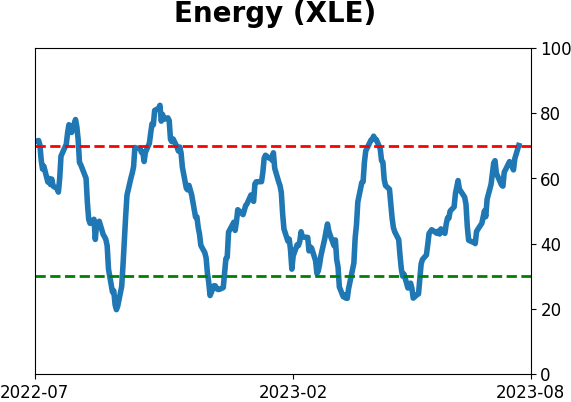
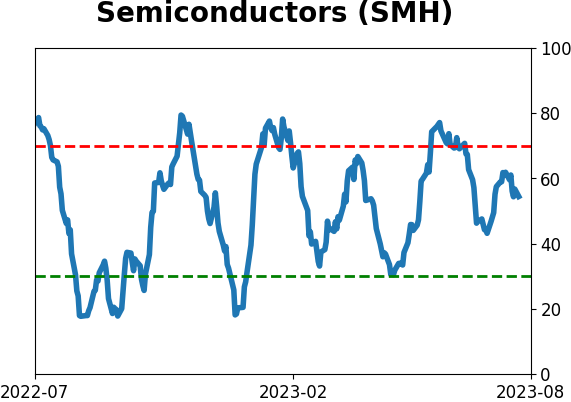
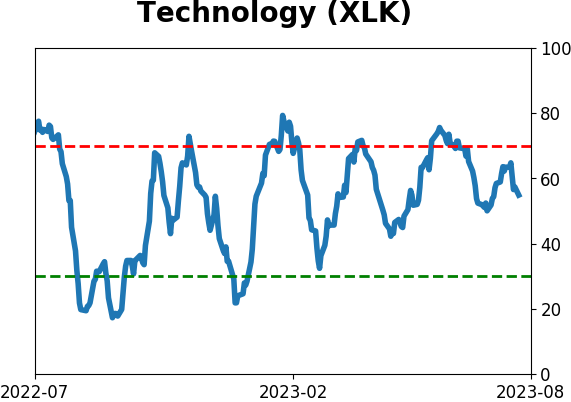
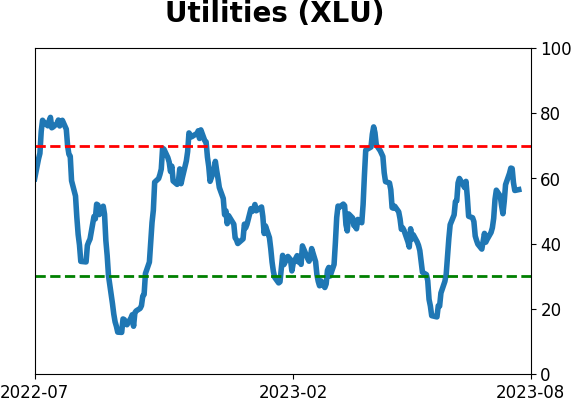
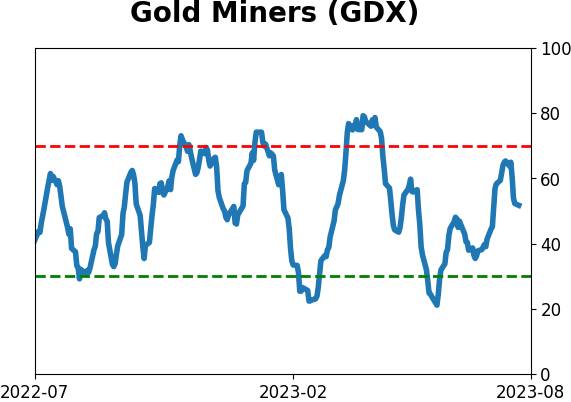
Optimism Index Thumbnails
|
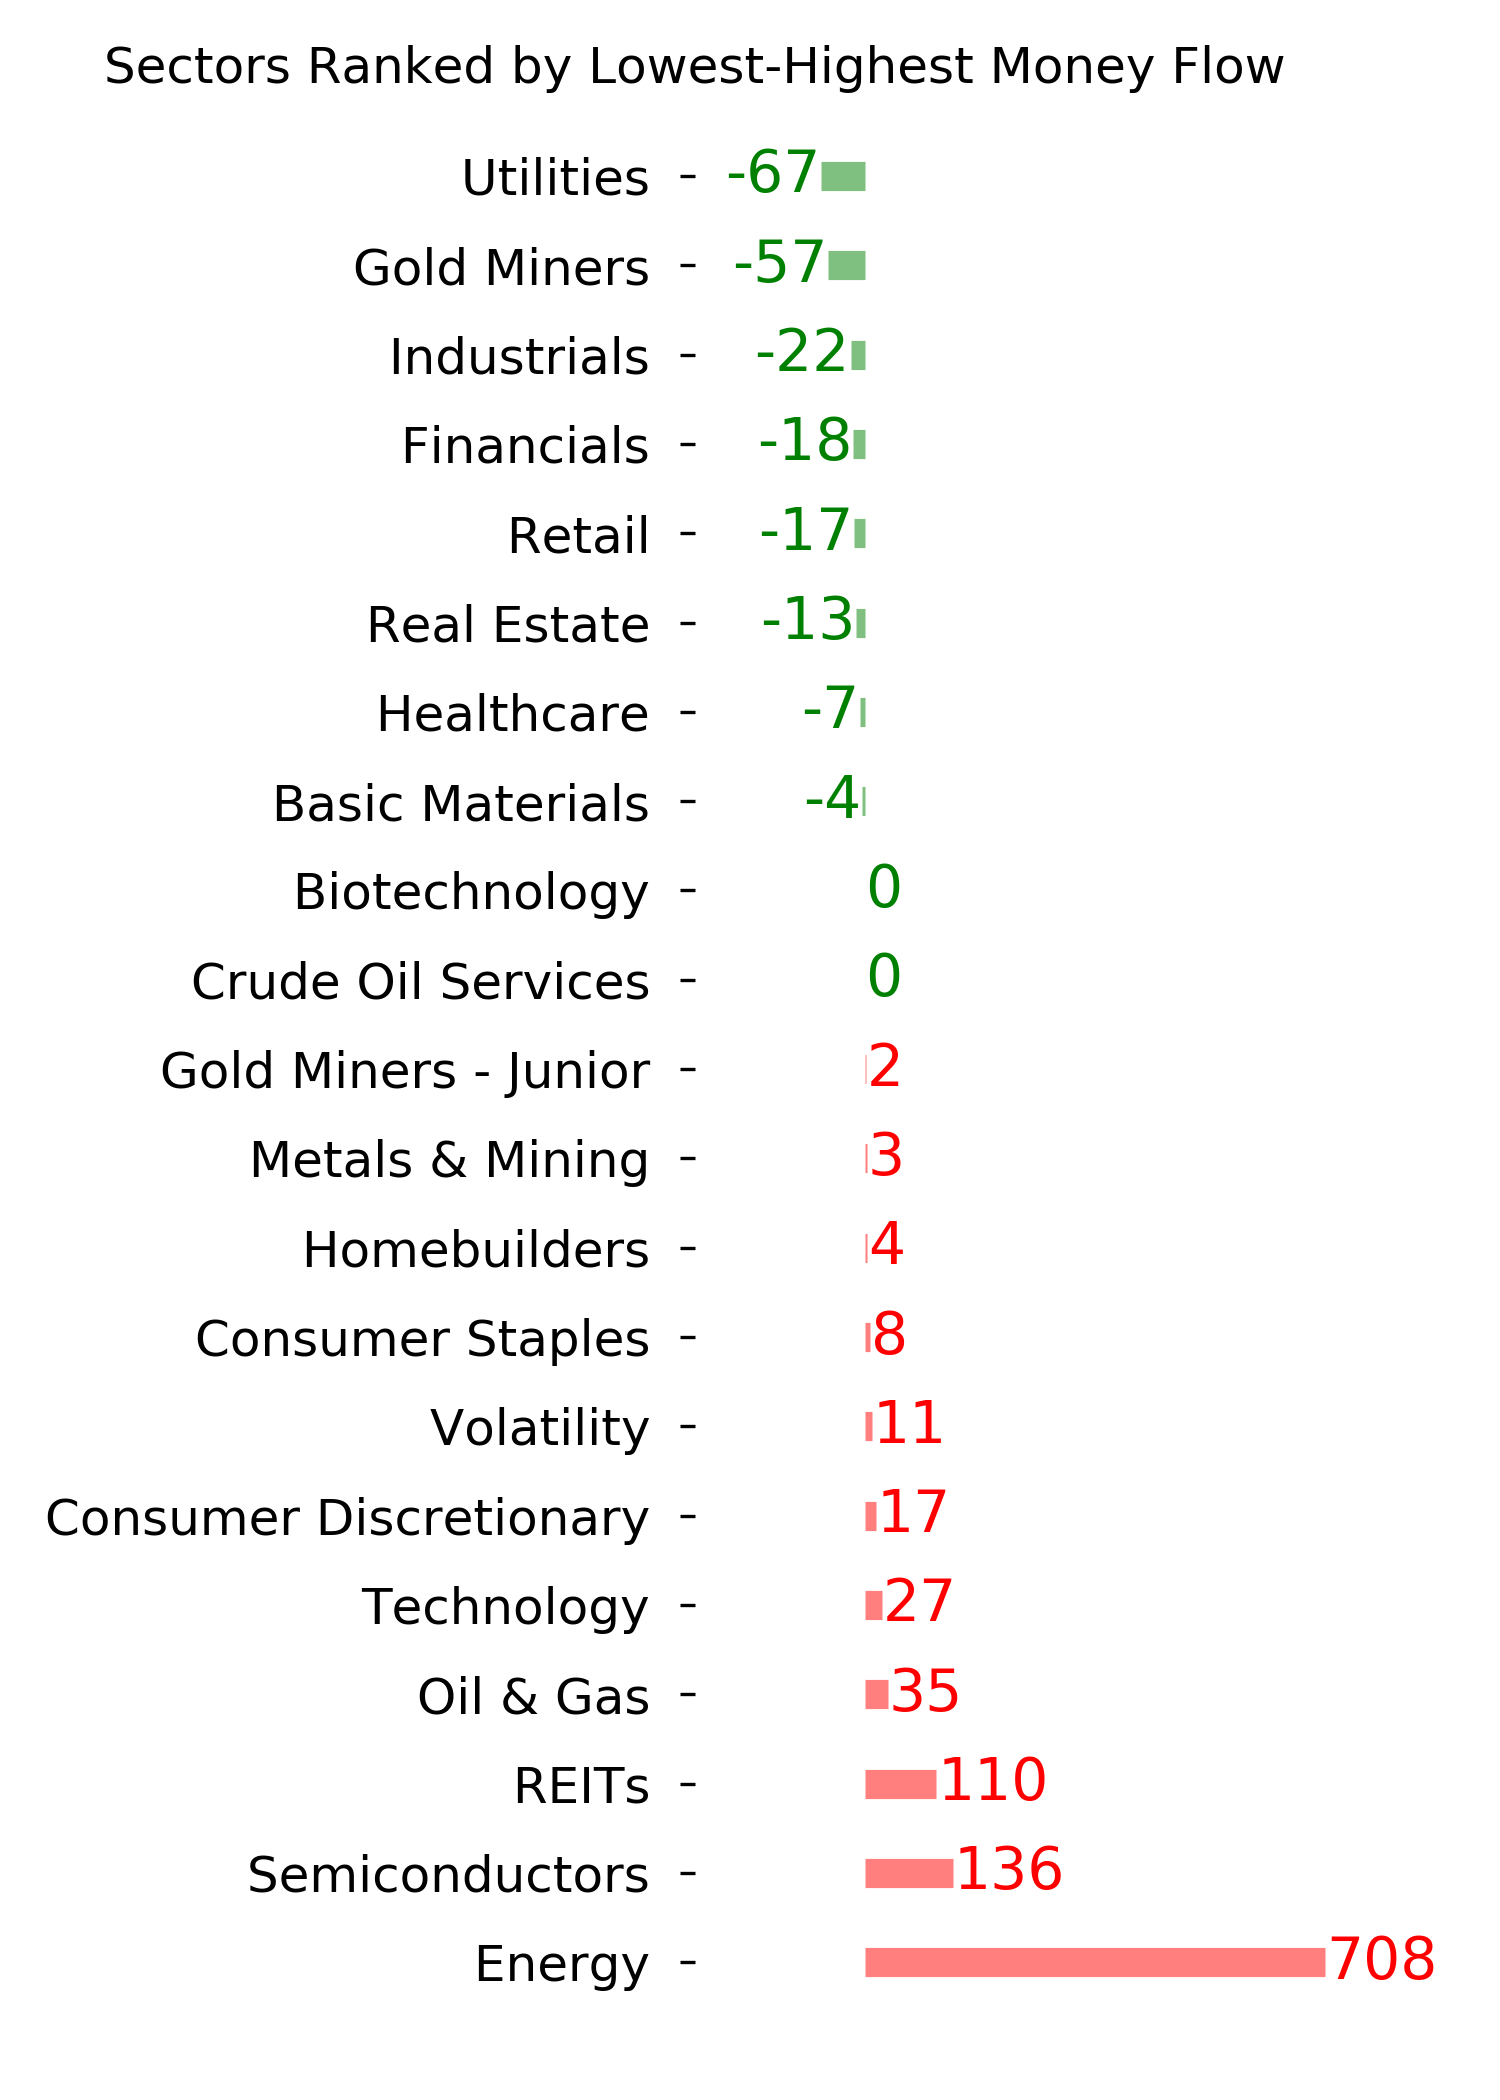
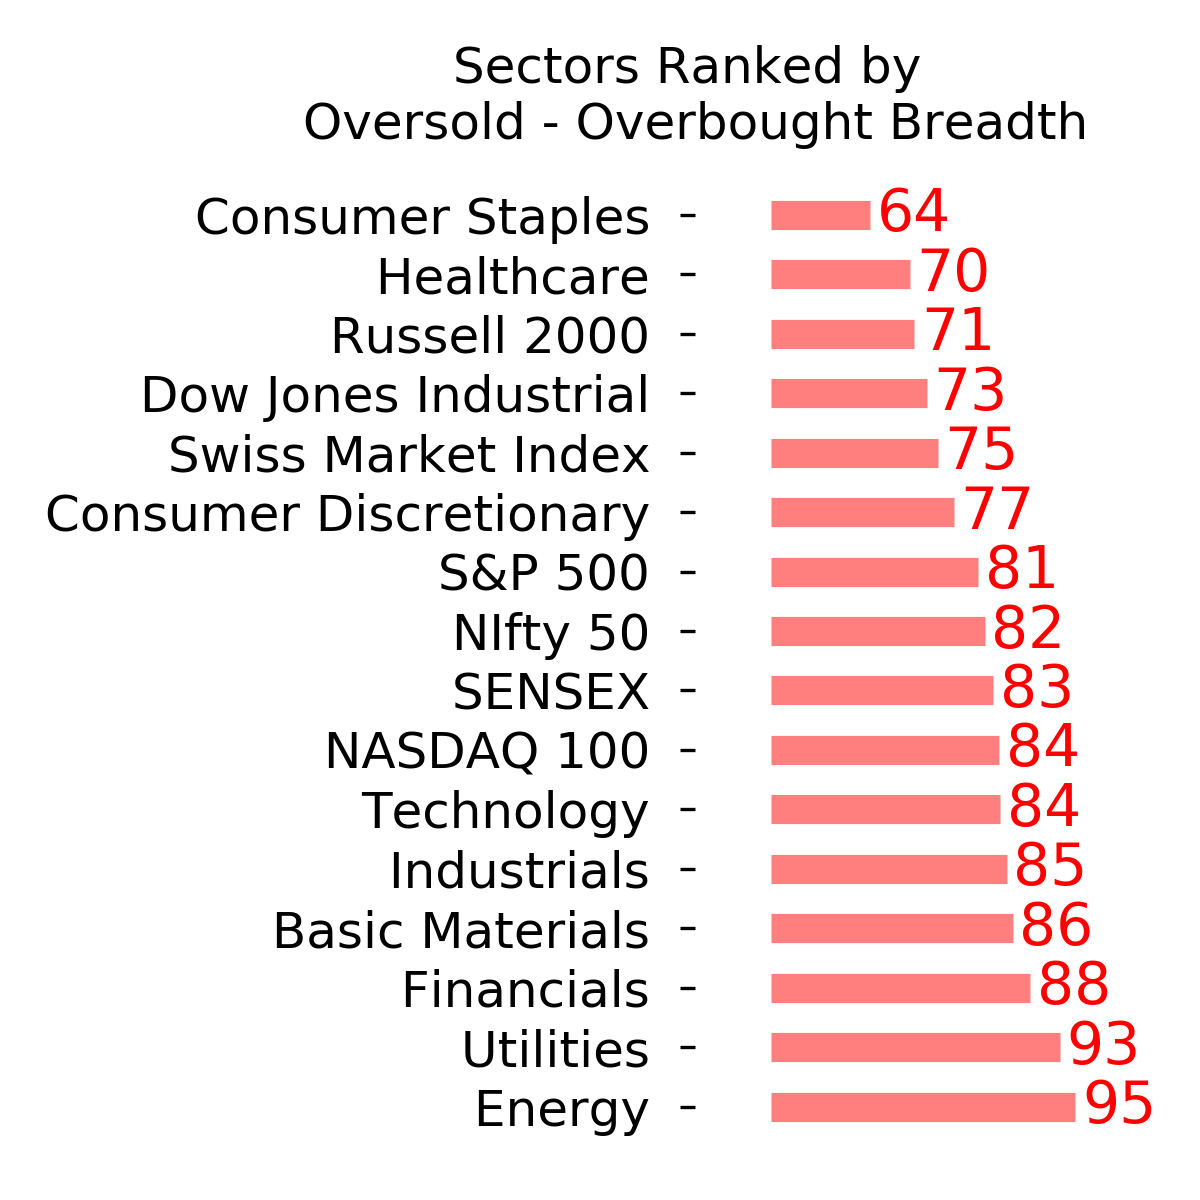
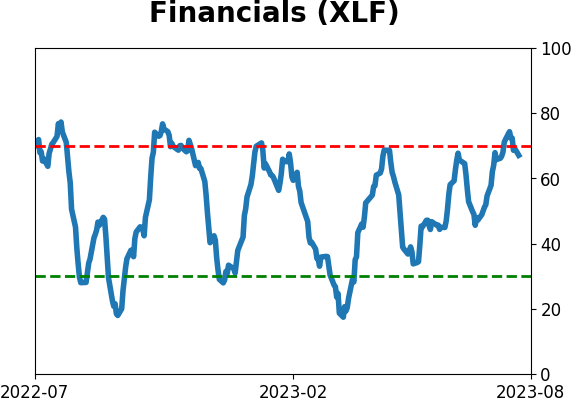
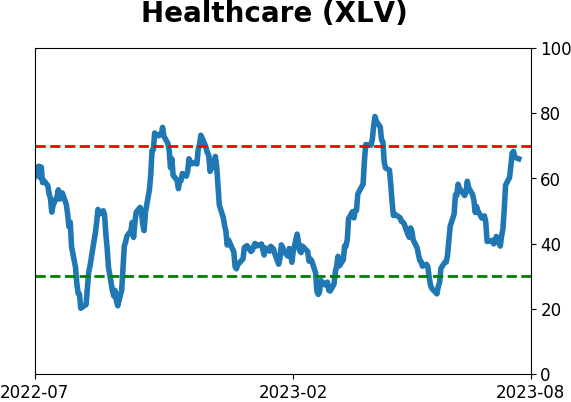
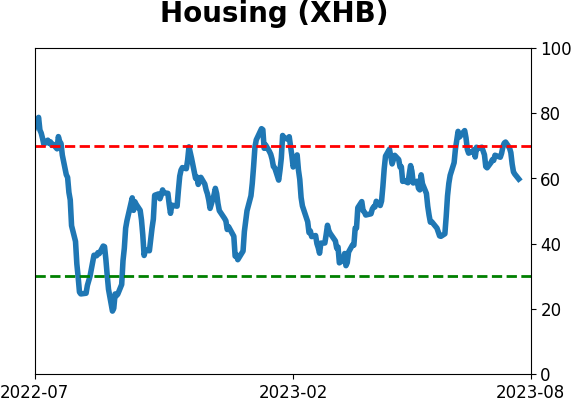
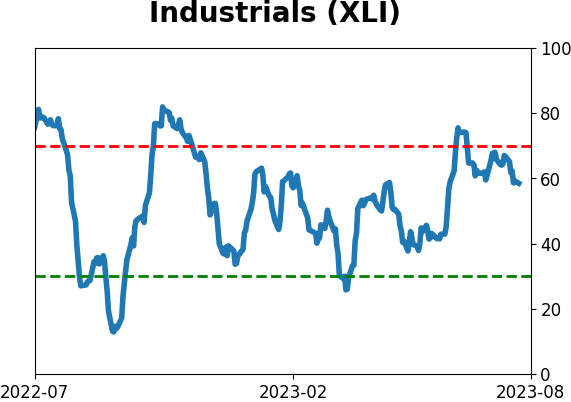
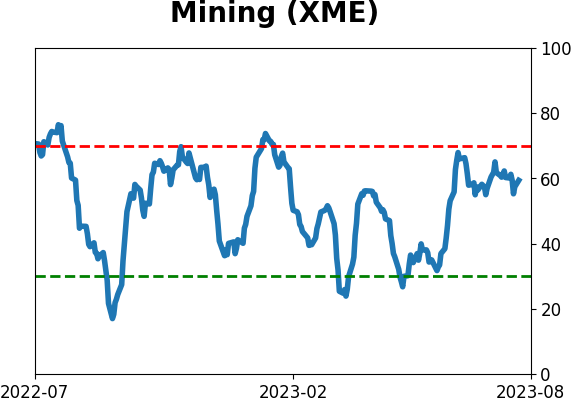
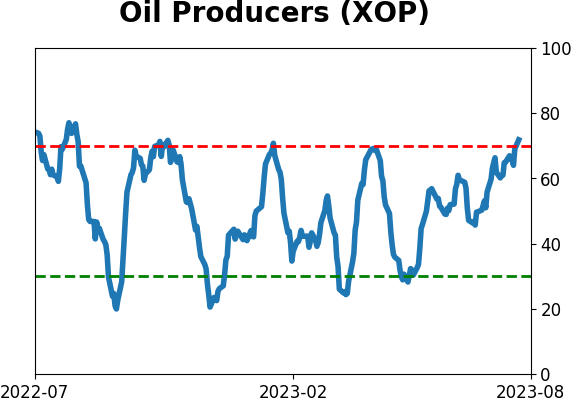
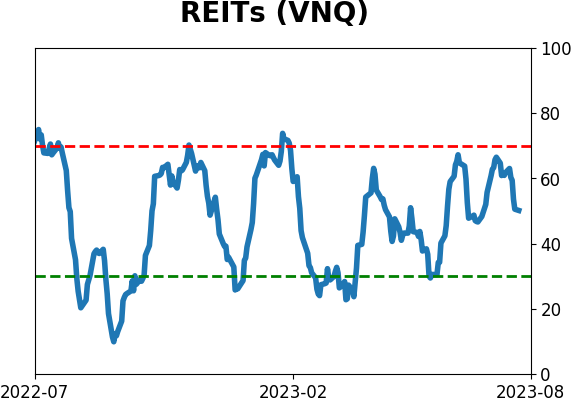
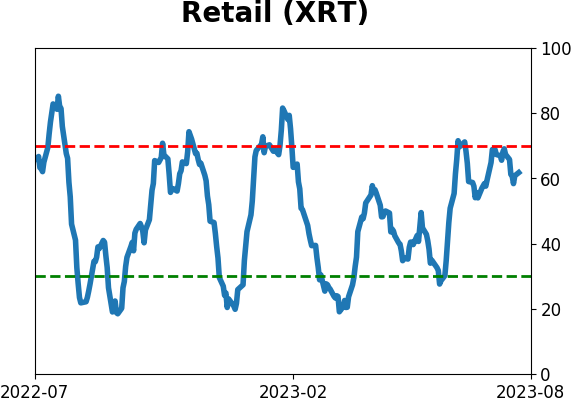
Sector ETF's - 10-Day Moving Average
|
|
|
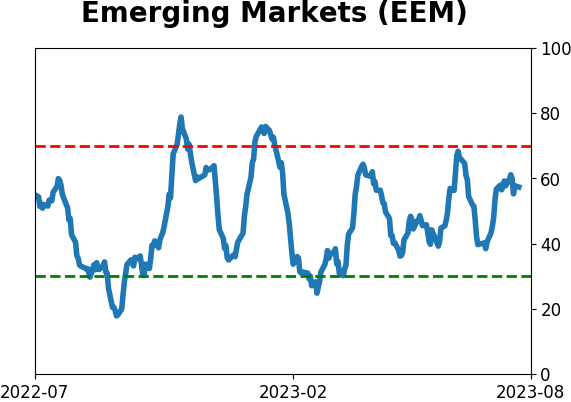
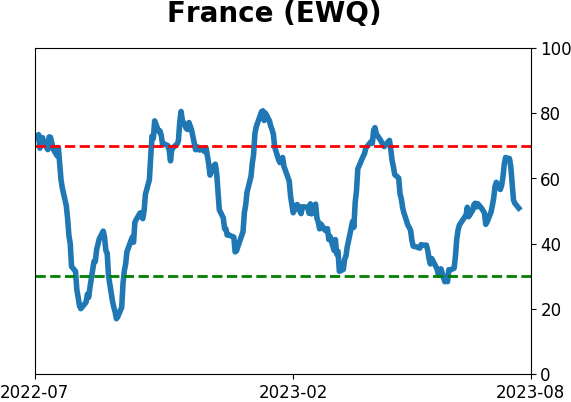
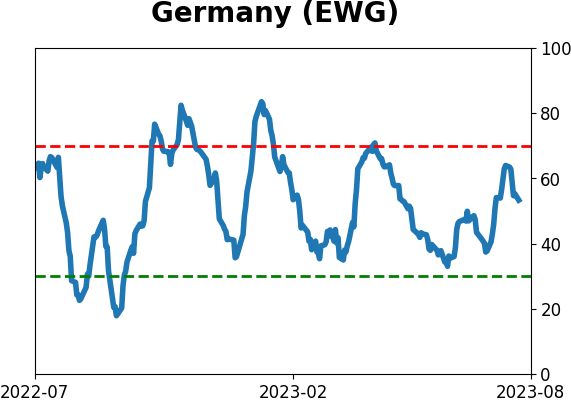
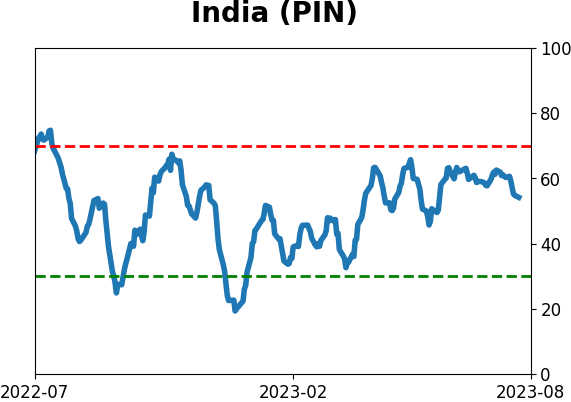
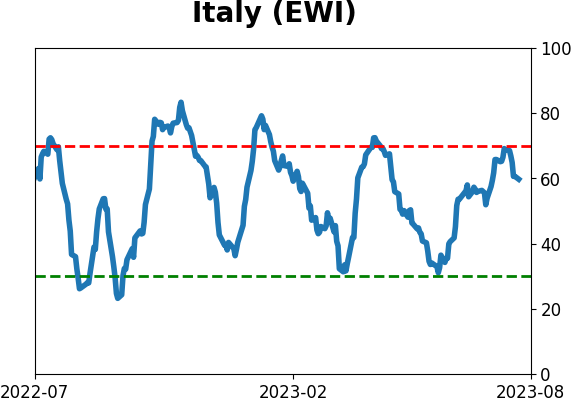
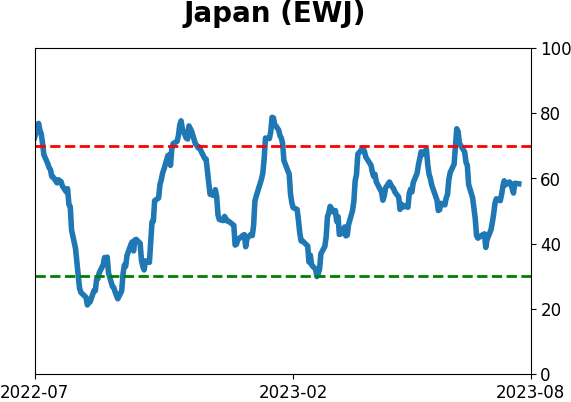
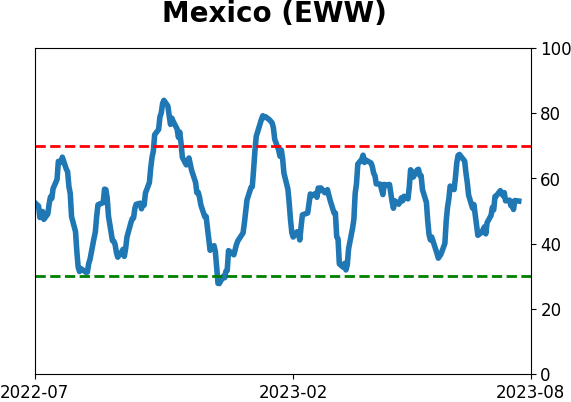
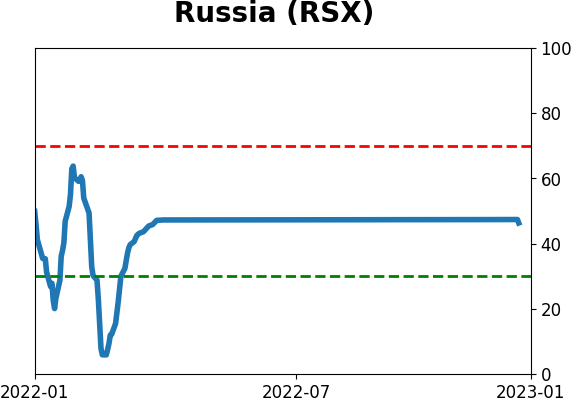
Country ETF's - 10-Day Moving Average
|
|
|
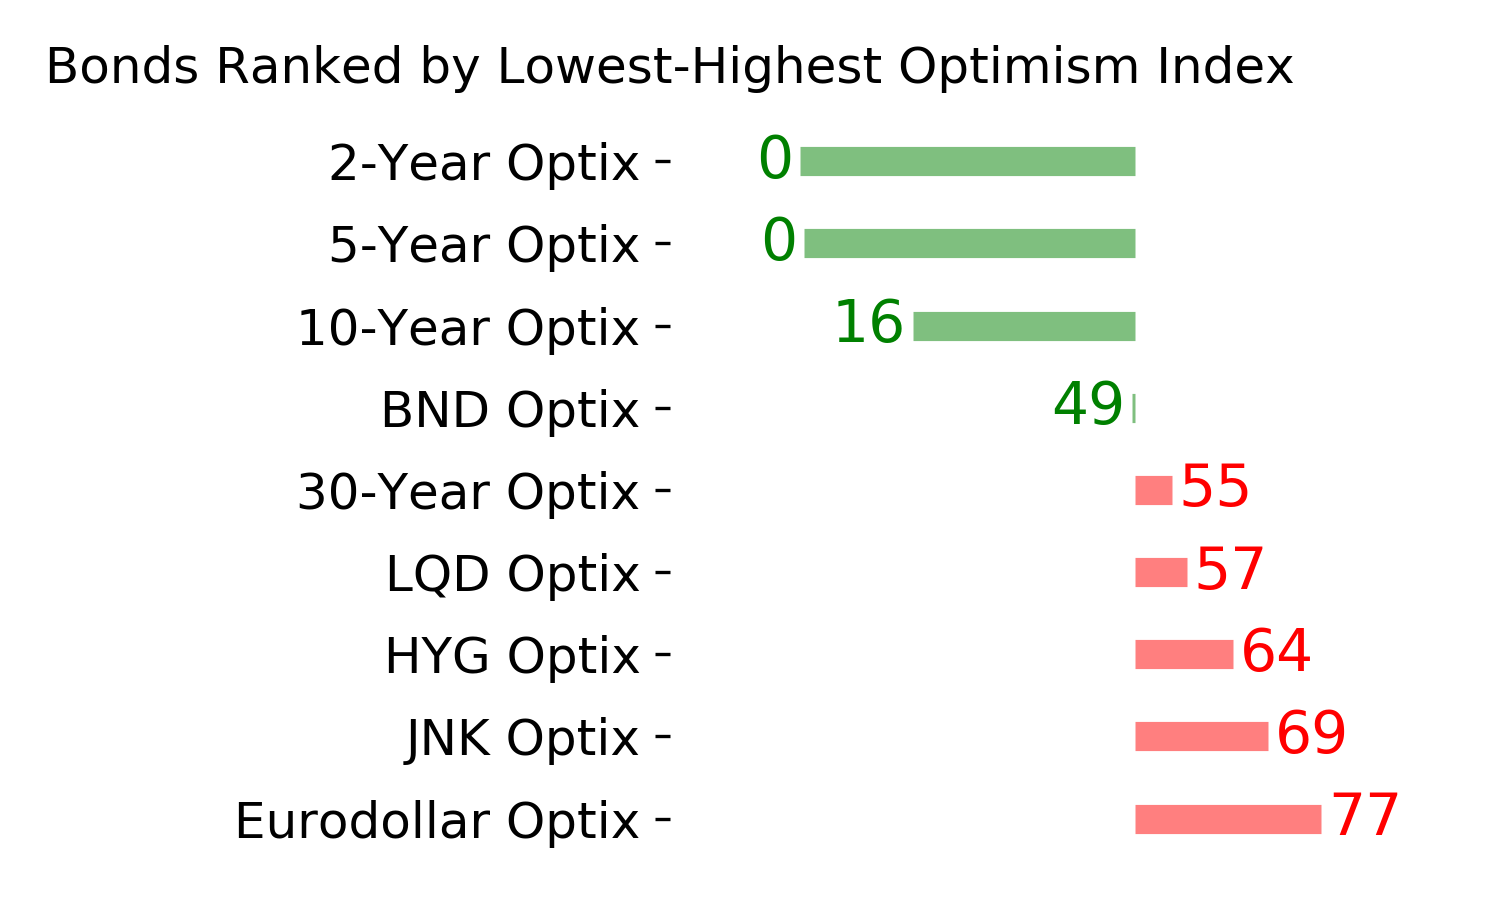
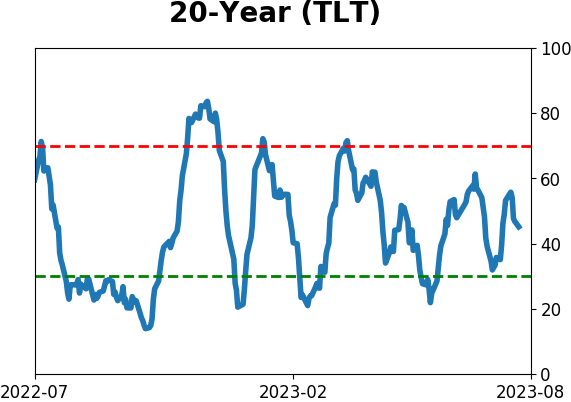
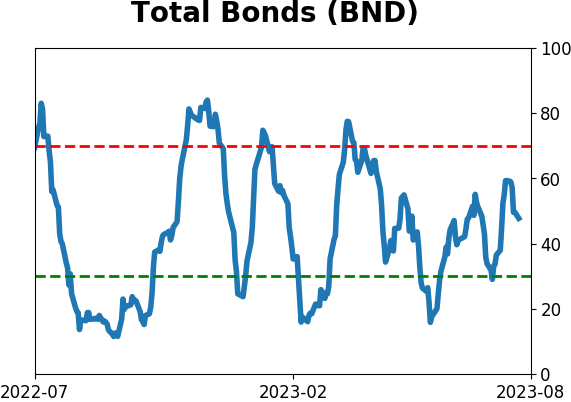
Bond ETF's - 10-Day Moving Average
|
|
|
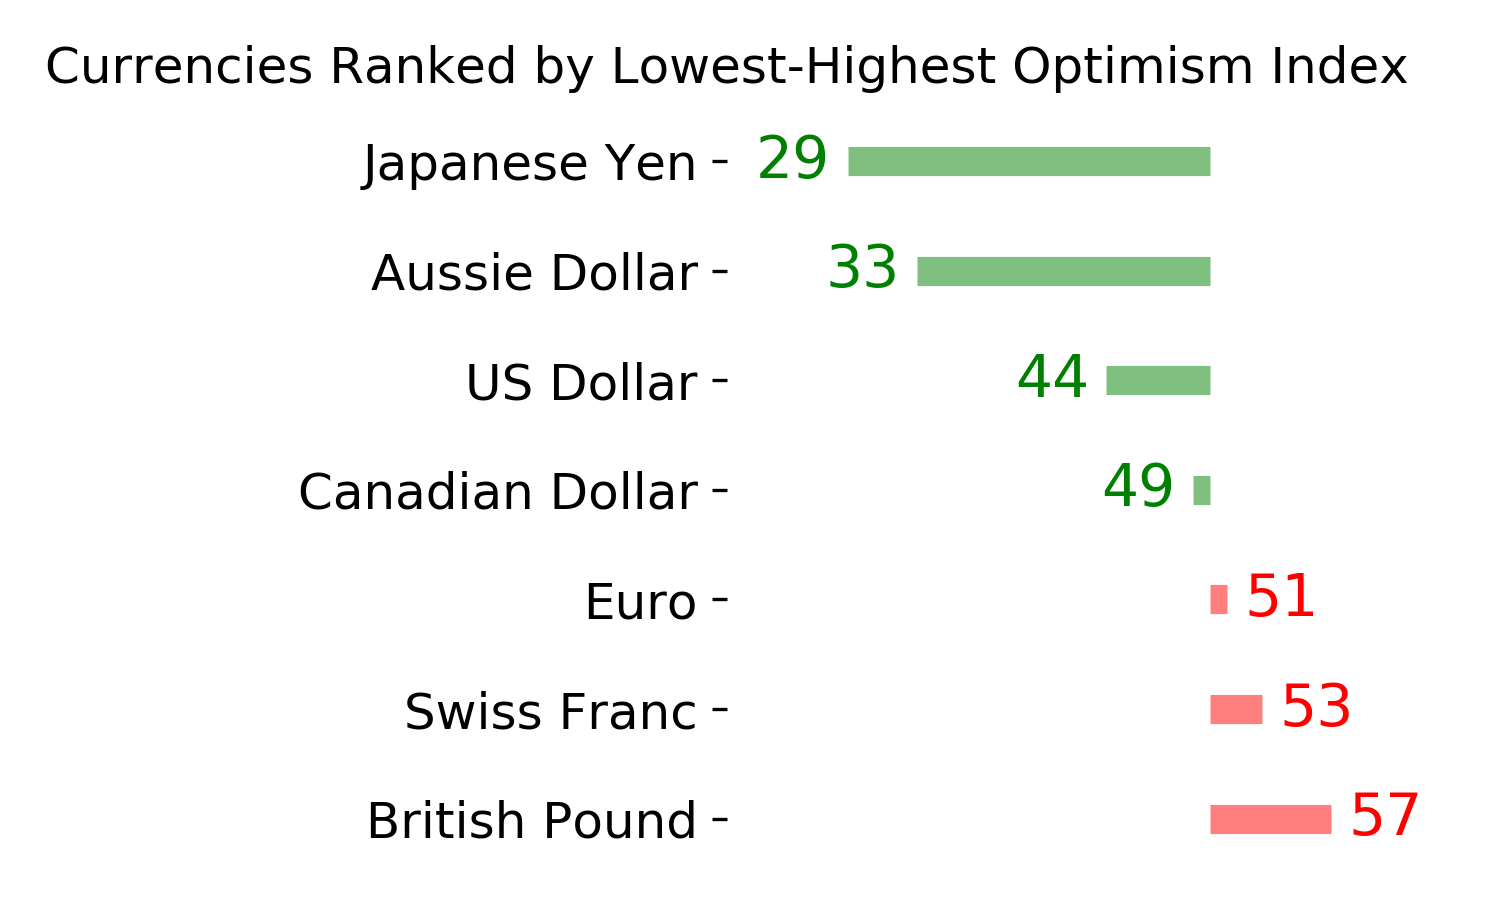
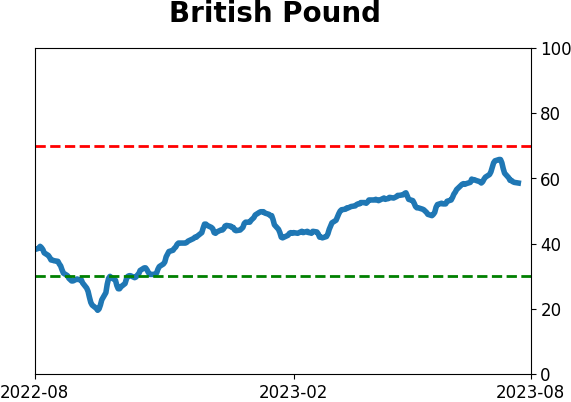
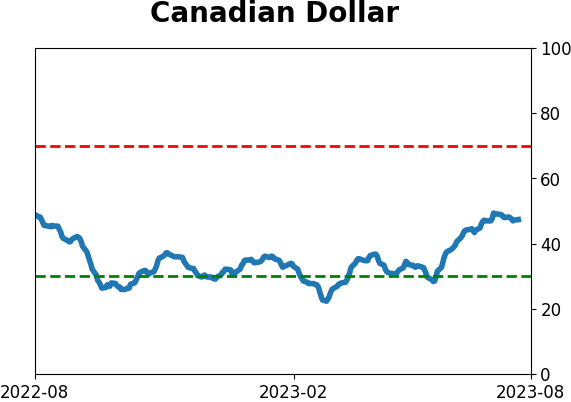
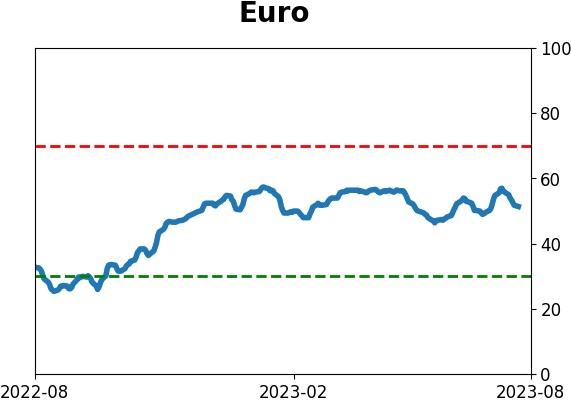
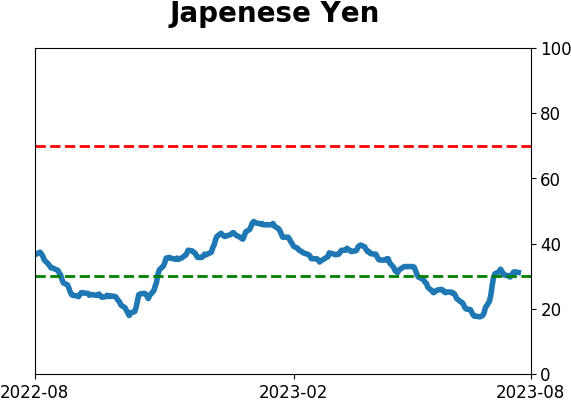
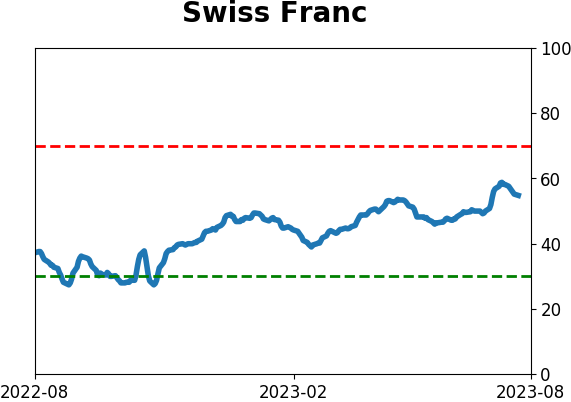
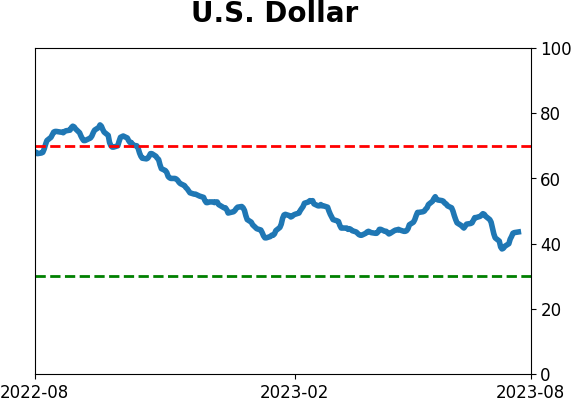
Currency ETF's - 5-Day Moving Average
|
|
|
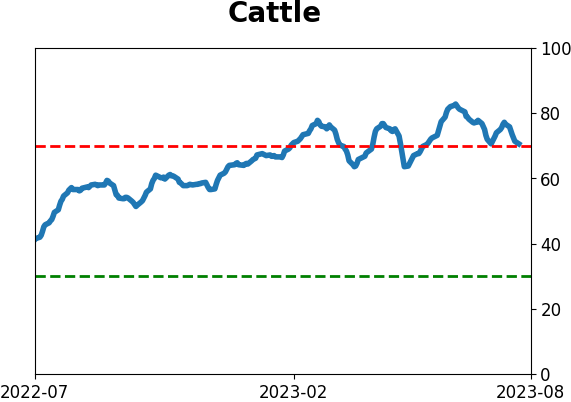
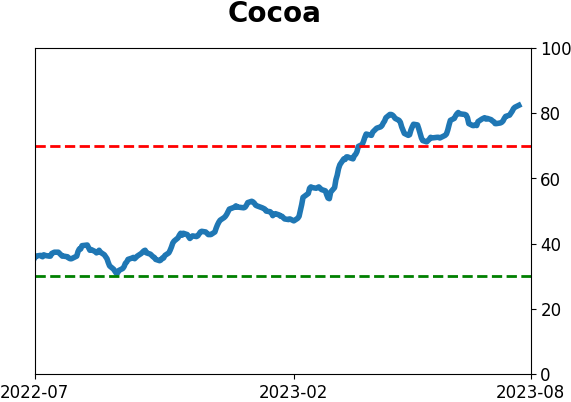
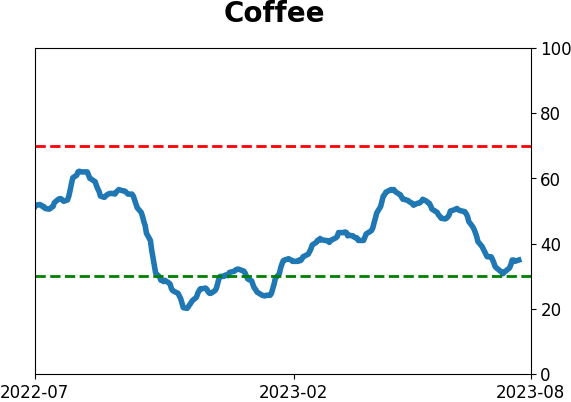
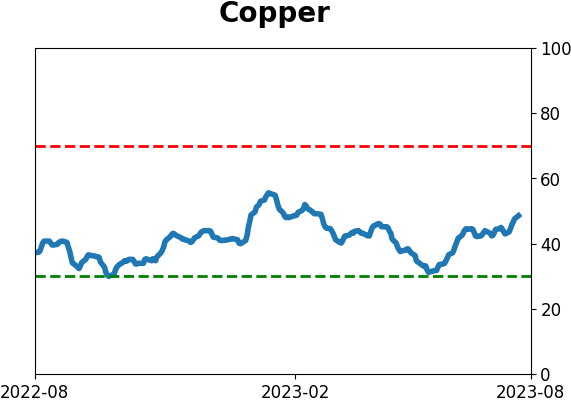
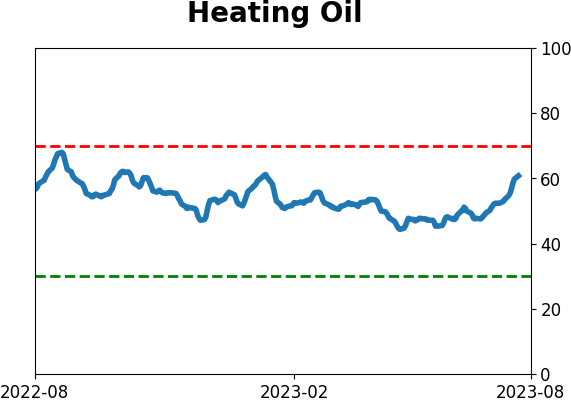
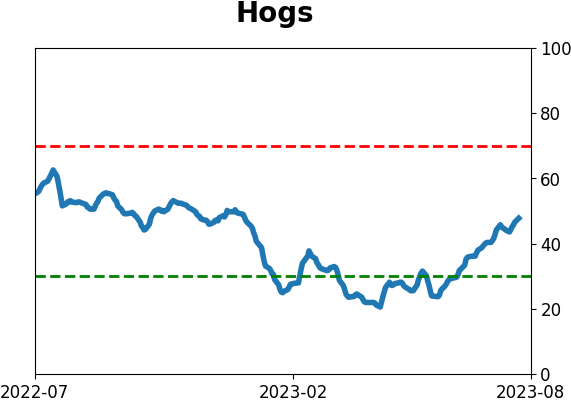
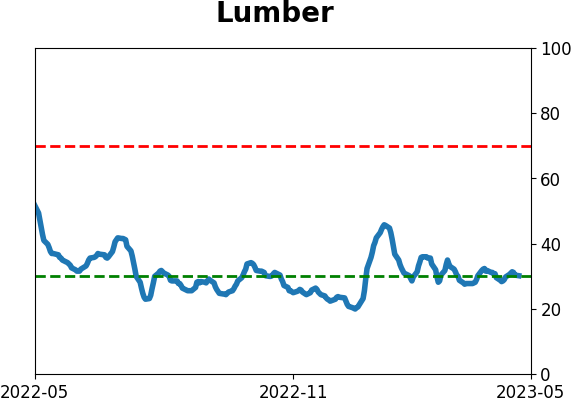
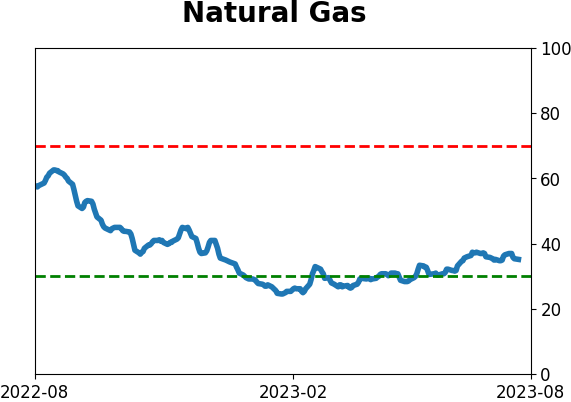
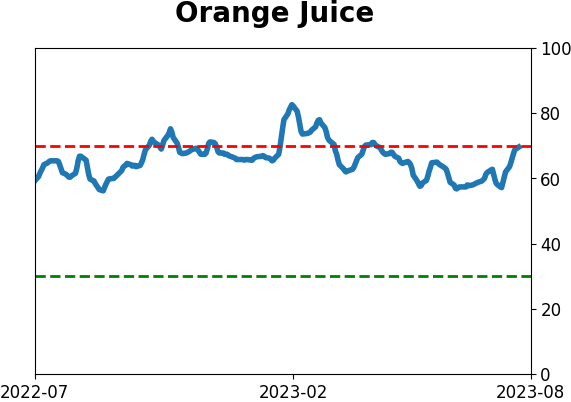
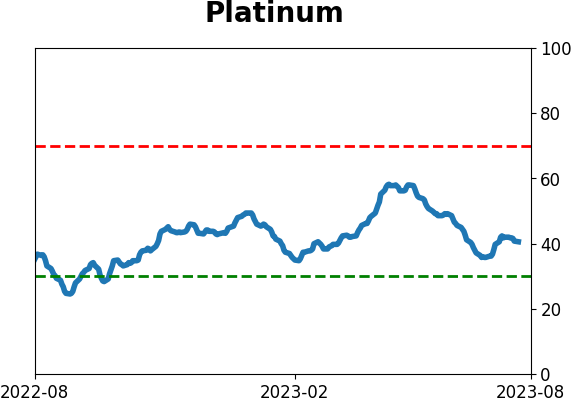
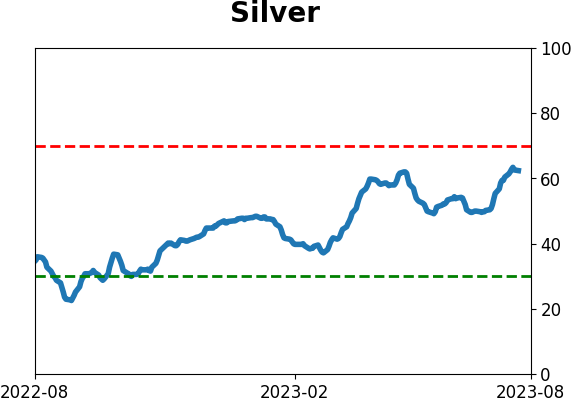
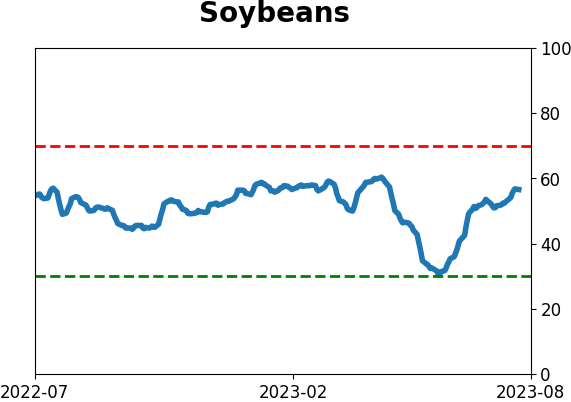
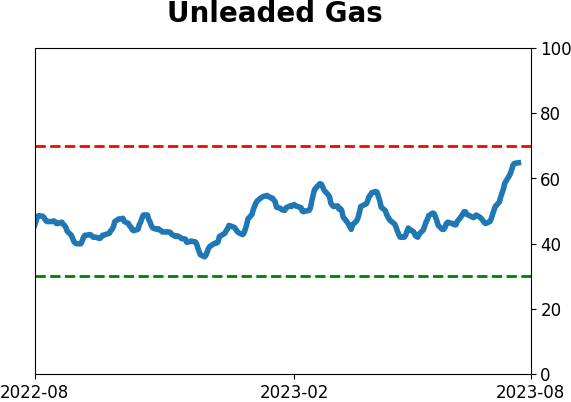
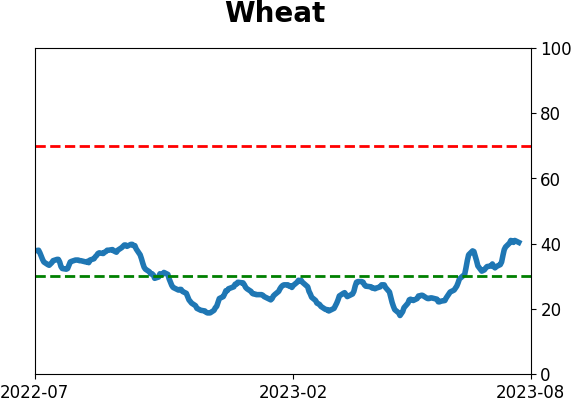
Commodity ETF's - 5-Day Moving Average
|
|