Daily Report : TradingEdge Weekly for Jul 29 - Disdainful consumers, fundamental concerns, frustrated gold bugs, "bear killer" thrusts

| View/Print a PDF version of this Report |
Headlines
|
TradingEdge Weekly for Jul 29 - Disdainful consumers, fundamental concerns, frustrated gold bugs, "bear killer" thrusts: This week, we saw continued challenges from a weak and deteriorating fundamental backdrop for stocks. Some "bear killer" thrusts triggered this week in stocks and high-yield bonds, after which those markets have excellent forward returns. Bond investors are trying to emerge from persistent pessimism, and doing a decent job in high-yield bonds. Gold bugs, on the other hand, can't catch a break. |
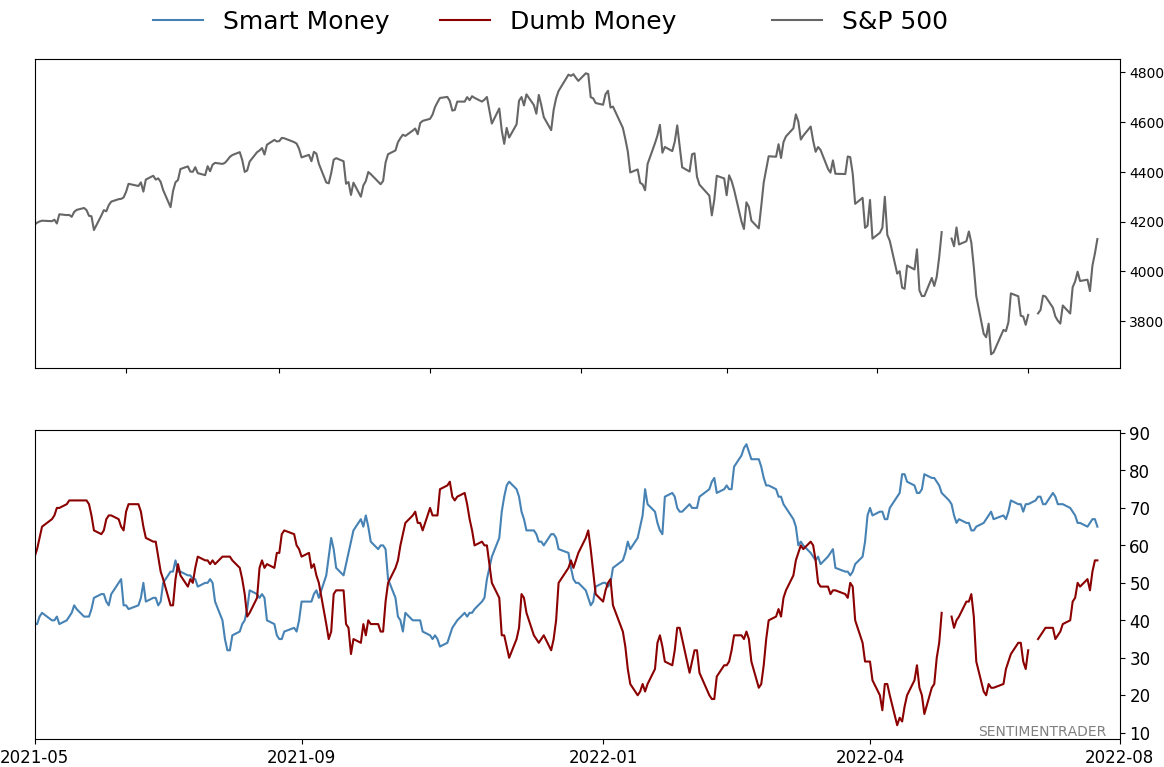
Smart / Dumb Money Confidence
|
|
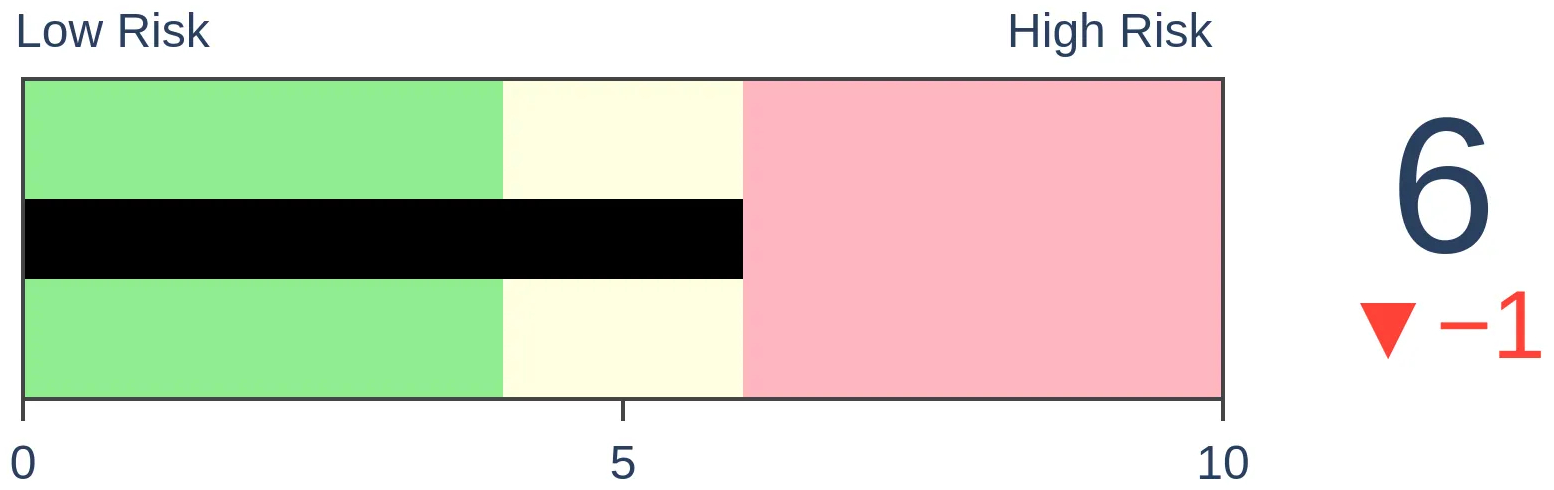
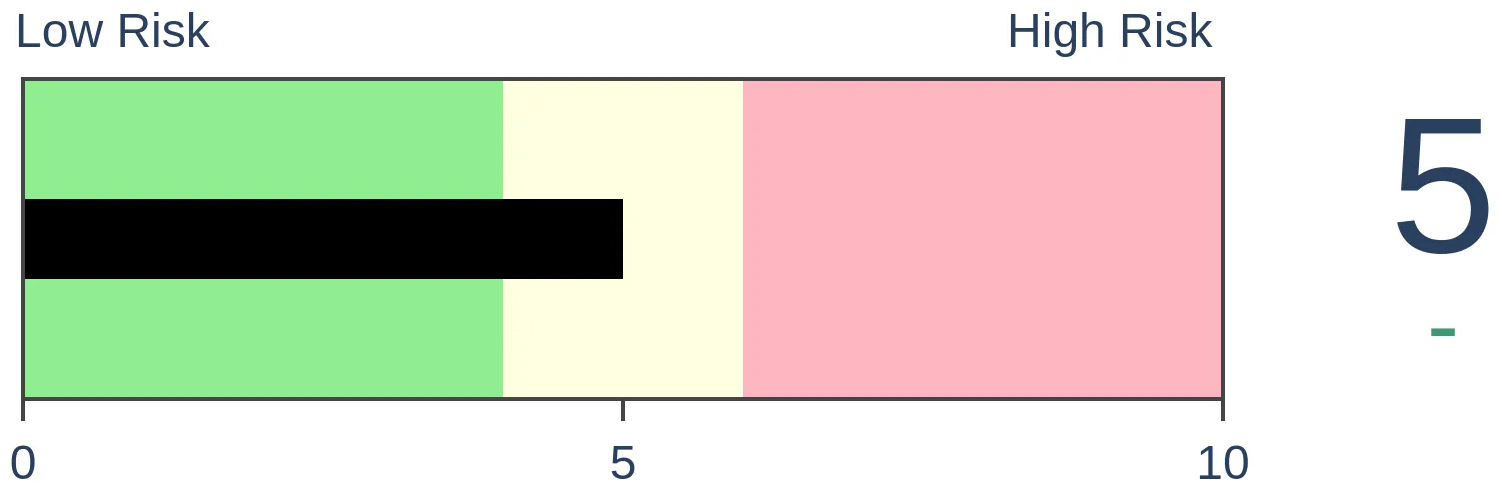
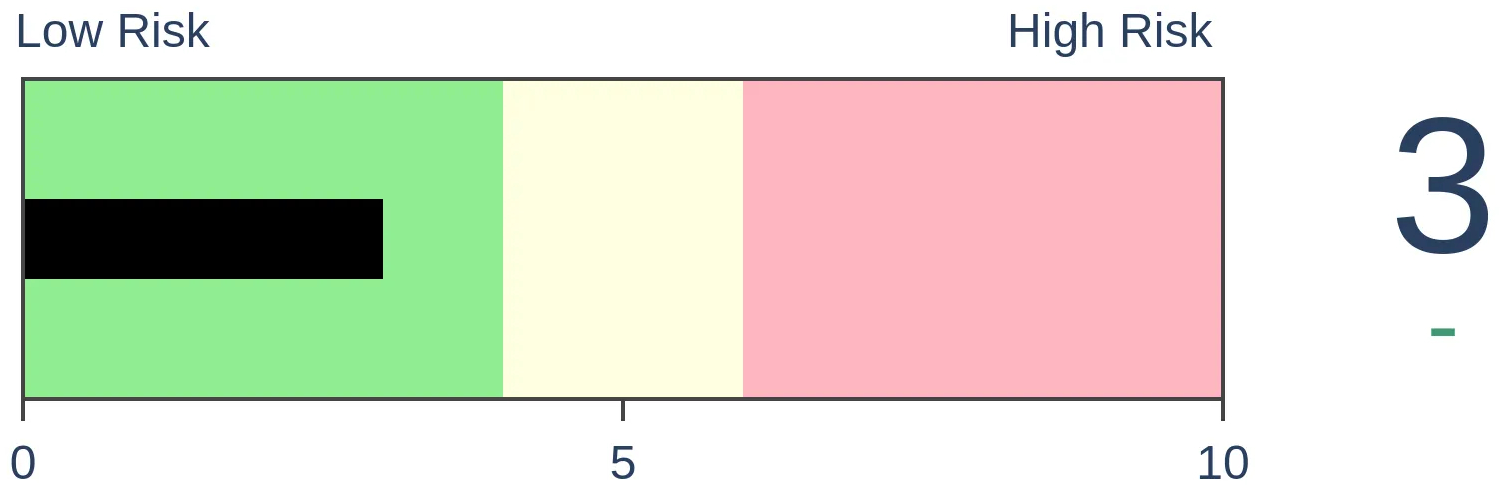
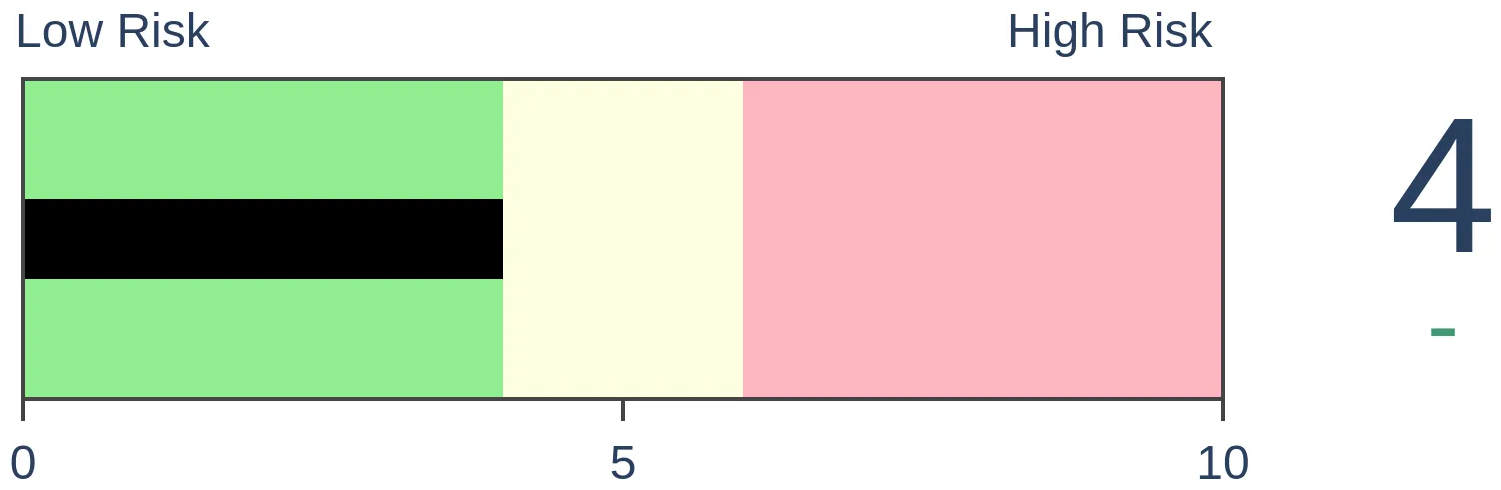
Risk Levels
|

|

|
Research
TradingEdge Weekly for Jul 29 - Disdainful consumers, fundamental concerns, frustrated gold bugs, "bear killer" thrustsBy Jason GoepfertBOTTOM LINEThis week, we saw continued challenges from a weak and deteriorating fundamental backdrop for stocks. Some "bear killer" thrusts triggered this week in stocks and high-yield bonds, after which those markets have excellent forward returns. Bond investors are trying to emerge from persistent pessimism, and doing a decent job in high-yield bonds. Gold bugs, on the other hand, can't catch a break. FORECAST / TIMEFRAME |
Key points:
- Fundamental conditions remain negative and are worsening
- Stocks struggle when the Leading Economic Indicators are below their long-term trend
- What a 4th consecutive Fed rate hike has meant for stocks and other markets
- Some "bear killer" thrusts triggered this week
- Consumers are showing outright disdain for the stock market
- August and September of mid-term election years have not been kind to investors
- Bond investors are trying to move out of a bear market mentality
- High-yield bonds are starting to emerge out of a historic bout of selling pressure
- Gold bugs simply can't catch a break, with a long string of losses
- Chile gave a buy signal
- Germany is facing headwinds from seasonality and trends
Fundamentals remain a terrible headwind
A consistent theme in these reports in recent weeks (months, even) has been that selling pressure and pessimism were deep enough that it has reliably preceded medium-term rallies, even during bear markets. That tendency has been severely challenged, and one of the consistent - and persistent - headwinds has been weak and deteriorating fundamental conditions.
The Goldman Sachs Bear Market Probability Model is still suggesting an 81% probability of a bear market in stocks. Our own Macro Index Model - which measures the strength of the economy - has plunged in recent months, suggesting a better than 60% probability of an impending recession. Jay noted that the spread between these two indicators suggests that the potential for a longer, more severe bear market remains intact.
This spread subtracts the latest Macro Index Model reading from the latest Bear Market Probability Model reading. High readings are considered bearish for stocks; low readings are bullish.
The chart and table below highlight those times when the Bear Market - Macro Index Spread crossed above 28 first time in 6 months.
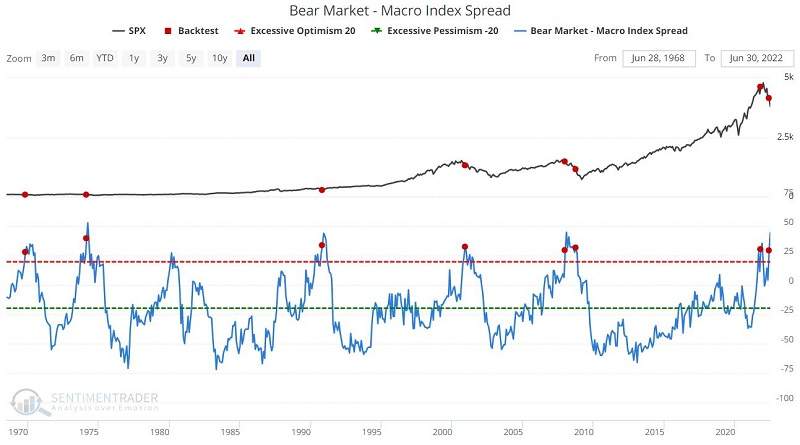
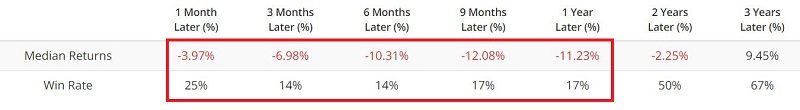
The dreadful performance results speak for themselves. We have seen many overbought/oversold and sentiment indicators flash encouraging signs in the last few weeks and months. In some cases, these indicators have reached levels that have effectively flashed an "all clear" sign in the past. Nevertheless, the current status of the indicators detailed here suggests that investors holding cash wait for more confirmation of a new uptrend before fully committing back to the market.
More fundamentally bad news
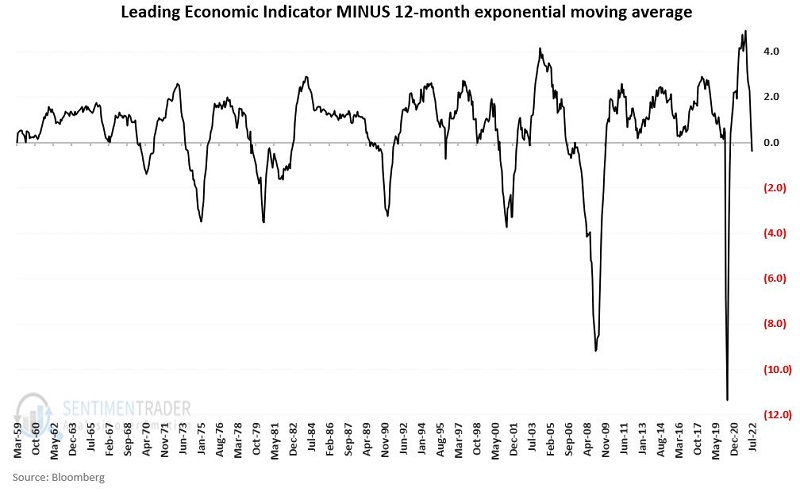
Jay also showed that the Conference Board Leading Economic Indicators (LEI) have fallen below their 12-month exponential moving average. Historically, the economy and the stock market perform better when LEI is showing strength.
There is no "perfect" way to define trends, so we will go with something straightforward. At the end of each month (regardless of when the data was released during the month), we will compare the latest LEI reading to its own 12-month exponential moving average. Interpretation is simple:
- If LEI > 12-month exponential average = Favorable for economy and stocks
- If LEI < 12-month exponential average = Unfavorable for economy and stocks
Since 1959, the S&P 500 has returned a cumulative +6,335% when LEI closed the previous month above its 12-month EMA.
The chart below displays the cumulative % growth for the S&P 500 index if held long only when LEI closed the previous month BELOW its 12-month EMA. The cumulative gain is only +10.7%.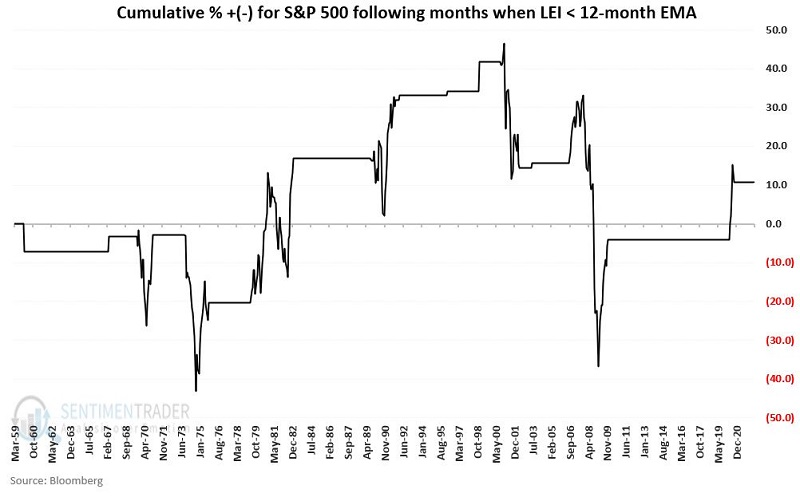
On the one hand, the S&P 500 Index did show a net gain while LEI < 12-month EMA. Nevertheless, the results are extraordinarily volatile and inconsistent and include most bear market periods (excluding 2002 until now) in the past 60+ years.
Fighting the Fed
The Federal Open Market Committee increased the federal fund's target rate for the 4th time. Dean showed that a 4th target rate increase preceded negative returns in the 6 & 12-month time frames for stocks, while commodities rallied and the yield curve contracted.
This study uses the fed funds target rate since 1989 and the discount rate in prior instances.
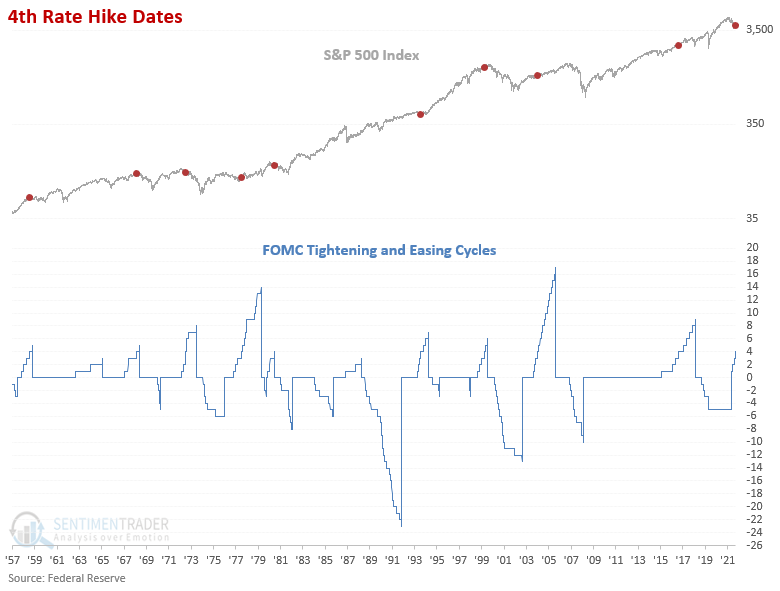
The 4th increase in the target rate preceded somewhat flat returns for the next few months and a negative outlook in the 6 & 12-month windows.
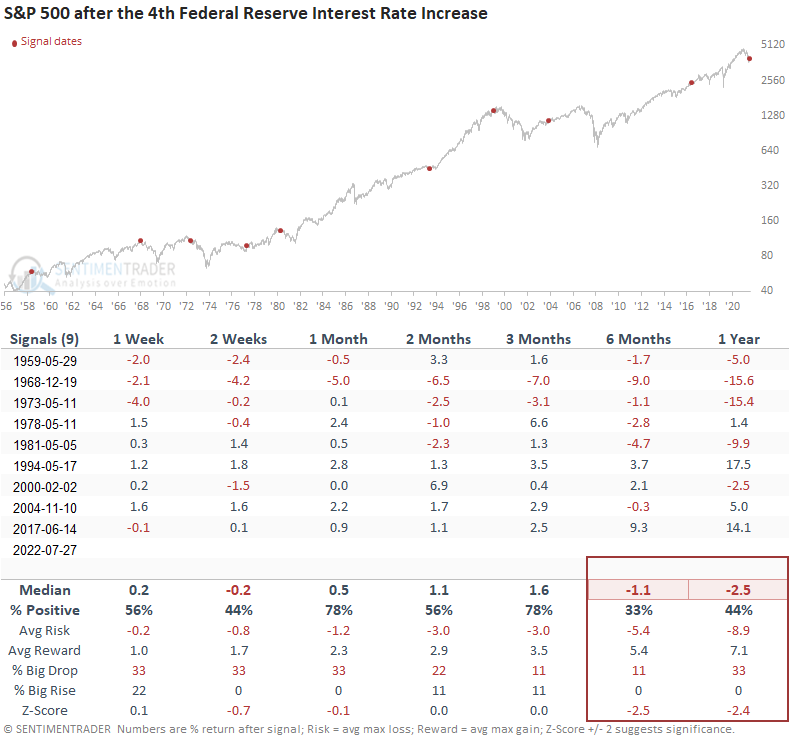
Interest rate-sensitive groups tend to struggle, especially the automobiles and components industry. Not surprisingly, a defensive group like health care holds up well. The Bloomberg Commodity Index returned an average 14.1% a year after these signals, while gold tended to decline over the next 3-6 months and averaged a one-year return of only 1.7%.
"Bear killer" thrusts have triggered
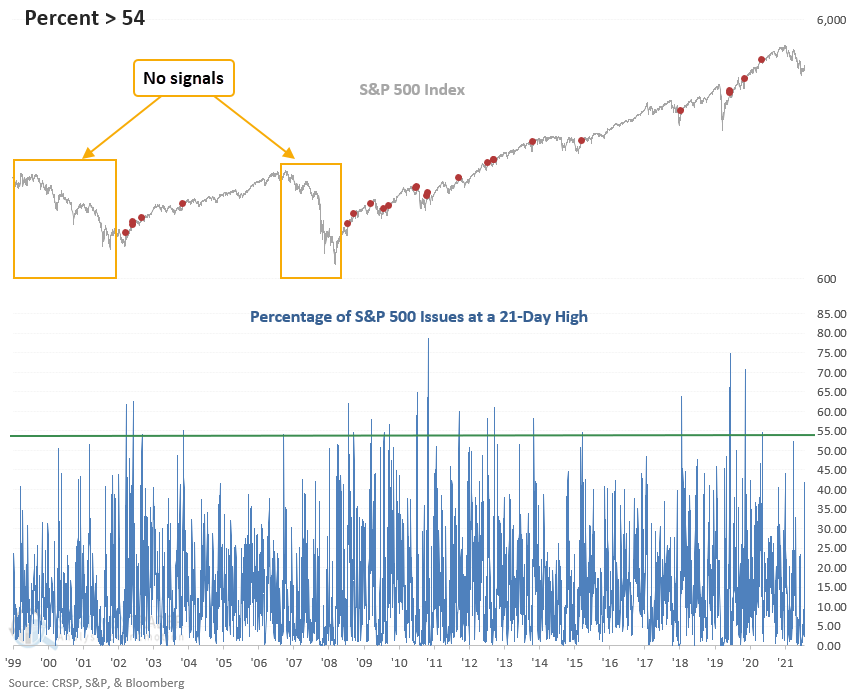
The number of S&P 500 issues registering a 21-day high remained below a critical level earlier this week. Dean showed that a surge above 54% would trigger a thrust signal that preceded gains following bear markets every time since 1950. It did so on Thursday.
During bear market phases since 1950, the percentage of issues registering a 21-day high fails to increase above the threshold level for a signal. When it does exceed the threshold level, the alert has a perfect record since 1950, with only one non-signal after a bear market, which occurred in 1966.
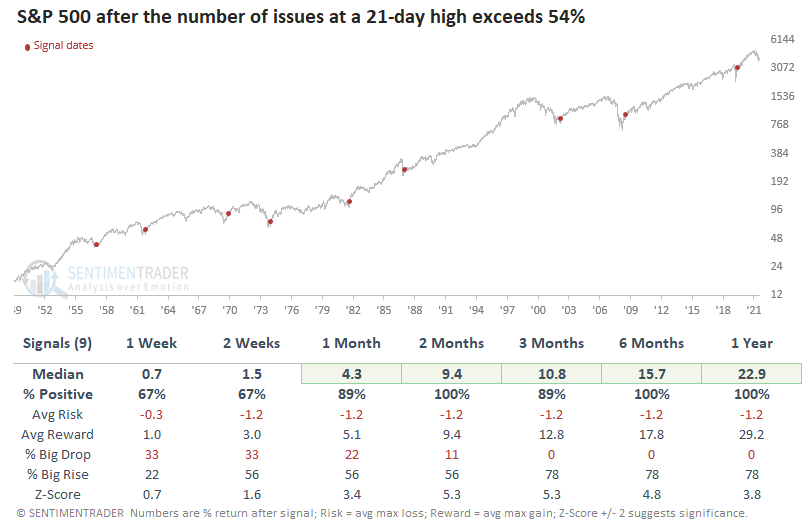
If we isolate bear market instances since 1950, the model generated a signal 9 times. After the others, S&P 500 future returns, win rates, and z-scores were excellent. The alert shows a perfect record 2, 6, and 12 months later.
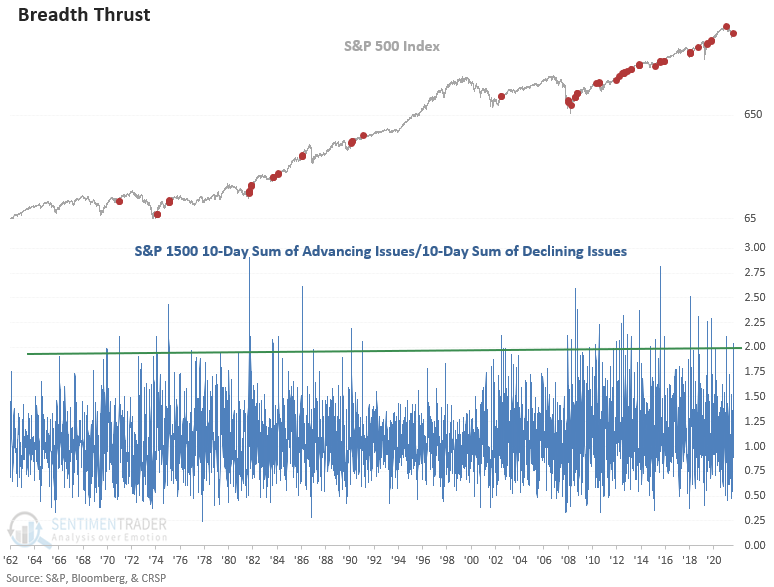
Dean also noted that other thrusts have now been triggered. Another model identifies when the 10-day sum of S&P 1500 advancing issues exceeds the 10-day sum of S&P 1500 declining issues by 1.97 to 1 after a reset condition to screen out repeats.
It's important to note that the new signal from a basket of stocks across all market capitalizations coincided with a thrust from members in the more economically sensitive S&P 400 and 600 indexes. i.e., mid and small-cap stocks. Due to the limited history of the all-cap index, I apply the S&P 1500 signals to the S&P 500 index.
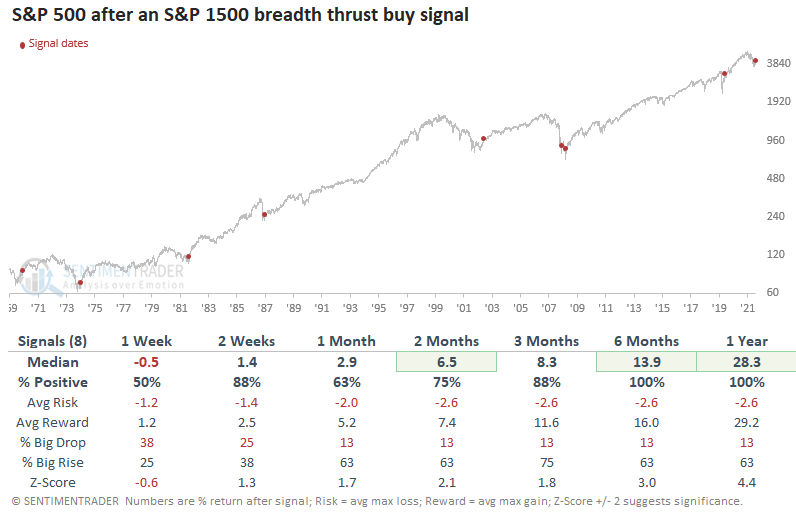
If we isolate instances that occurred after the S&P 500 closed down 20% from a high, the model triggered a signal 8 other times in the last 52 years. After the others, S&P 500 future returns, win rates, and z-scores were excellent across all time frames. The signal has a perfect record 6 & 12 months later. However, the alert in December 2008 is a good reminder that the path to higher stock prices is not always smooth.
Dean used the same breadth thrust model/concept for high-yield bonds, which also triggered late this week. While history is limited to about the last 15 years, forward returns in stocks and high-yield bonds were excellent.
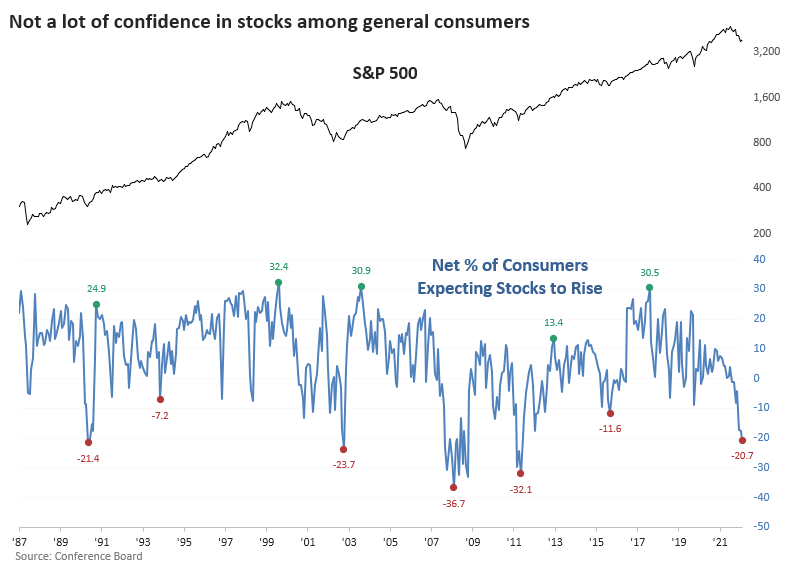
The lack of "oomph" drives severe disdain for stocks
The latest survey of households by the Conference Board showed that only 25% of consumers expect stock prices to rise over the next twelve months. That reading is in the bottom 5% of all months since 1987. At the same time, a whopping 46% of consumers expect stocks to drop, ranking in the top 3% of all months since '87.
The difference between bulls and bears has plunged to -21%, one of the worst readings in the survey's history.
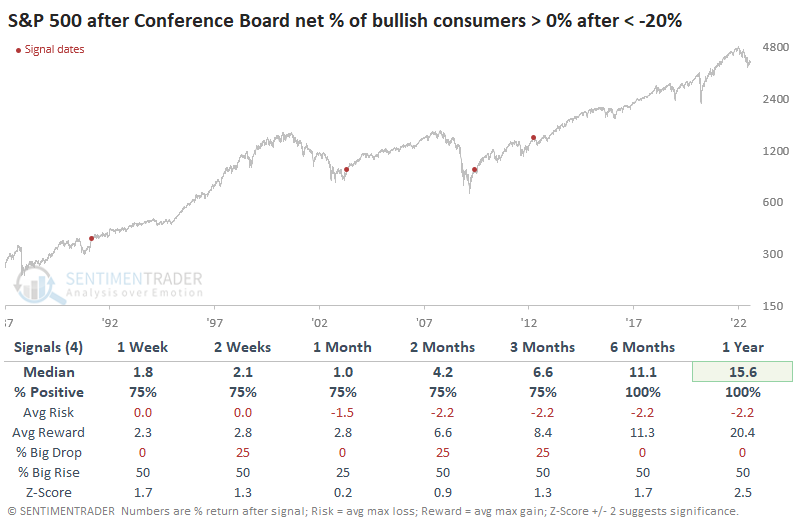
When consumers first get the impression that it's a good idea to actively bet against stocks, they're typically very wrong. Even during the financial crisis - when they were ultimately proven very right - the S&P 500 rallied more than 5% over the next three months.
The sticking point for anyone looking at the above table, other than the tiny sample size, is the outlier during the financial crisis. Buying into deep pessimism looked good for a while, then suffered horrible losses.
So, let's just wait until consumers get their bearings again. After more than a net 20% of them expect stocks to drop, we'll wait until more of them think stocks will rise than decline. If we do that, we sidestep the entirety of the financial crisis and still enjoy double-digit gains during the following year. We bought right at the peak before a painful correction in 2012, but otherwise, the gains were consistent and large.
Among sectors and factors, this waiting strategy preceded some massive gains in Small-Caps, though overall sector returns were less than if we'd just bought on the first sign of deep pessimism.
They might have to wait a couple of months
The months of August and September have individually registered lackluster results during mid-term years. Jay noted that the months of August and September have shown a net loss during mid-term years over the past 100 years.
The chart below displays the cumulative % return for the S&P 500 Index if held only during August (black line) and September (red line) during every mid-term election year since 1920.
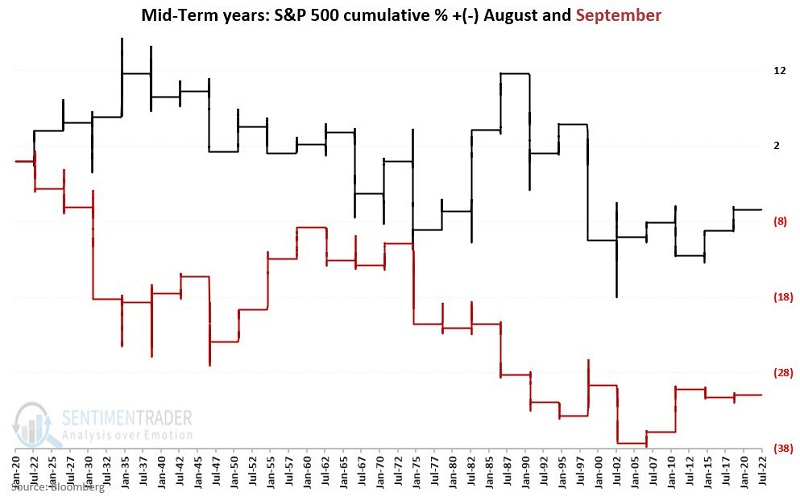
The results are pretty random on an election cycle to election cycle basis, with both months showing some gains and some losses. The critical thing to note is that both months have registered a net loss over the past 100 years.
It is rarely a good idea to trade based solely on seasonality as a standalone indicator. So, let's add the most important indicator of all - price action. The chart below displays the cumulative % gain/loss for the S&P 500 when the month is August or September of a mid-term election year and SPX is below its 200-day EMA.
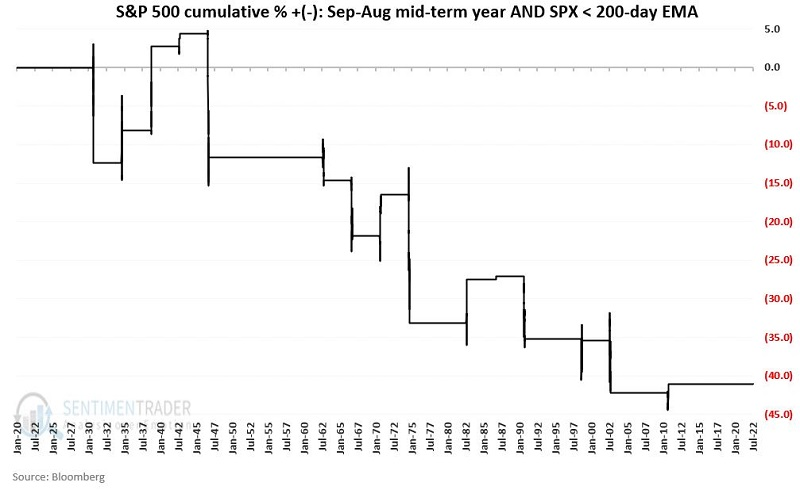
During this unfavorable seasonal period:
- Cumulative gain when $SPX > 200-day EMA = +10%
- Cumulative loss when $SPX < 200-day EMA = (-41%)
Bond investors are trying to get out of a bear market mentality
One heuristic we touch on frequently is that investors behave differently in bull markets than in bear markets. In terms of indicators, pessimism tends to get deeper for longer, and when it moves back to neutral, selling pressure tends to set in.
In the bond market, we've certainly seen the former.
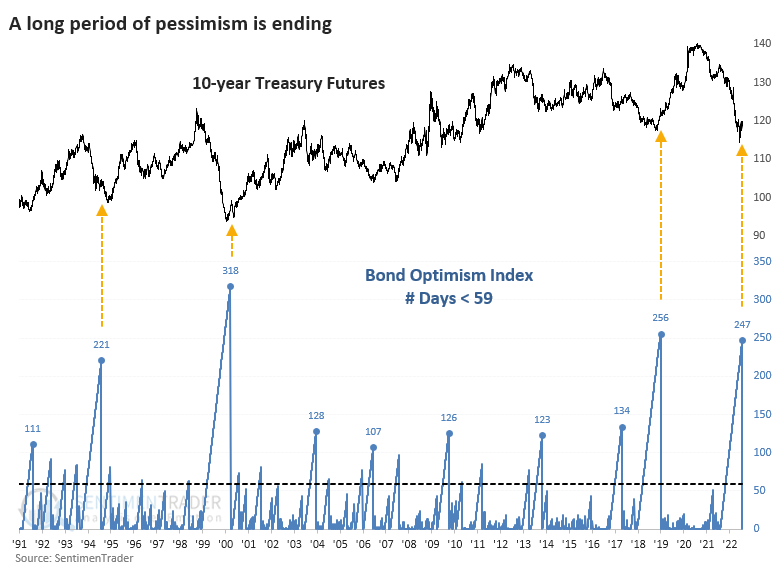
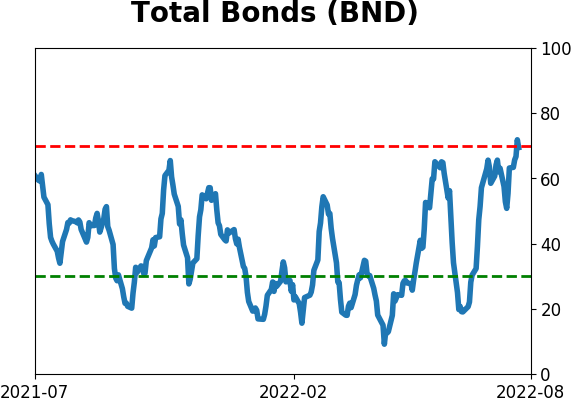
For the first time in a year, the Bond Optimism Index (Optix) has neared the 60 threshold that tends to define bull vs. bear market sentiment (not just in bonds, but across markets). During bear markets, Optix tends to stay below 40, with moves toward 60 bringing out sellers.
While Bond Optix hasn't quite made it to 60, it's gotten as close as possible. This is the first time in almost exactly a year that it has been this high. The others triggered near the ends of the most significant bear markets in bond prices over the past 30 years.
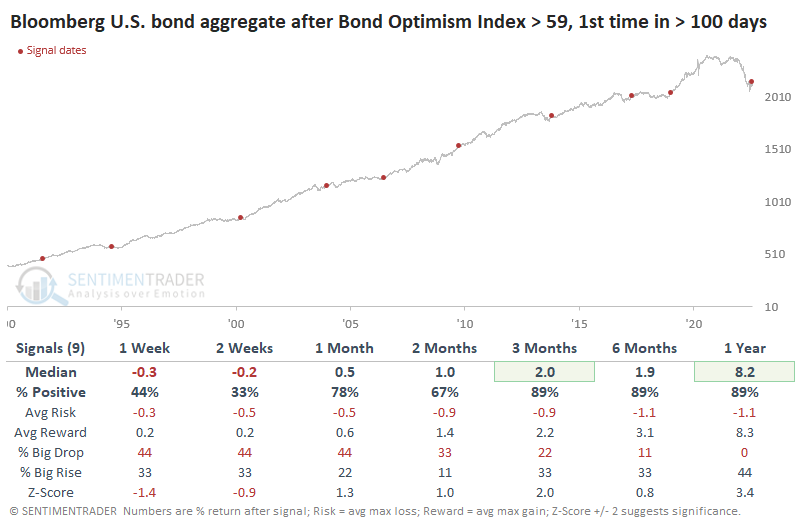
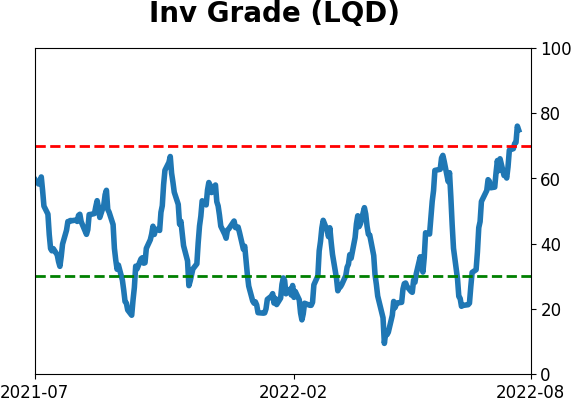
Looking at lesser extremes, the first reading of 59 or higher in more than 100 sessions, returns deteriorated significantly. Returns in the Bloomberg U.S. bond aggregate total return tended to be significantly better, which is not a big surprise since it incorporates income and not just price return. The index is heavily weighted toward Treasuries but also includes mortgages, corporates, and asset-backed securities.
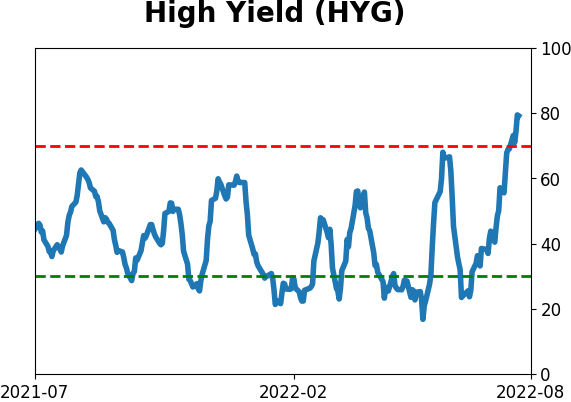
High-yield bonds trying to recover, too
As investors weigh the probability of a recession, it's depth, and future Fed response, one key area to watch is the high-yield corporate bond market.
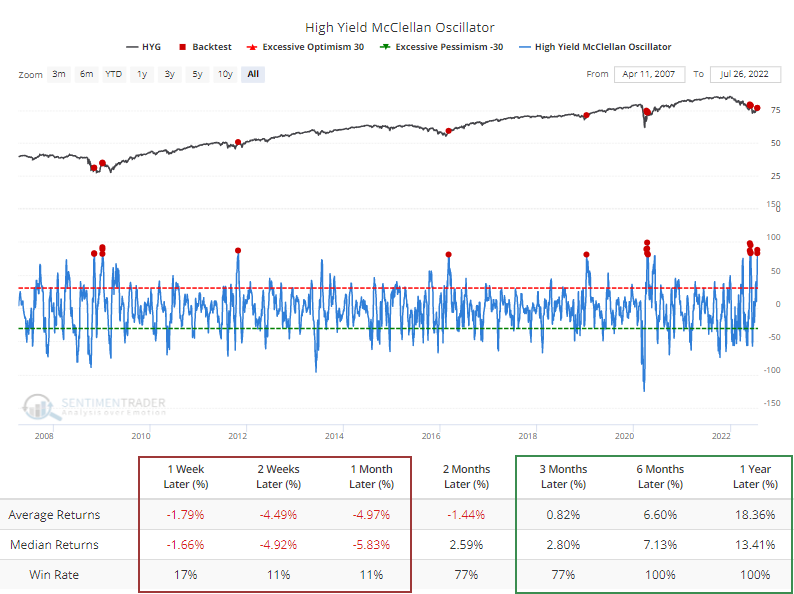
After a complete shellacking in June, many of these bonds have stabilized and there are some signs of recovery. In recent days, the McClellan Oscillator, a reflection of internal momentum, crossed above +80, an extremely strong number. The Backtest Engine shows that while the most popular high-yield bond fund, HYG, suffered short-term losses nearly every time, long-term returns were excellent.
The jump in the McClellan Oscillator is helping to bring the Summation Index out of its deep funk. This is the first time in six months that the Summation Index climbed above -500. That's a remarkable streak of negative momentum, more than double the number of days the index spent below -500 during the financial crisis.
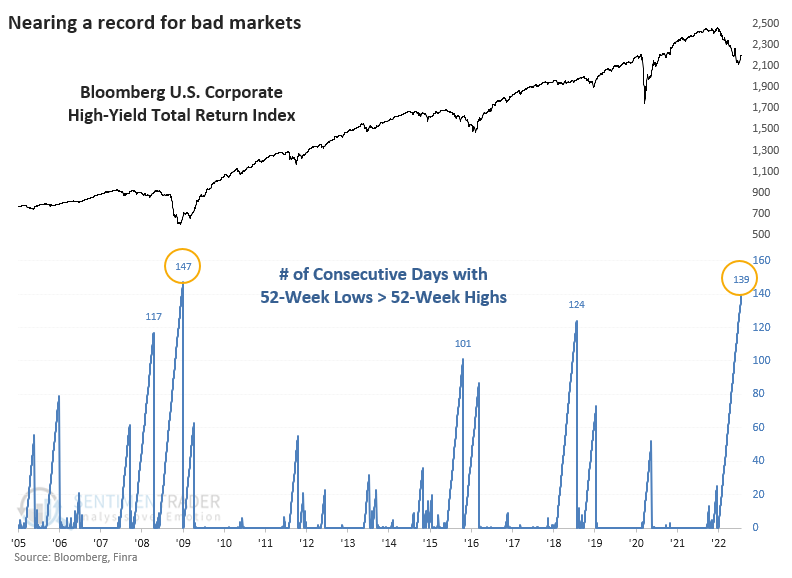
A healthy market sees more component stocks (or bonds) hitting 52-week highs than falling to 52-week lows. In high-yield bonds, there have been a few days when highs outnumbered lows since last fall, but it's been deeply negative for most of the past six months.
Like so many positives in recent weeks and months, across almost all markets, the only bright side for investors is that things are so bad that they're potentially good. High-yield bonds are nearing a record number of consecutive days when the number of 52-week lows outnumbered 52-week highs.
The high-yield bond market tends to track the stock market as much (or more) than the broader bond market. As such, it's suffered the double-whammy of a poor stock market and horrible bond market. The recent surge in buying interest has been a reliable bullish sign for that market, though bulls have to hope it's strong enough to make up for the failures seen earlier this year.
Gold bugs can't catch a break
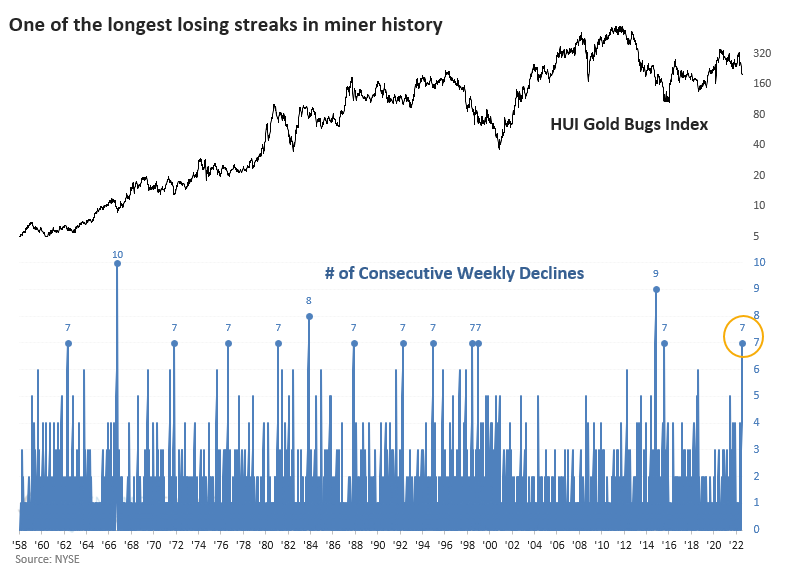
There may be no more frustrating market to trade than gold, and gold mining stocks by extension. A few weeks ago, selling pressure in miners had been so severe that it triggered one of the most extreme panic breadth readings in 40 years, and yet buyers still aren't interested.
Persistent daily declines mean that on a weekly basis, gold bugs haven't been able to get off the mat. Last week marked the 7th consecutive weekly drop.
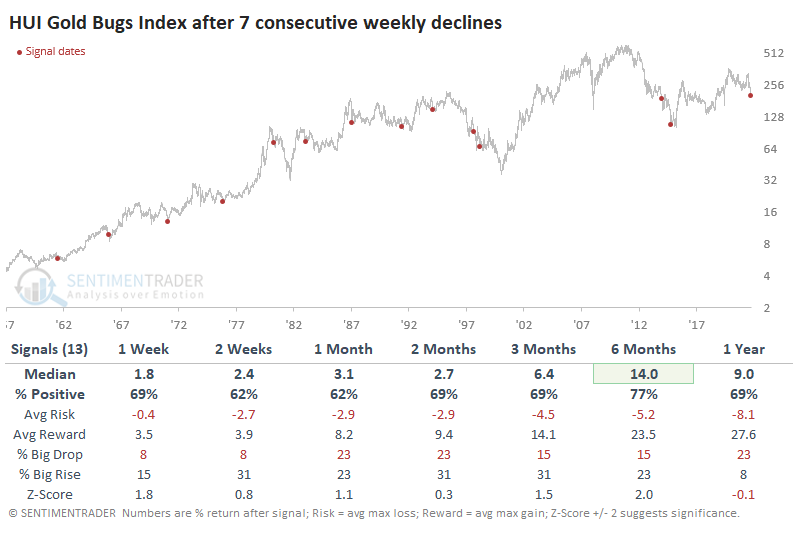
The other times when the Gold Bugs Index fell seven weeks in a row, it tended to rebound over the medium-term. After the 13 signals, all but two saw more "reward" than "risk" over the next six months.
Miners themselves have registered some extremes. The 20-day average of 52-week lows crossed above 22% of stocks at new lows. That preceded gains for gold mining stocks between two and six months later.
The horrid slide in gold and plunge in mining stocks has led hedge funds, Commodity Pool Operators, and other money managers to slash their bets on metals prices. As of the latest week, they're aggressively betting those contracts will continue to fall. In gold and silver combined, money managers hold the 2nd-most aggressive bet on a decline since the inception of the data 16 years ago.
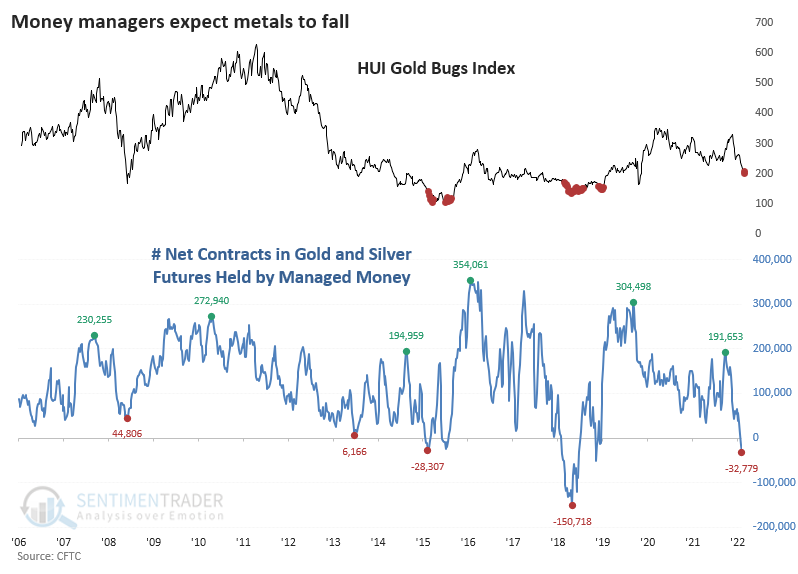
They're certainly not the only investors who are ill-positioned if gold and other metals find a way to rise. Traders in the GLD exchange-traded fund recently pulled an average of almost $200 million daily from the fund over 20 days. That's one of the most egregious outflows since the fund's inception.
The market times who frequent the Rydex Precious Metals fund have given up, with assets in the fund dwindling to less than $50 million. When these particular traders get excited or despondent about any particular sector or asset, there has been a consistent tendency over the past two decades to make them regret it.
There are more and more factors pointing to a rally in gold and mining stocks, but that was the case a few weeks ago. More than anything, there is enough evidence to suggest that actively betting against precious metals and mining stocks at this point is highly risky. Whether that translates into a low-risk opportunity for buyers is another matter; these markets have disappointed them too many times in recent weeks to have a high degree of confidence.
A Chile buy signal
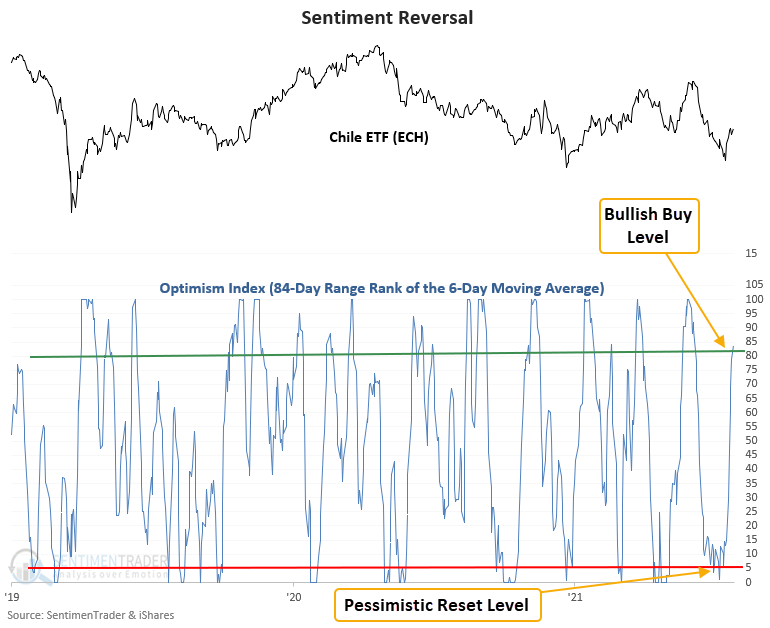
Dean noted that a model that uses our Optimism Index (Optix) to pinpoint when sentiment reverses from a period of pessimism issued a buy signal for the Chile ETF (ECH) on 7/25/22.
The model measures the current value relative to all other values over a lookback period. A new buy signal triggers when the range rank exceeds the 81st percentile after a pessimistic reset, and ETF momentum turns positive within 5 days of the cross.
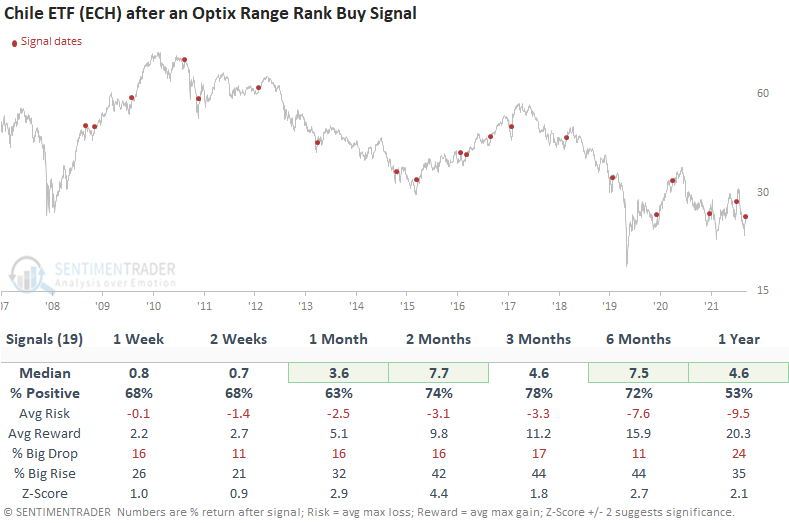
This model generated a signal 19 other times over the past decade. After the others, the ECH ETF future returns, win rates, and z-scores were solid across all time frames, especially the 2-month window. The signal shows a gain at some point in the first month in 16 out of 19 instances. The previous alert is a good reminder that one must take quick profits in a bear market.
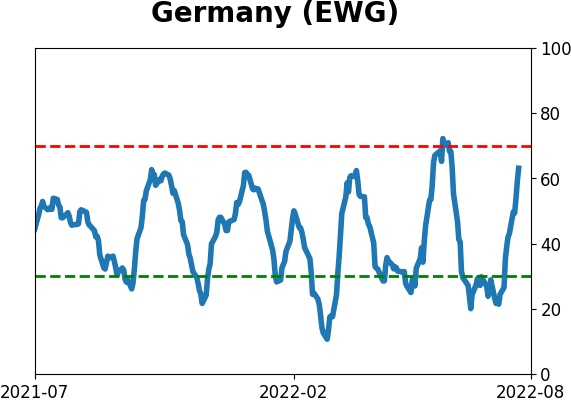
Germany's weak seasonal and trend tendencies
The German stock market is entering its least favorable seasonal period, and German stock market price action has been weak. Jay showed that, historically, this has been a dangerous combination for traders.
The chart below displays the annual seasonal trend for ticker EWG (Germany iShares MSCI ETF).
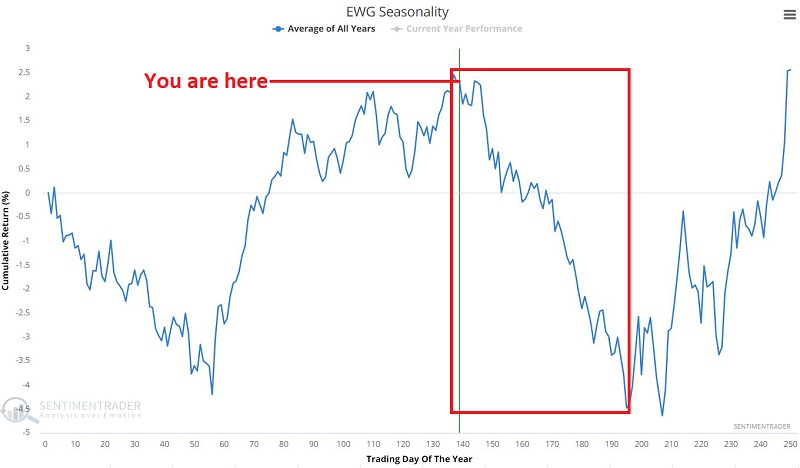
A very unfavorable period occurs between Trading Day of Year (TDY) #137 and TDY #195. For 2022, this period extends from 7/20/2022 through 10/11/1995.
The chart below displays the cumulative % gain/loss for EWG during this seasonal weak spot and EWG is trading below its 200-day exponential moving average at the time.
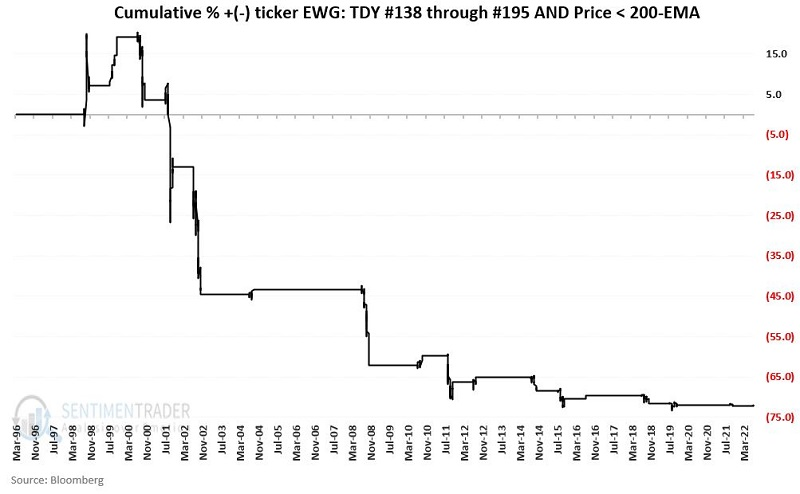
During this unfavorable seasonal period, EWG returned +10% if it was trading above its 200-day average. But it returned -72% during these windows when below its average, which is the case now.
Jay also outlined an options trade that could be used to trade this tendency while limiting risk if it doesn't work out as it has in the past.
About TradingEdge Weekly...
The goal of TradingEdge Weekly is to summarize the research published to SentimenTrader over the past week. Sometimes there is a lot to digest and this summary is meant to highlight the highest conviction or most compelling ideas we discussed. This is NOT the full research that's published, rather it pulls out some of the most relevant parts. It includes links to the published research for convenience; if you don't subscribe to those products it will present the options for access.
Indicators at Extremes
|
|
|
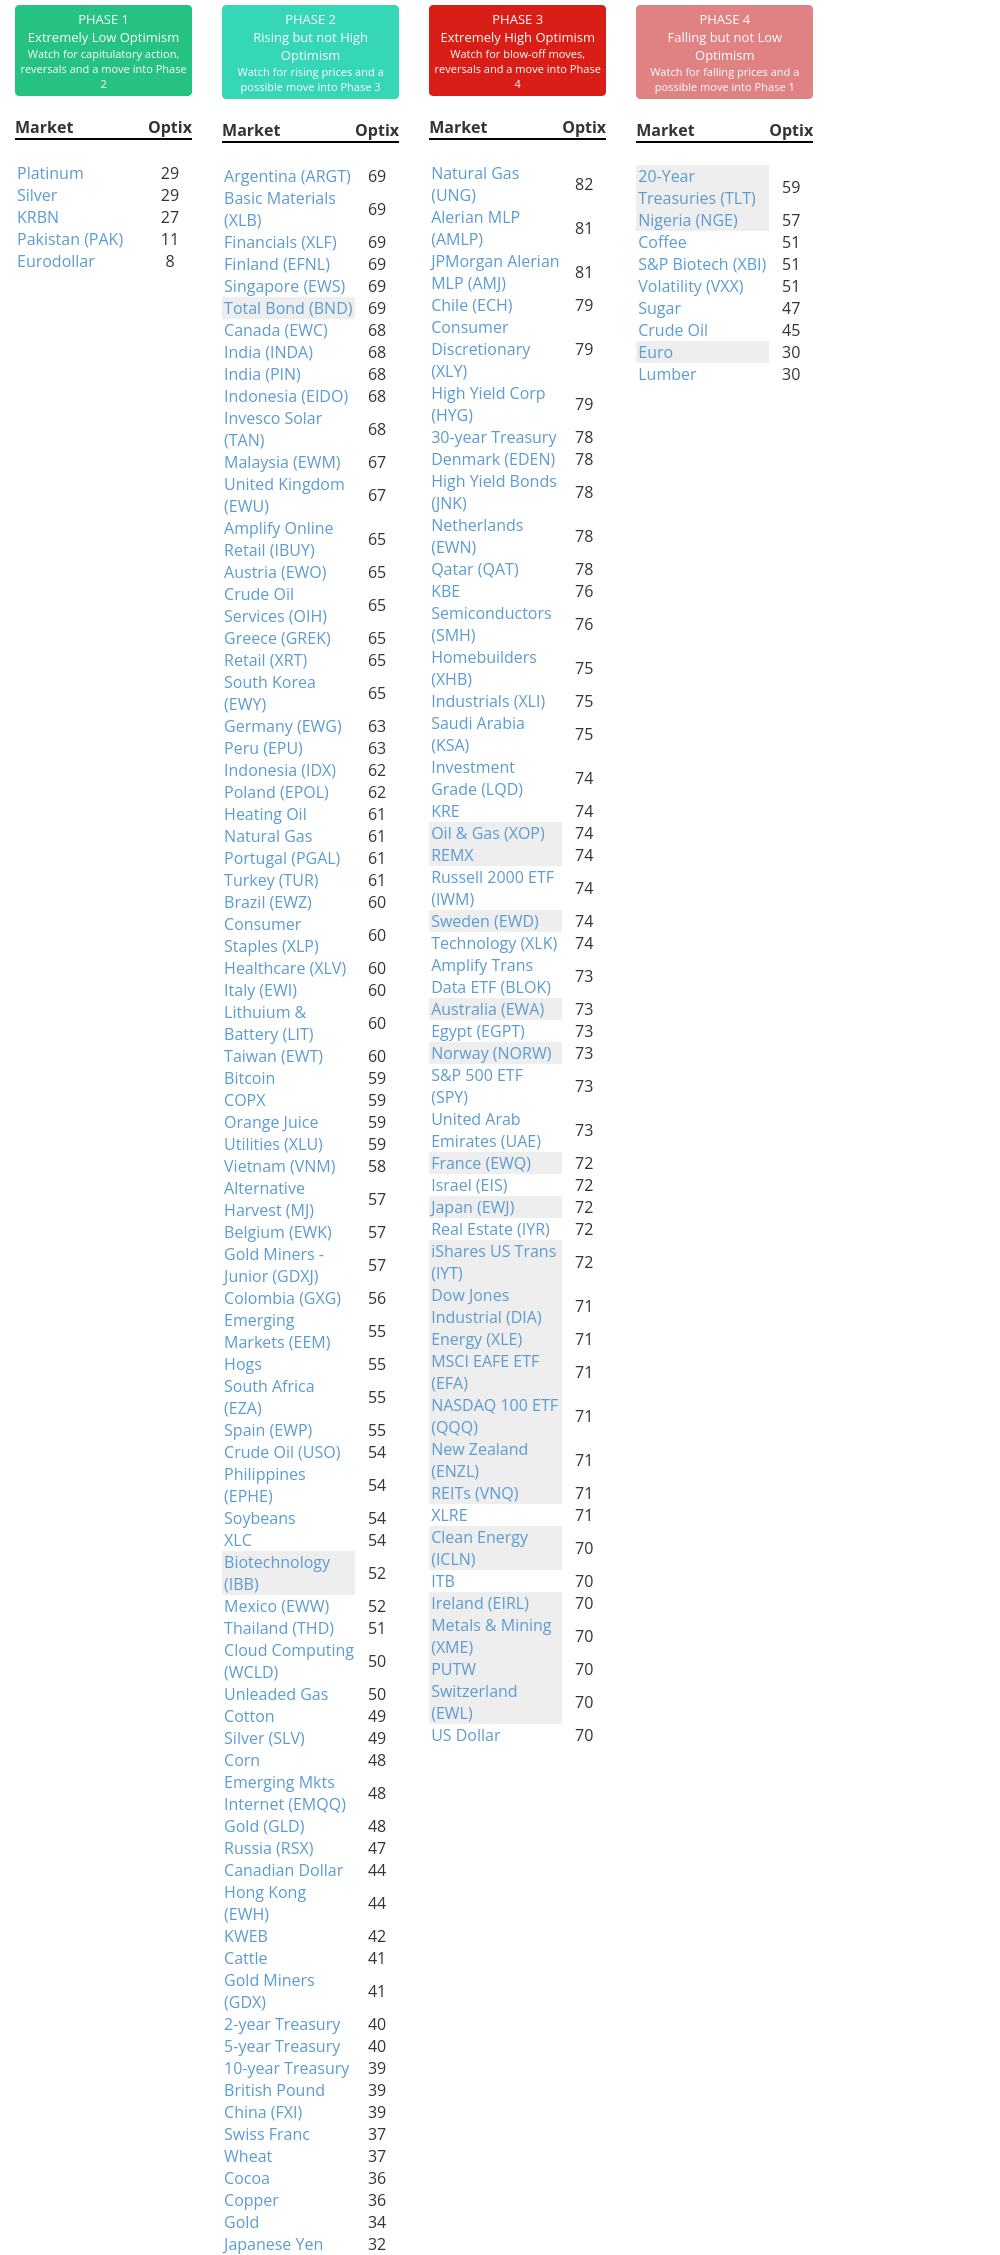
Phase Table
|
|
|
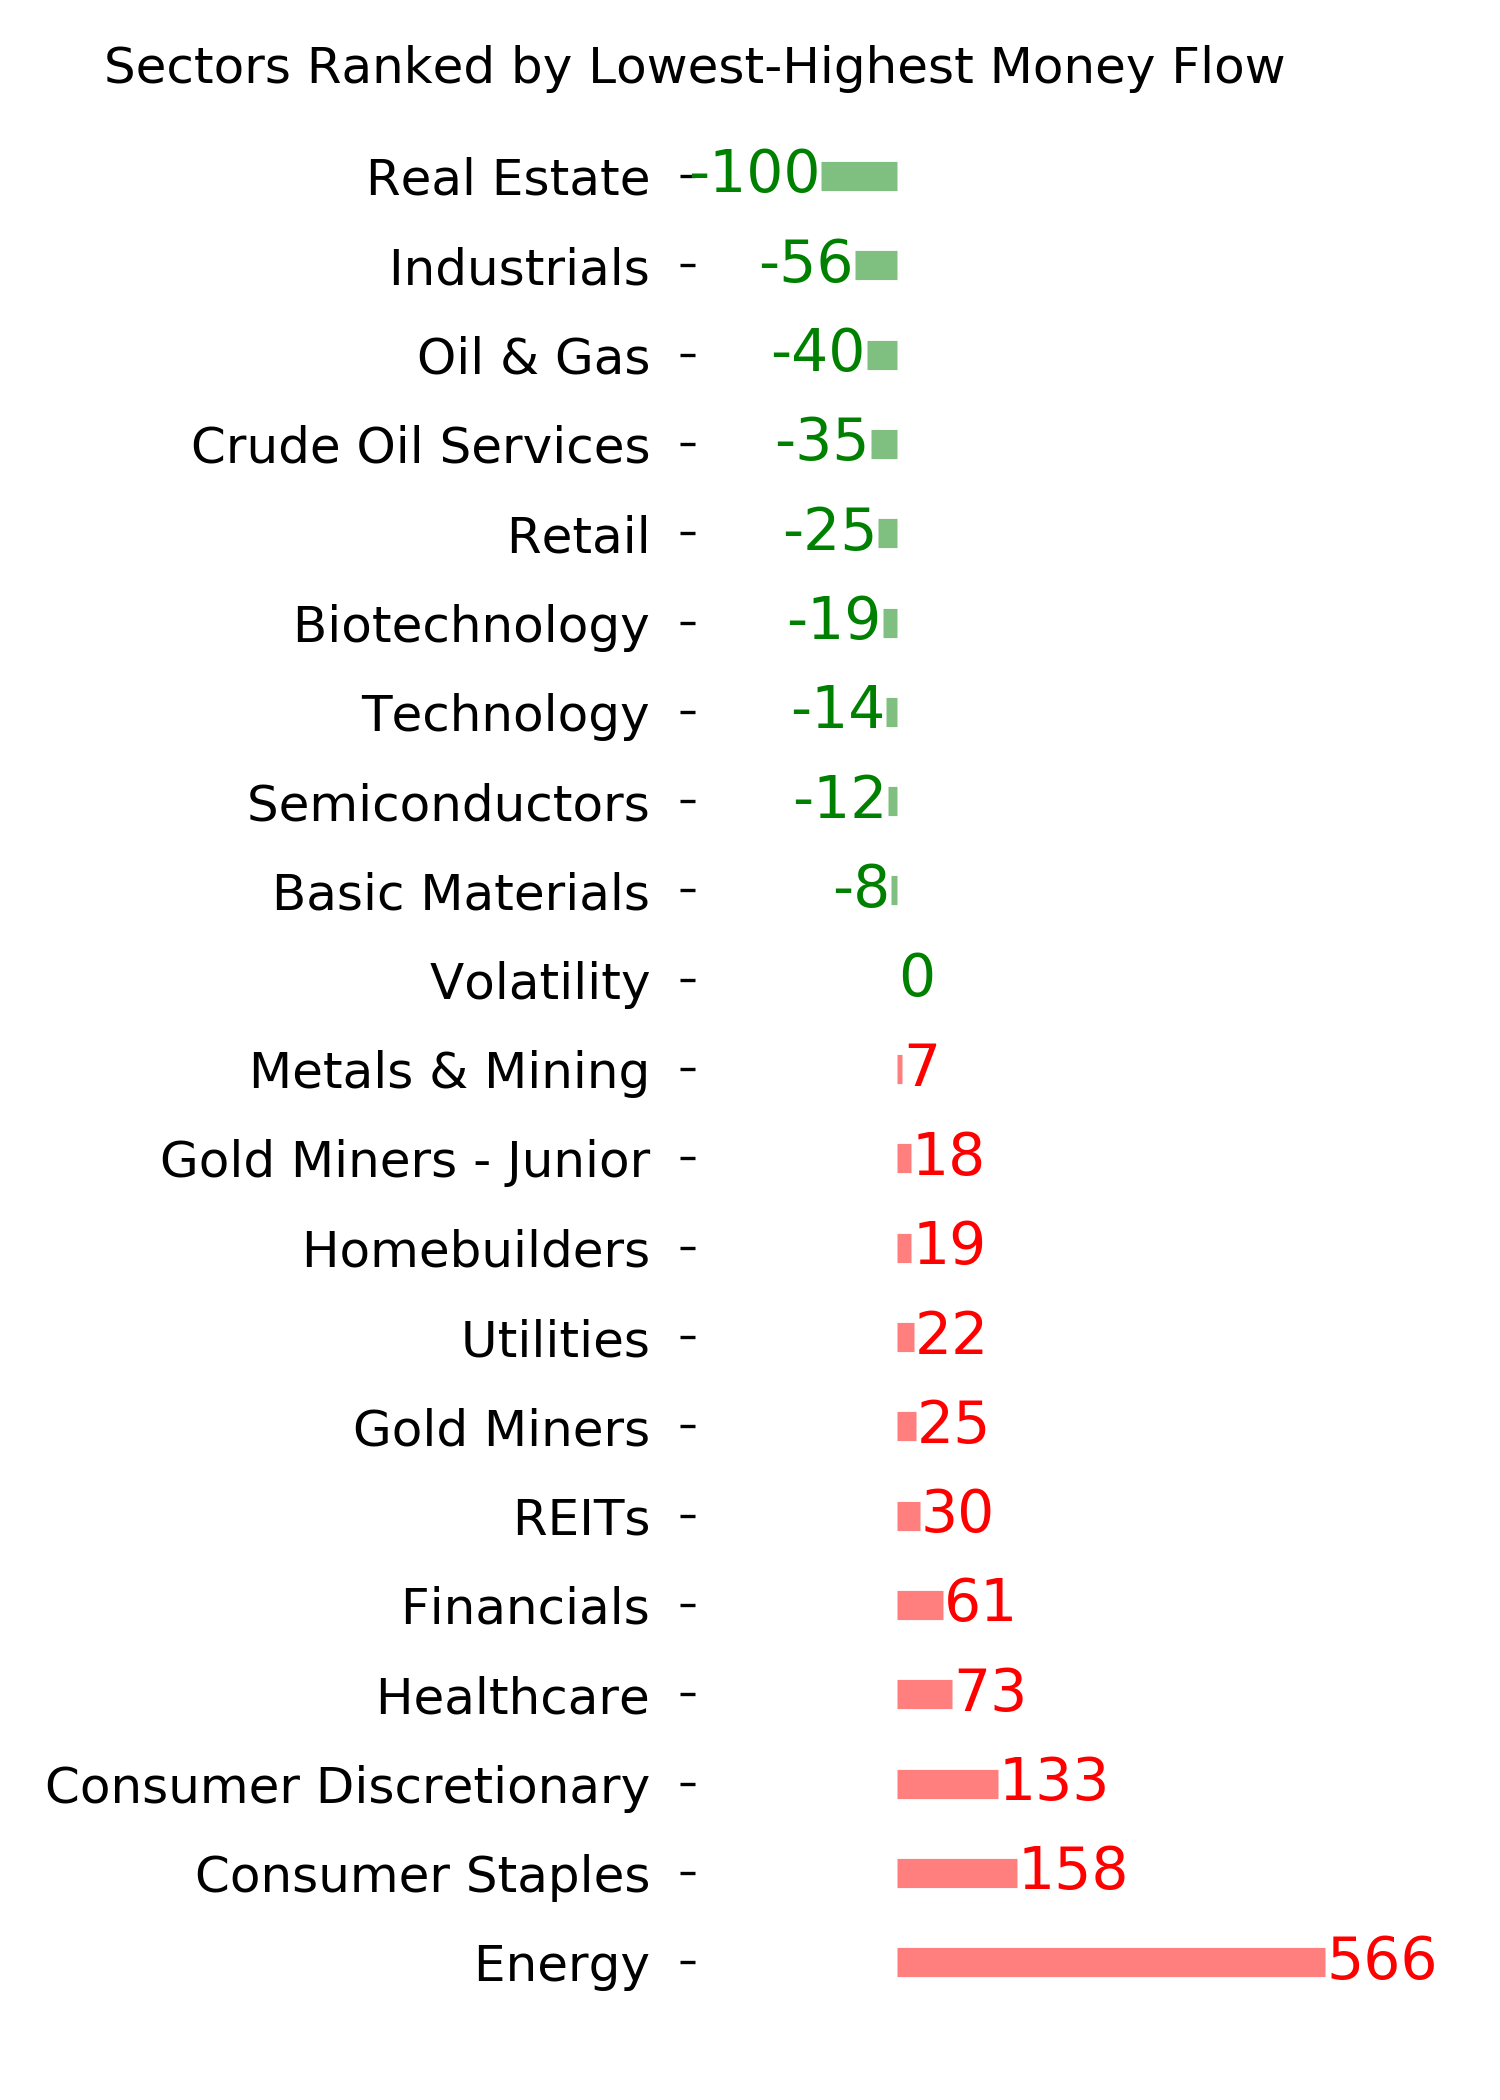
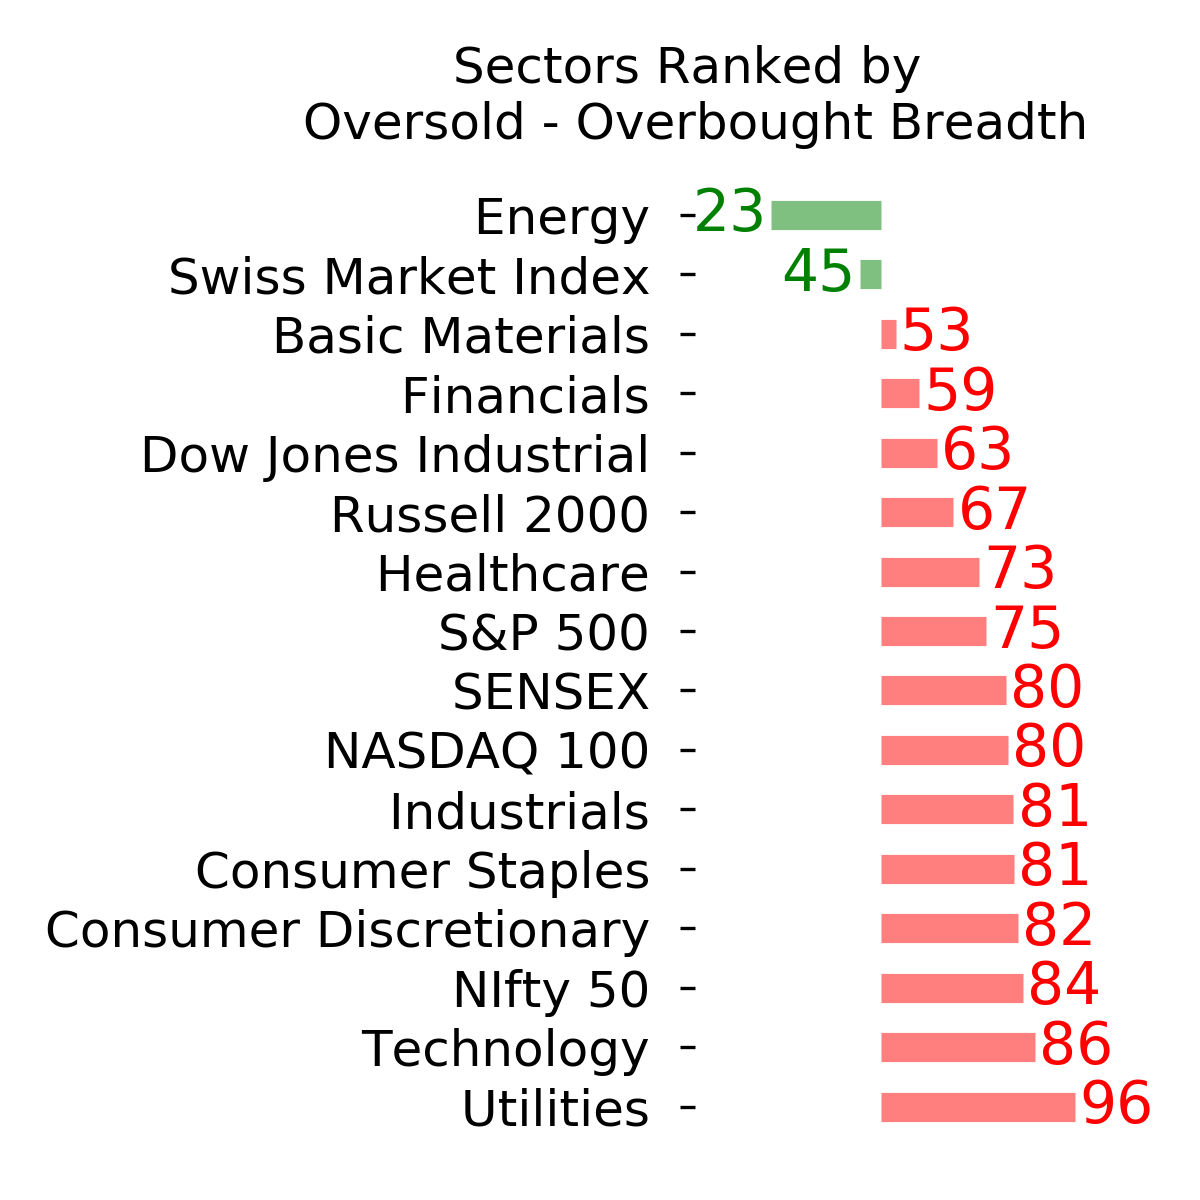
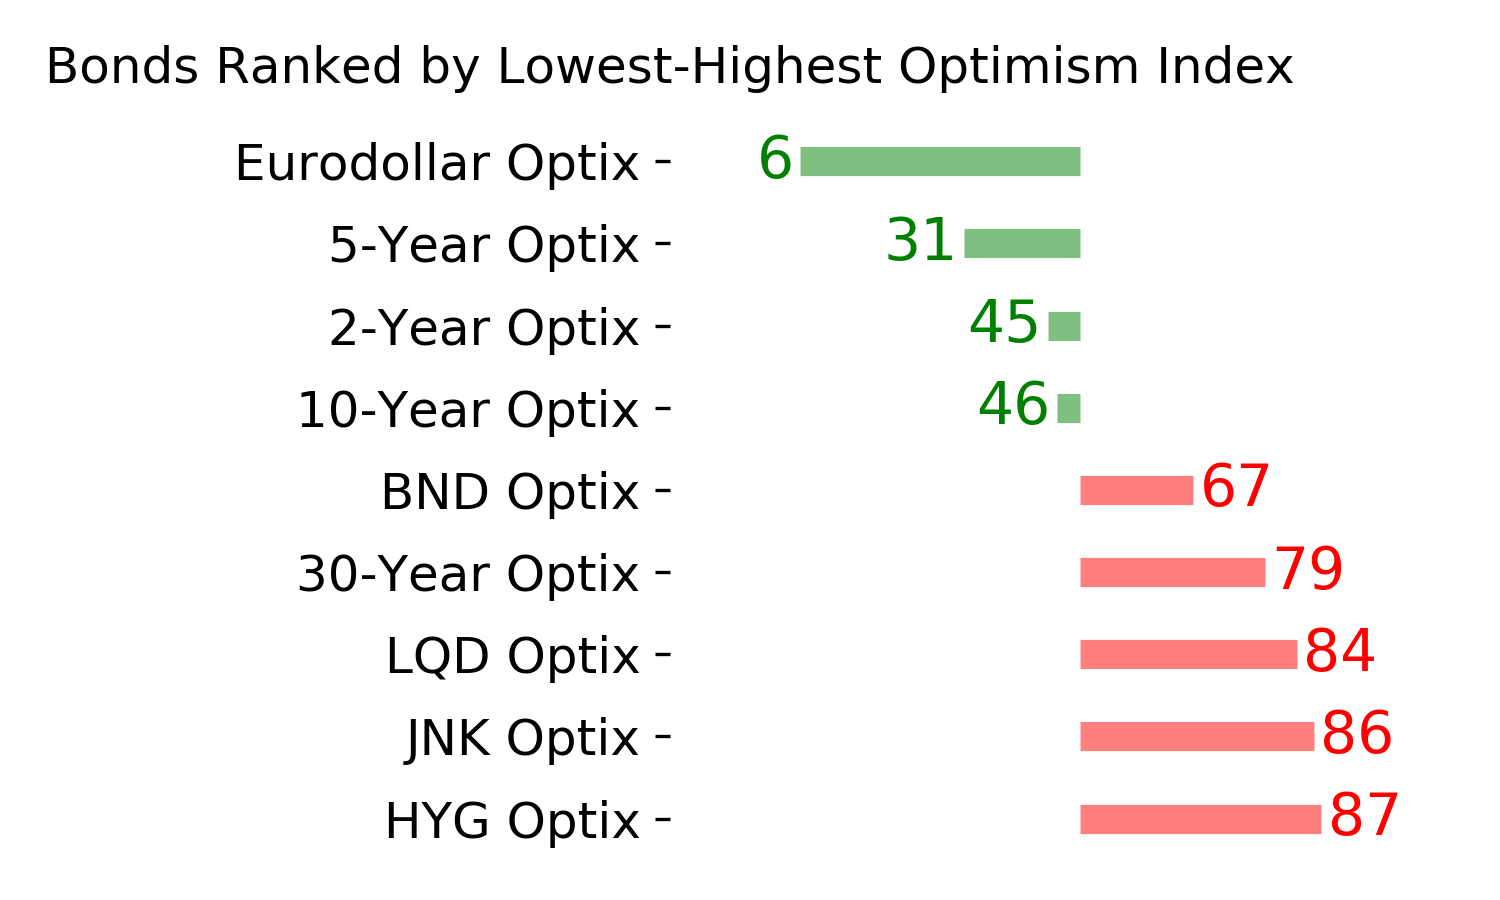
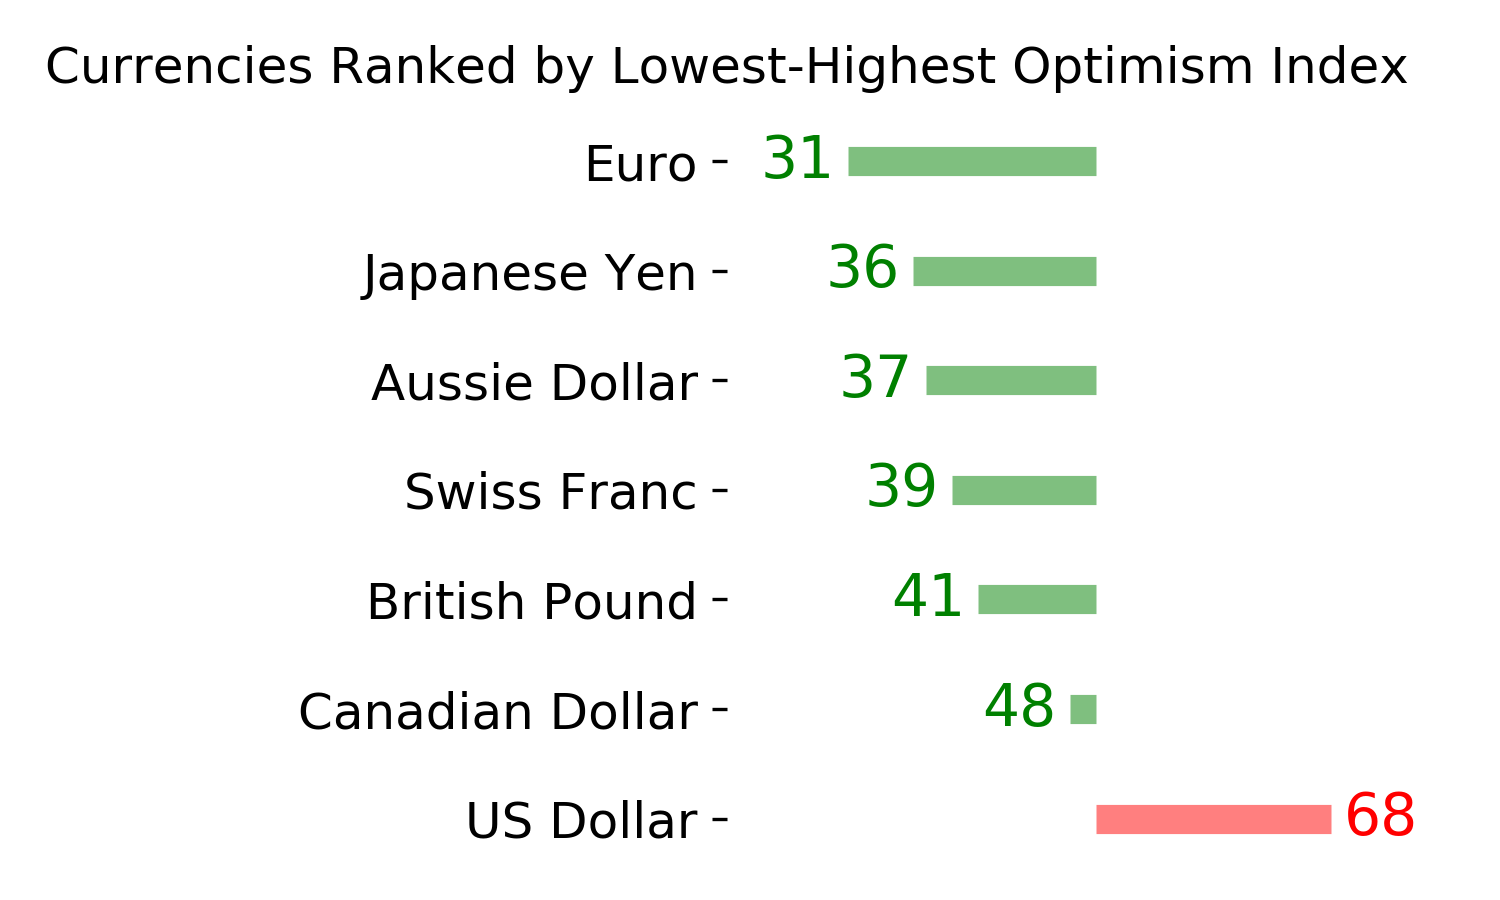
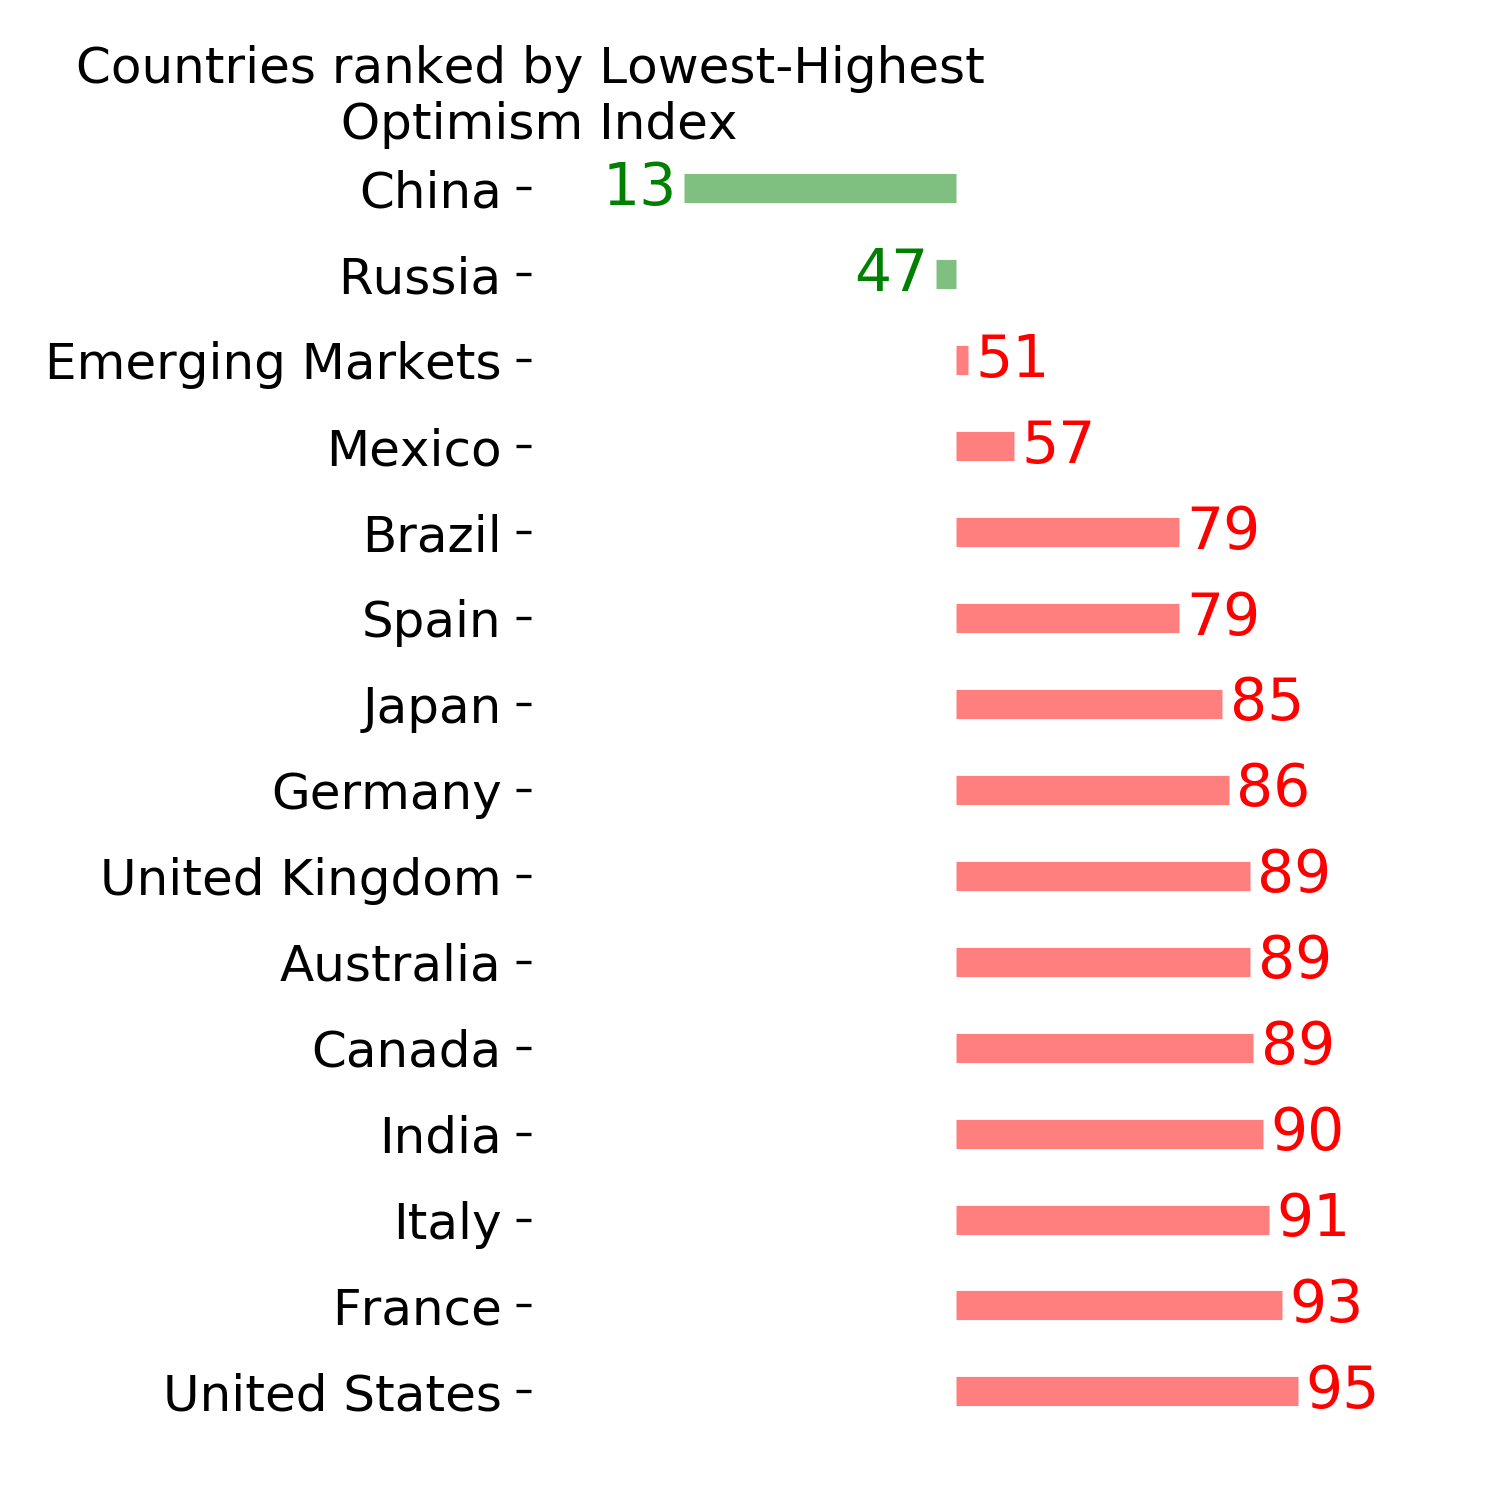
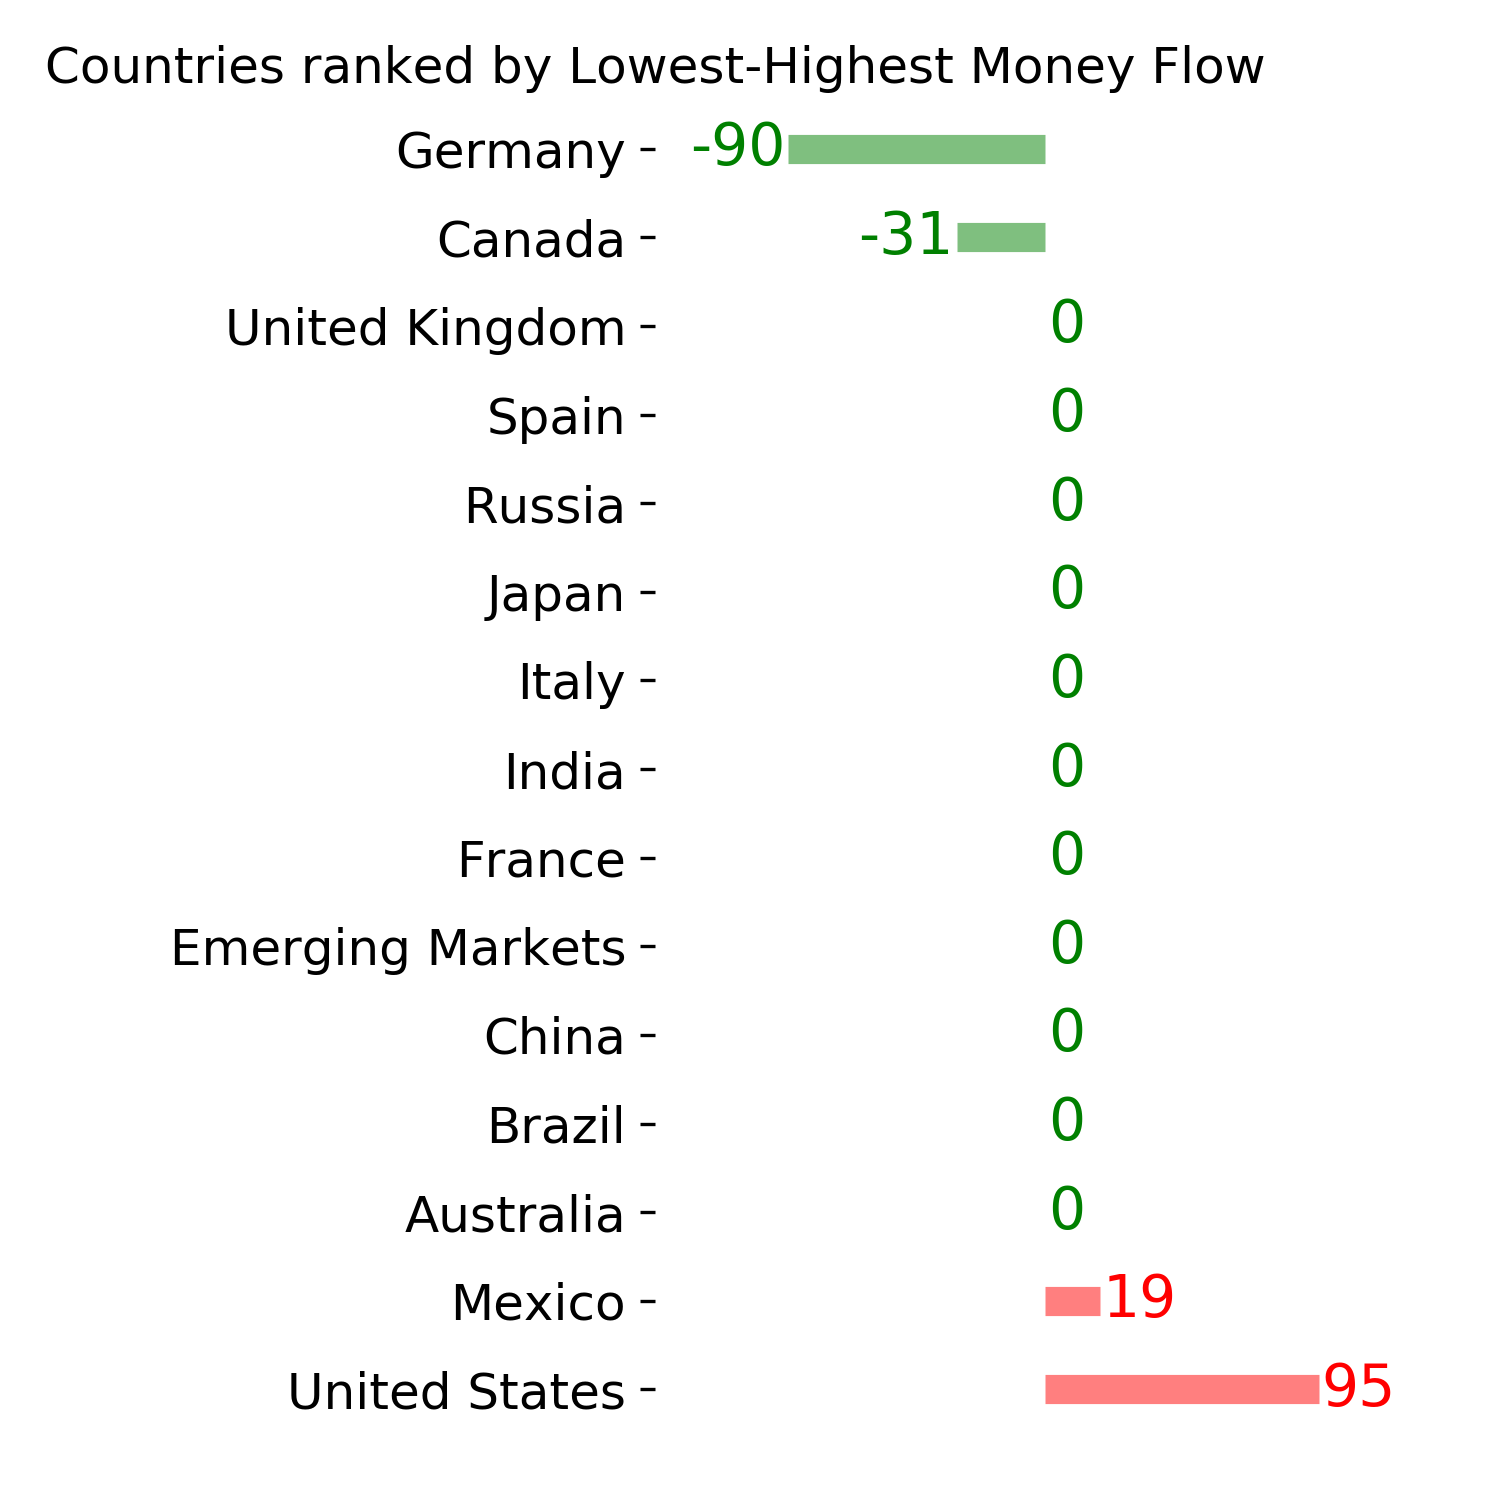
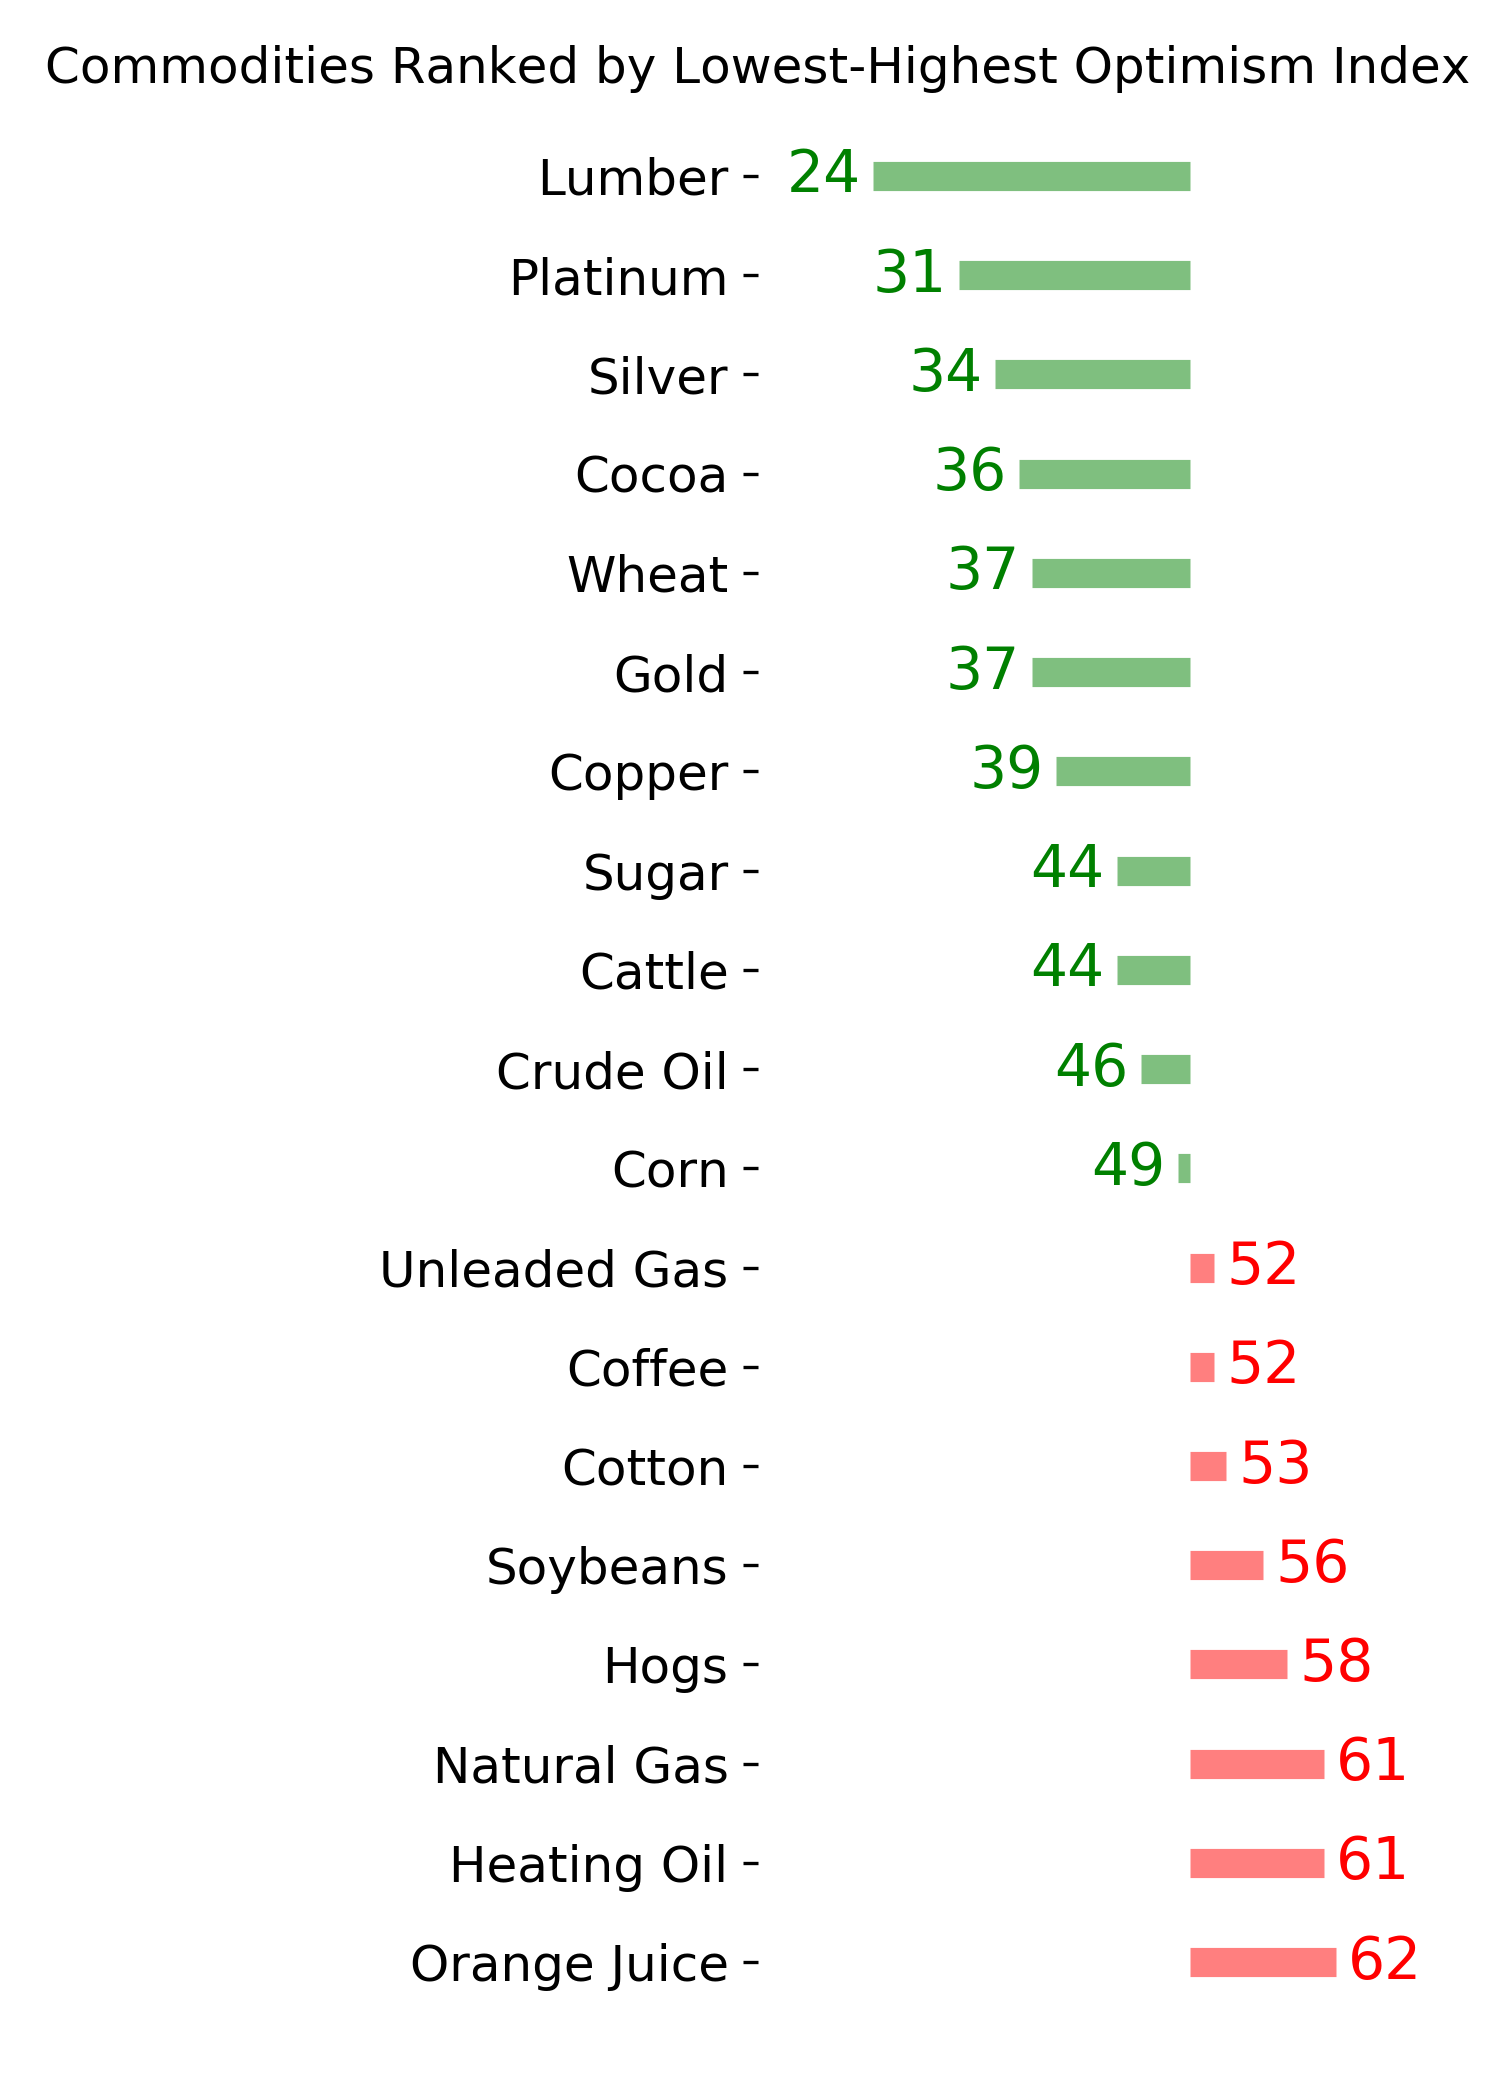
Ranks
|
|
|
|
|
|
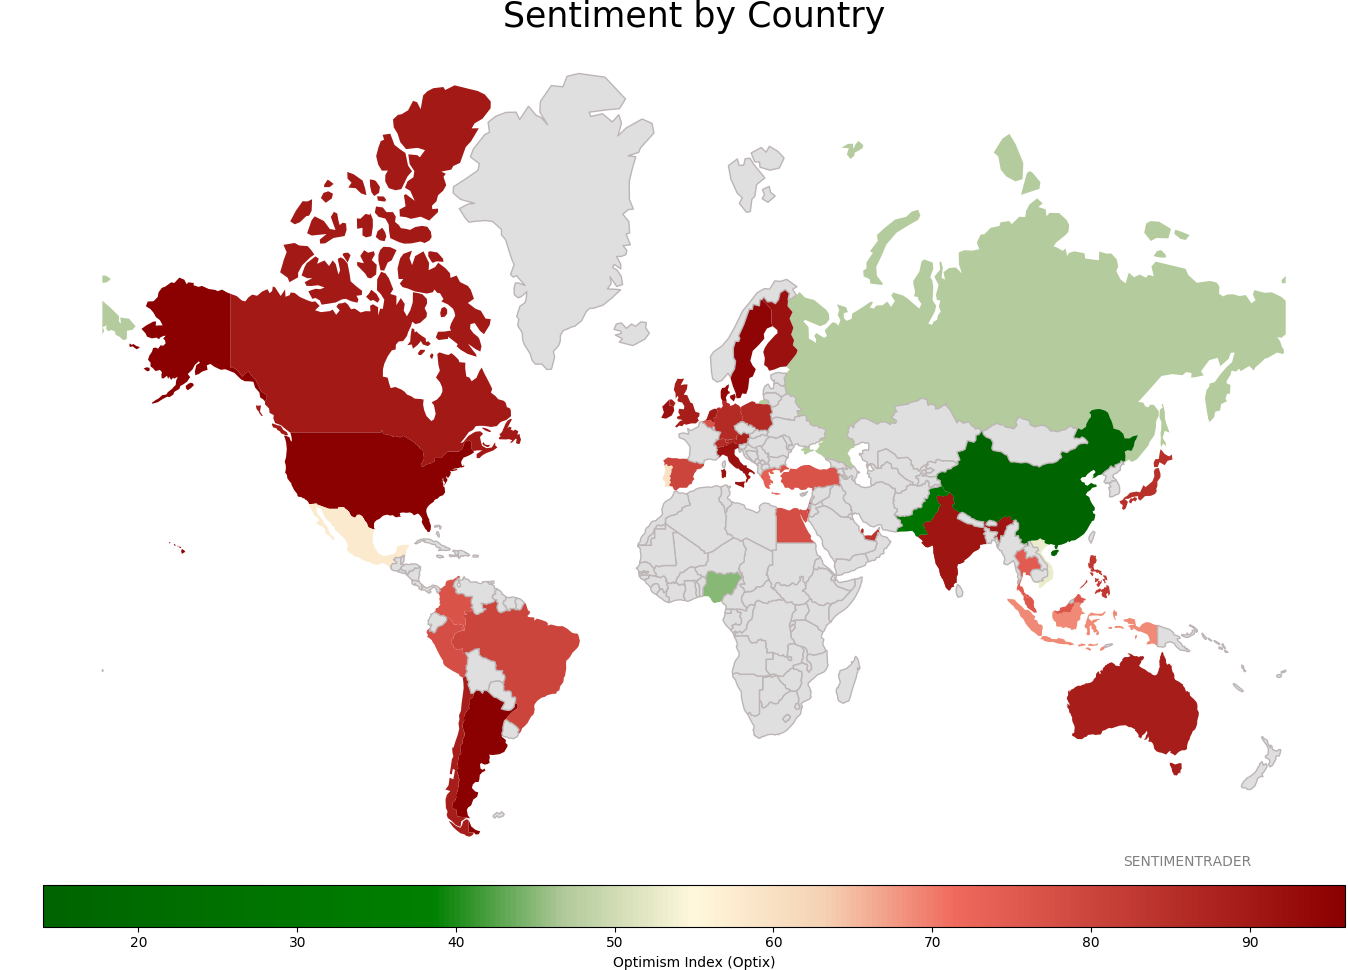
Sentiment Around The World
|
|
|
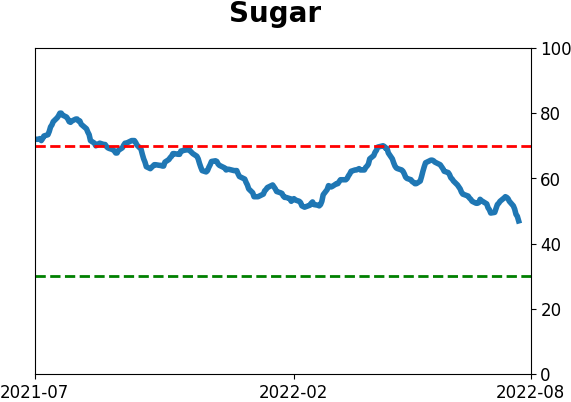
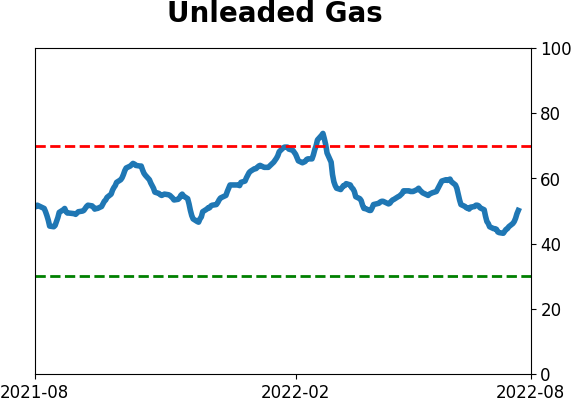
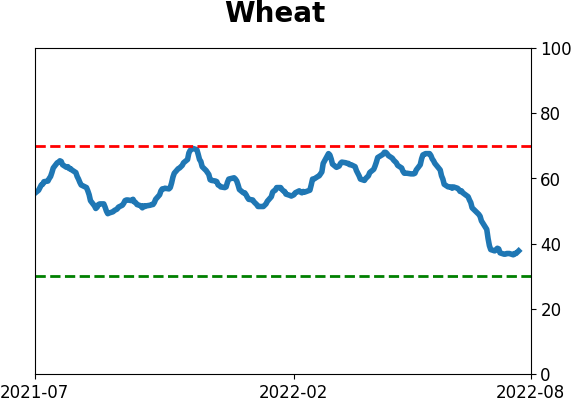
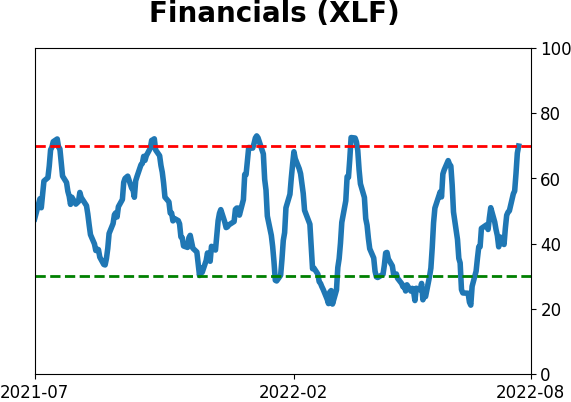
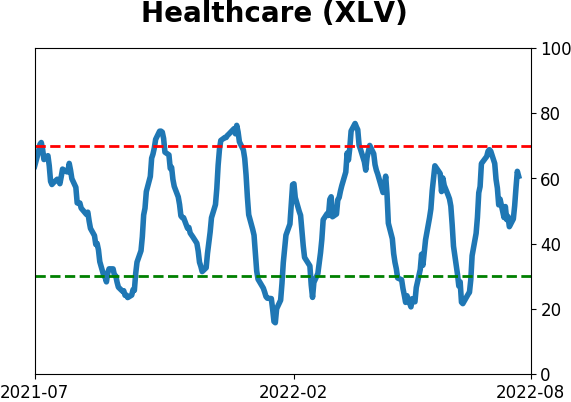
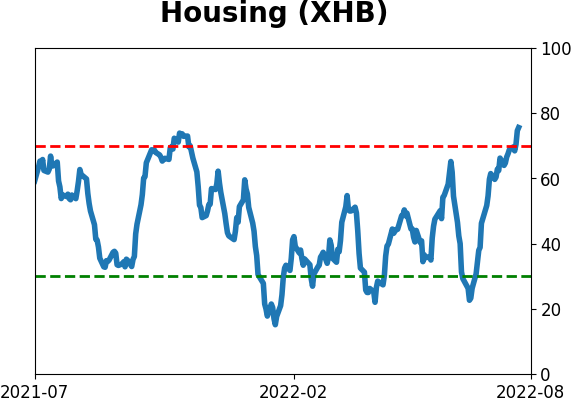
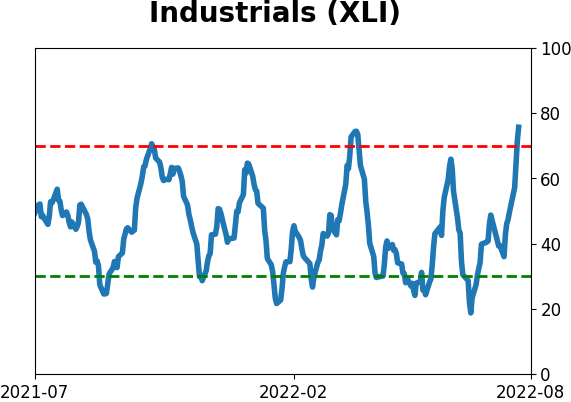
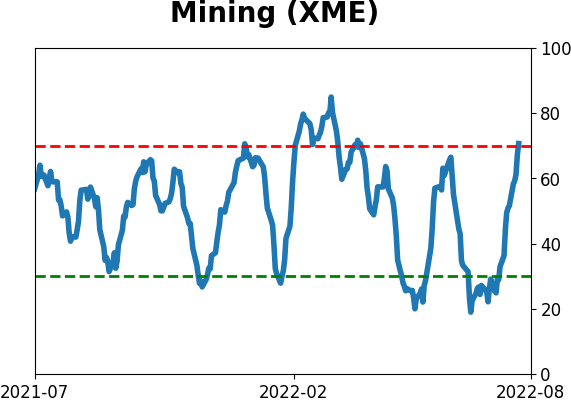
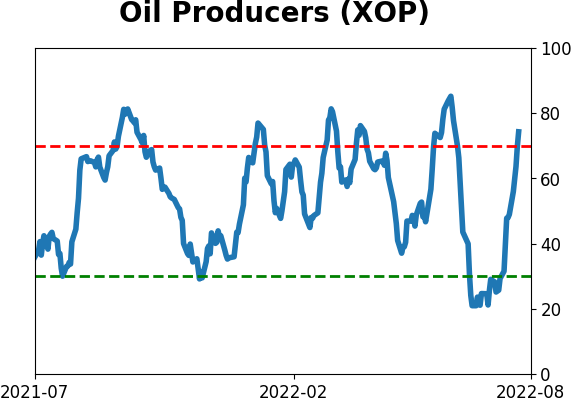
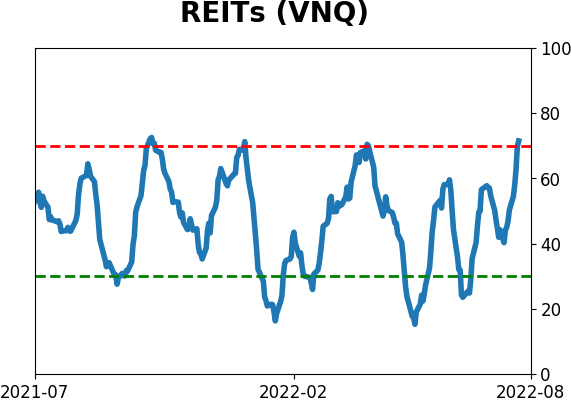
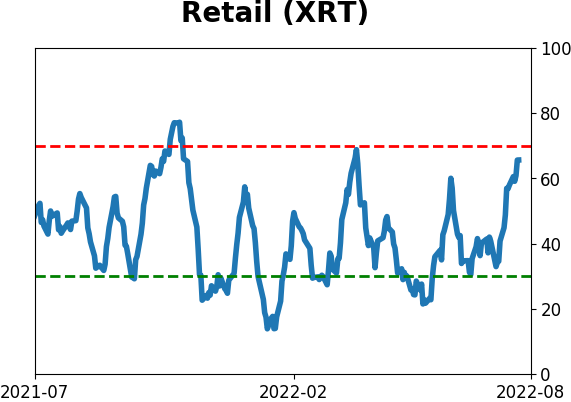
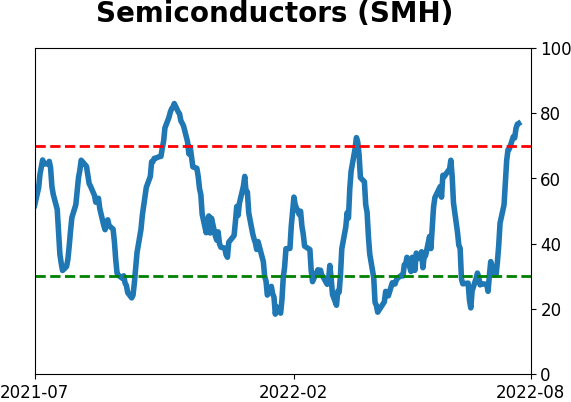
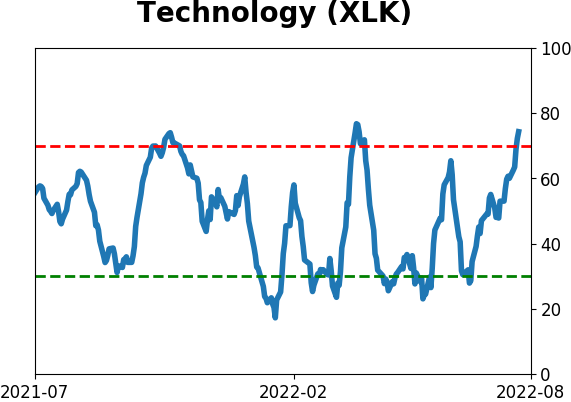
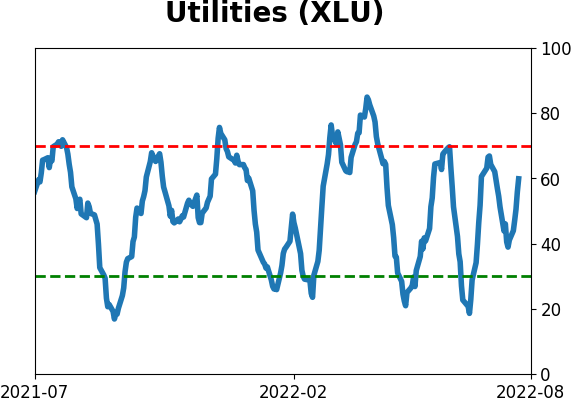
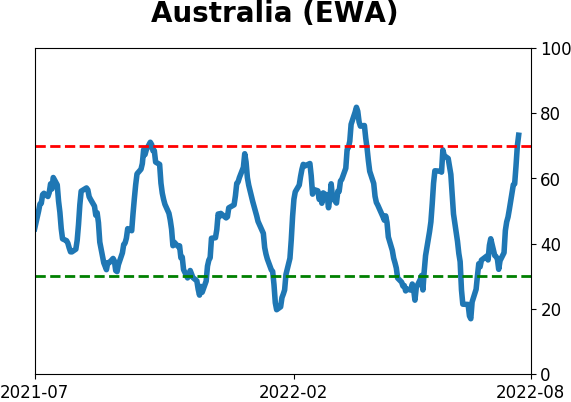
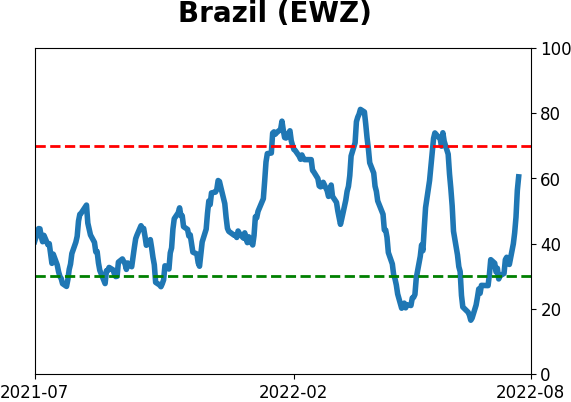
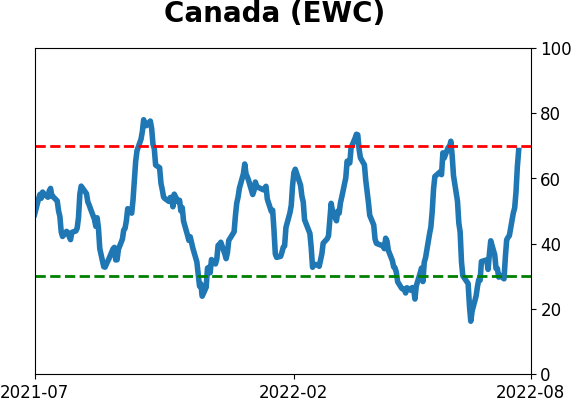
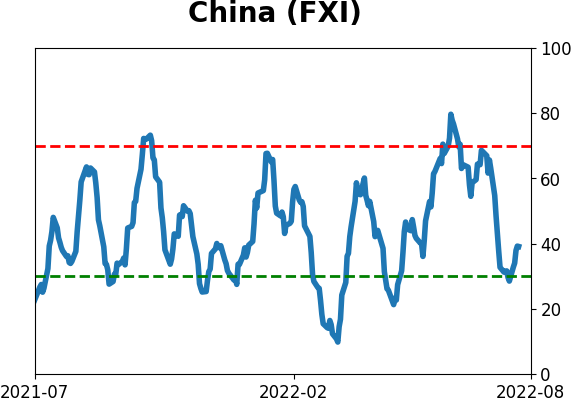
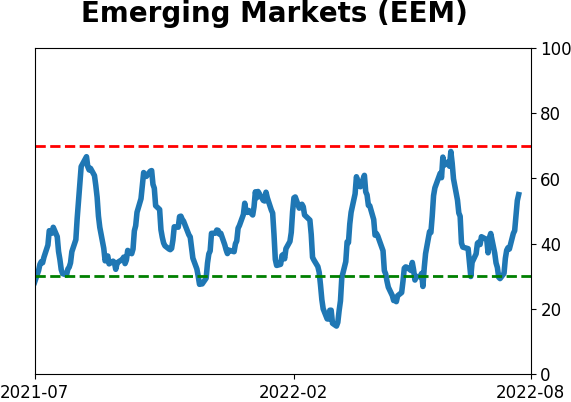
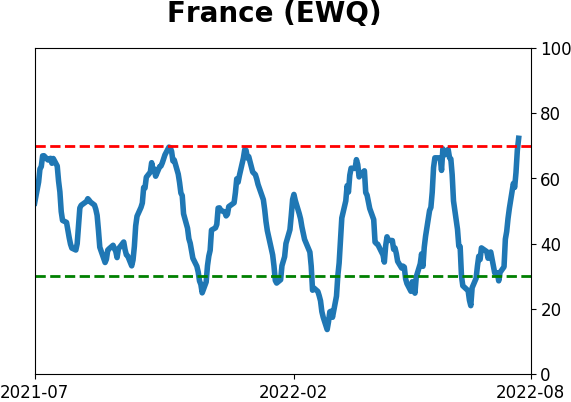
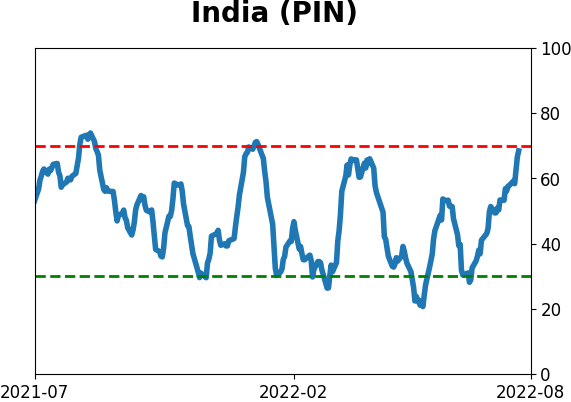
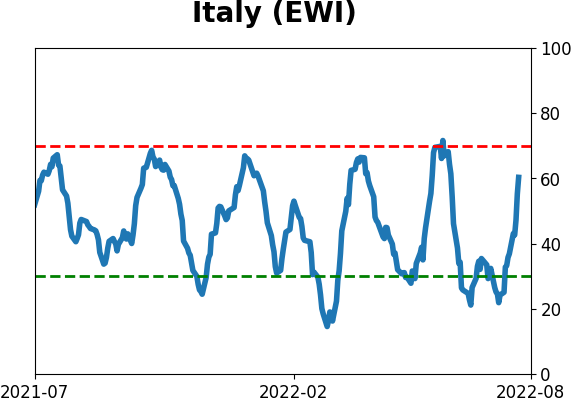
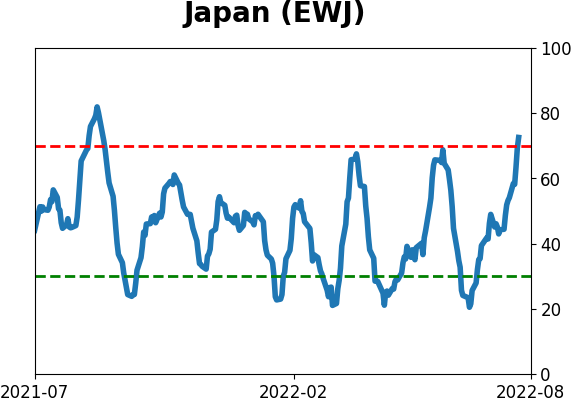
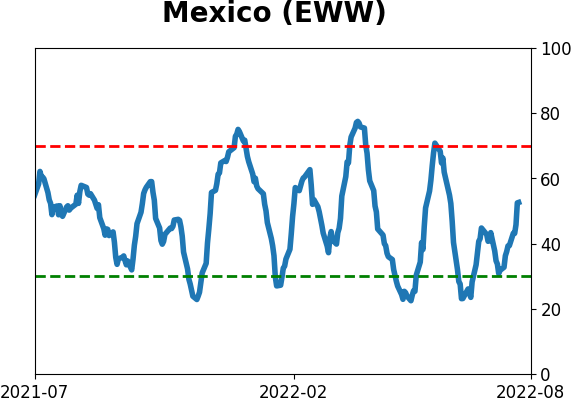
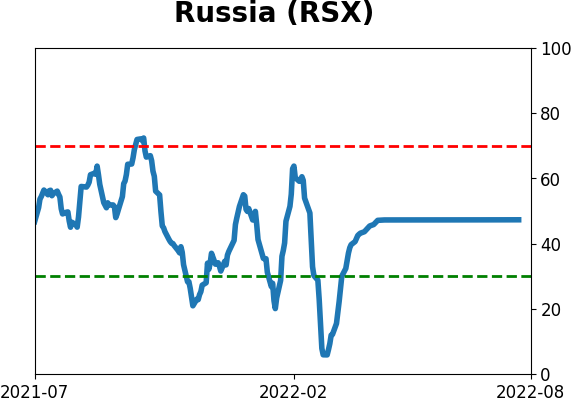
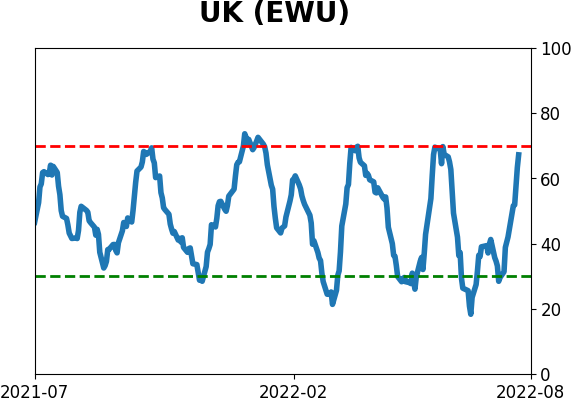
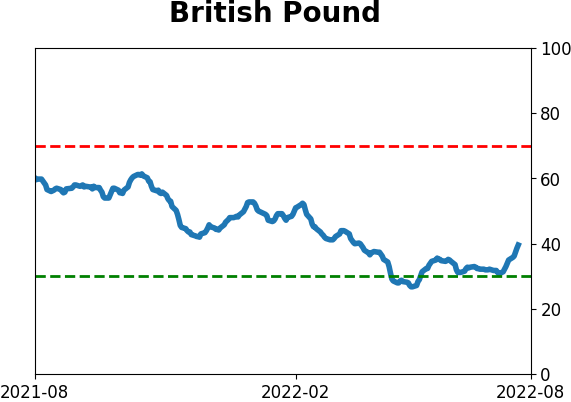
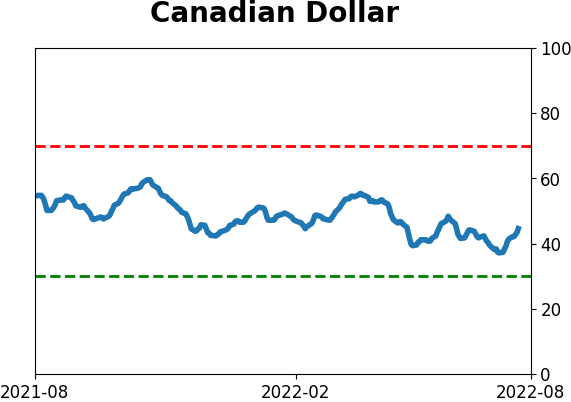
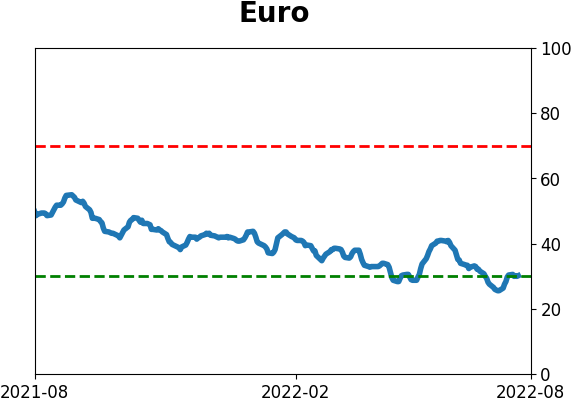
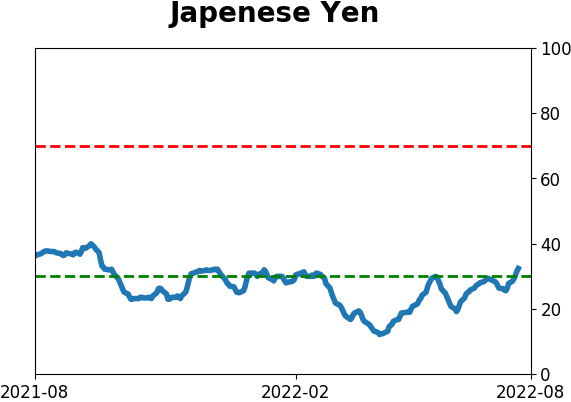
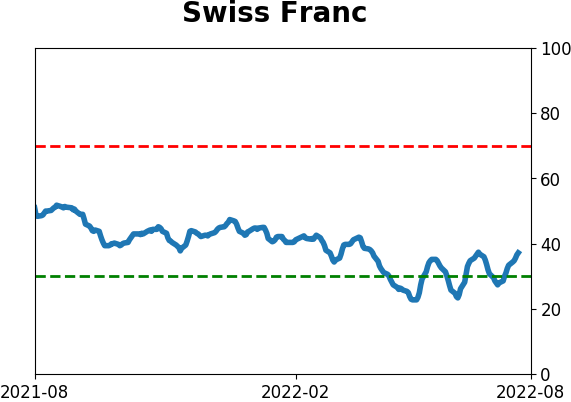
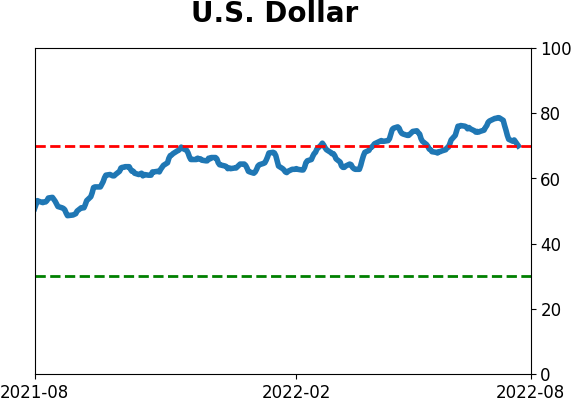
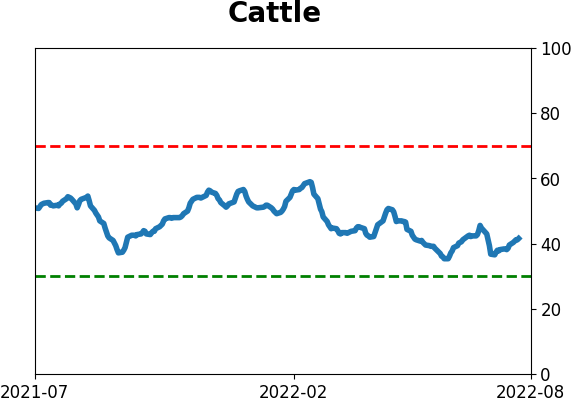
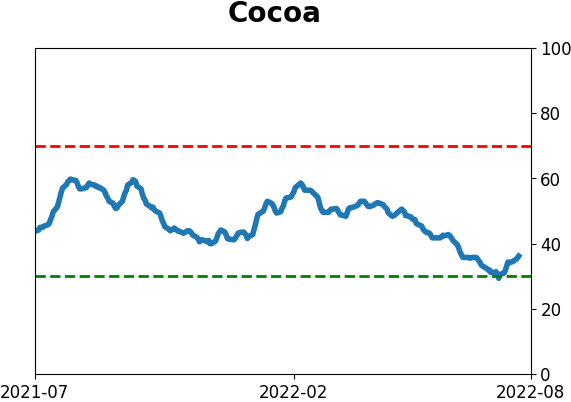
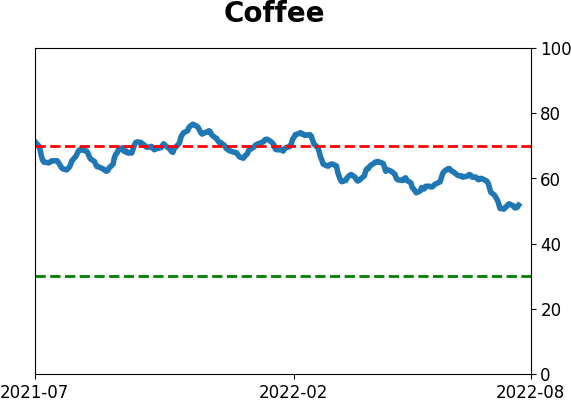
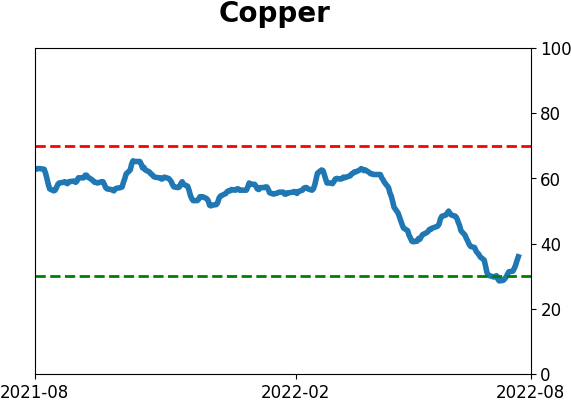
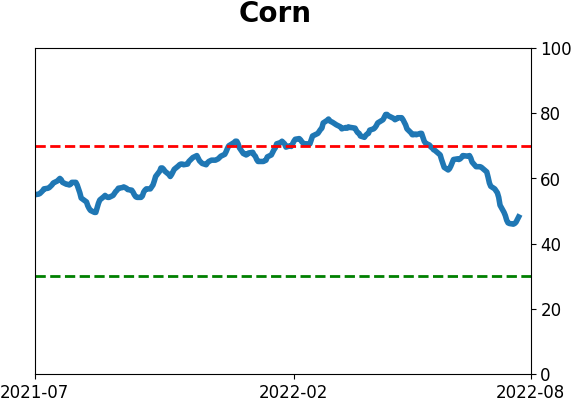
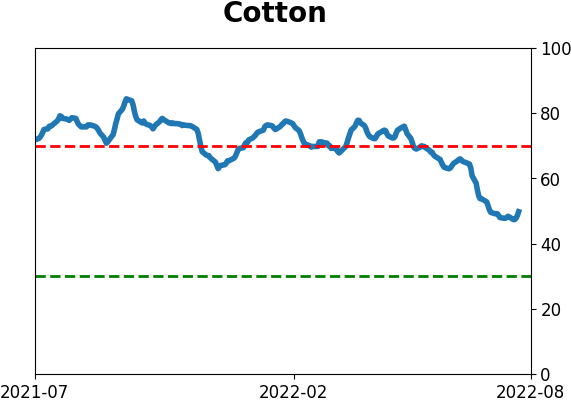
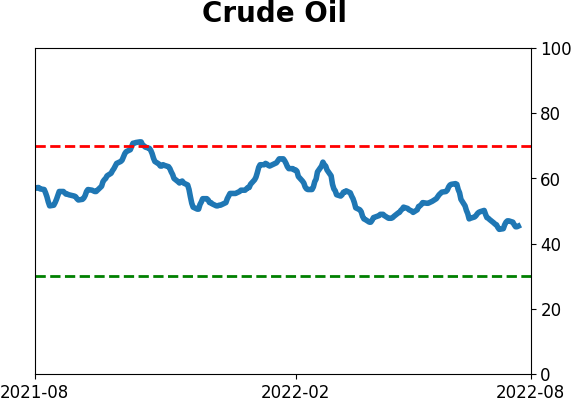
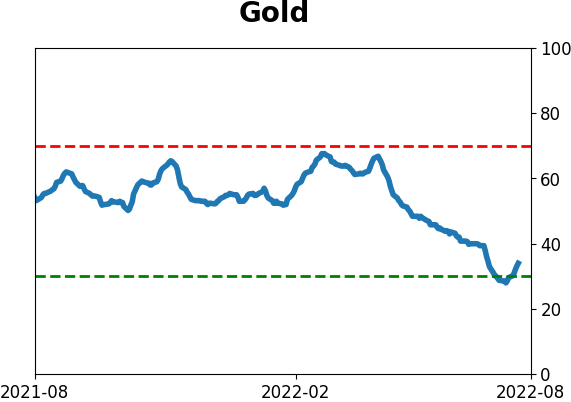
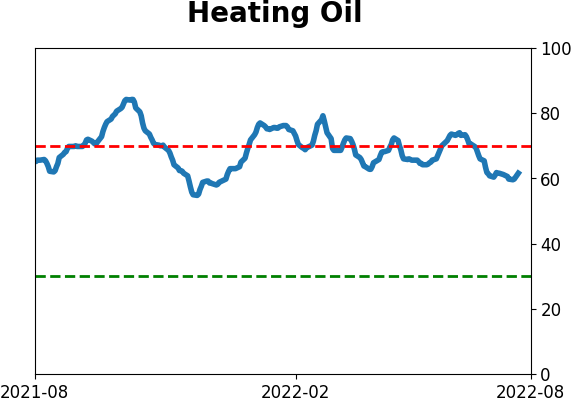
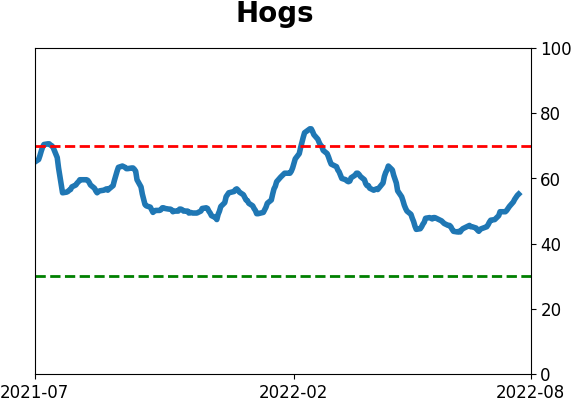
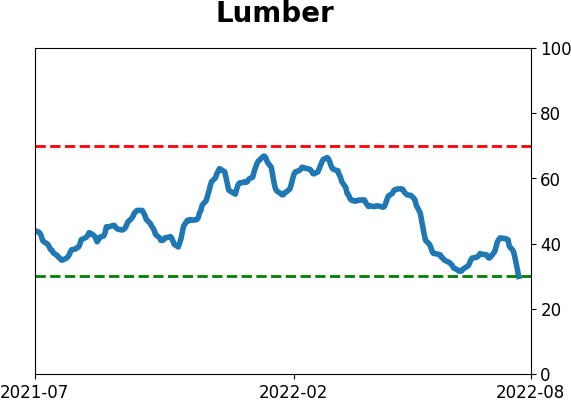
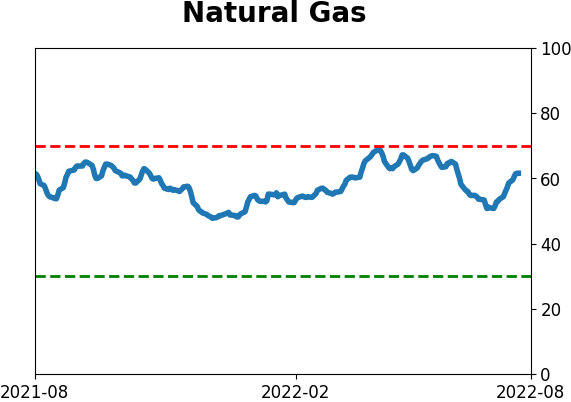
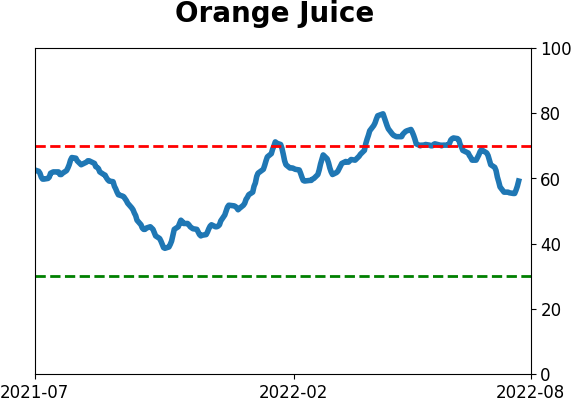
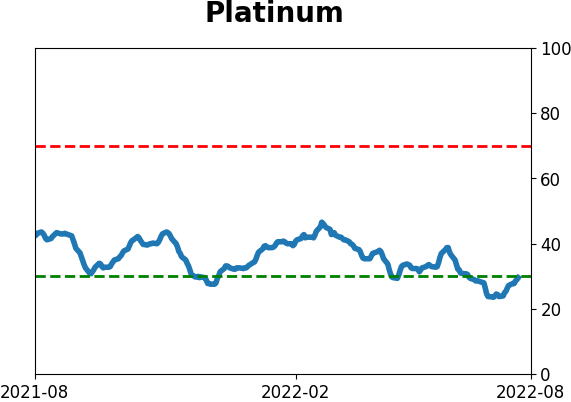
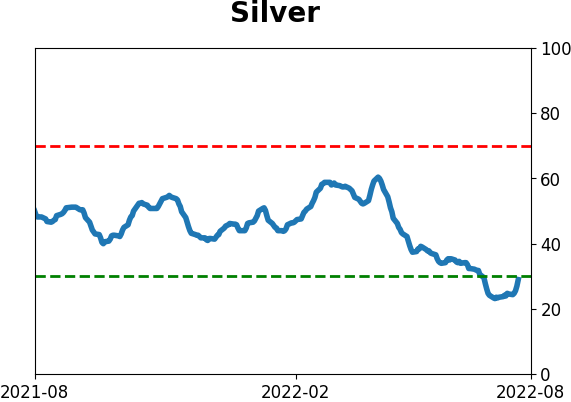
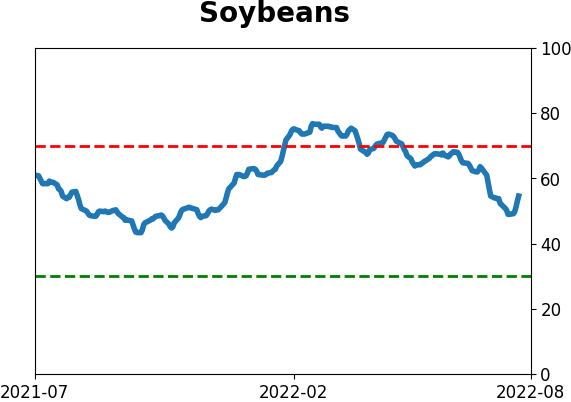
Optimism Index Thumbnails
|
|
|
|
|
|
|
|
|
|

|
|
|
|
|
|
|
|
|
|
|