Daily Report : TradingEdge Weekly for Jul 28 - Taking on more debt, impressive price momentum, cyclical stock uptrends


| View/Print a PDF version of this Report |
Headlines
|
TradingEdge Weekly for Jul 28 - Taking on more debt, impressive price momentum, cyclical stock uptrends: This week, we saw that investors are taking on more debt, but that's actually a good thing. Signs are building that investors are very confident in a further rally. It's had to blame them when it's been months since a big down day and five straight months of gains. Almost all cyclical stocks are in medium-term uptrends. An economic indicator is pointing to a recovering economy. |
Smart / Dumb Money Confidence
|
|
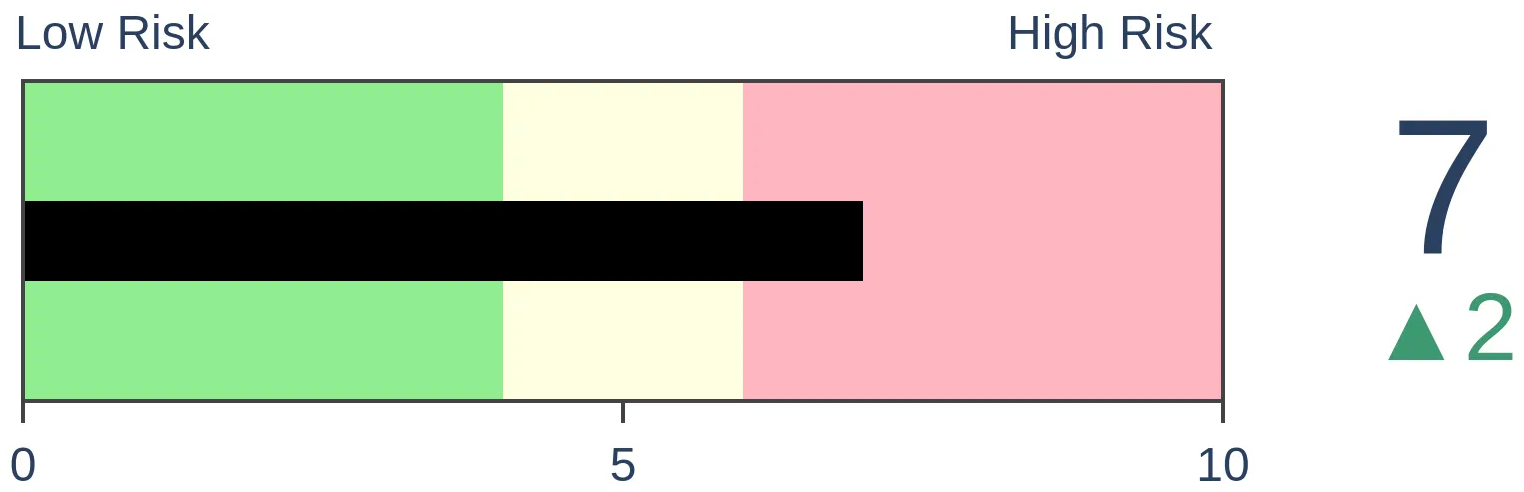
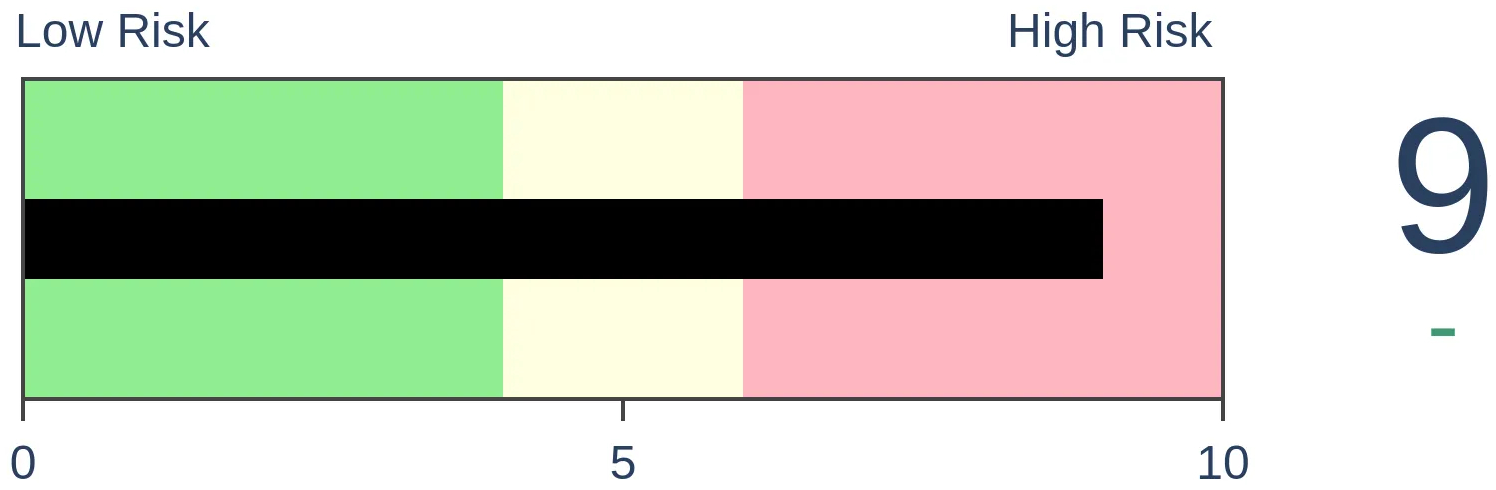
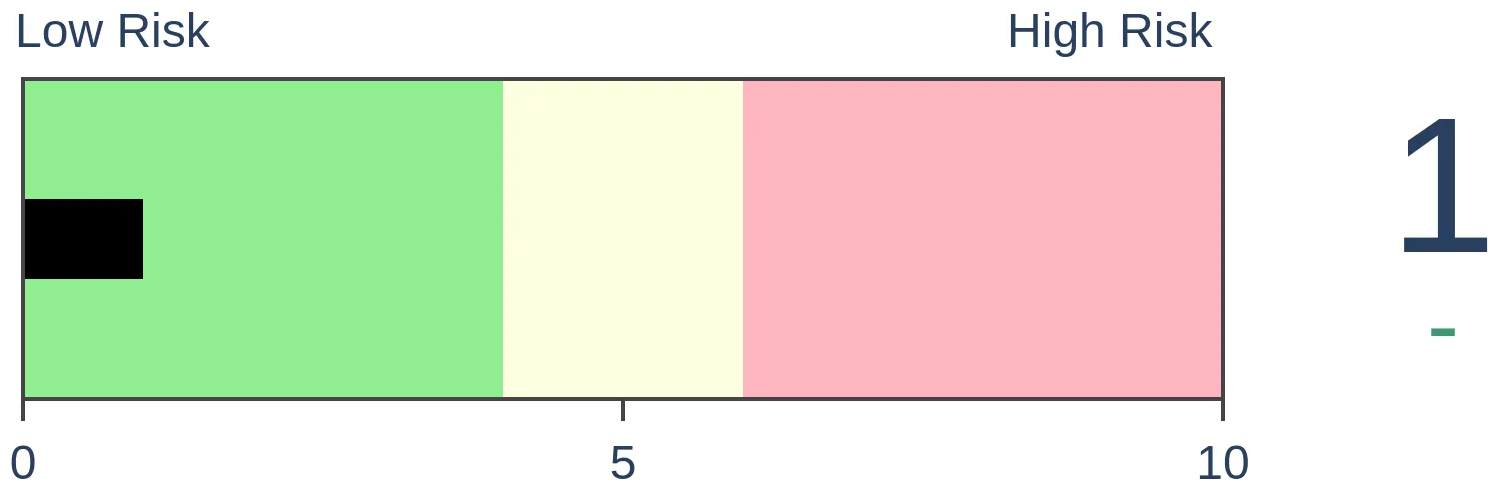
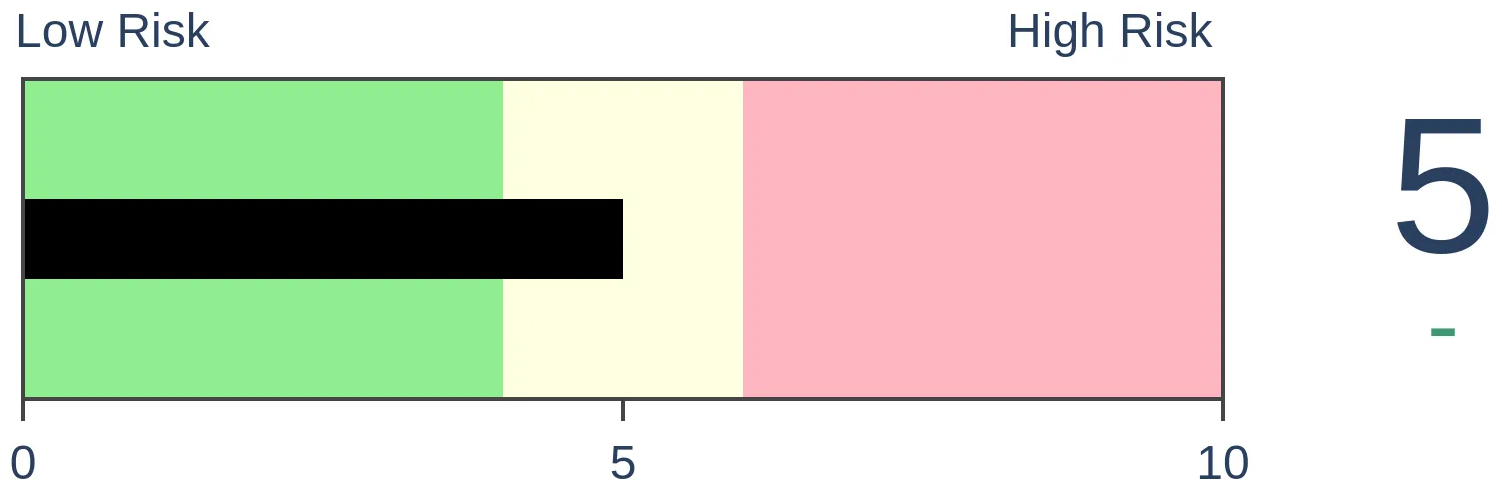
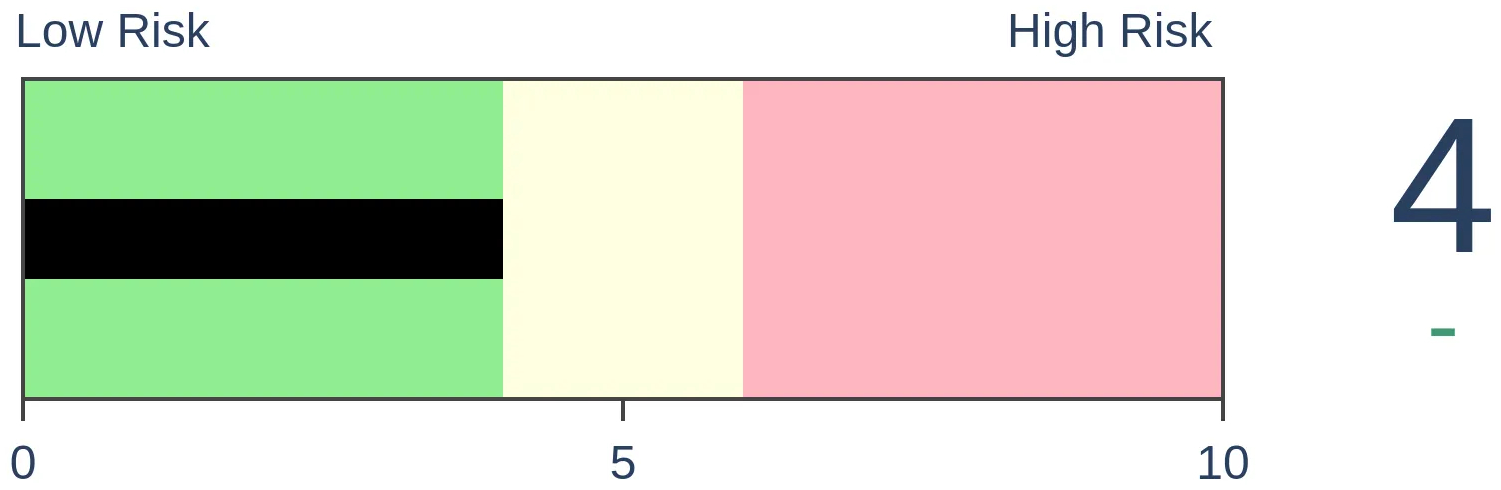
Risk Levels
|
|
|

Research
TradingEdge Weekly for Jul 28 - Taking on more debt, impressive price momentum, cyclical stock uptrendsBy Jason GoepfertBOTTOM LINEThis week, we saw that investors are taking on more debt, but that's actually a good thing. Signs are building that investors are very confident in a further rally. It's had to blame them when it's been months since a big down day and five straight months of gains. Almost all cyclical stocks are in medium-term uptrends. An economic indicator is pointing to a recovering economy. FORECAST / TIMEFRAME |
Key points:
- Investors are taking on more debt, and that's a good thing
- Signs are building that investors are supremely confident
- It's hard to be bearish when stocks have had a big down day for months
- The S&P is on track for its fifth straight monthly gain
- An obscure economic indicator is flashing bullish signs
- High Beta stocks have outperformed Low Volatility by more than 30%
- Almost all cyclical sector stocks are now in medium-term uptrends
- Technology stocks haven't even set a 10-day low for three months
- Platinum and the Aussie dollar are facing seasonal headwinds
- Unleaded gas is facing a seasonally tough window
Investors are taking on more debt
The debt that investors borrow against their stockholdings cycled from more than a 33% y/y decline to nearly even. Dean showed that the S&P 500 was higher a year later every time after similar recoveries in margin debt.
One of the real money sentiment indicators that we maintain on the website is NYSE margin debt. Margin debt is the amount of money an investor borrows from their broker via a margin account and acts as a sentiment gauge for the stock market, reflecting the prevailing attitudes of investors. A rise in margin debt indicates increased optimism, with investors willing to take on more leverage to capitalize on potential gains.
NYSE margin debt % growth, which measures the year-over-year percentage change in margin debt, declined to the 4th lowest level in more than 70 years and subsequently reversed higher, triggering a bullish signal for stocks.
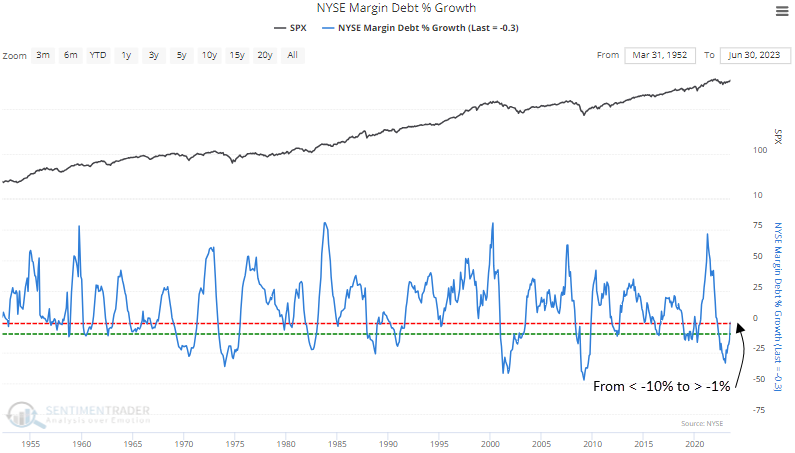
When the year-over-year change in NYSE margin debt cycles from less than -10% to greater than -1%, the S&P 500 was higher a year later every time. Because margin debt is a monthly series reported in the third week of each month and reflects data from the previous month, this is a big-picture confirmation signal that should be used in a broader weight of the evidence approach.
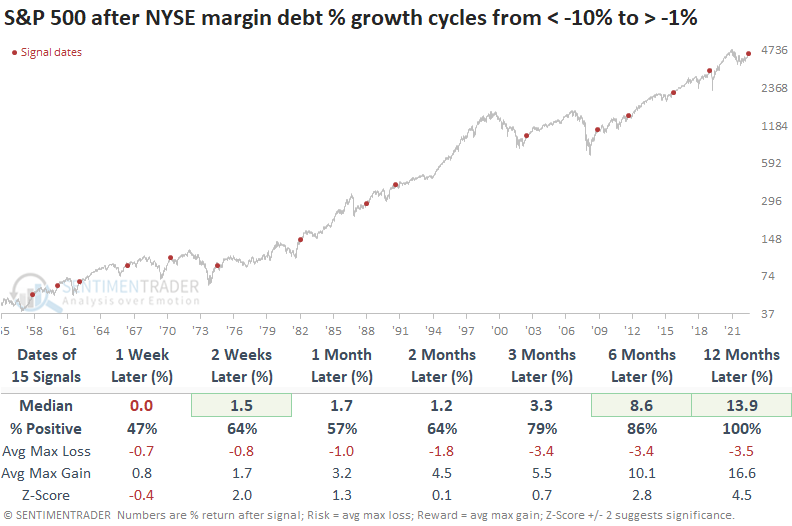
Over the next three and six months, only one alert incurred a max loss of greater than -10%. That instance took place right before the COVID lockdown. A year later, the max gain exceeded the max loss in 13 out of 15 precedents.
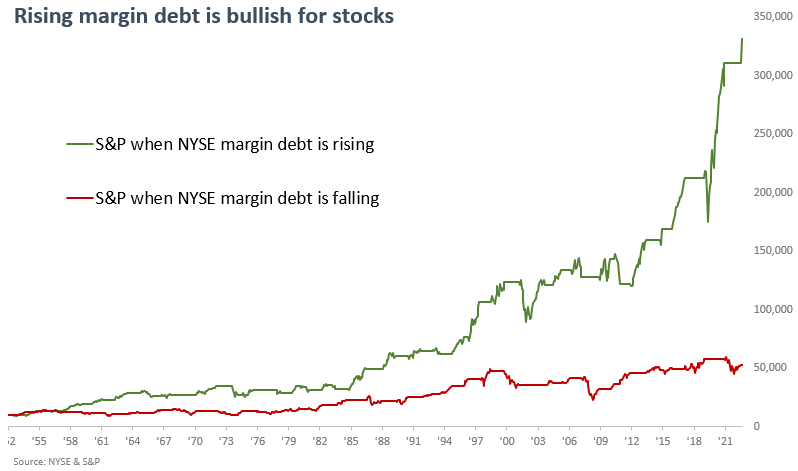
Utilizing a simple six-month trend-following rule, a $10,000 investment in the S&P 500 soars to $331,000 when margin debt increases. Conversely, a decline in margin debt results in significantly smaller growth, with the initial investment reaching only $52,000.
Jay looked a bit further at the data, showing times when the indicator crossed back above -19% after dropping below that level. The latest signal argues that stock prices will be higher at the end of April 2024 (i.e., 12 months after the signal) than at the end of July 2023 (i.e., three months after the signal).
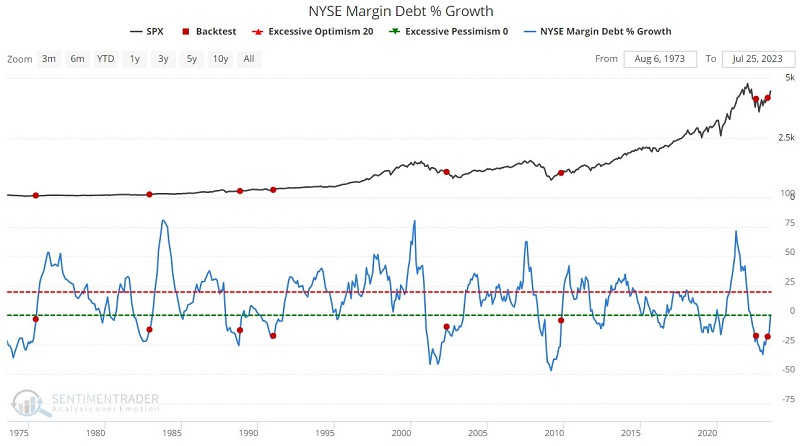
Another marker will be crossed when the 3-month moving average crosses above -10%, which it should in the next month or two. After those signals, the S&P 500 rose every time over the following year.
Other signs that investor sentiment has recovered
Investors are betting like crazy on stocks, and we're back in a bubble. Scary stuff. At least, that's the tone of a recent article from The Wall Street Journal.
By way of evidence, the Journal noted a handful of indicators, roughly representing "sentiment."
- AAII survey bullishness the highest in over a year
- More bulls than bears in the AAII survey for at least 6 weeks
- University of Michigan consumer survey most optimistic in at least a year
- U of M survey biggest jump in optimism in at least a year
- Put/Call Ratio lowest in at least a year
- VIX "fear gauge" is under 14
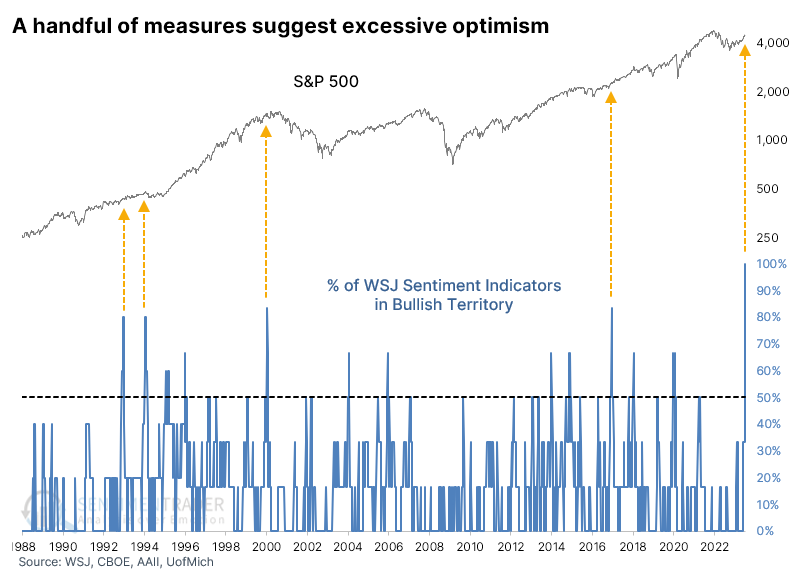
Let's go back as far as we can and use those six measures of sentiment to determine how bullish investors have become, according to the WSJ sentiment model. The chart below assigns a score of "1" to each of the six conditions above if it shows an extreme. So, a reading of 100% would mean that every indicator suggests optimism, while 0% would mean there is pessimism because none of them have triggered.
For the first time since at least 1988, the model is at 100%. That's not a total surprise because the conditions in the article were selected specifically because they've just triggered. It's also not a total surprise that it's never happened before because most of the time, at least one indicator is off doing its own thing.
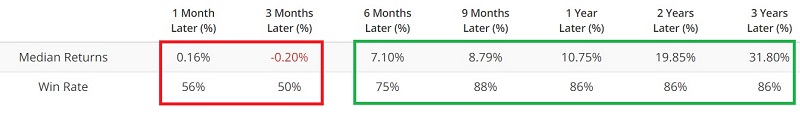
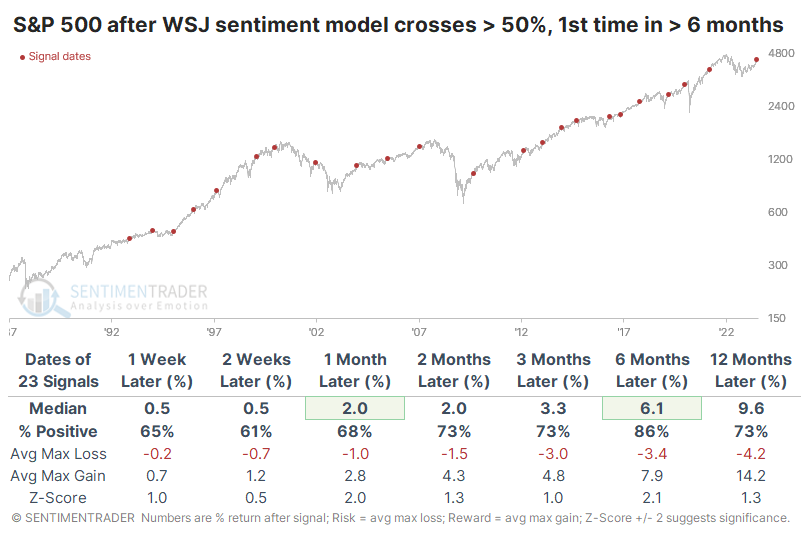
It's hard to reach much into such a tiny sample size, so the table below looks at returns following lesser extremes. These are times when at least half of the signals were triggered for the first time in at least six months. Six months later, it showed a gain 86% of the time, with a median return quite a bit higher than a random return during the study period. Of 22 signals, 18 saw more reward than risk over the next year.
After a year like 2022, investors will want to bail at the faintest hint of other investors getting optimistic. We've looked at an inordinate number of studies showing that behavior like this, as we've witnessed since October, would be extraordinarily rare during an ongoing bear market, so the probability we're in a bull market environment is high and has been for more than seven months.
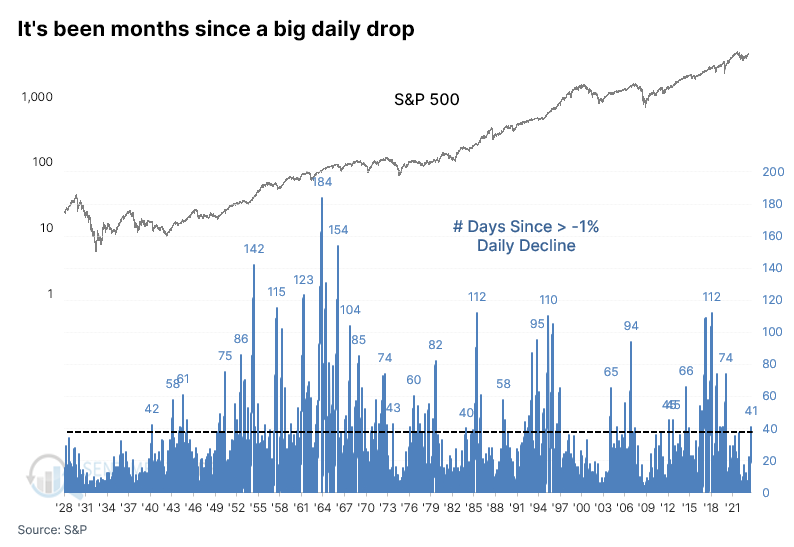
It's hard to be pessimistic when stocks don't suffer big declines
It's been a while since investors got slapped hard. We're going on two months now since the most benchmarked index in the world took more than a 1% daily dip. That's nearly three times as long as it's been since the last 1% up day.
One of the scary charts du jour circulating amongst the usual tripe on social media suggests that the ends of long streaks without a significant down day have preceded some big declines as complacent investors panic. This did happen as stocks were peaking in early 2020 ahead of the pandemic. So there's that.
Still, we're far from what could be considered an extreme streak without a big down day. It's gone on much, much longer than two months. Let's pretend the streak ends soon and see how the S&P 500 fared after similar conditions.
The table below shows the ends of streaks of more than 40 sessions without a 1% down day, along with at least one day when the S&P hit a 52-week high in the past two weeks.
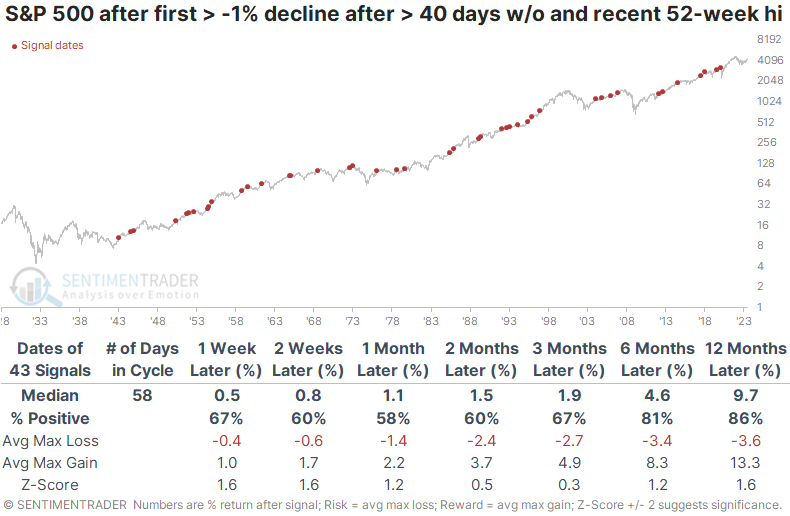
The results weren't too bad. The S&P outperformed a random return across all time frames, though its consistency, median return, and risk/reward ratio were just okay. At least disproves the notion that we should get scared once the 1% down-day streak ends. It preceded a nasty and protracted decline in the months ahead only once. Twice if we're being generous. Four times if we're being extremely generous.
Five straight months of gains
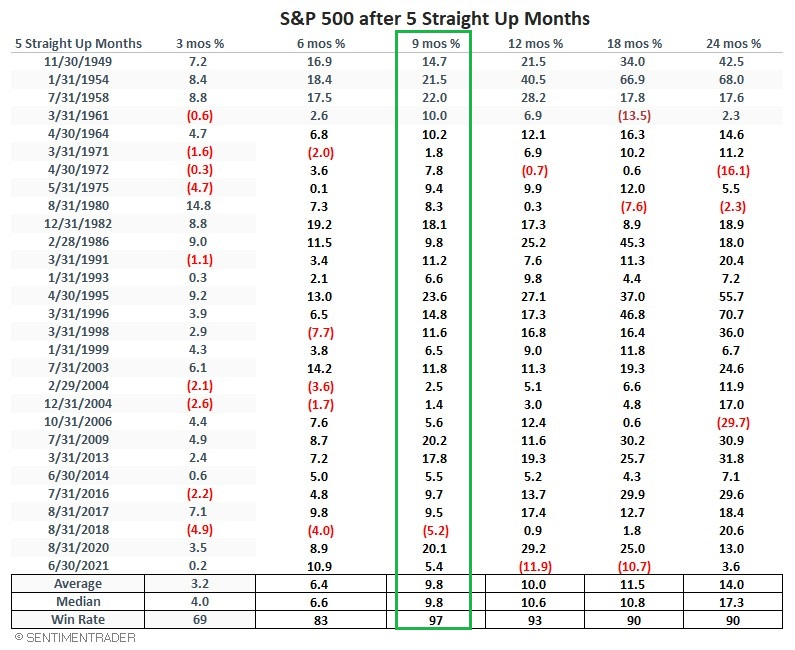
Jay showed that the S&P 500 appears likely to close July 2023 with a gain; this would mark the 5th consecutive up month.
Since 1949, there have been only 29 times when the S&P 500 Index showed a calendar monthly gain for five consecutive months. The table below displays the dates and subsequent S&P 500 performance for each of the previous instances.
The chart below displays the growth of $1 invested in the S&P 500 only during the first nine months after five consecutive higher monthly closes. To better understand the consistency of returns, the chart is on a logarithmic basis (i.e., the distance between $1 and $10 is the same as the distance between $10 and $100).
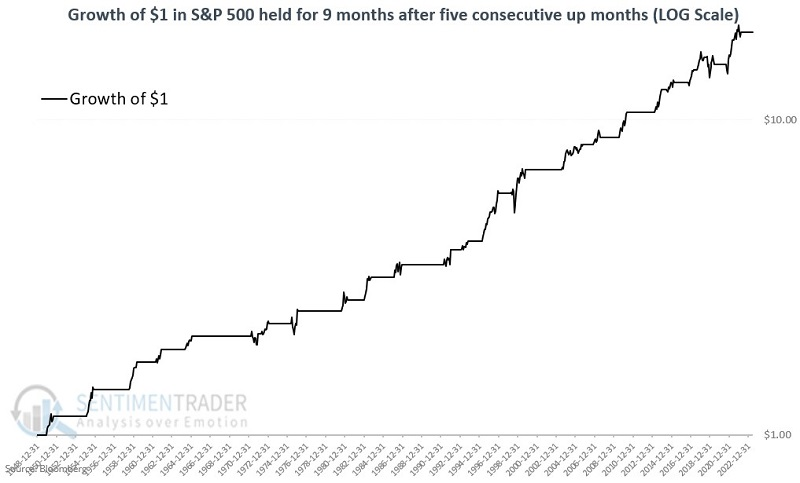
No indicator is infallible. Still, history has demonstrated in many ways that momentum in the stock market can be a powerful force. The "lower left to upper right" nature of the equity curve above is what most investors seek. If July 2023 closes with the S&P 500 above 4450.38, it will mark the fifth consecutive higher monthly close. History suggests that this occurrence would lend significant weight to the bullish side of the ledger.
Some good economic news from an obscure indicator
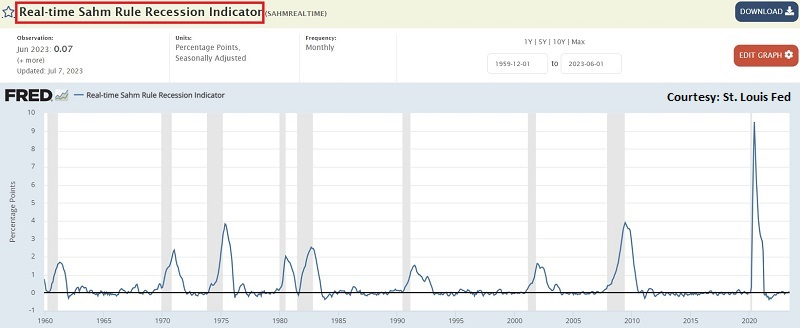
The Real-Time Sahm Rule Recession Indication (SAHM) attempts to identify economic recessions on an impending or concurrent basis. Jay noted that while not intended to be used as a standalone model, this indicator is presently suggesting a low likelihood of an imminent recession.
The chart below displays the Real-Time Sahm Rule Recession Indicator (SAHM) at this link. The latest reading of 0.07 for June 2023 was reported on July 7th.
The originally stated recession rule is defined as:
Sahm Recession Indicator signals the start of a recession when the three-month moving average of the national unemployment rate (U3) rises by 0.50 percentage points or more relative to its low during the previous 12 months.
Our analysis shows a cutoff level of 0.30 is a simple and valuable alternative.
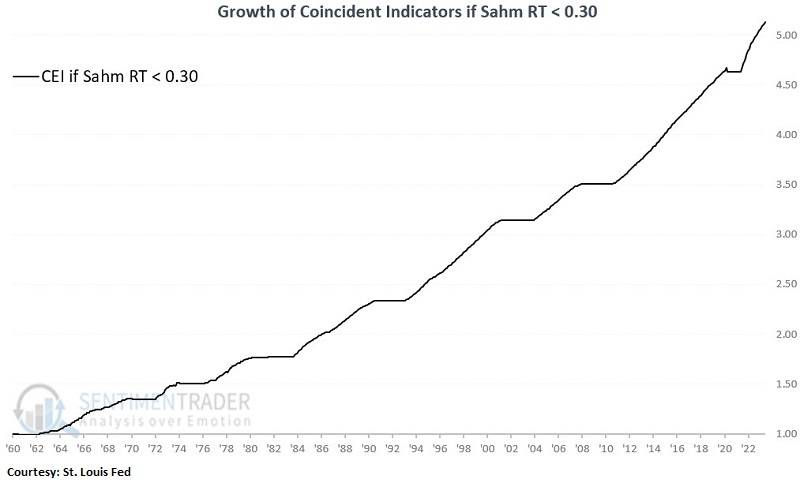
For tracking the state of the economy, we will use the Coincident Economic Activity Index (CEI) for the United States. At the end of the month, Jay looked at the latest reading for SAHM, and if the value is below 0.30, the indicator is considered favorable for the economy. If the value is 0.30 or higher, the indicator is considered unfavorable for the economy
The chart below displays the cumulative change in coincident economic growth only during months when SAHM ended the previous month < 0.30.
The chart below displays the cumulative change in coincident economic growth only during months when SAHM ended the previous month >= 0.30.
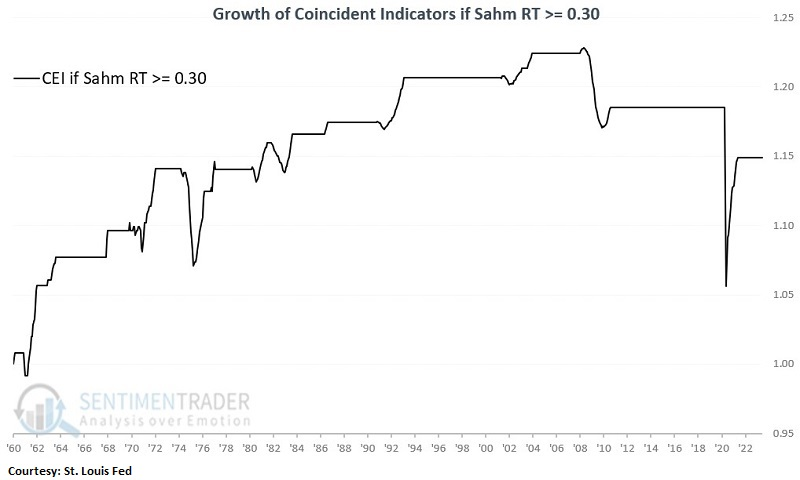
A cursory glance reveals that the economy (again, as measured by the next month's gain or loss for the Coincident Economic Activity Index) has performed much better when SAHM was below 0.30, which it is now.
The CEI increased or was unchanged during 97% of all months when SAHM ended the previous month below 0.30, versus only 67% of all months when SAHM was 0.30 or higher. Also, CEI's average monthly % increase or decrease was over four times greater (0.30% versus 0.07%) when SAHM was below 0.30.
High Beta has beat Low Volatility by leaps and bounds
It's been a heckuva different year, depending on how much risk an investor has been willing to stomach. Those invested in higher-beta stocks that move more relative to the broader market have enjoyed spectacular gains. Those stuck in more staid movers are only about even.
Over the past twelve months, High Beta stocks have outperformed Low Volatility ones by more than 30%. That's one of the most significant year/year spreads in more than 30 years. All the biggest spreads in performance came after protracted declines.
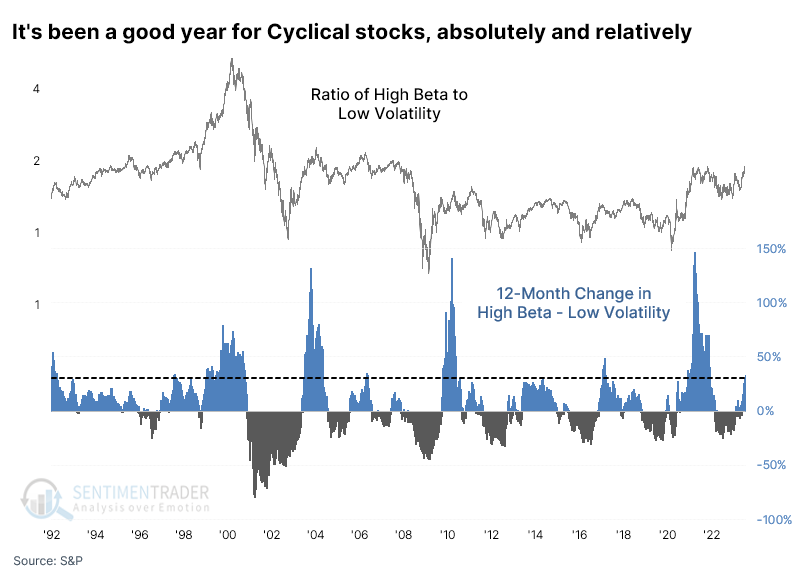
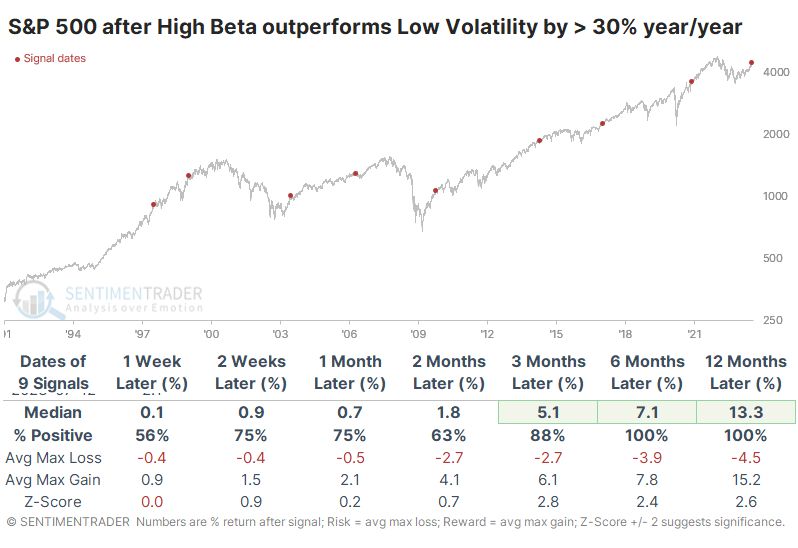
These big jumps in risk appetite were a great sign for the broader market. Over the next 6-12 months, the S&P 500 never showed a loss, with the usual caveats accompanying a tiny sample size.
Risk was muted, with no losses of more than -5.1% at any point within the next 12 months, which is quite remarkable. At the same time, every signal enjoyed a double-digit gain at some point.
For High Beta stocks, the vast outperformance led to some shorter-term digestion but still impressive longer-term returns.
It was a relatively better sign for Low Volatility, with some evidence of mean reversion. Over the next month, High Beta stocks suffered five losses versus only two for Low Volatility. And the longer-term returns in the latter were more impressive relative to their base rate, though in the lead-up to the pricking of the internet bubble, these stocks suffered more.
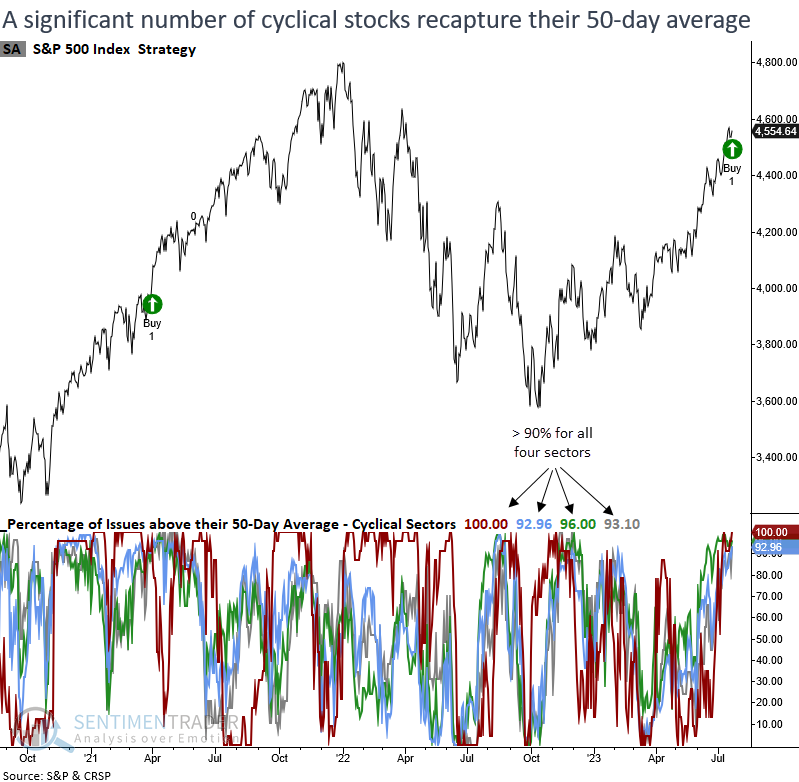
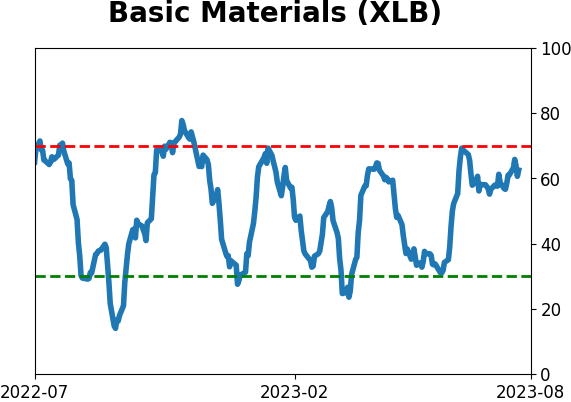
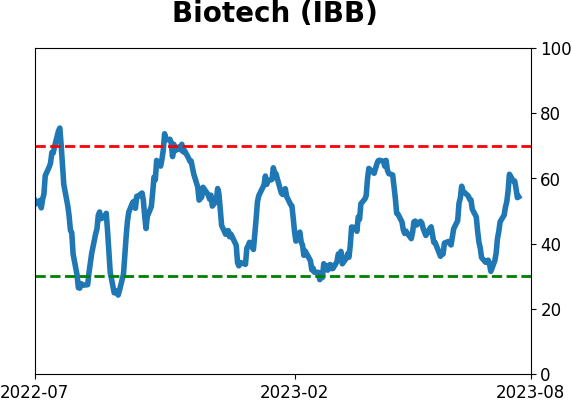
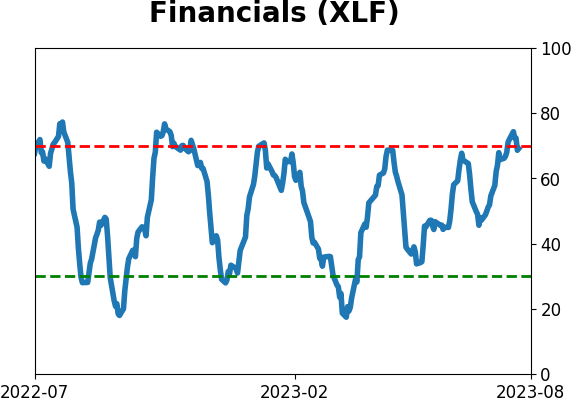
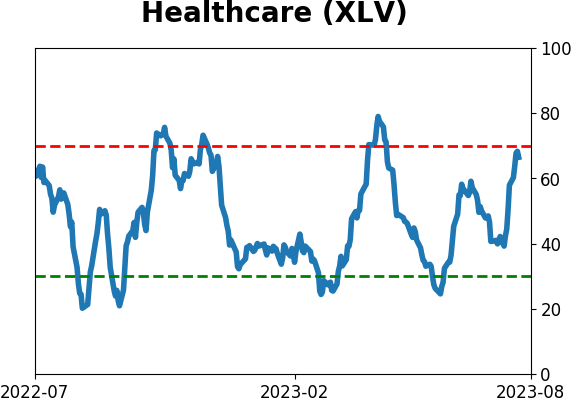
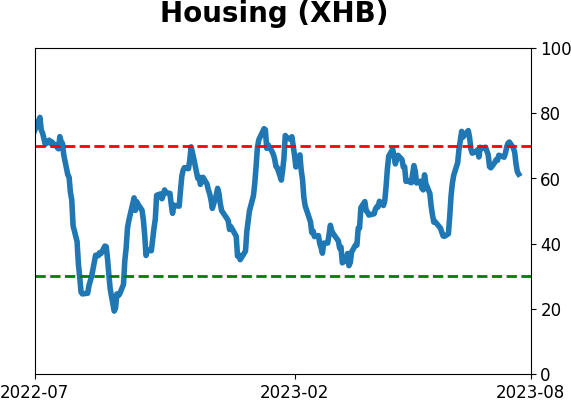
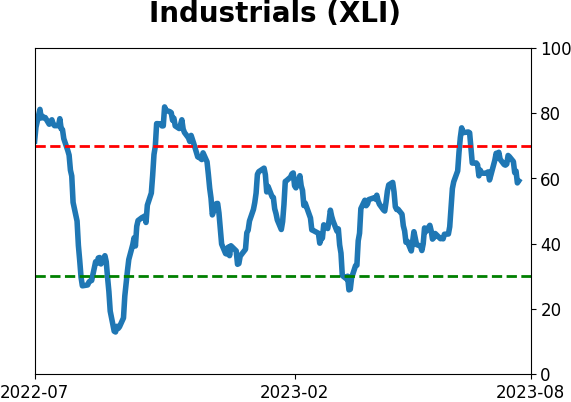
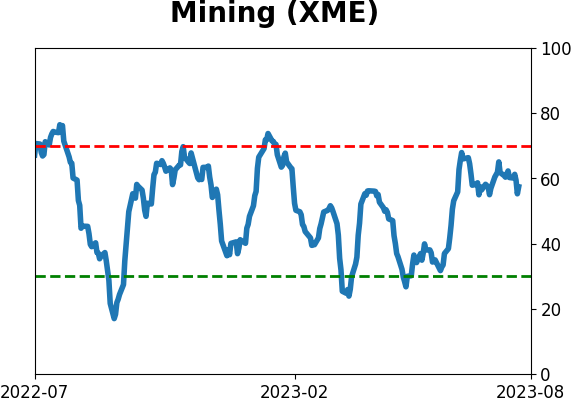
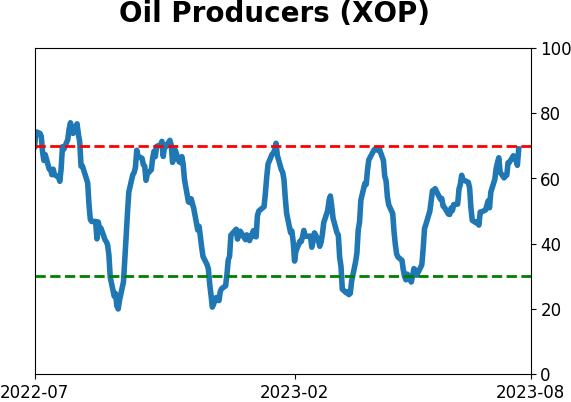
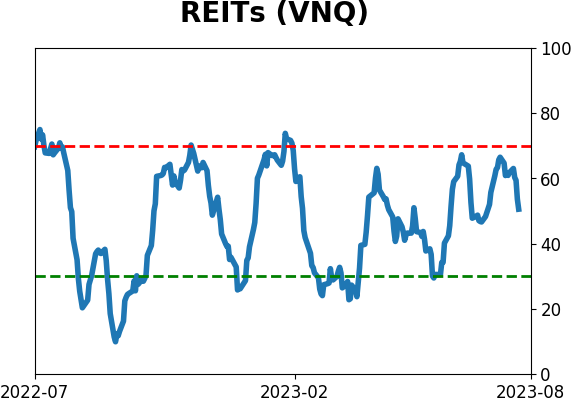
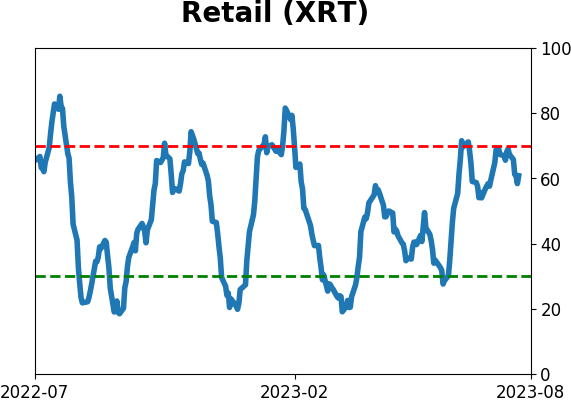
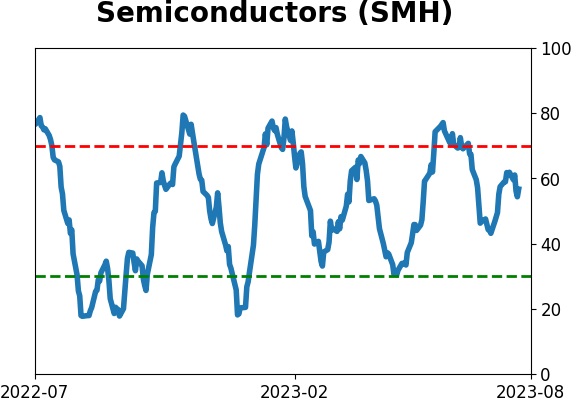
Almost all cyclical stocks are in medium-term uptrends
More than 90% of stocks in value-oriented cyclical sectors closed above their 50-day average. Dean showed that similar participation levels led to better than random returns in the S&P 500 over the next year.
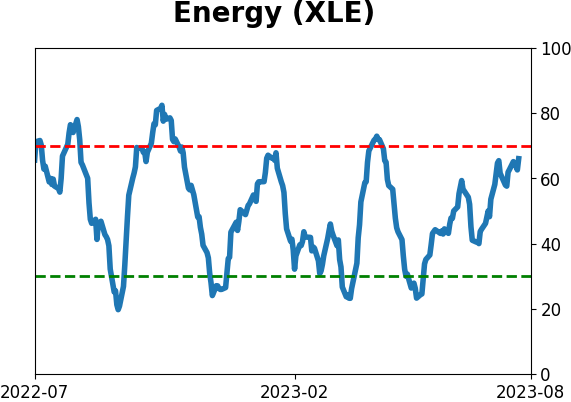
We can remove the narrow market breadth wall of worry from our list of concerns. For the first time since the low in October 2022, more than 90% of stocks in the Energy, Financials, Industrials, and Materials sectors closed above their respective 50-day average on the same day.
When more than 90% of value-oriented cyclical sector stocks close above their 50-day average in unison, the S&P 500 tends to see additional gains that exceed the average return over the study period. Except for 1973 and the signals during the Dotcom bust, both of which took place in downtrends, drawdowns were reasonably modest.
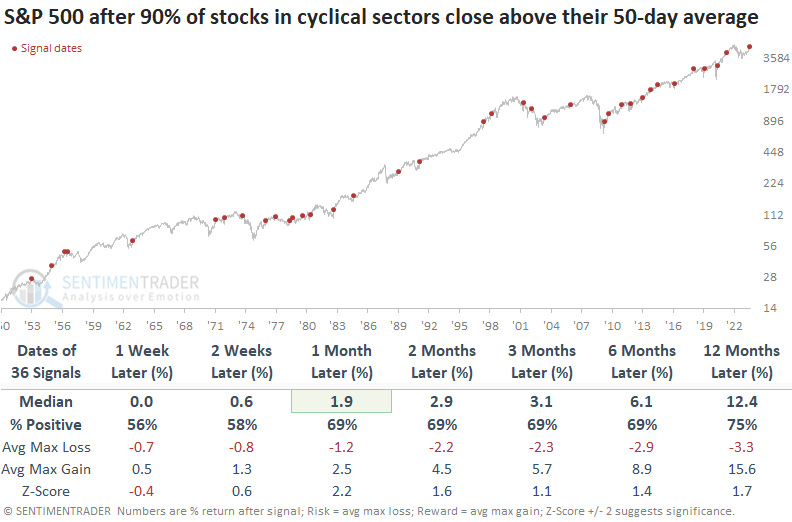
Suppose we compare the forward returns for the value-oriented cyclical sectors to the S&P 500. In that case, there's not a lot of evidence to suggest that we should be thinking about rotating money to value despite the resurgence in uptrends.
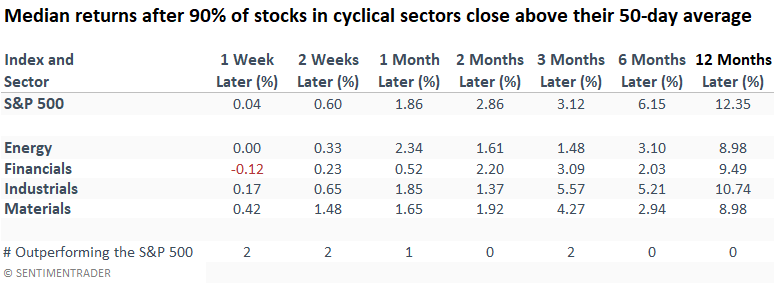
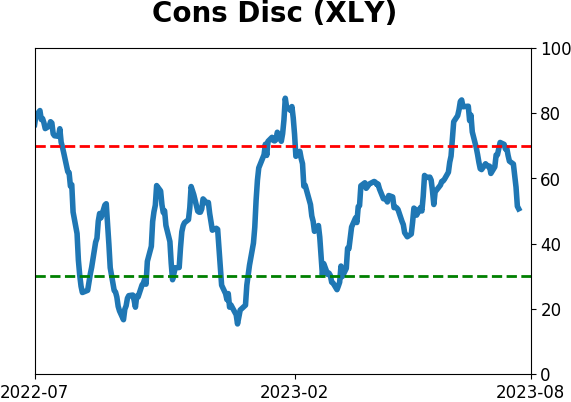
Growth-oriented sectors like Consumer Discretionary, Technology, and Health Care outperformed all other groups on a fairly consistent basis.
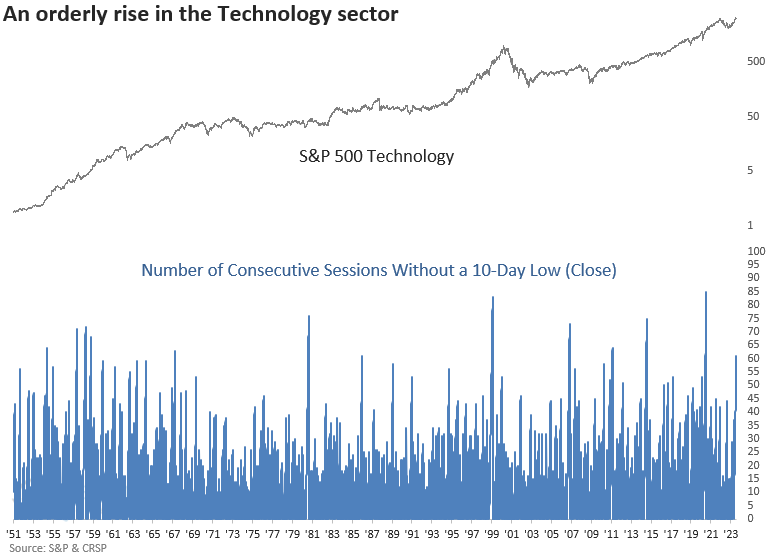
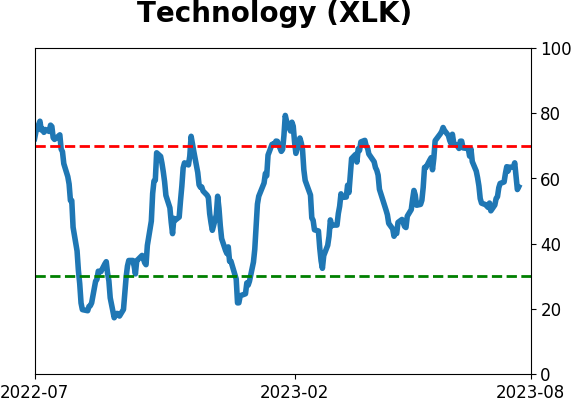
It's been months since Technology fell to even a 10-day low
The S&P 500 Technology sector has avoided a 10-day low (close) for 61 sessions. Dean showed that after similar win streaks, the sector was higher 83% of the time over the next two and three months.
As the Technology sector continues its bullish run, anxiety among investors escalates. The dilemma for market participants who joined the Technology rebound this year is whether the sector's upward momentum has become excessive, prompting them to assess the possibility of taking profits. For 61 consecutive sessions, the S&P 500 Technology sector has refrained from closing at a 10-day low, establishing the longest win streak since the post-COVID melt-up and ranking as the 11th most significant count in over 70 years.
When the S&P 500 Technology sector avoids a 10-day low (close) for 60 sessions, the bullish price momentum for the group is likely to continue over a medium- and long-term horizon. The best opportunity to add exposure comes in the first few weeks when the sector shows a coin toss win rate.
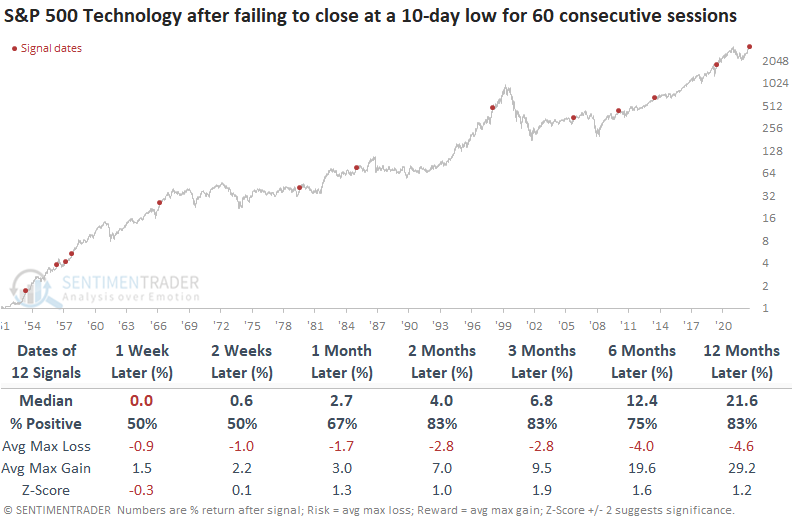
Drawdowns were remarkedly low in the first three months, with only one precedent greater than -6%. Over the next two, three, and six months, the max gain exceeded the max loss in 11 out of 12 instances.
Favorable conditions in the Technology sector bode well for the broad market. Over the next two months, the S&P 500 was higher in all but one case, and that instance showed a minimal decline of only -1.3%. The 1957 instance is the only time a signal occurred within the context of a bear market.
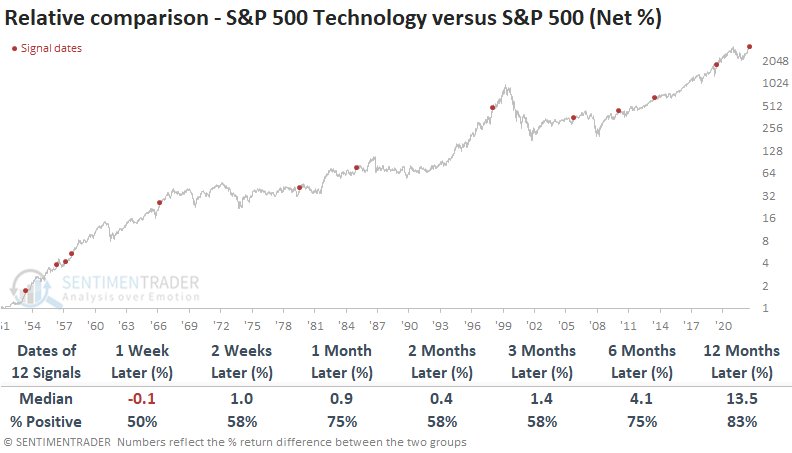
When comparing the S&P 500 Technology sector to the broader S&P 500 index, the potential for Technology to continue outperforming the broad market looks promising, especially over the next 12 months.
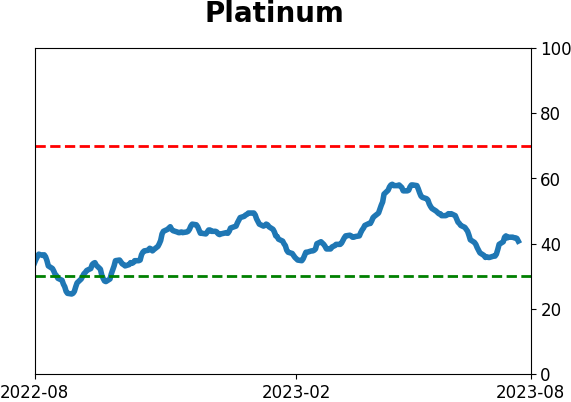
Some seasonal weakness in a metal and currency
Jay showed that platinum is headed into an unfavorable period, and the Aussie Dollar is already there.
Seasonality is only a history of tendencies in the past, and entering an unfavorable seasonal period is not an automatic sell signal, but these two contracts have had a consistent tendency.
For platinum, the period that extends from the close on Trading Day of Year #149 through TDY #198 has been particularly weak. For 2023 this period extends from the close on 2023-07-28 through the close on 2023-10-05. The chart below displays the hypothetical cumulative $ +(-) from holding a long position in platinum futures only during this unfavorable period every year since 1987.
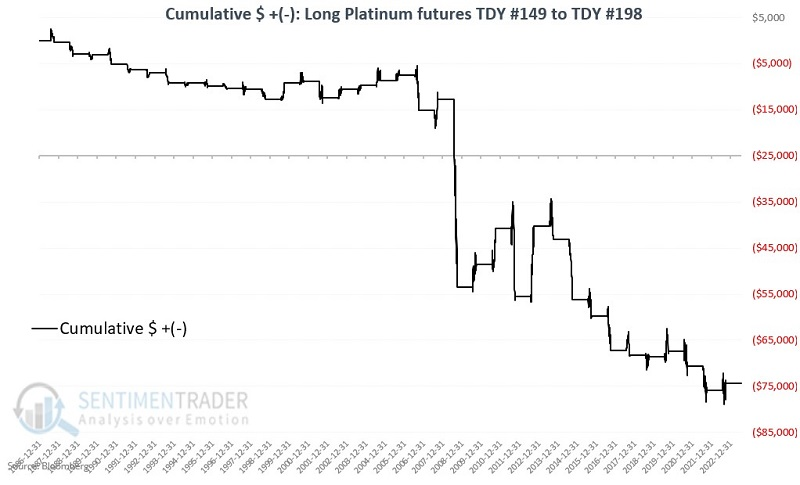
These windows showed a gain during 36% of the years, with a significantly larger average loss than average gain. The contract rose by more than +$5,000 during two years while falling by more than -$5,000 during six years.
The chart below displays the annual seasonal trend for Australian Dollar futures.
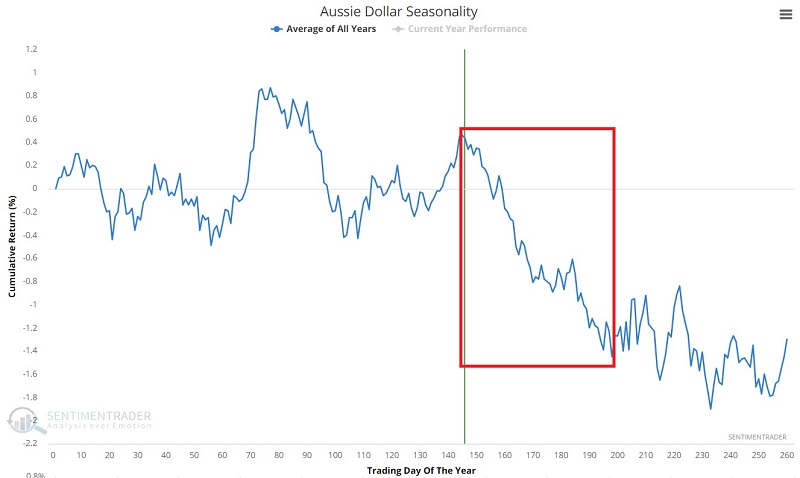
The red box highlights the period that extends from the close on Trading Day of Year #145 through TDY #198. For 2023 this period extends from the close on 2023-07-21 through the close on 2023-10-05.
During these windows, the Aussie rose only 33% of the time, again with a significantly larger average loss than average gain. It rose more than +$3,000 during four years while losing more than -$3,000 during eight years.
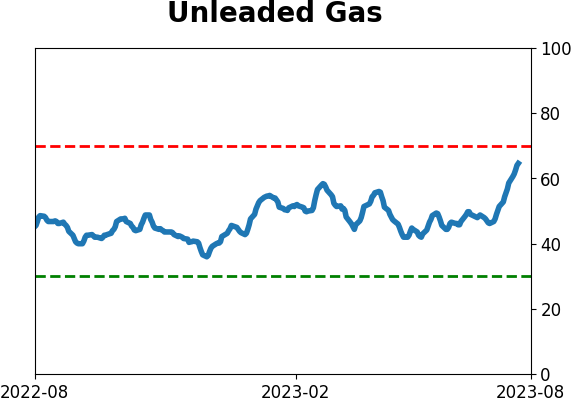
Keeping an eye on gas
Unleaded Gas has rallied sharply. However, Jay noted that unleaded also has a long history of experiencing significant price weakness during the second half of the year.
When looking at the annual seasonal trend for unleaded gas futures, identifying the weakest time of year is not difficult. Over the years, there has been a seasonal weak spot from the close on Trading Day of Year #145 through TDY #236. For 2023 this period extends from the close on 2023-07-25 through the close on 2023-11-27.
The chart below displays the hypothetical cumulative $ +(-) from holding a long position in unleaded gas futures only during this unfavorable period every year since 2005.
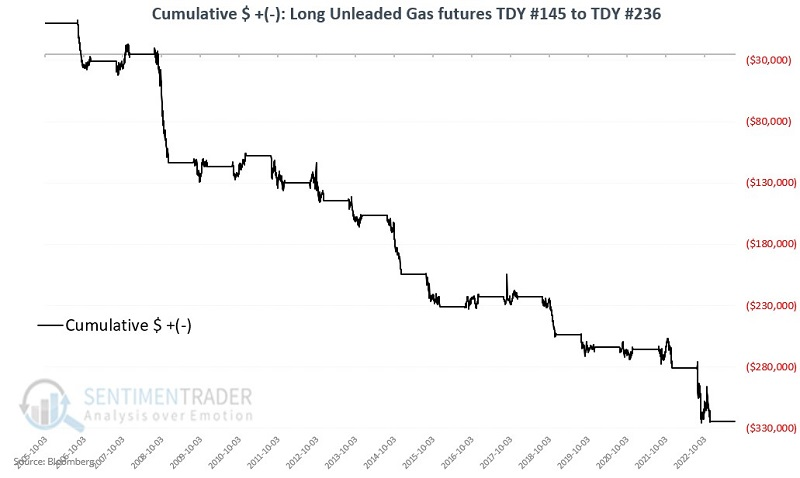
These windows showed a gain only 18% of the time and the average loss was about three times larger than the average gain. The contract never gained more than +$5,000 while it lost more than -$5,000 during eleven years.
About TradingEdge Weekly...
The goal of TradingEdge Weekly is to summarize some of the research published to SentimenTrader over the past week. Sometimes there is a lot to digest, and this summary highlights the highest conviction or most compelling ideas we discussed. This is NOT the published research; rather, it pulls out some of the most relevant parts. It includes links to the published research for convenience, and if you don't subscribe to those products, it will present the options for access.
Indicators at Extremes
|
|
|
Phase Table
|
|
|
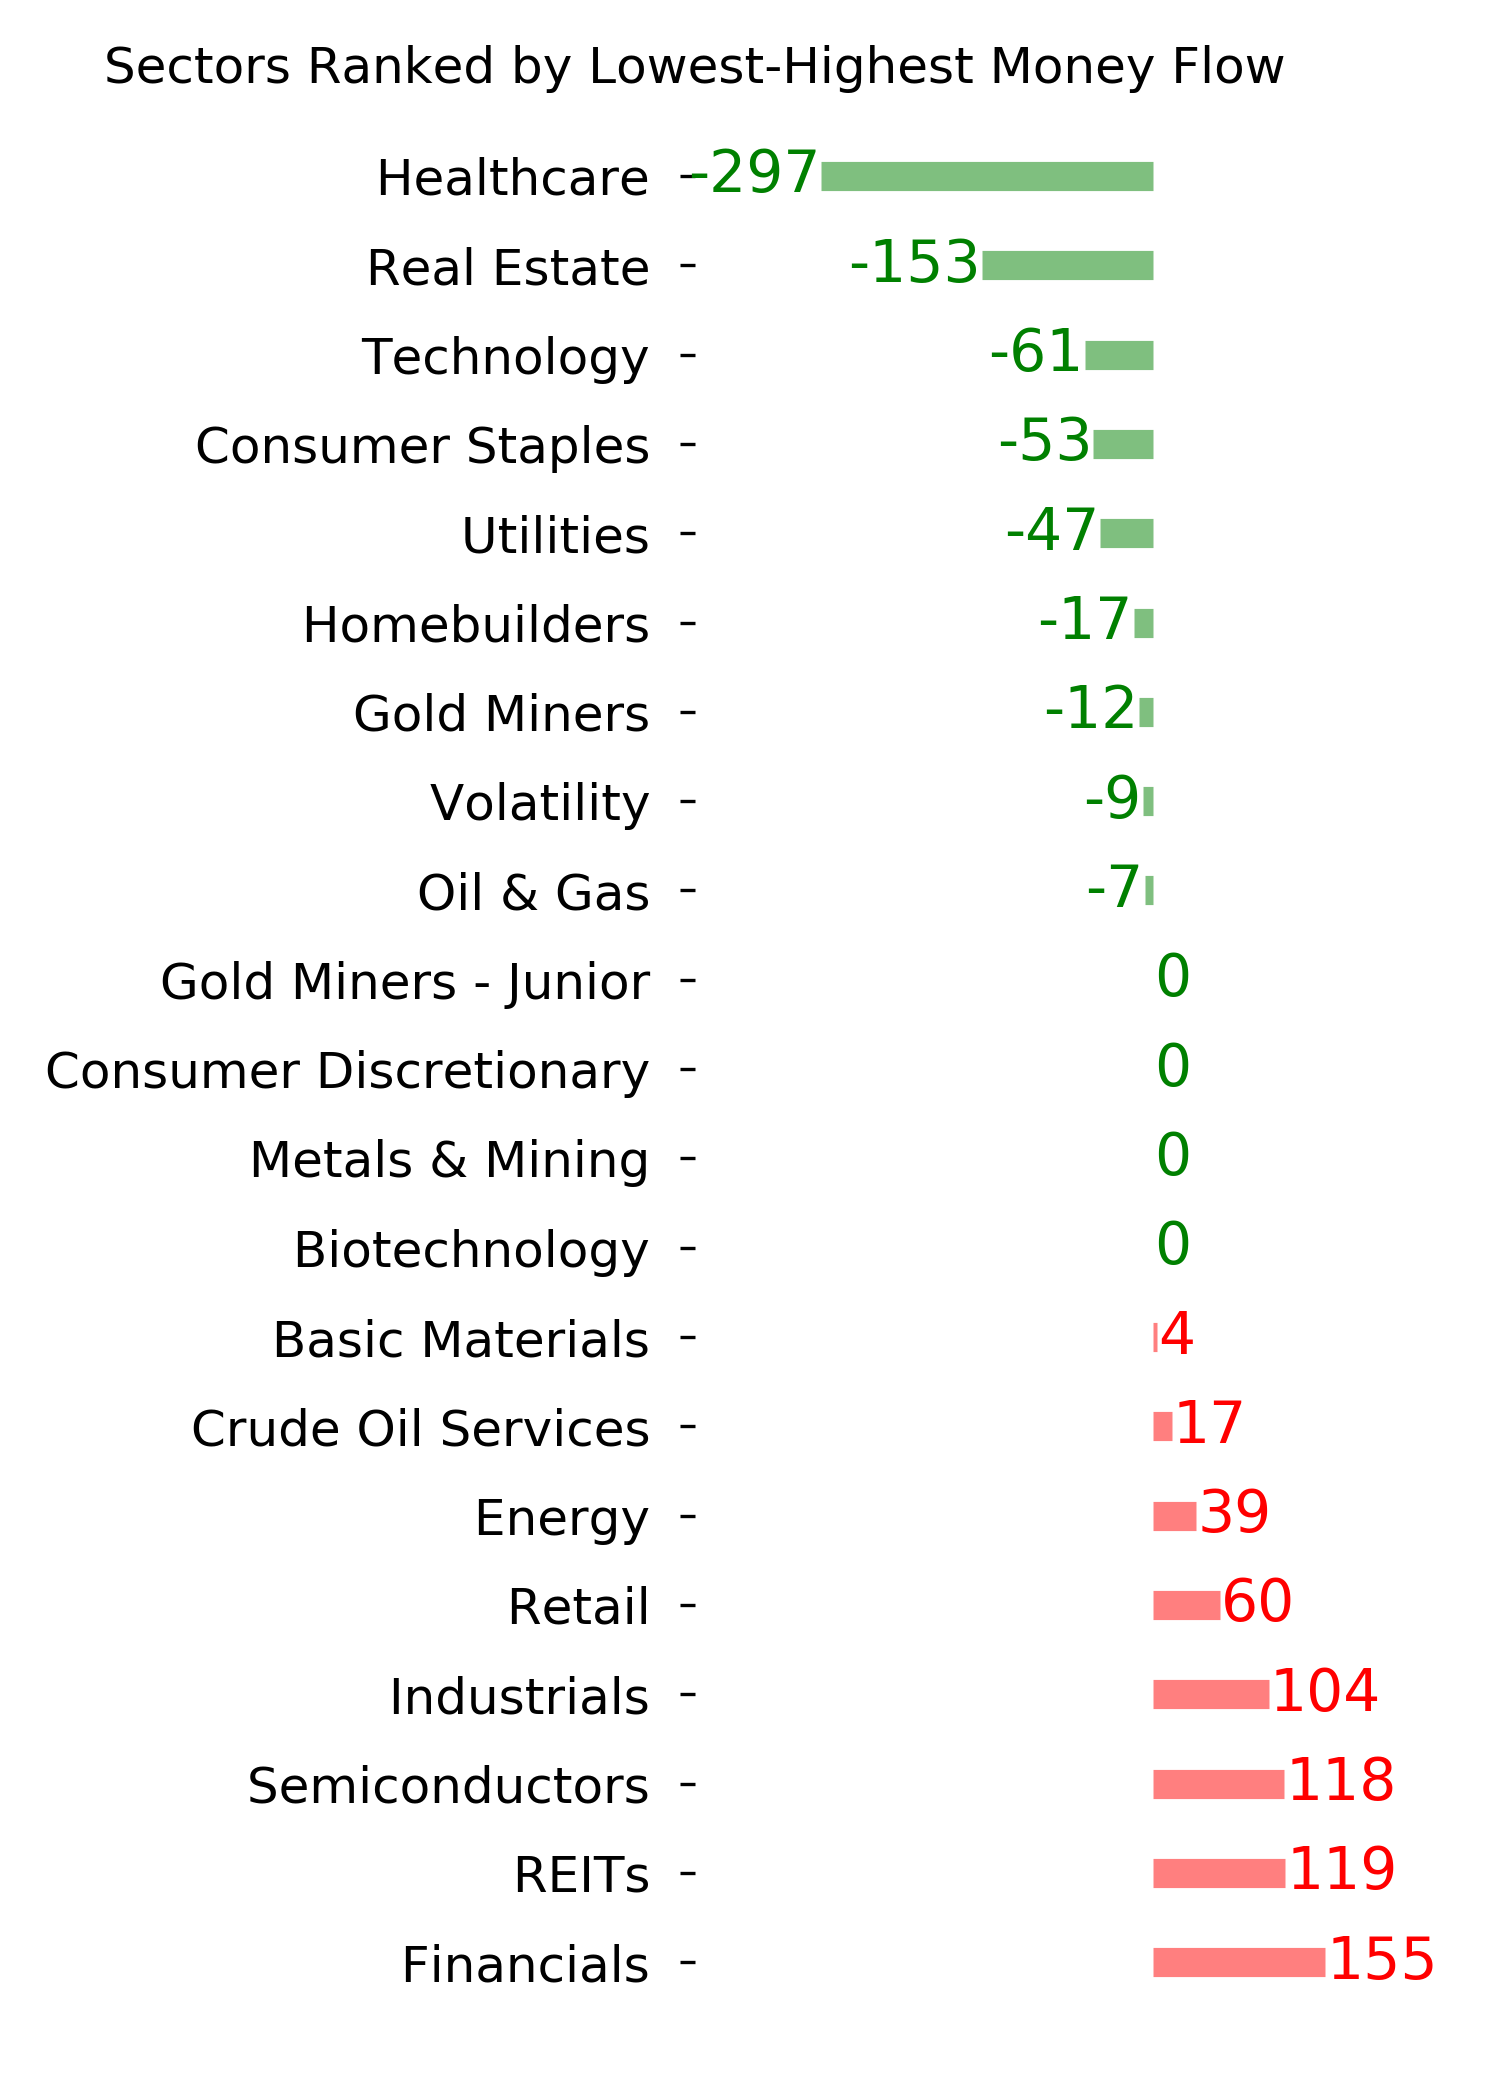
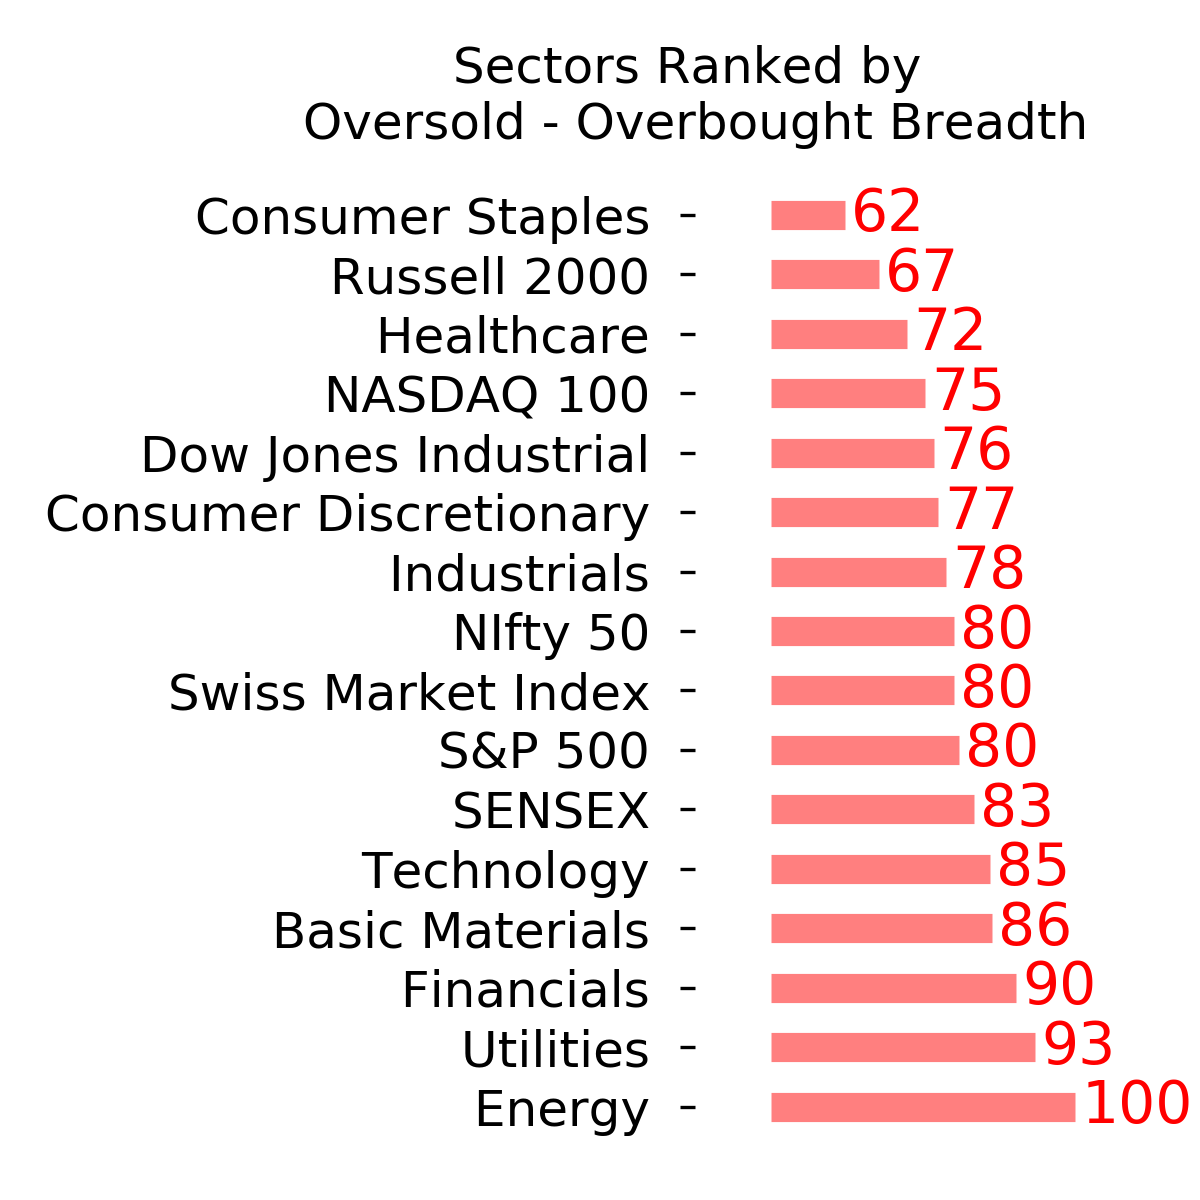
Ranks
|
|
|
|
|
|
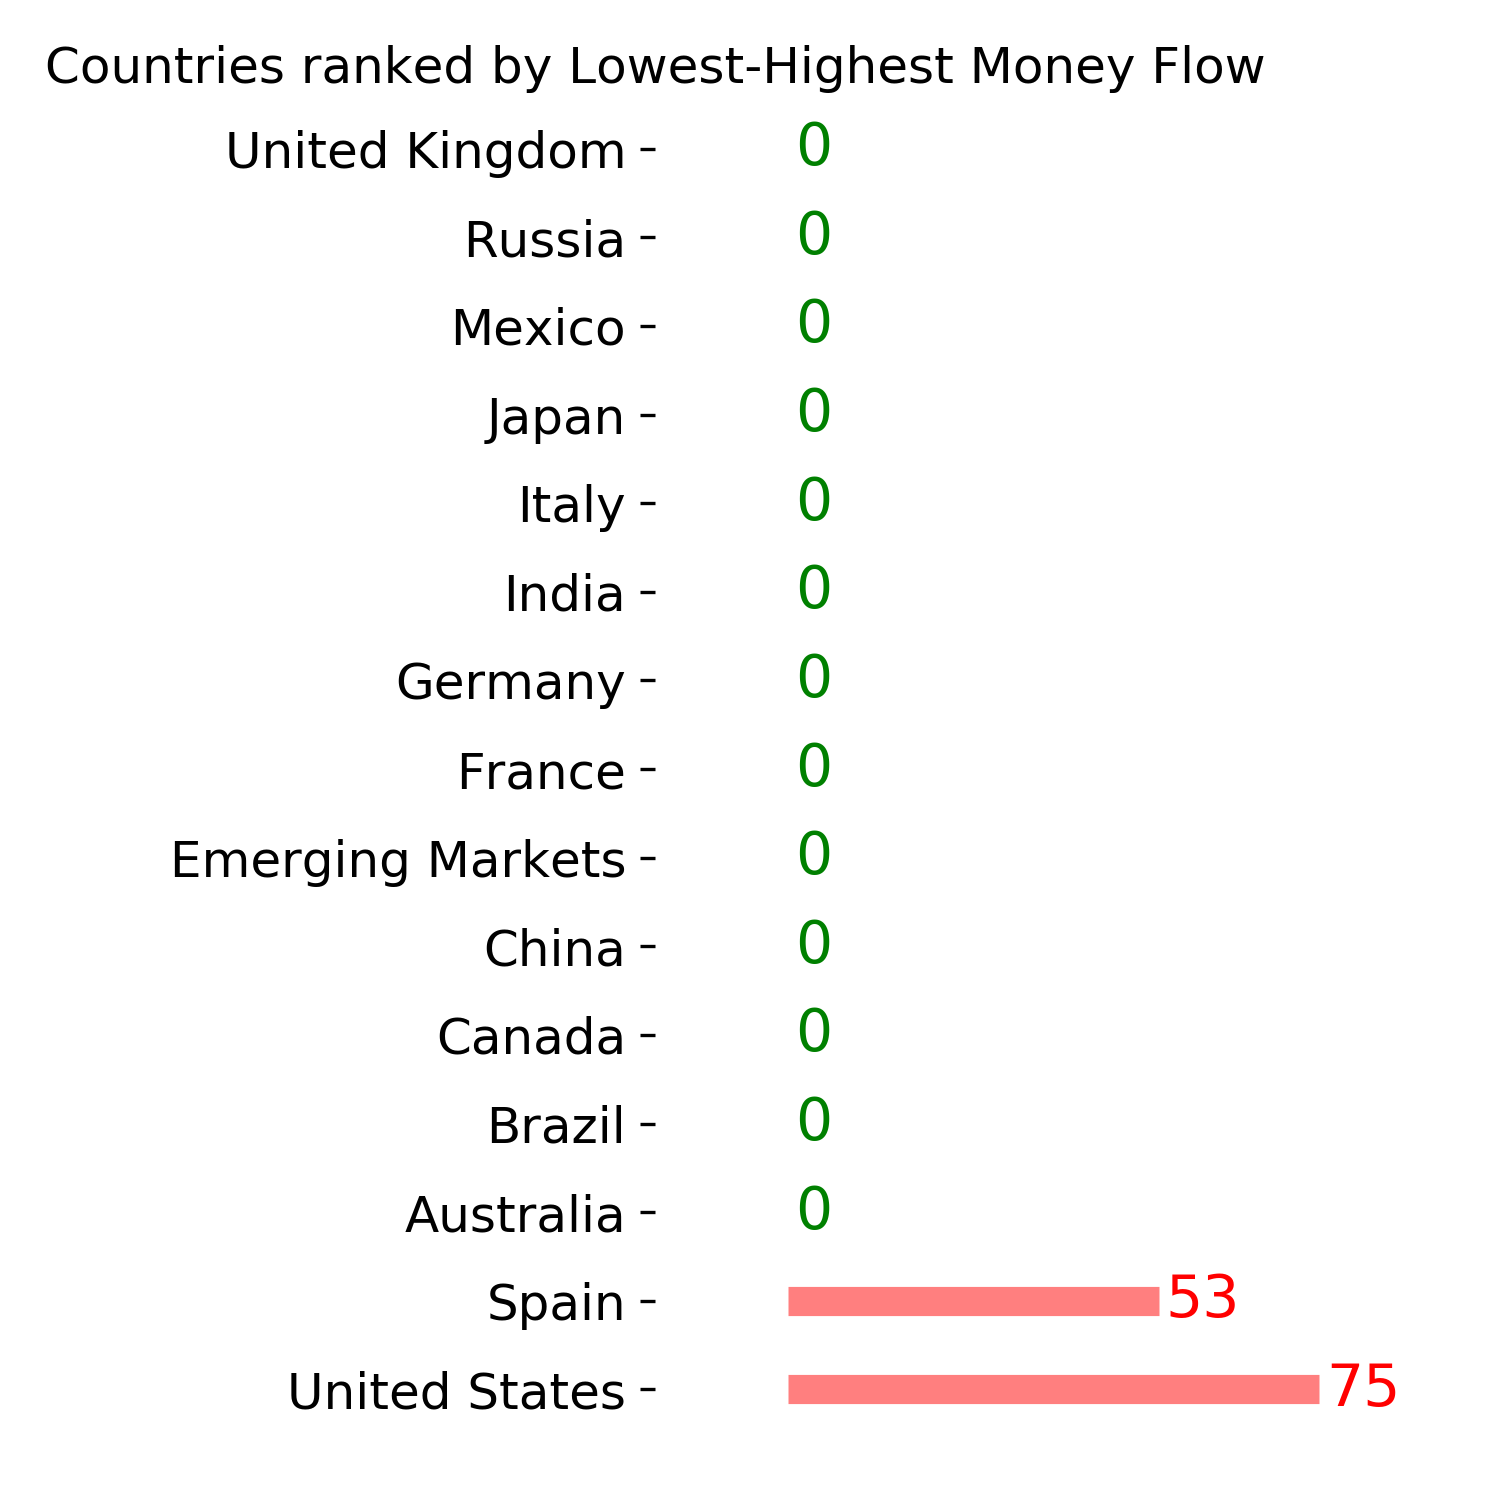
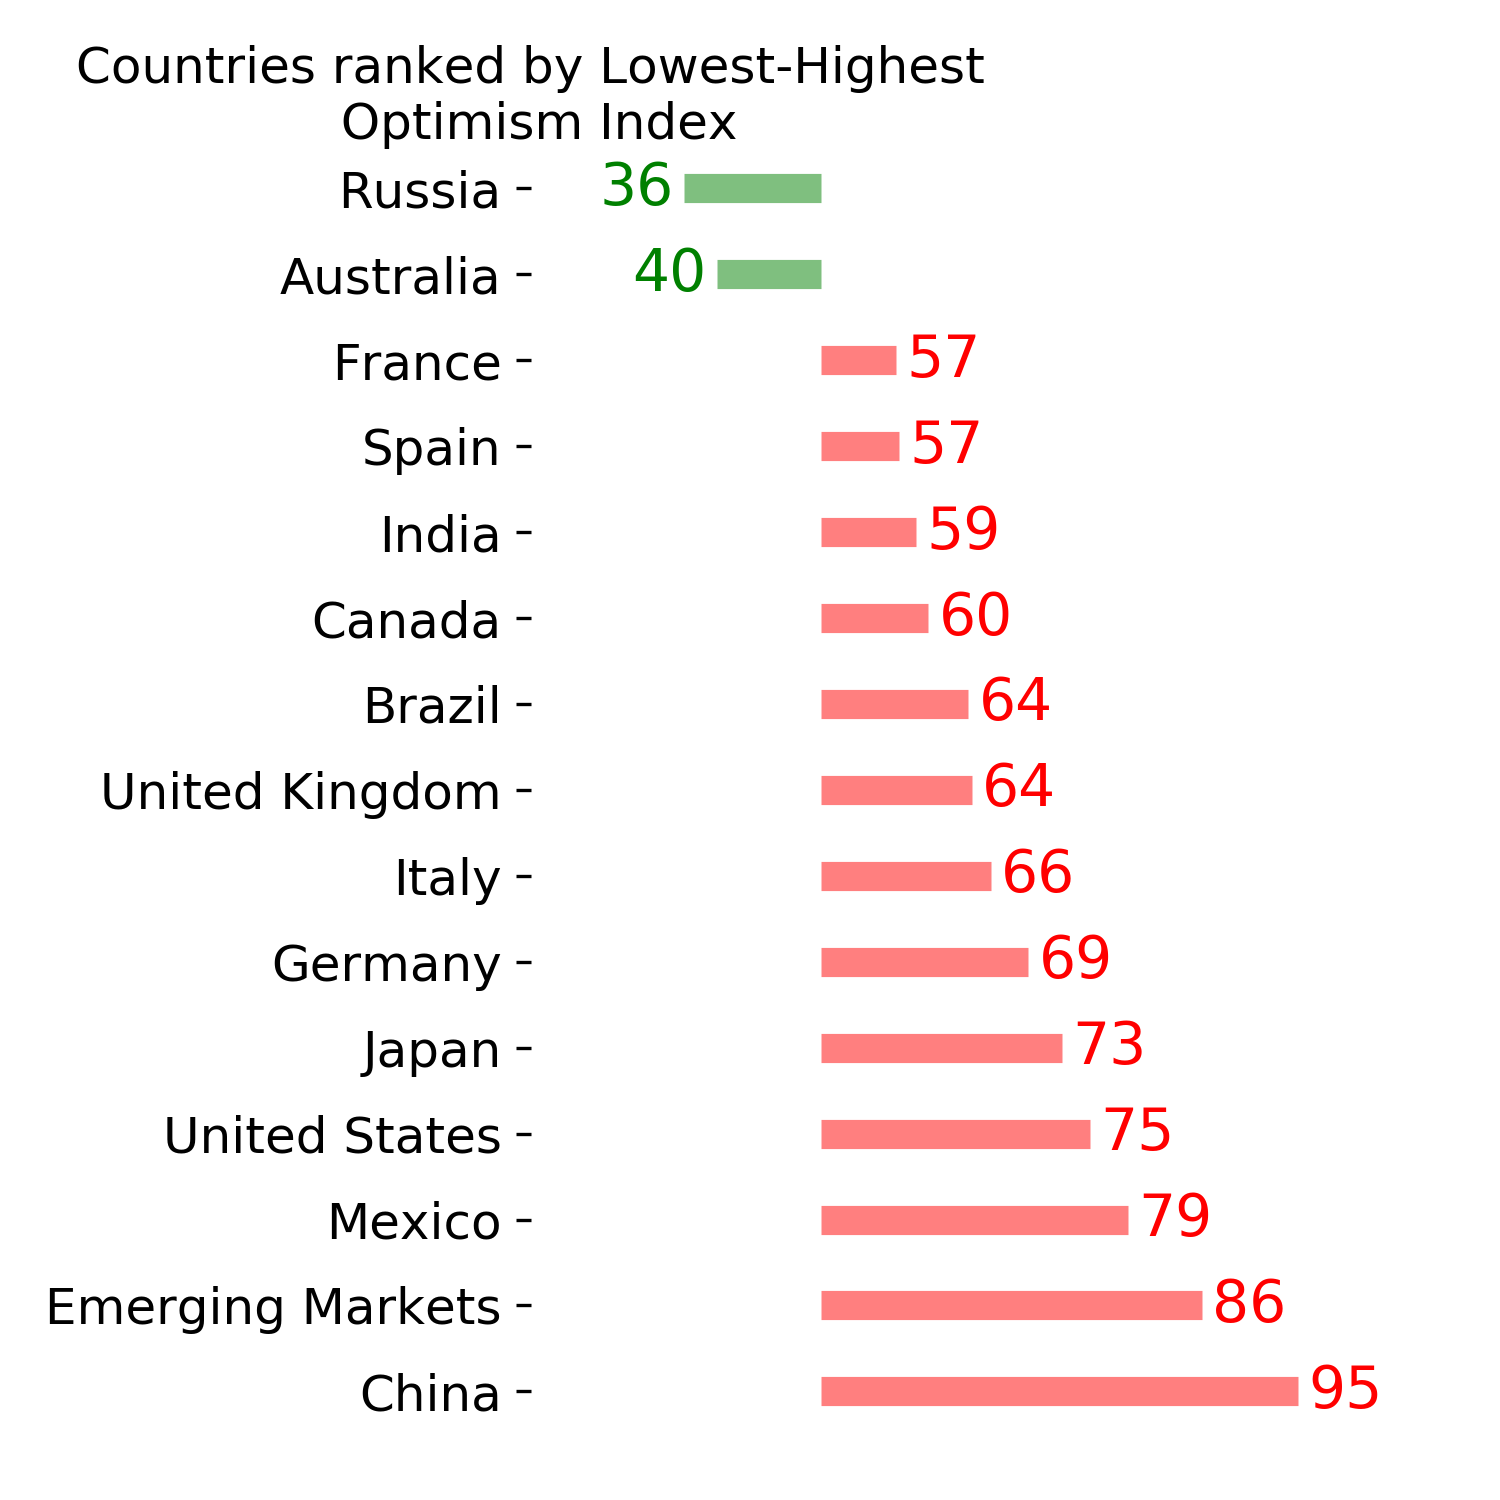
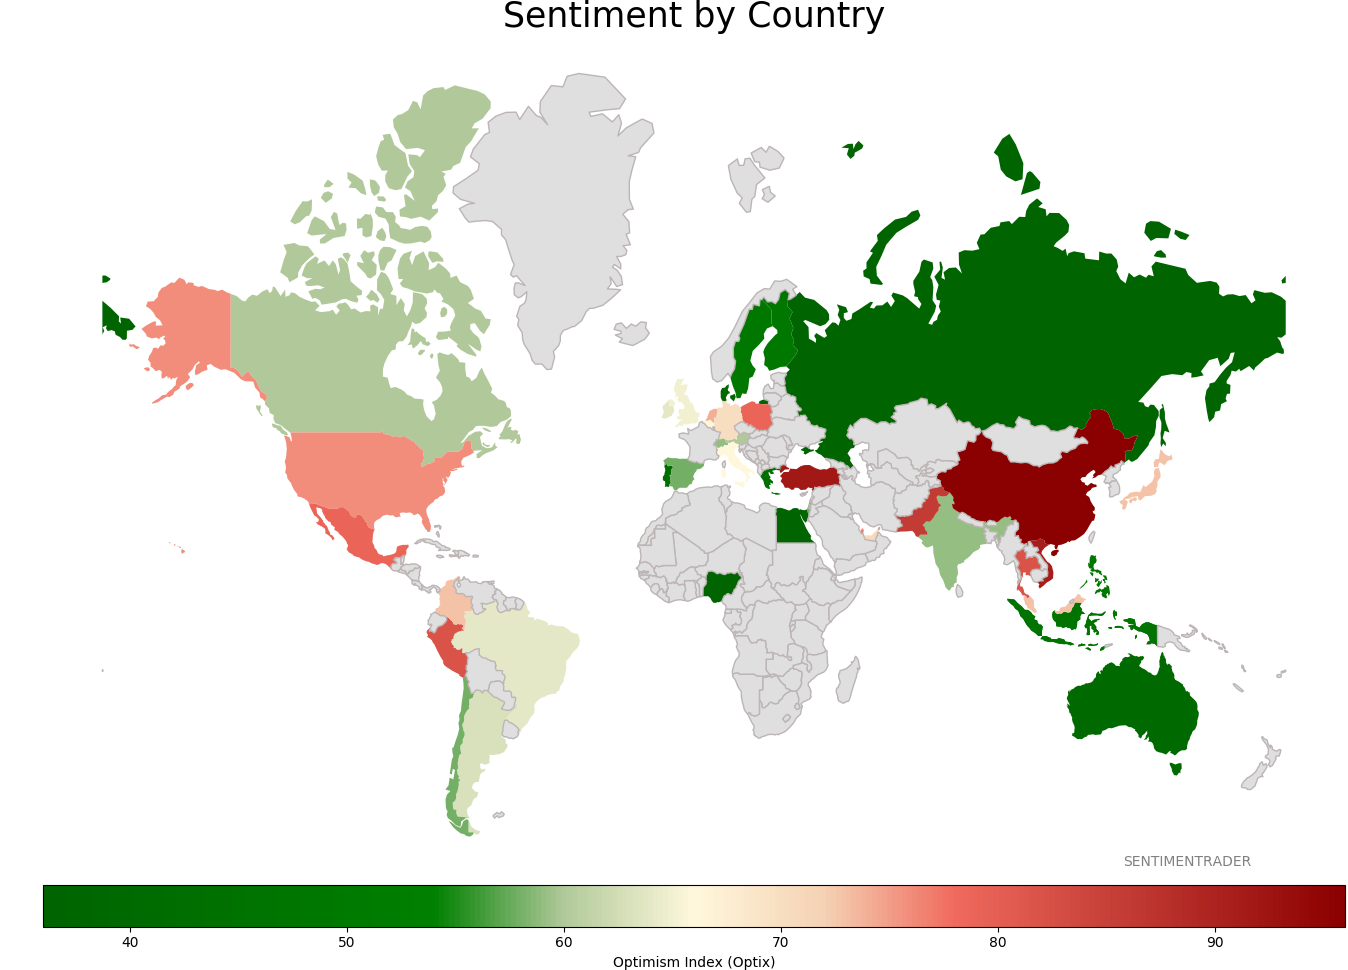
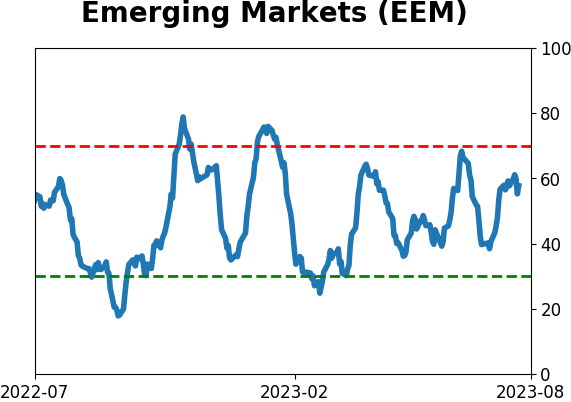
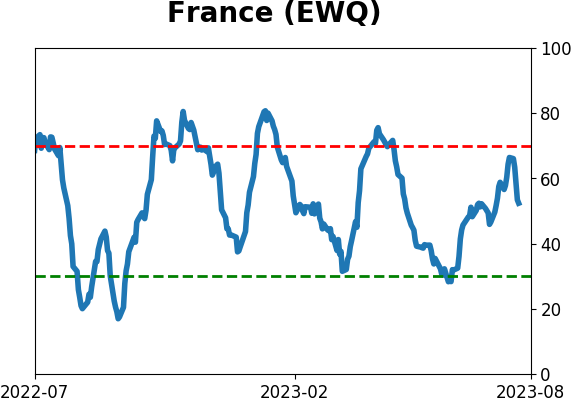
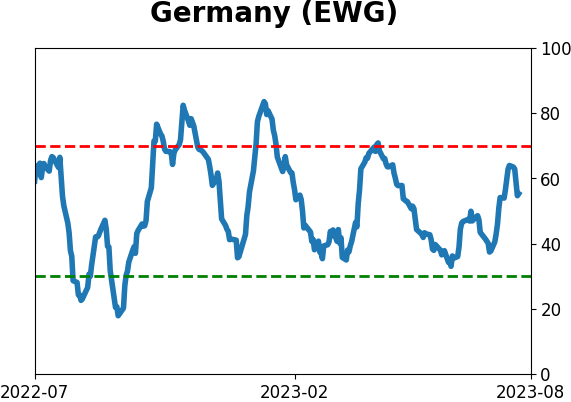
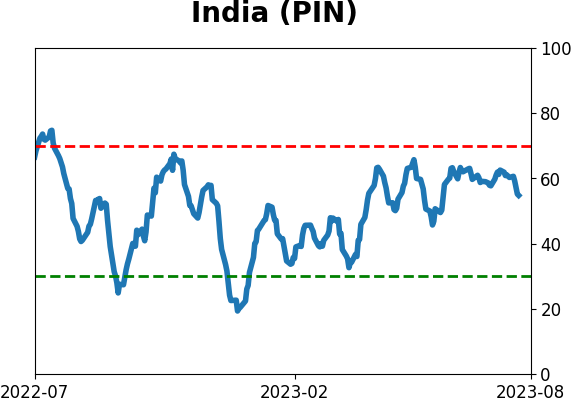
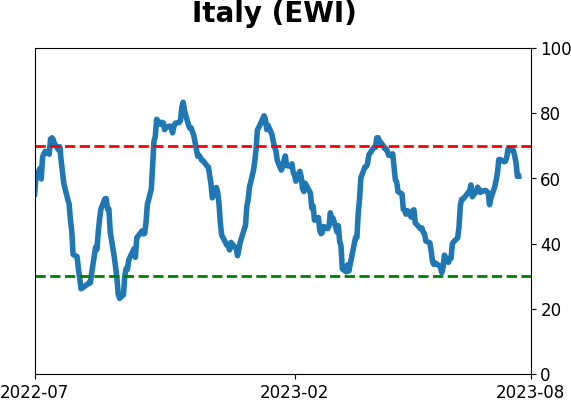
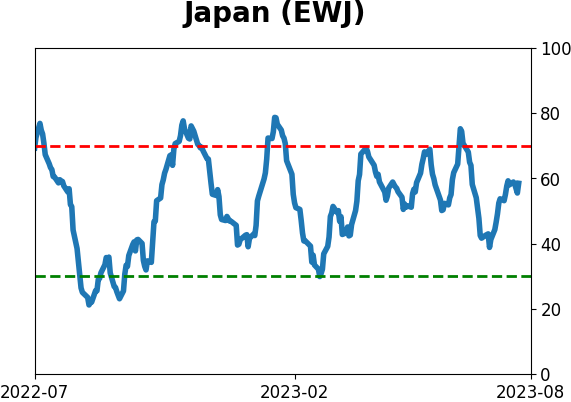
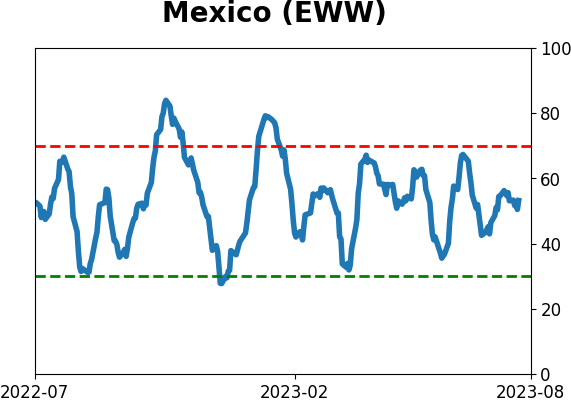
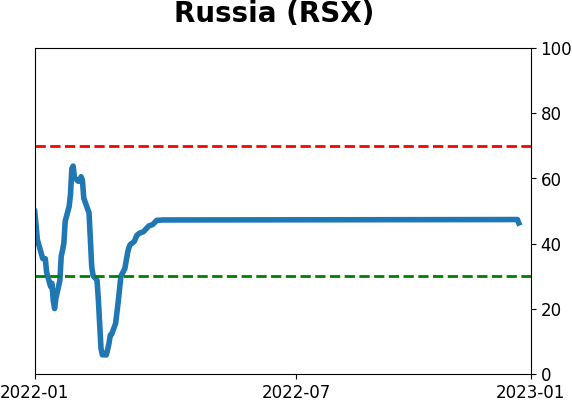
Sentiment Around The World
|
|
|
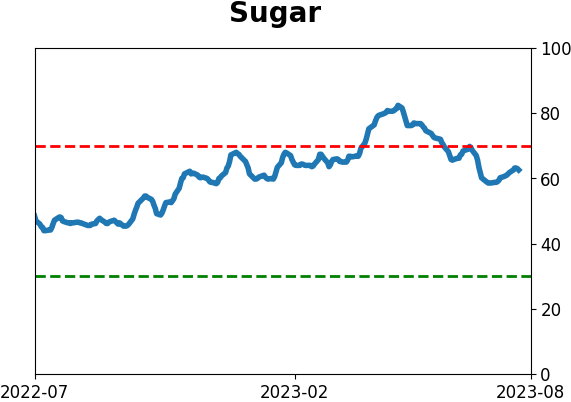
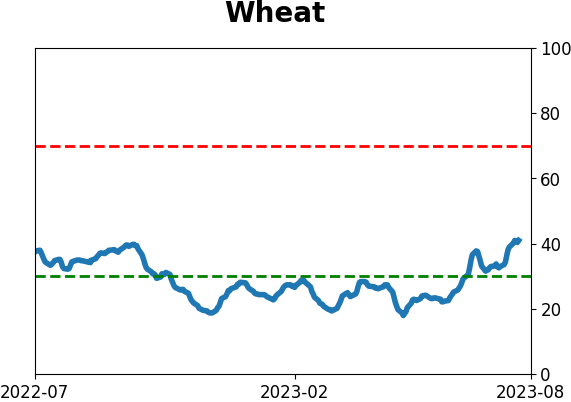
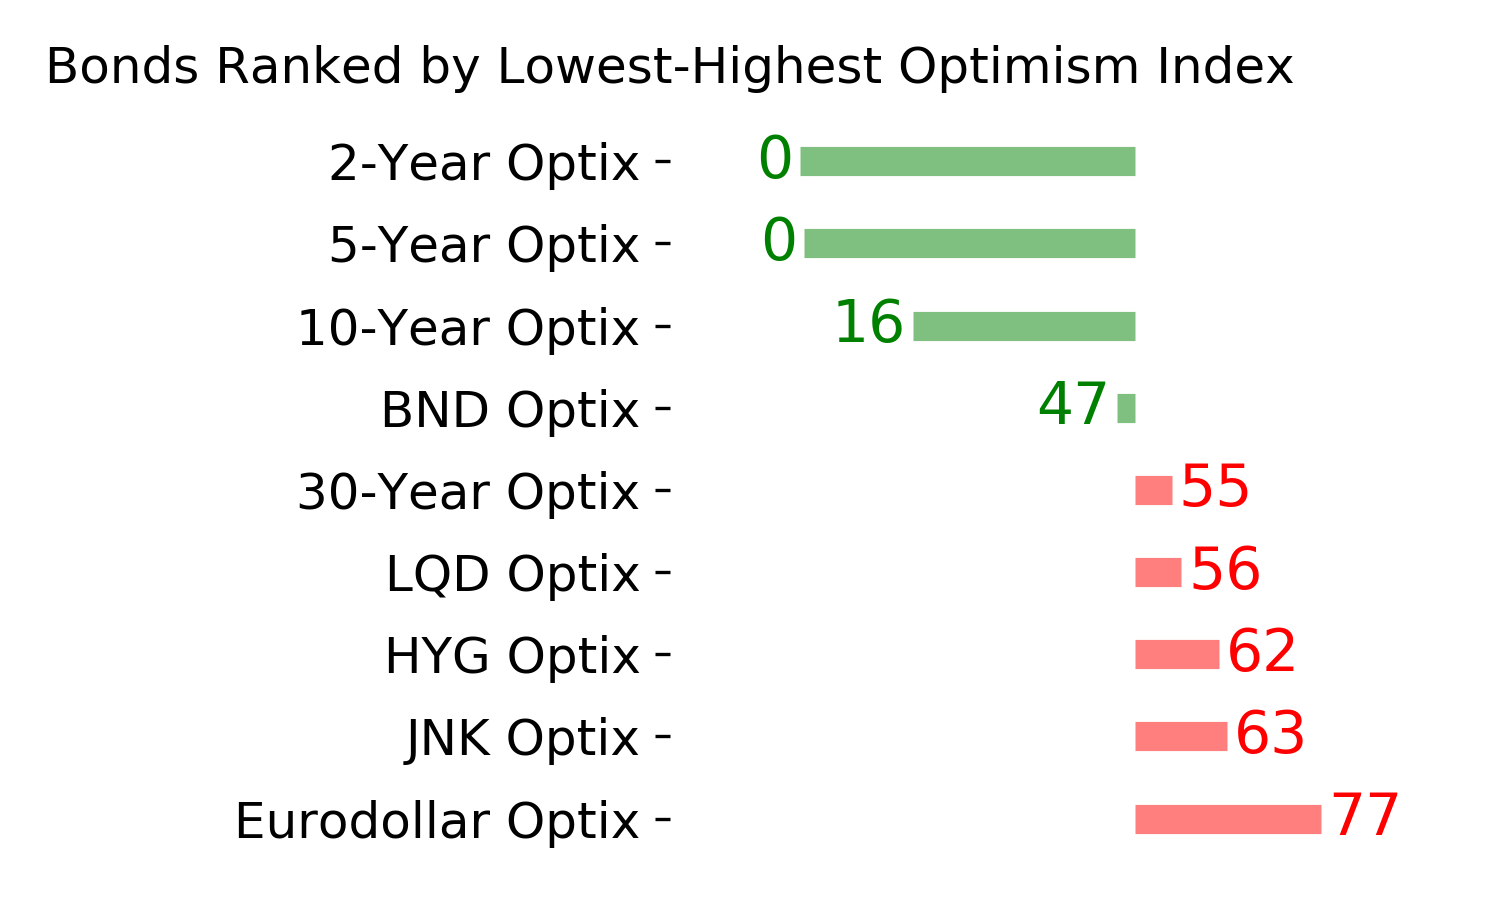
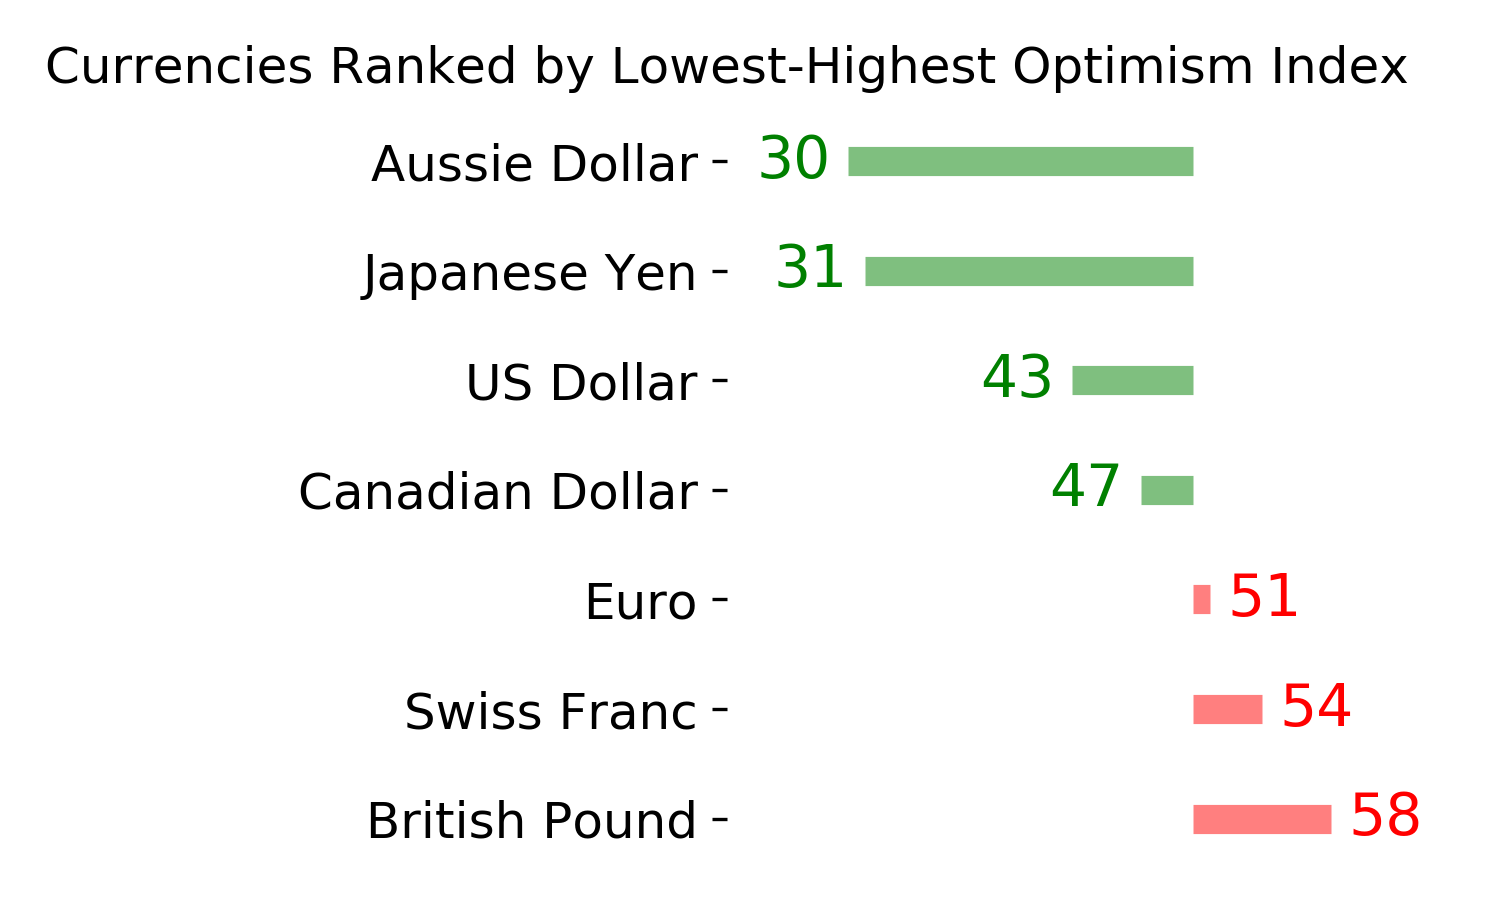
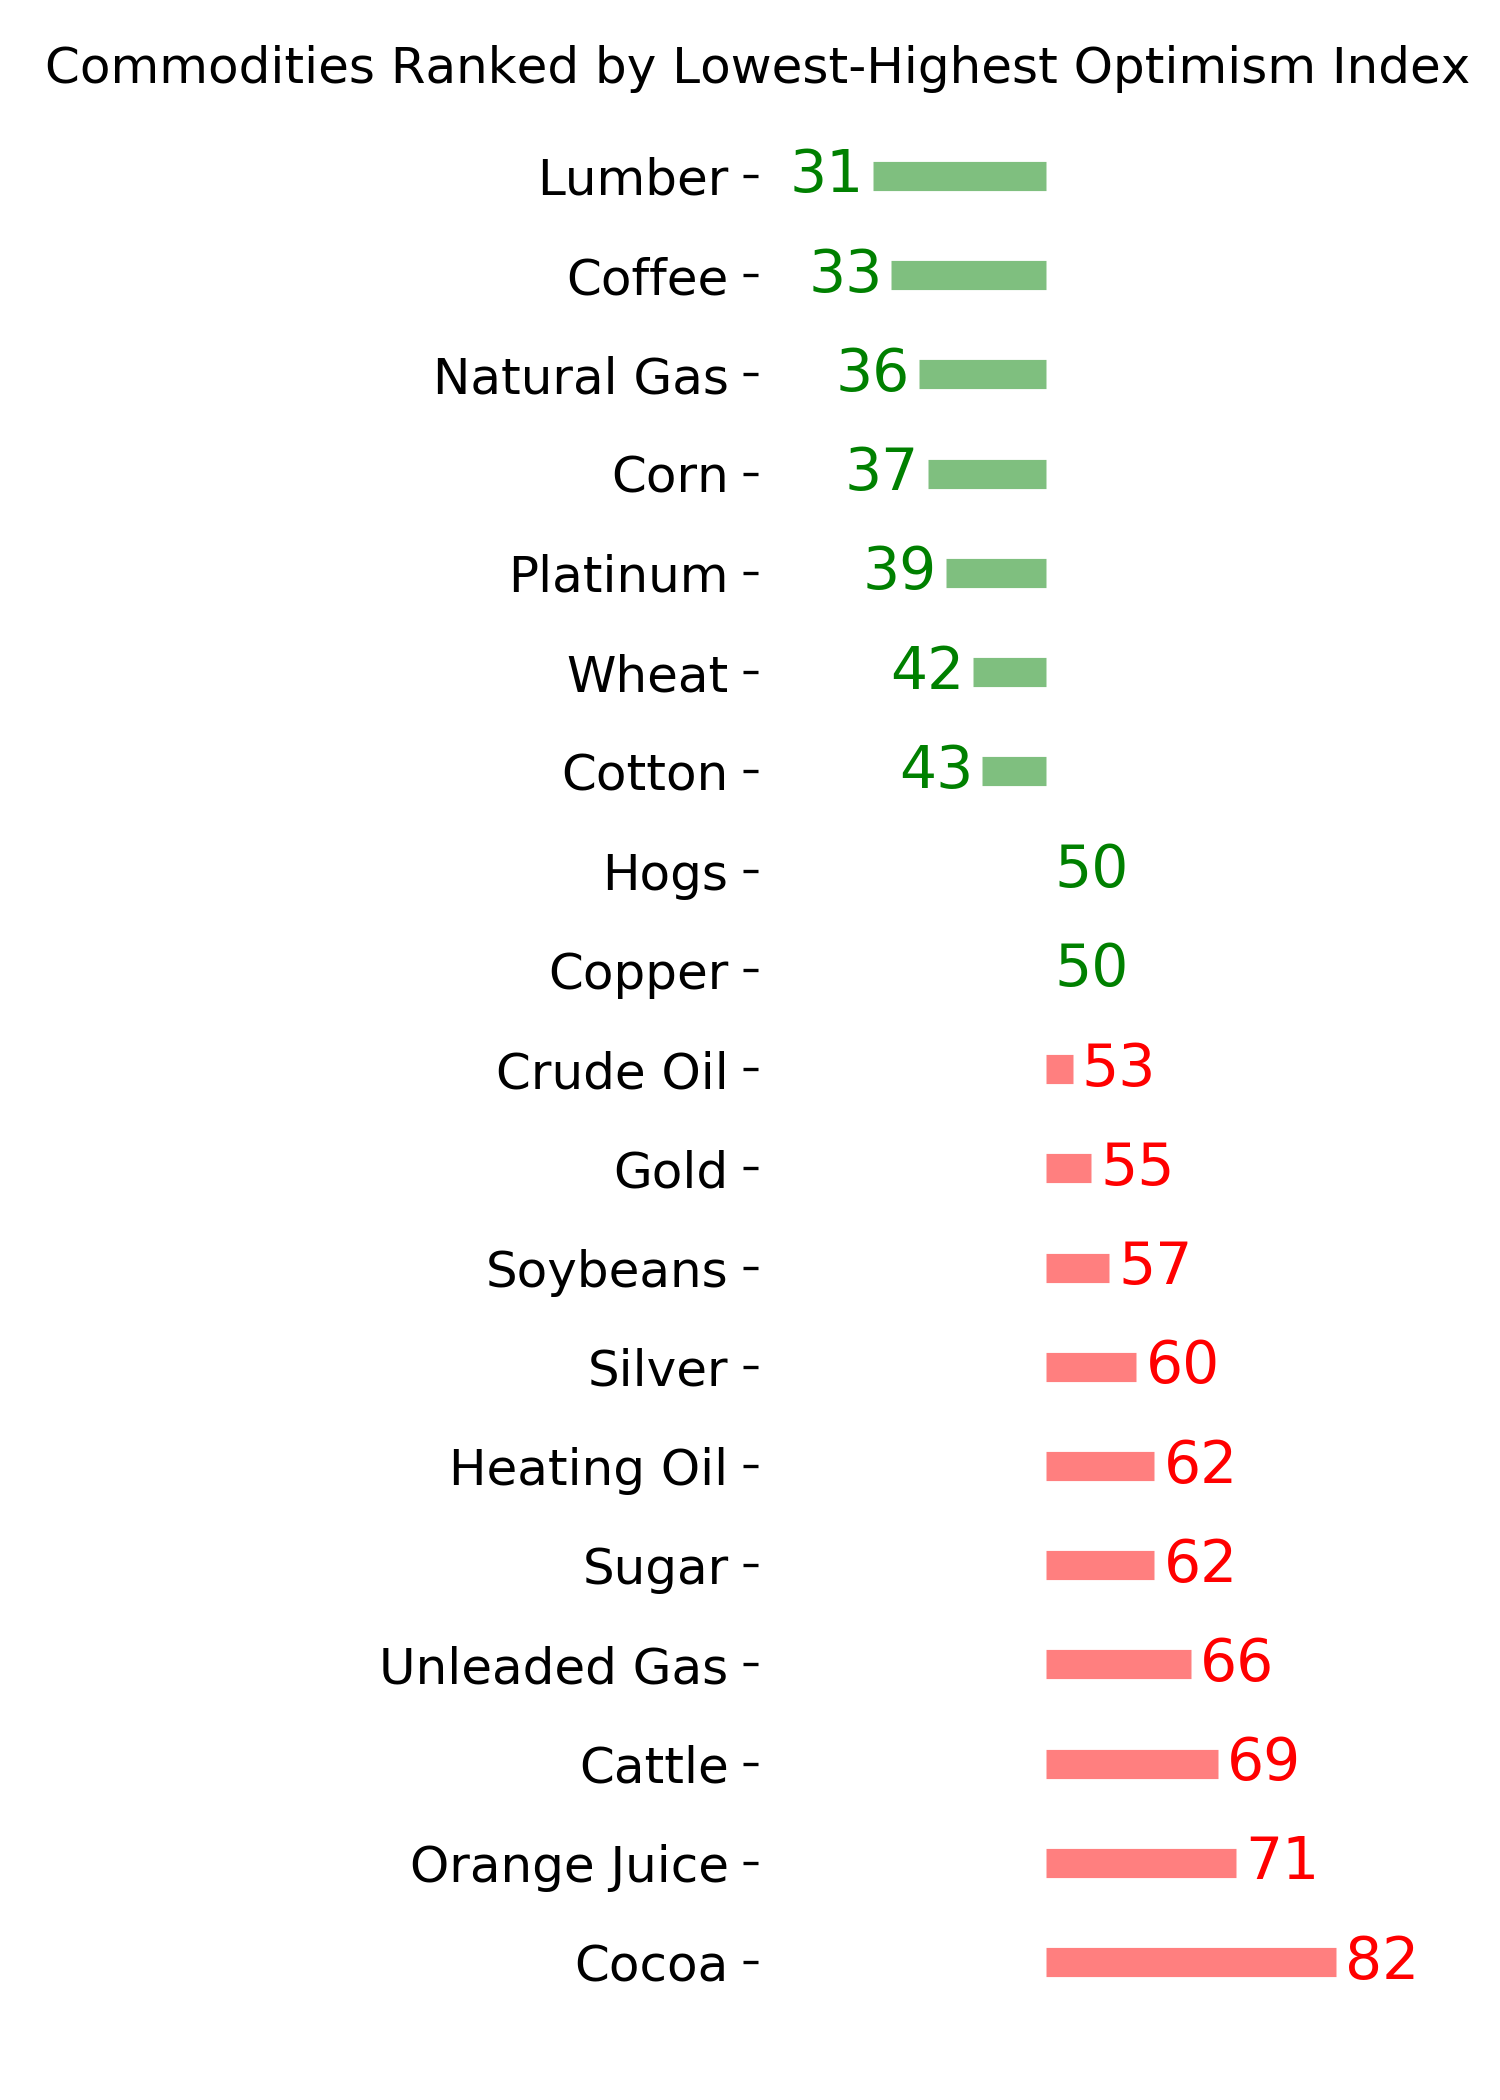
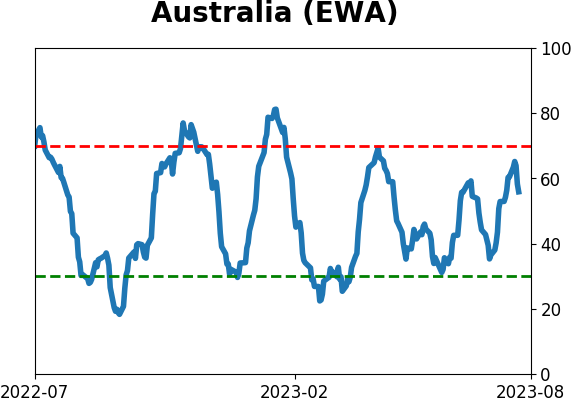
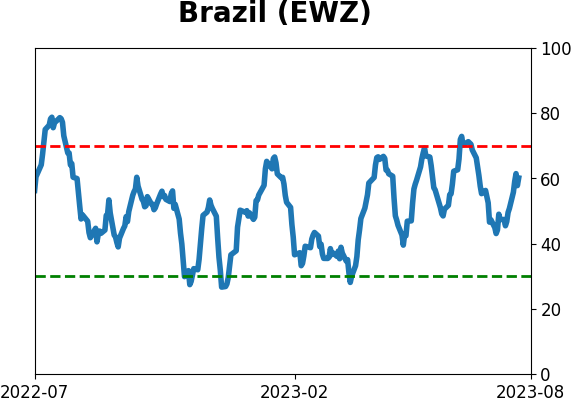
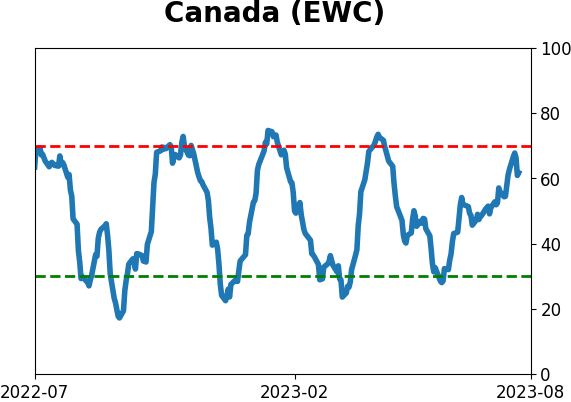
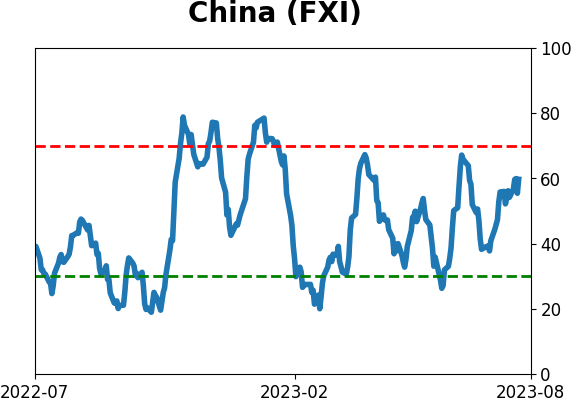
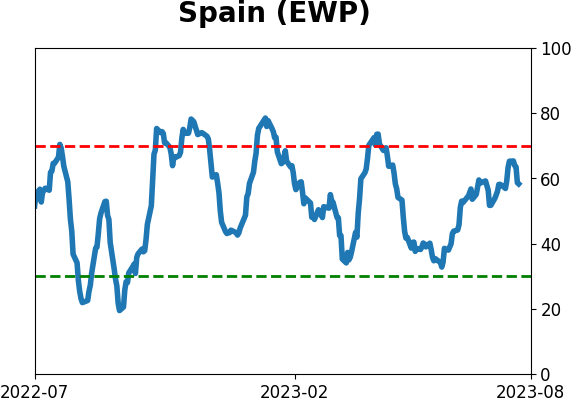
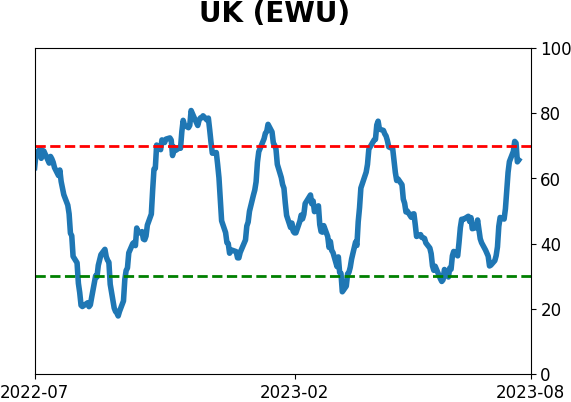
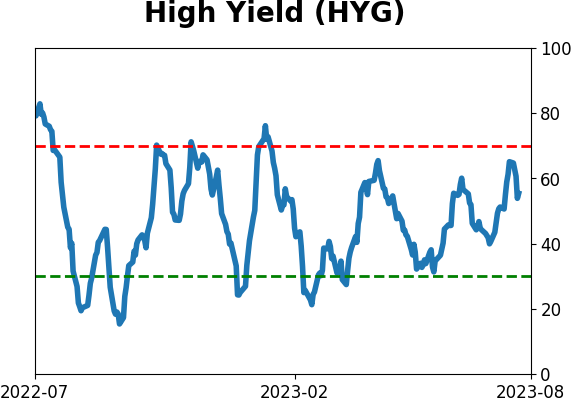
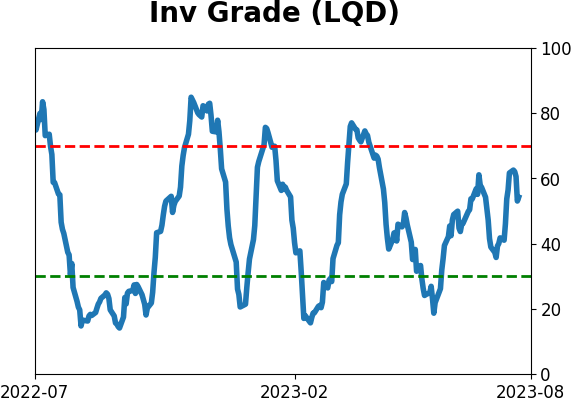
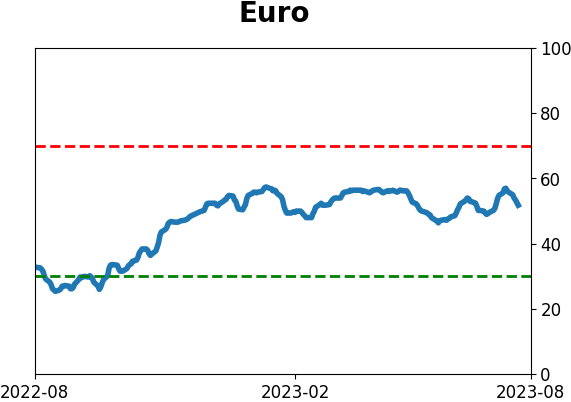
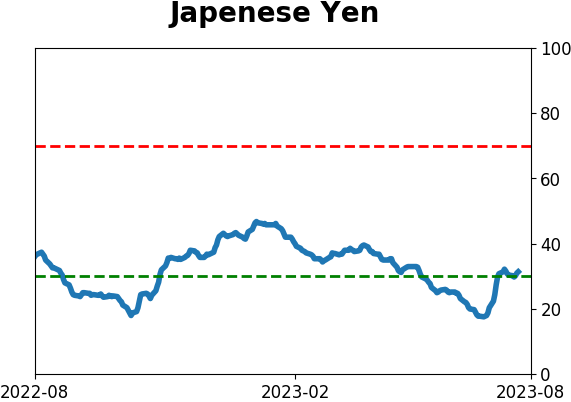
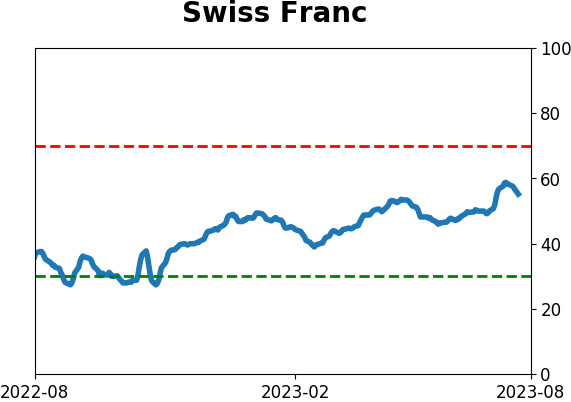
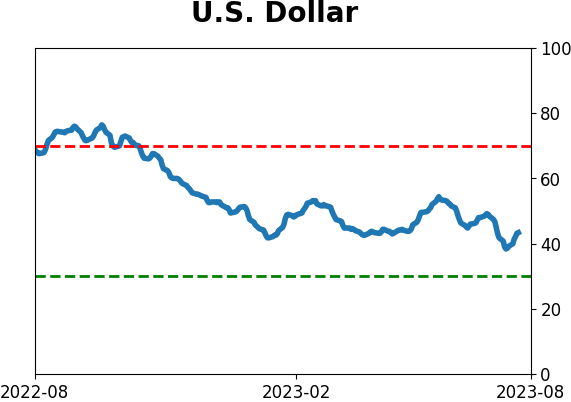
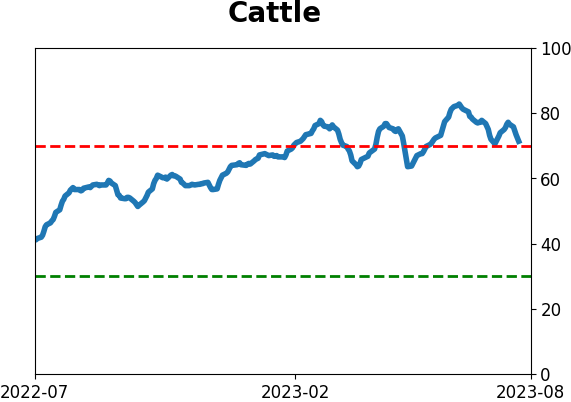
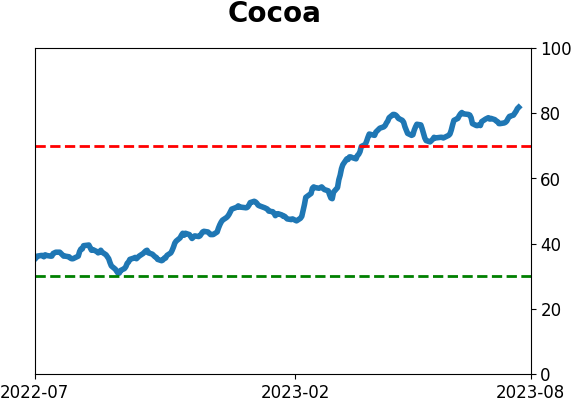
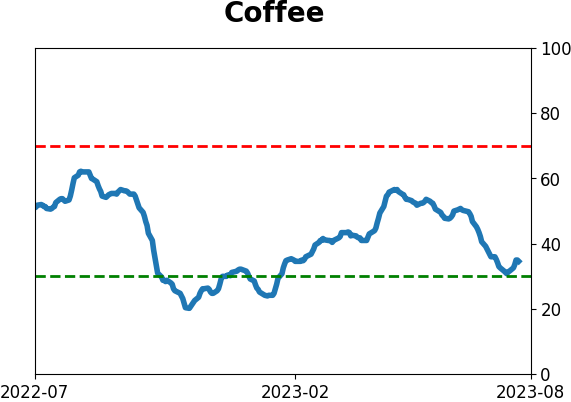
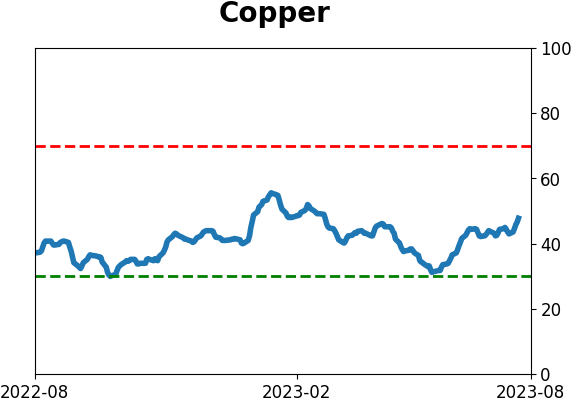
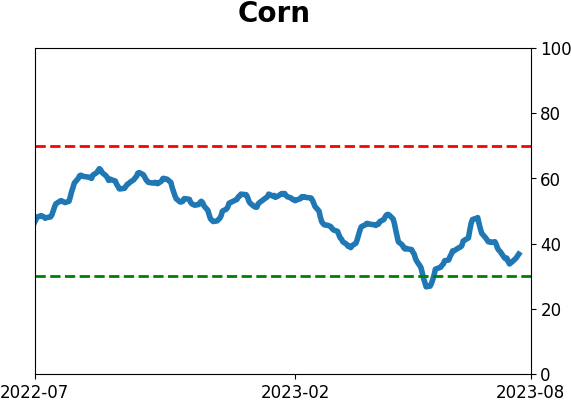
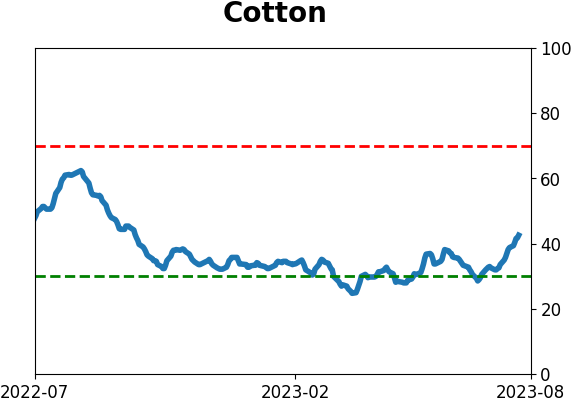
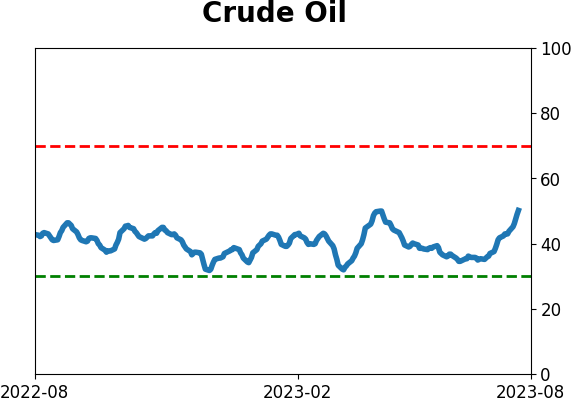
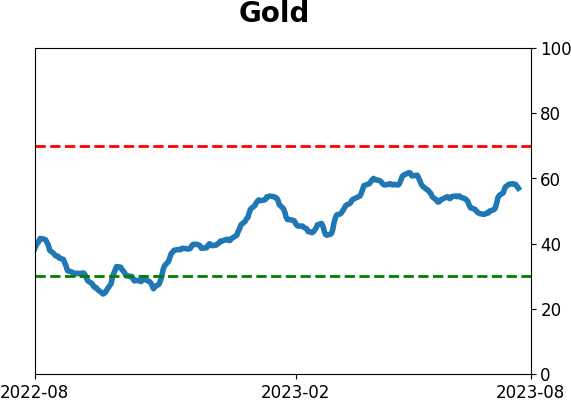
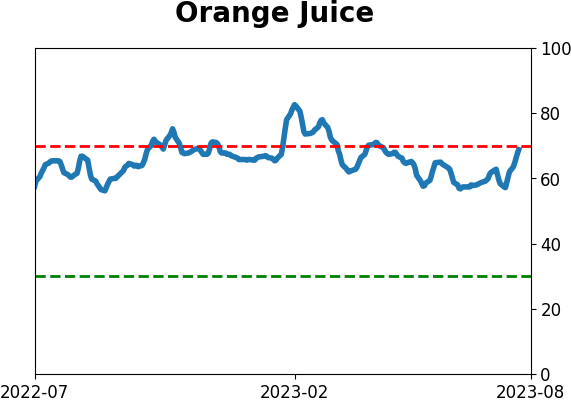
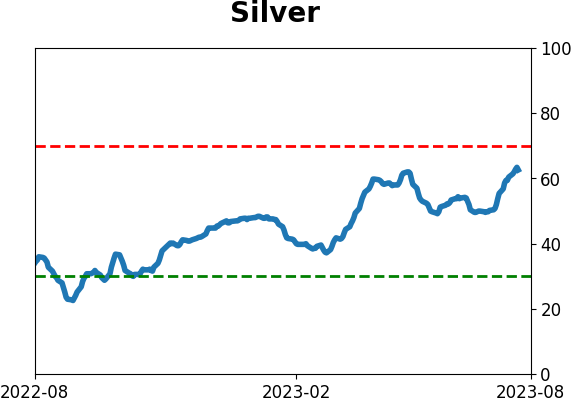
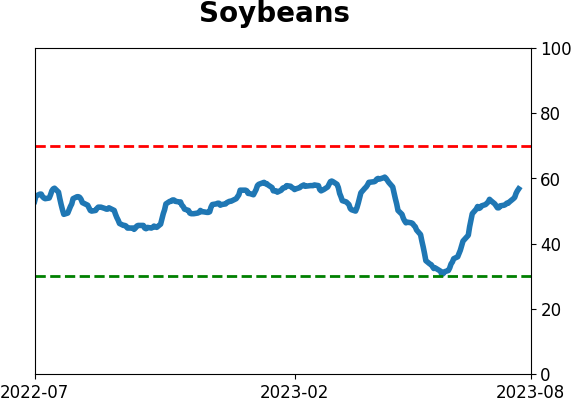
Optimism Index Thumbnails
|
|
|
|
|
|
|
|
|
|
|
|
|
|
|
|
|
|
|
|
|