Headlines
|
|
Consumers show historic disdain for the stock market:
The latest Conference Board survey showed a drop in the percentage of consumers who expect stocks to rise over the next year. There was a sharp increase in those who expect stocks to fall, pushing the spread to one of the widest in history. Stocks rose in the months following similarly poor sentiment.
|
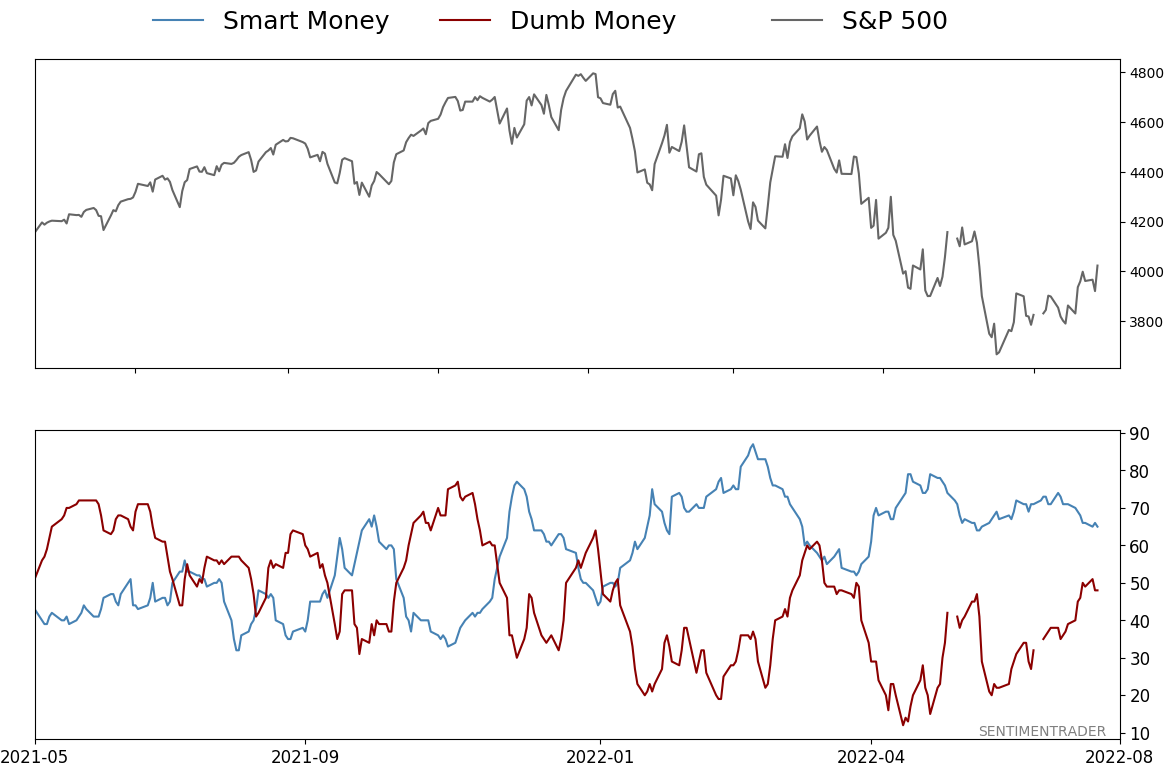
Smart / Dumb Money Confidence
|
Smart Money Confidence: 65%
Dumb Money Confidence: 48%
|
|
Risk Levels
Stocks Short-Term
|
Stocks Medium-Term

|
|
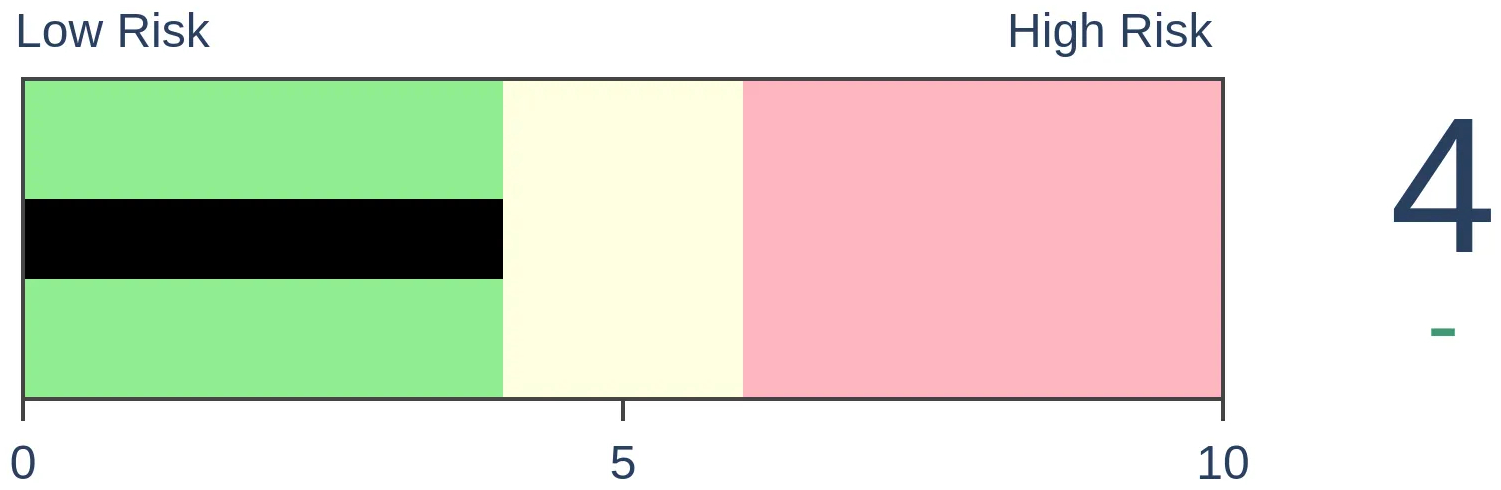
Bonds
|
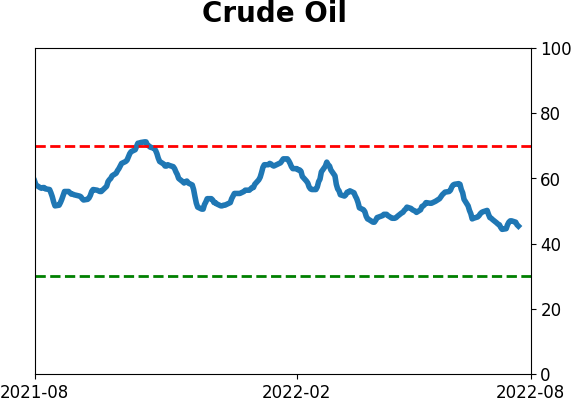
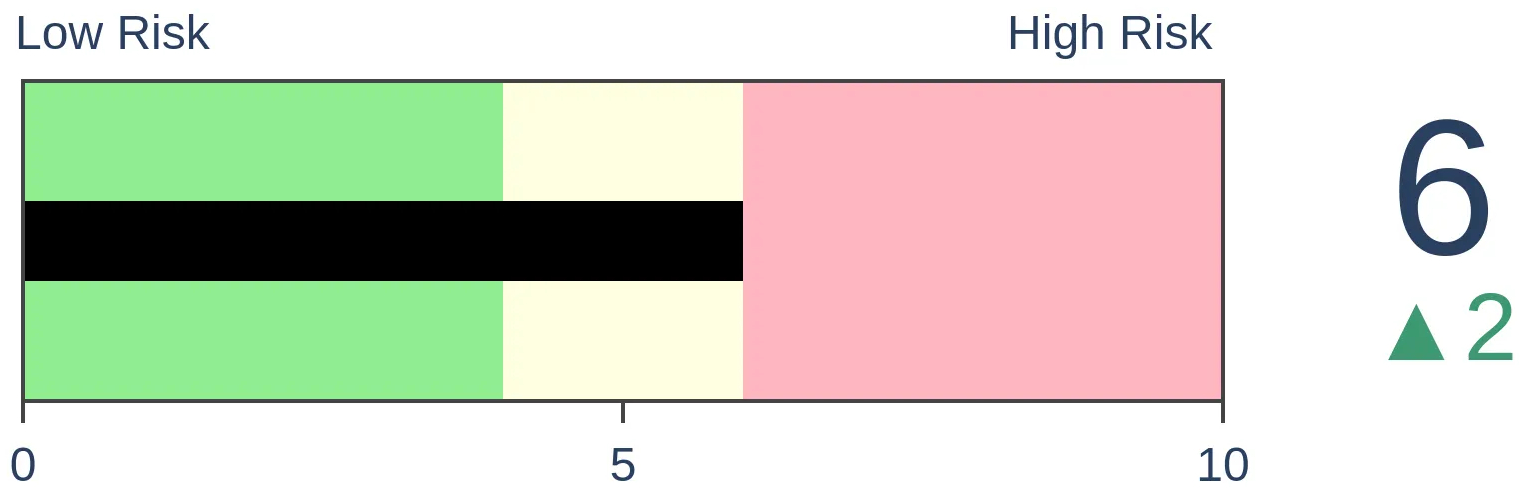
Crude Oil
|
|
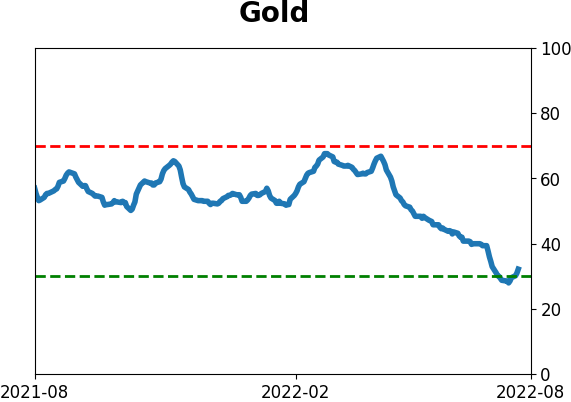
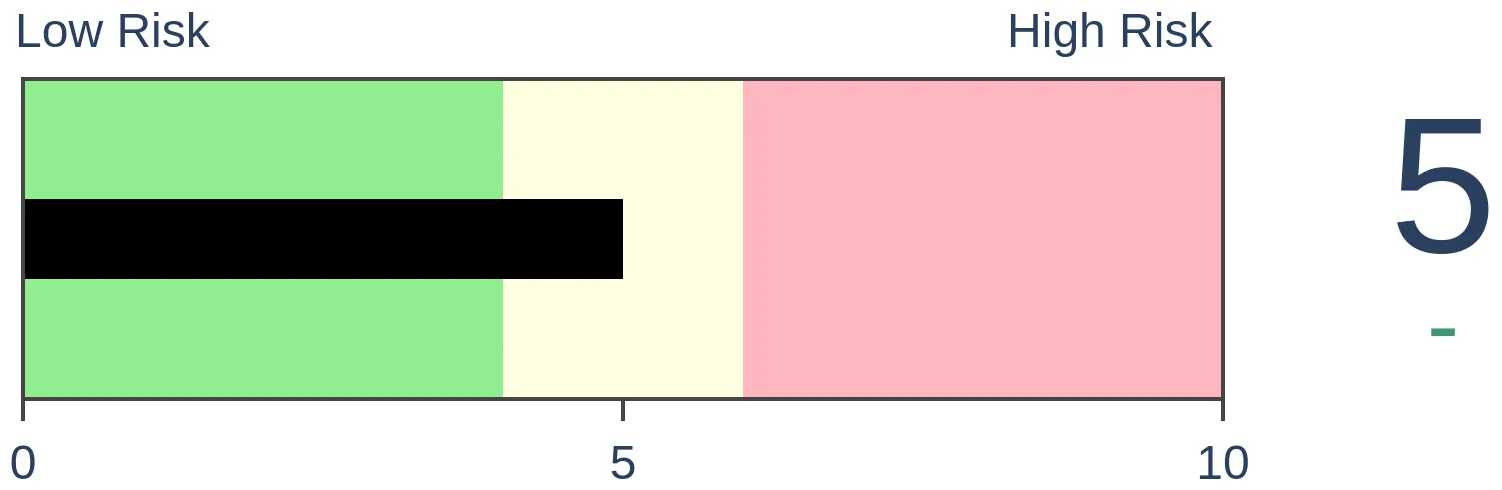
Gold
|
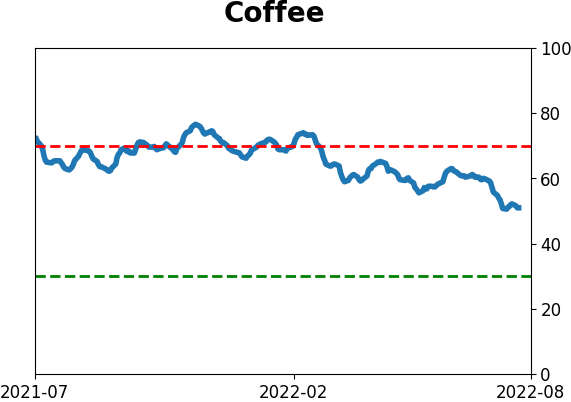
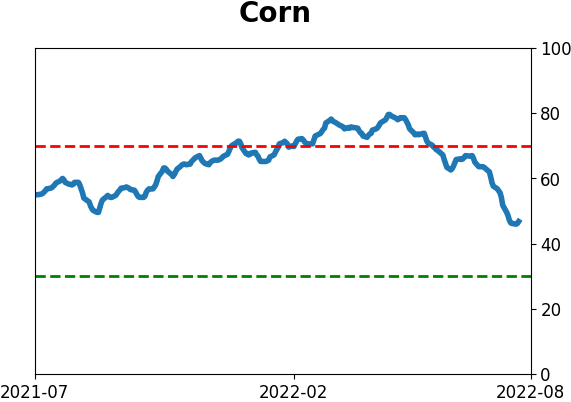
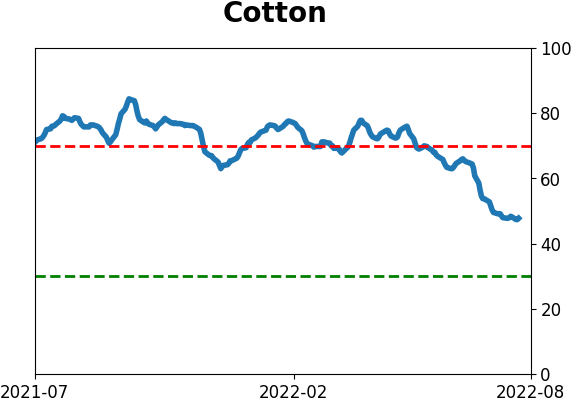
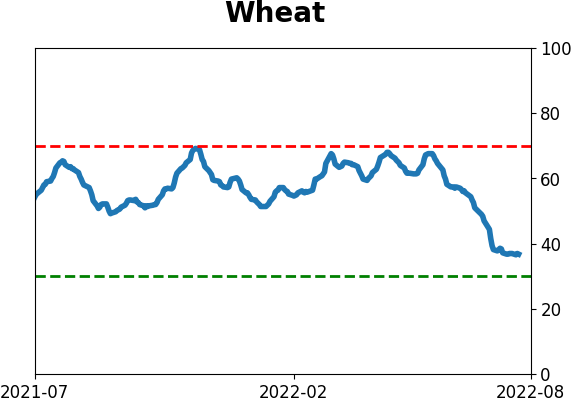
Agriculture

|
|
Research
By Jason Goepfert
BOTTOM LINE
The latest Conference Board survey showed a drop in the percentage of consumers who expect stocks to rise over the next year. There was a sharp increase in those who expect stocks to fall, pushing the spread to one of the widest in history. Stocks rose in the months following similarly poor sentiment.
FORECAST / TIMEFRAME
None
|
Key points:
- Among general U.S. households, there is a deep sense of doom toward the stock market
- There is currently one of the largest-ever spreads between consumers who think stocks will rise vs. fall
- Similar readings preceded gains for stocks, though a better risk/reward setup was waiting for a turn in sentiment
Consumers aggressively bet against the stock market
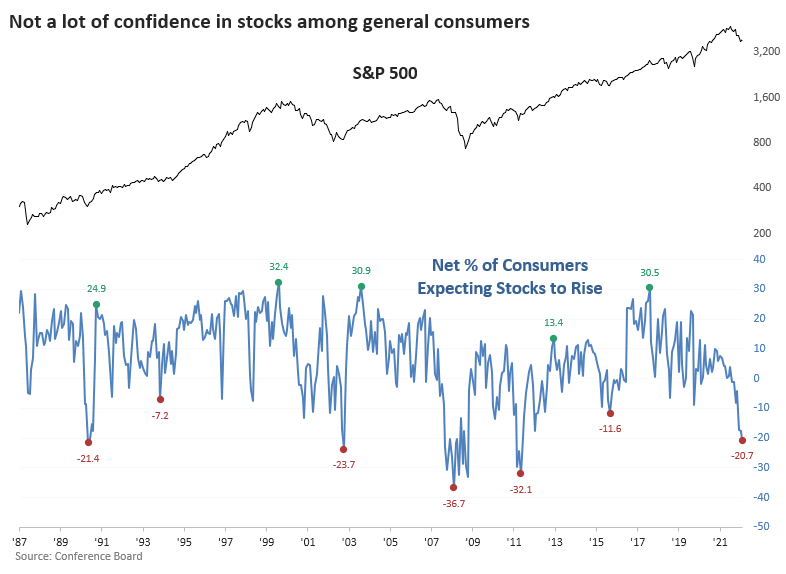
Investors have been downbeat about the prospects for stocks for months. What began as uncertainty led to pessimism and turned into outright disdain.
That sentiment started among the most speculative traders and bled into the sentiment among broader investors. Now, it has morphed into an almost apocalyptic sense of doom about the stock market among general U.S. consumers.
The latest survey of households by the Conference Board showed that only 25% of consumers expect stock prices to rise over the next twelve months. That reading is in the bottom 5% of all months since 1987. At the same time, a whopping 46% of consumers expect stocks to drop, ranking in the top 3% of all months since '87.
The difference between bulls and bears has plunged to -21%, one of the worst readings in the survey's history.
Deep pessimism (mostly) fuels good returns
When consumers first get the impression that it's a good idea to actively bet against stocks, they're typically very wrong. Even during the financial crisis - when they were ultimately proven very right - the S&P 500 rallied more than 5% over the next three months.
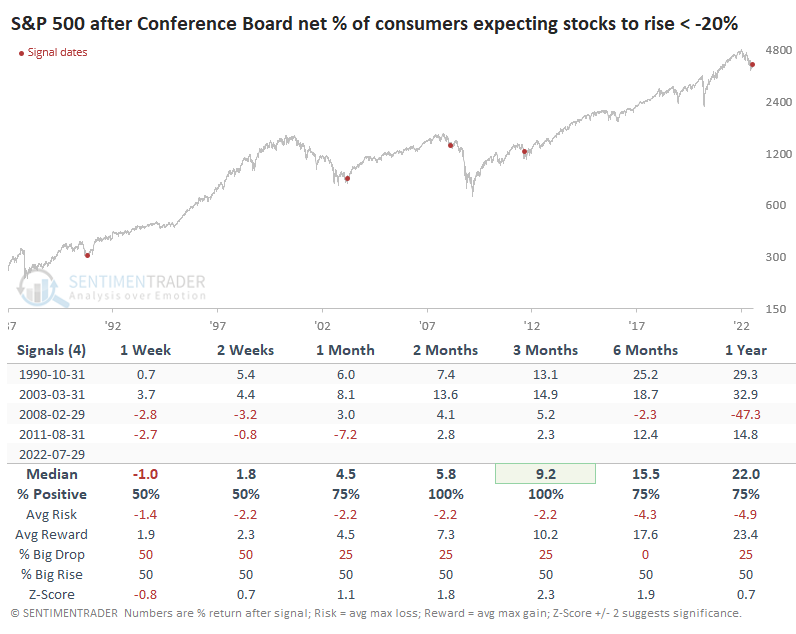
That February/March 2008 period has shown up in many of our recent studies. Even during some of the worst bear markets, the level of pessimism witnessed lately has almost always preceded at least a multi-month relief rally.
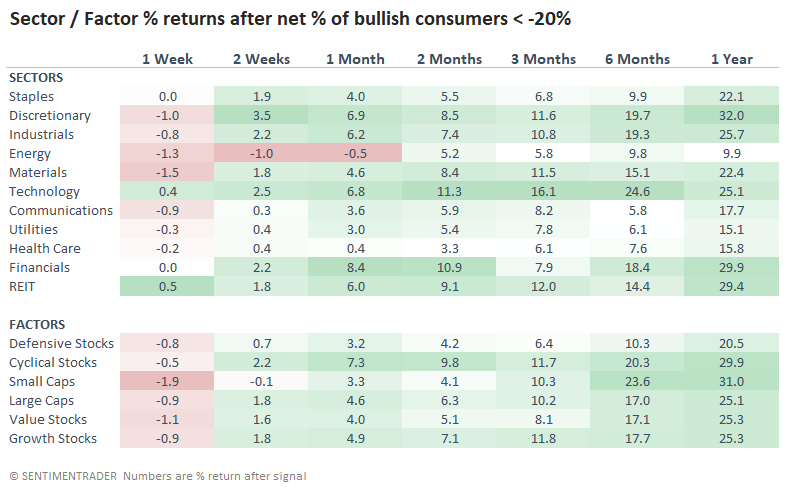
Among sectors and factors, Technology enjoyed the highest average returns over the medium-term. The usual cohorts like Industrials and Discretionary also showed strong results.
The sticking point for anyone looking at the above table, other than the tiny sample size, is the outlier during the financial crisis. Buying into deep pessimism looked good for a while, then suffered horrible losses.
As always, an investor has to balance risks. One can buy into an extreme, assuming that people will behave like they typically do, and markets will mean-revert. The risk is that some fundamental or structural force overwhelms that behavior, and things get really out of whack. An alternative is to get defensive, go to cash, and wait until the smoke clears. That usually avoids the worst drawdowns but also usually leads to smaller returns...and there's no guarantee the situation doesn't get worse after it gets better.
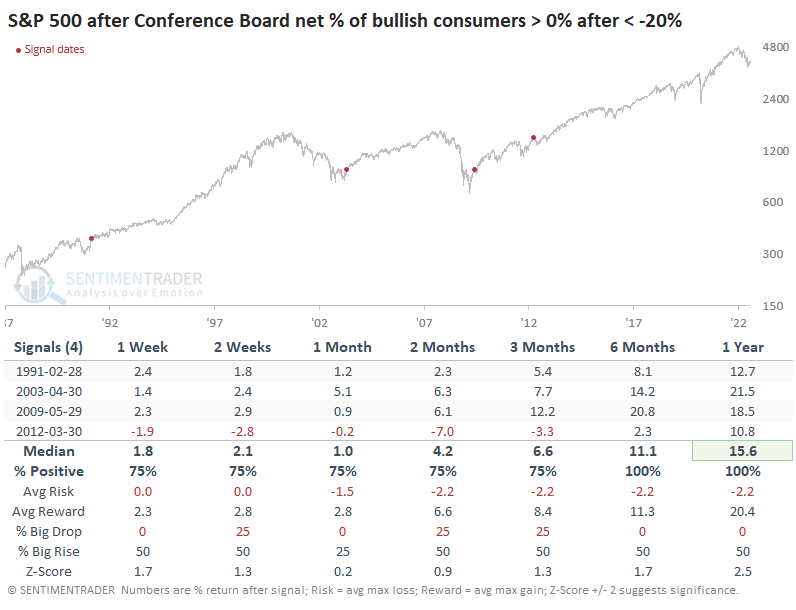
So, let's just wait until consumers get their bearings again. After more than a net 20% of them expect stocks to drop, we'll wait until more of them think stocks will rise than decline. If we do that, we sidestep the entirety of the financial crisis and still enjoy double-digit gains during the following year. We bought right at the peak before a painful correction in 2012, but otherwise, the gains were consistent and large.
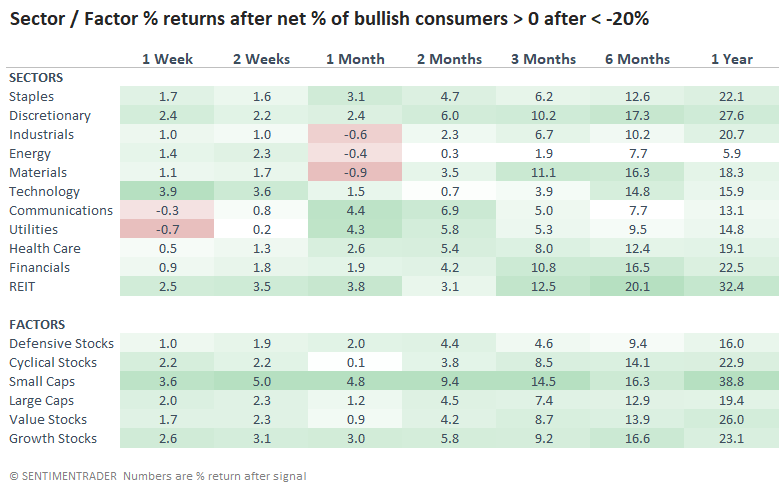
Among sectors and factors, this waiting strategy preceded some massive gains in Small-Caps, though overall sector returns were less than if we'd just bought on the first sign of deep pessimism.
What the research tells us...
There is no "right" way to invest. Every single one of us has a different financial situation, goals, risk tolerance, and all the rest. We can objectively look at reliable data and determine where the most significant risks and potential reward lies. When we do that with long-term sentiment data like the above, it's still unclear what the best likely outcome might be. Aggressive investors, or those with shorter time frames, have typically come out ahead by increasing exposure to stocks just as consumers give up as they just did. More conservative folks, or those with longer time frames, have usually given up some return but slept better at night by waiting until the mood of consumers turned optimistic again.
Indicators at Extremes
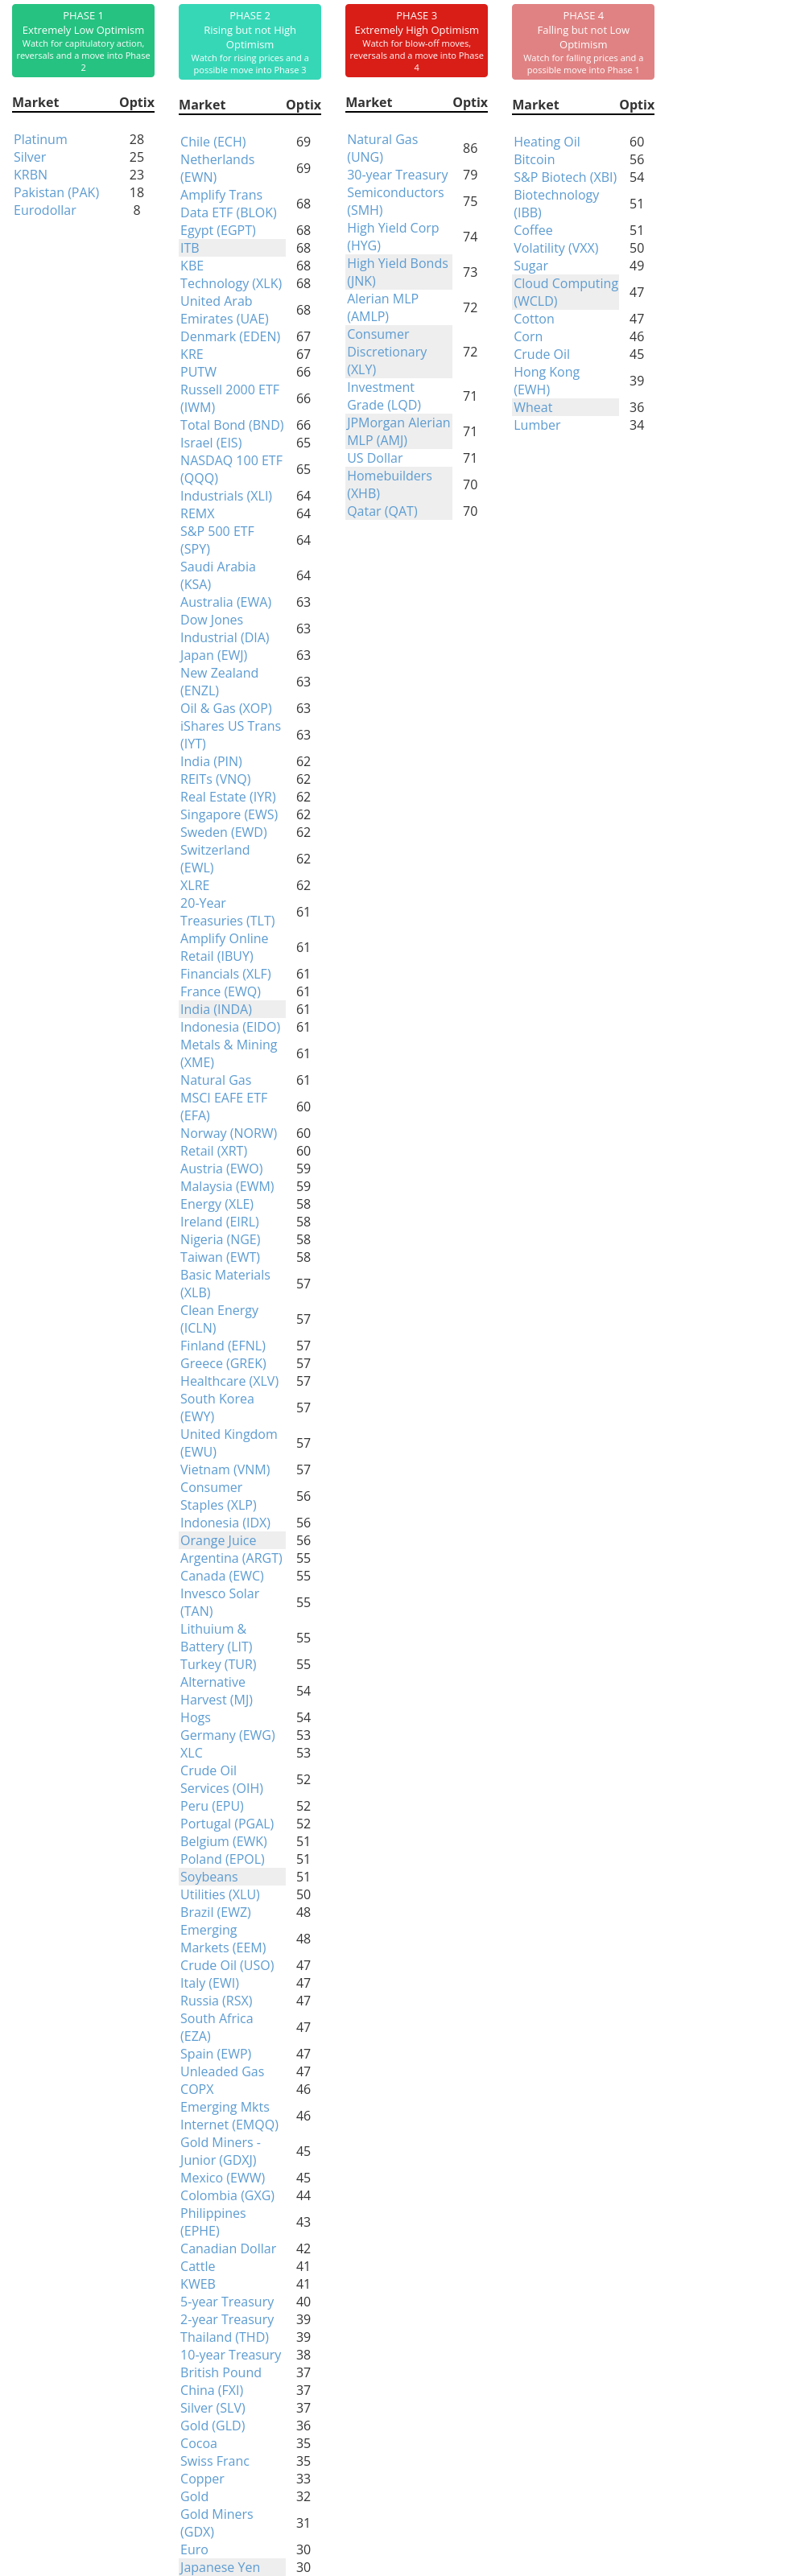
Phase Table
Ranks
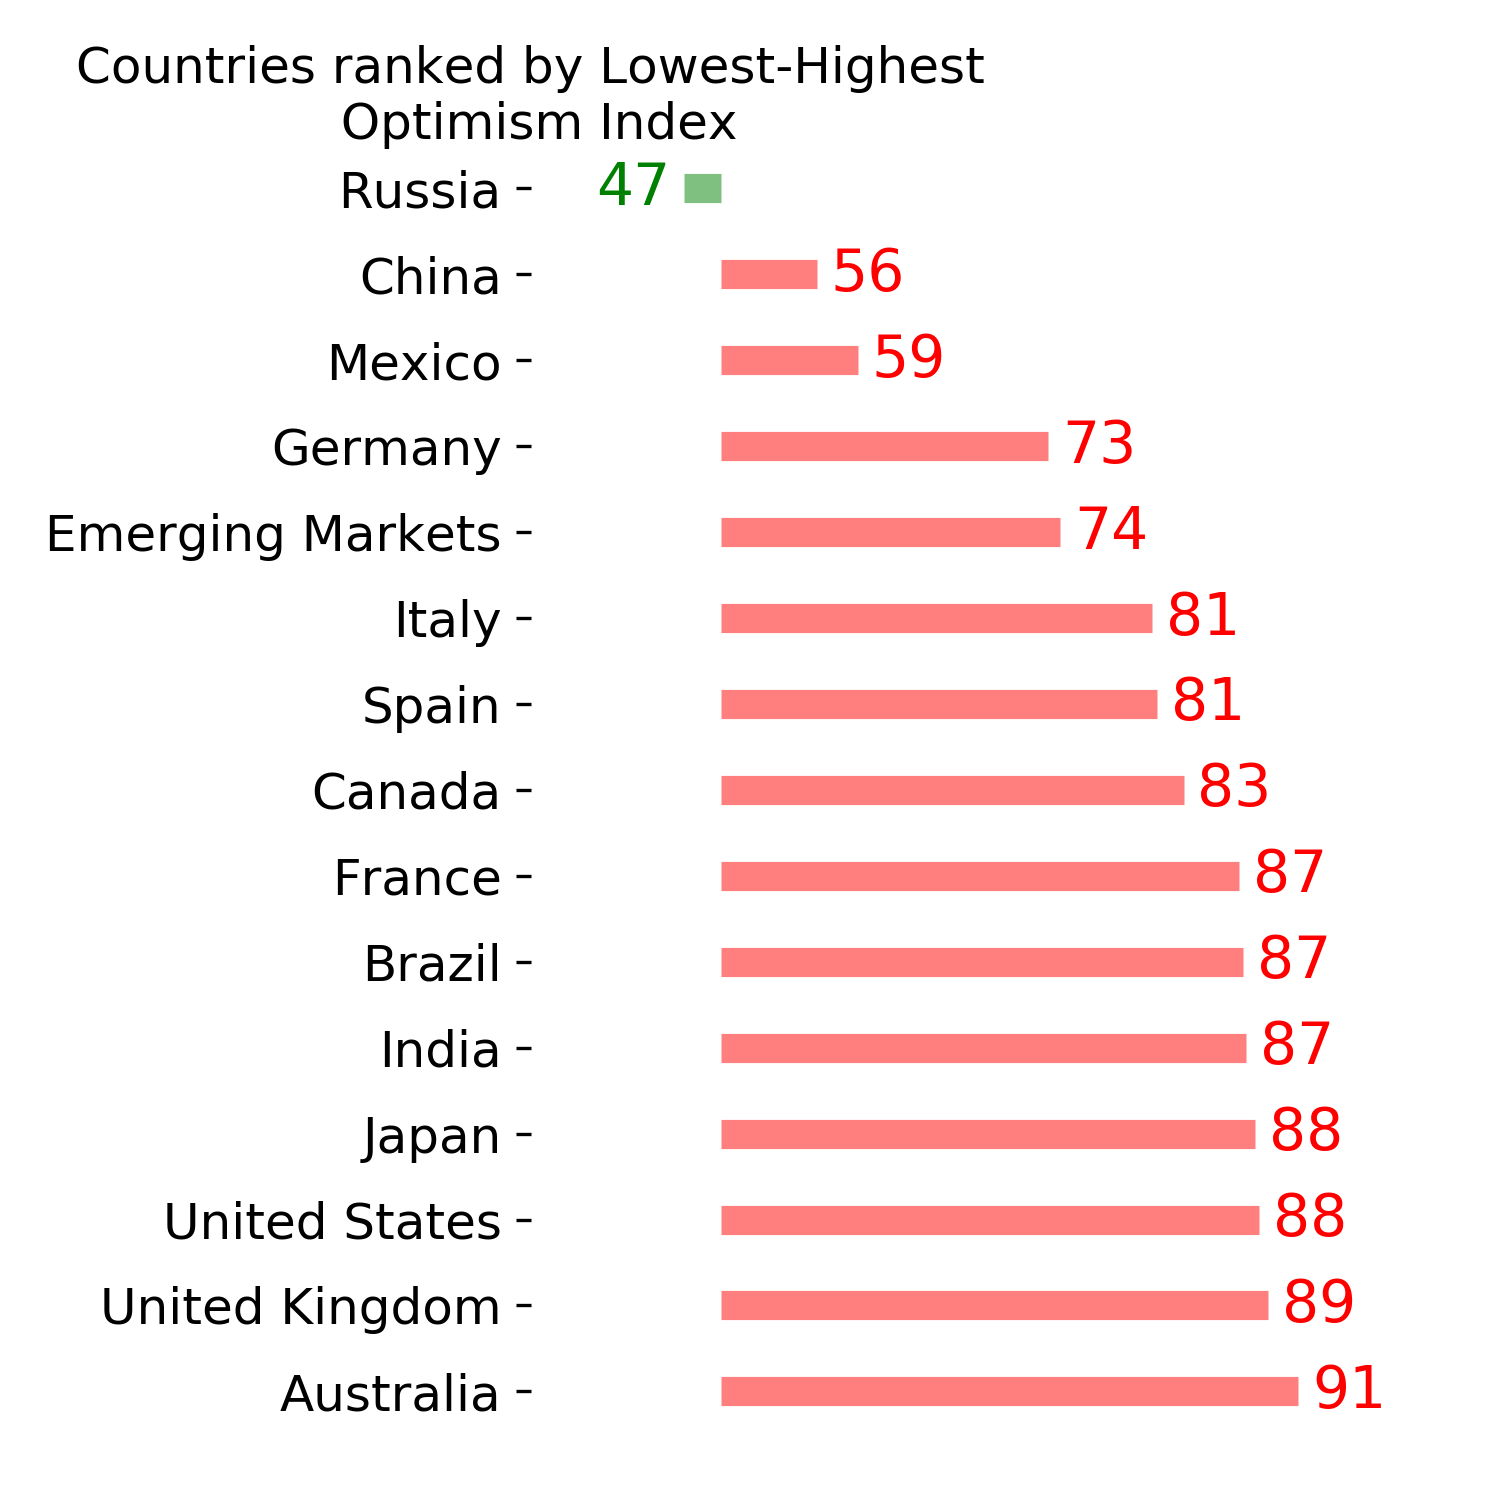
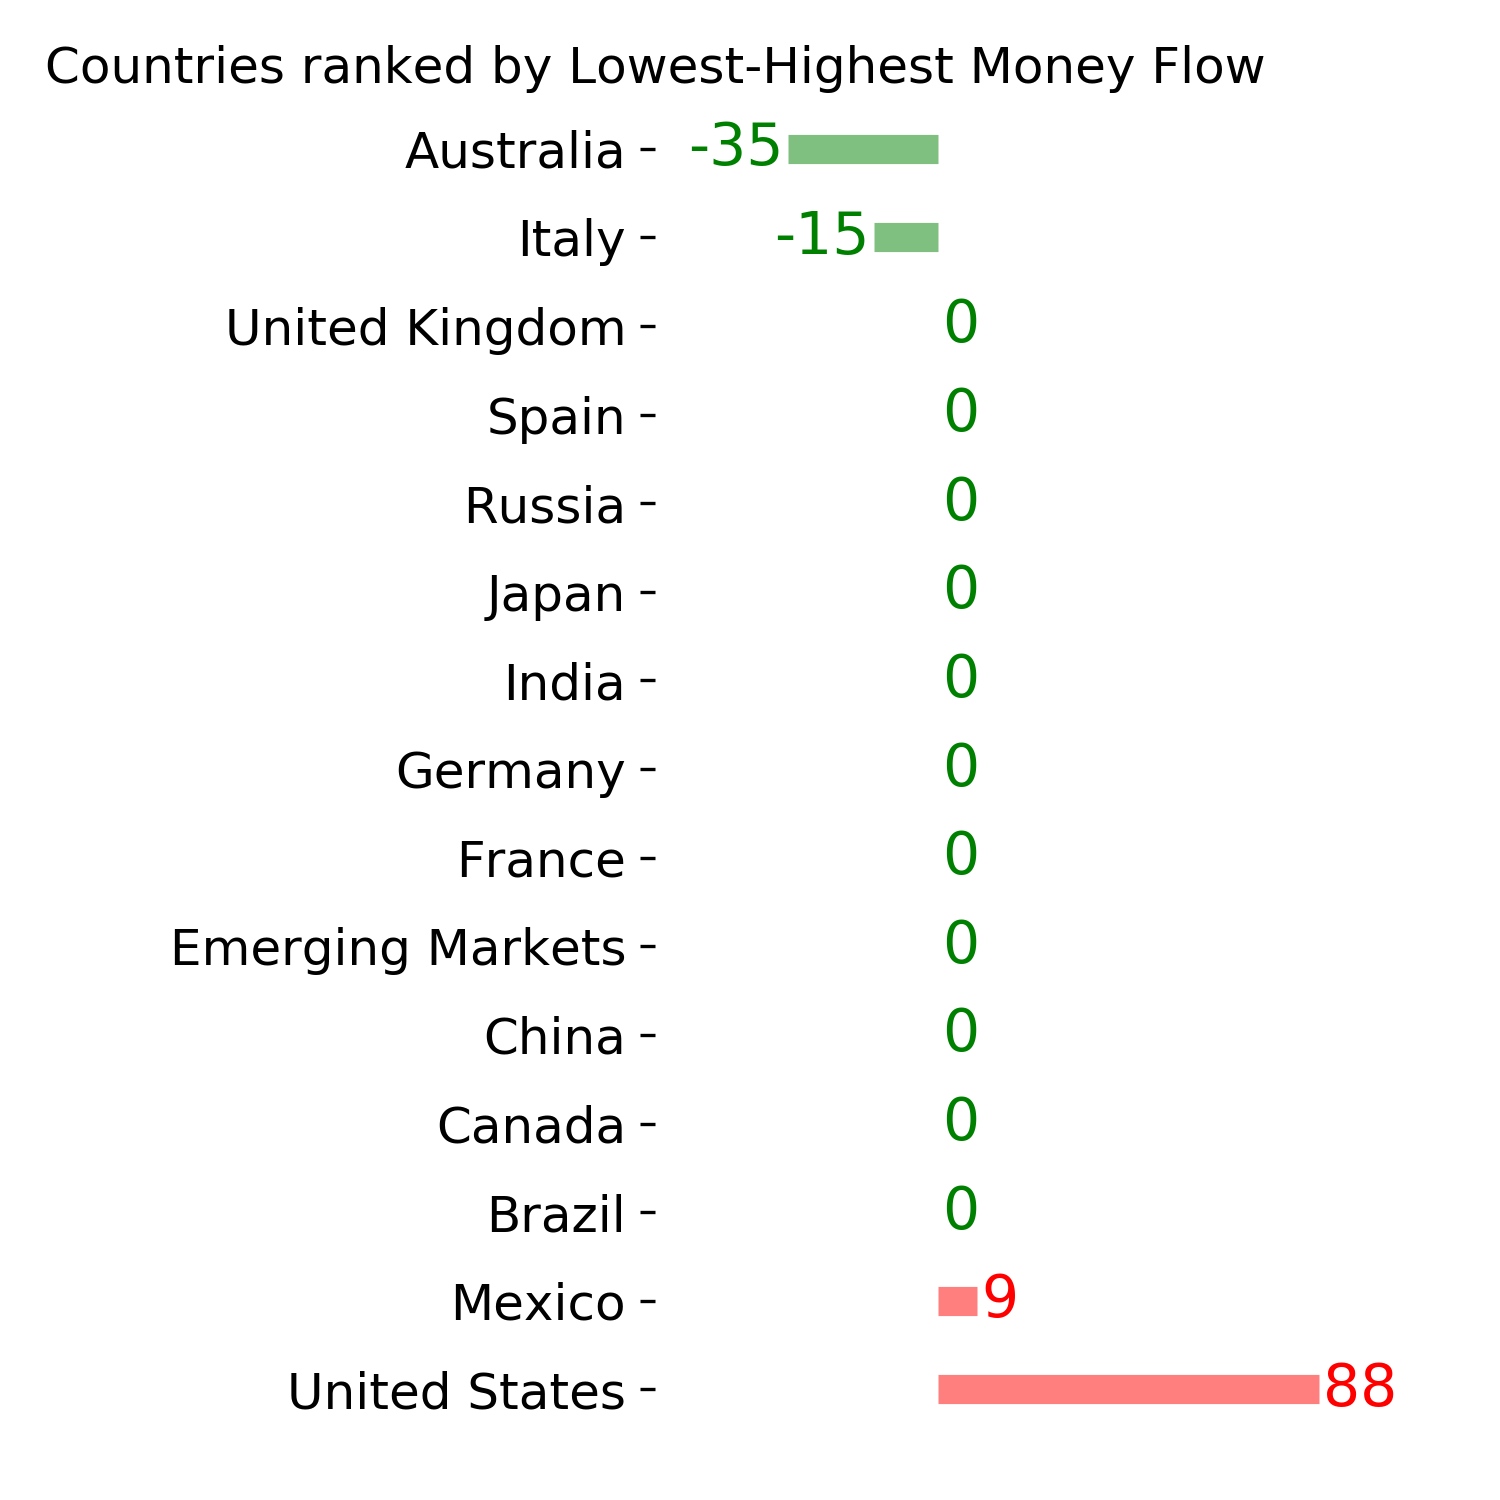
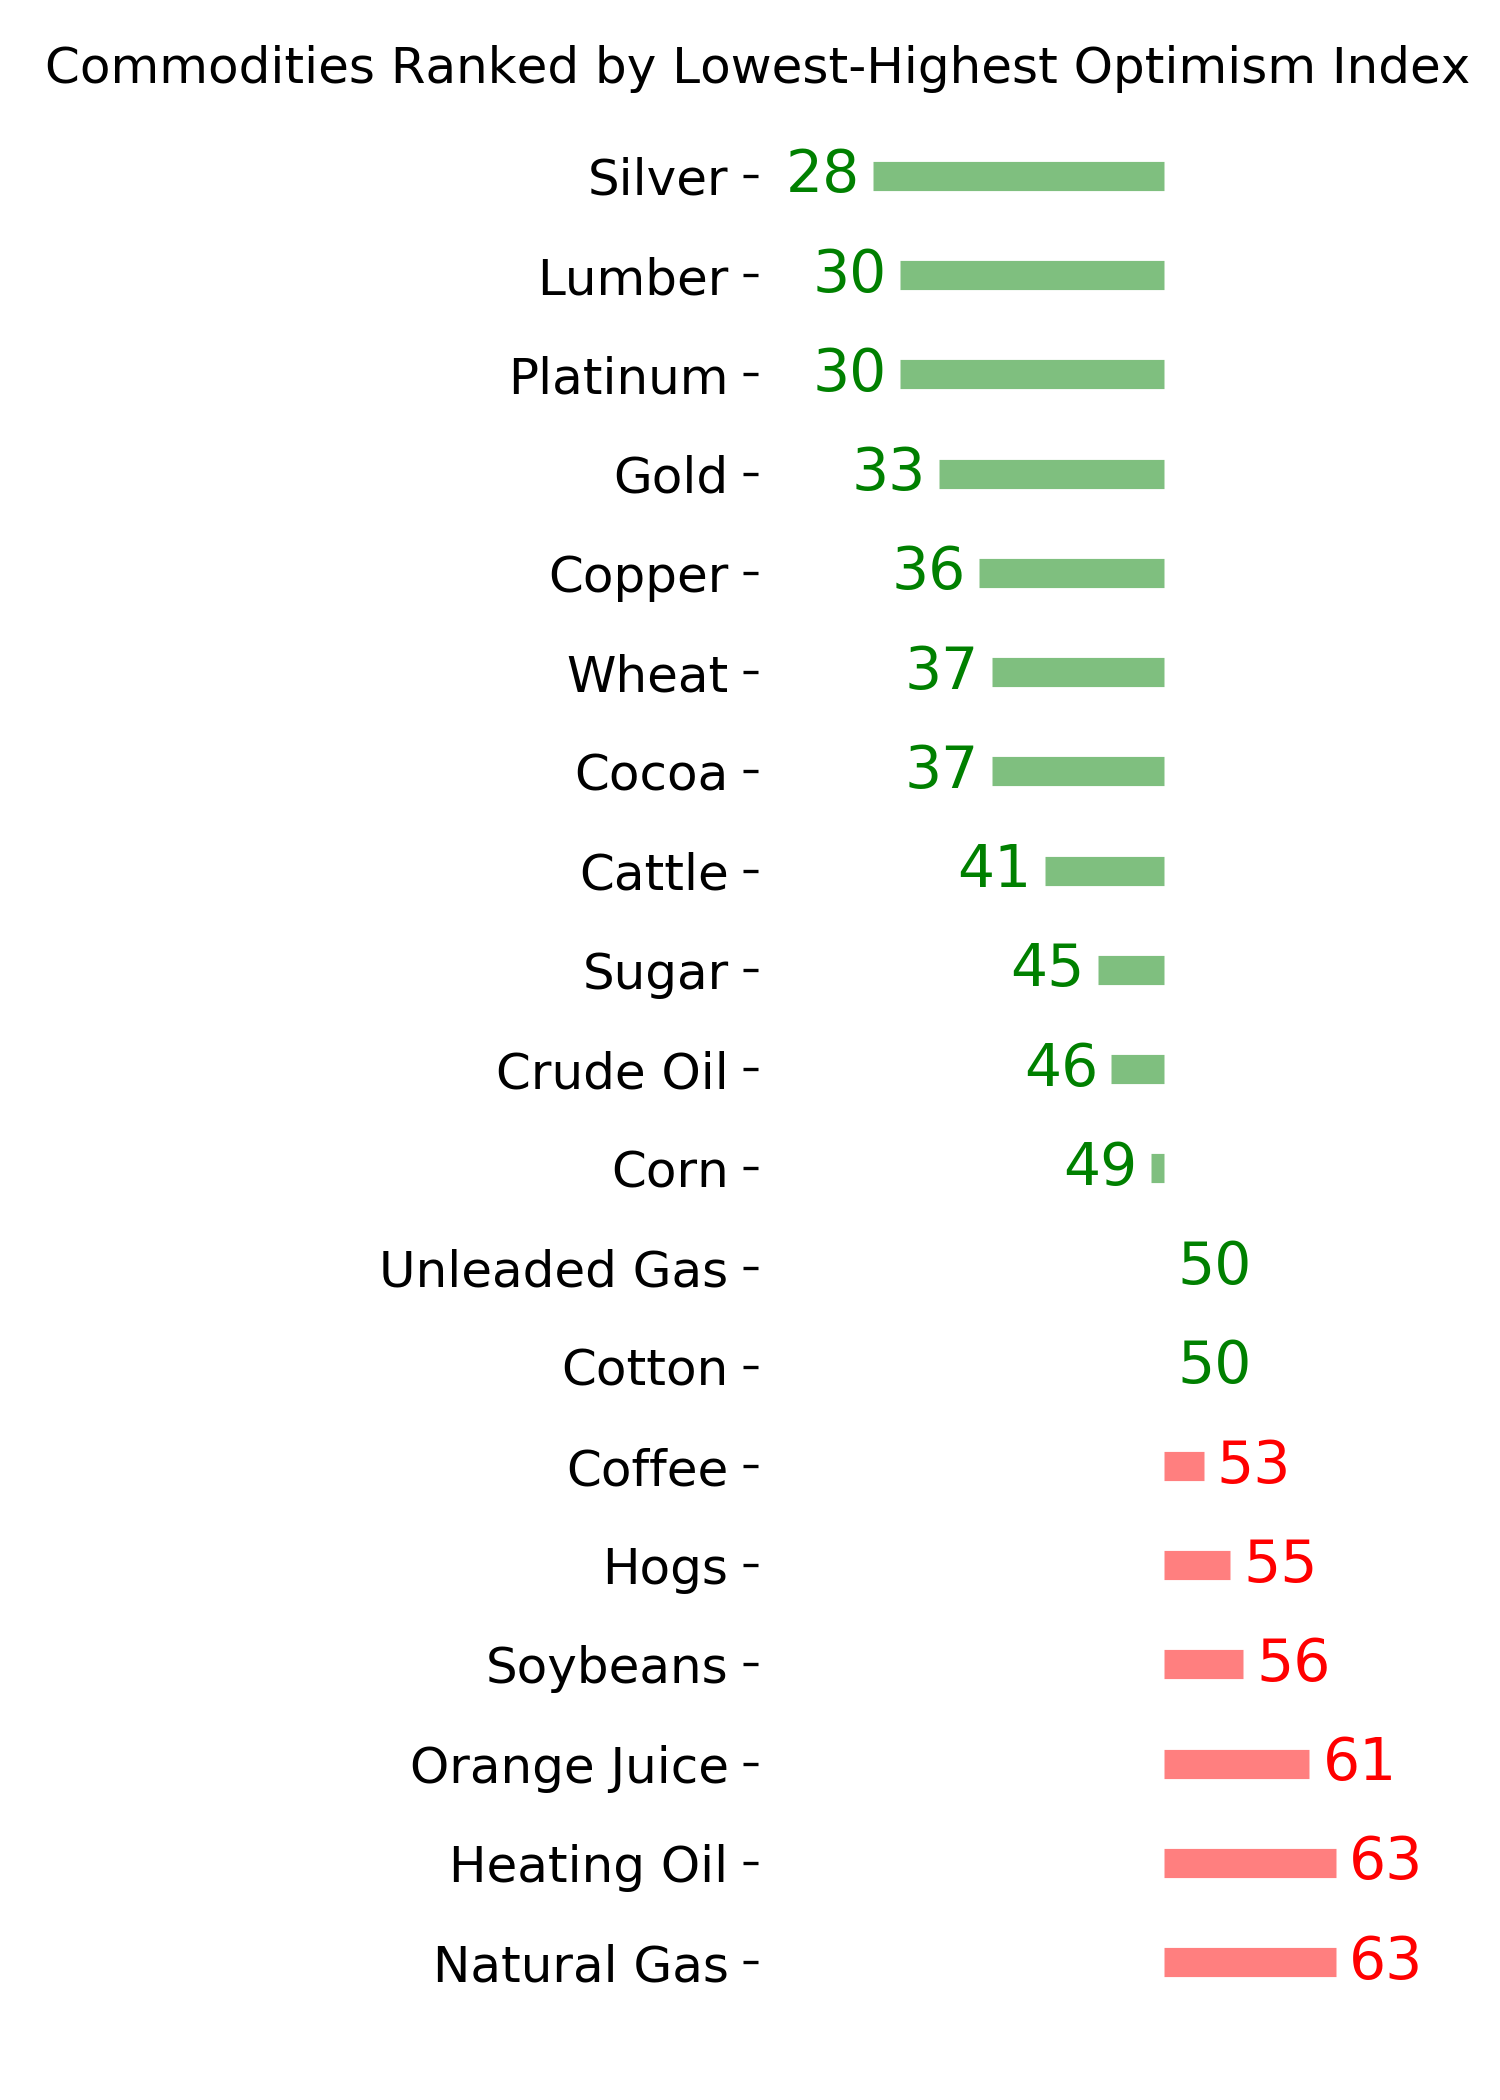
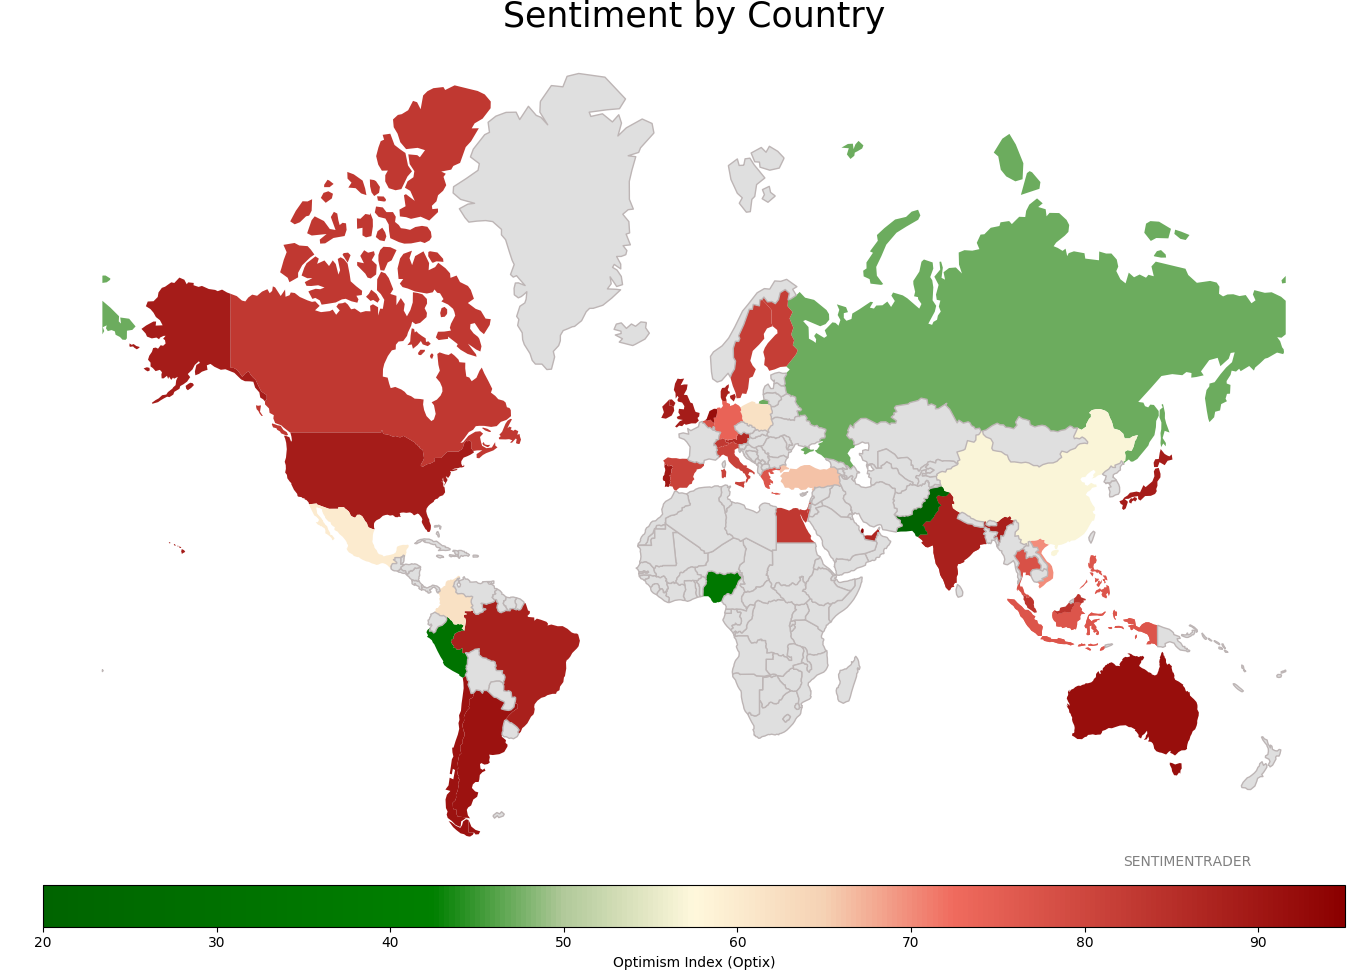
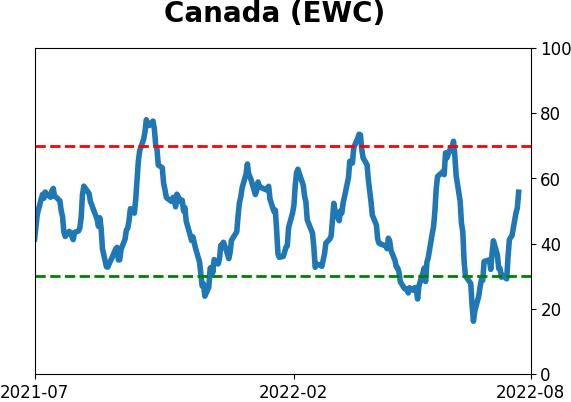
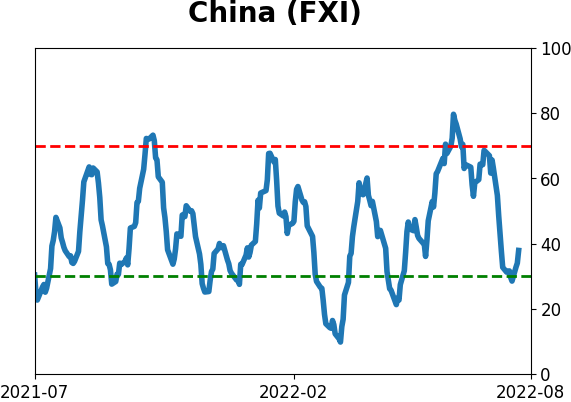
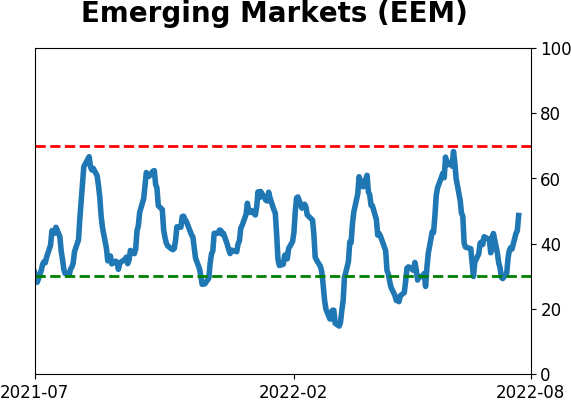
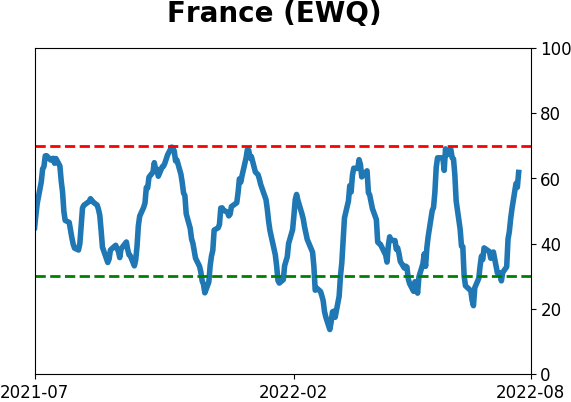
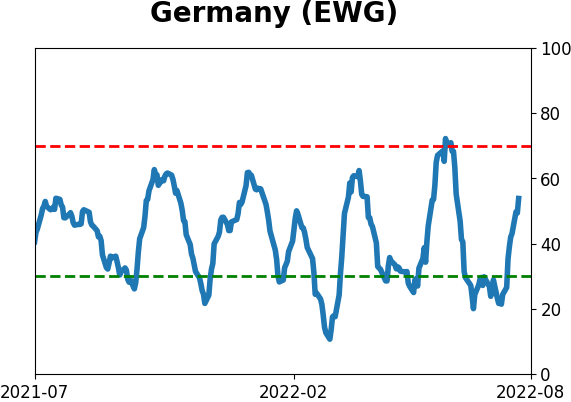
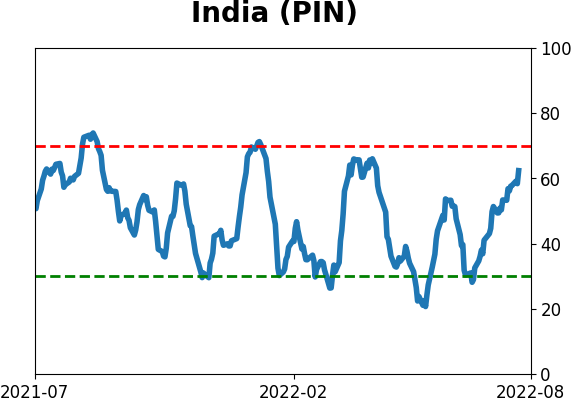
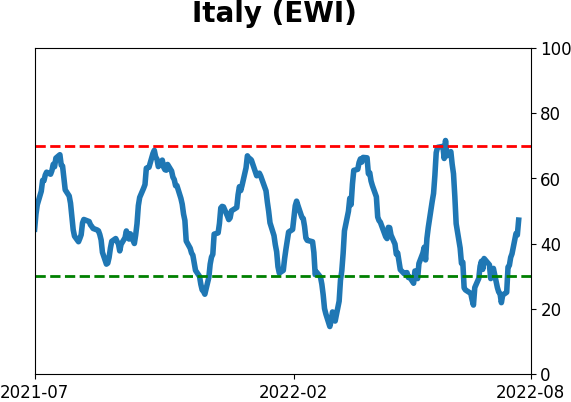
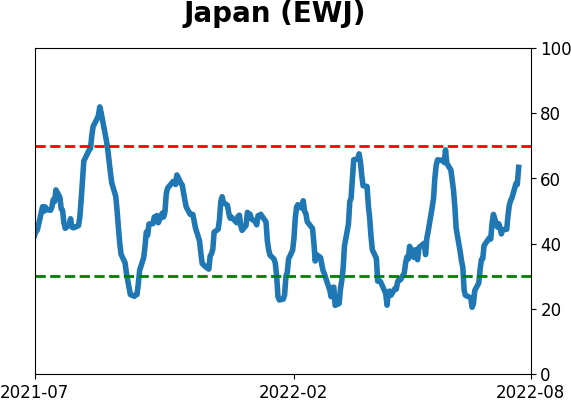
Sentiment Around The World
Optimism Index Thumbnails
|
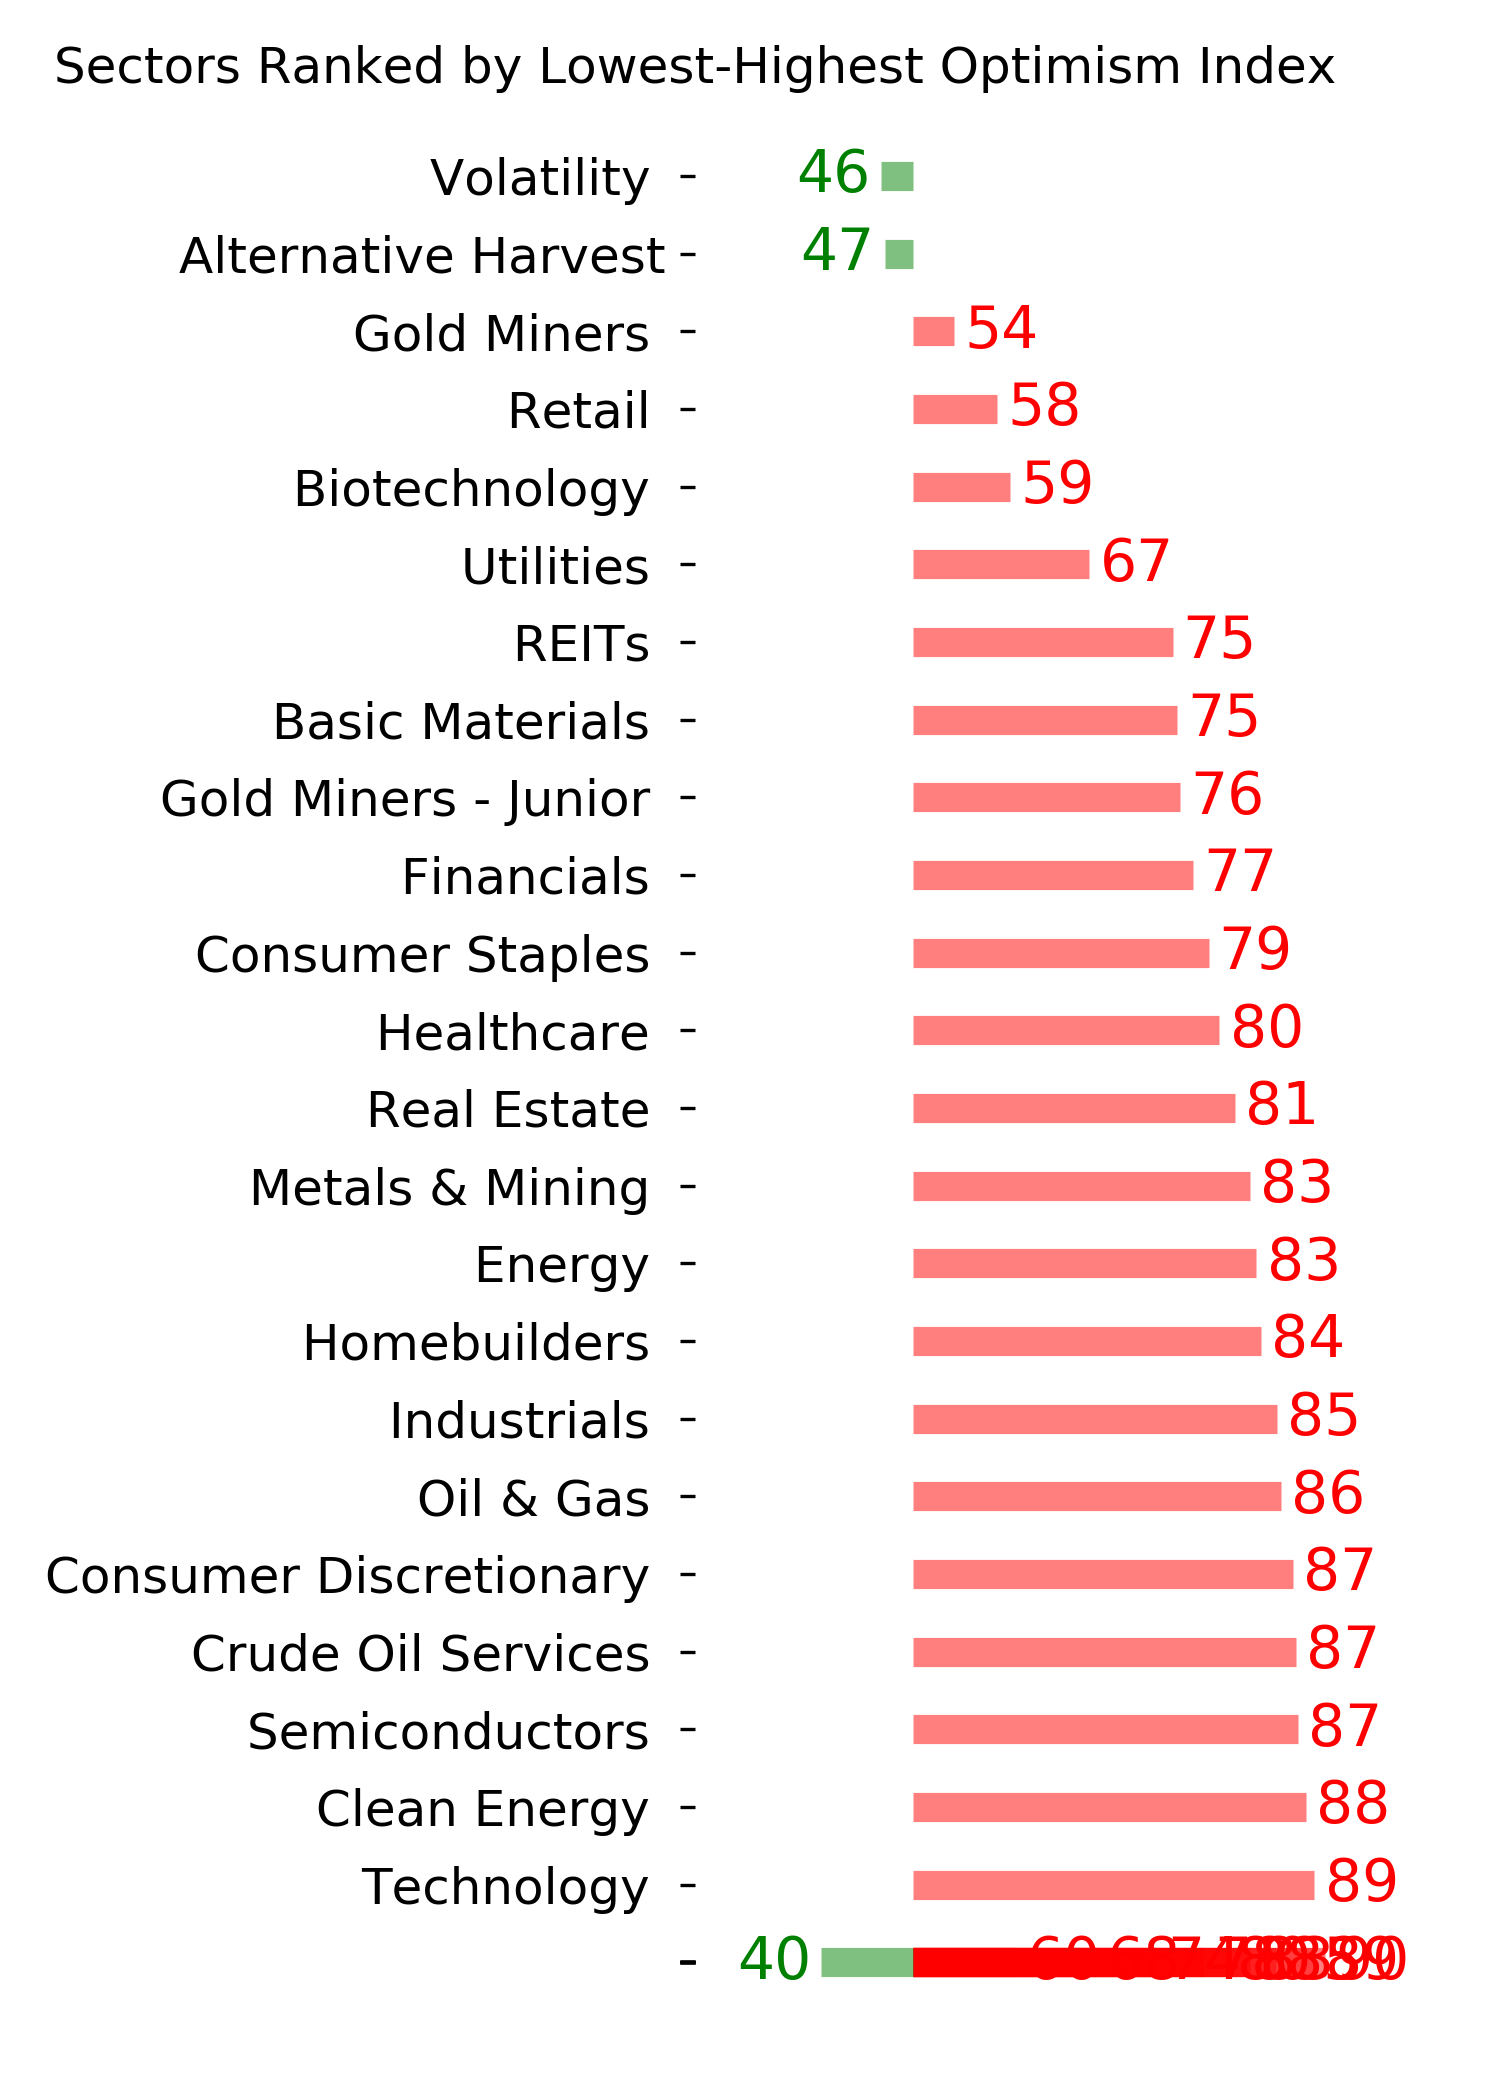
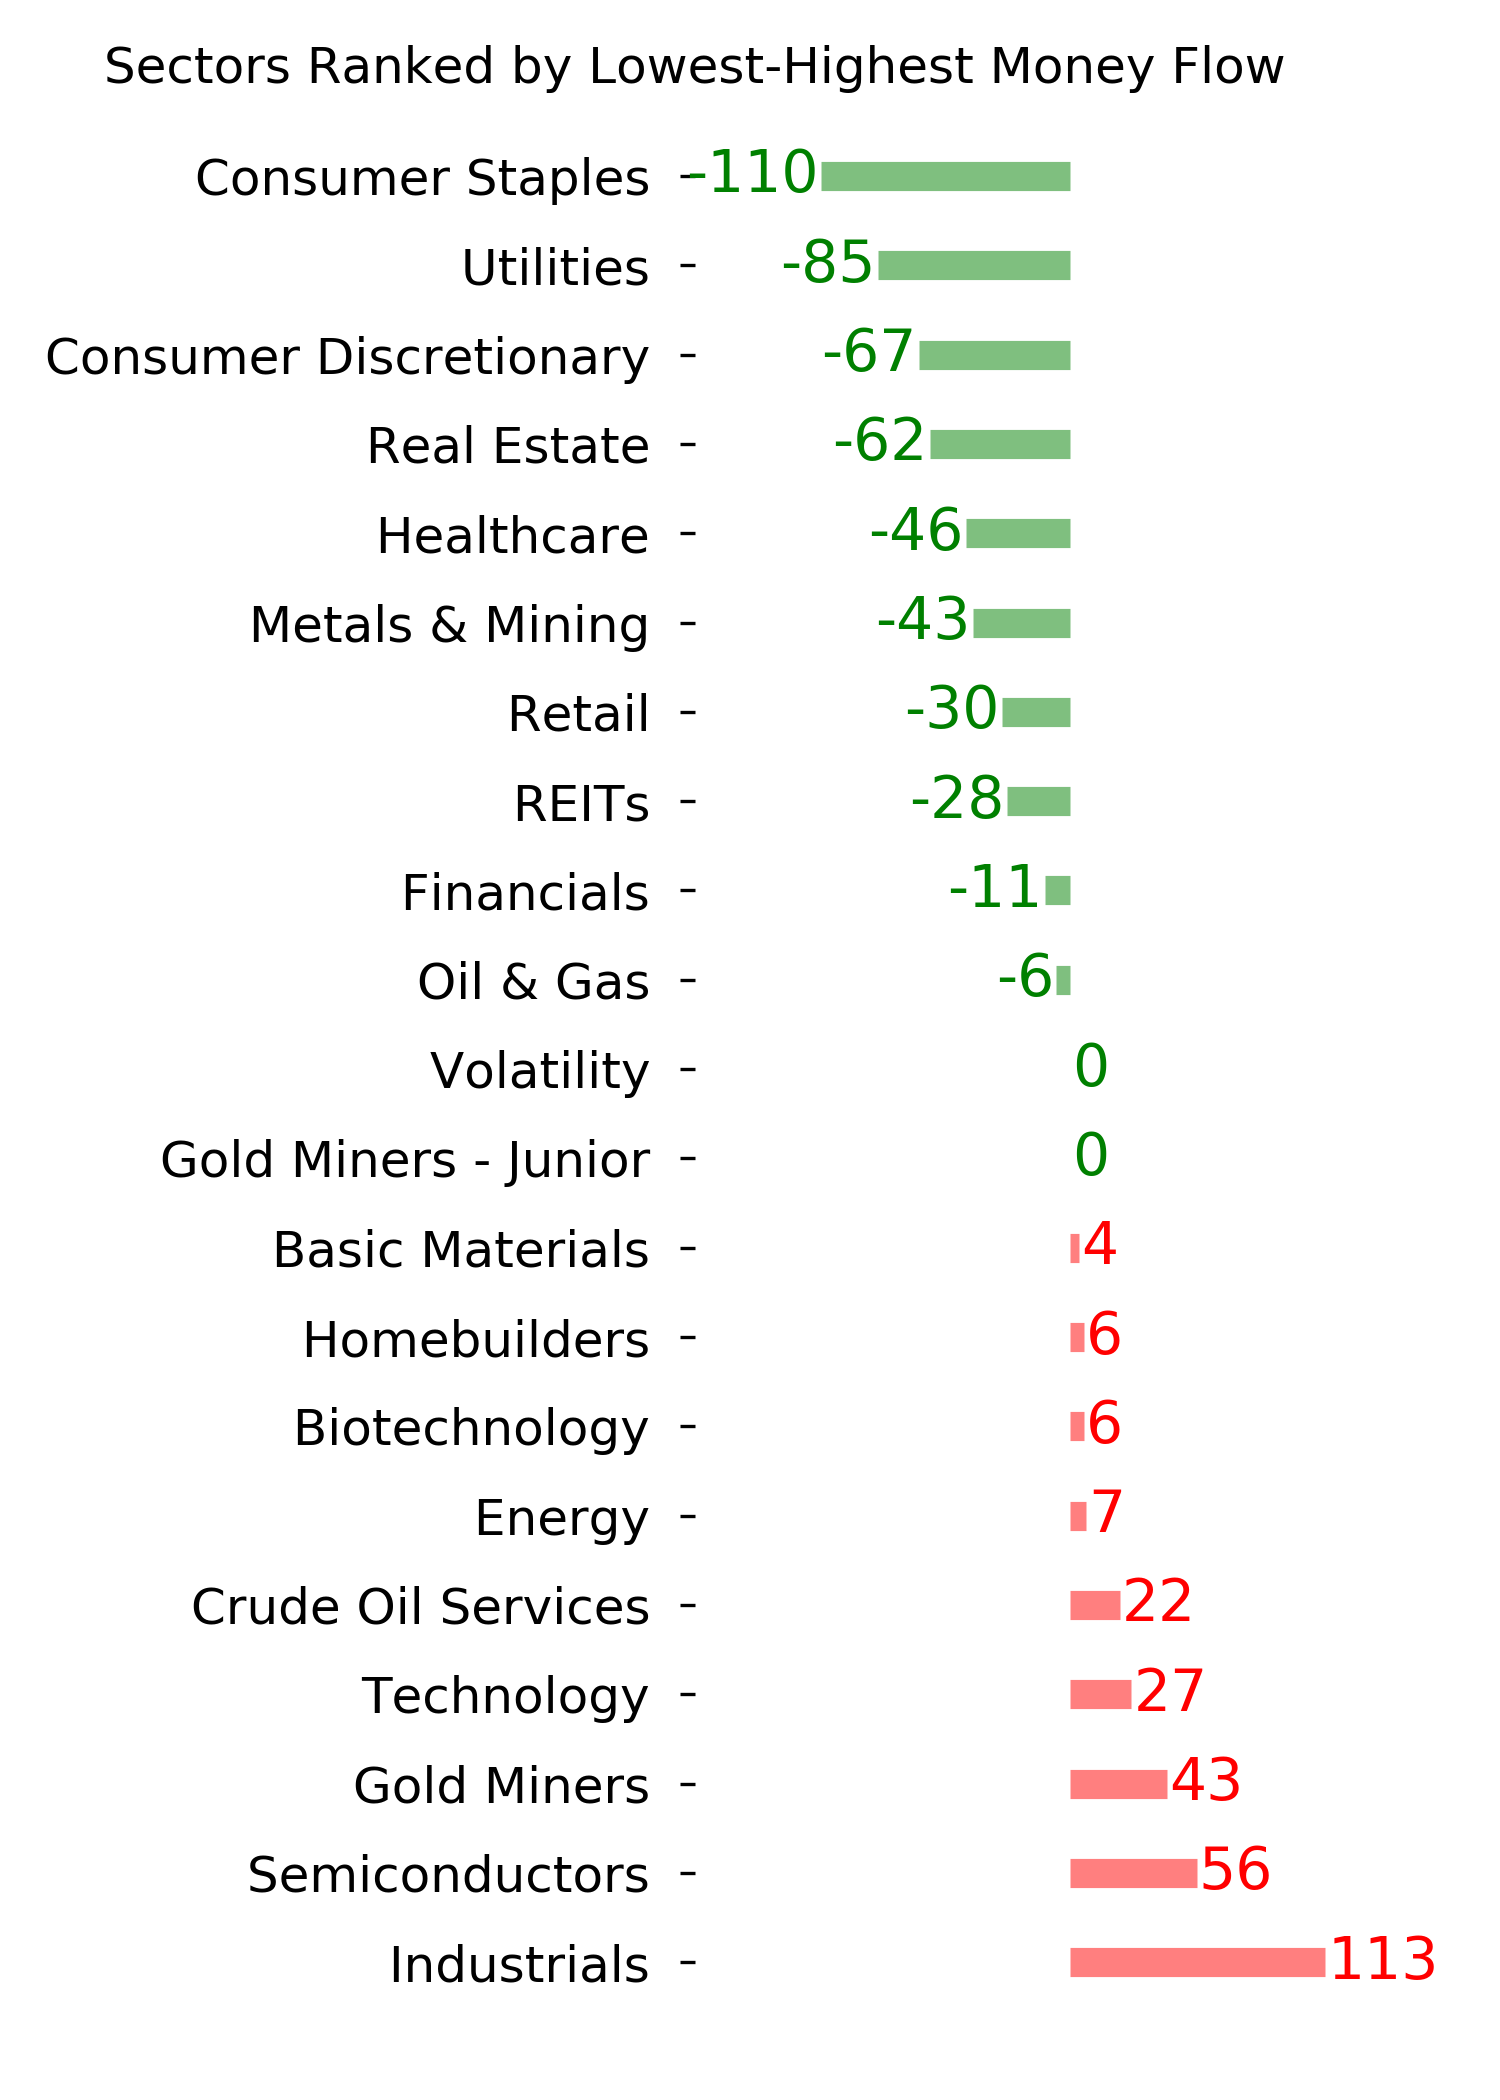
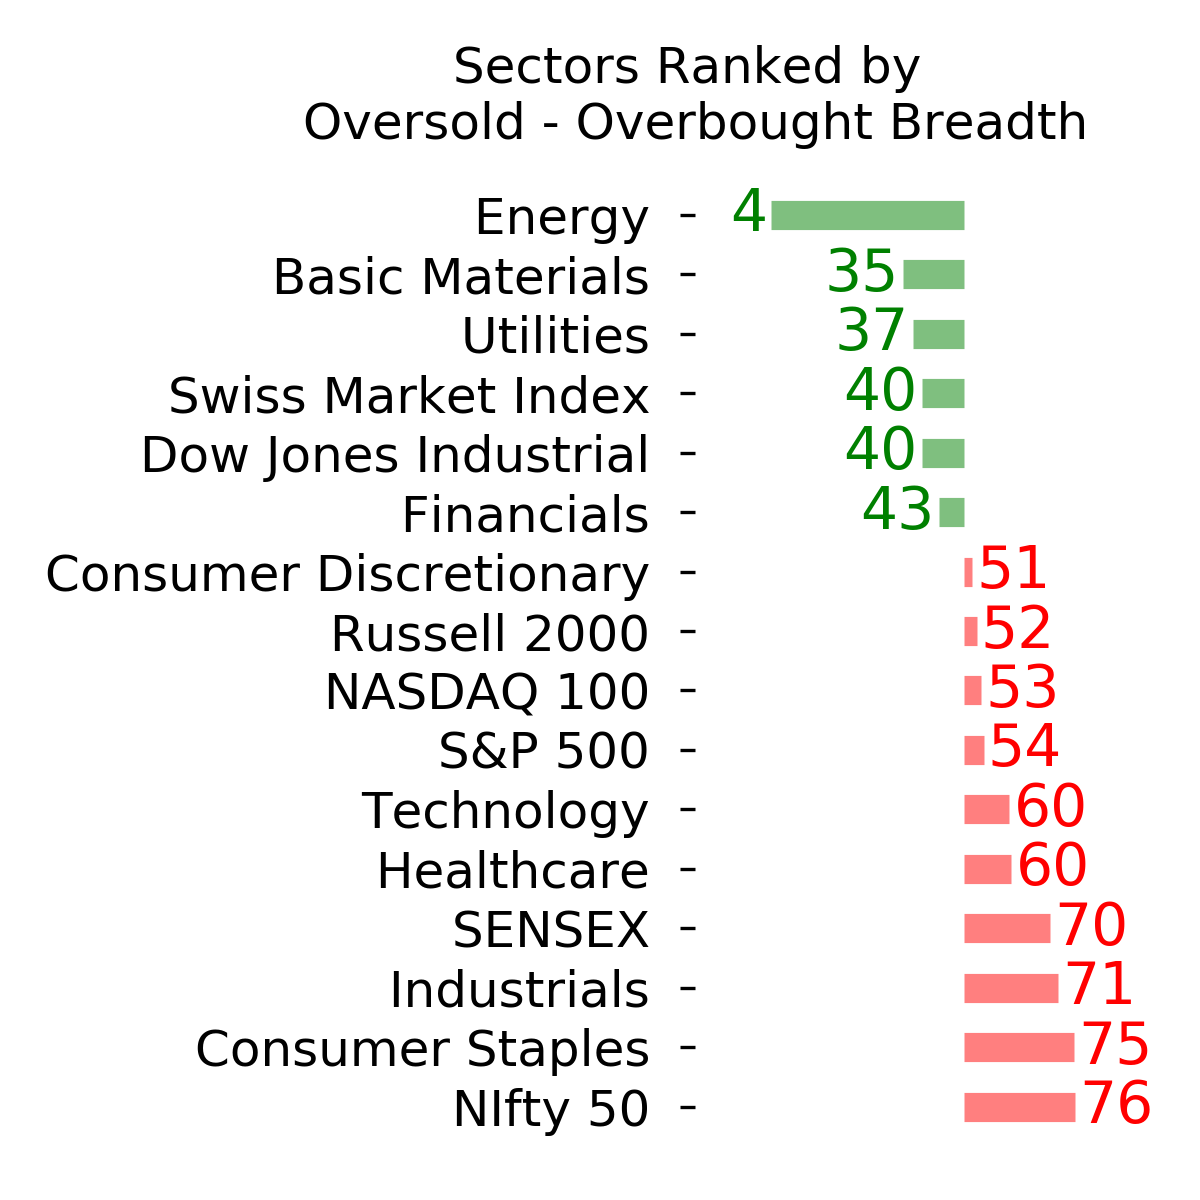
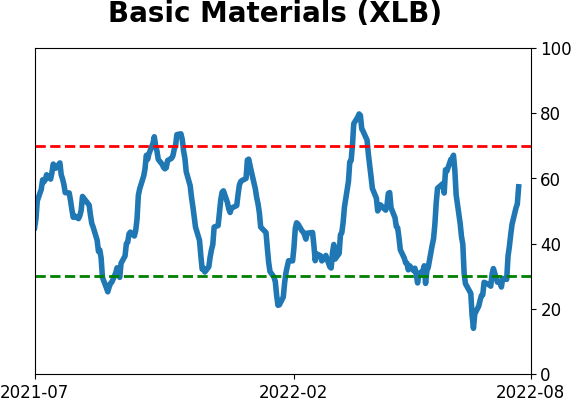
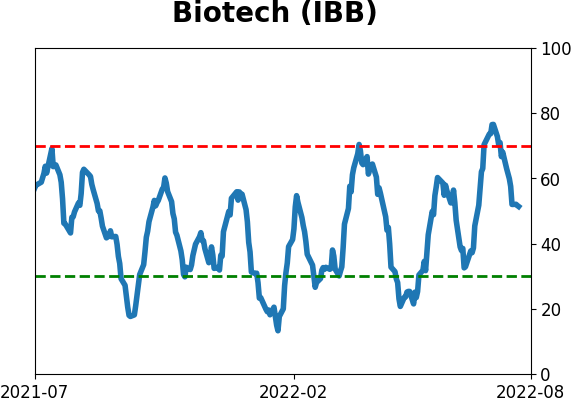
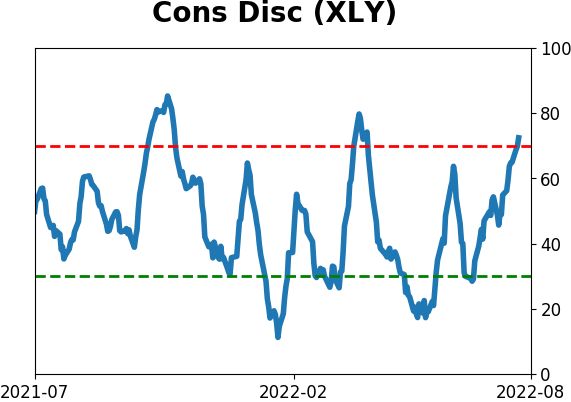
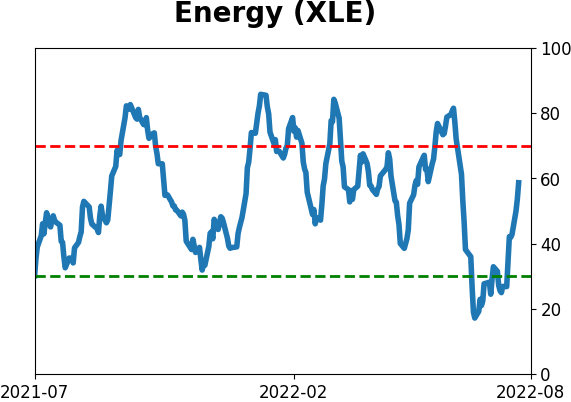
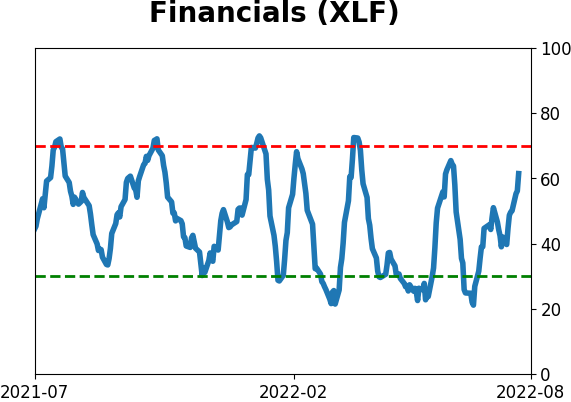
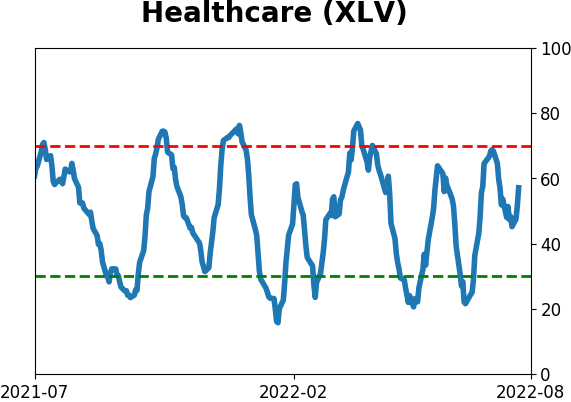
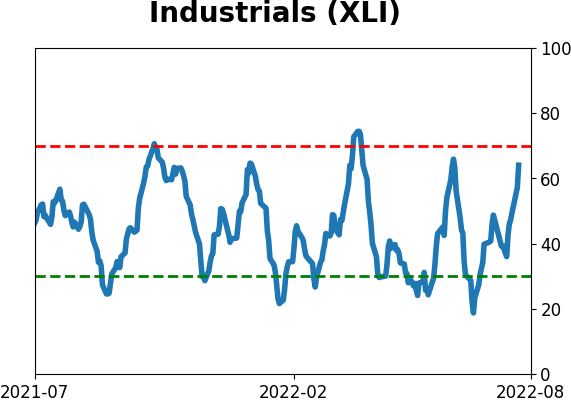
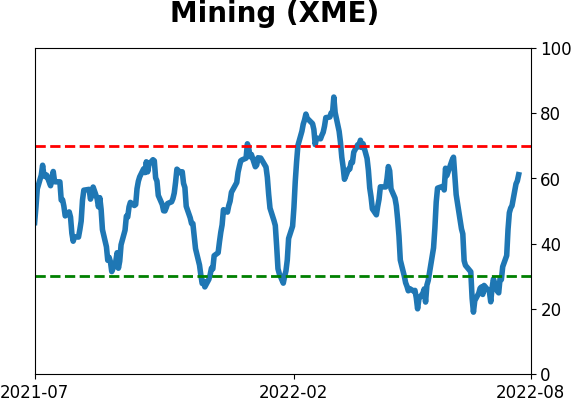
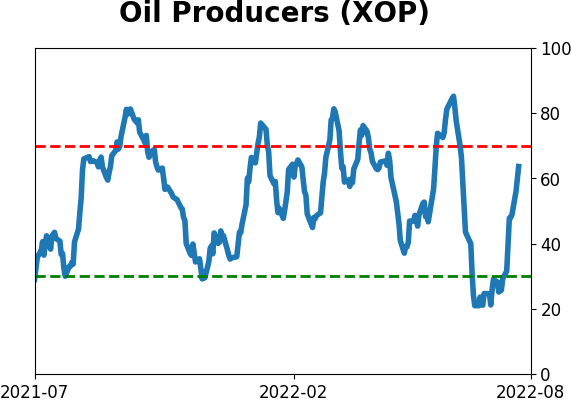
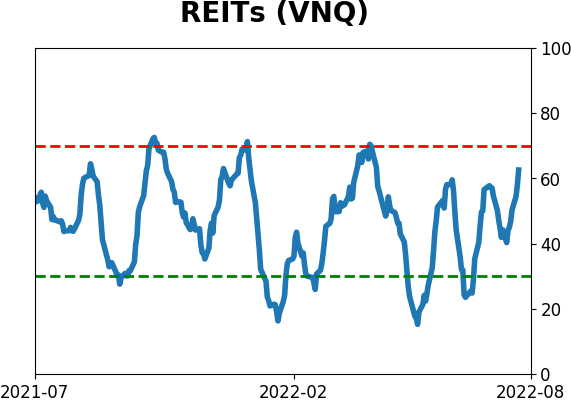
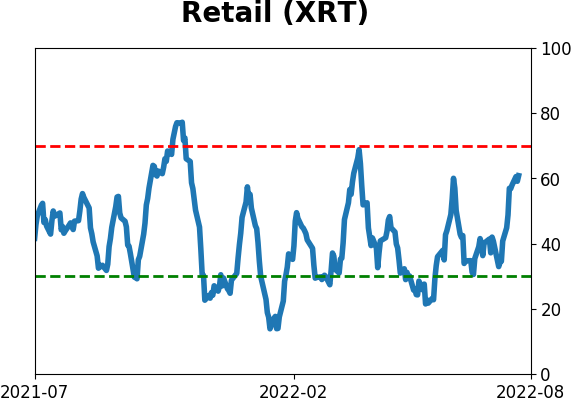
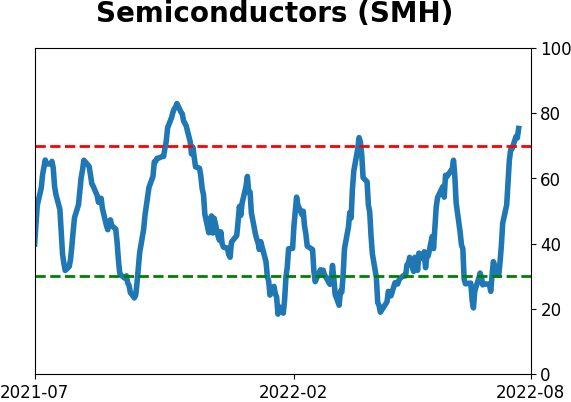
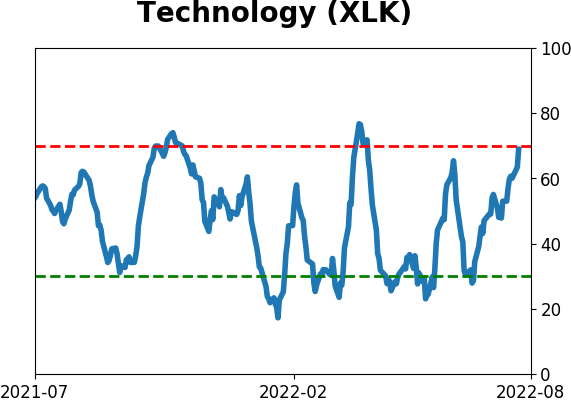
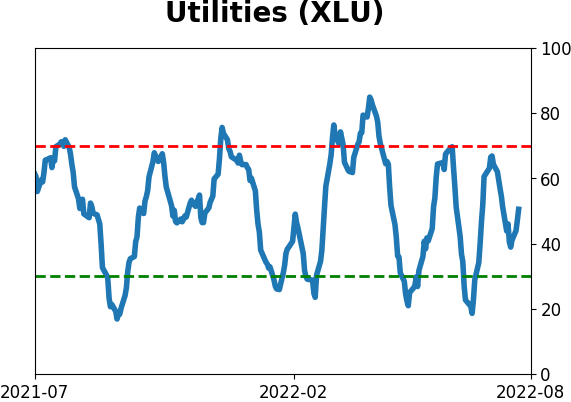
Sector ETF's - 10-Day Moving Average
|
|
|
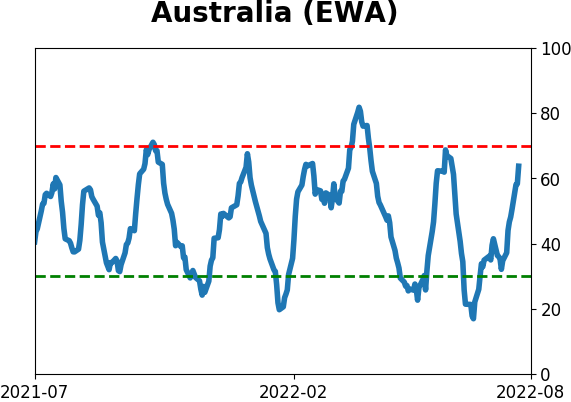
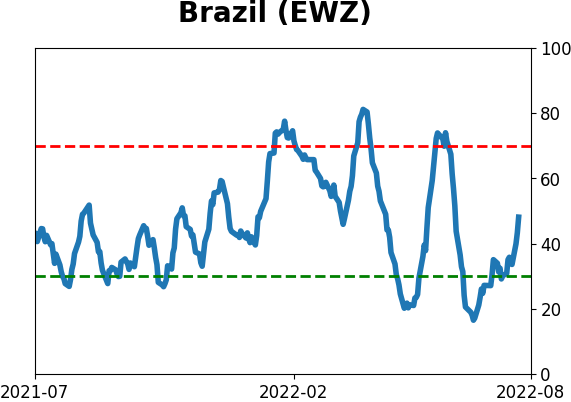
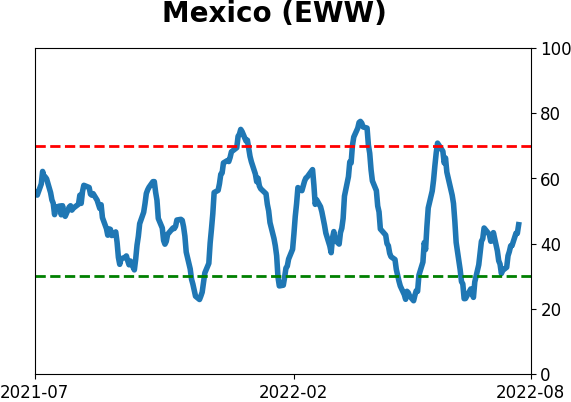
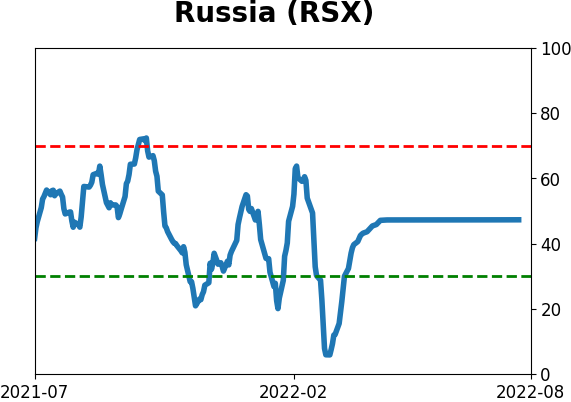
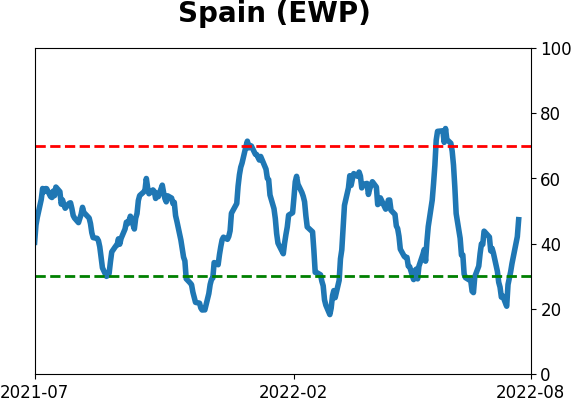
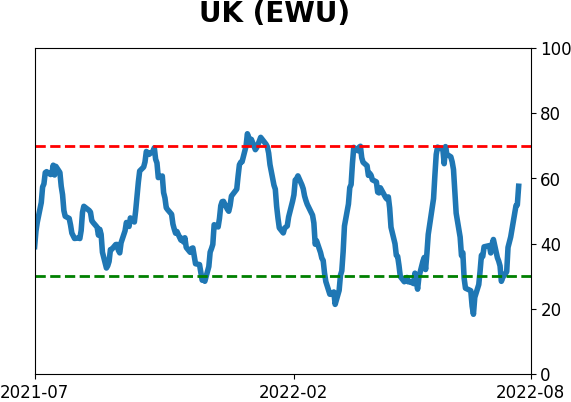
Country ETF's - 10-Day Moving Average
|
|
|
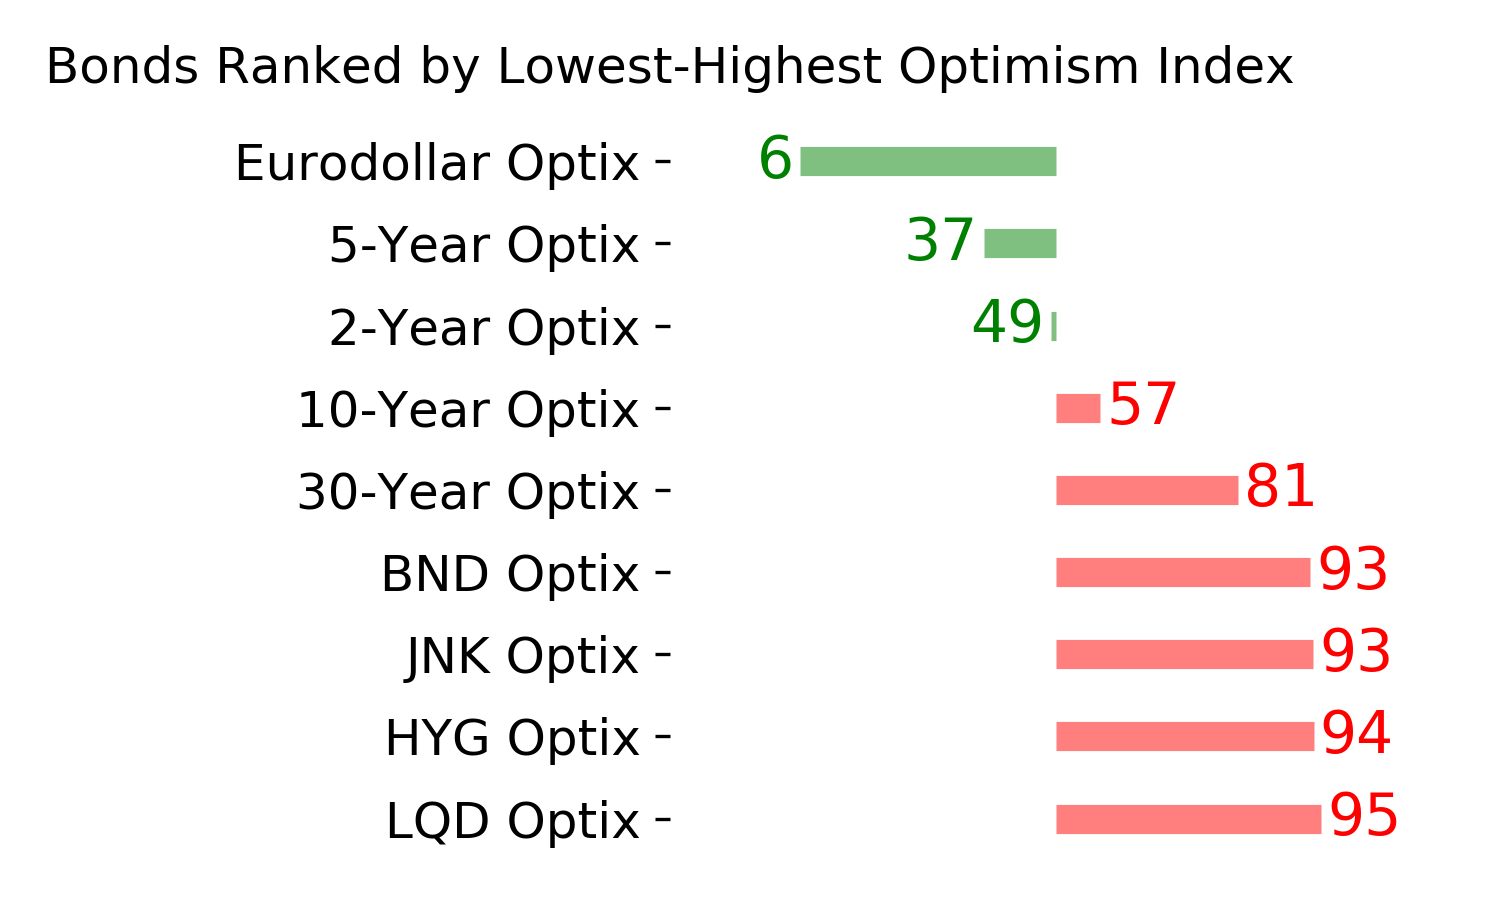
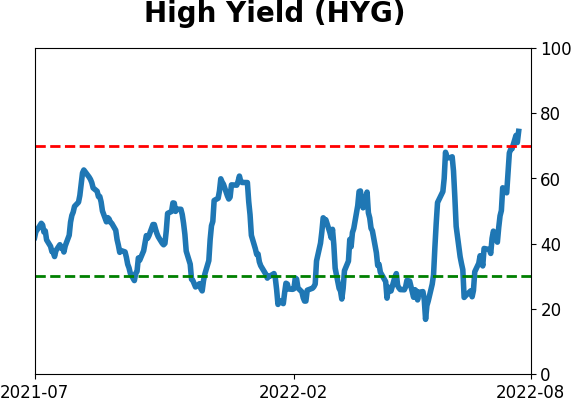
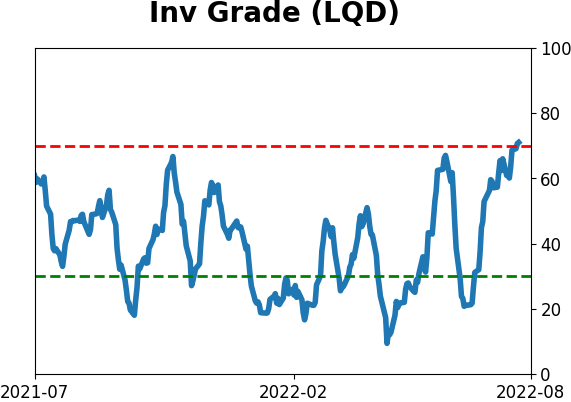
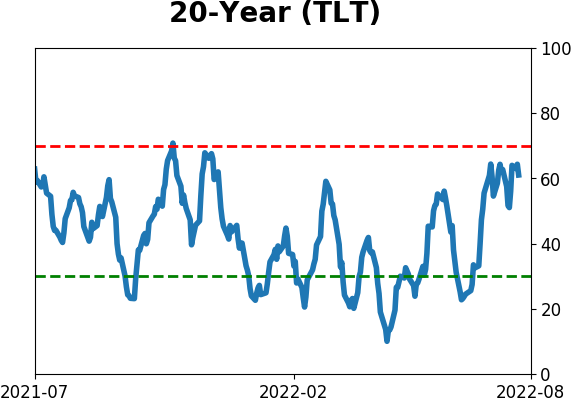
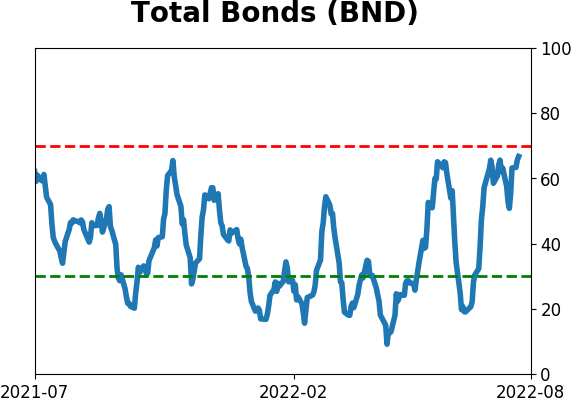
Bond ETF's - 10-Day Moving Average
|
|
|
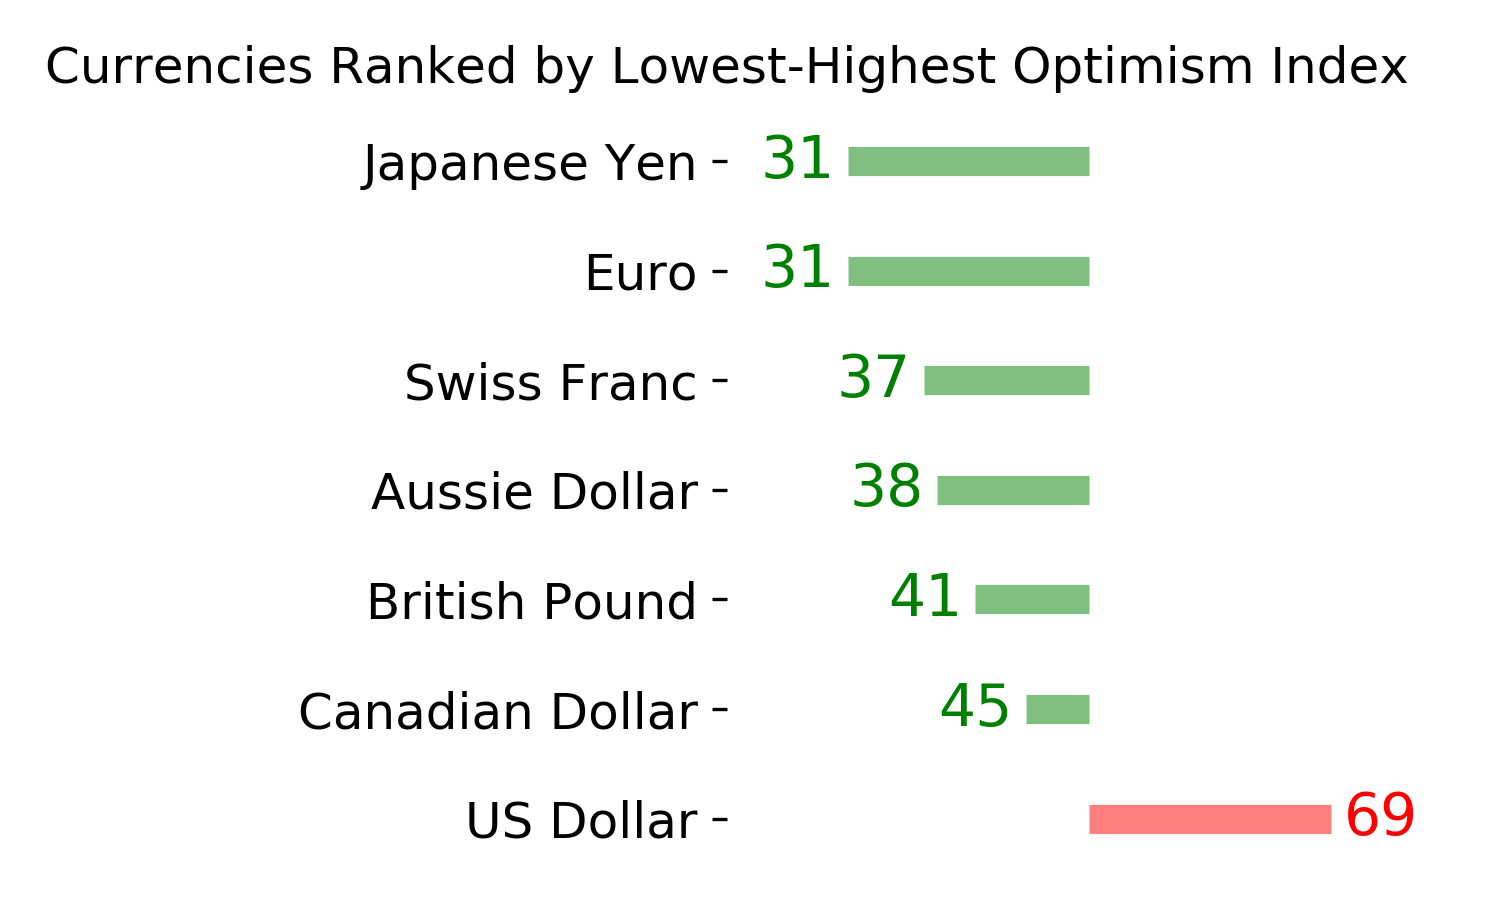
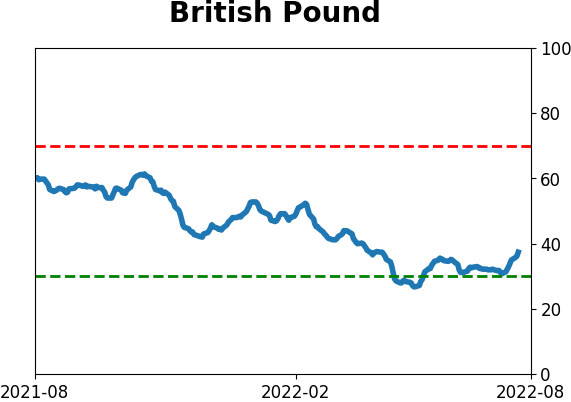
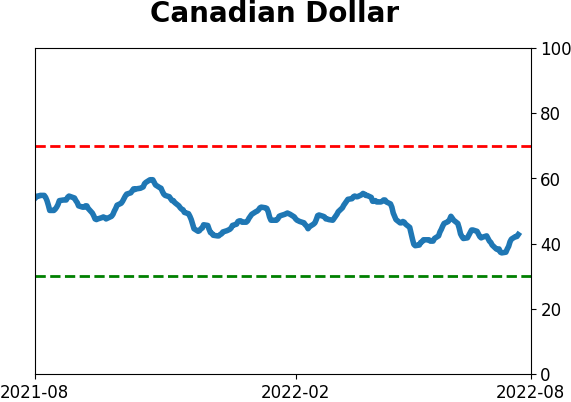
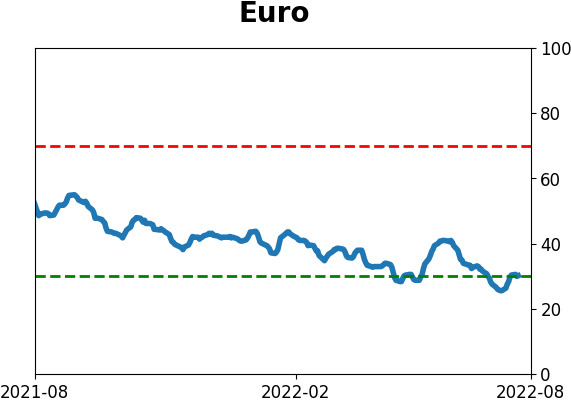
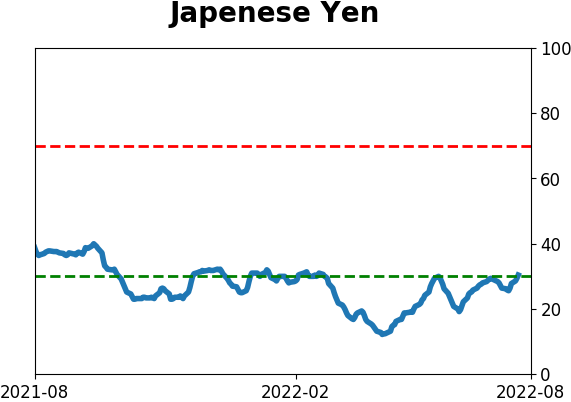
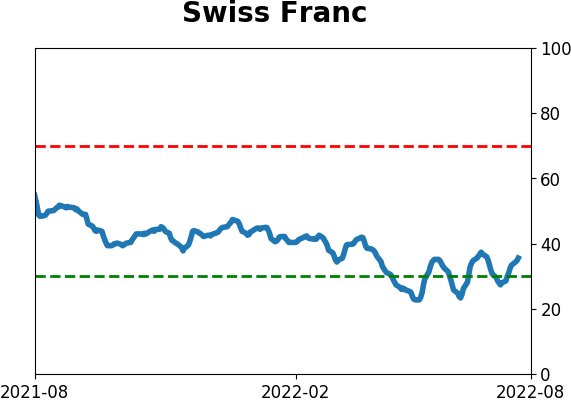
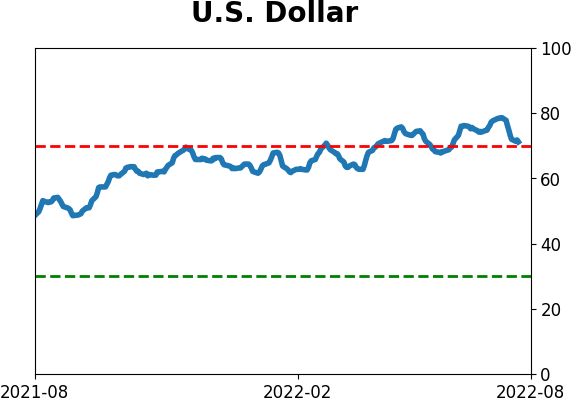
Currency ETF's - 5-Day Moving Average
|
|
|
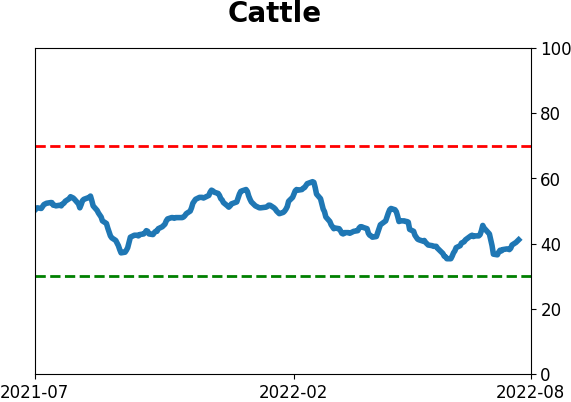
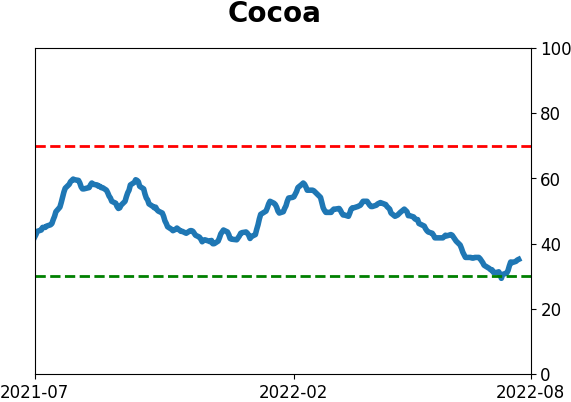
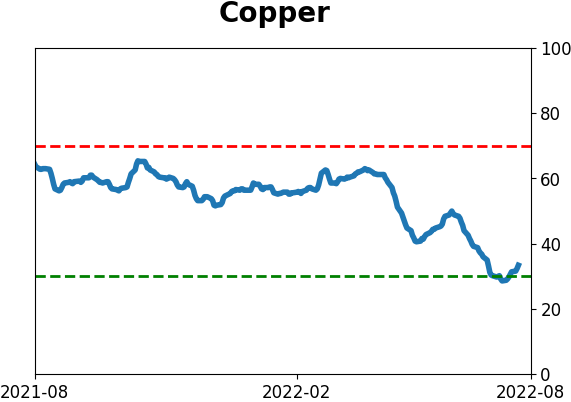
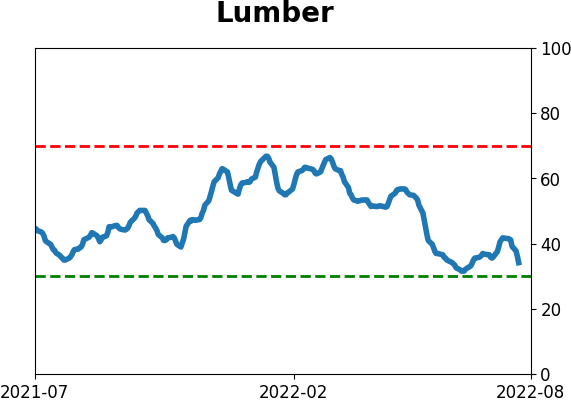
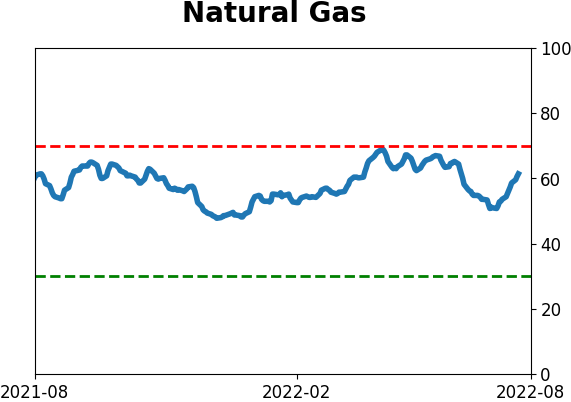
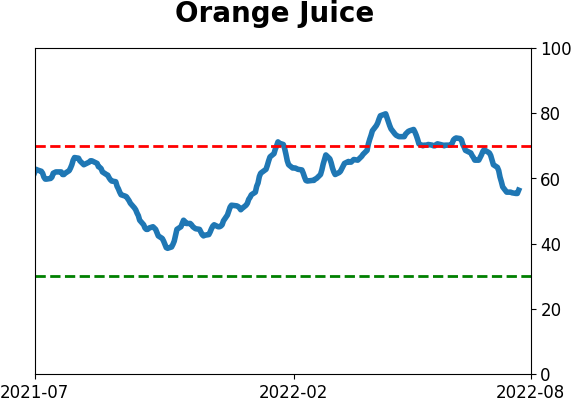
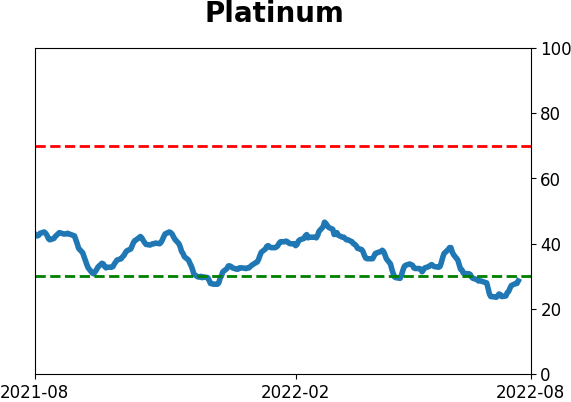
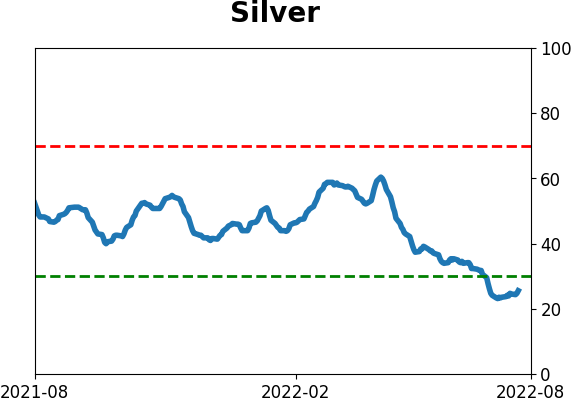
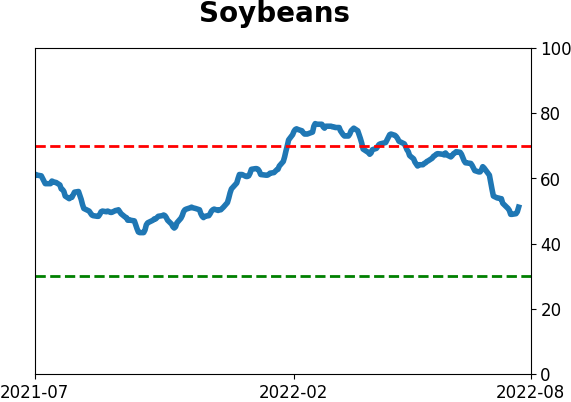
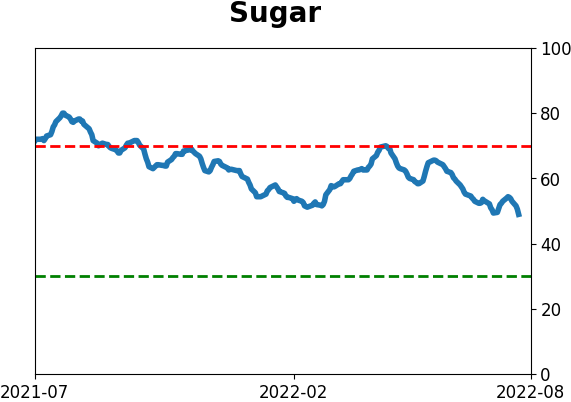
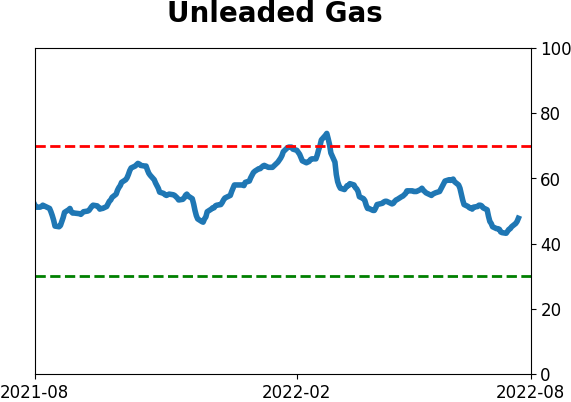
Commodity ETF's - 5-Day Moving Average
|
|