Headlines
|
|
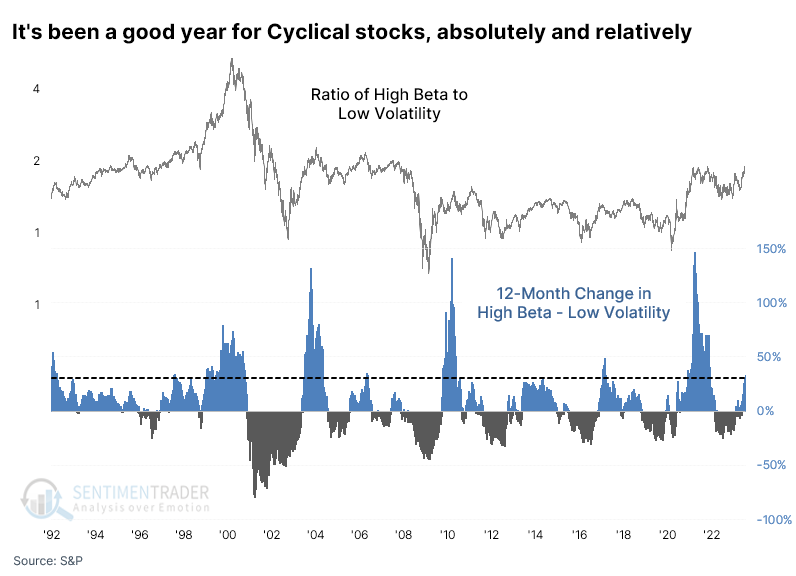
High beta stocks have soared relative to their staid cousins:
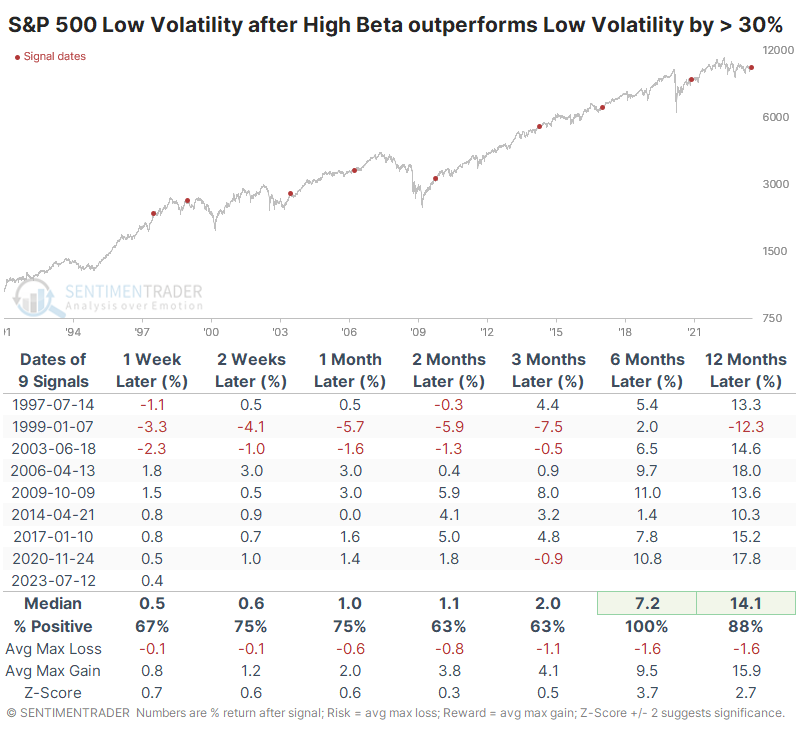
Over the past year, High Beta stocks have soared relative to Low Volatility ones, outperforming by more than 30%. Such wide disparities between the two sectors have preceded gains in the S&P 500 over the next six to twelve months every time.
|
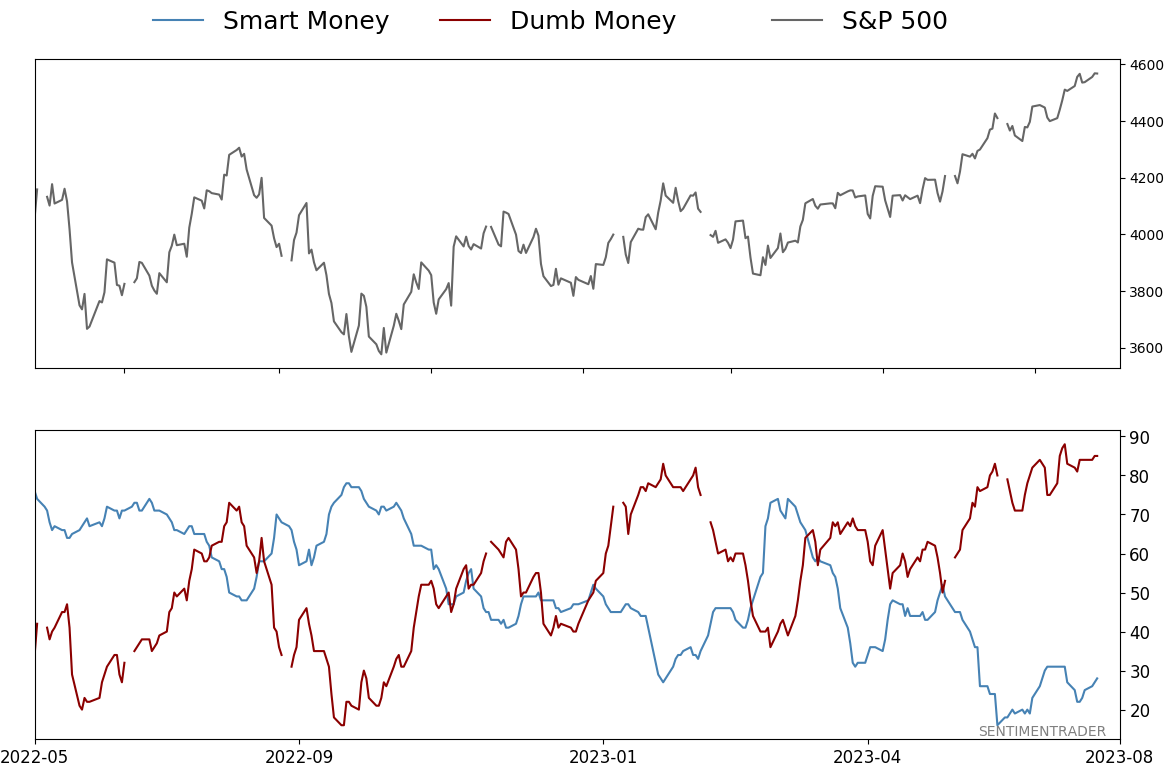
Smart / Dumb Money Confidence
|
Smart Money Confidence: 28%
Dumb Money Confidence: 85%
|
|
Risk Levels
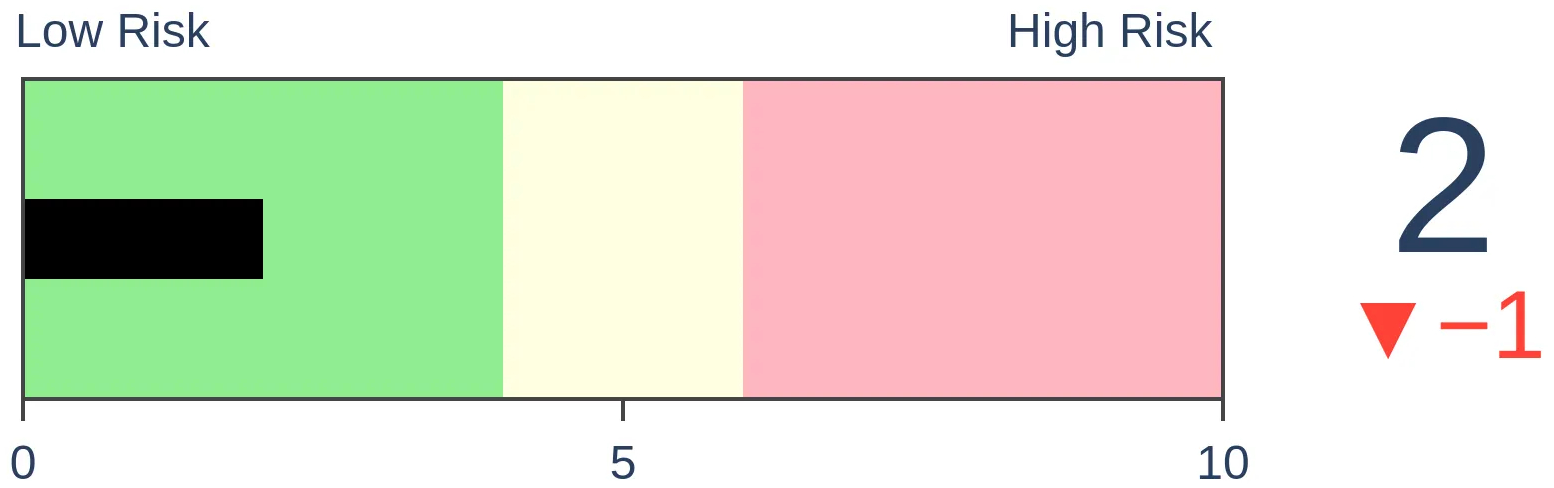
Stocks Short-Term
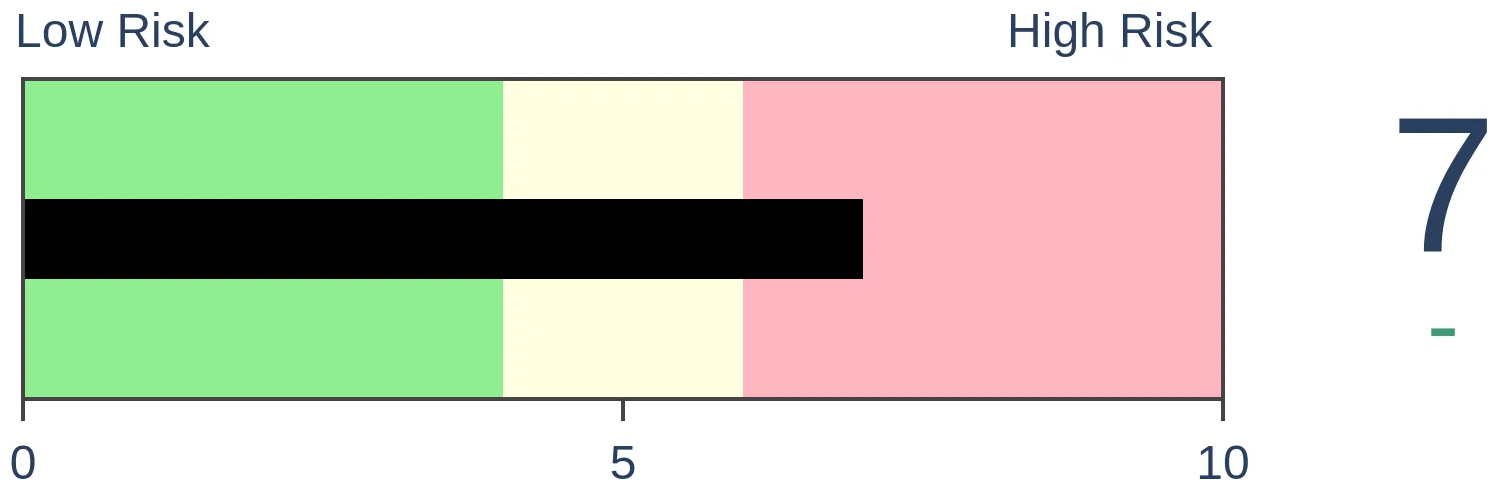
|
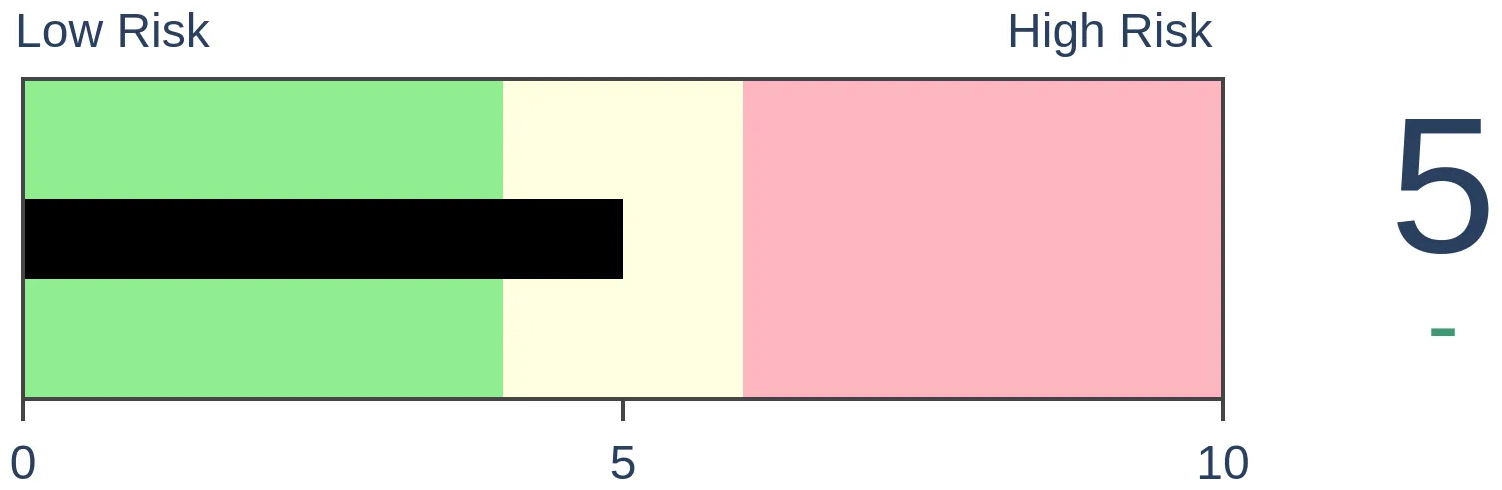
Stocks Medium-Term
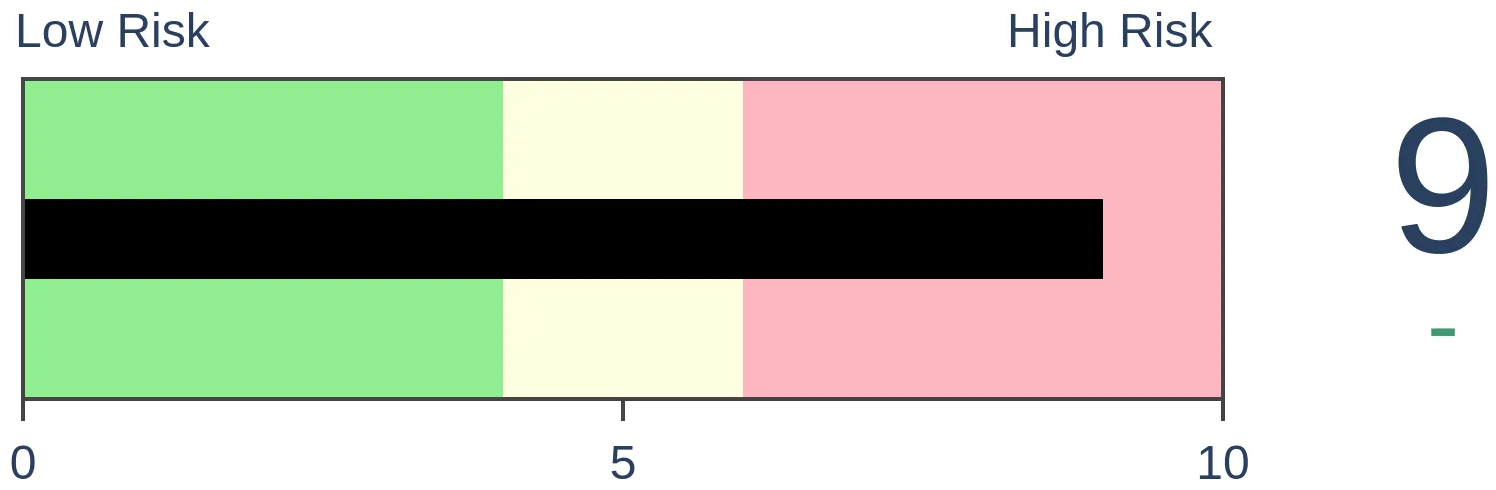
|
|
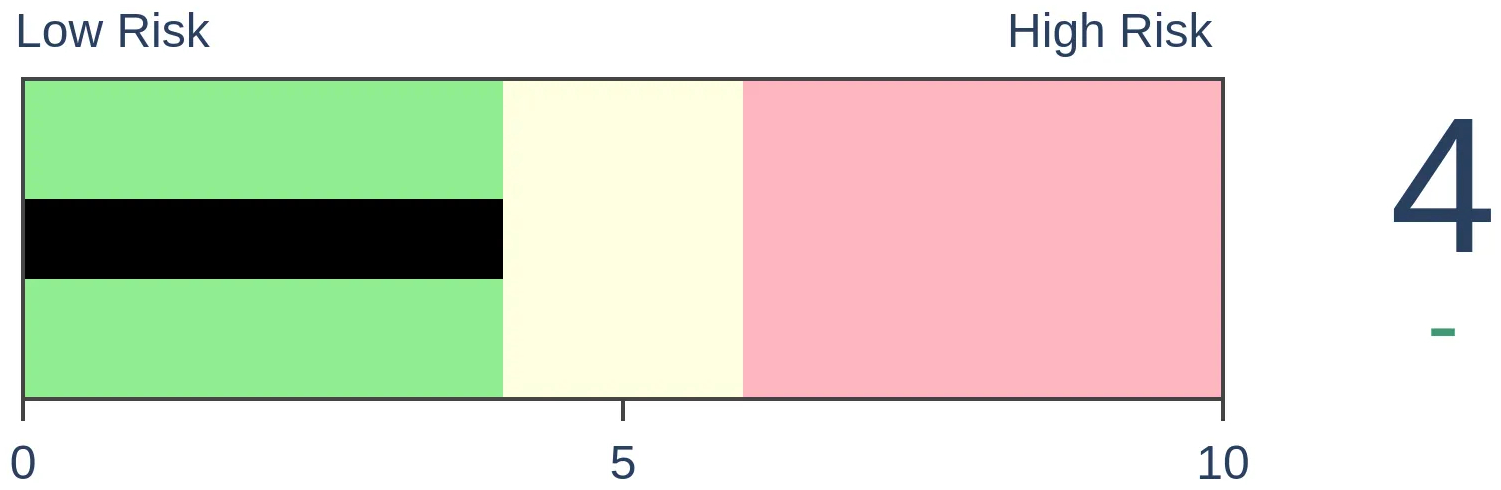
Bonds
|
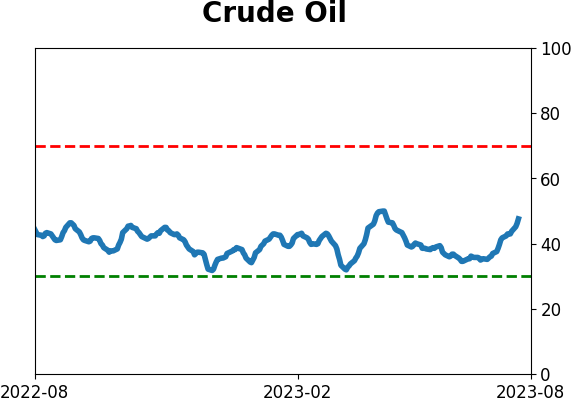
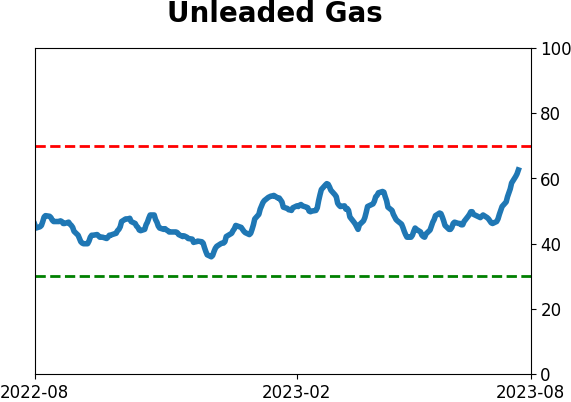
Crude Oil
|
|
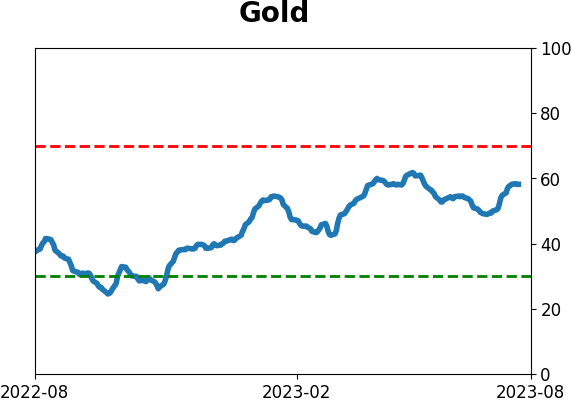
Gold
|
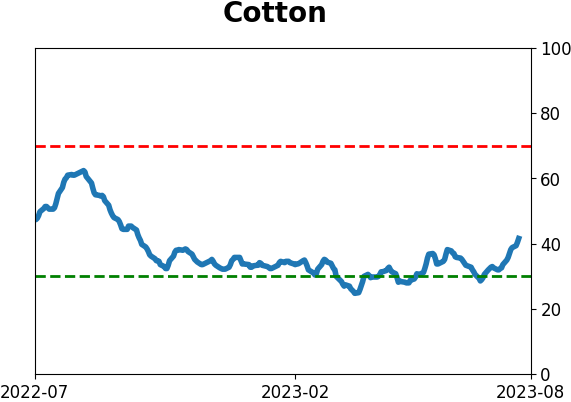
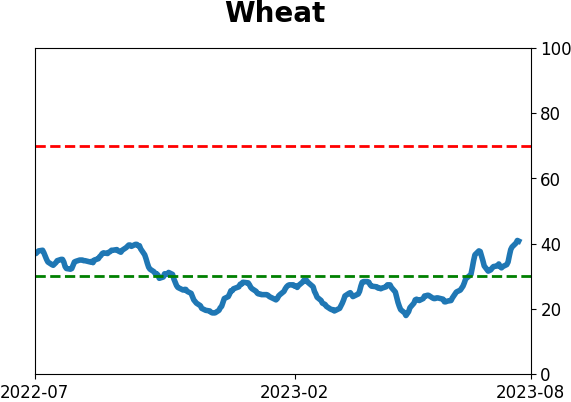
Agriculture

|
|
Research
By Jason Goepfert
BOTTOM LINE
Over the past year, High Beta stocks have soared relative to Low Volatility ones, outperforming by more than 30%. Such wide disparities between the two sectors have preceded gains in the S&P 500 over the next six to twelve months every time.
FORECAST / TIMEFRAME
None
|
Key points:
- High Beta stocks have outperformed Low Volatility stocks by more than 30% over the past year
- While it's a wide spread, it has blown out much more during bear market recoveries
- High spreads between the two factors preceded gains in the S&P 500 every time
High Beta stocks have roared ahead of their staid cousins
It's been a heckuva different year, depending on how much risk an investor has been willing to stomach. Those invested in higher-beta stocks that move more relative to the broader market have enjoyed spectacular gains. Those stuck in more staid movers are only about even.
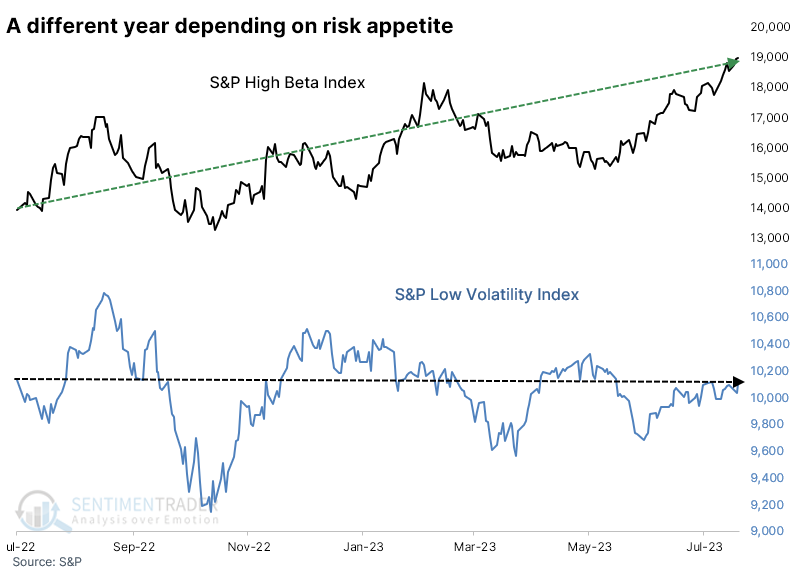
Over the past twelve months, High Beta stocks have outperformed Low Volatility ones by more than 30%. That's one of the most significant year/year spreads in more than 30 years. All the biggest spreads in performance came after protracted declines.
Big jumps in High Beta stocks led to gains for the broader market every time
These big jumps in risk appetite were a great sign for the broader market. Over the next 6-12 months, the S&P 500 never showed a loss, with the usual caveats accompanying a tiny sample size.
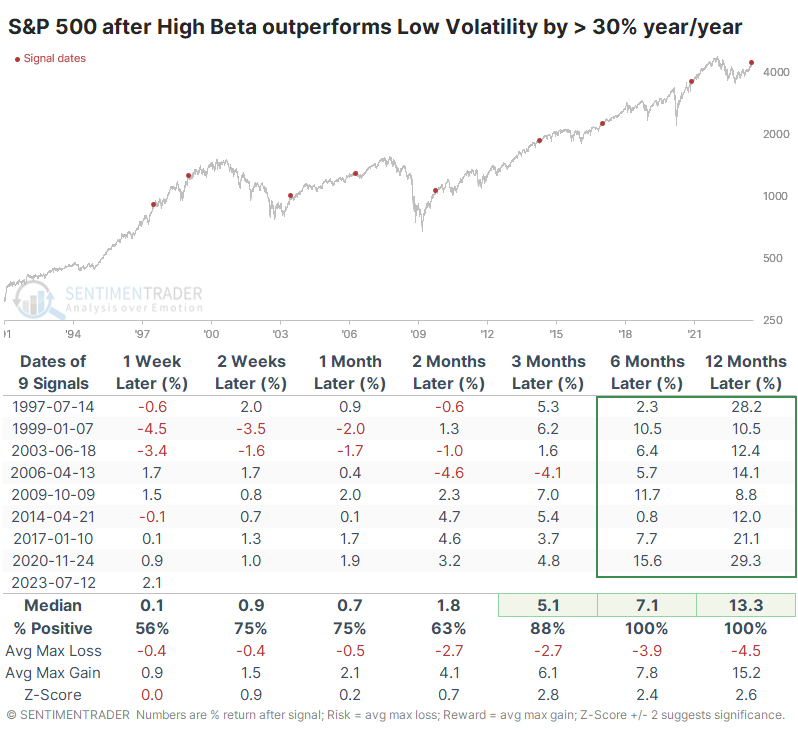
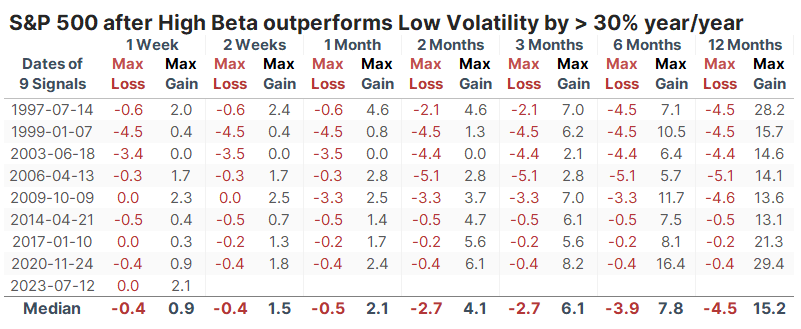
Risk was muted, with no losses of more than -5.1% at any point within the next 12 months, which is quite remarkable. At the same time, every signal enjoyed a double-digit gain at some point.
For High Beta stocks, the vast outperformance led to some shorter-term digestion but still impressive longer-term returns.
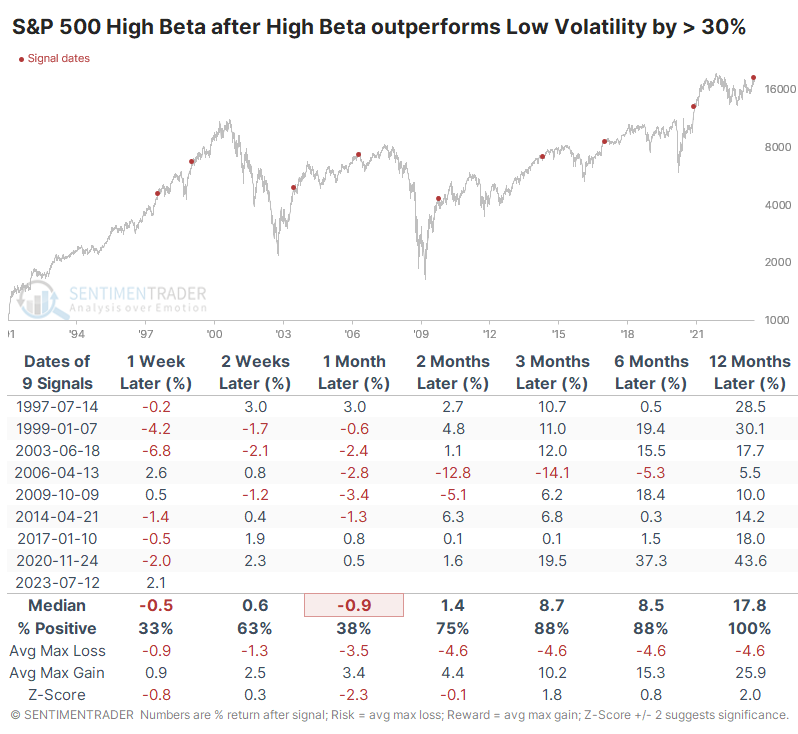
It was a relatively better sign for Low Volatility, with some evidence of mean reversion. Over the next month, High Beta stocks suffered five losses versus only two for Low Volatility. And the longer-term returns in the latter were more impressive relative to their base rate, though in the lead-up to the pricking of the internet bubble, these stocks suffered more.
What the research tells us...
When there is a big jump in riskier assets, knee-jerk contrarians always assume it's a bad sign. Sometimes it is. But when it comes after a prolonged bear market, it's the opposite.
We don't have a lot of history here, but when we look at similar performance of High Beta versus Low Volatility stocks when the former outperforms as much as it has, it has been an excellent sign for the broad market. High Beta stocks tend to be more volatile by definition, so longer-term returns in Low Volatility stocks tended to exhibit a better risk/reward ratio after behavior like we've seen over the past year.
Indicators at Extremes
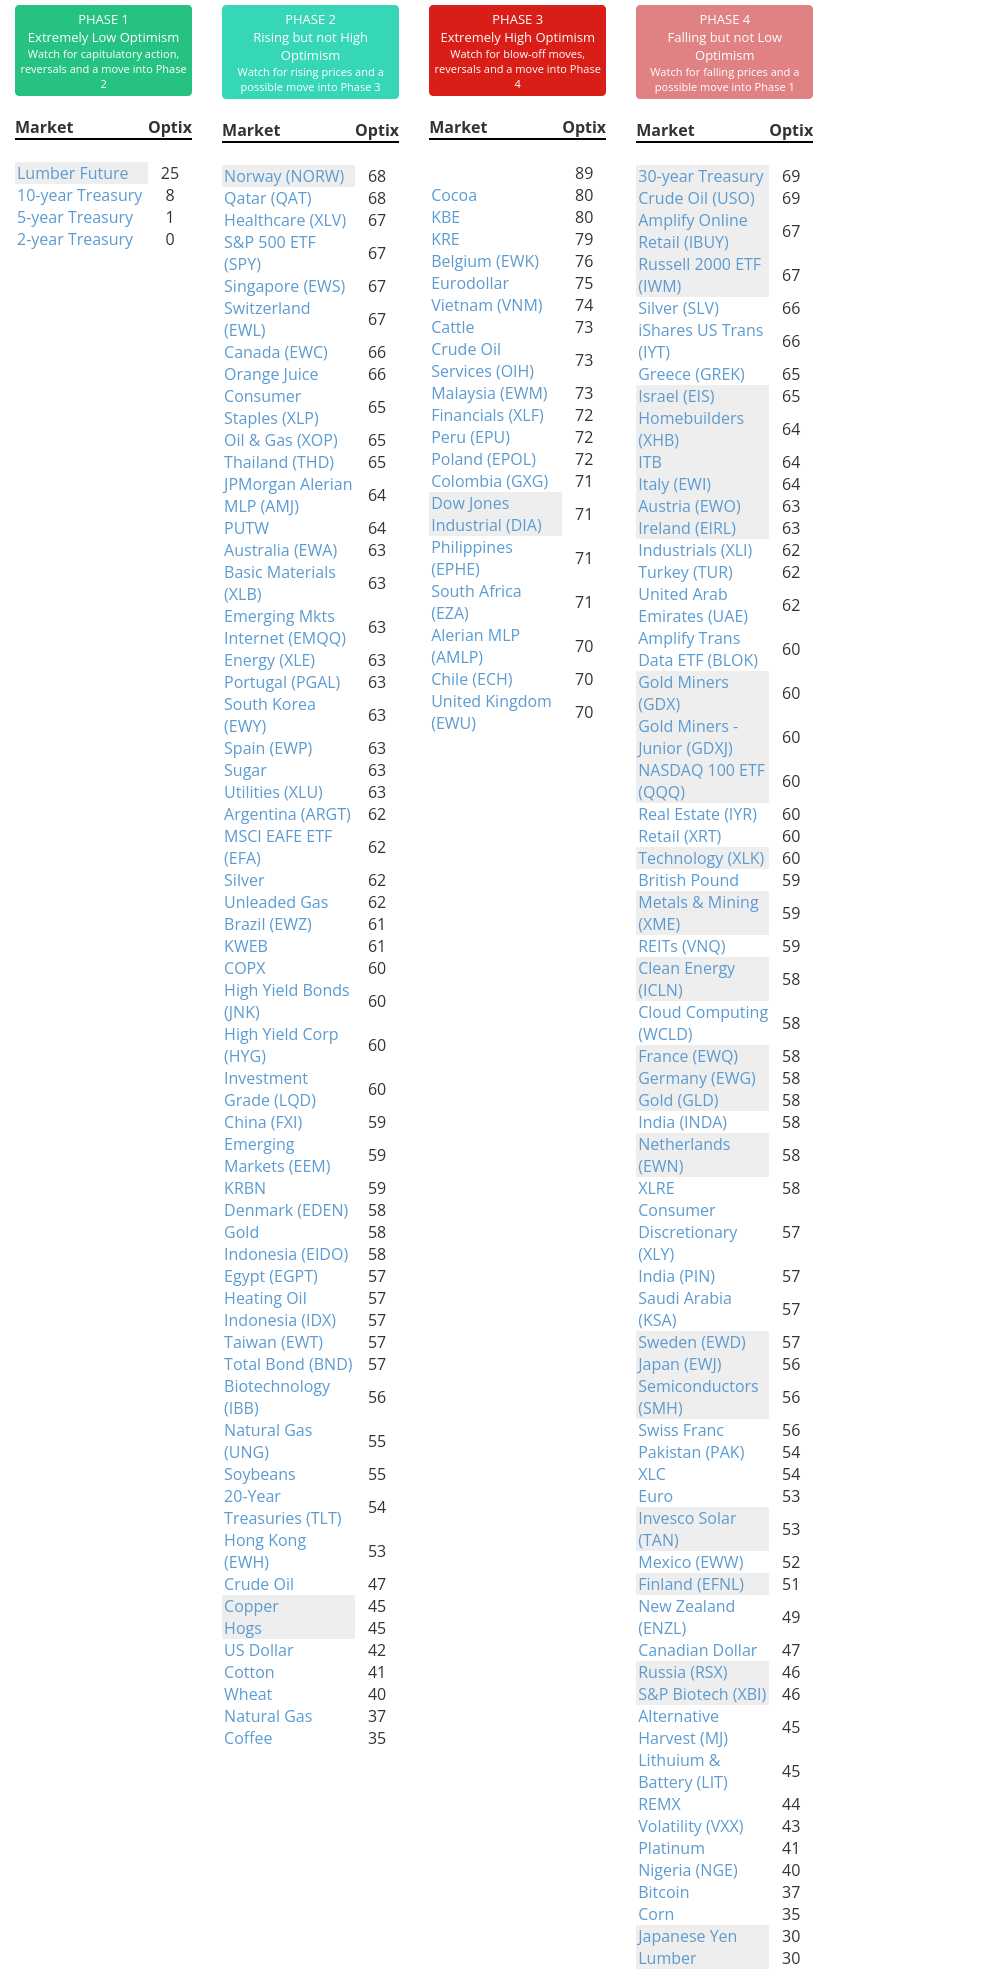
Phase Table
Ranks
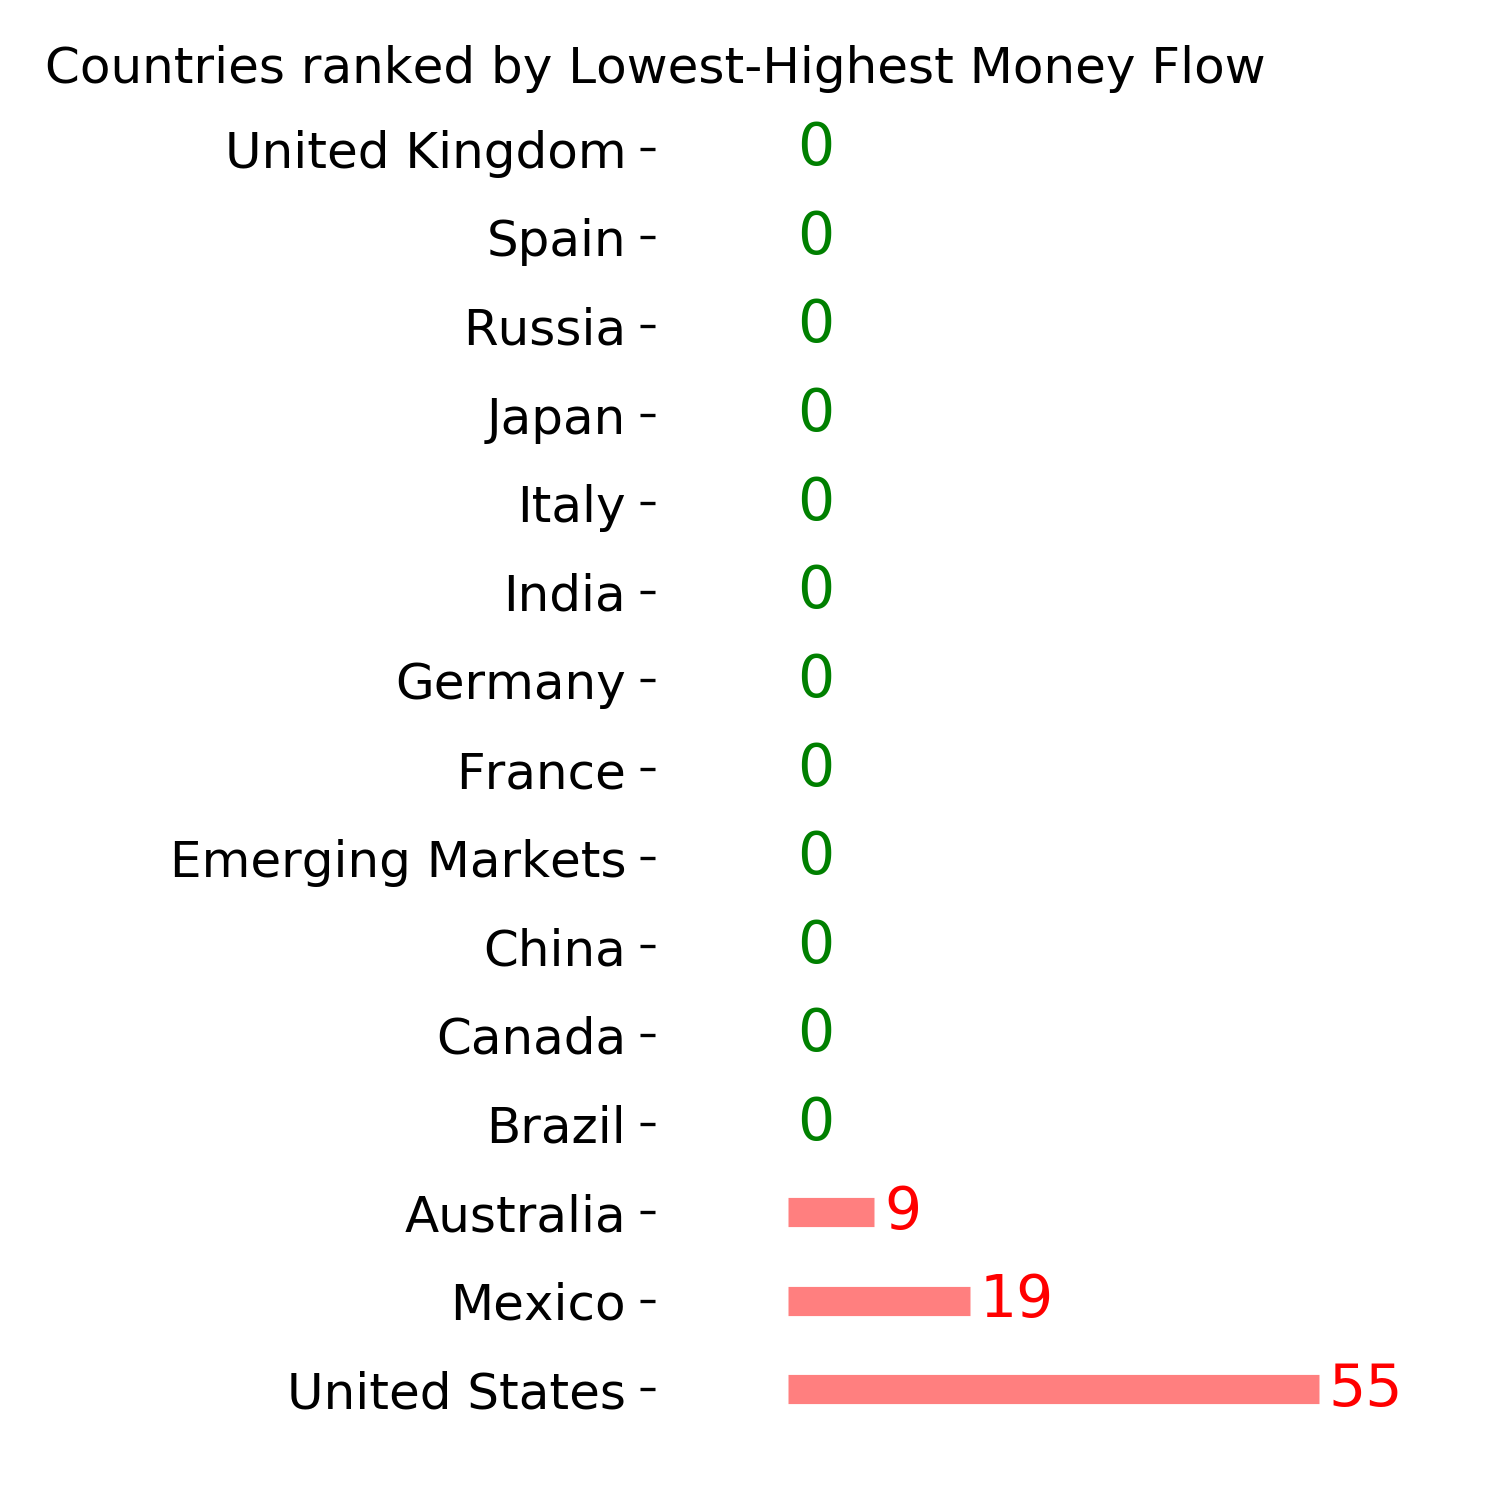
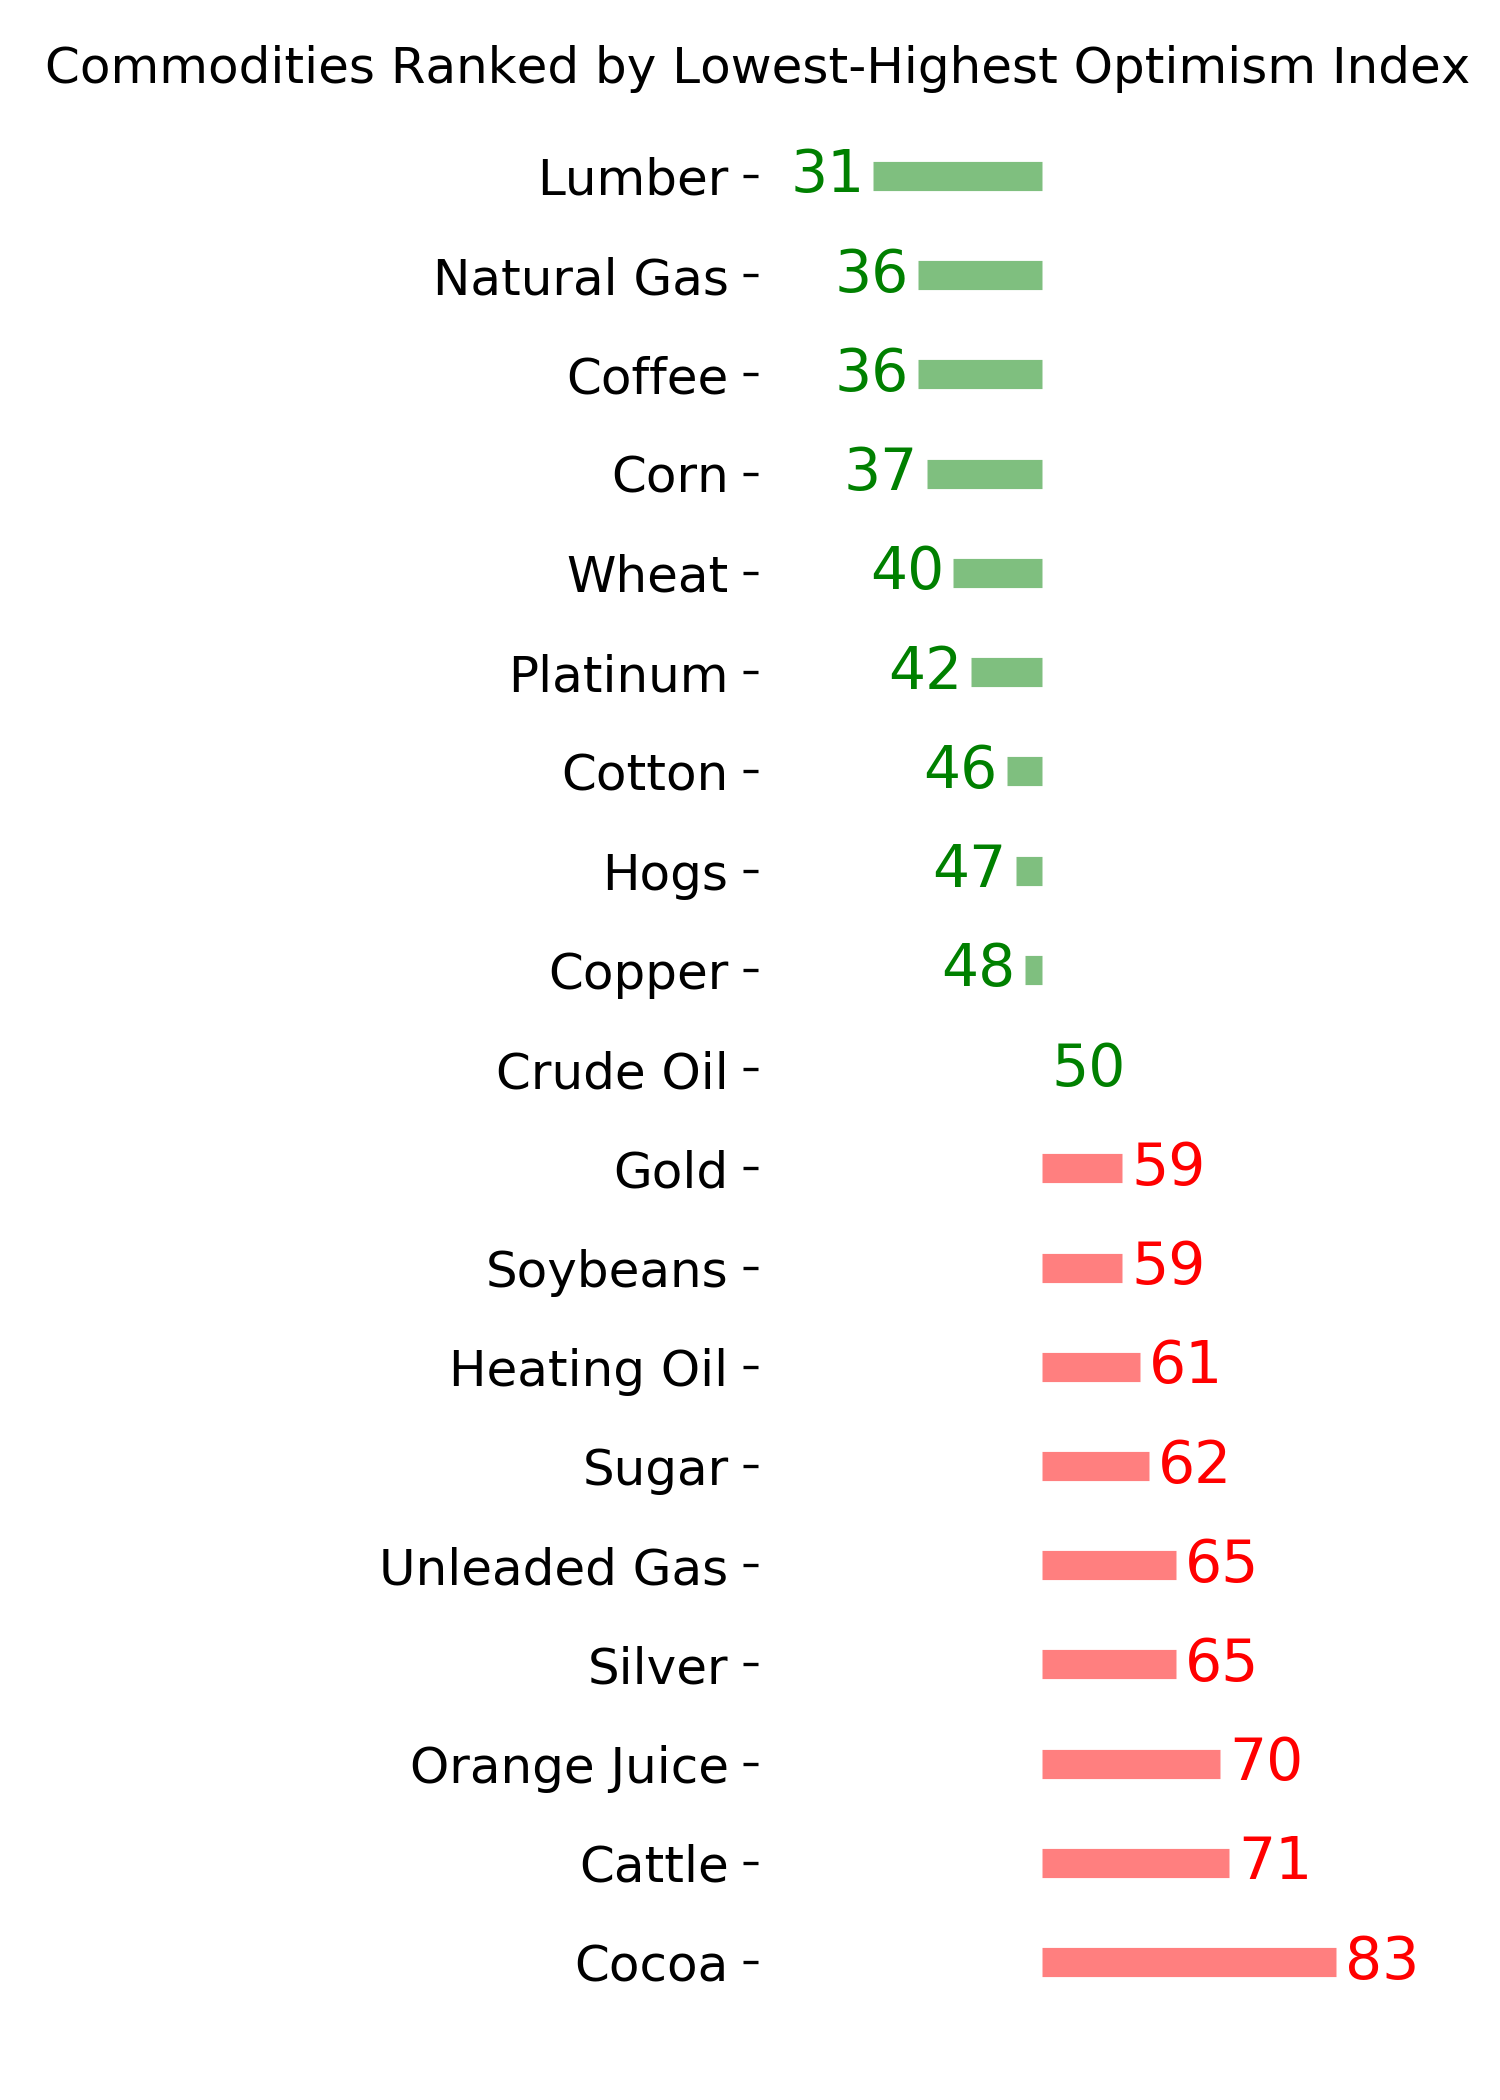
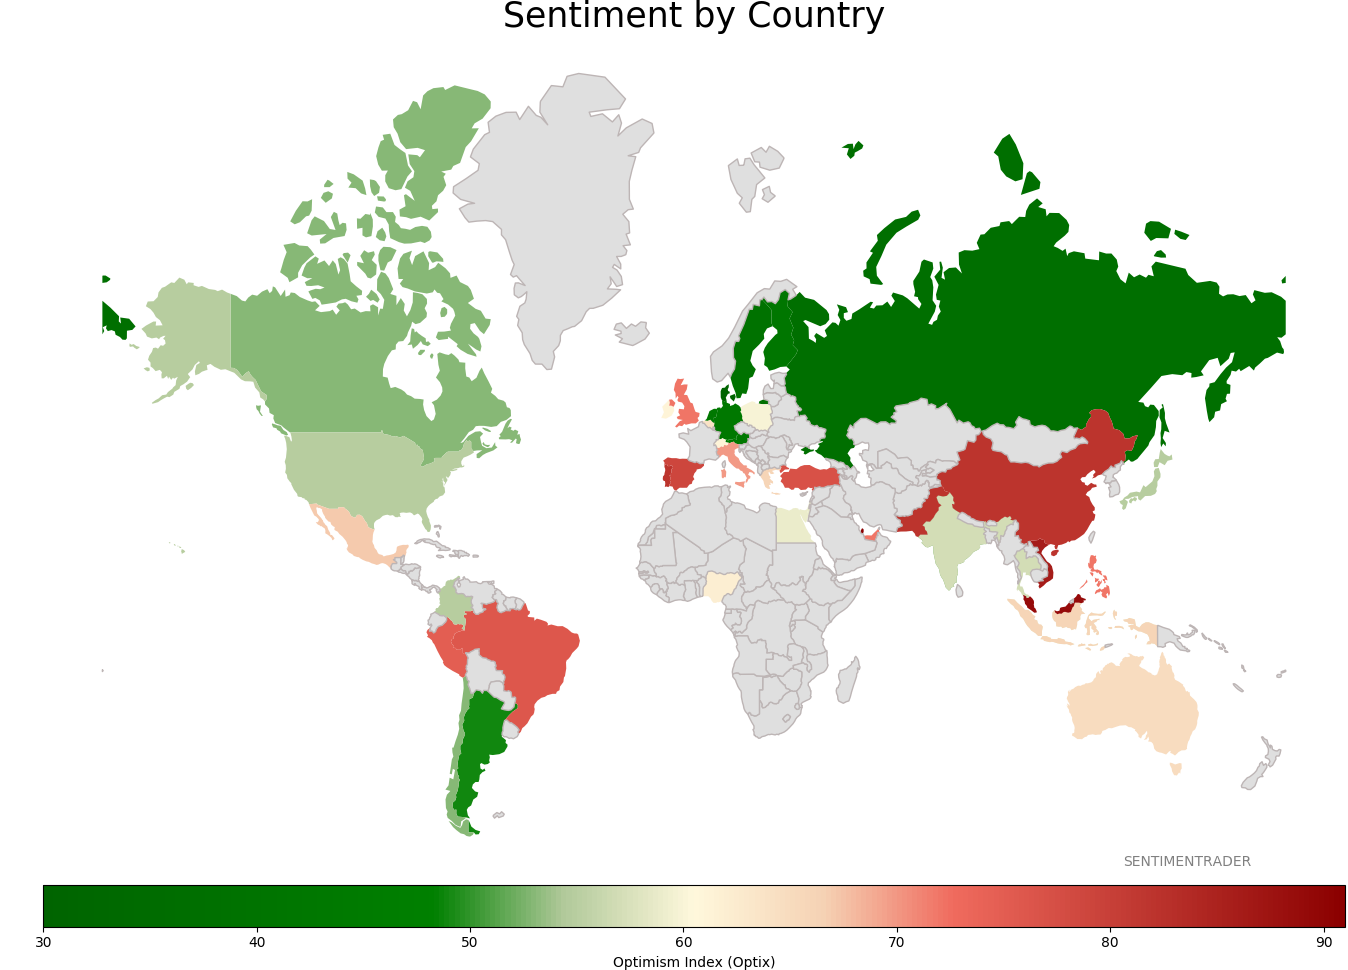
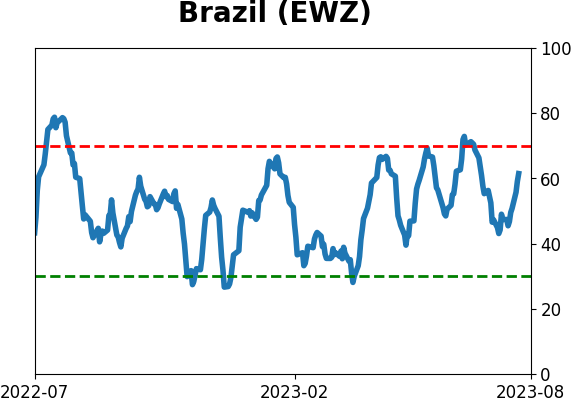
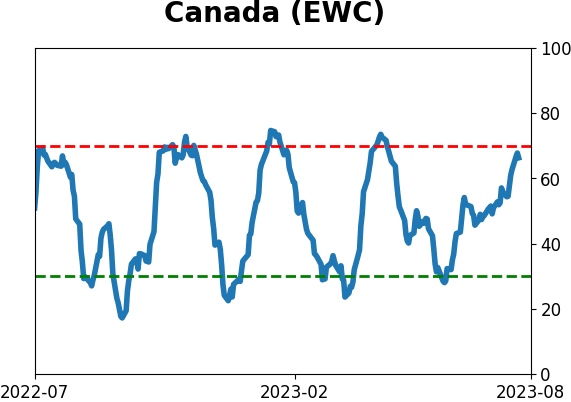
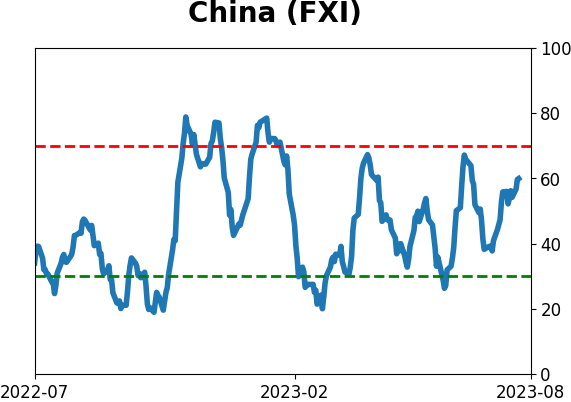
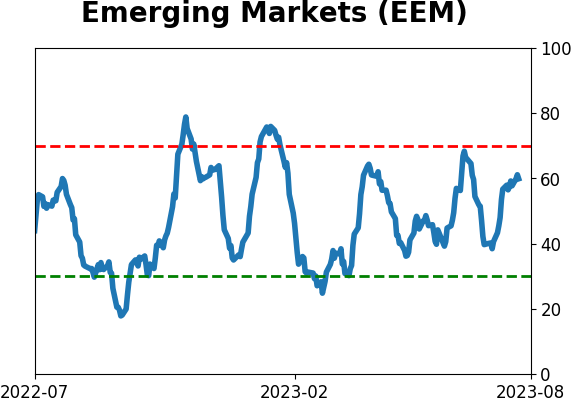
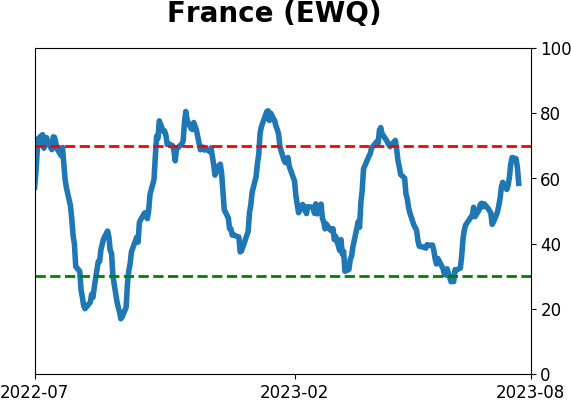
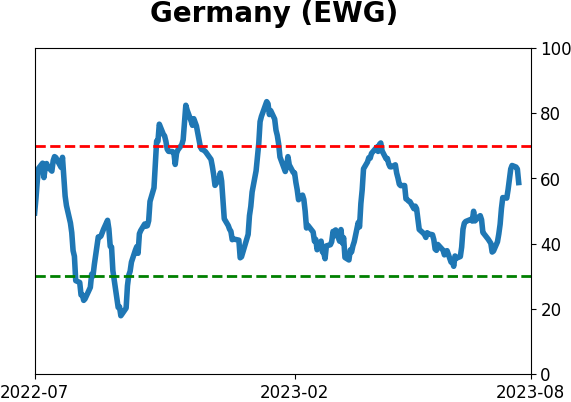
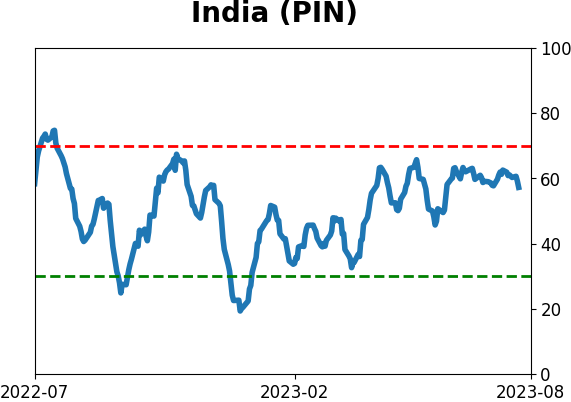
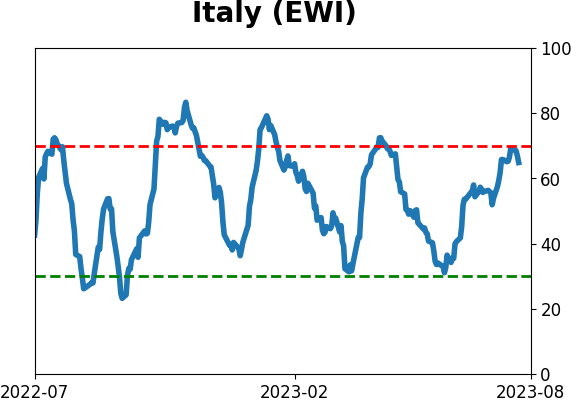
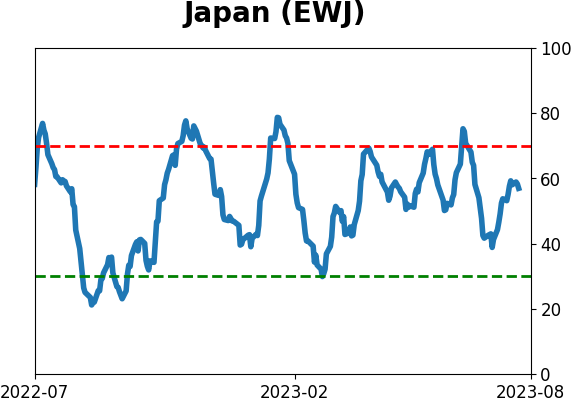
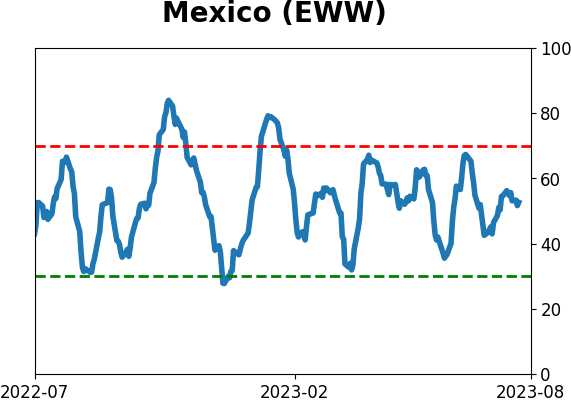
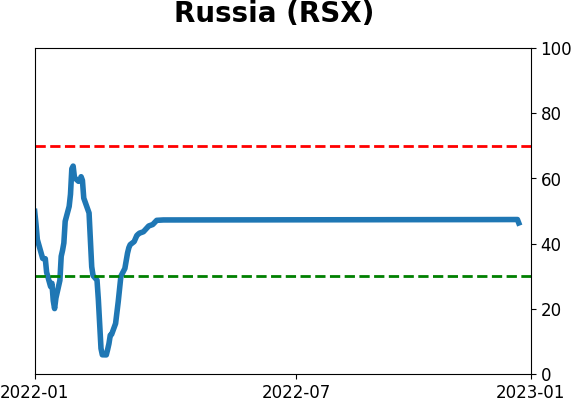
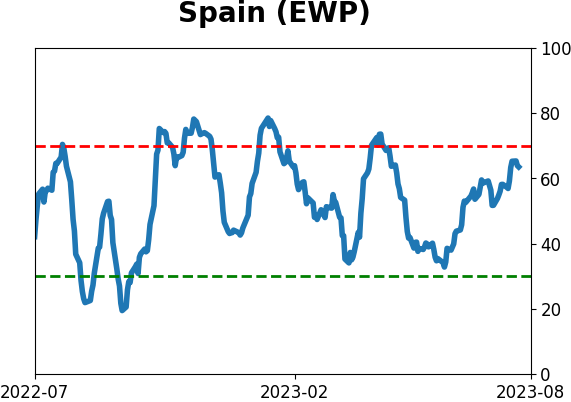
Sentiment Around The World
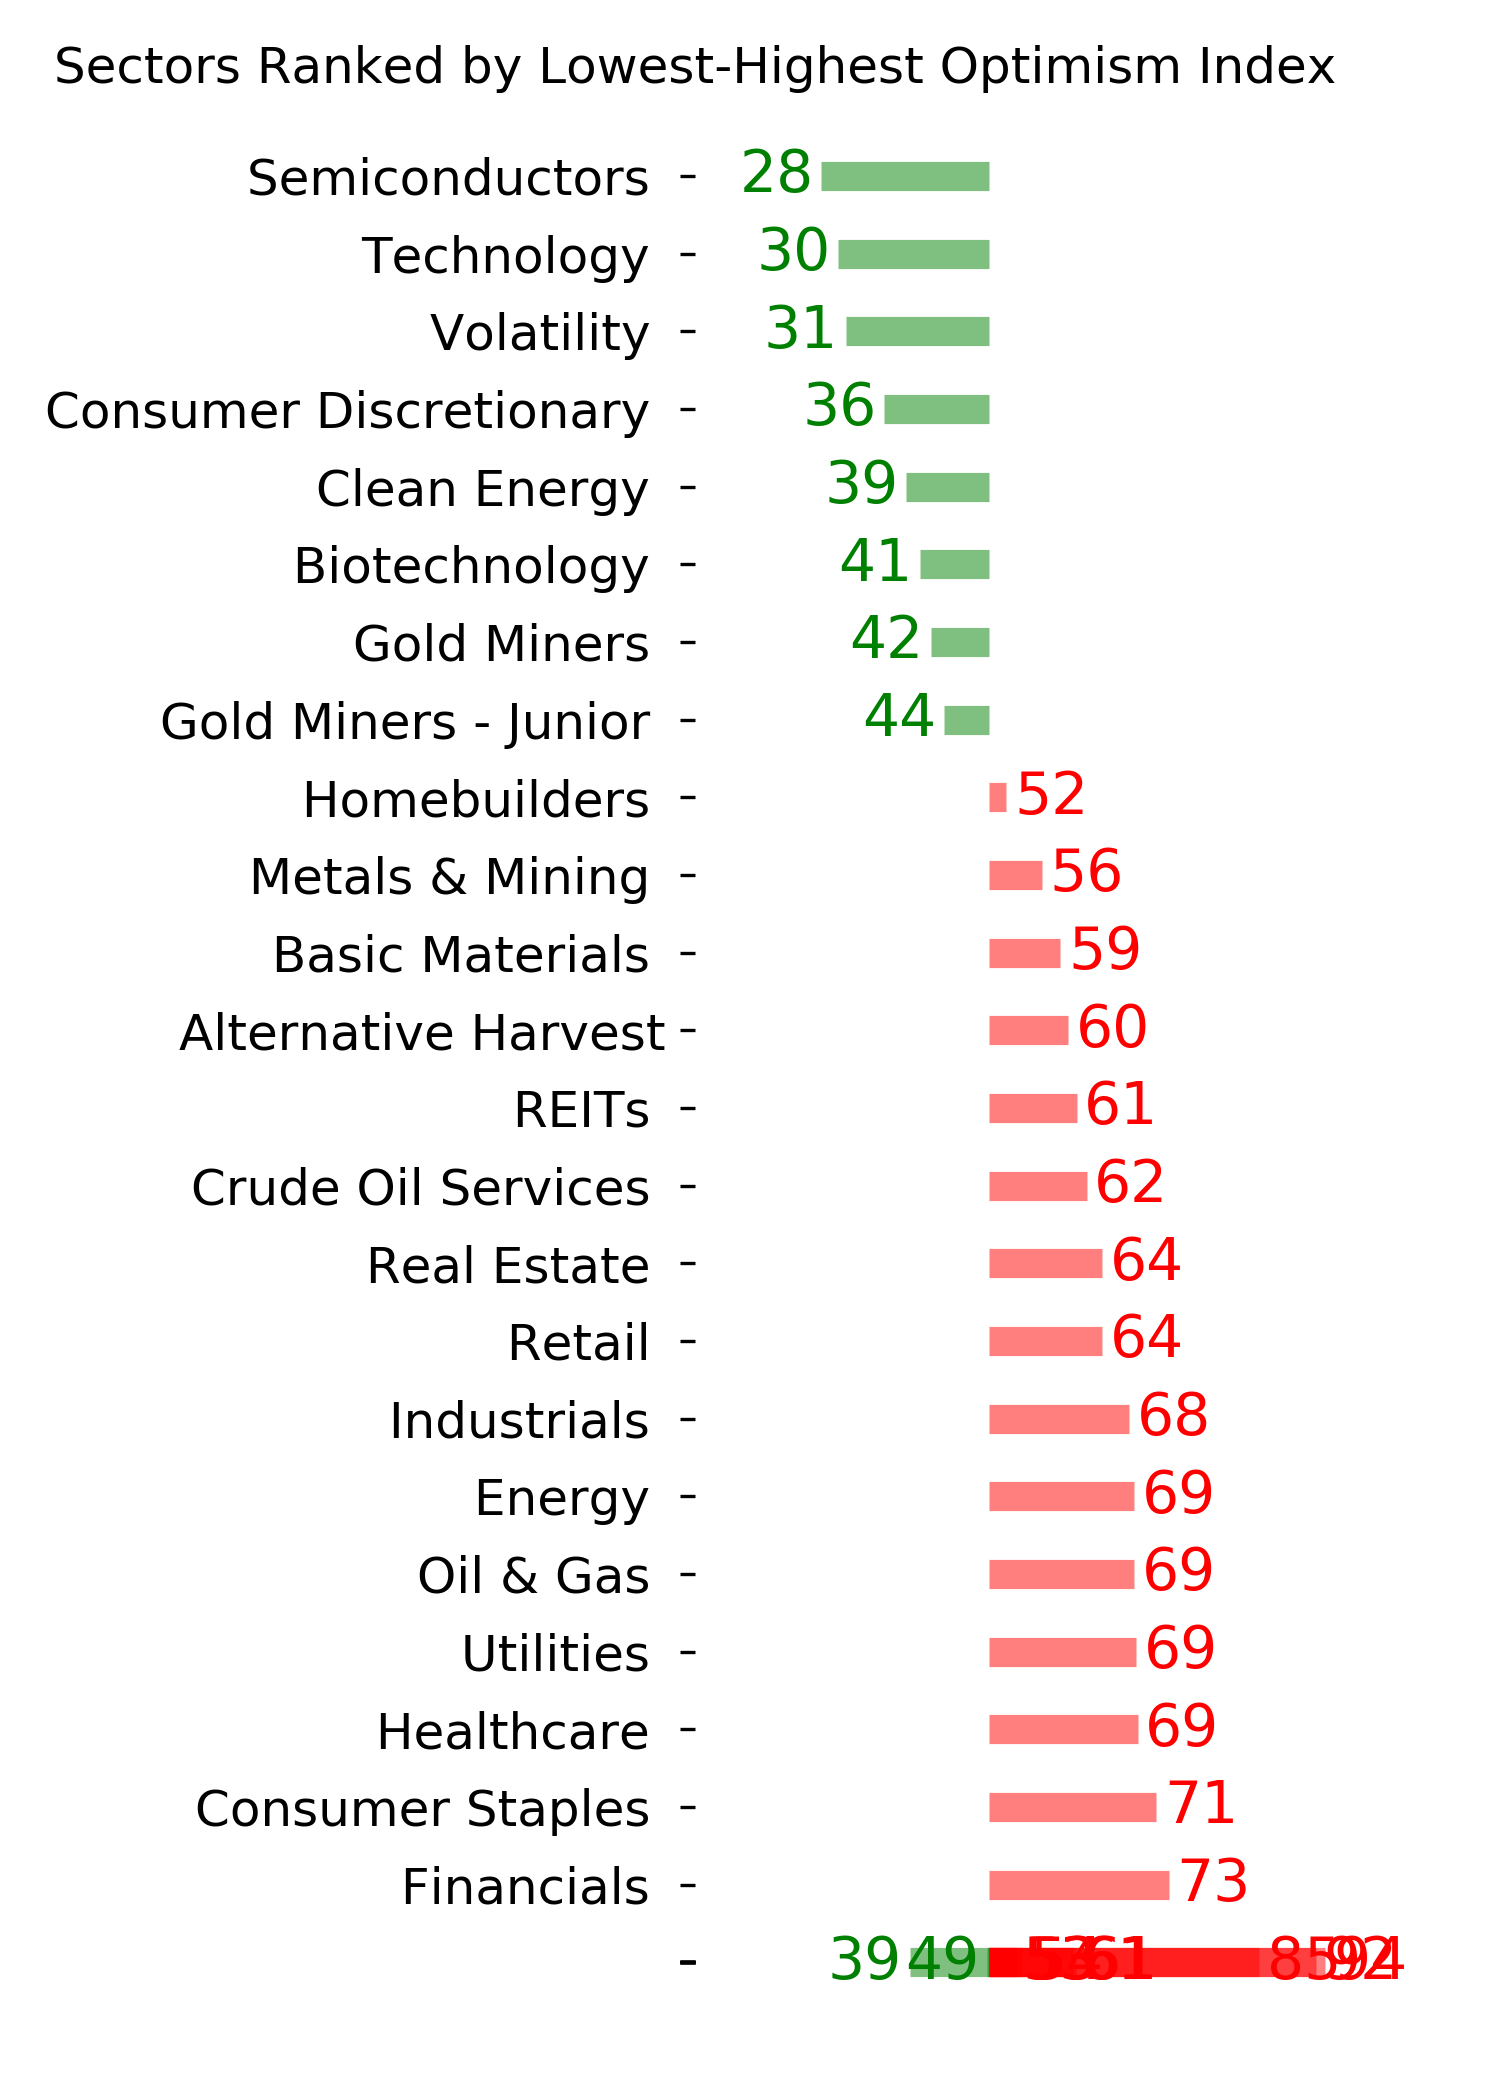
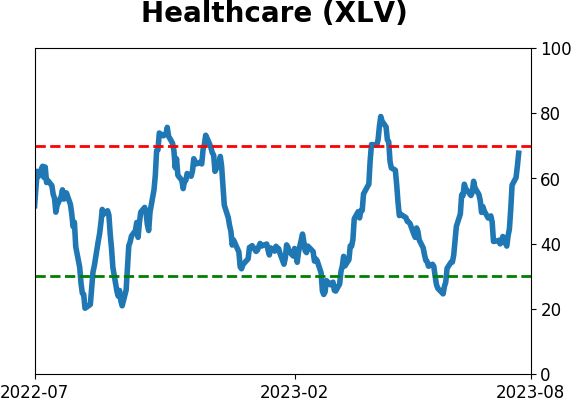
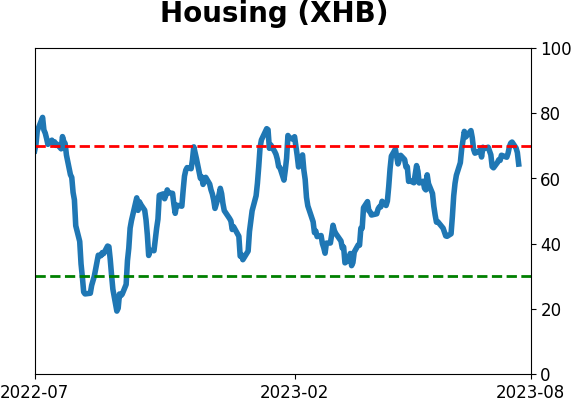
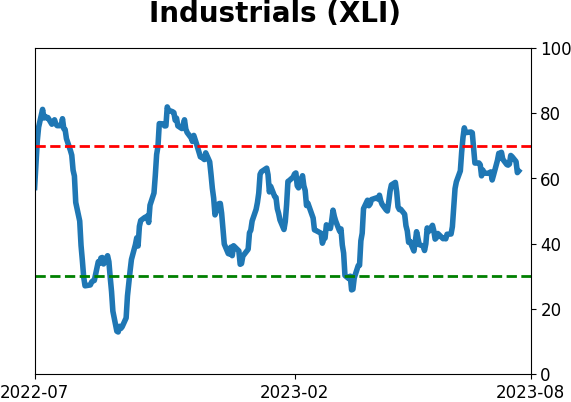
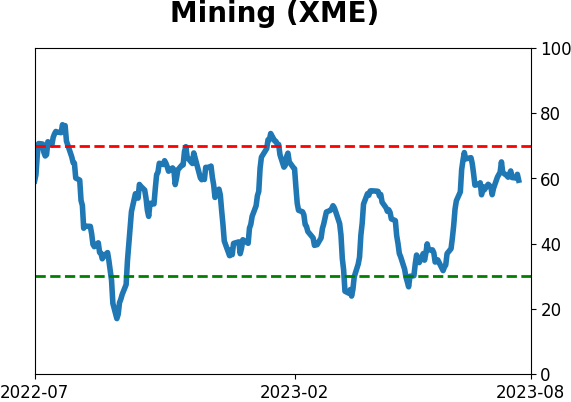
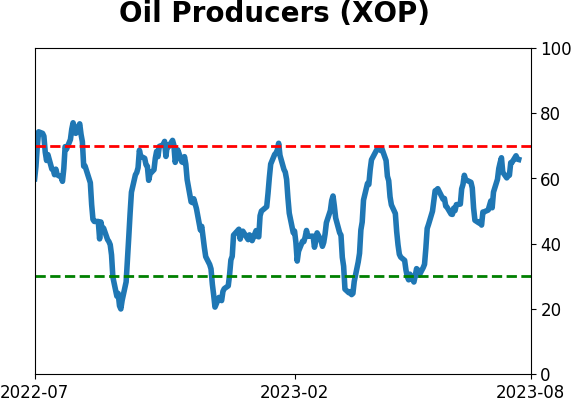
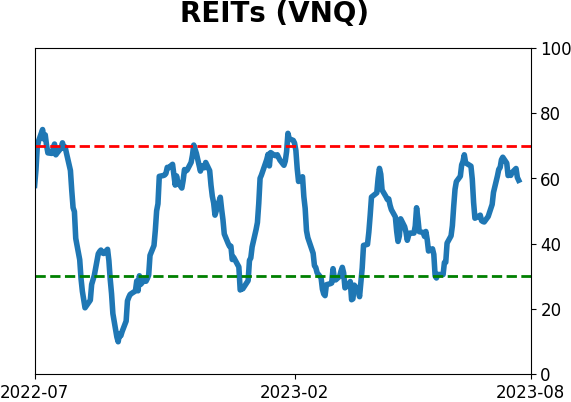
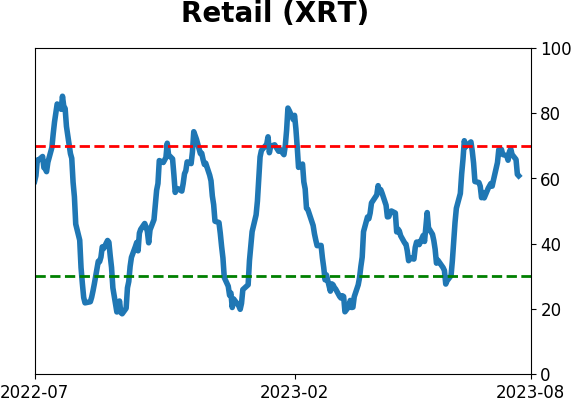
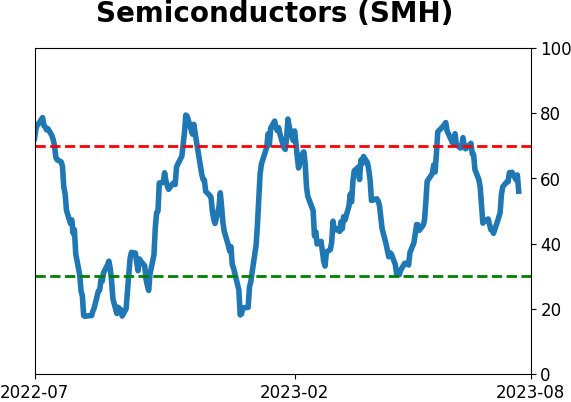
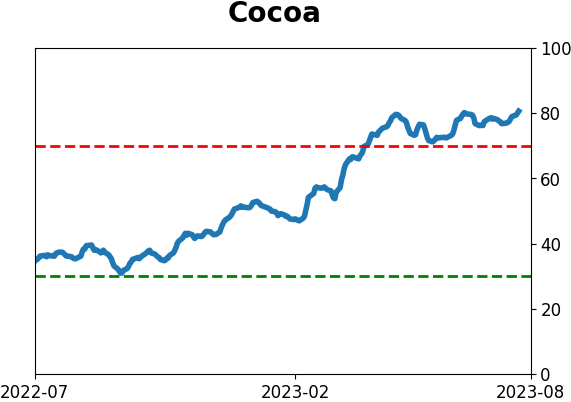
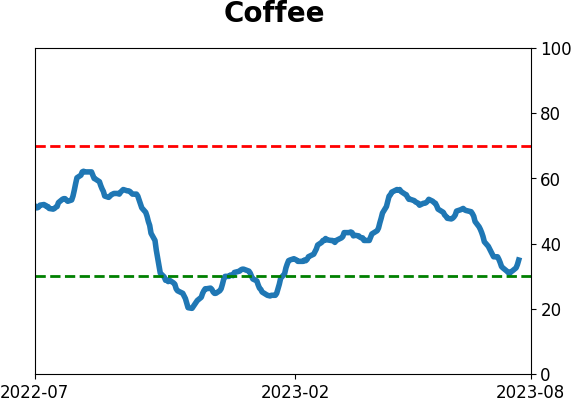
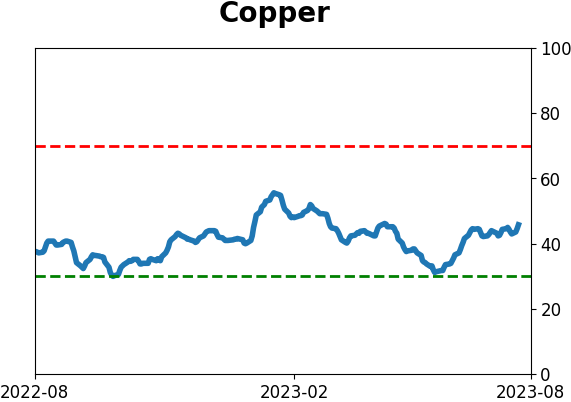
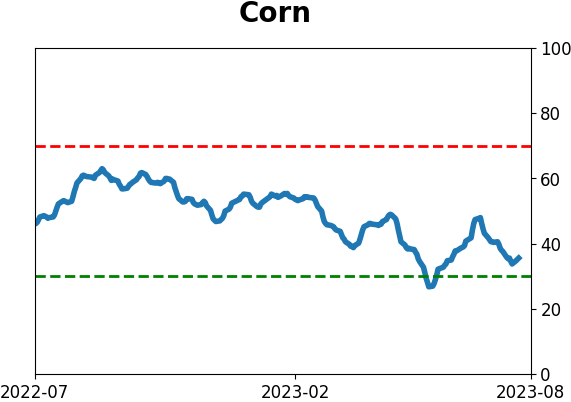
Optimism Index Thumbnails
|
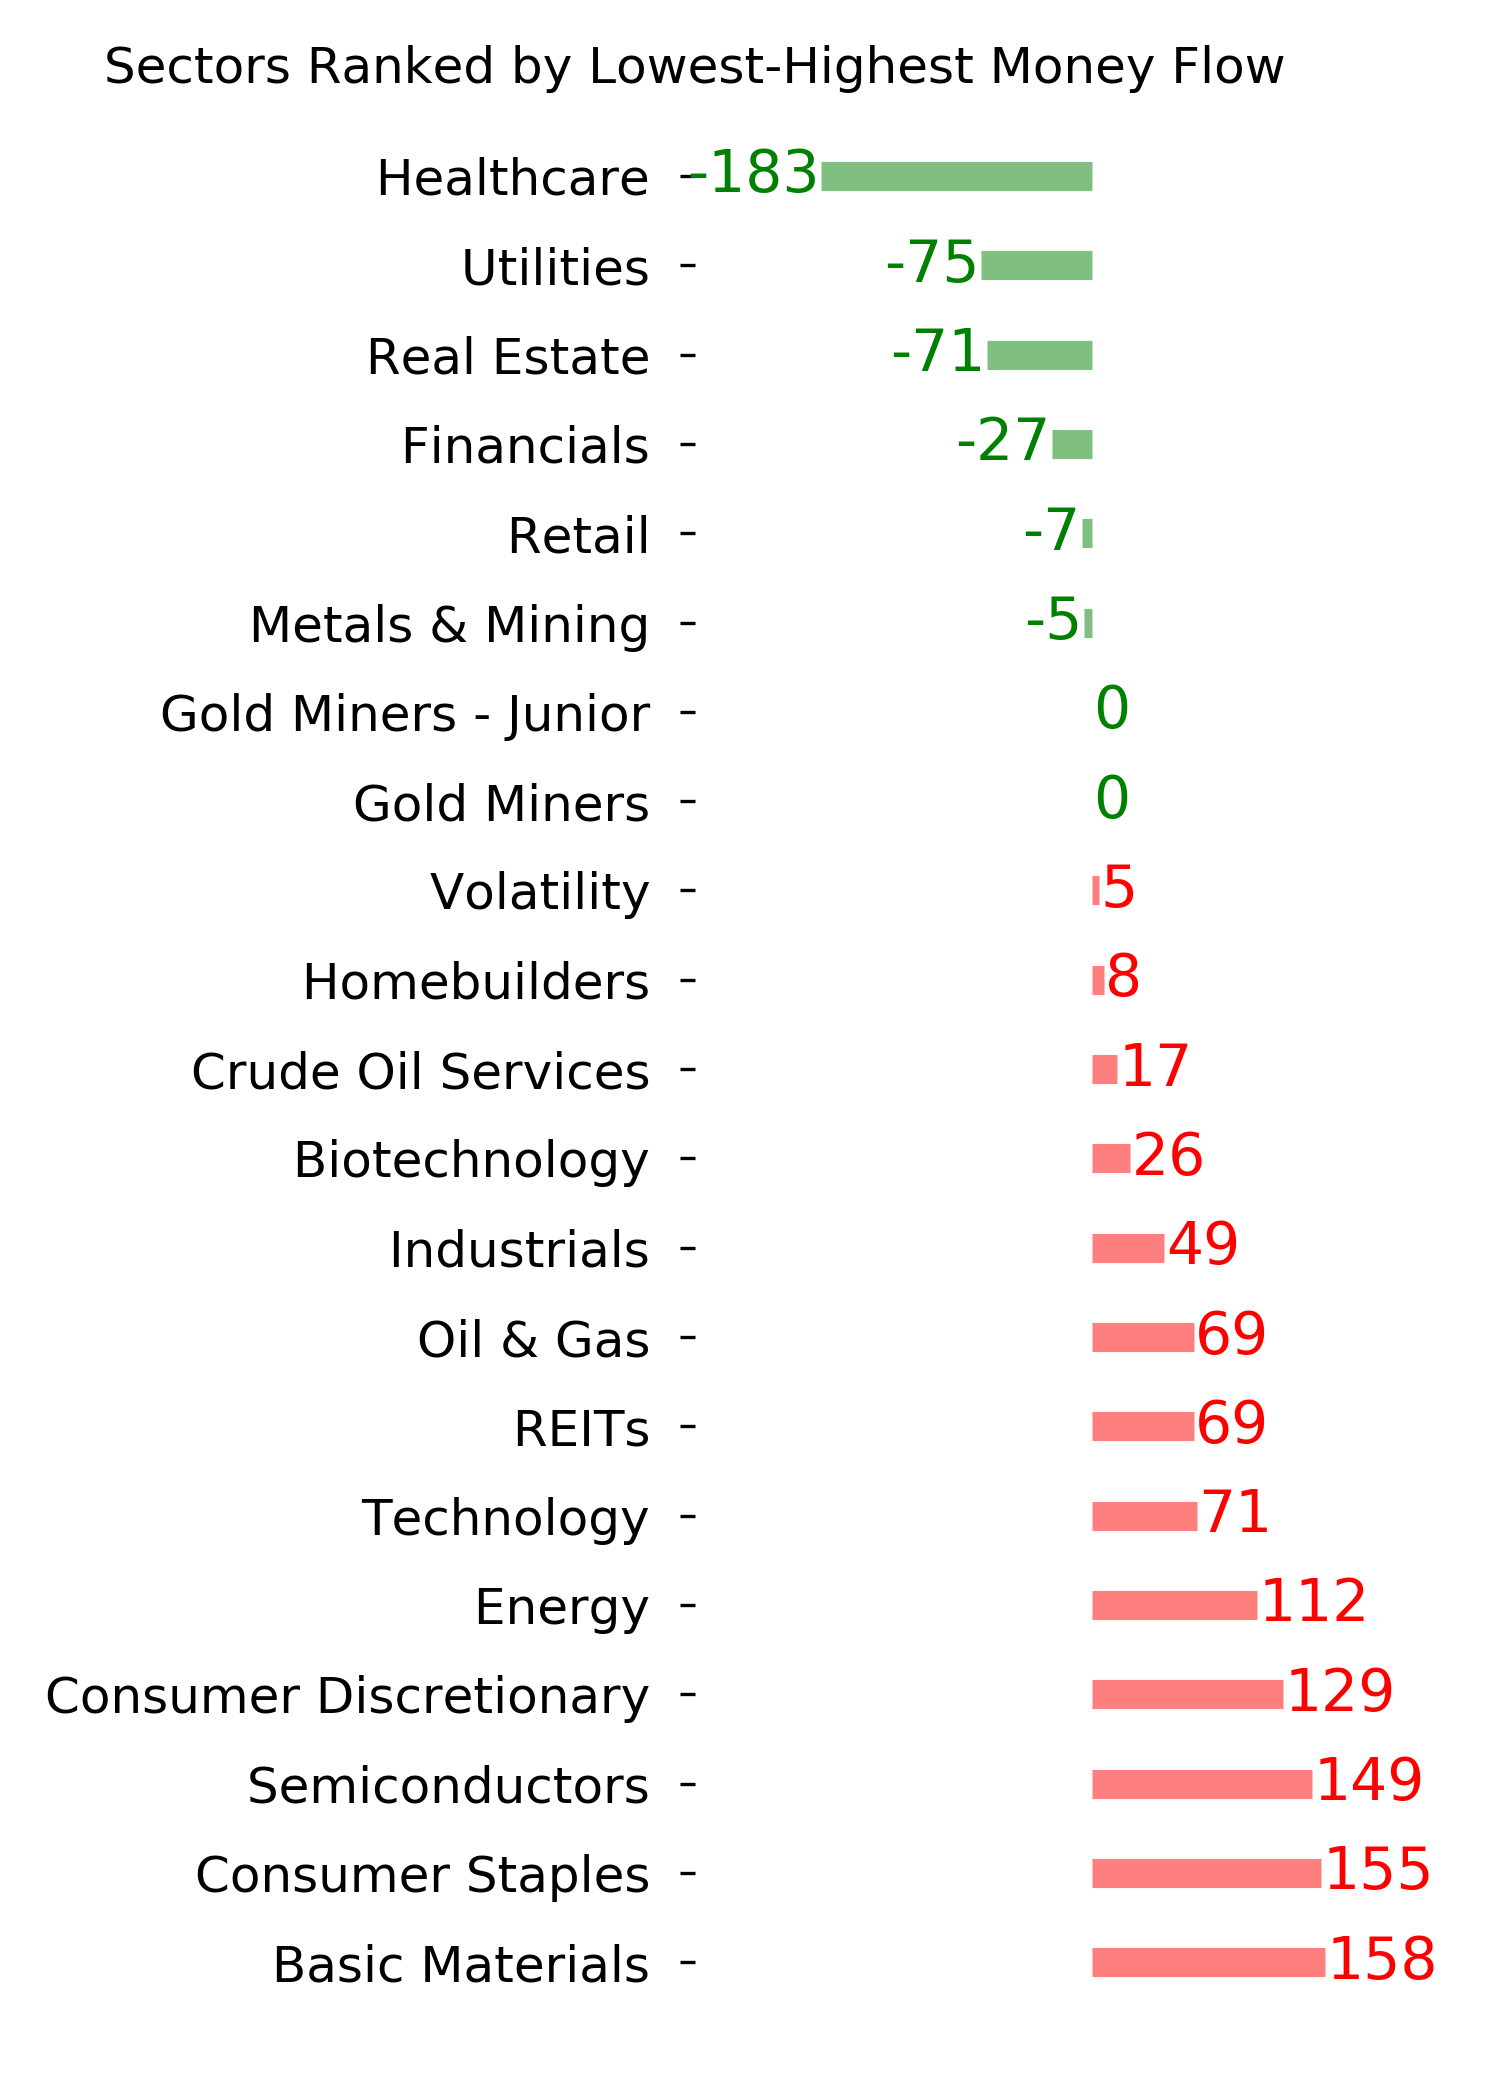
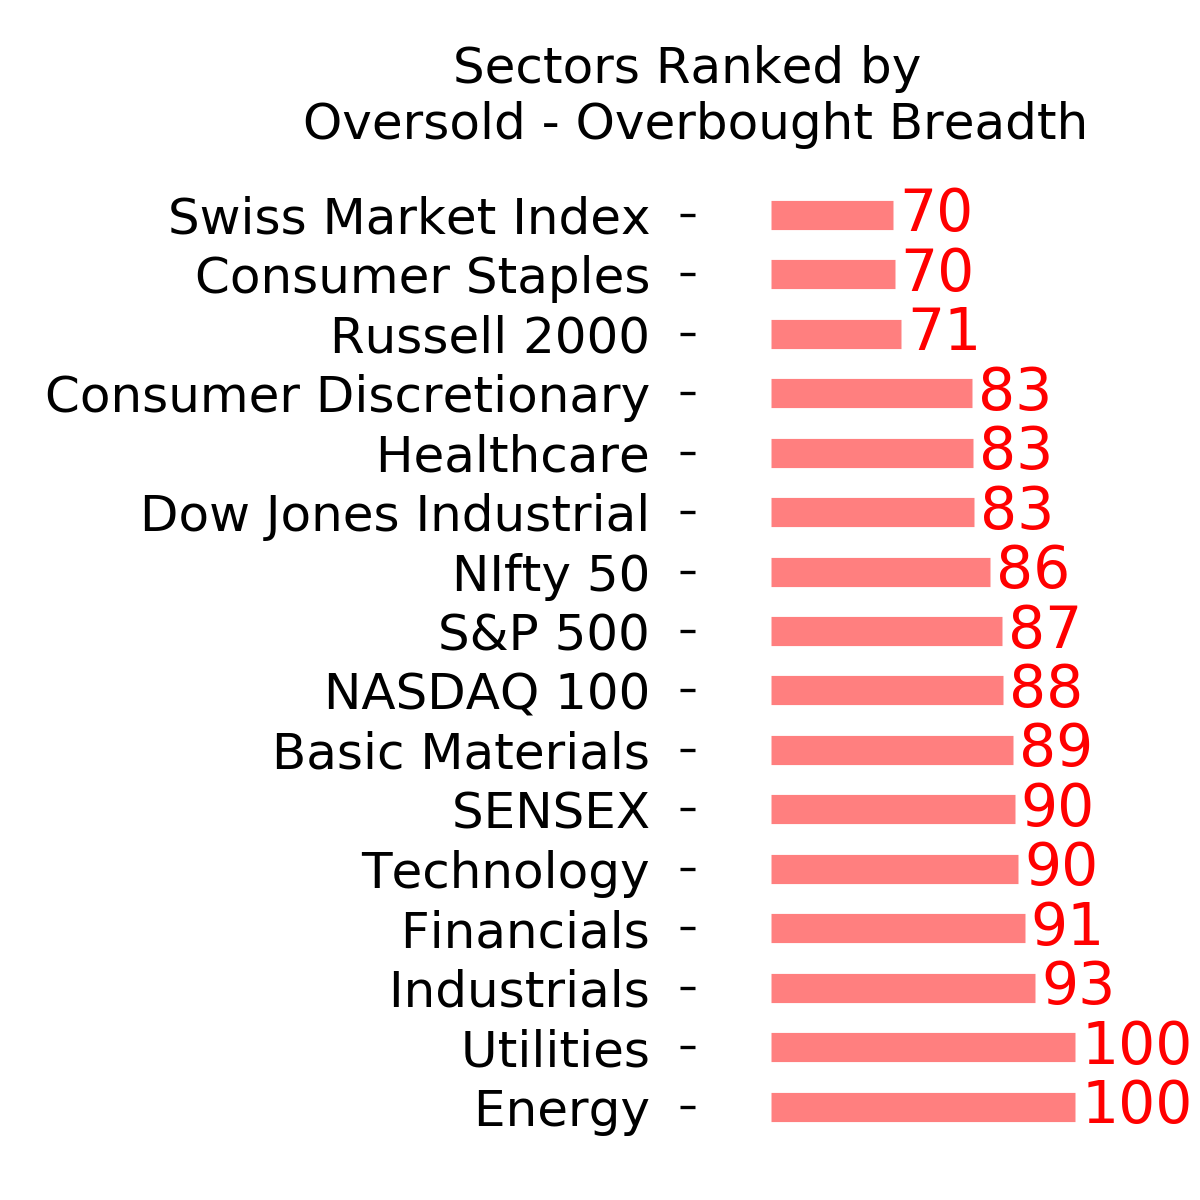
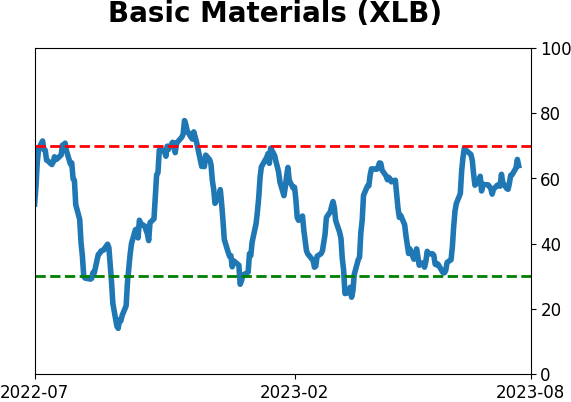
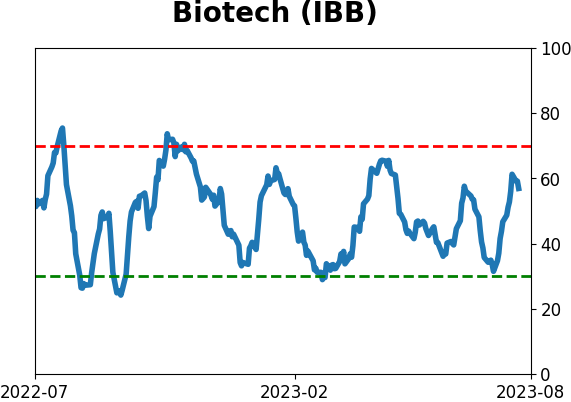
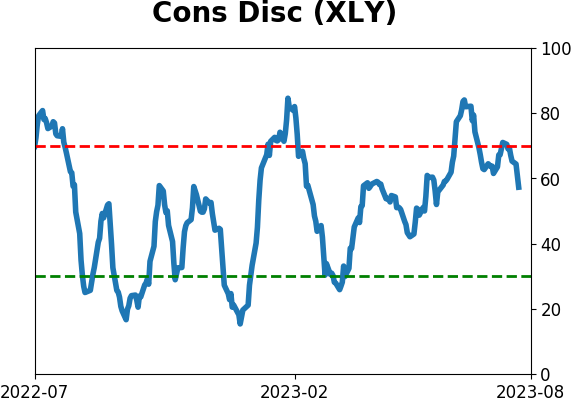
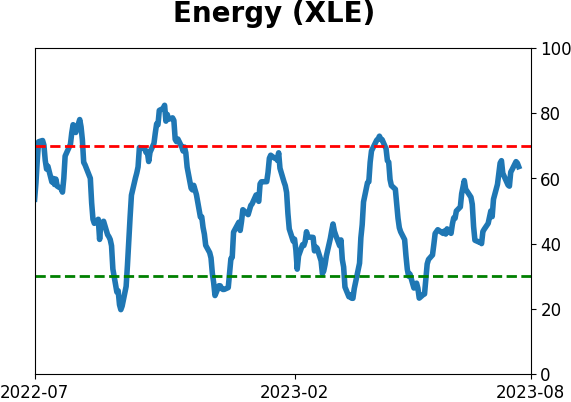
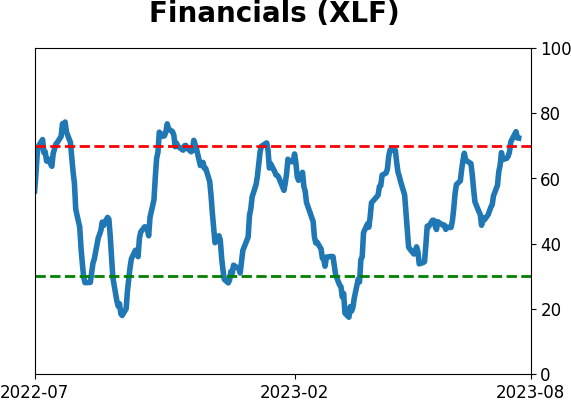
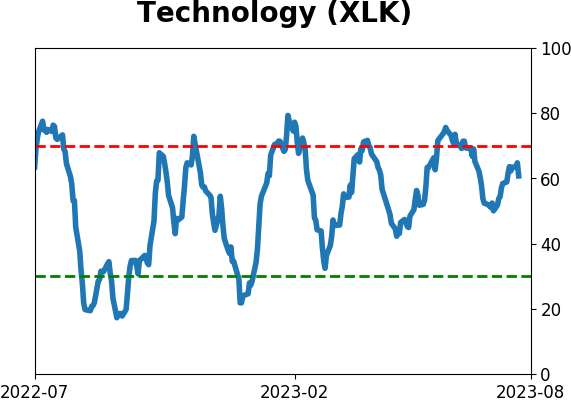
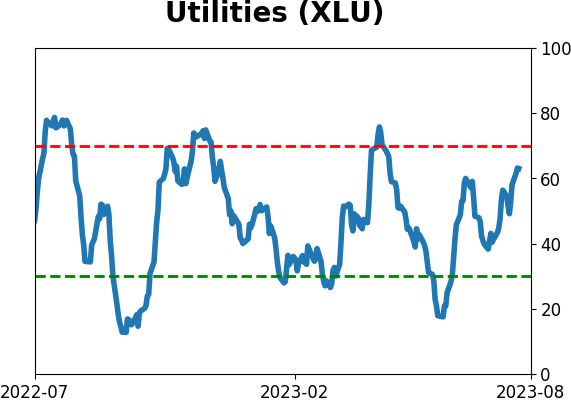
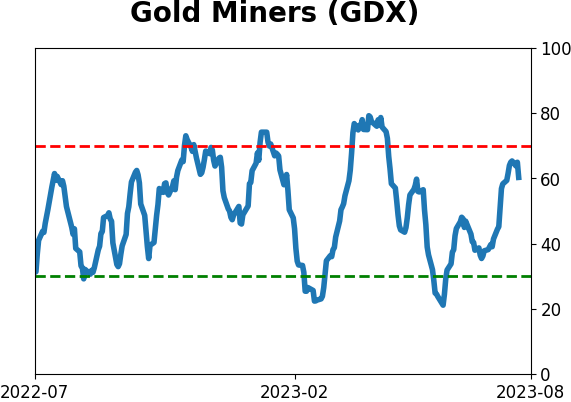
Sector ETF's - 10-Day Moving Average
|
|
|
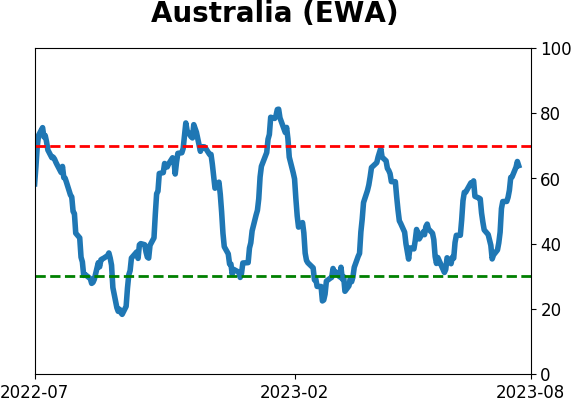
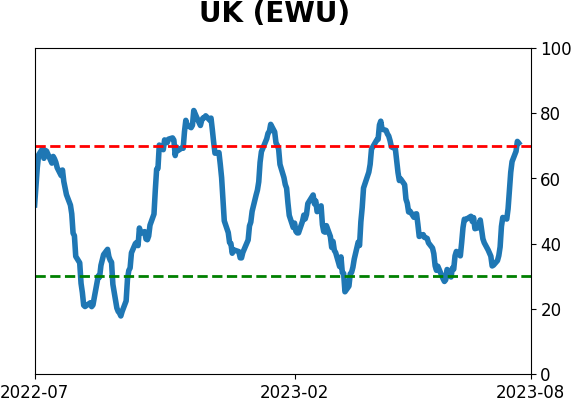
Country ETF's - 10-Day Moving Average
|
|
|
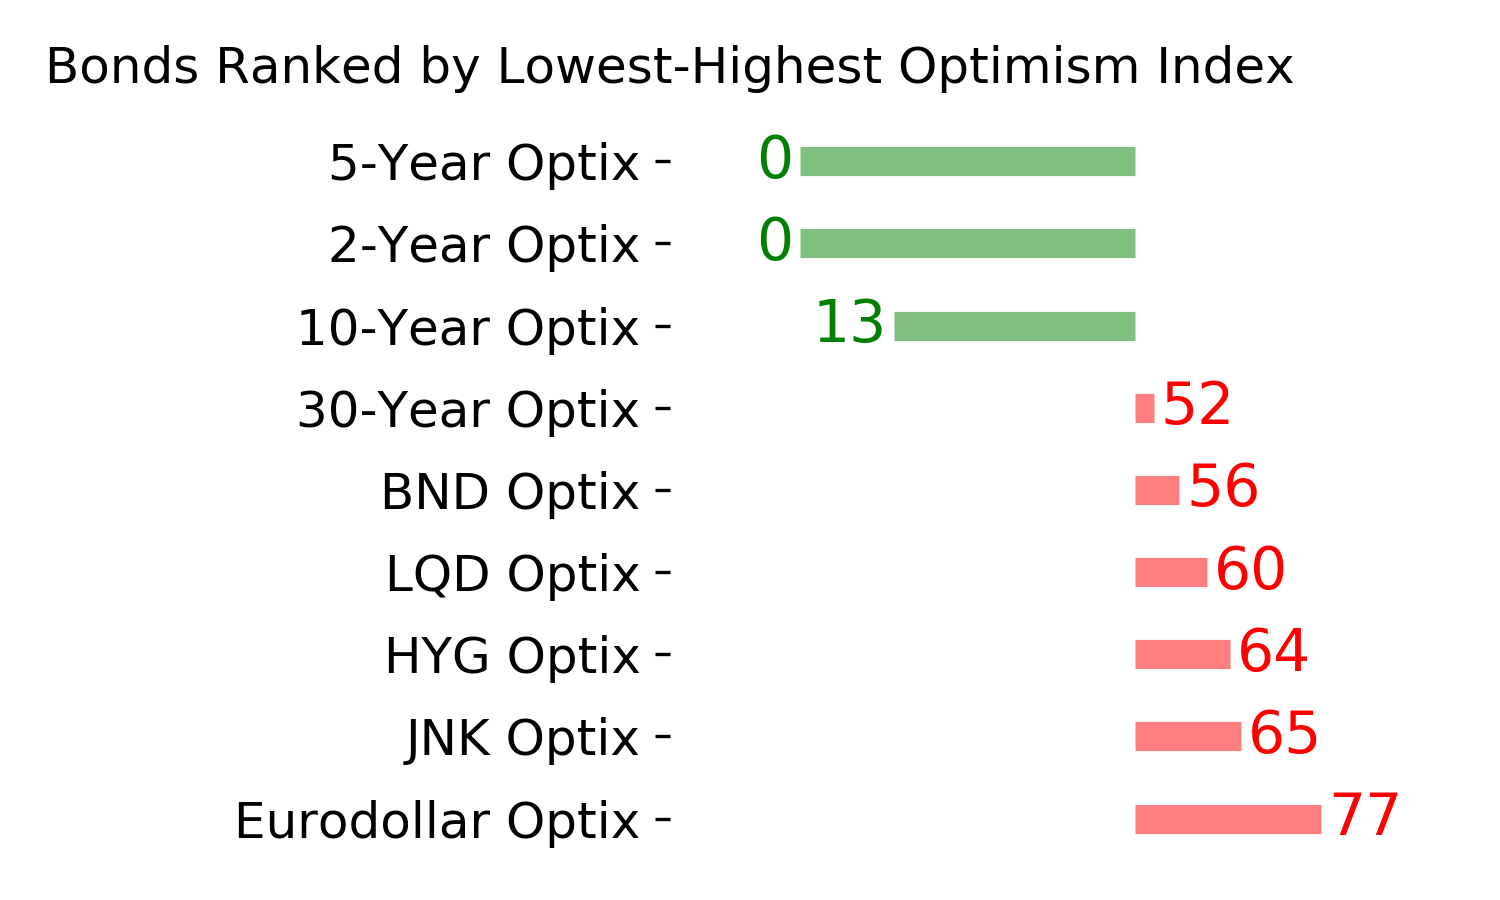
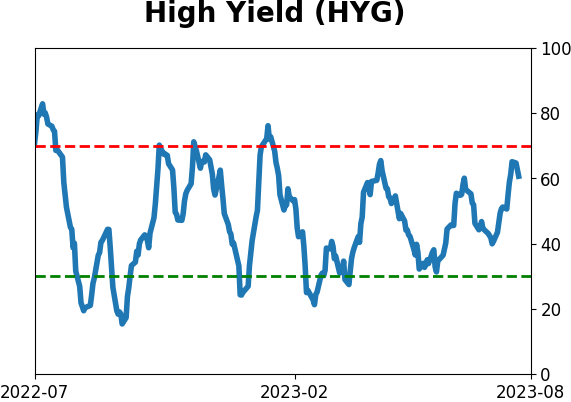
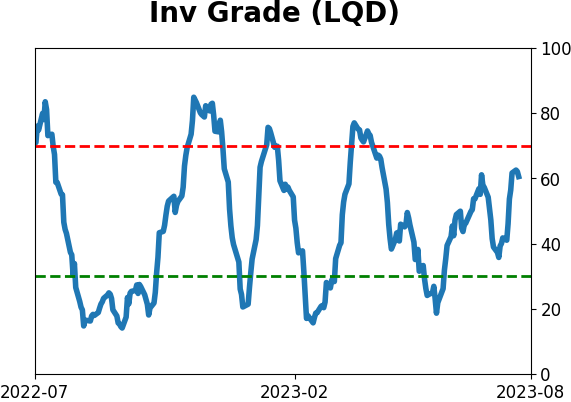
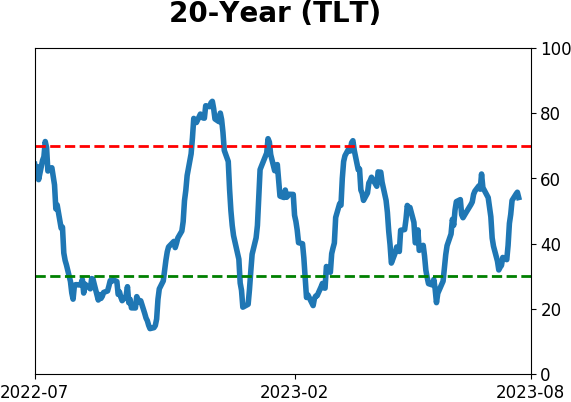
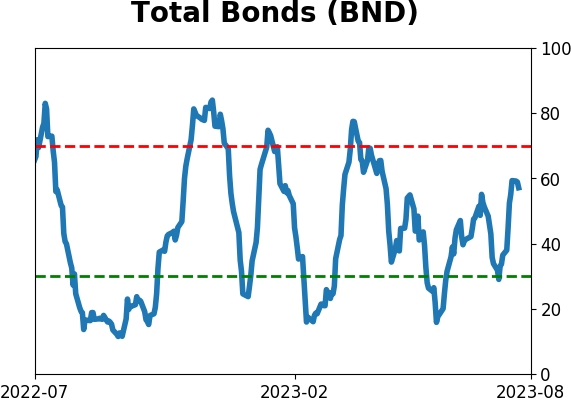
Bond ETF's - 10-Day Moving Average
|
|
|
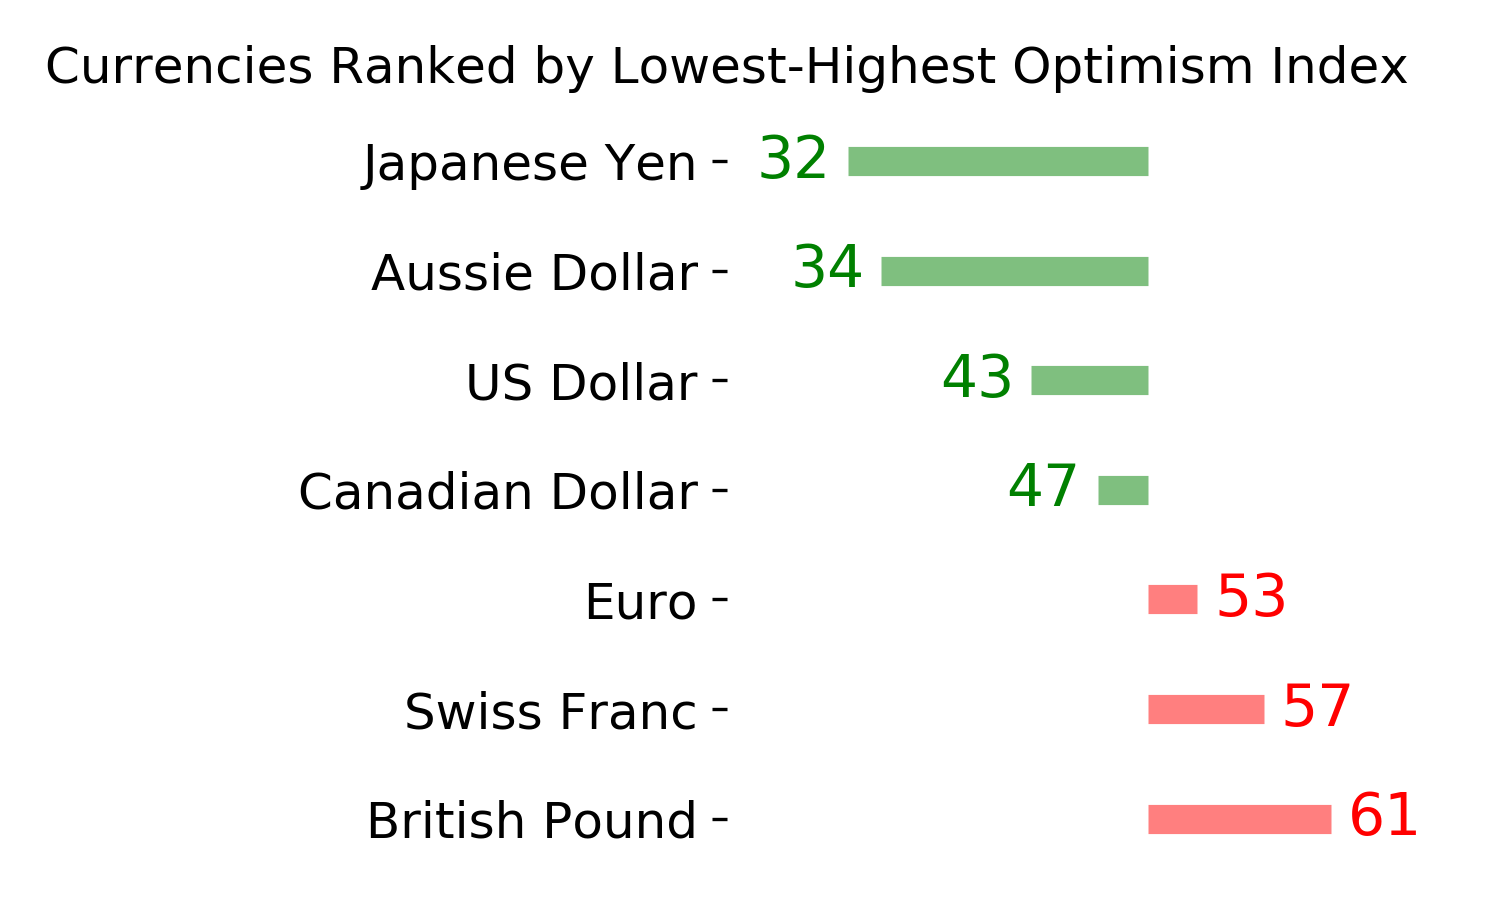
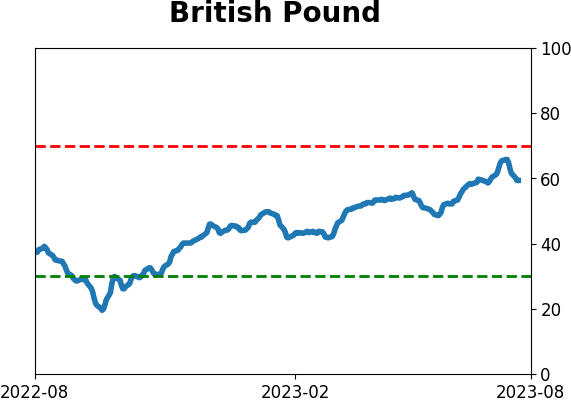
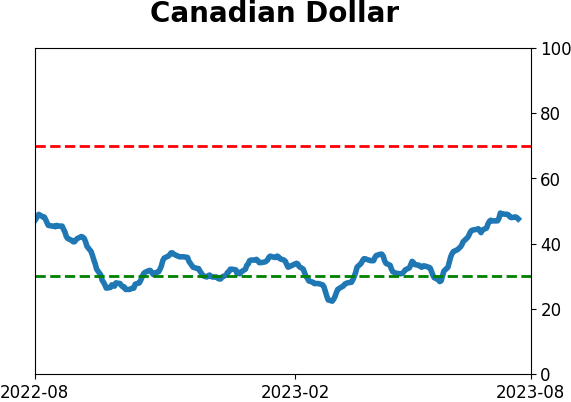
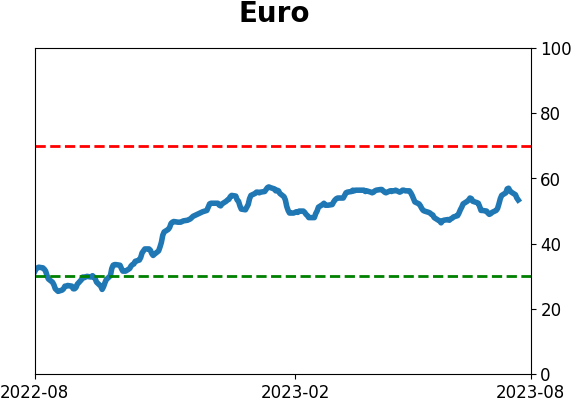
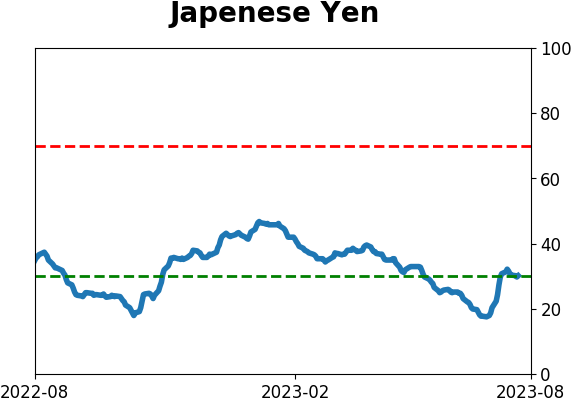
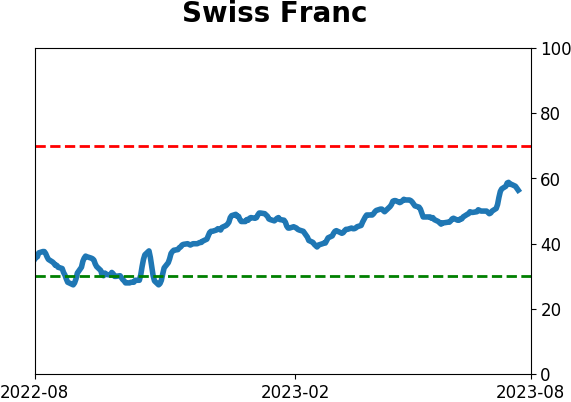
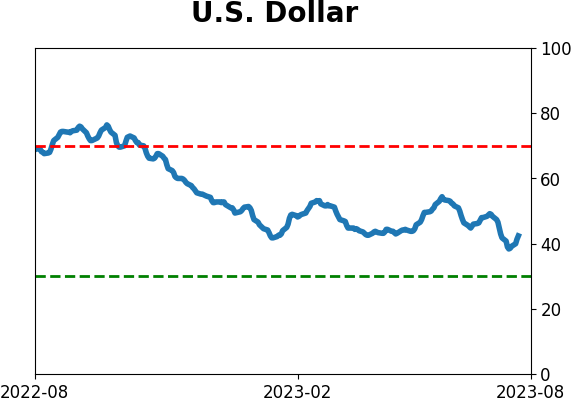
Currency ETF's - 5-Day Moving Average
|
|
|
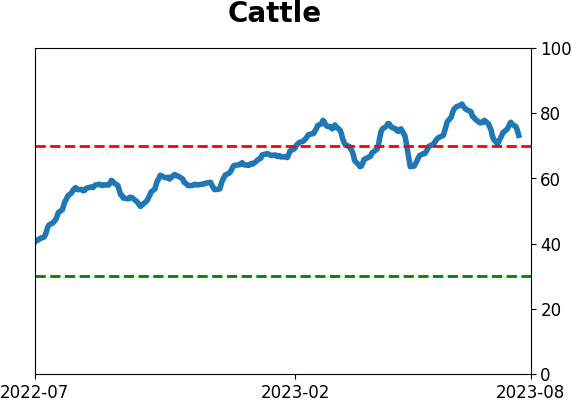
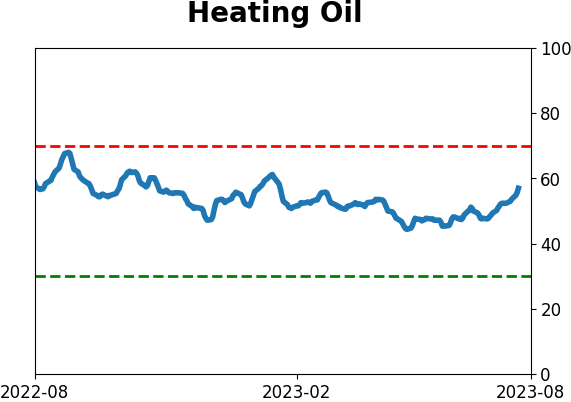
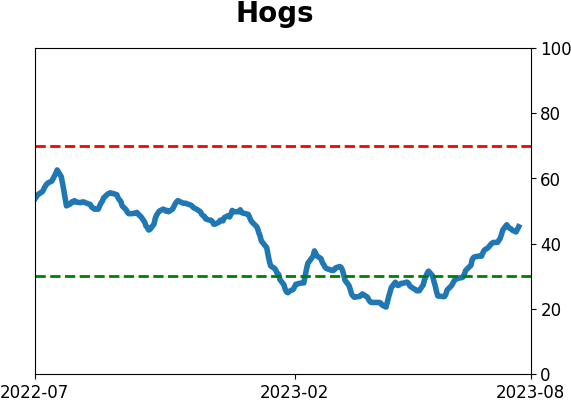
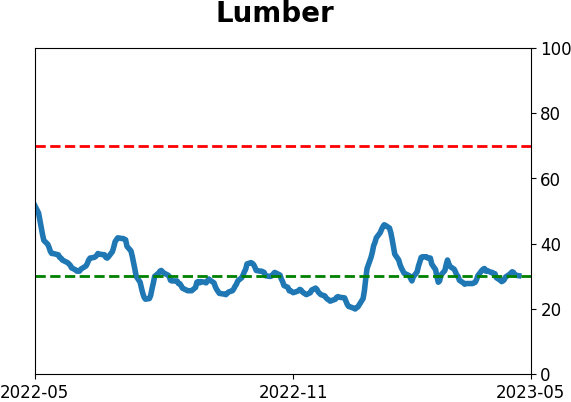
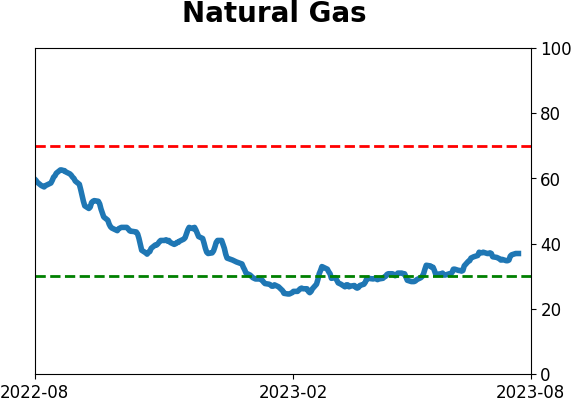
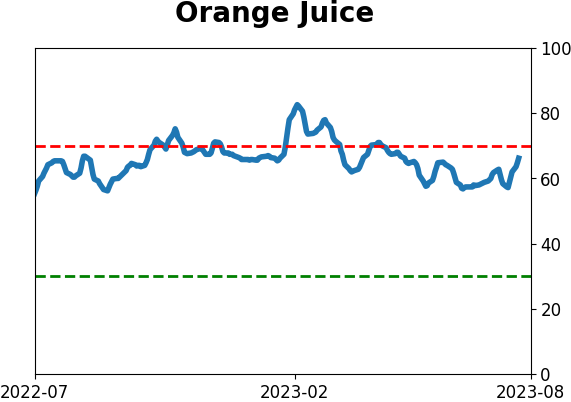
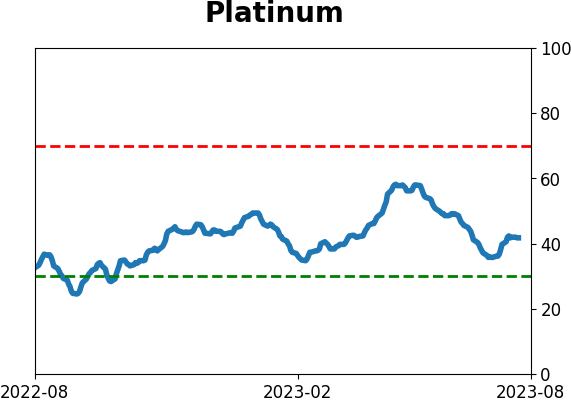
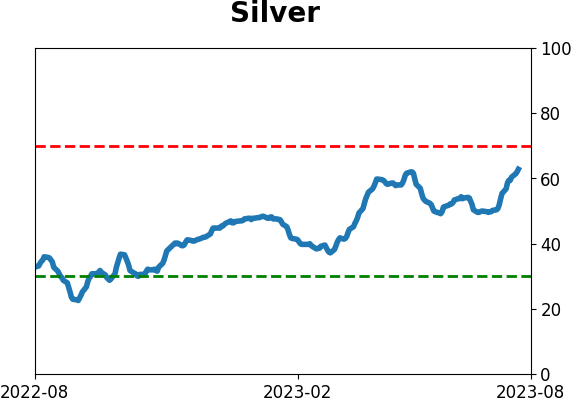
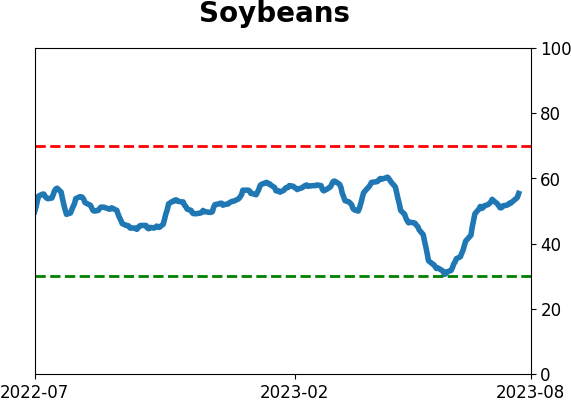
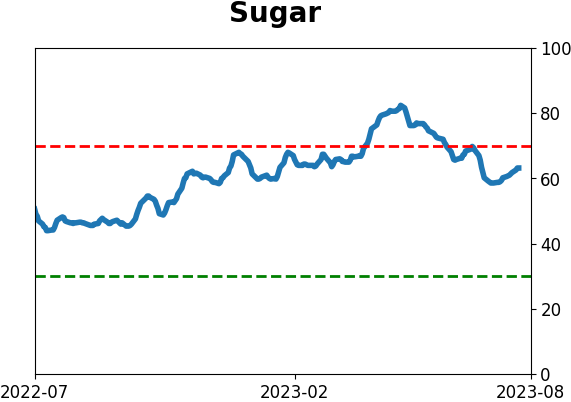
Commodity ETF's - 5-Day Moving Average
|
|