Headlines
|
|
Bond investors try to emerge from bear market mentality:
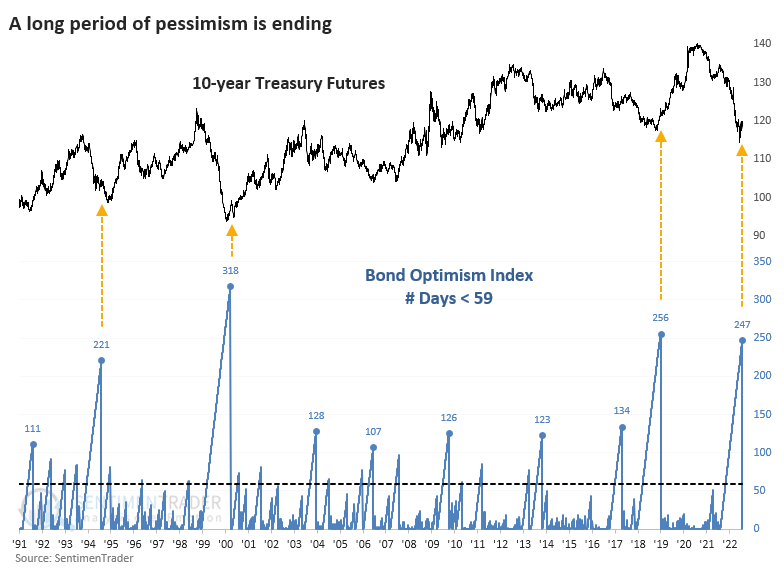
For the first time in a year, the Bond Optimism Index is nearing its threshold that we normally see in bull markets. This ends one of the longest streaks of deep pessimism in 30 years. The others coincided with the ends (or nearly so) of bear markets in bond prices. A broad aggregate of bond prices showed the best returns.
|
Smart / Dumb Money Confidence
|
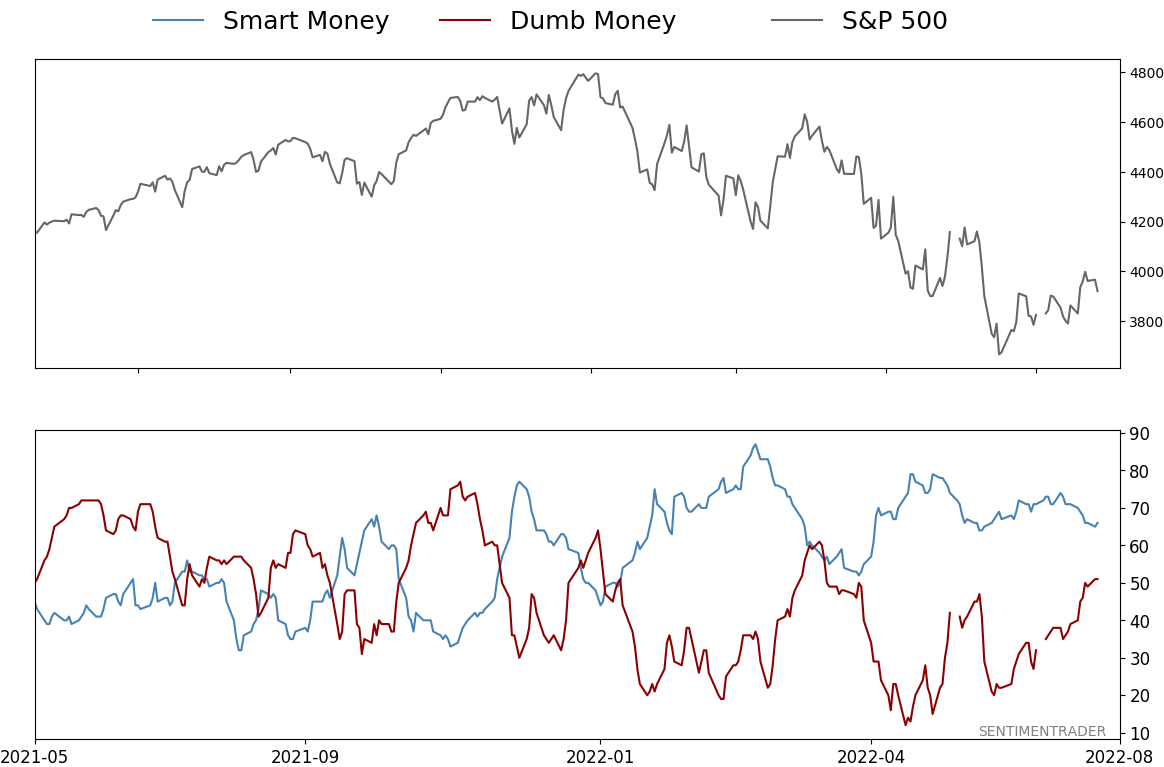
Smart Money Confidence: 66%
Dumb Money Confidence: 51%
|
|
Risk Levels
Stocks Short-Term
|
Stocks Medium-Term
|
|
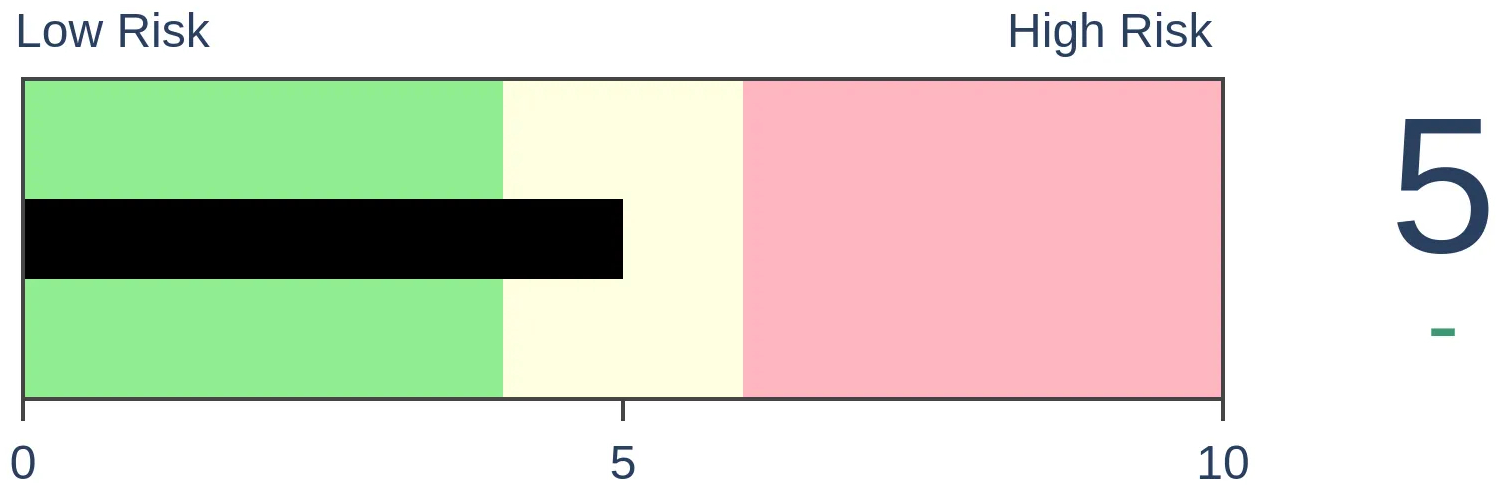
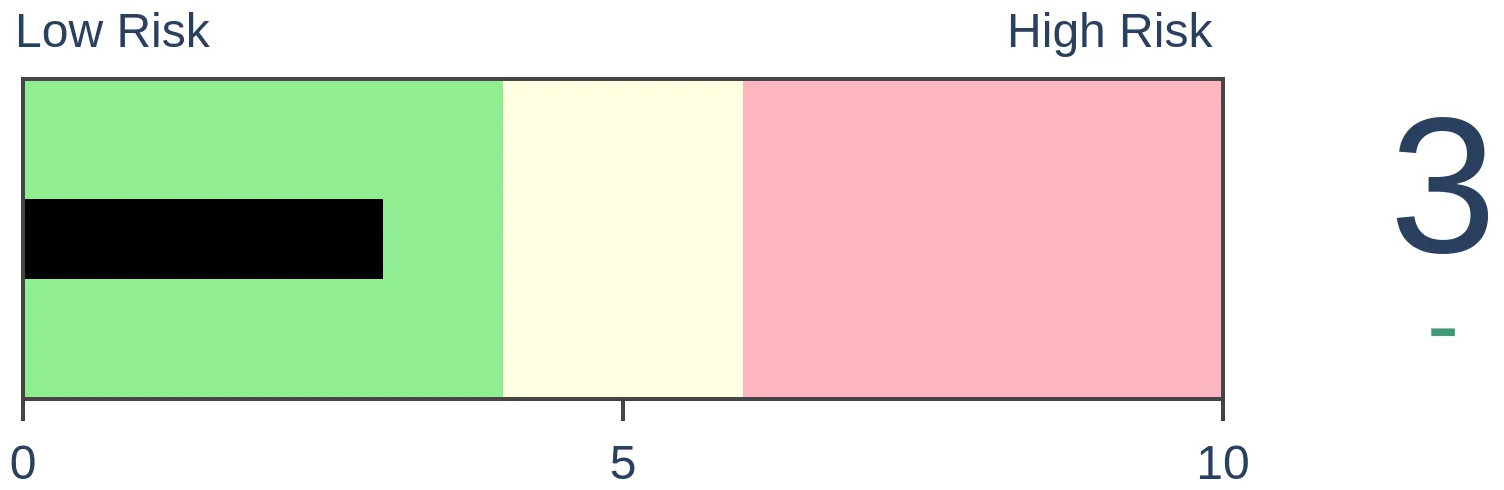
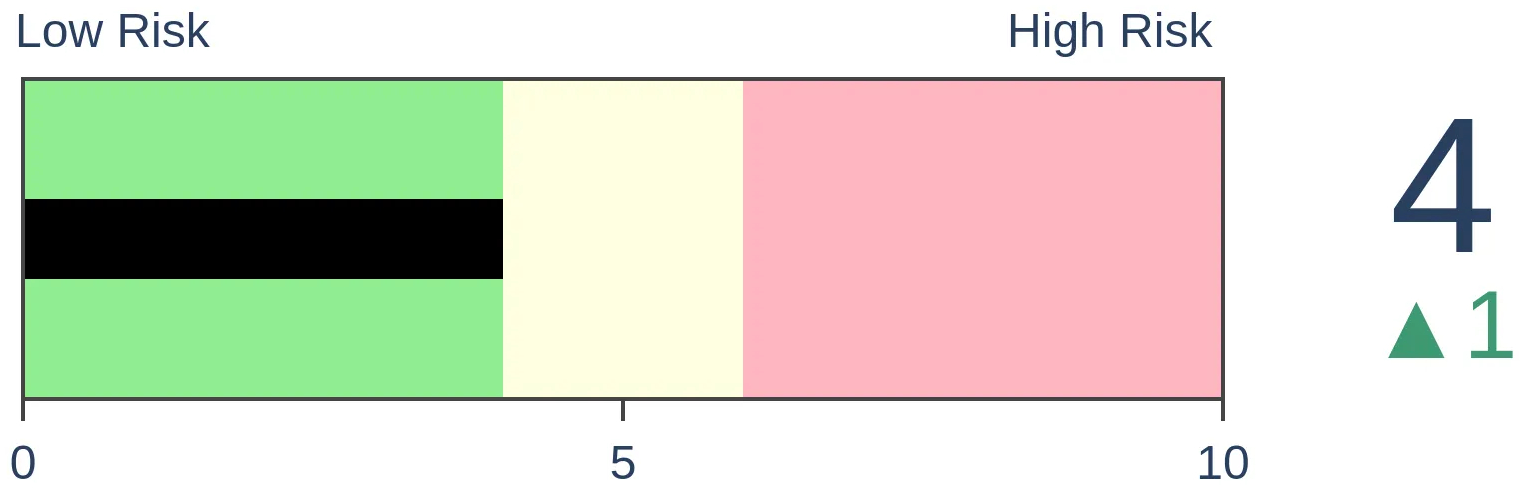
Bonds

|
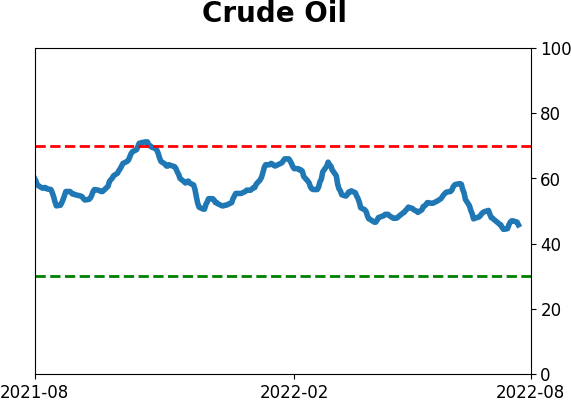
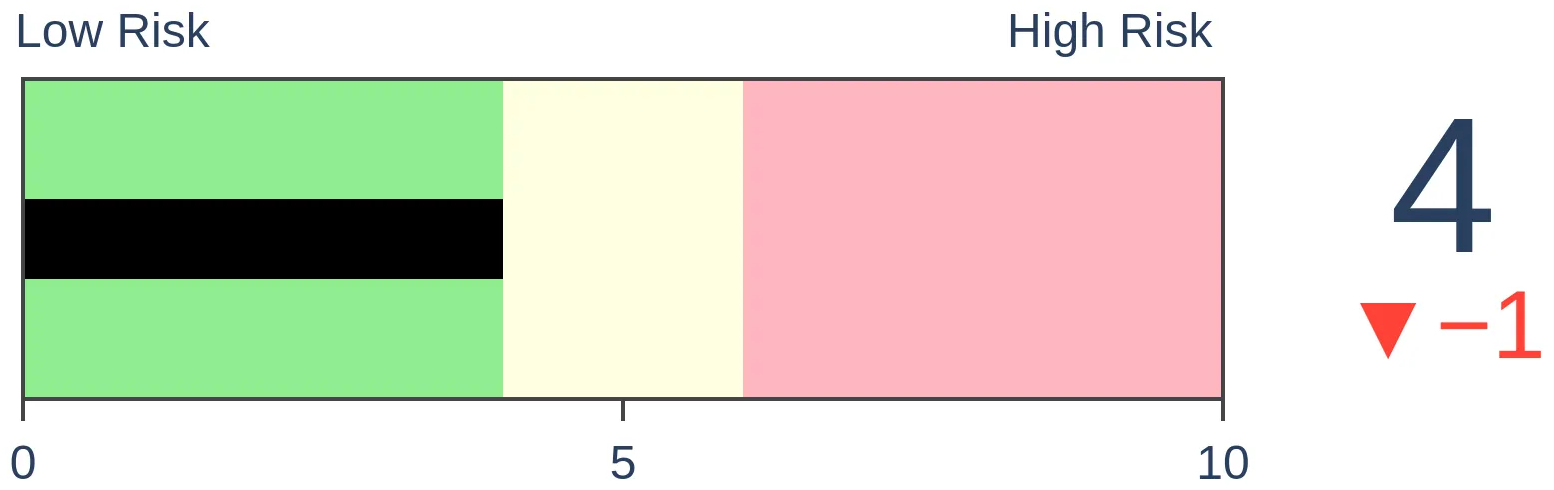
Crude Oil
|
|
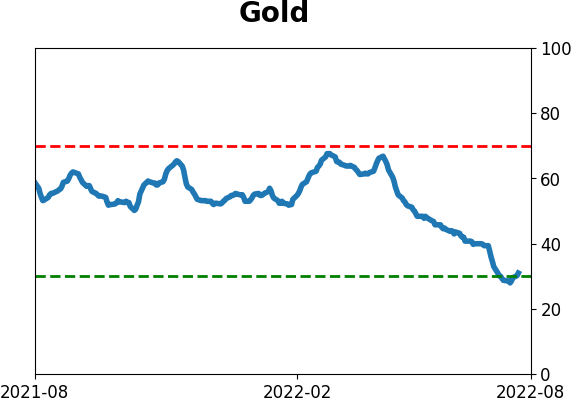
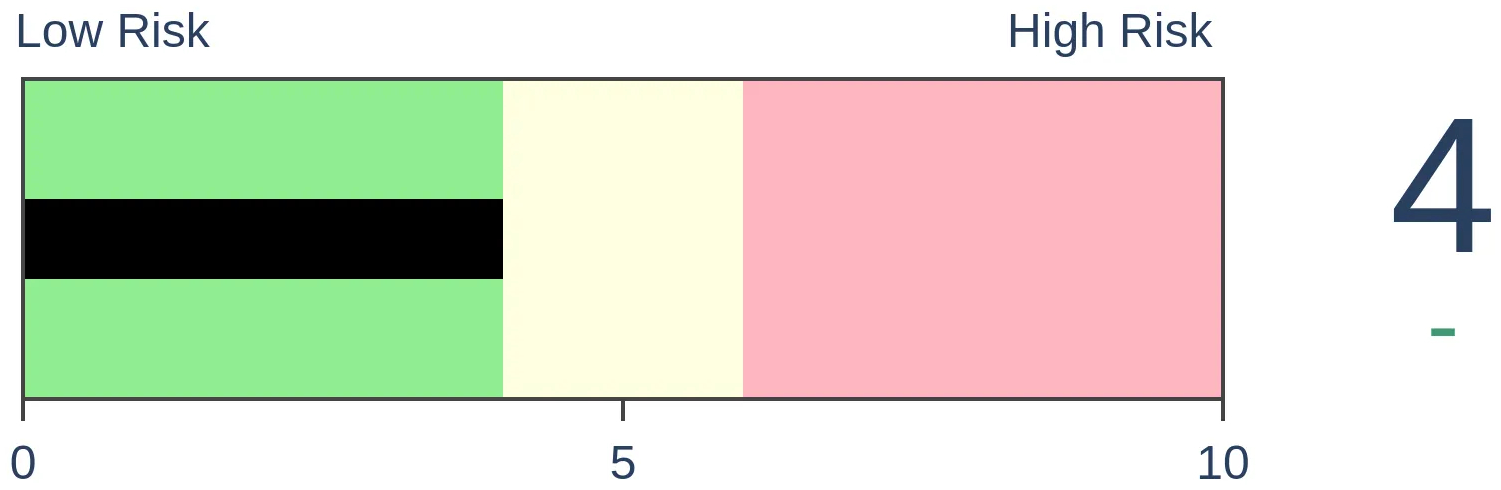
Gold
|
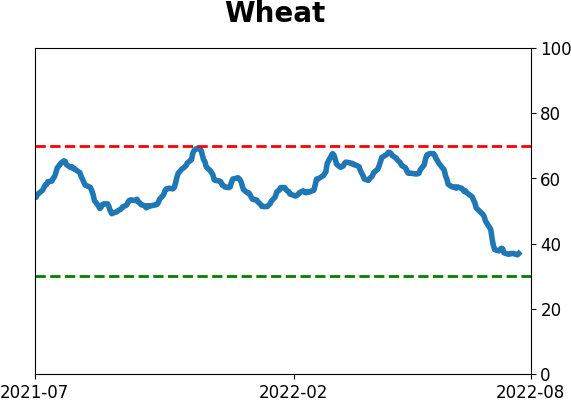
Agriculture
|
|
Research
By Jason Goepfert
BOTTOM LINE
For the first time in a year, the Bond Optimism Index is nearing its threshold that we normally see in bull markets. This ends one of the longest streaks of deep pessimism in 30 years. The others coincided with the ends (or nearly so) of bear markets in bond prices. A broad aggregate of bond prices showed the best returns.
FORECAST / TIMEFRAME
None
|
Key points:
- For the first time in a year, bond market sentiment is trying to move out of bear market territory
- The few other times this happened, it coincided with future bull markets in bond prices
- Broader bond aggregates performed best after these signals
Bond market sentiment is moving on from deep pessimism
One heuristic we touch on frequently is that investors behave differently in bull markets than in bear markets. In terms of indicators, pessimism tends to get deeper for longer, and when it moves back to neutral, selling pressure tends to set in.
In the bond market, we've certainly seen the former.
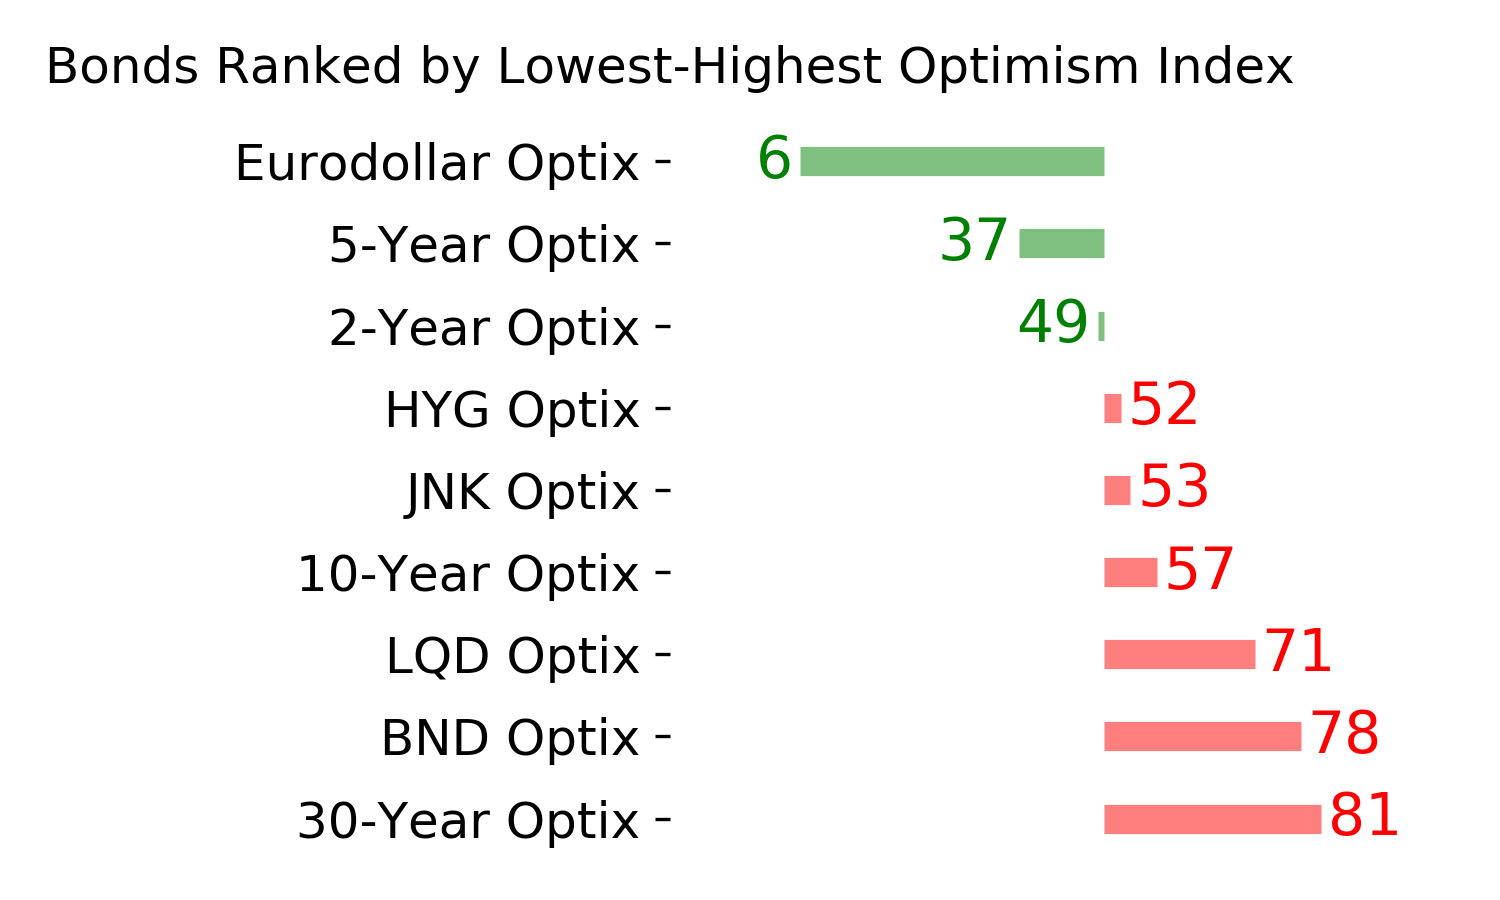
For the first time in a year, the Bond Optimism Index (Optix) has neared the 60 threshold that tends to define bull vs. bear market sentiment (not just in bonds, but across markets). Bull market sentiment spends most of its time above this level, with dips to 40 and below being brief before buyers appear. During bear markets, Optix tends to stay below 40, with moves toward 60 bringing out sellers.
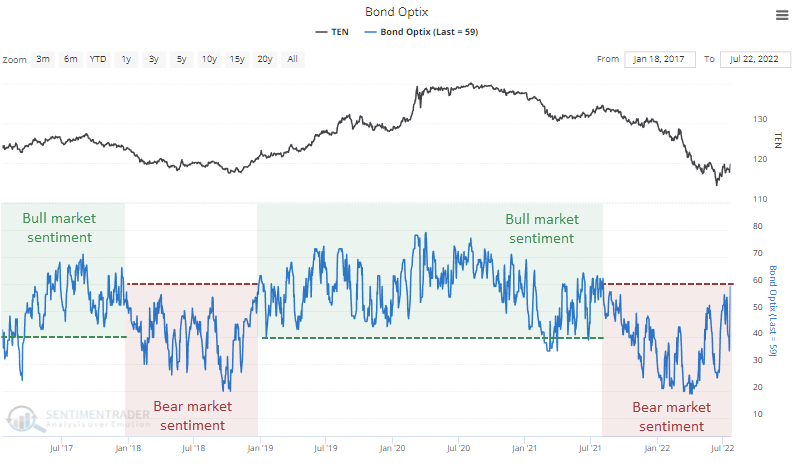
While Bond Optix hasn't quite made it to 60, it's gotten as close as possible. This is the first time in almost exactly a year that it has been this high. The others triggered near the ends of the most significant bear markets in bond prices over the past 30 years.
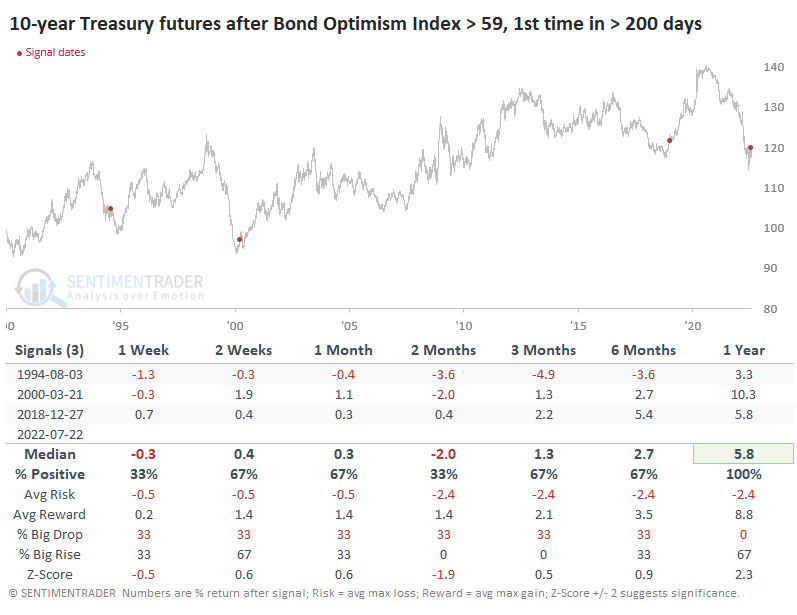
Recovery from deep pessimism shows good forward returns for aggregates
The table below shows returns in 10-year Treasury futures after the Bond Optix recovered for the first time in over 200 days. Granted, the sample size is tiny, and there were some medium-term losses in 1994, but one-year returns were solid in each case.
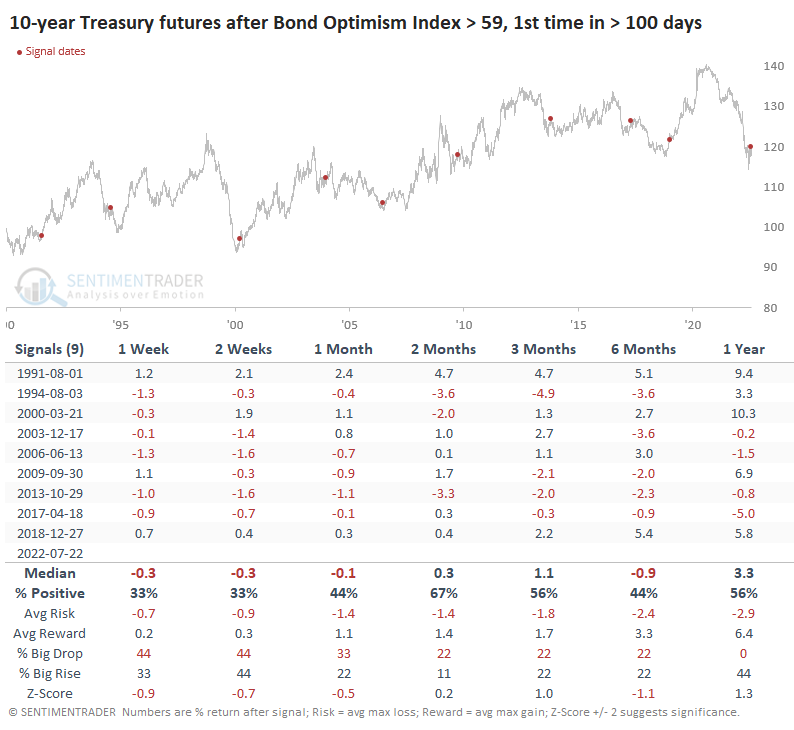
Looking at lesser extremes, the first reading of 59 or higher in more than 100 sessions, returns deteriorated significantly. This is an issue - bond bulls should want to see the positive returns hold up, and these did not. The biggest "but..." argument would be that the poor sentiment had continued for so long this time, as noted above.
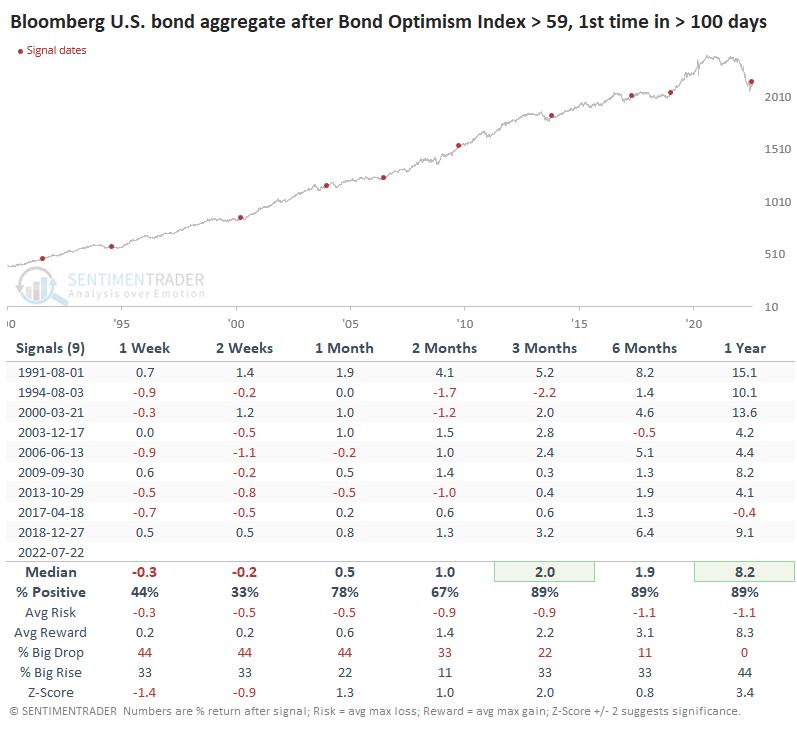
Returns in the Bloomberg U.S. bond aggregate total return tended to be significantly better, which is not a big surprise since it incorporates income and not just price return. The index is heavily weighted toward Treasuries but also includes mortgages, corporates, and asset-backed securities.
What the research tells us...
So many markets have carved out historic moves this year; it's no wonder that investors are selling and trying to hide in cash. Even then, they're losing significant funds due to rampant inflation. That's why sentiment is in the gutter across a wide variety of markets. For bonds, there are nascent signs that investors (actual investors, not traders) are returning. That should be a good sign, especially for the broader bond market. Like other markets, though, it's hard to have high confidence in this due to failed moves throughout the year so far.
Indicators at Extremes
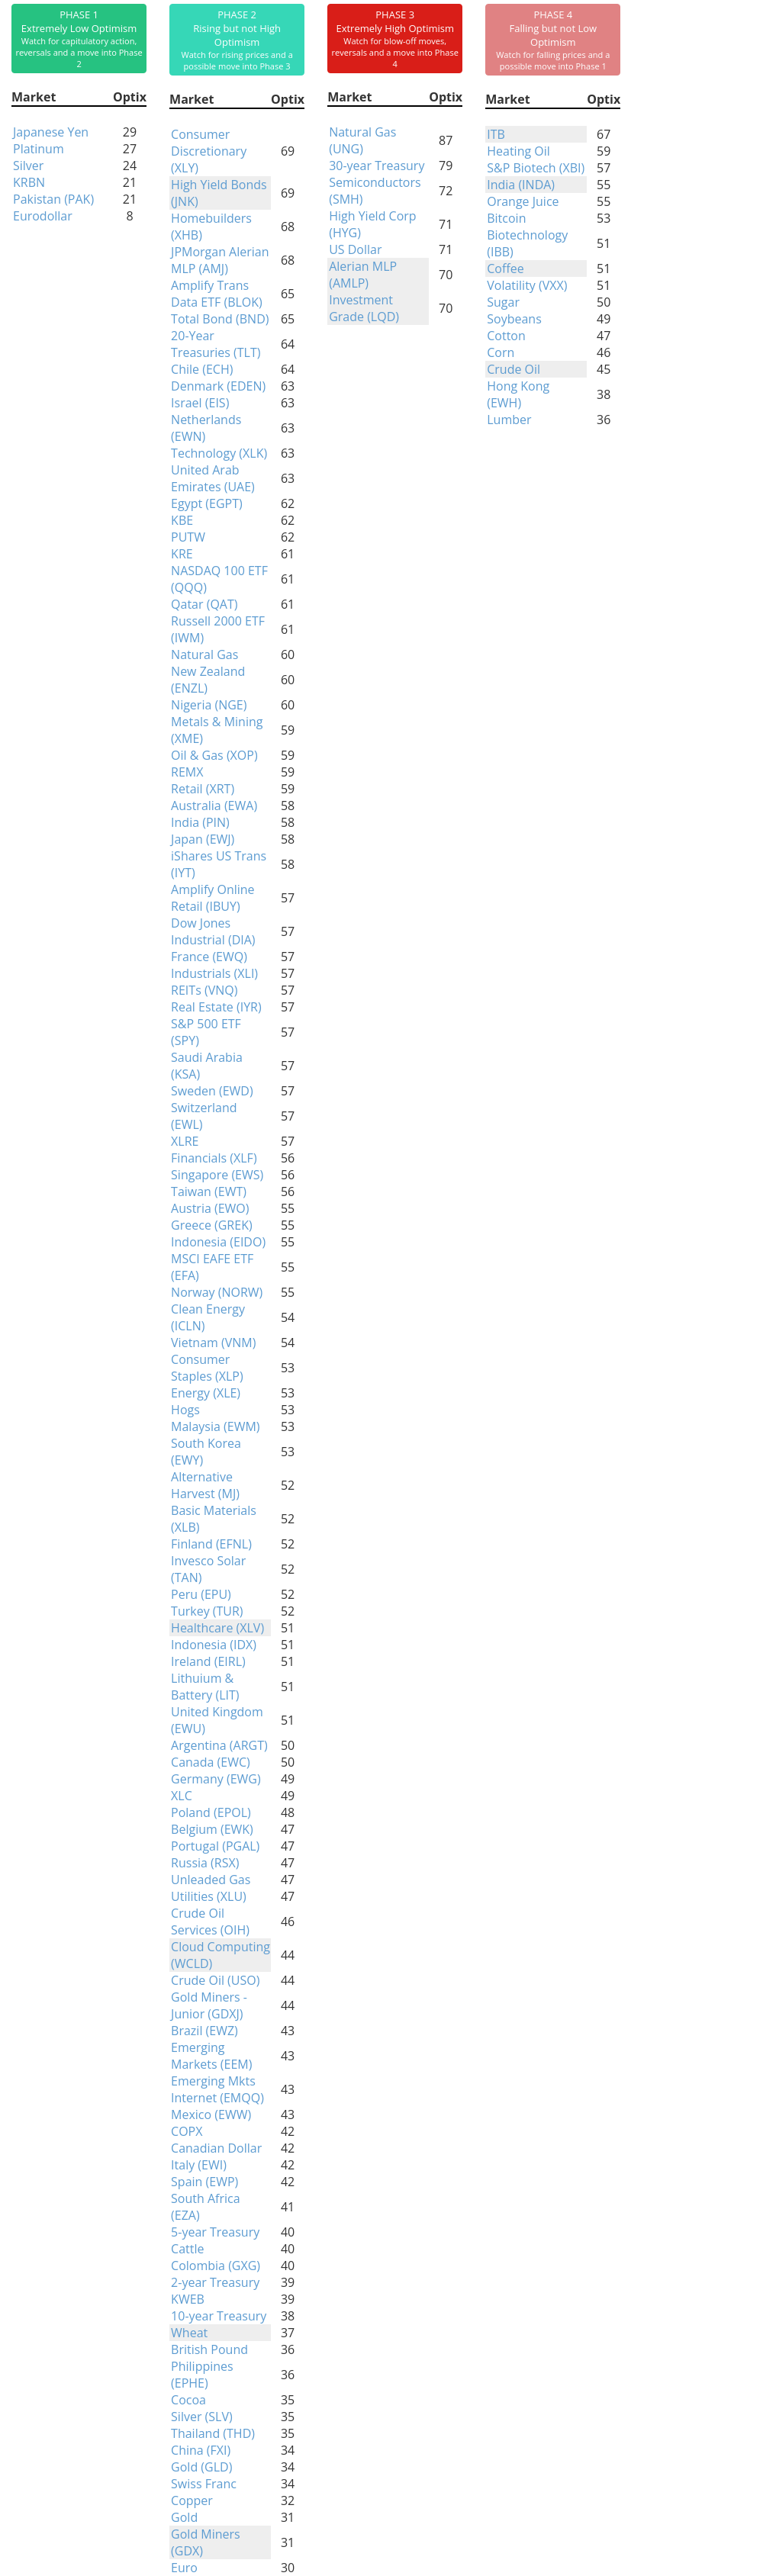
Phase Table
Ranks
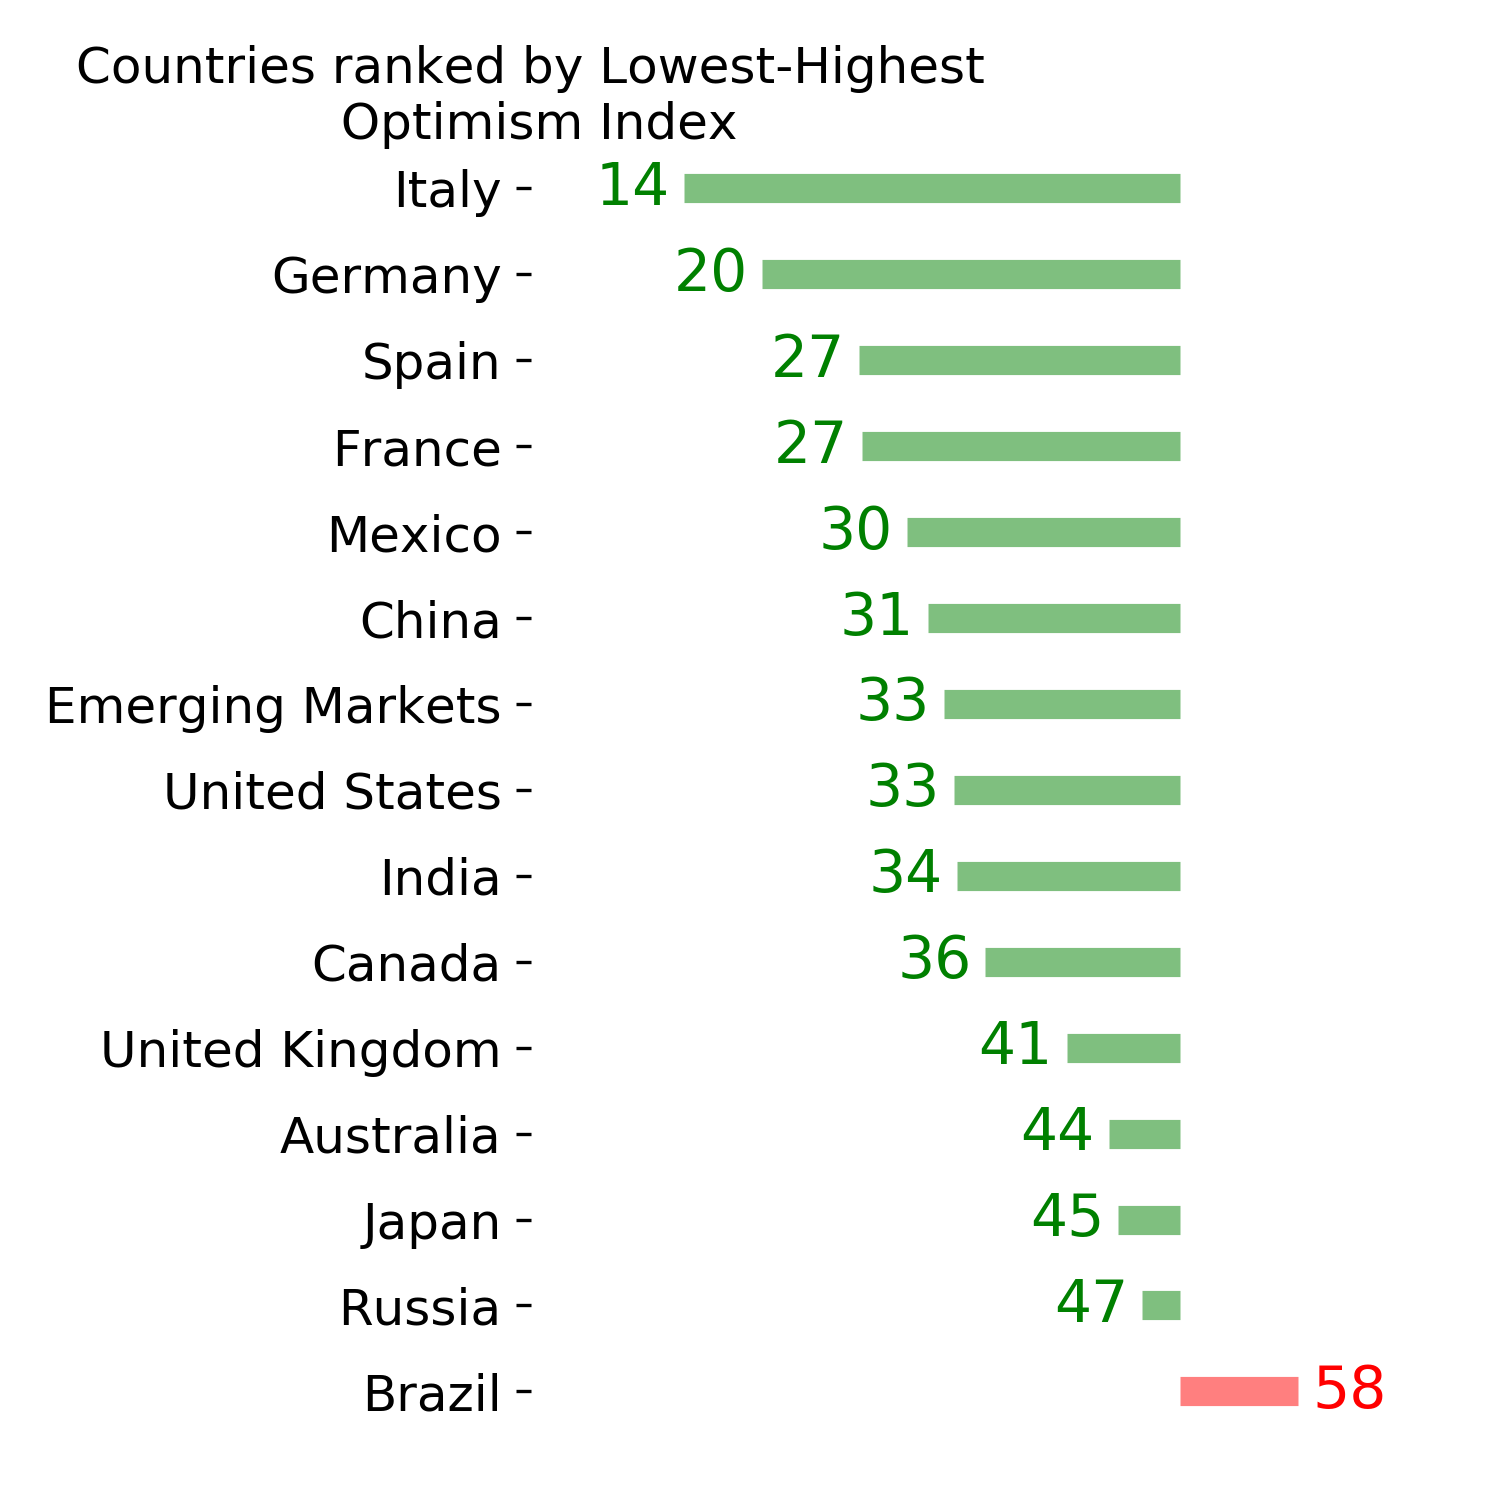
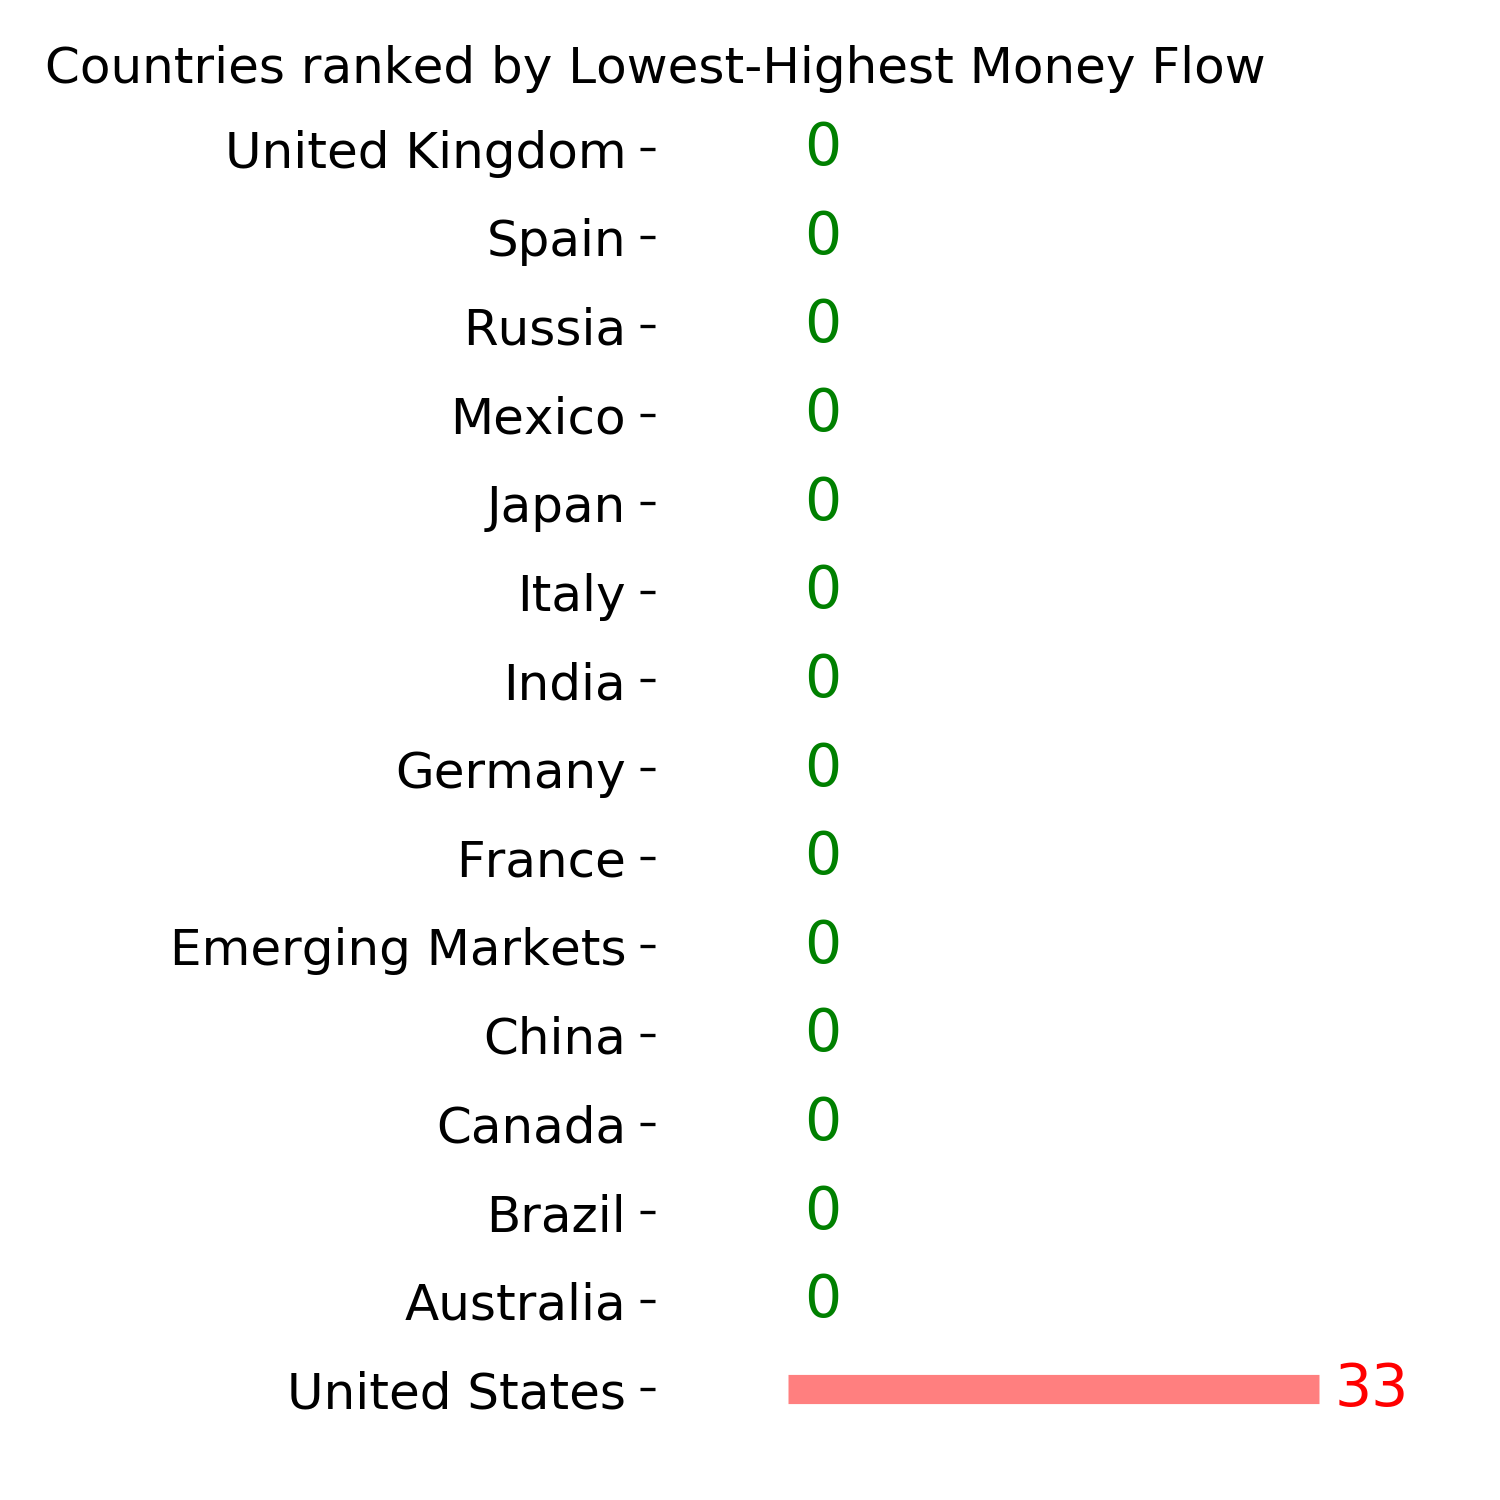
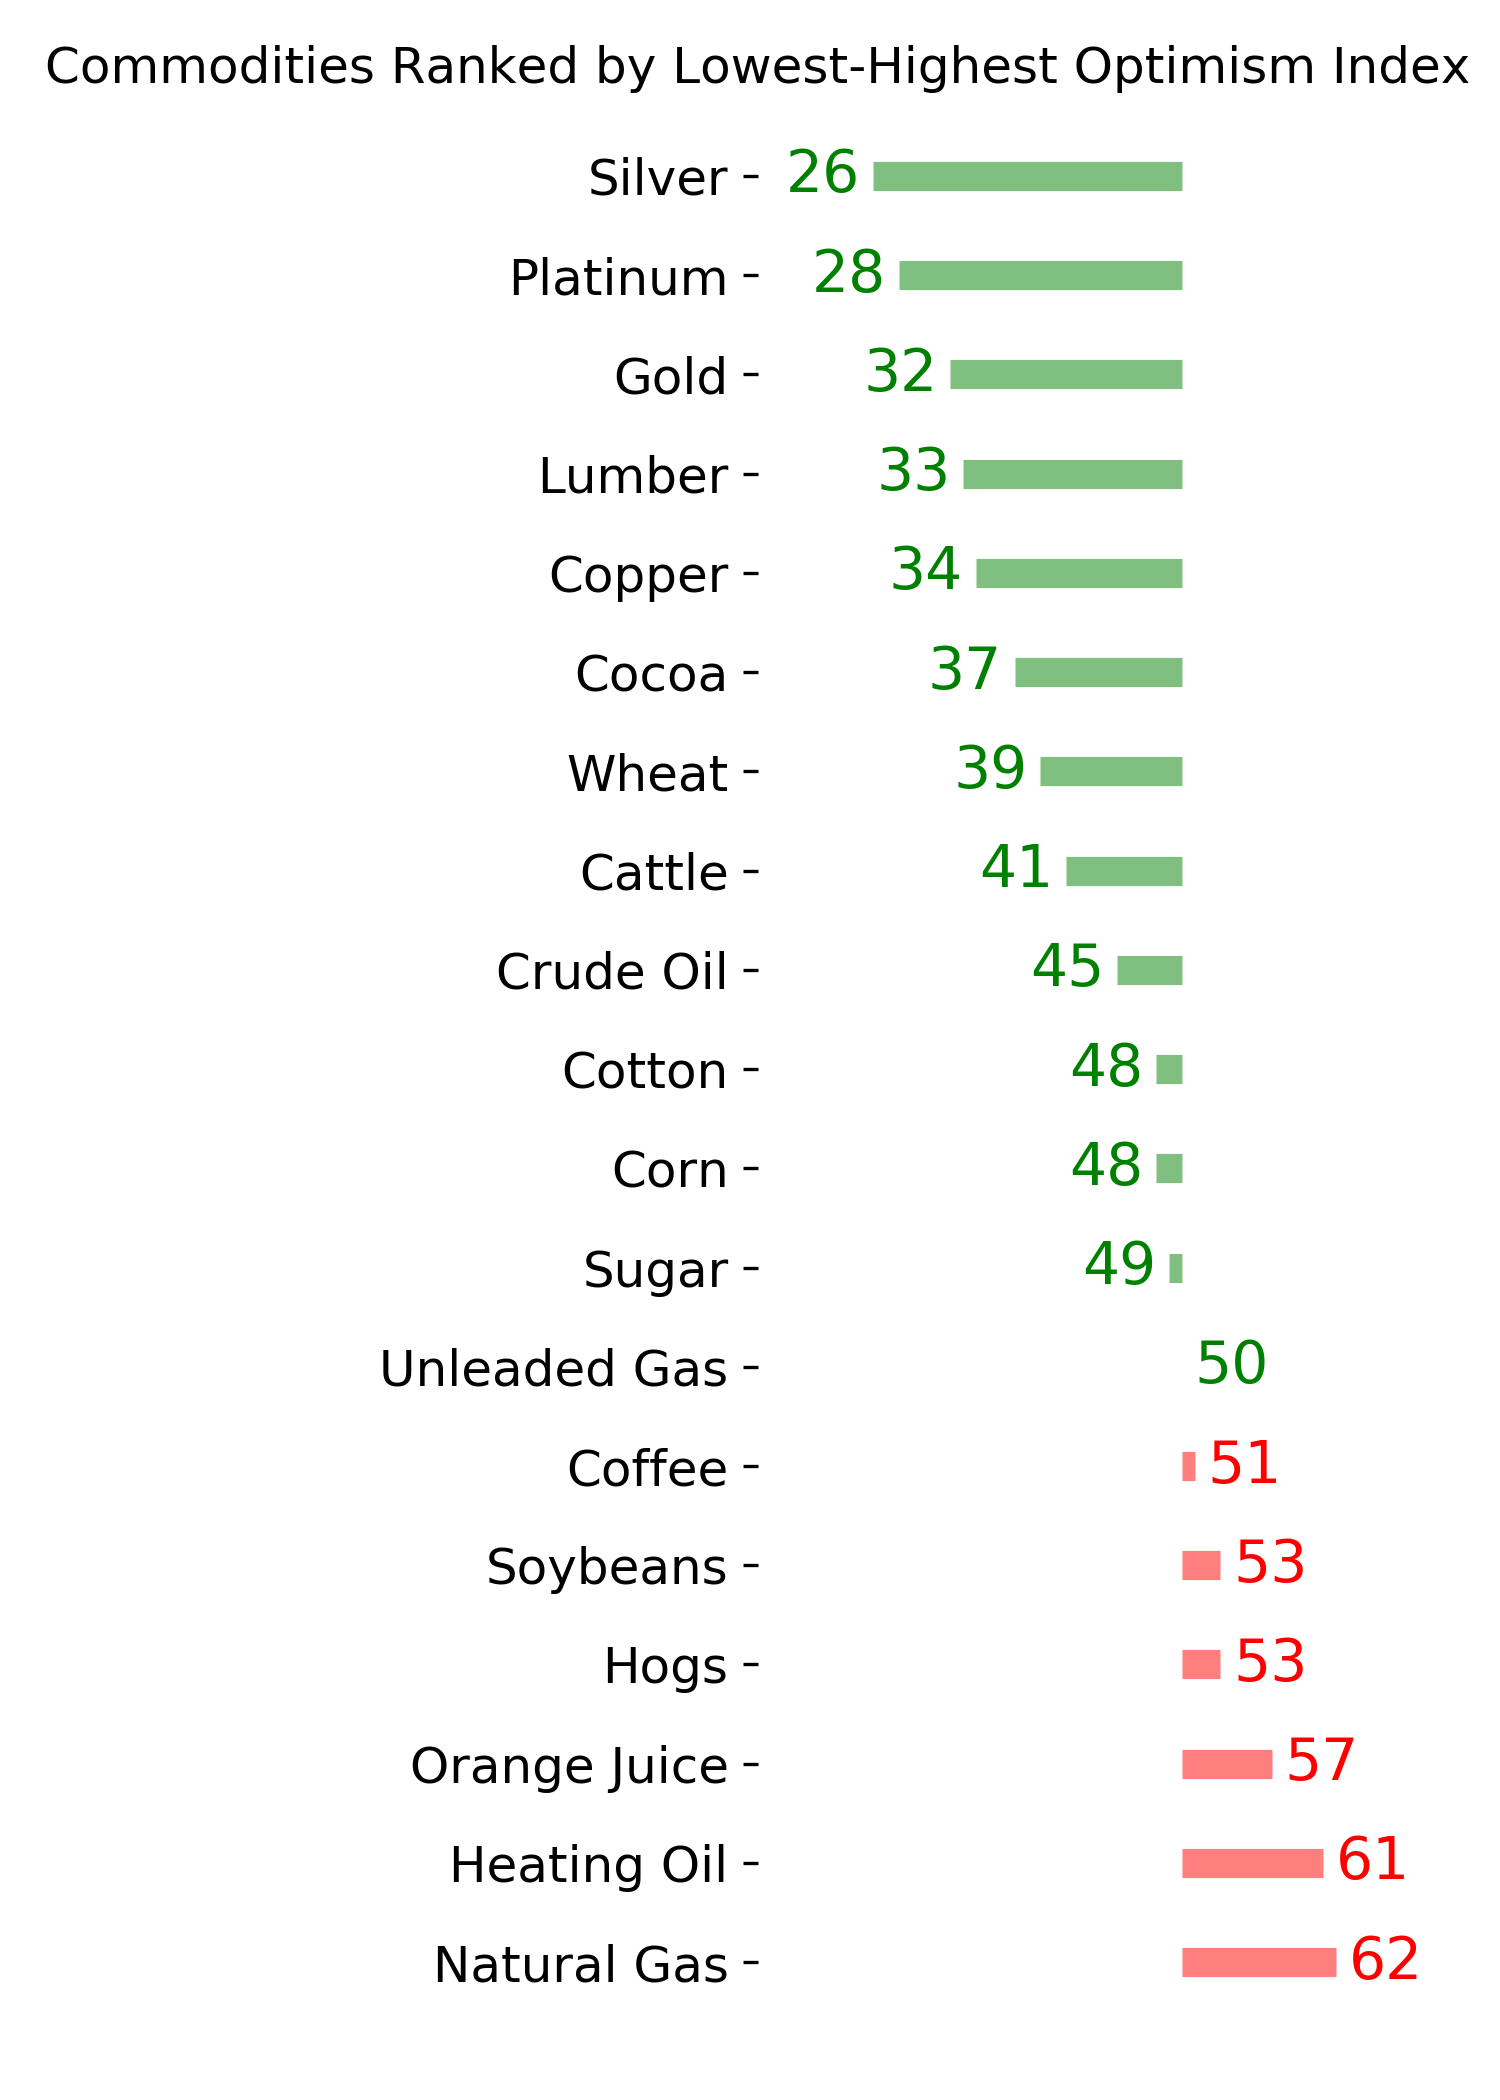
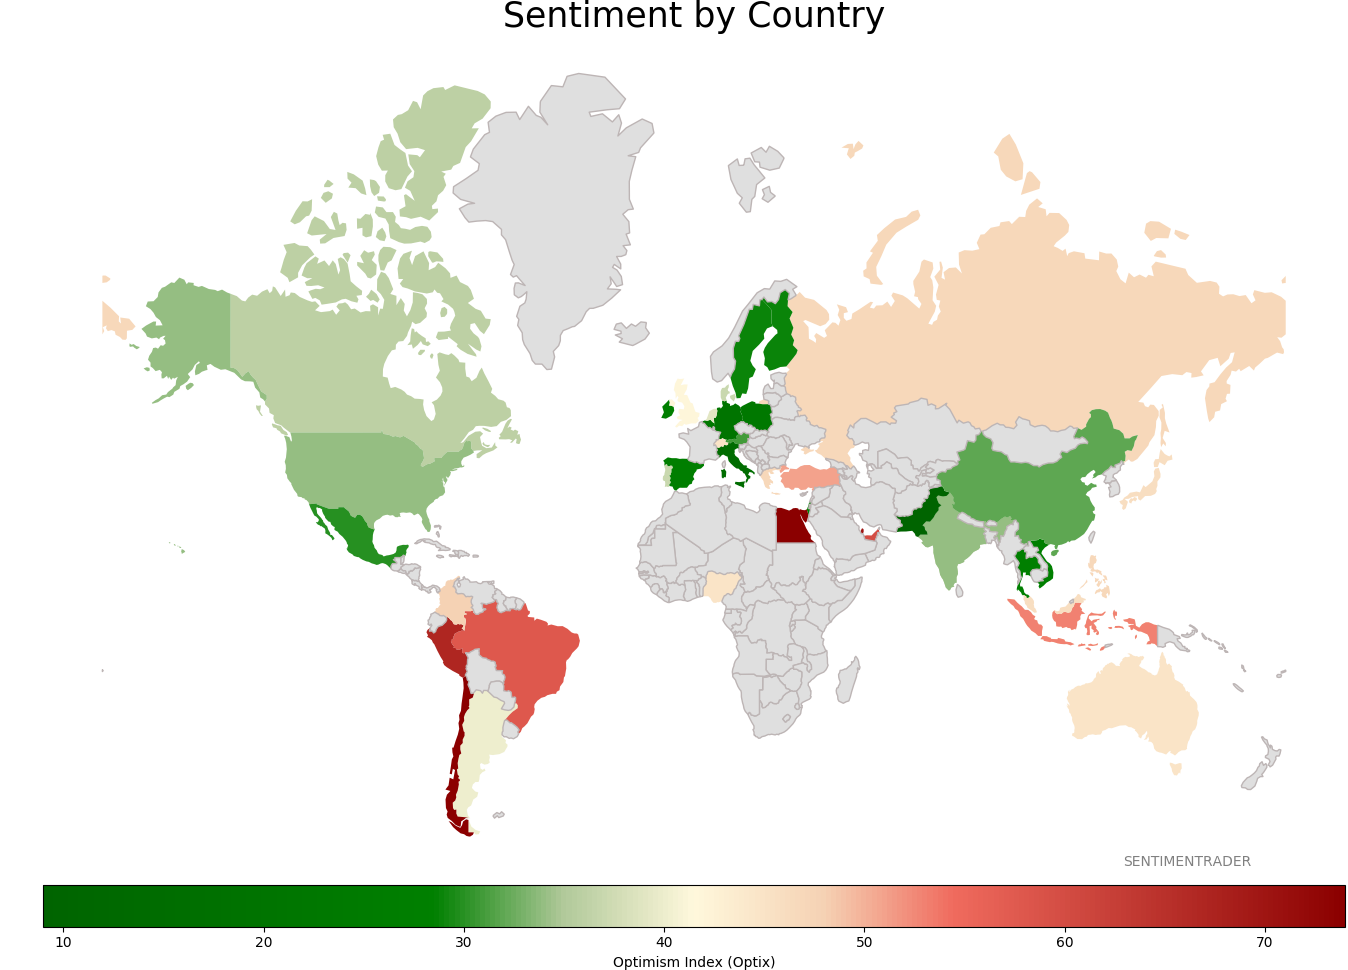
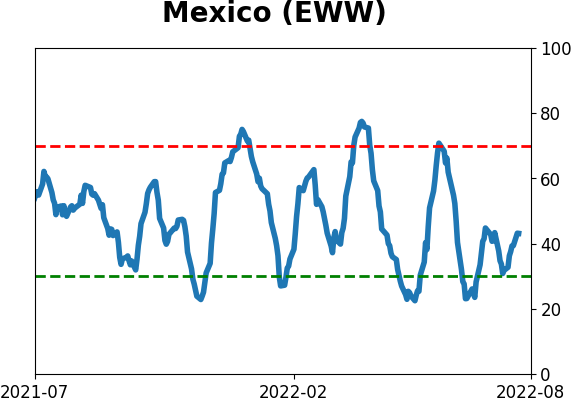
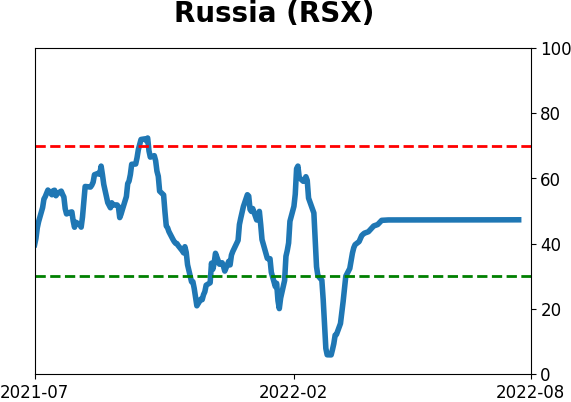
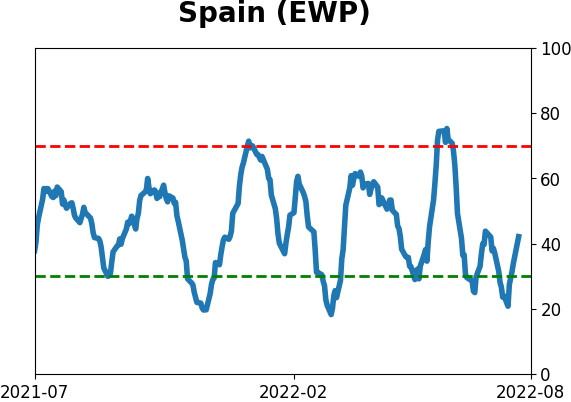
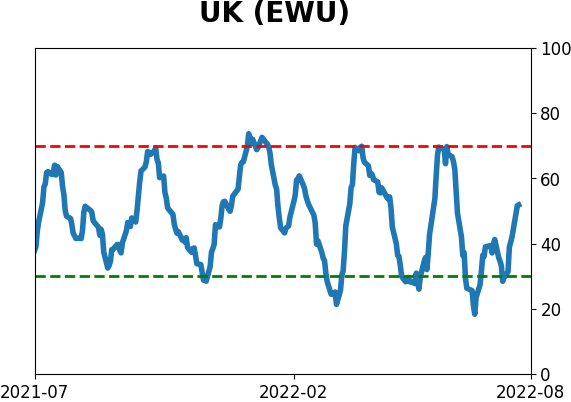
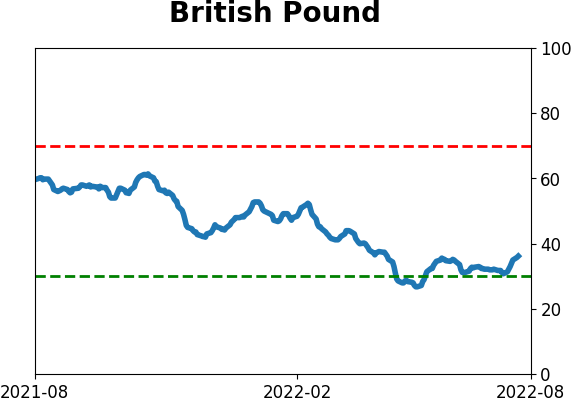
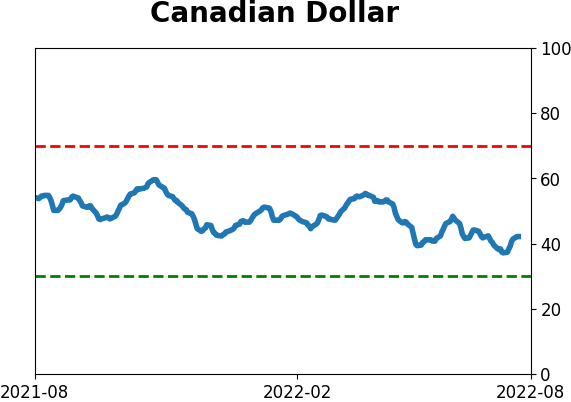
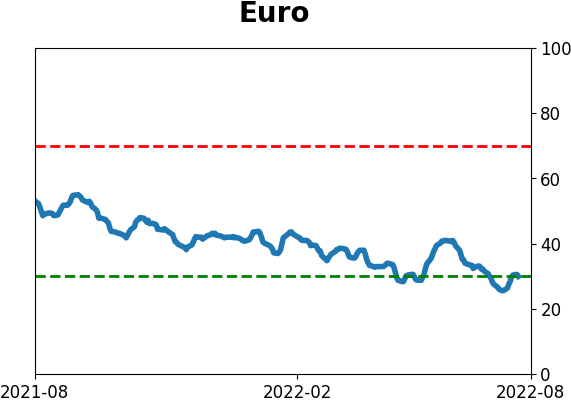
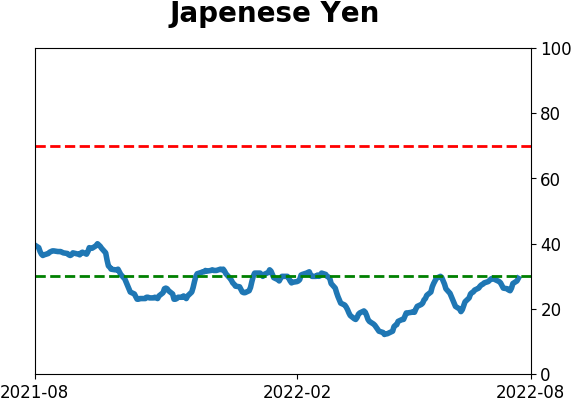
Sentiment Around The World
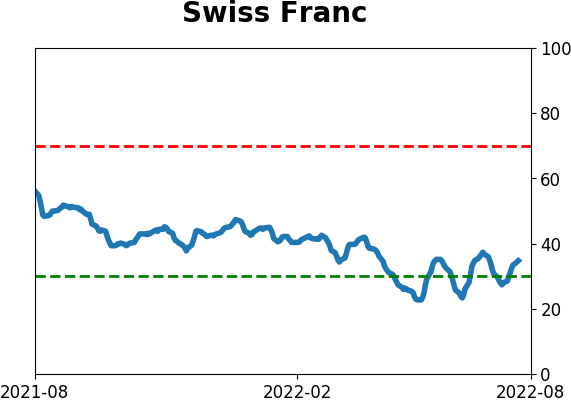
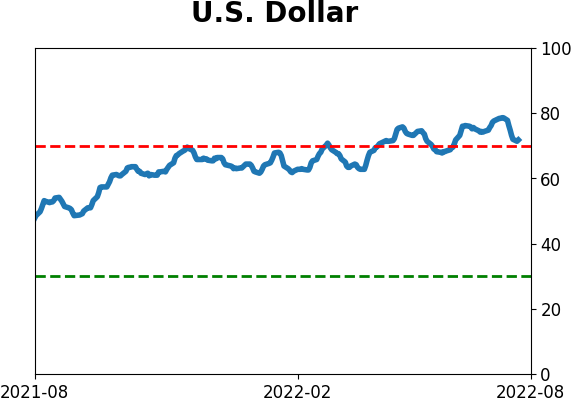
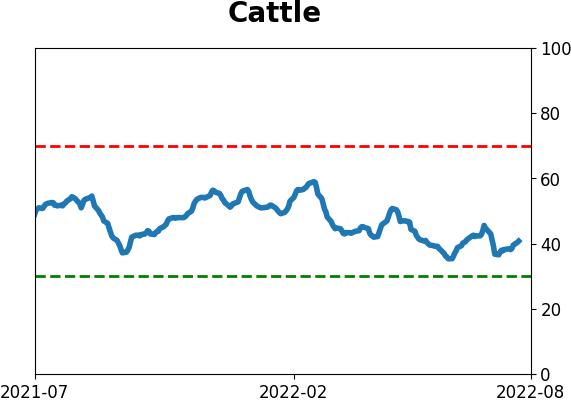
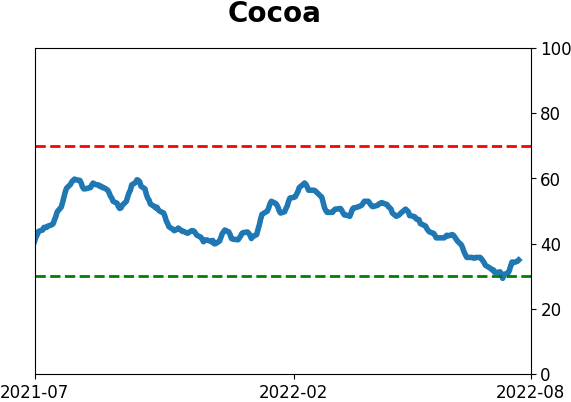
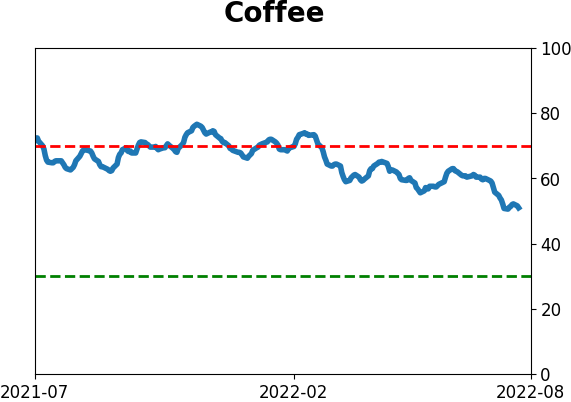
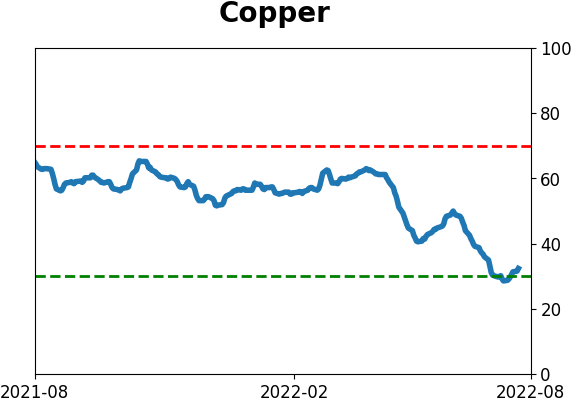
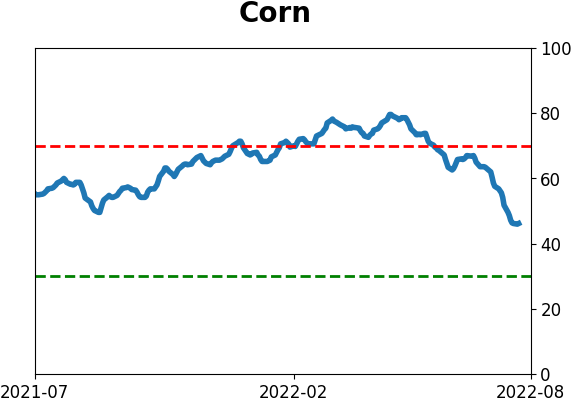
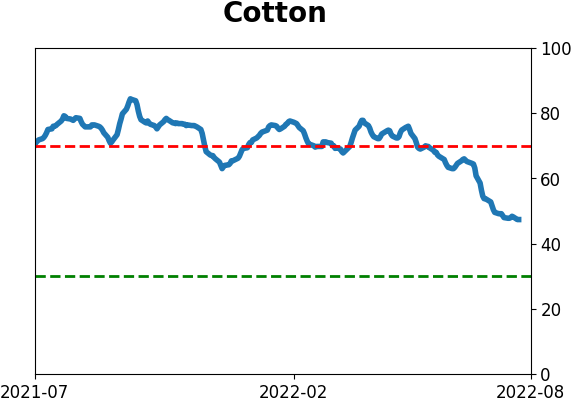
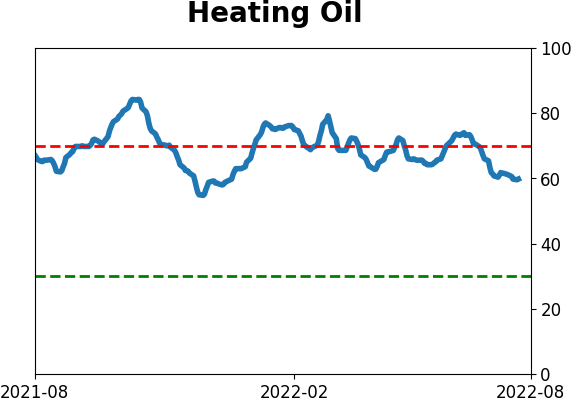
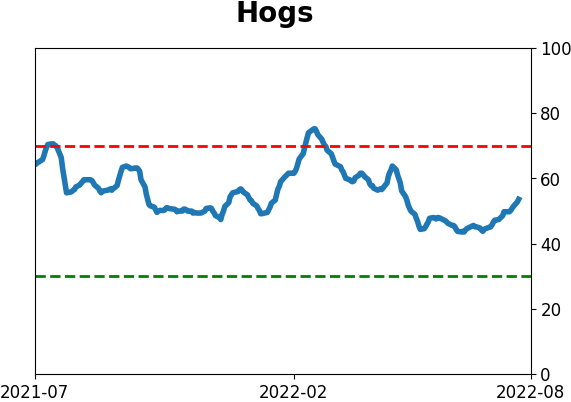
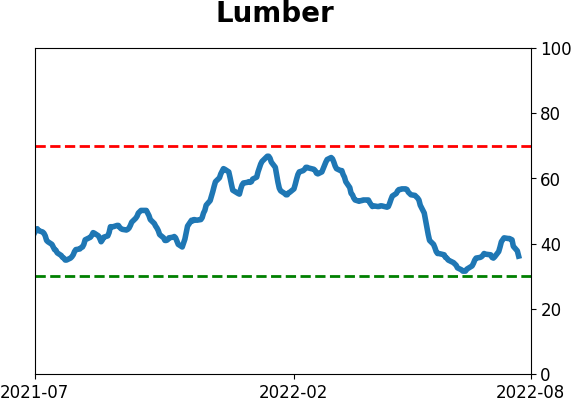
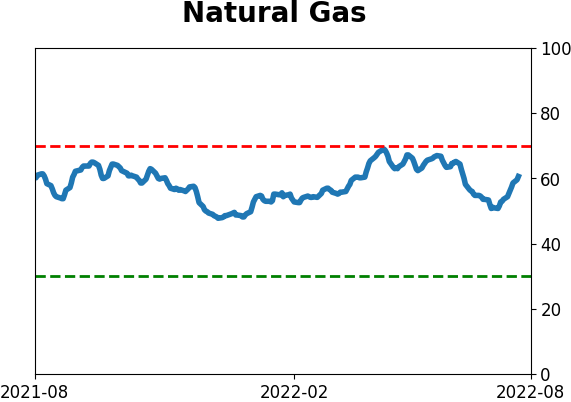
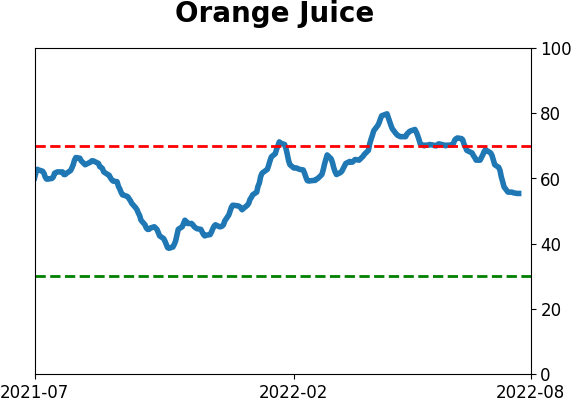
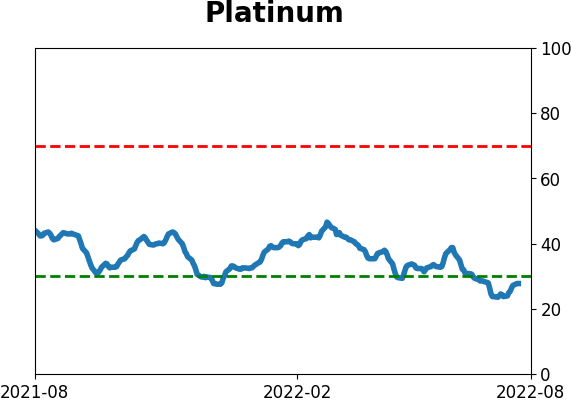
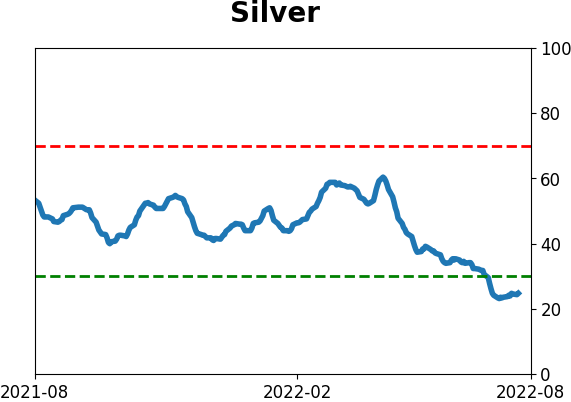
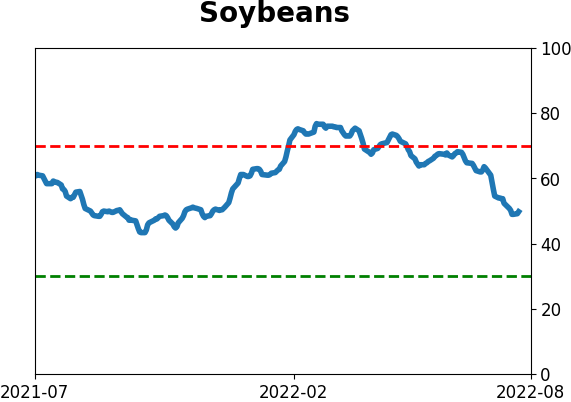
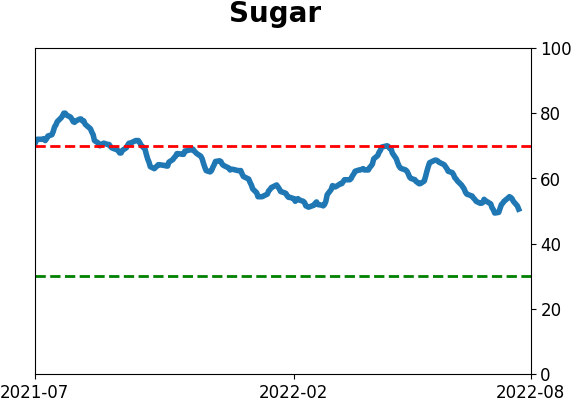
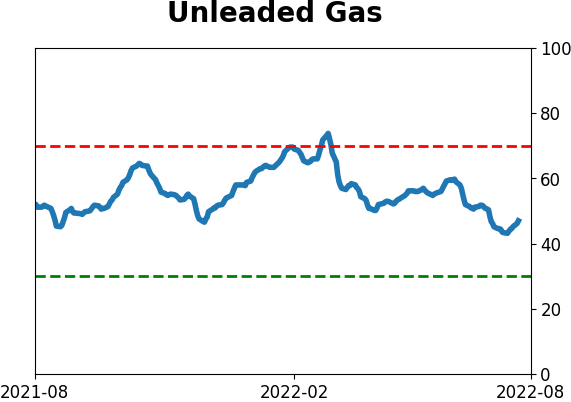
Optimism Index Thumbnails
|
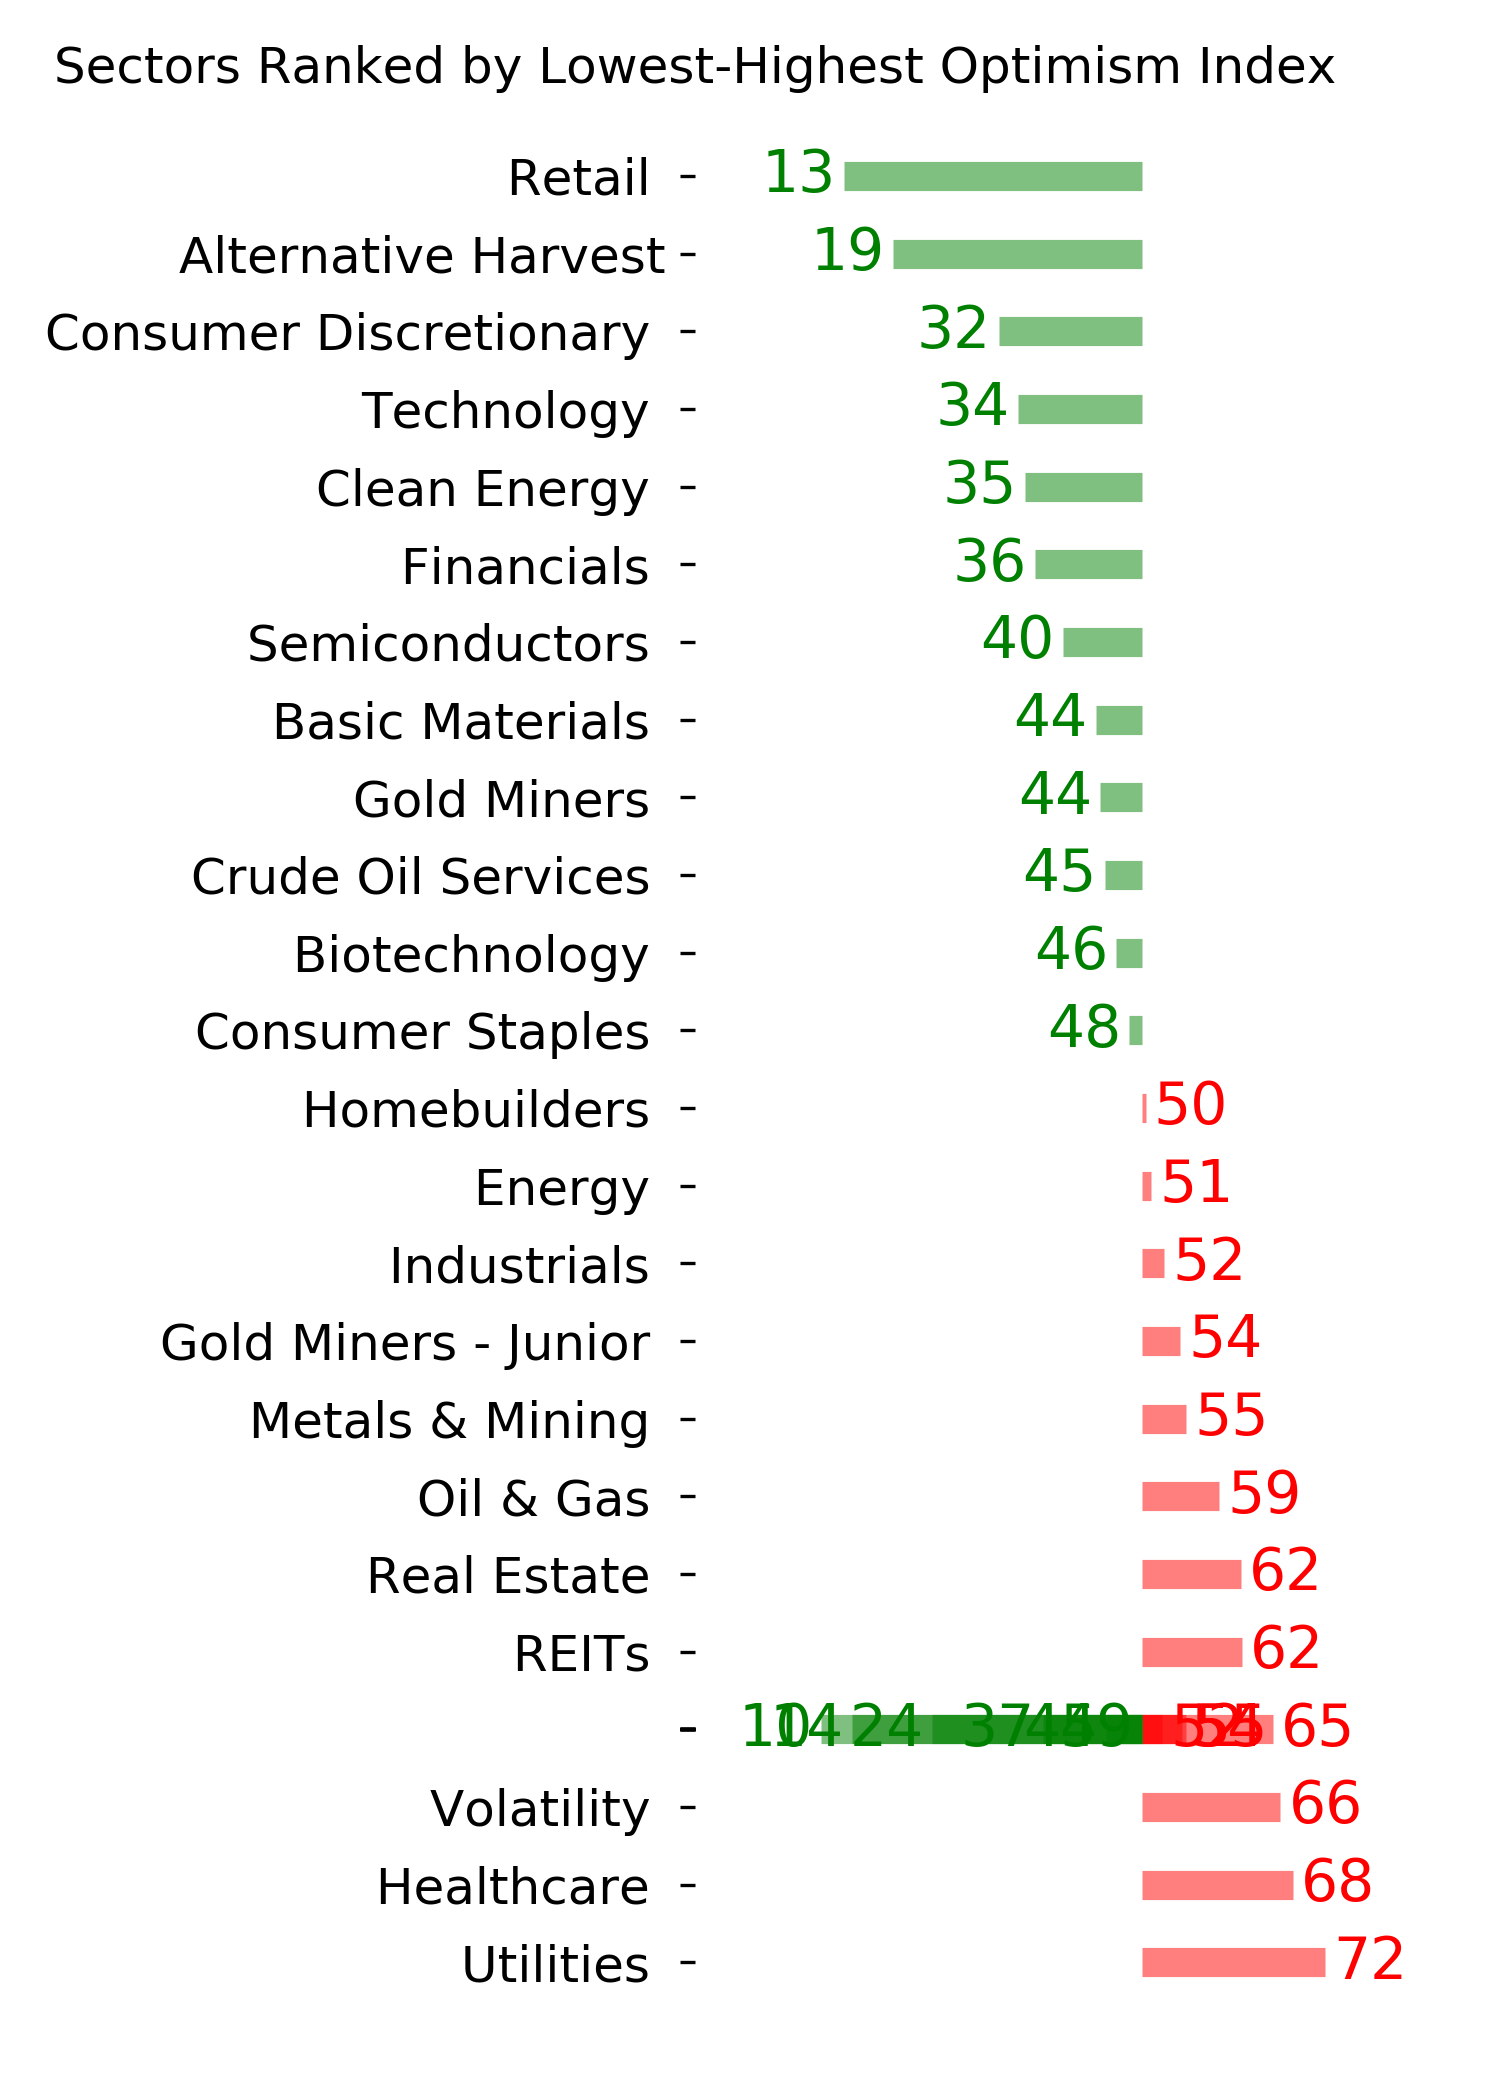
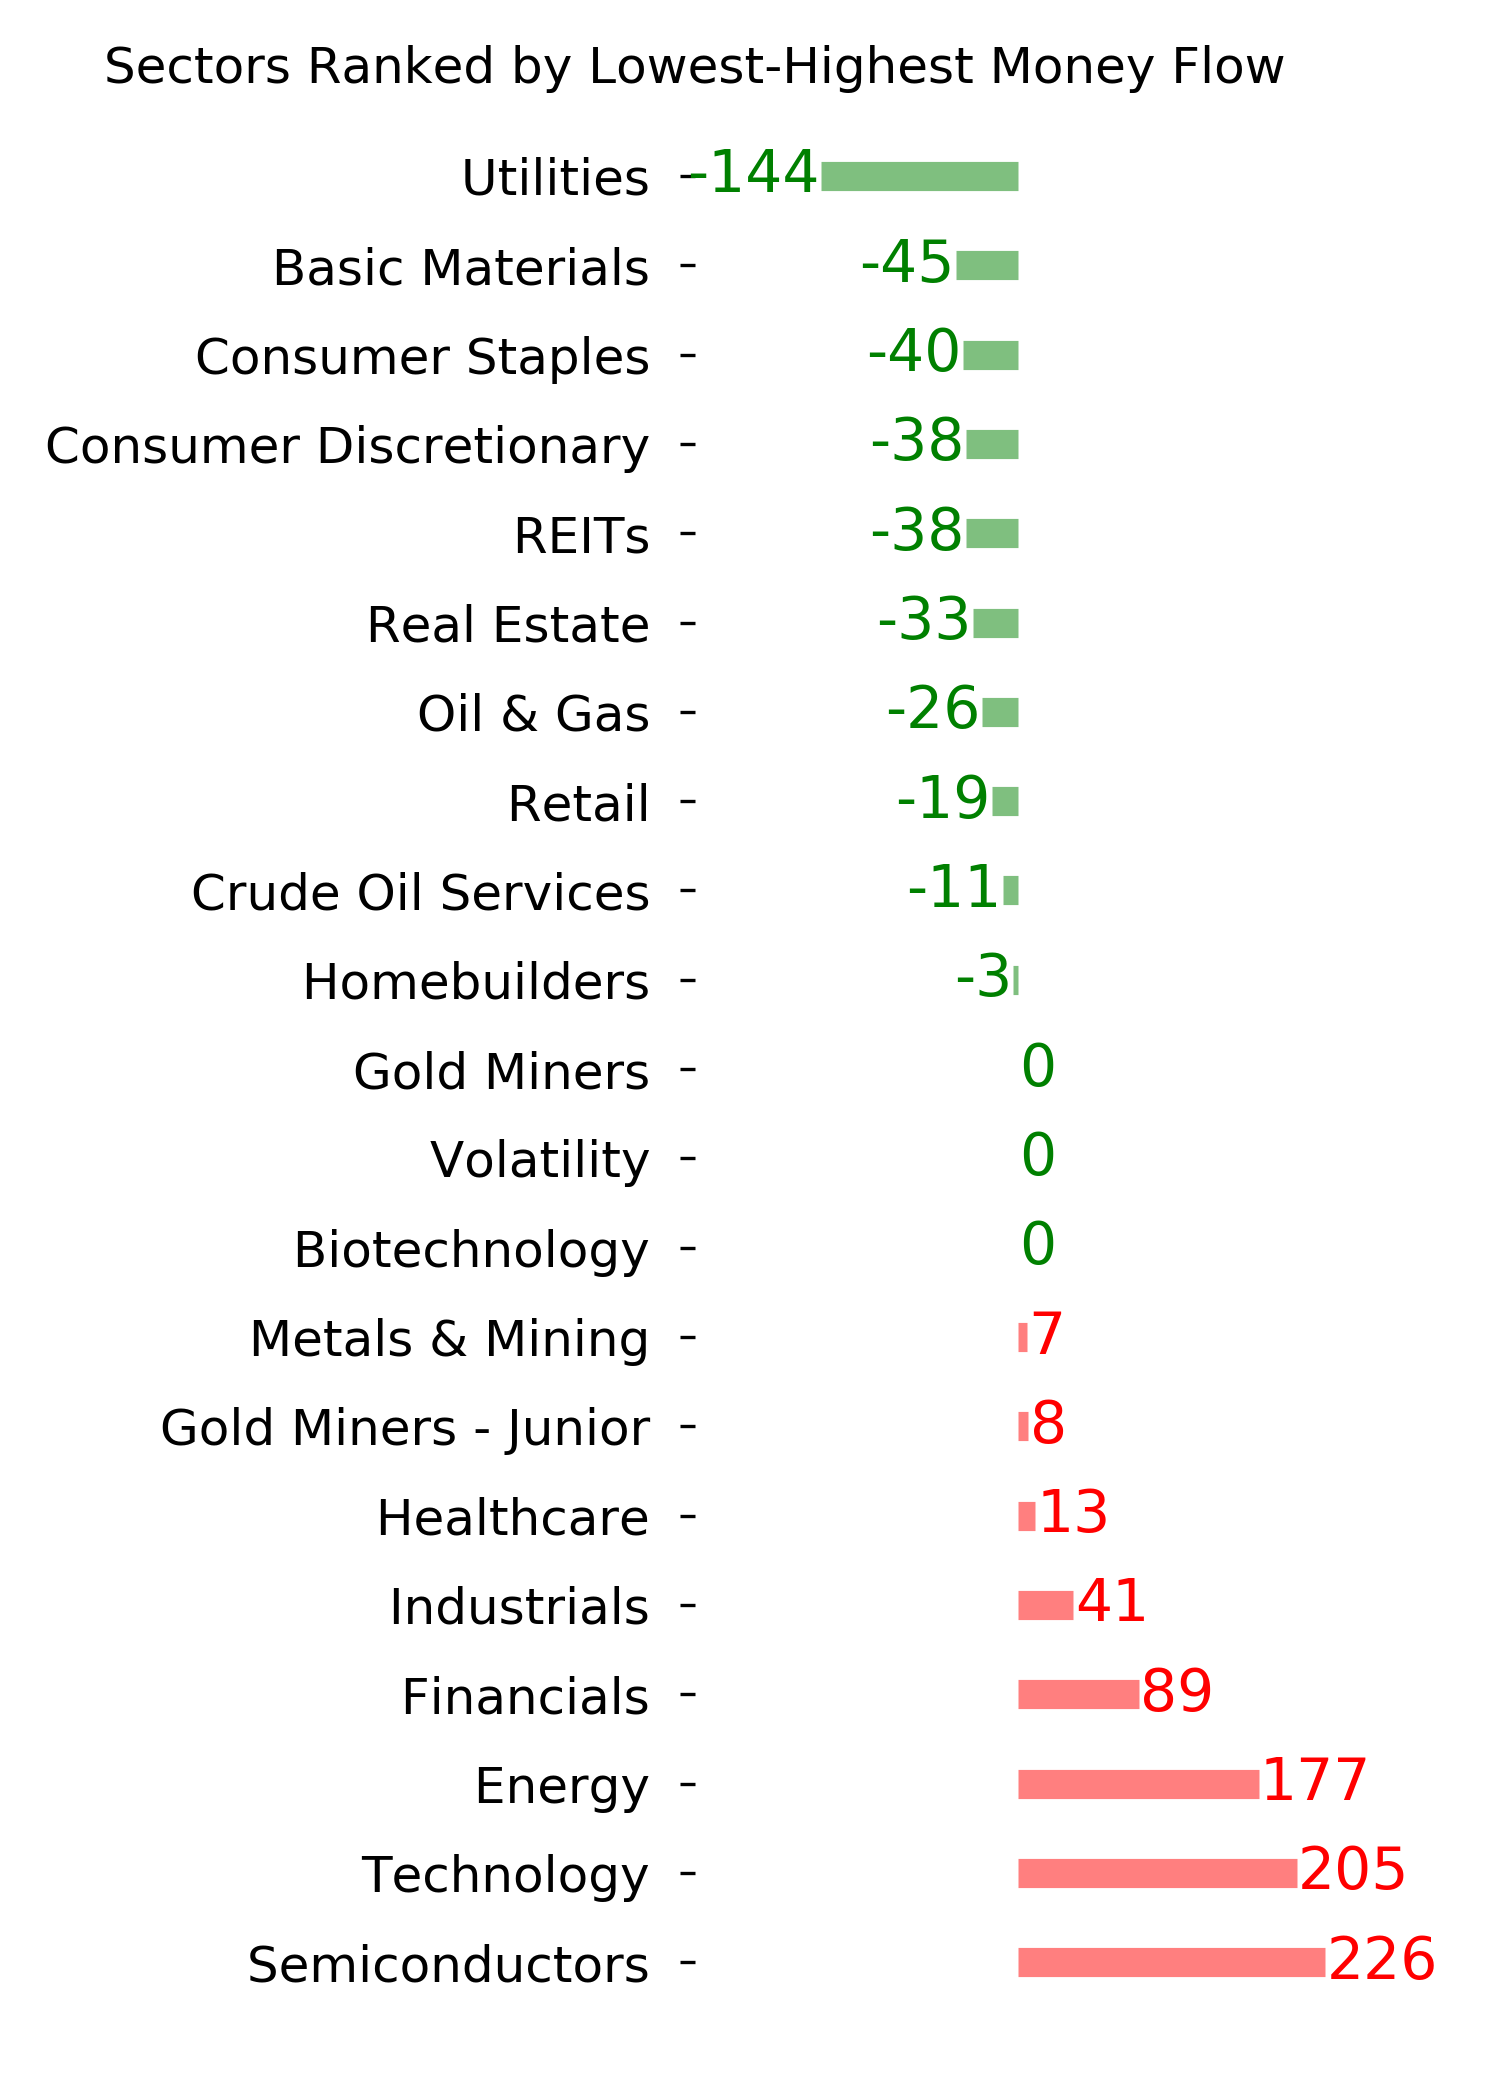
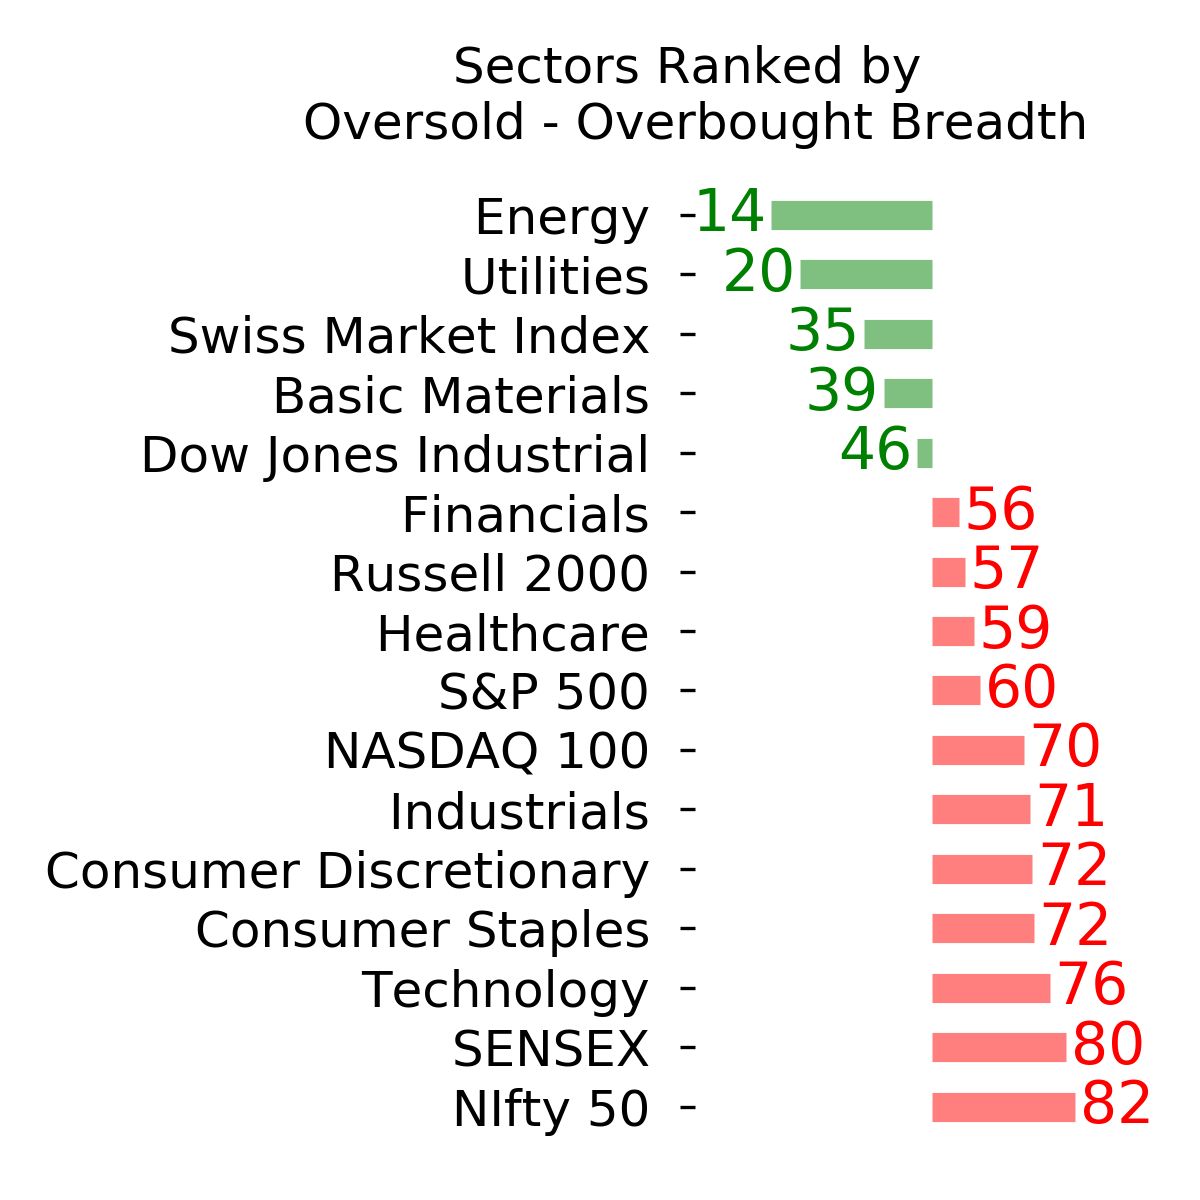
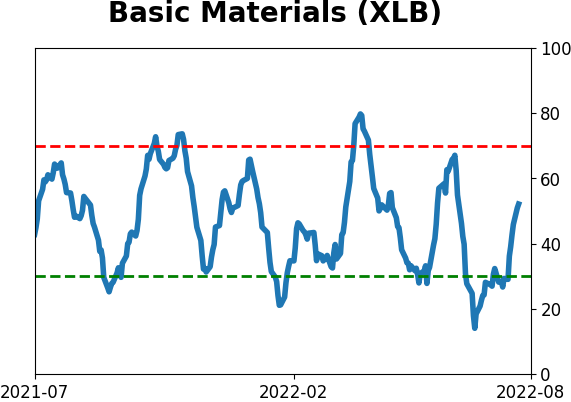
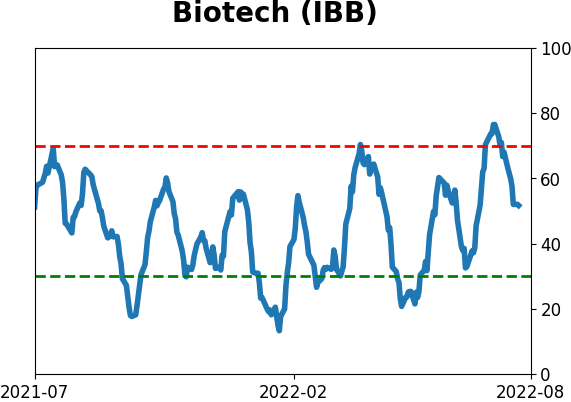
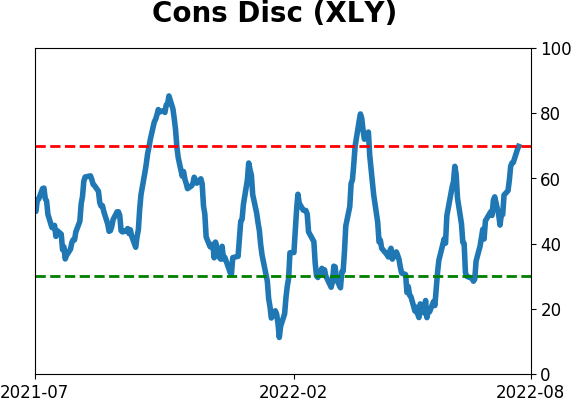
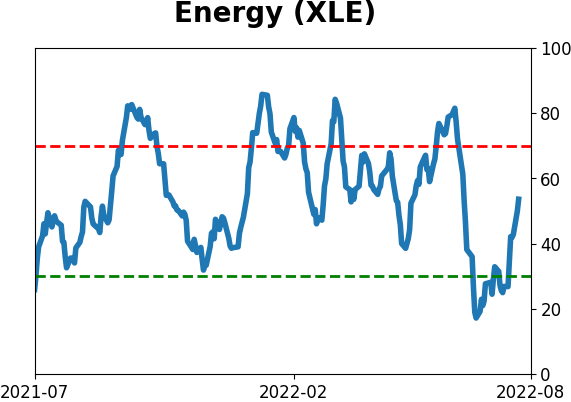
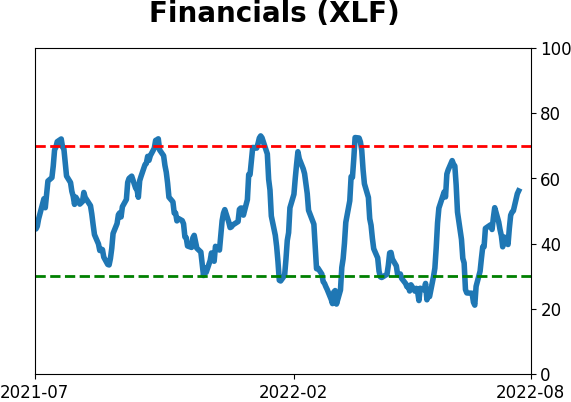
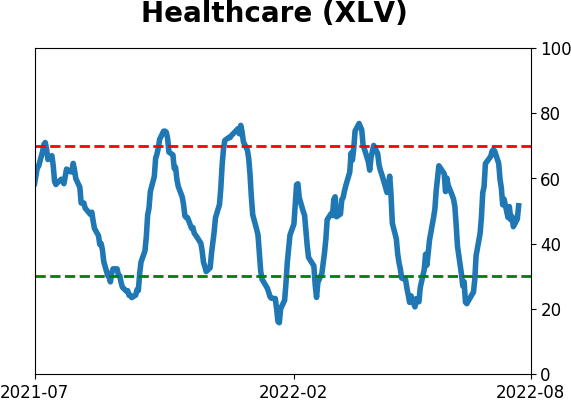
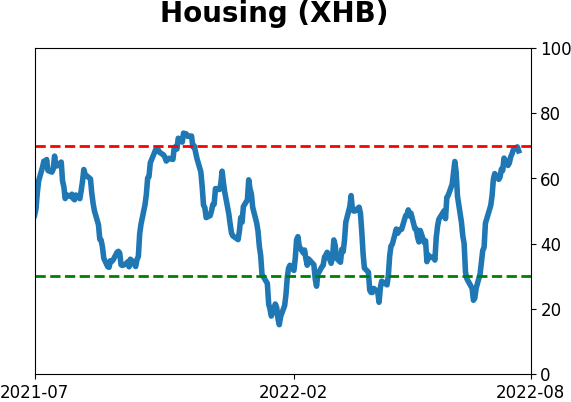
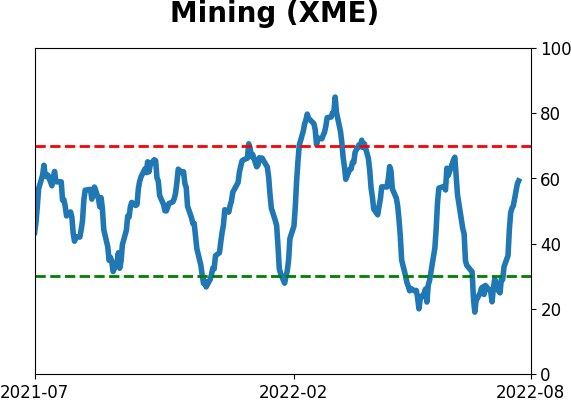
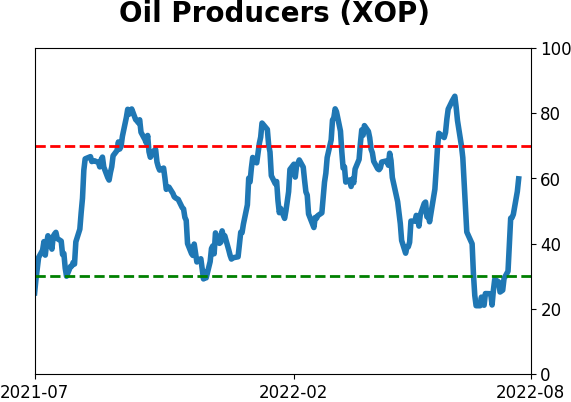
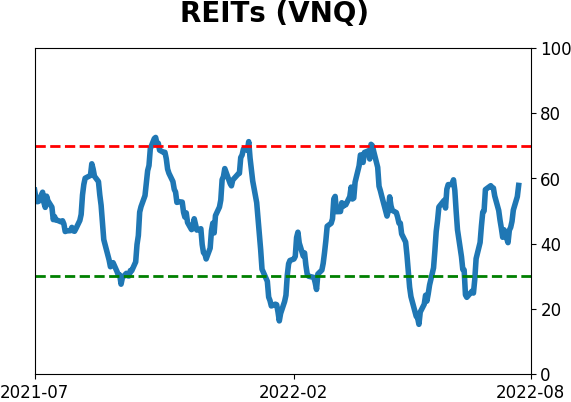
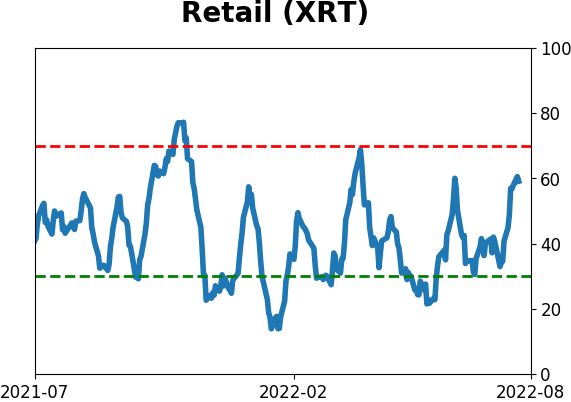
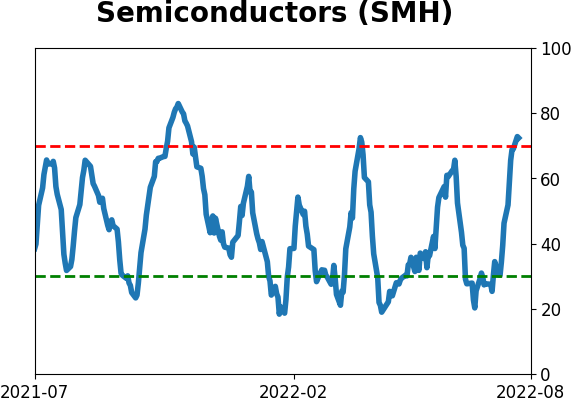
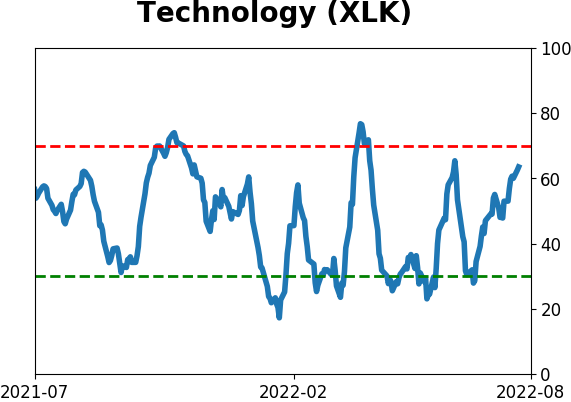
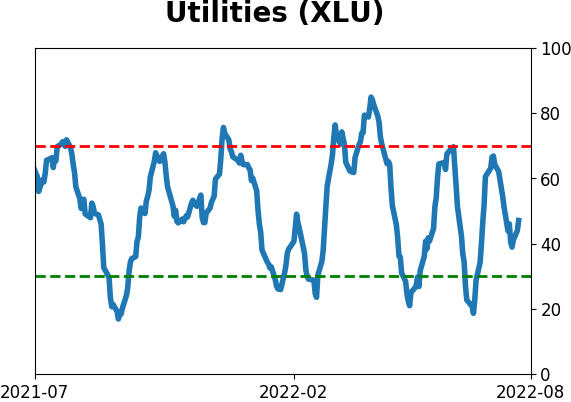
Sector ETF's - 10-Day Moving Average
|
|
|
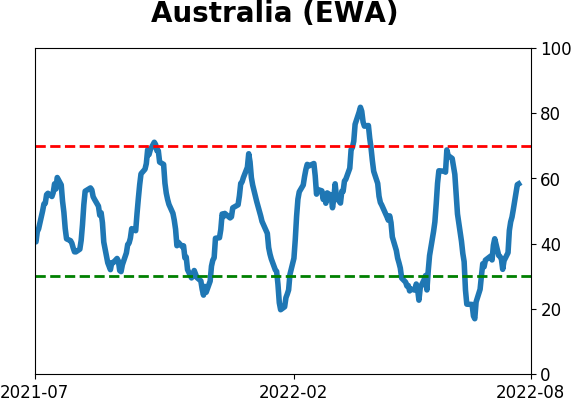
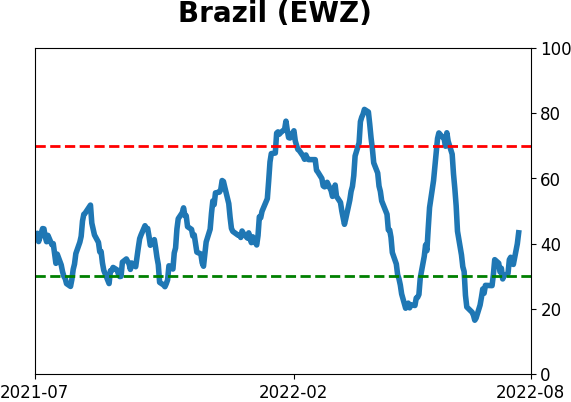
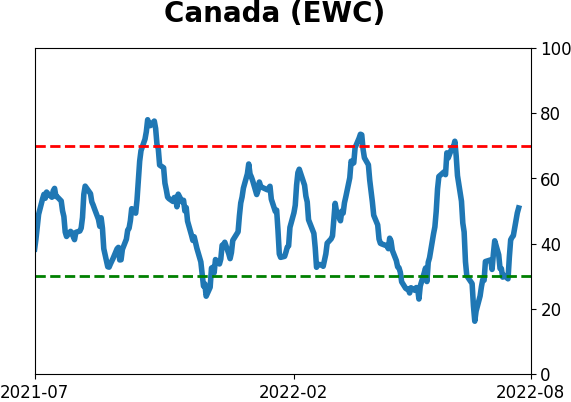
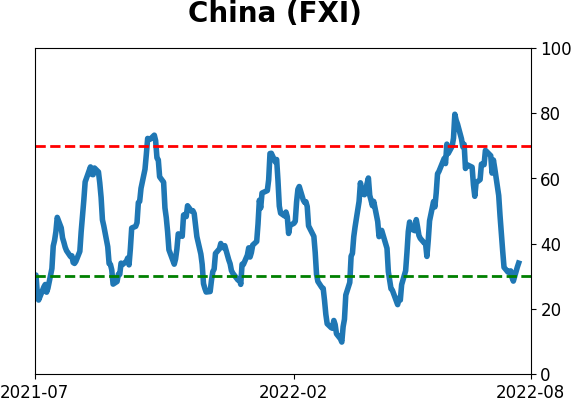
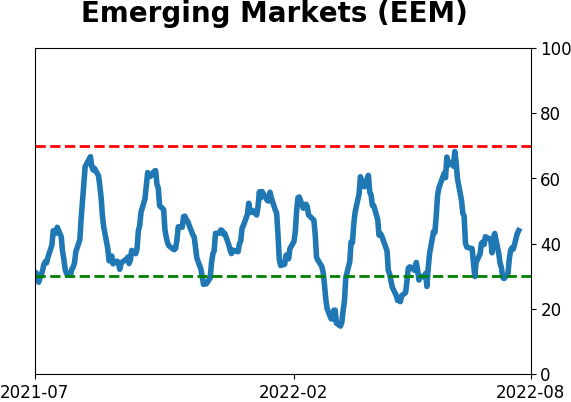
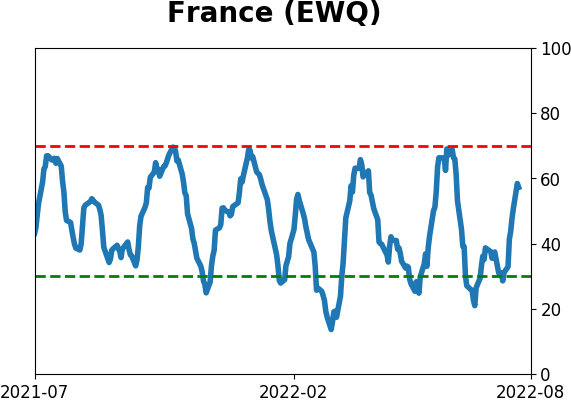
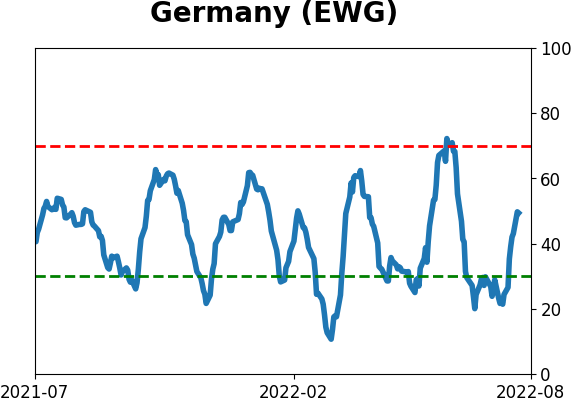
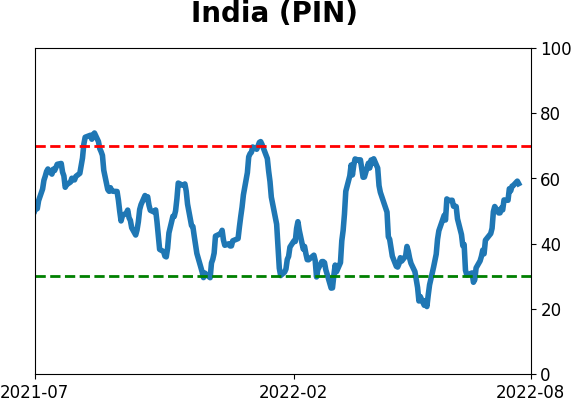
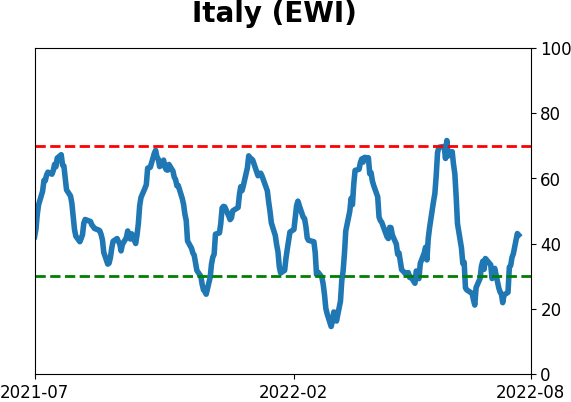
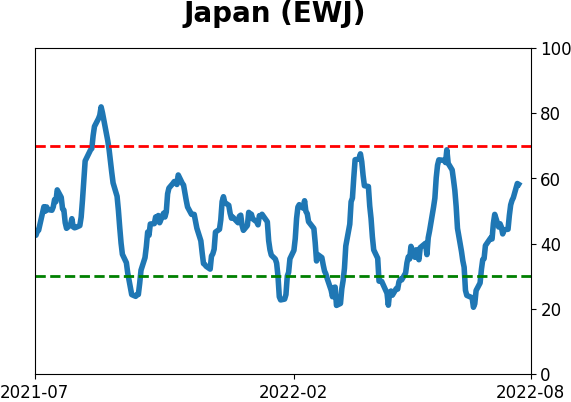
Country ETF's - 10-Day Moving Average
|
|
|
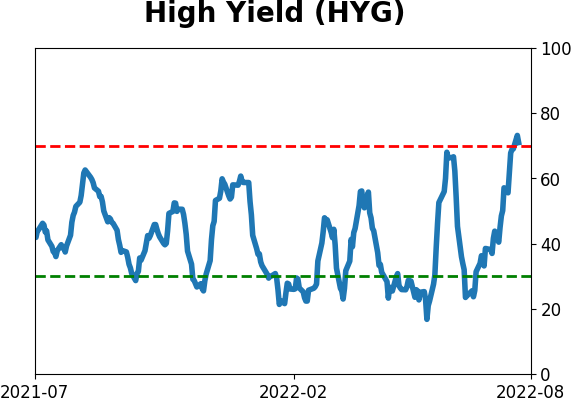
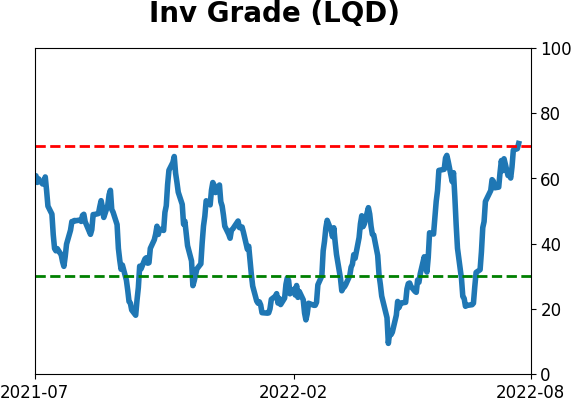
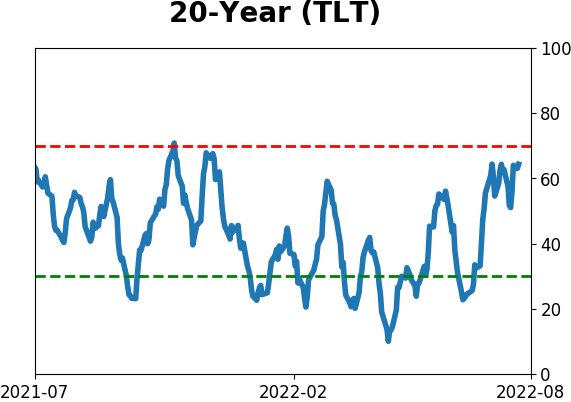
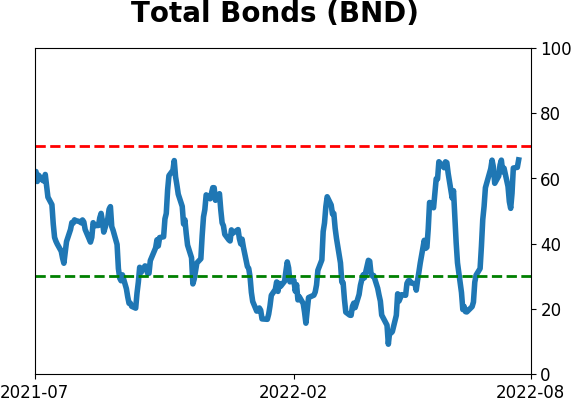
Bond ETF's - 10-Day Moving Average
|
|
|
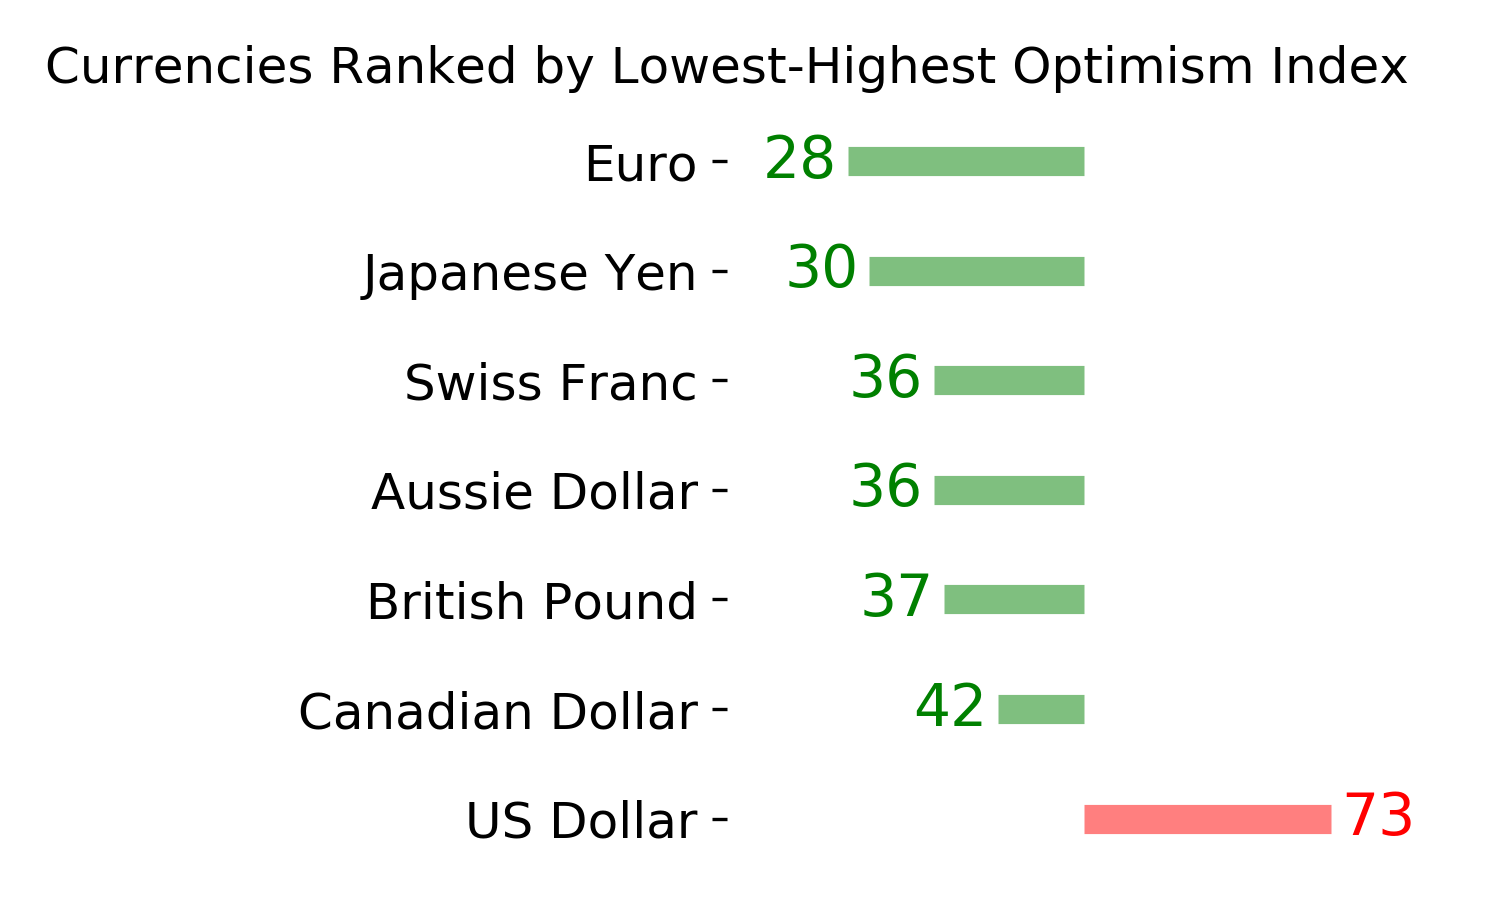
Currency ETF's - 5-Day Moving Average
|
|
|
Commodity ETF's - 5-Day Moving Average
|
|