Headlines
|
|
Small Caps Can't Keep Up with S&P's Torrid Pace:
The S&P 500 managed to close at yet another record high to end the week, but it's been more than 90 days since the small-cap Russell 2000 has done so.
Bottom Line:
See the Outlook & Allocations page for more details on these summaries STOCKS: Hold
The speculative frenzy in February is wrung out. Internal dynamics have mostly held up, with some exceptions. Many of our studies still show a mixed to poor short-term view, with medium- and long-term ones turning more positive. BONDS: Hold
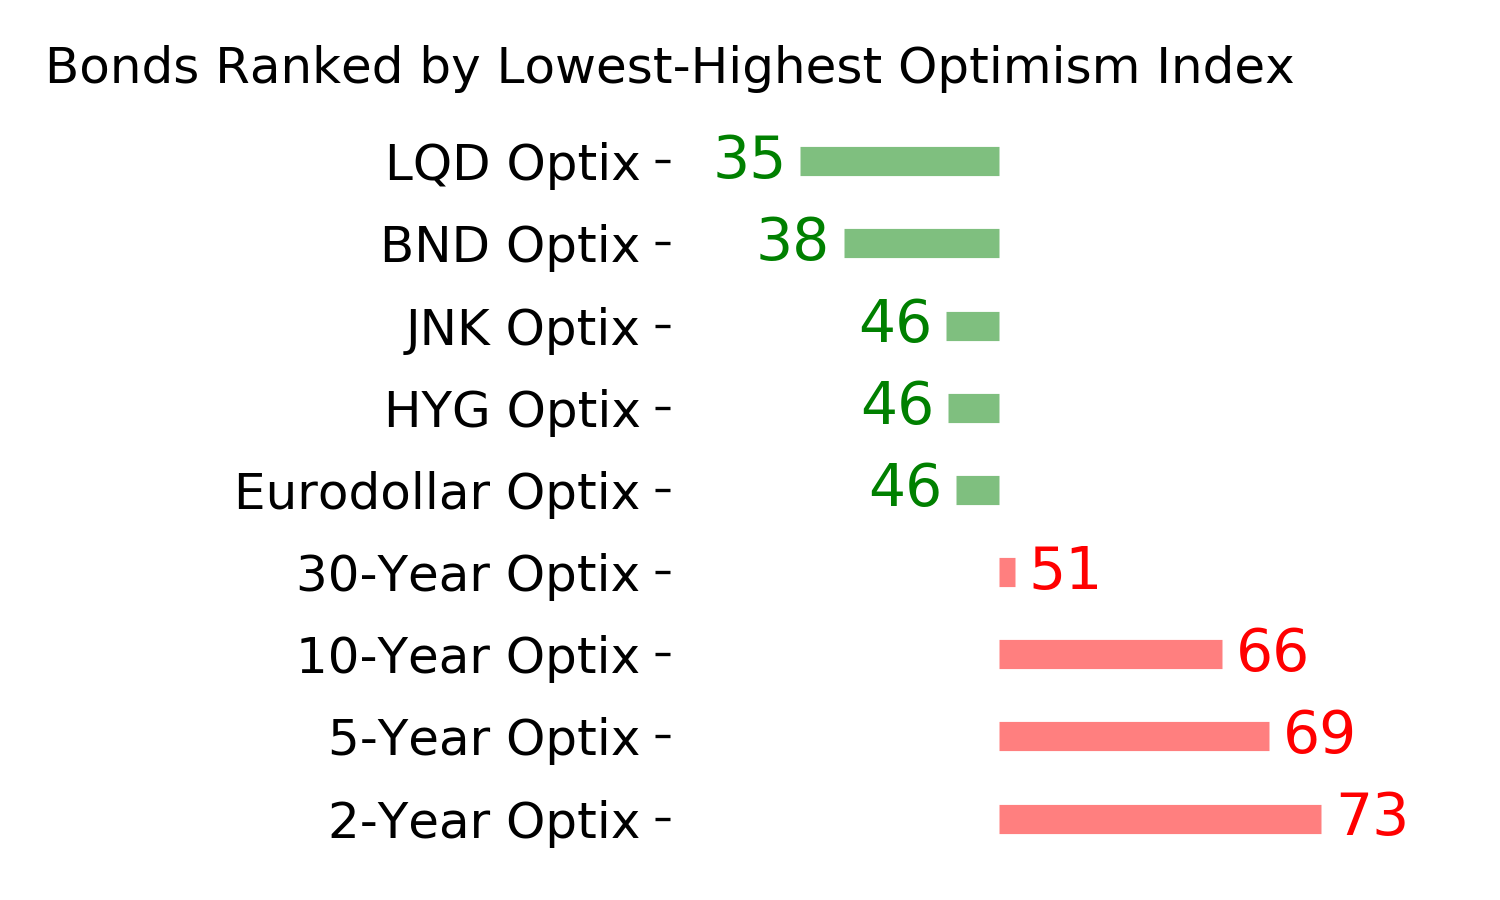
Various parts of the market got hit in March, with the lowest Bond Optimism Index we usually see during healthy environments. After a shaky couple of weeks, the broad bond market has modestly recovered. Not a big edge here either way. GOLD: Hold
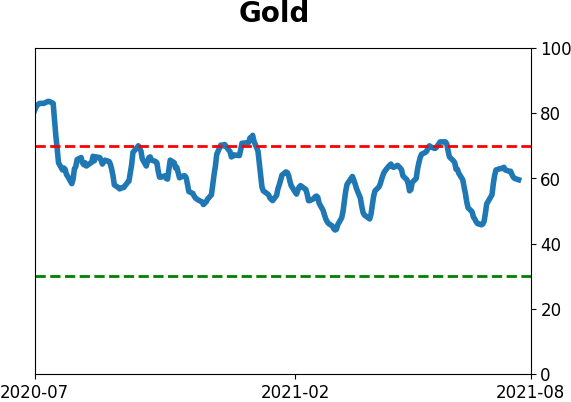
Gold and miners have done very well, recovering above long-term trend lines. The issue is that both have tended to perform poorly after similar situations - will have to wait and see how it plays out.
|
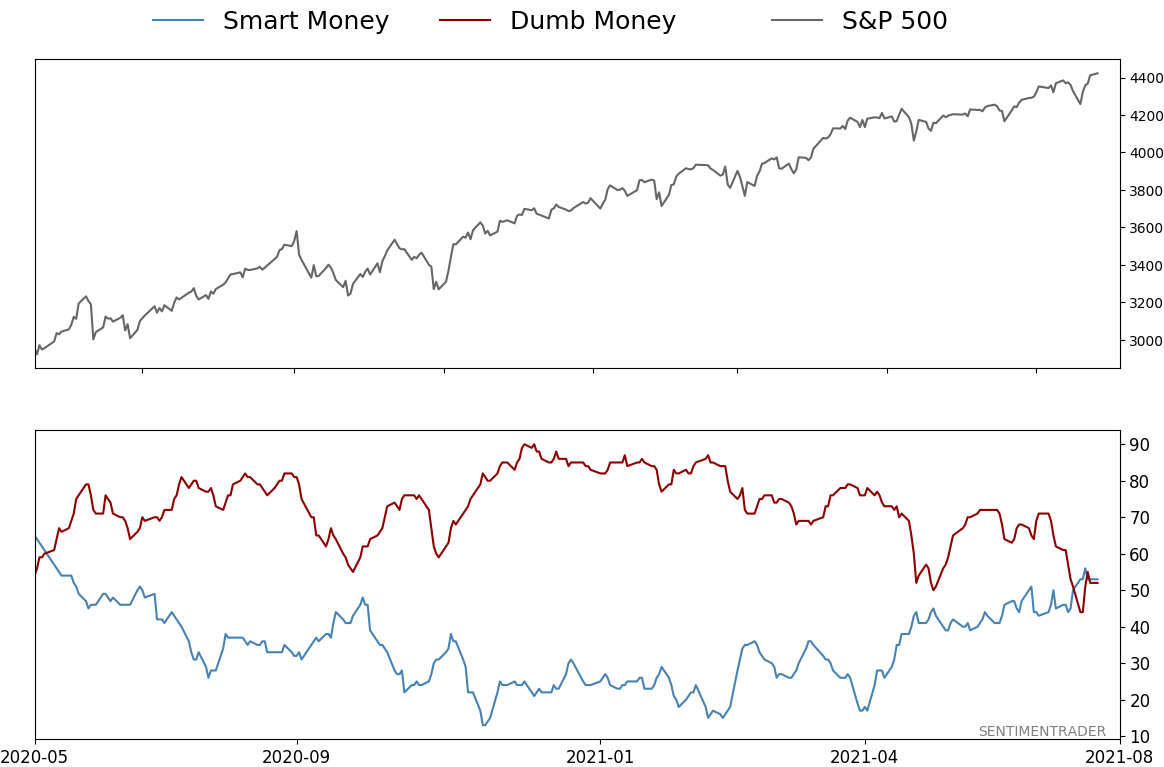
Smart / Dumb Money Confidence
|
Smart Money Confidence: 53%
Dumb Money Confidence: 52%
|
|
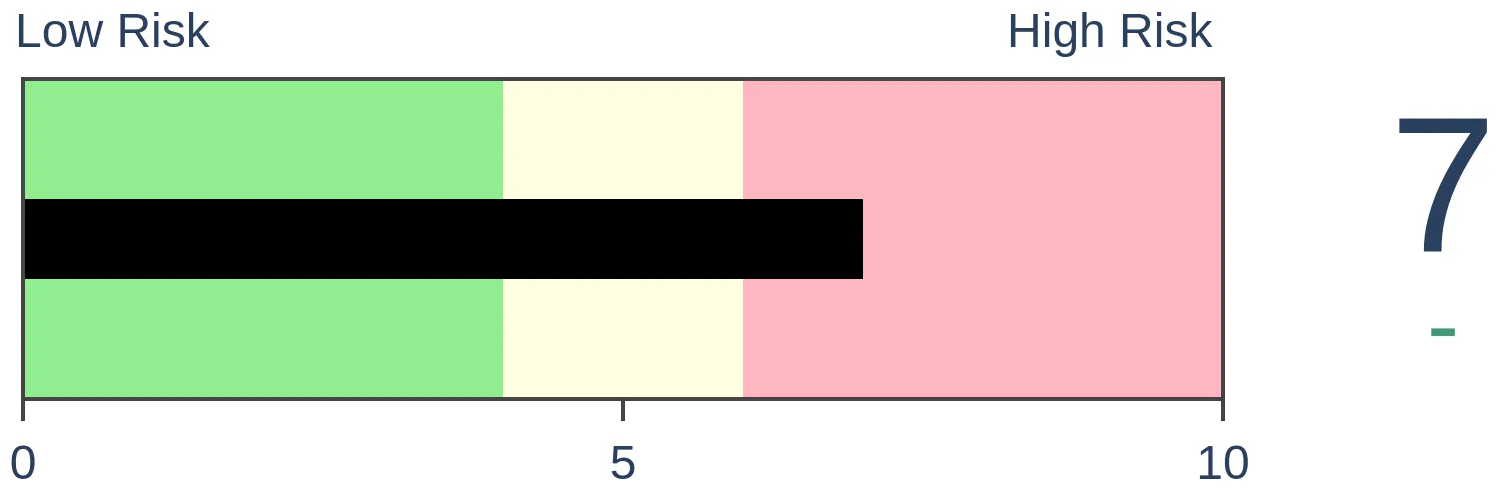
Risk Levels
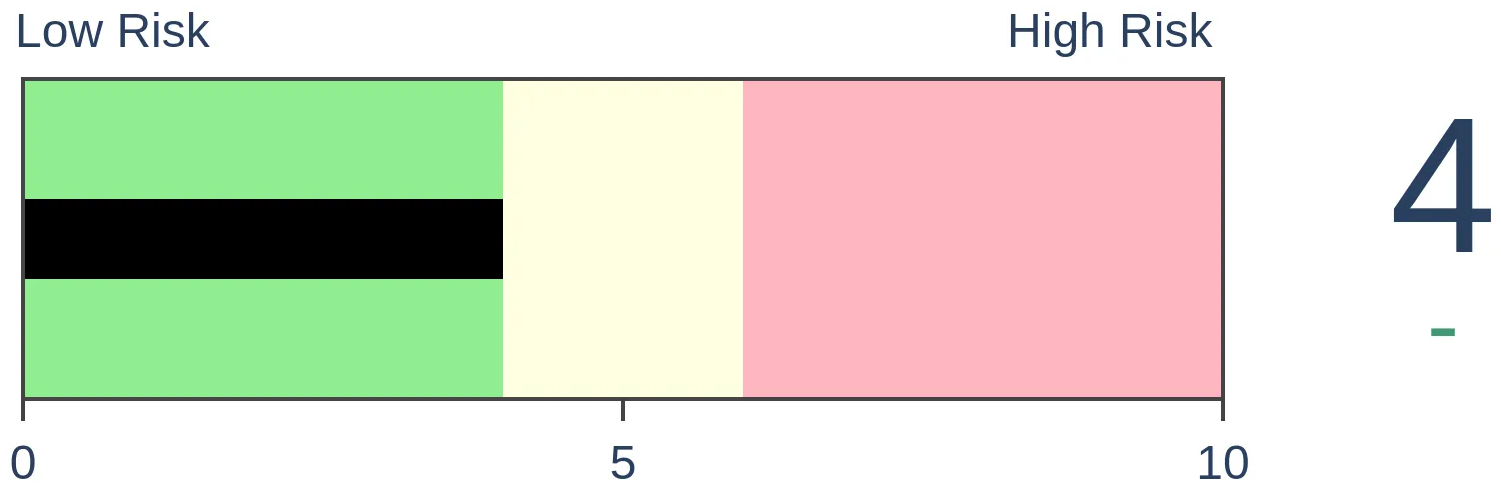
Stocks Short-Term
|
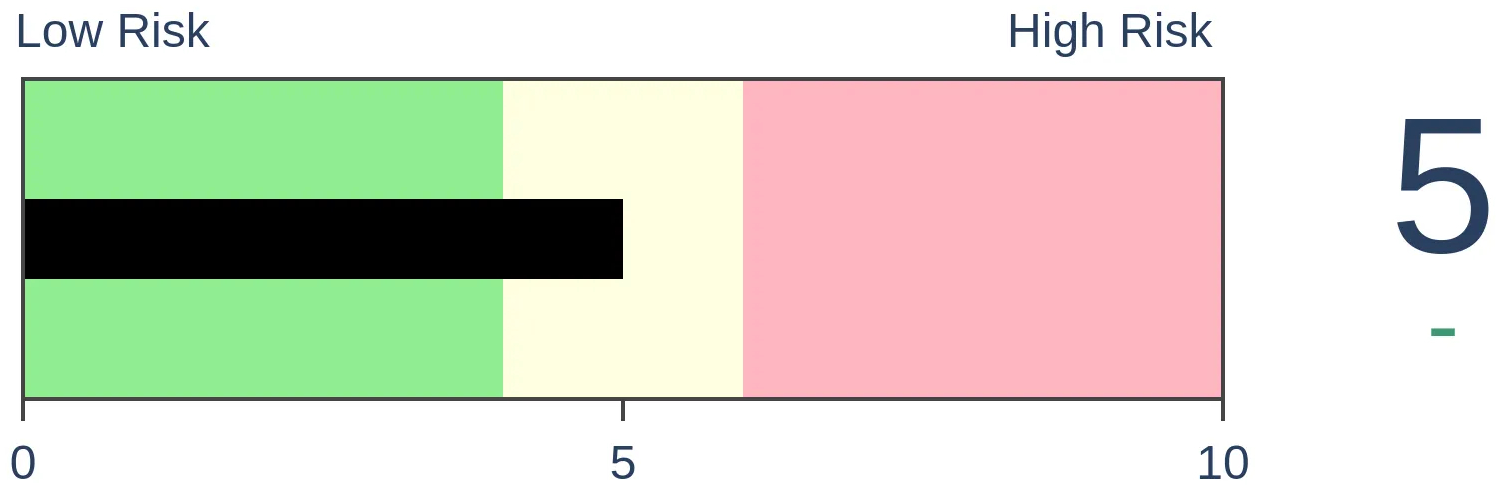
Stocks Medium-Term

|
|
Bonds

|
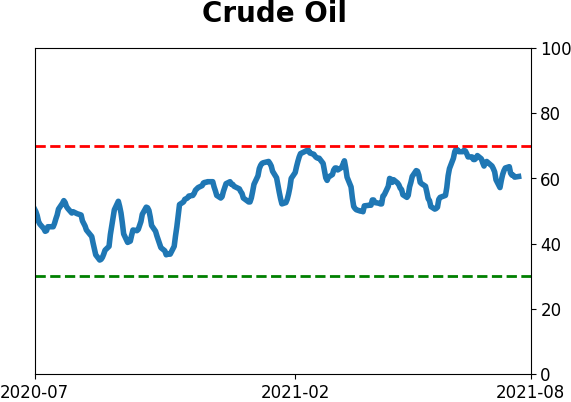
Crude Oil
|
|
Gold
|
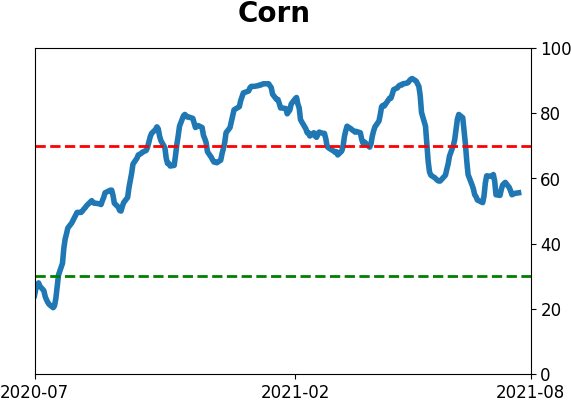
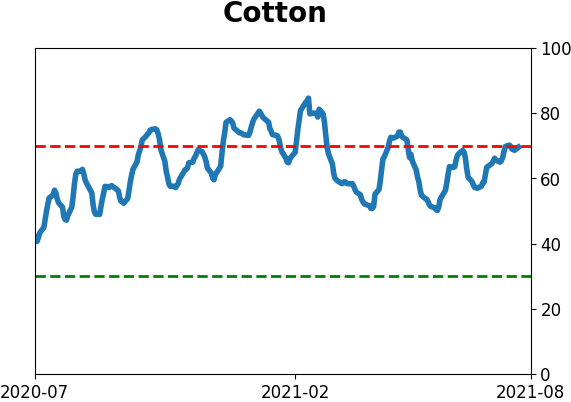
Agriculture

|
|
Research
By Jason Goepfert
BOTTOM LINE
The S&P 500 managed to close at yet another record high to end the week, but it's been more than 90 days since the small-cap Russell 2000 has done so.
FORECAST / TIMEFRAME
SPY -- Up, Medium-Term
|
It was a historically persistent and consistent rally for the S&P 500 in the first half of 2021, and things aren't changing much. After a blip on Monday, the index is right back to a record high.
For smaller stocks, it's been much more of a struggle. The Russell 2000 hasn't set a new high for more than 90 days now.
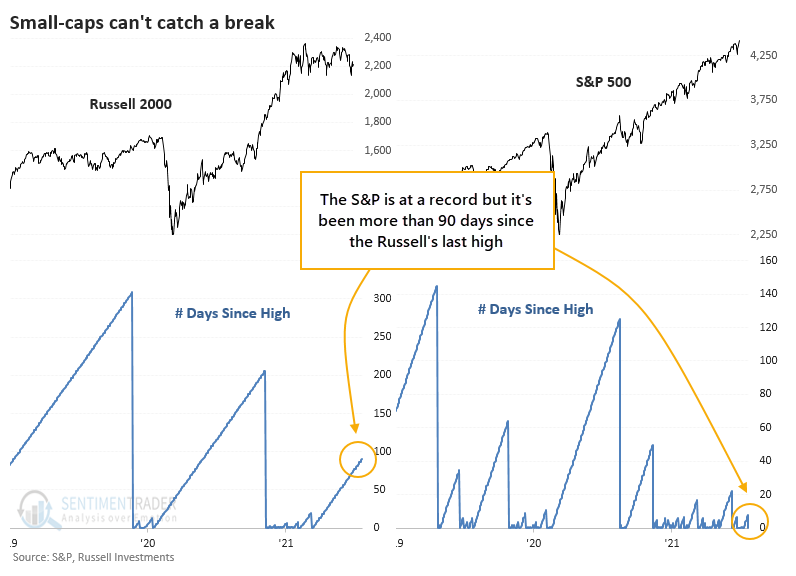
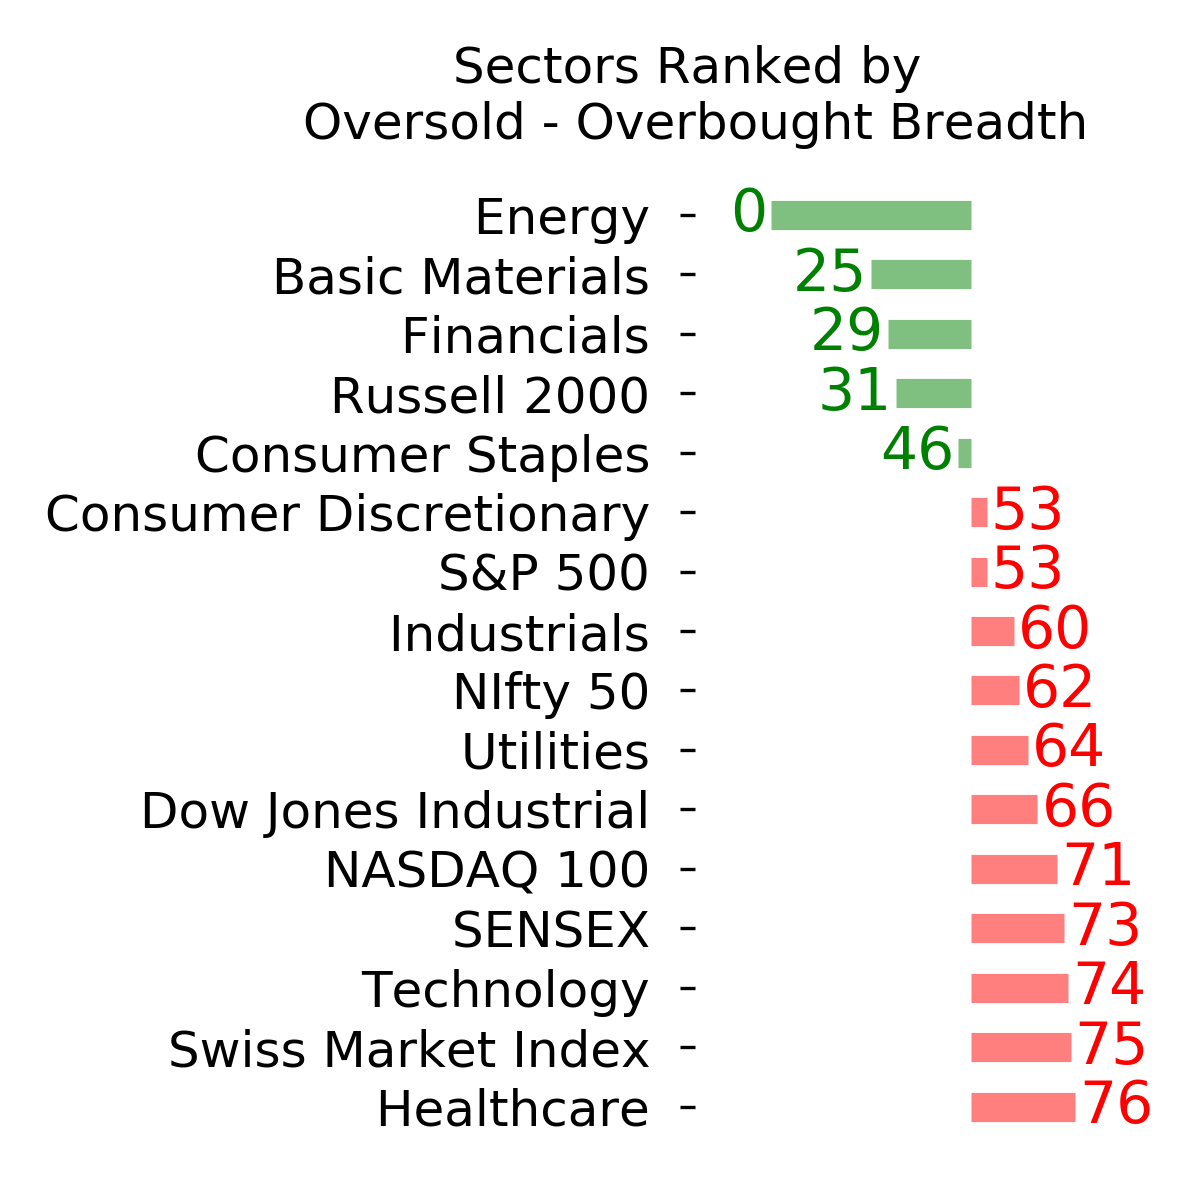
This is part of the reason why some breadth metrics have been struggling. Divergences like that do tend to precede trouble, but clearly, that's having no impact yet and hasn't for this entire year.
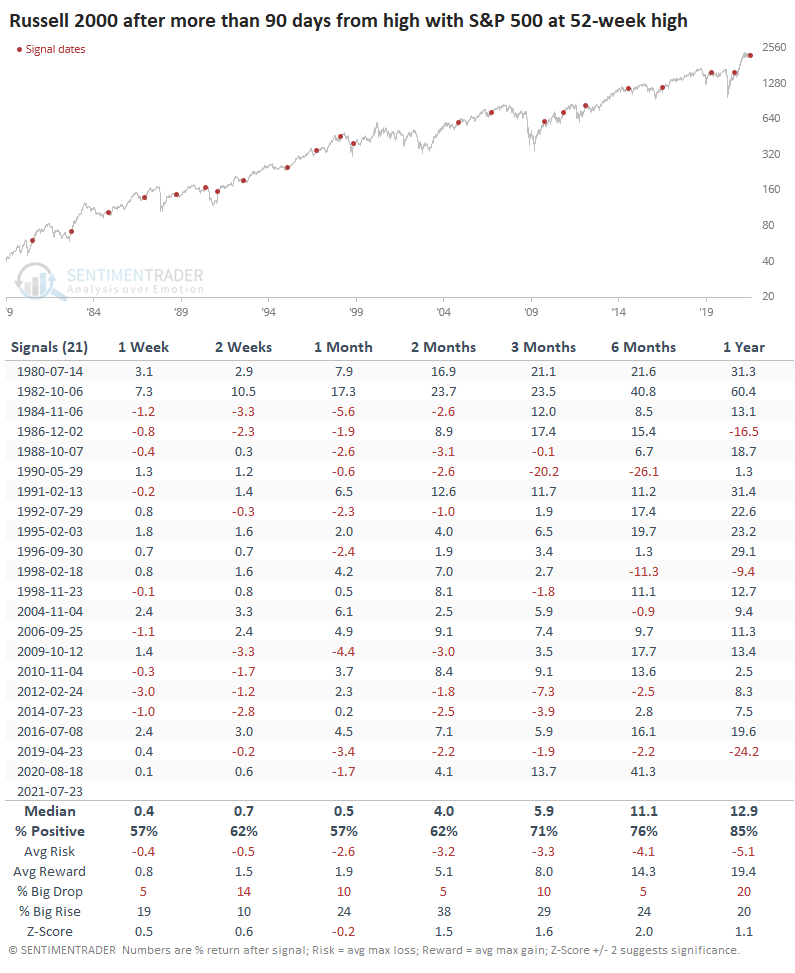
NOT A BAD SIGN FOR STOCKS
If we focus on the interplay of the two indexes and look for times when the S&P set a new high with the Russell not having done so for at least 90 days, it wasn't a bad sign at all.
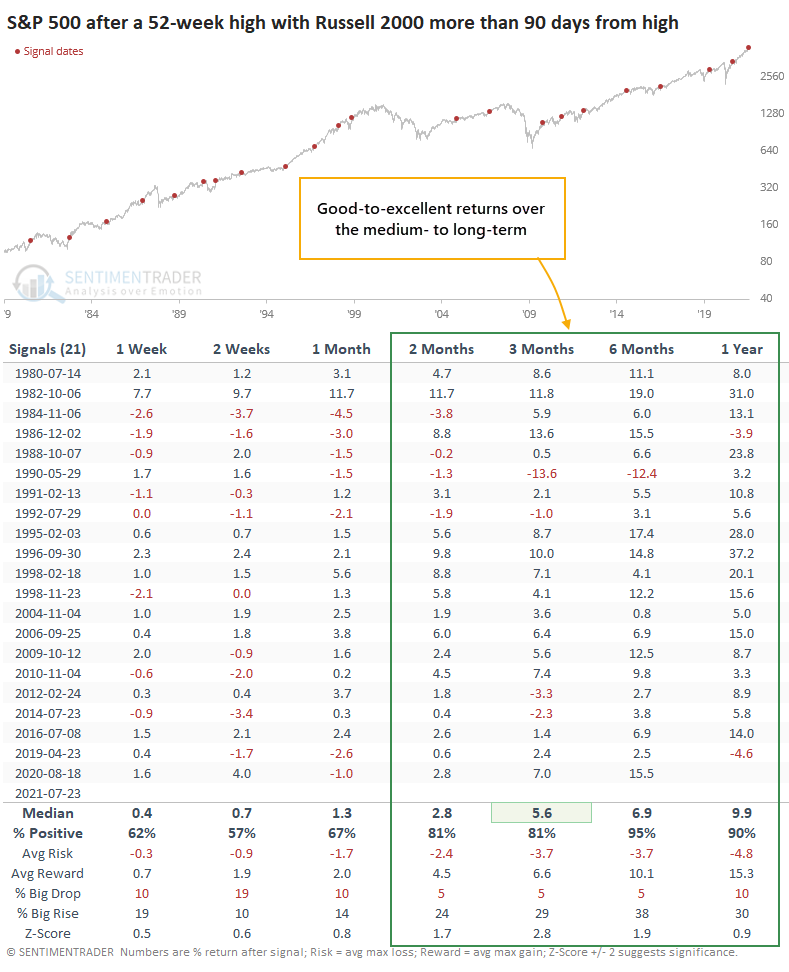
Over the next six months, the S&P showed a positive return after 20 out of 21 signals, and the sole loser was erased in subsequent months. Over the next 6-12 months, the risk vs. reward was impressively skewed to the upside.
Even though it was lagging badly, the Russell tended to rebound going forward but not as consistently as the S&P. Because it's a more volatile index, its average returns tended to be higher, though.
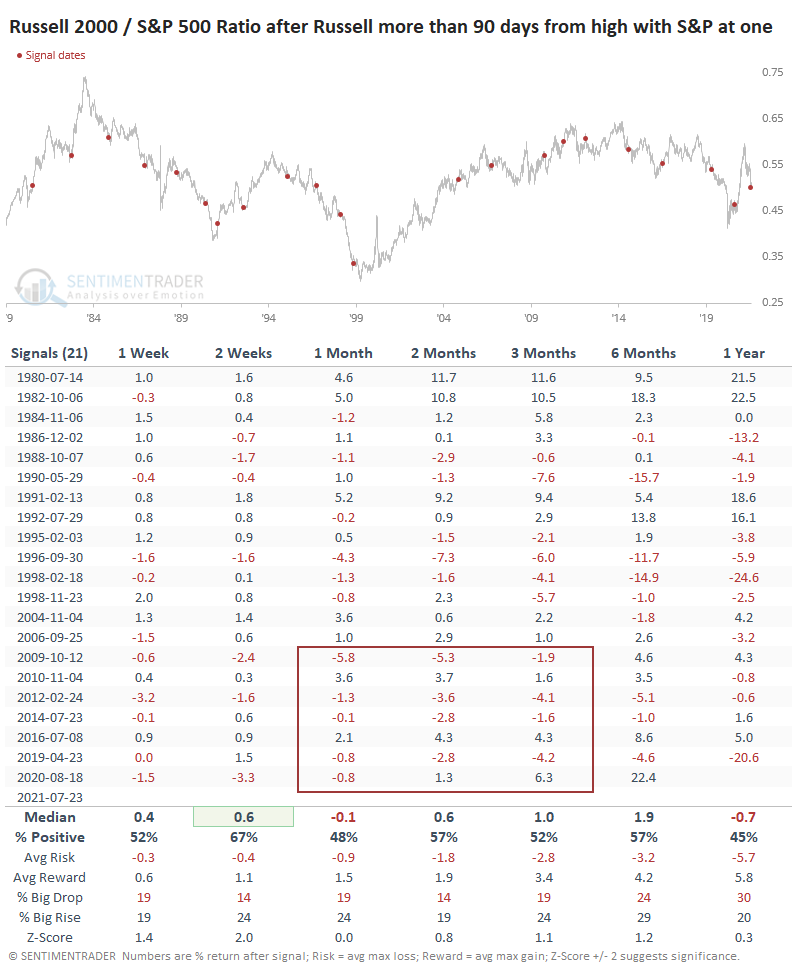
S&P VS. RUSSELL - A DRAW
Looking at the ratio between them, it was a mixed picture. Over the medium- to long-term, the Russell underperformed over a couple of time frames and outperformed slightly after a few others. Since the 2008 financial crisis, there was more of a tendency to underperform over the medium-term.
There is a frustratingly mixed picture with stocks right now. Sentiment is high (on most measures) but ebbing from earlier in the spring. Breadth has diverged negatively, and then we saw an impressive reversal of buying interest mid-week last week that never failed to lead to a rally. We very much favor a weight-of-the-evidence approach that incorporates work from different angles, and right now, that is nothing but a muddled mess.
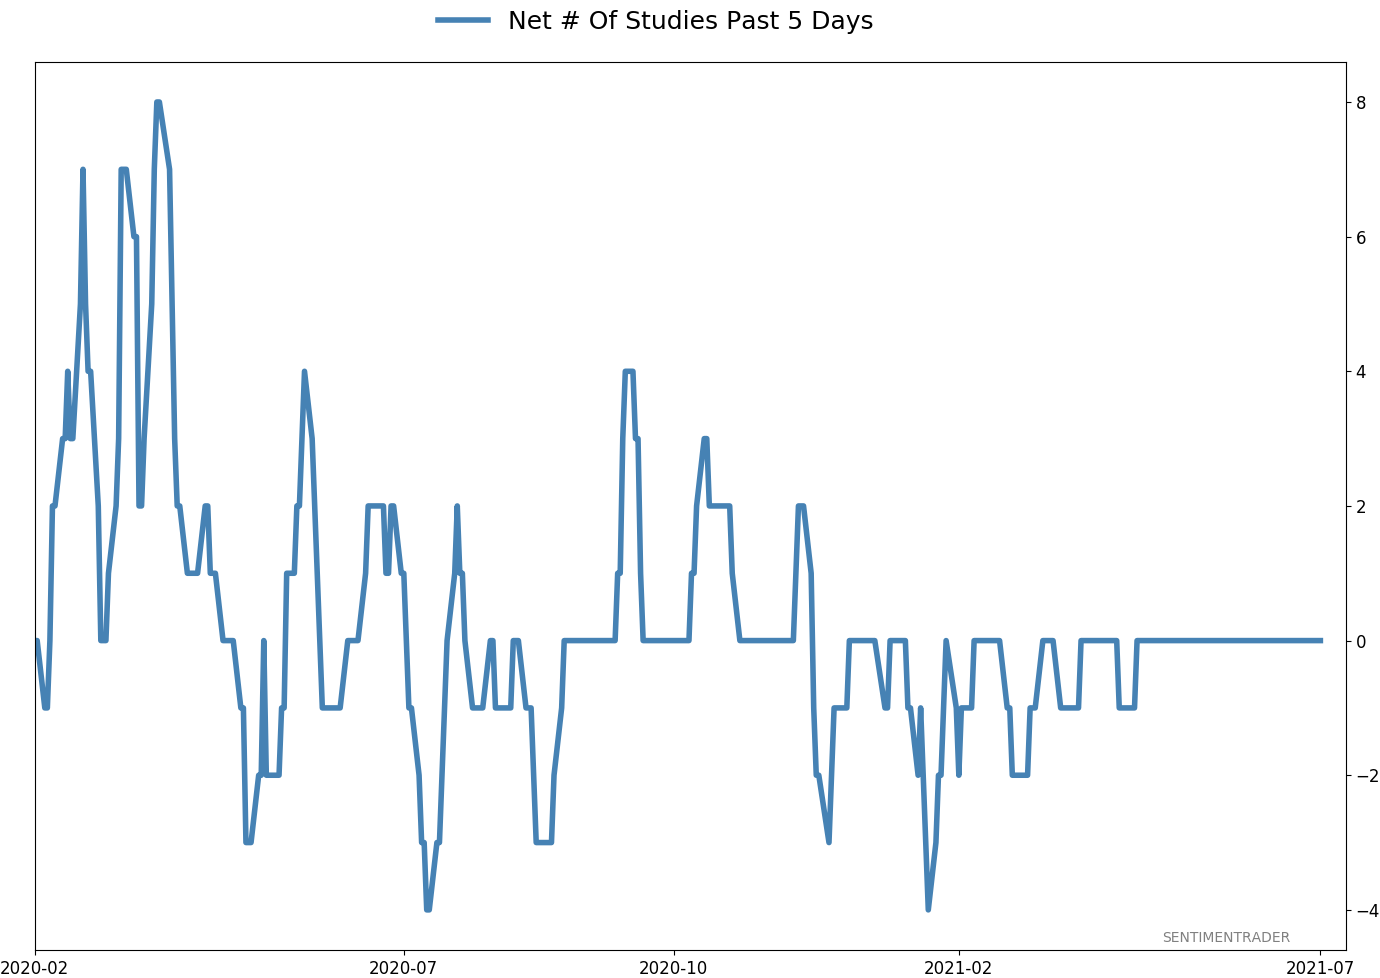
Active Studies
| Time Frame | Bullish | Bearish | | Short-Term | 0 | 4 | | Medium-Term | 4 | 3 | | Long-Term | 10 | 5 |
|
Indicators at Extremes
Portfolio
| Position | Description | Weight % | Added / Reduced | Date | | Stocks | RSP | 4.1 | Added 4.1% | 2021-05-19 | | Bonds | 23.9% BND, 6.9% SCHP | 30.7 | Reduced 7.1% | 2021-05-19 | | Commodities | GCC | 2.6 | Reduced 2.1%
| 2020-09-04 | | Precious Metals | GDX | 5.6 | Reduced 4.2% | 2021-05-19 | | Special Situations | 4.3% XLE, 2.2% PSCE | 7.6 | Reduced 5.6% | 2021-04-22 | | Cash | | 49.4 | | |
|
Updates (Changes made today are underlined)
Much of our momentum and trend work has remained positive for several months, with some scattered exceptions. Almost all sentiment-related work has shown a poor risk/reward ratio for stocks, especially as speculation drove to record highs in exuberance in February. Much of that has worn off, and most of our models are back toward neutral levels. There isn't much to be excited about here. The same goes for bonds and even gold. Gold has been performing well lately and is back above long-term trend lines. The issue is that it has a poor record of holding onto gains when attempting a long-term trend change like this, so we'll take a wait-and-see approach. RETURN YTD: 9.1% 2020: 8.1%, 2019: 12.6%, 2018: 0.6%, 2017: 3.8%, 2016: 17.1%, 2015: 9.2%, 2014: 14.5%, 2013: 2.2%, 2012: 10.8%, 2011: 16.5%, 2010: 15.3%, 2009: 23.9%, 2008: 16.2%, 2007: 7.8%
|
|
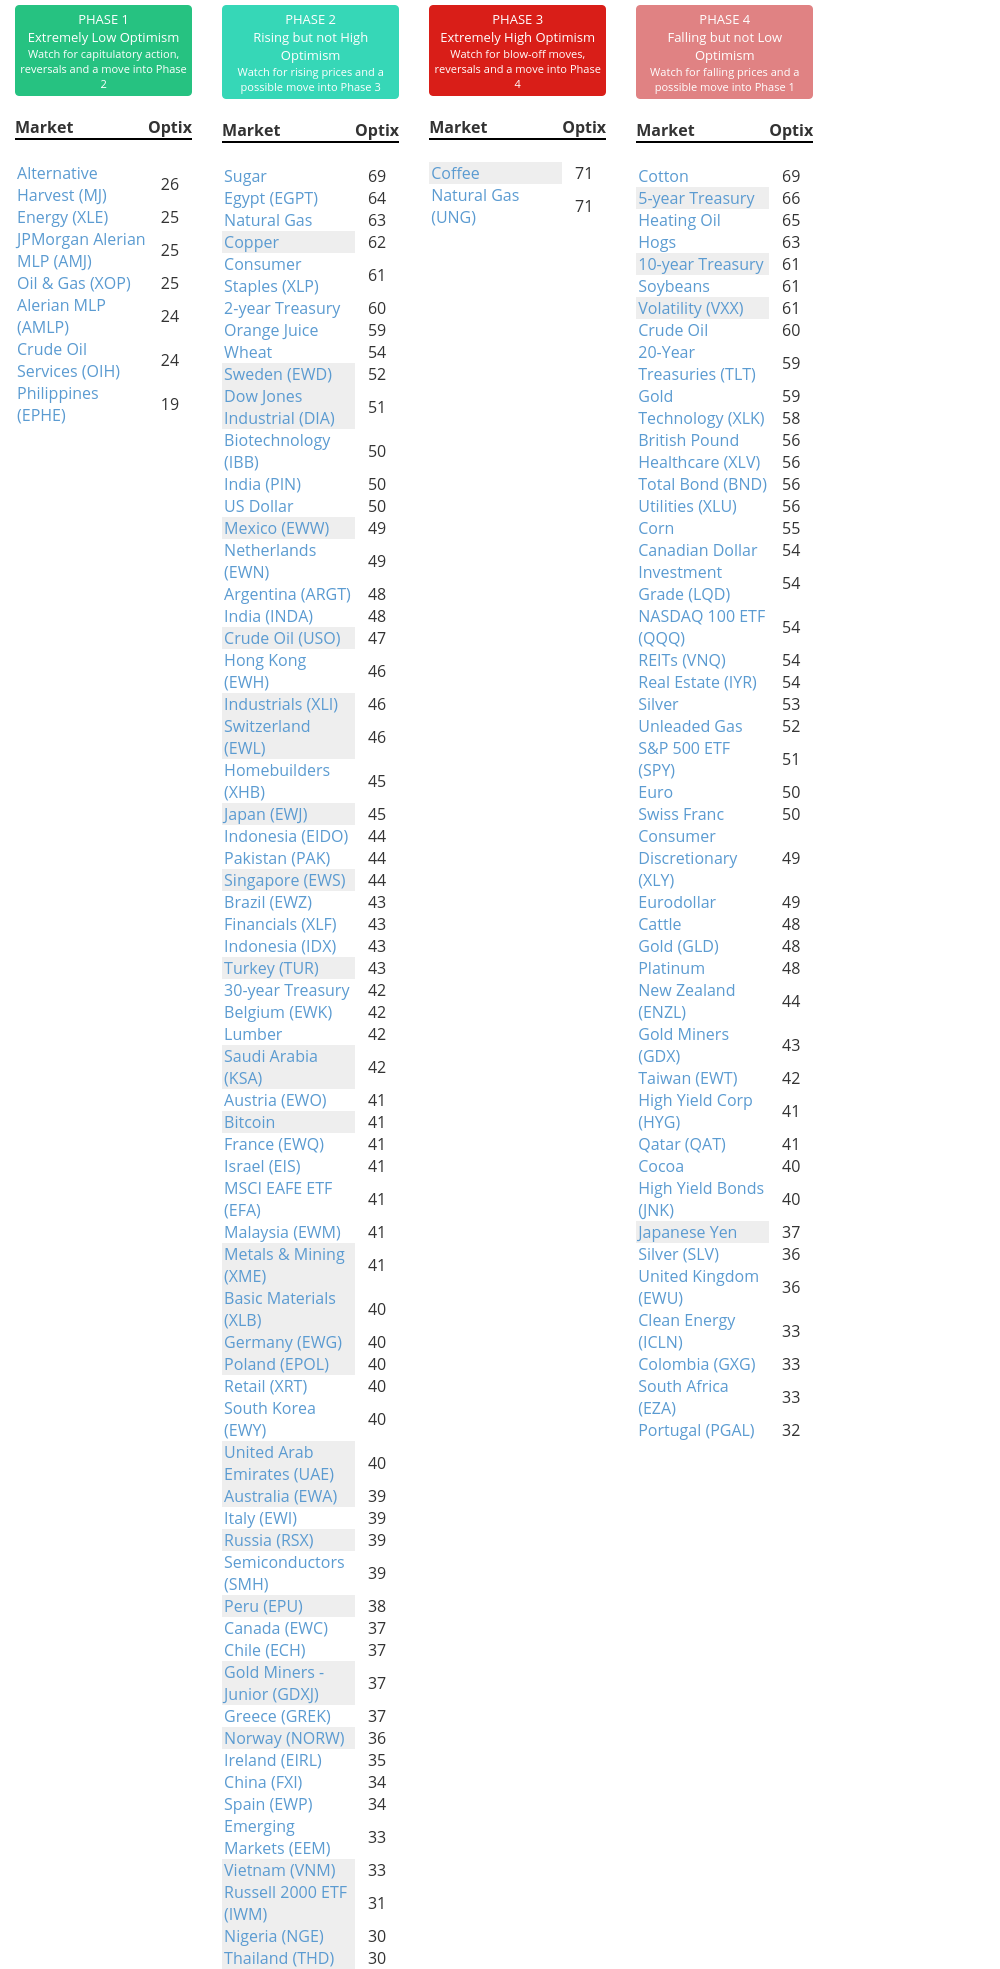
Phase Table
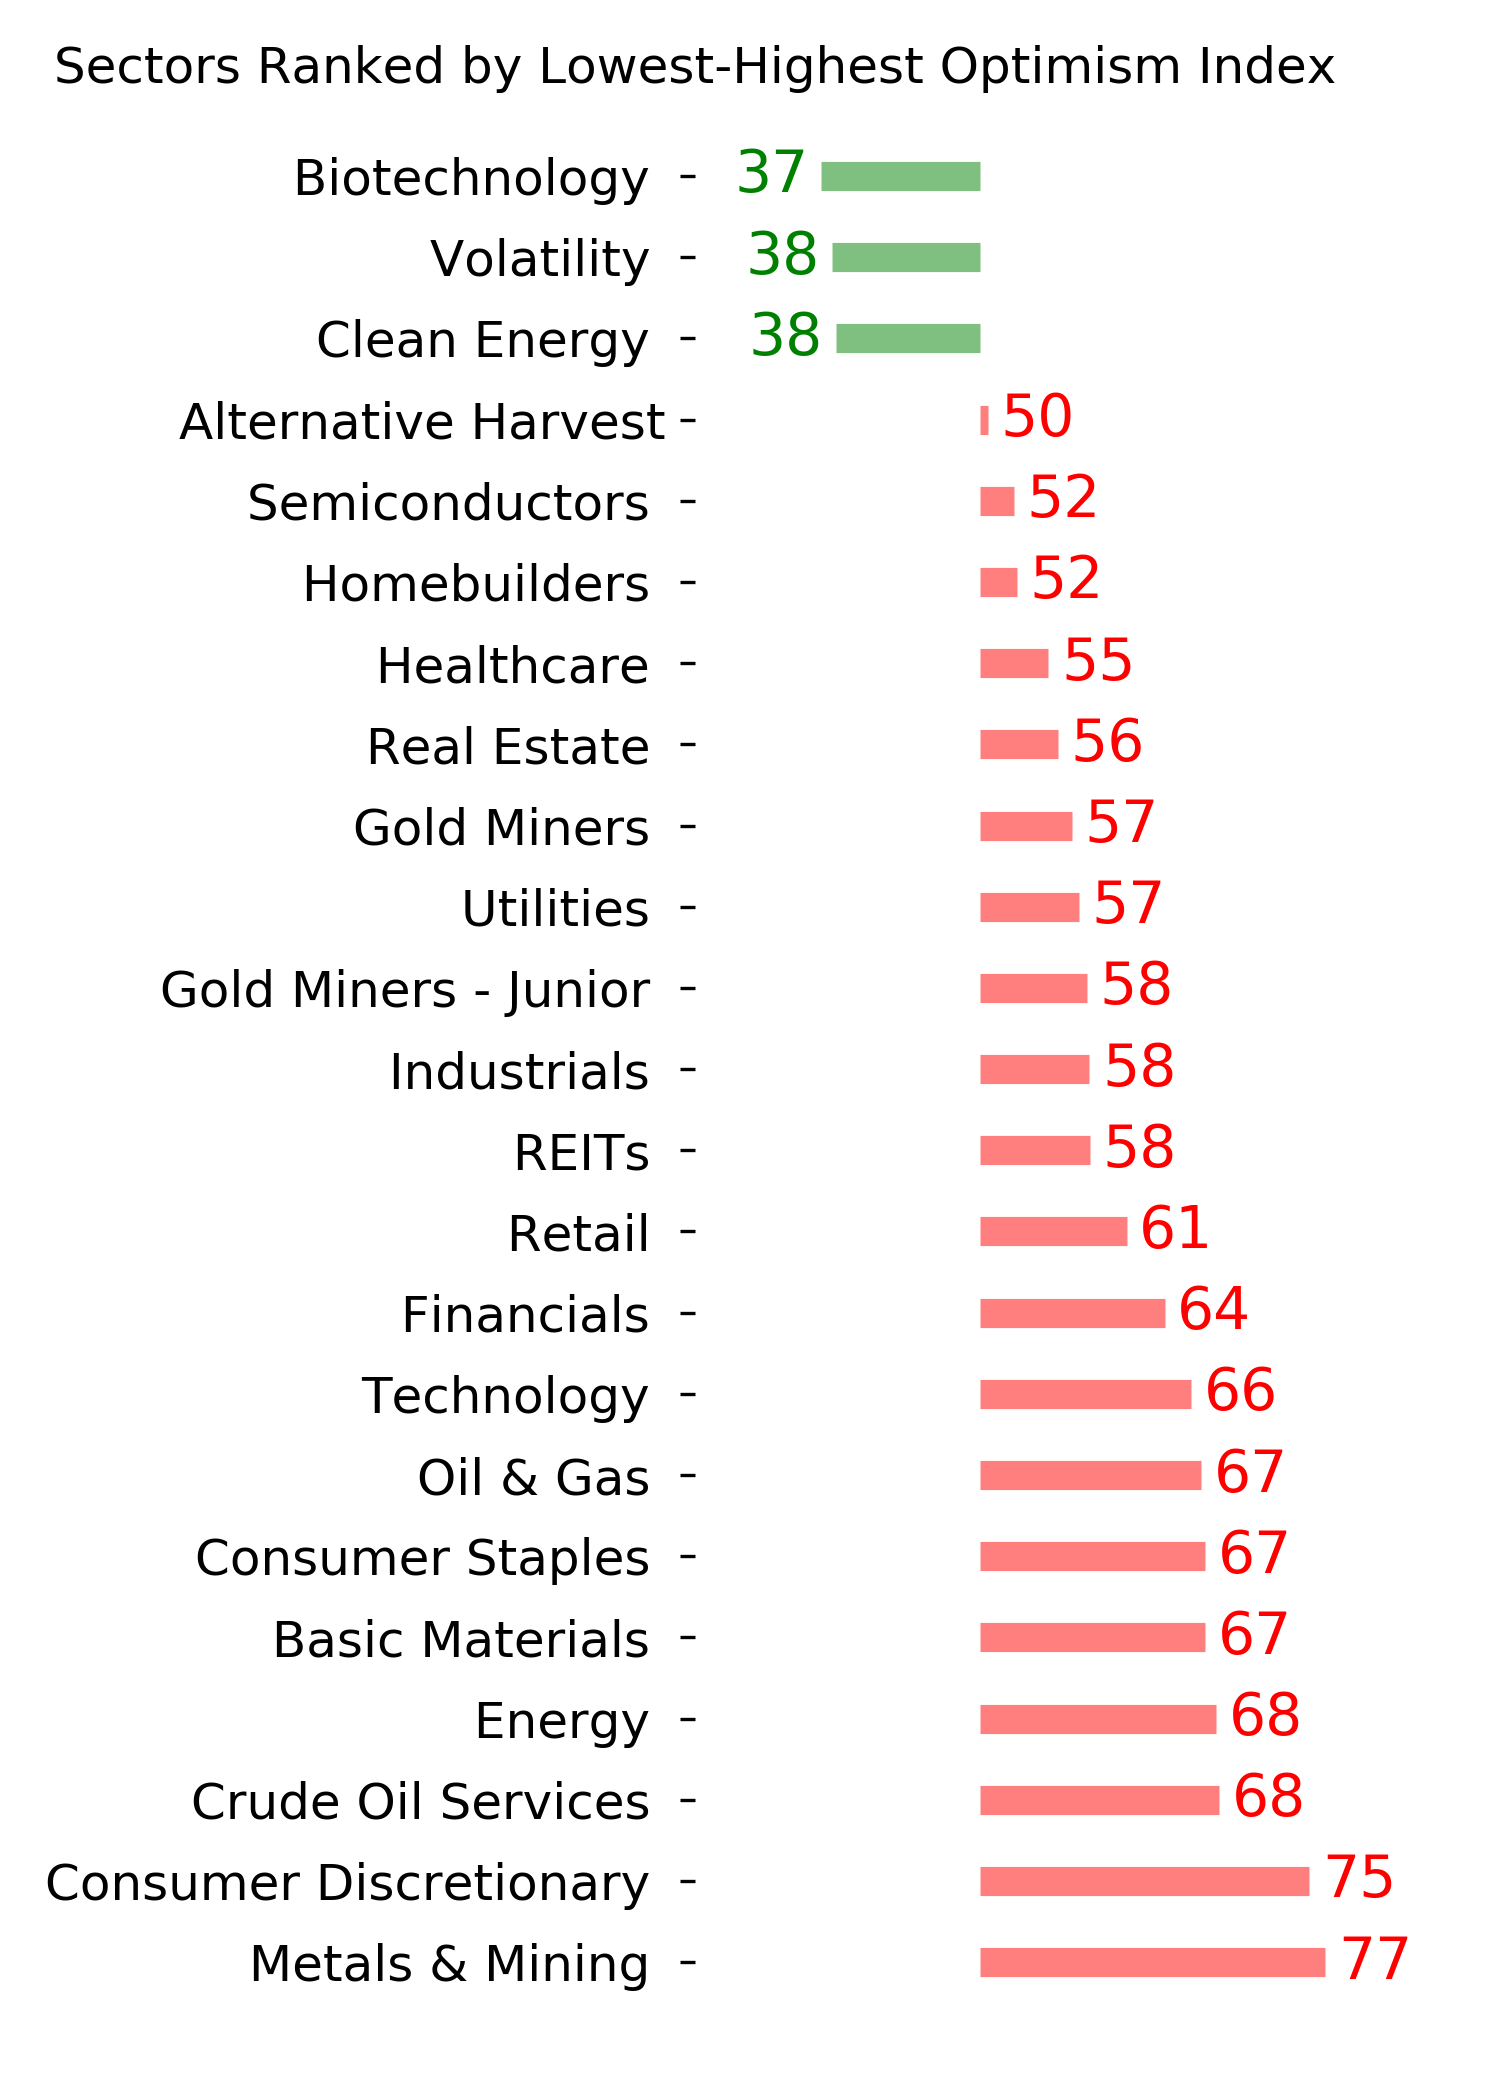
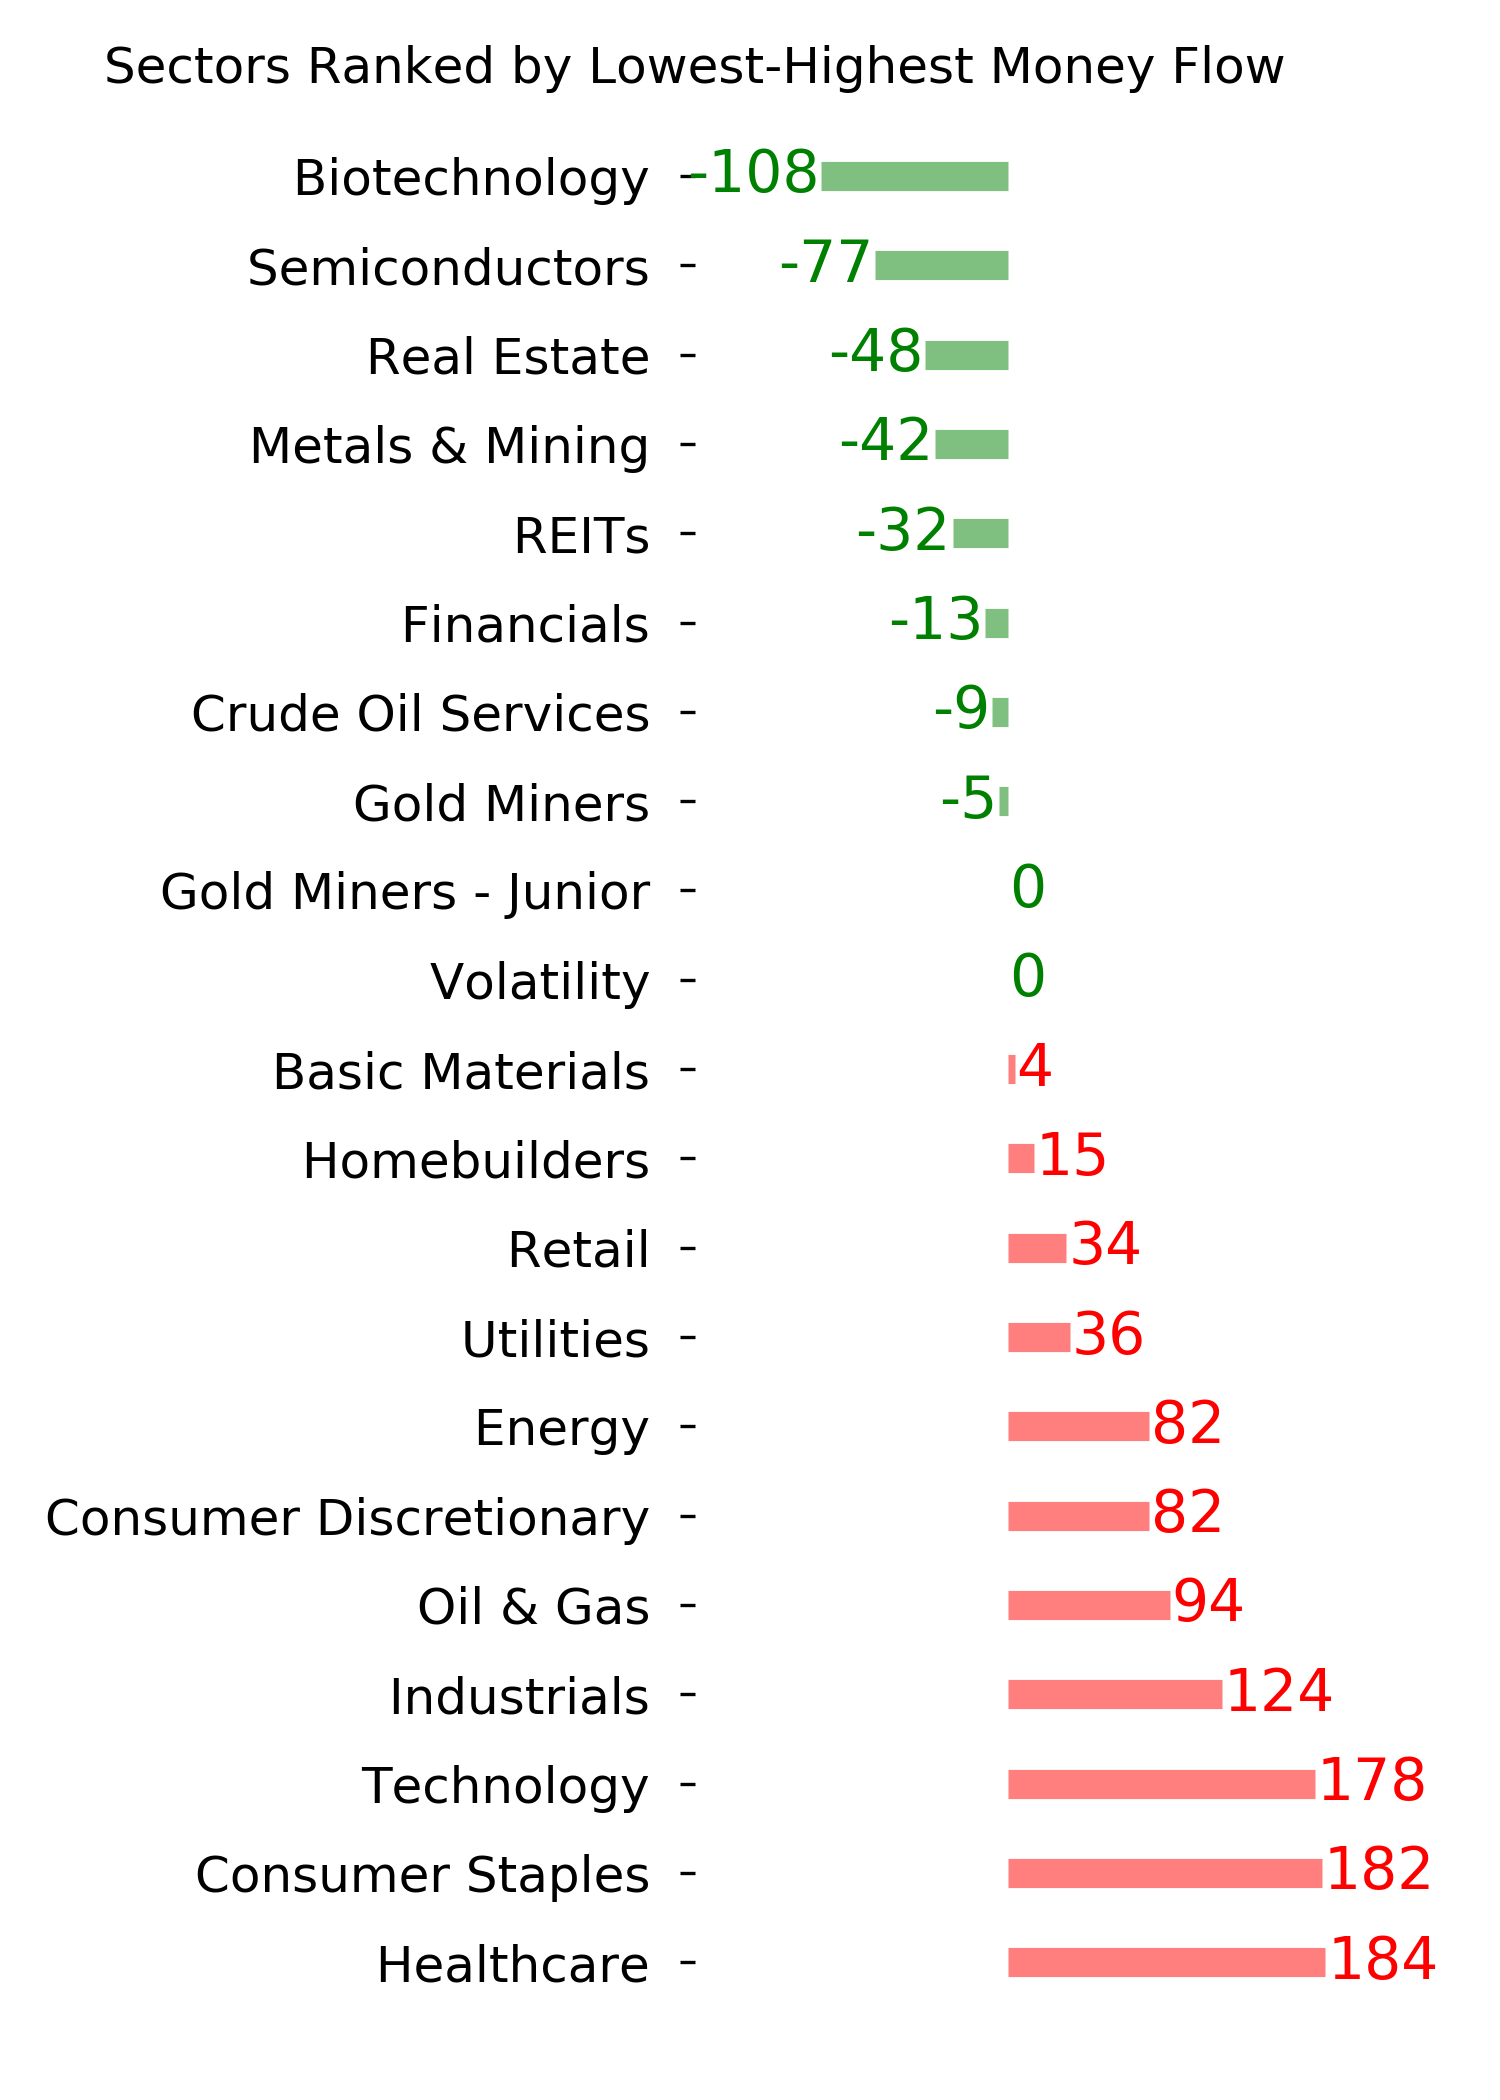
Ranks
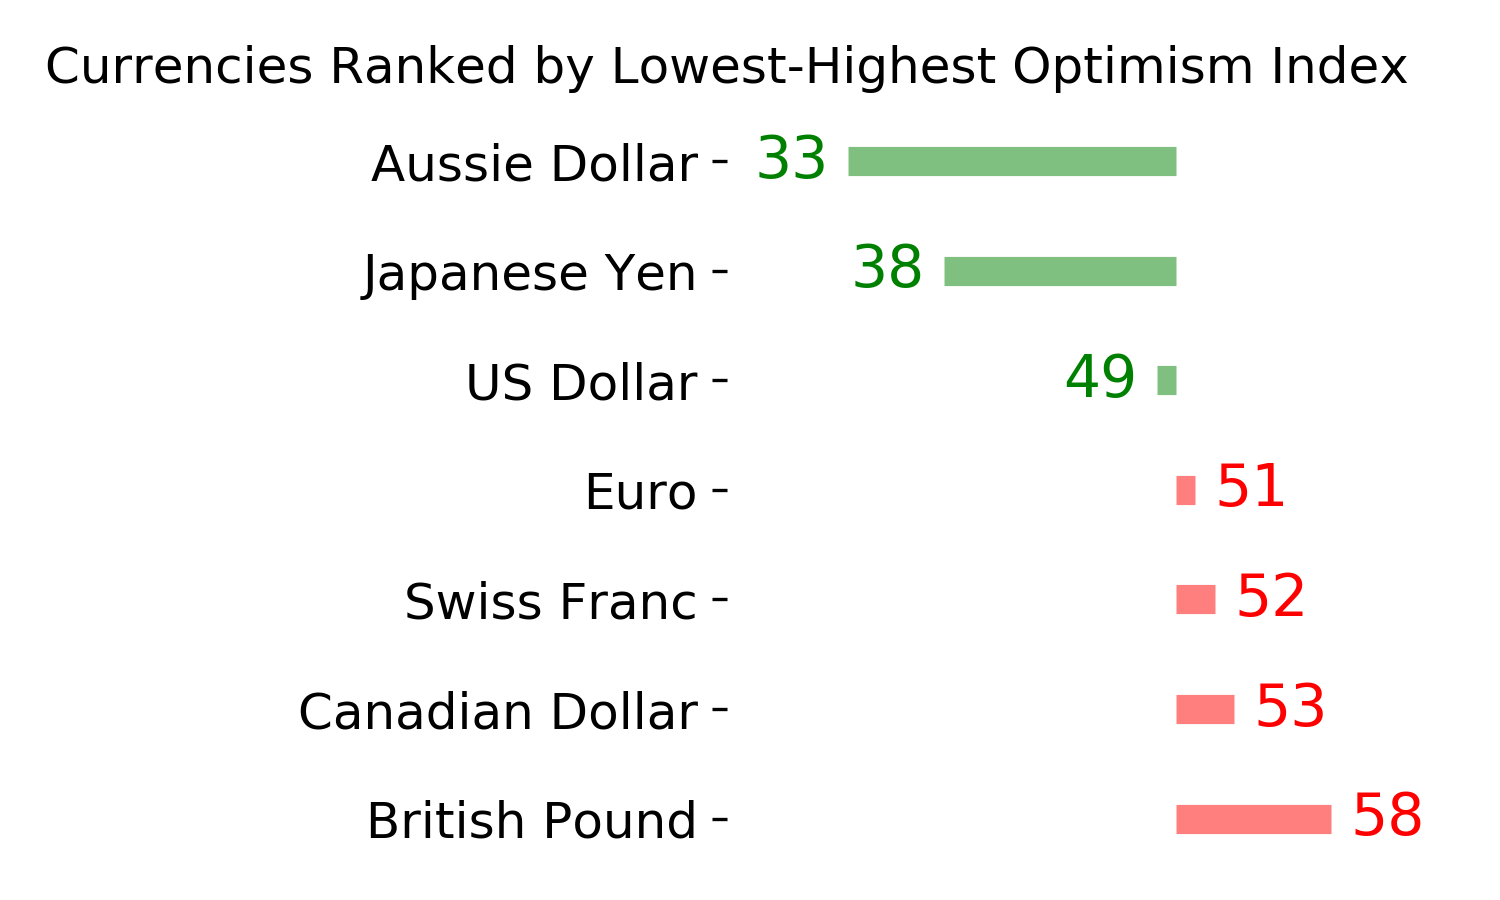
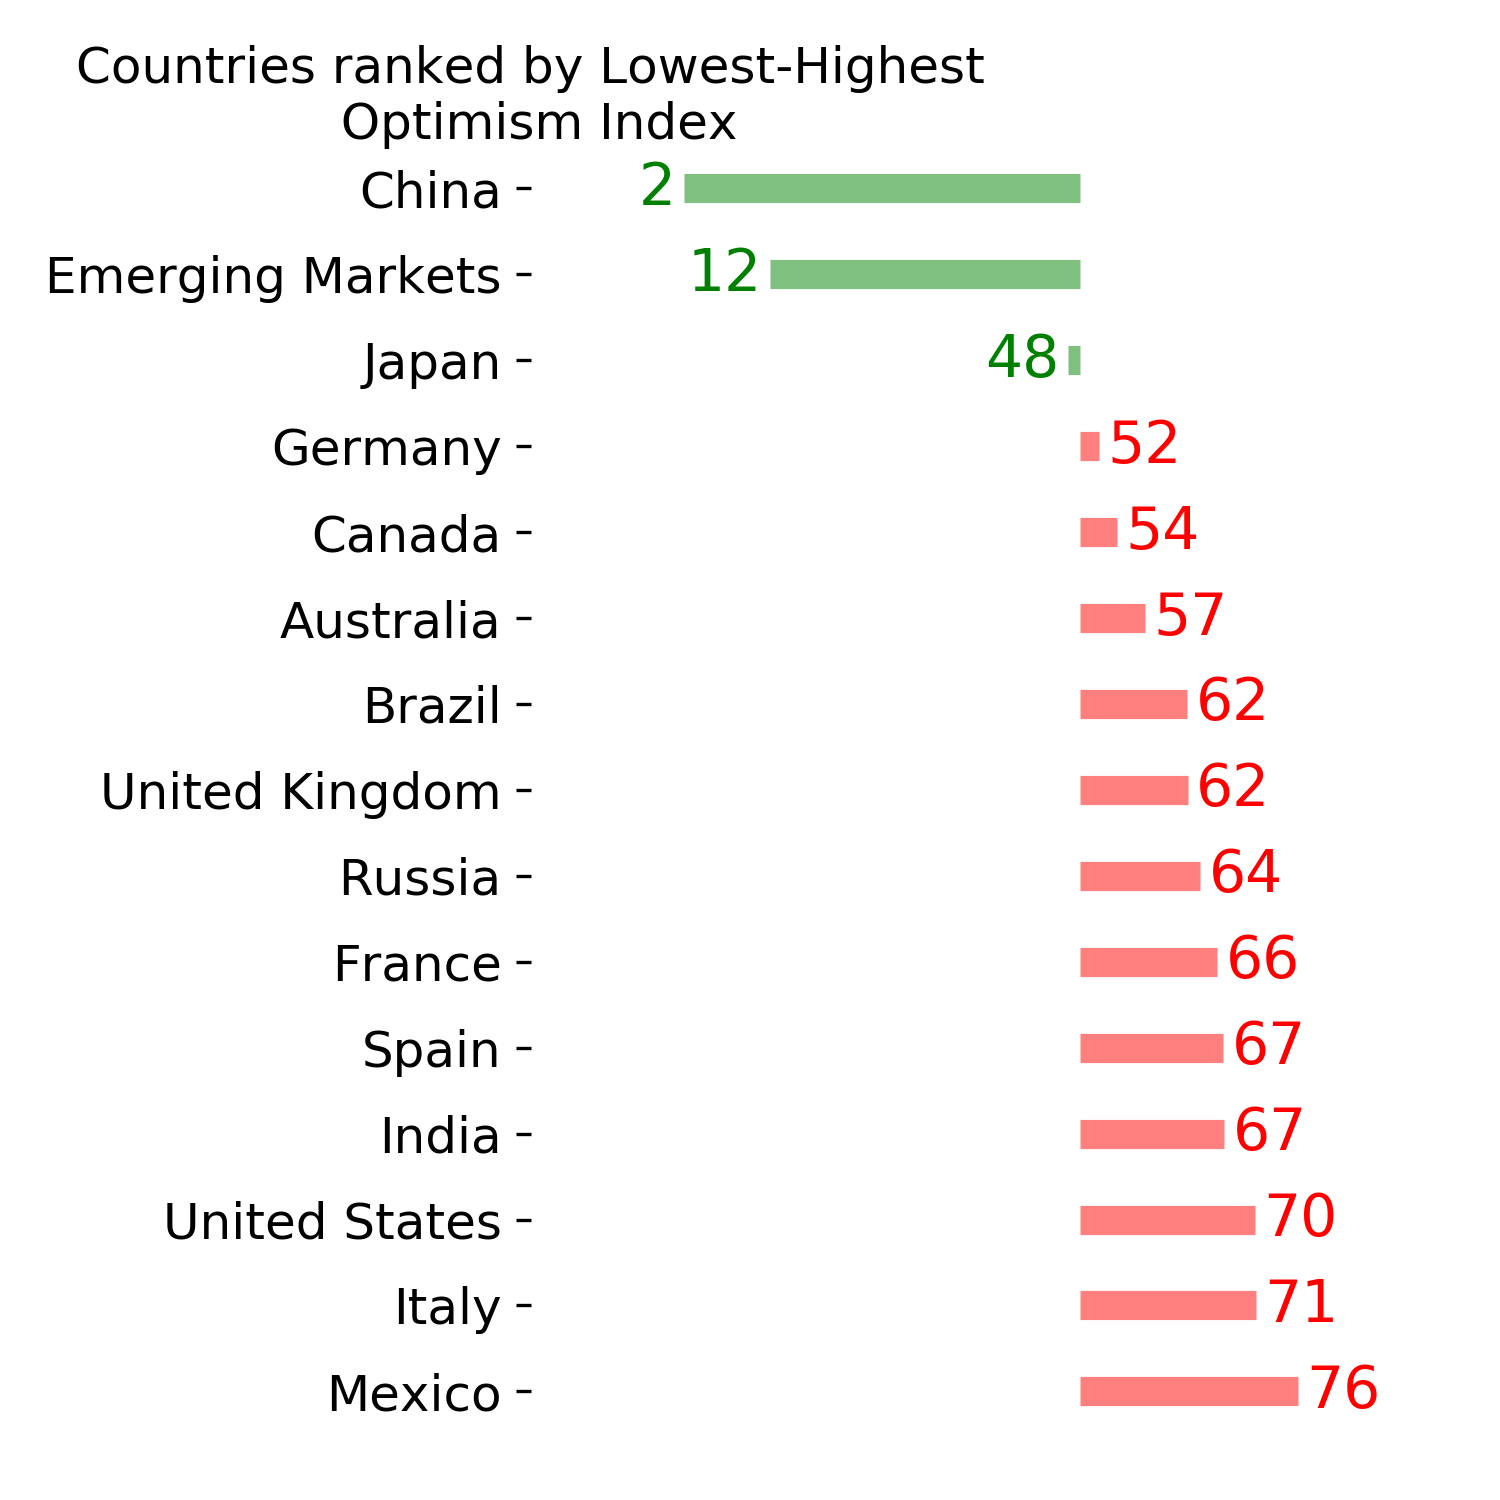
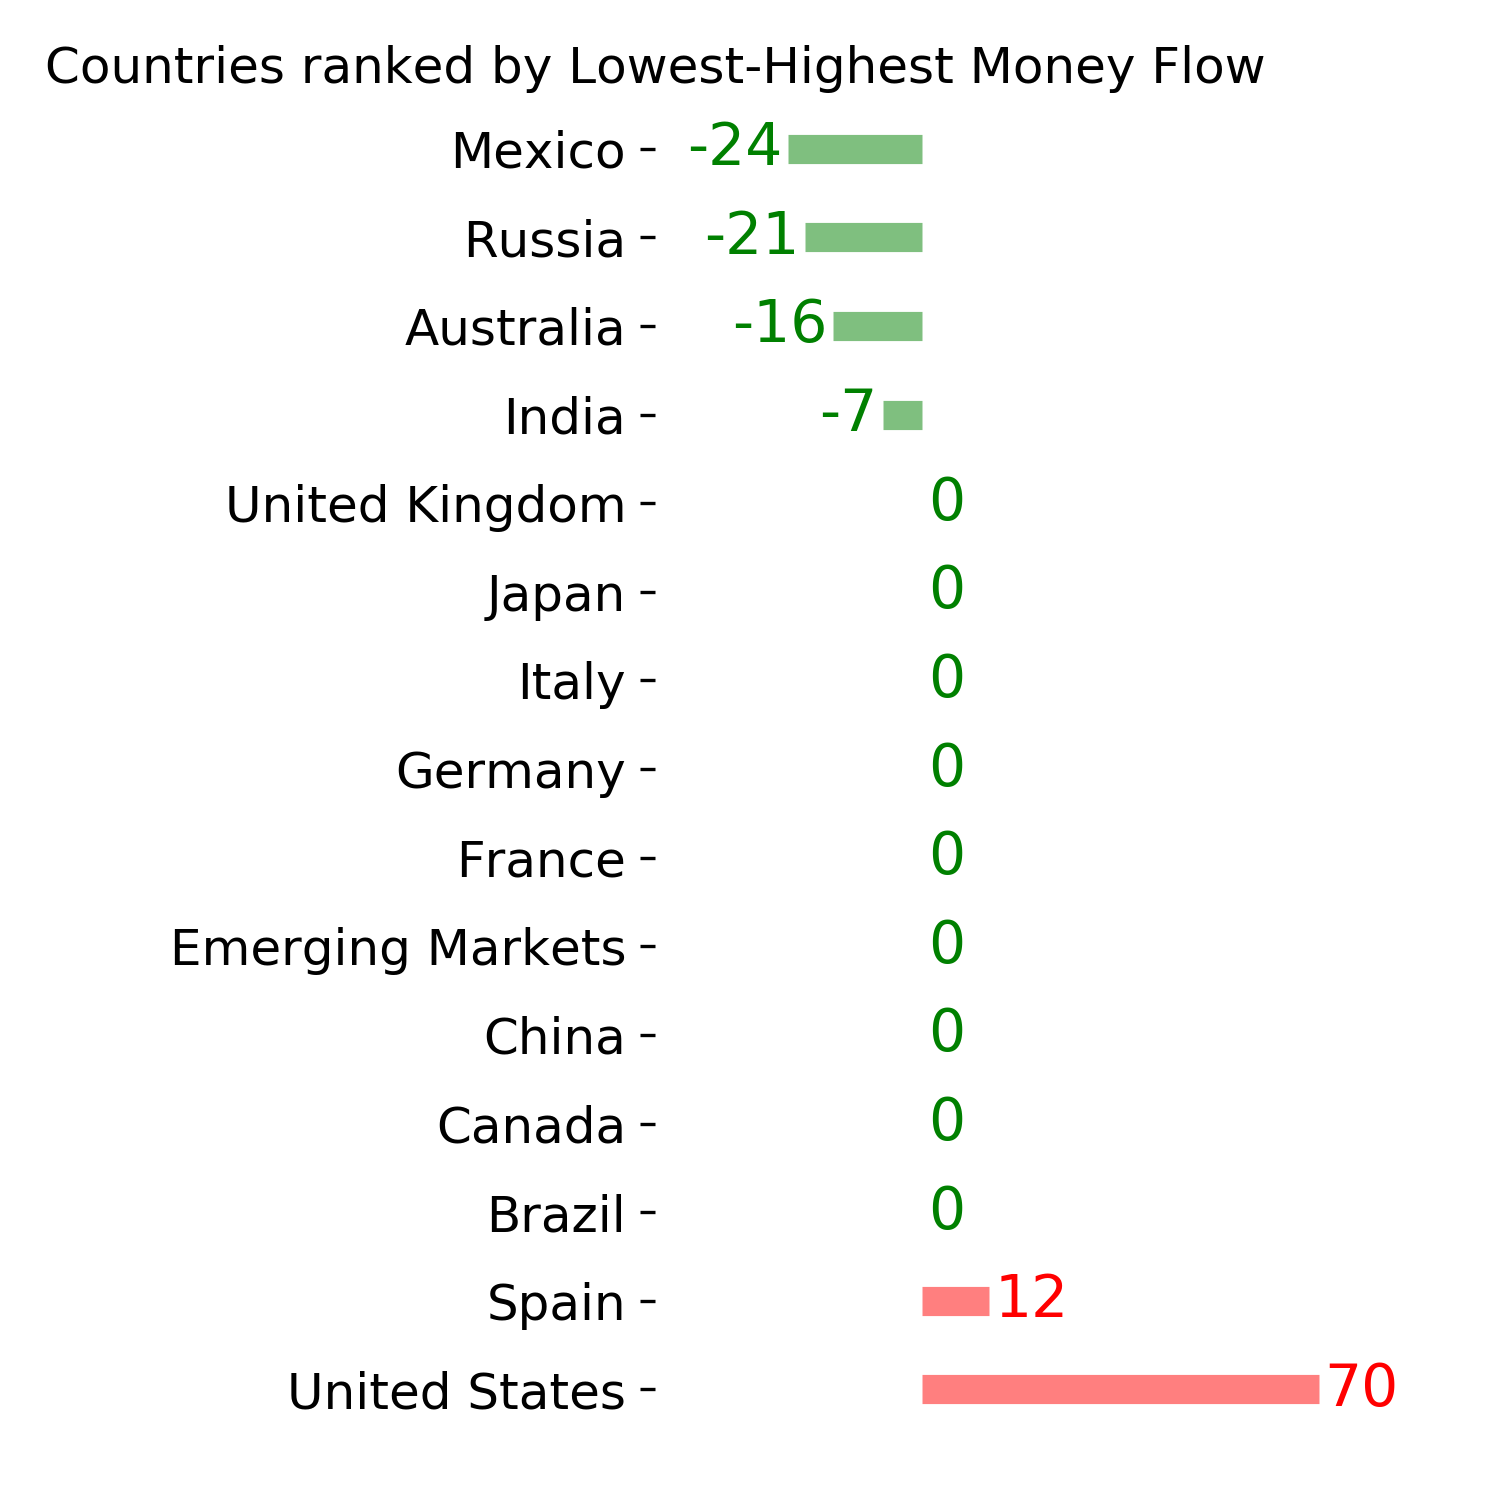
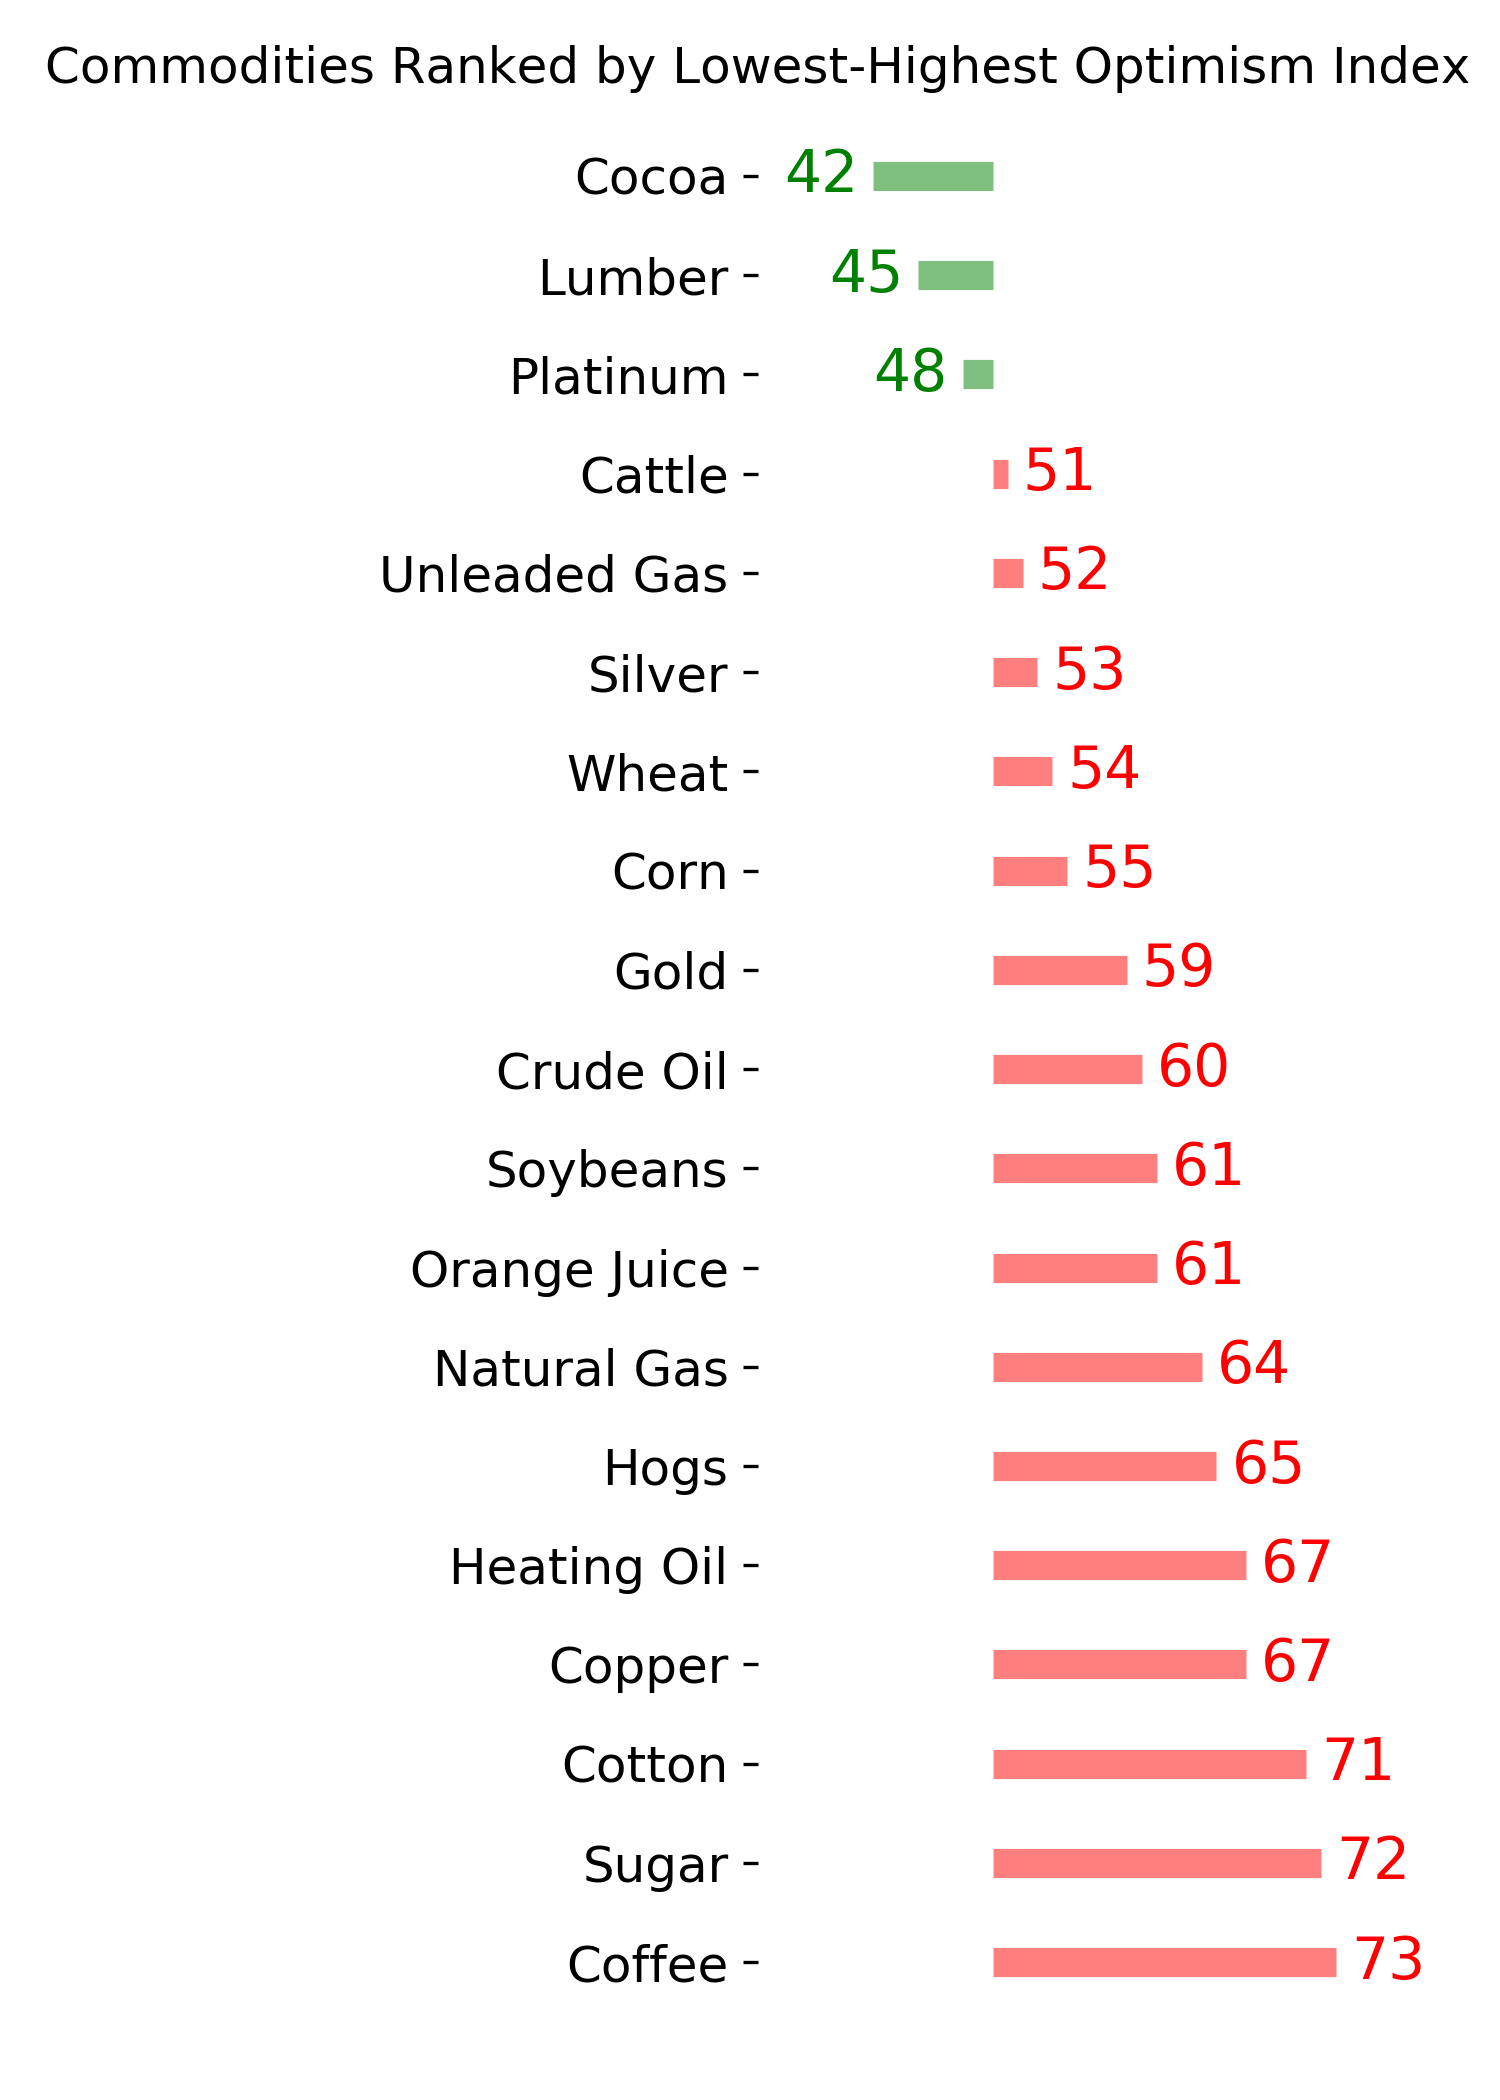
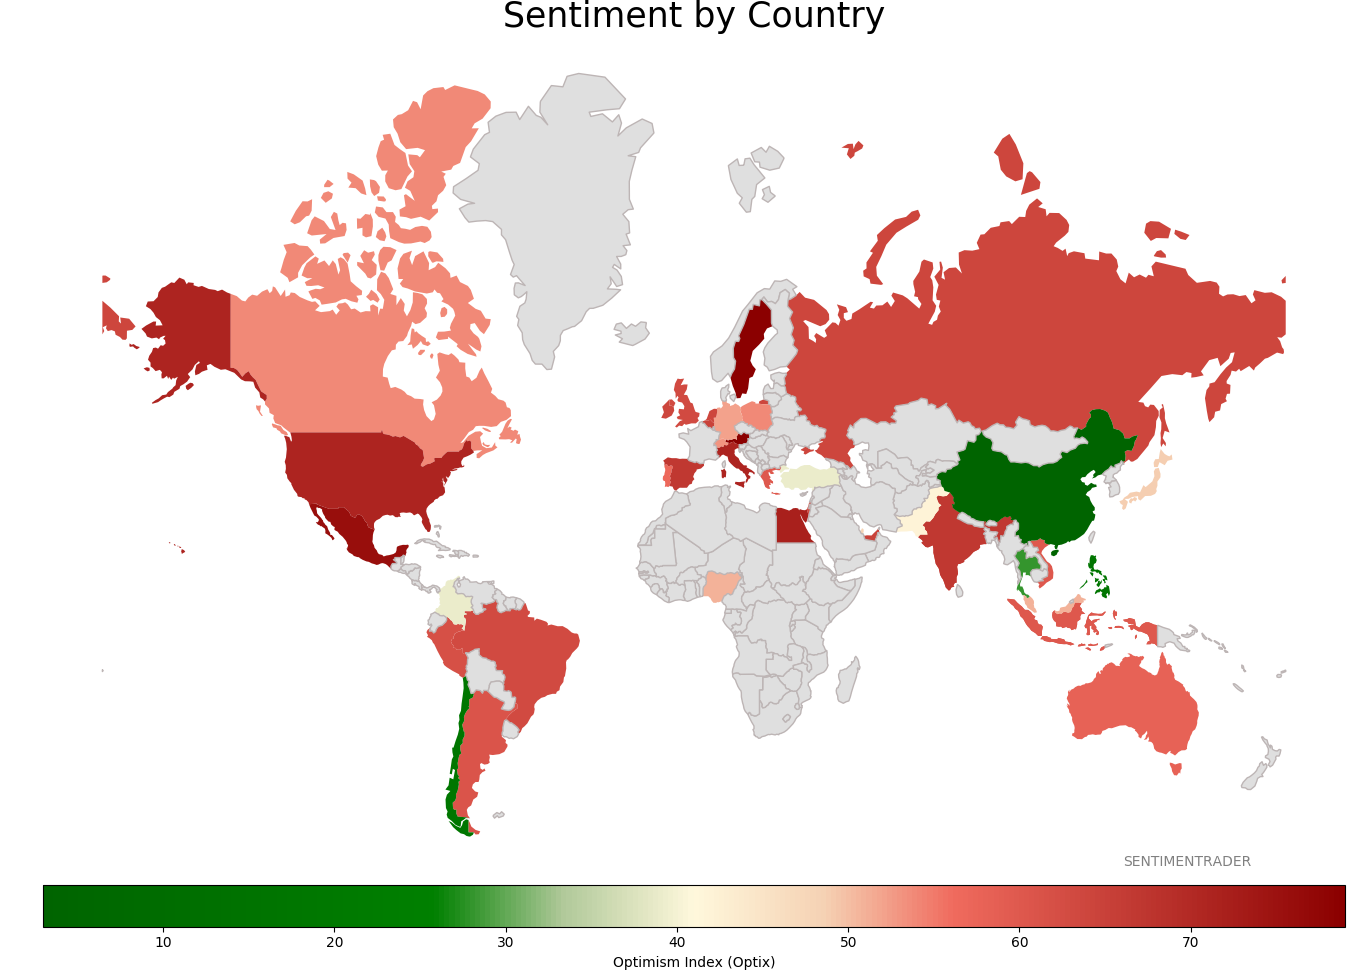
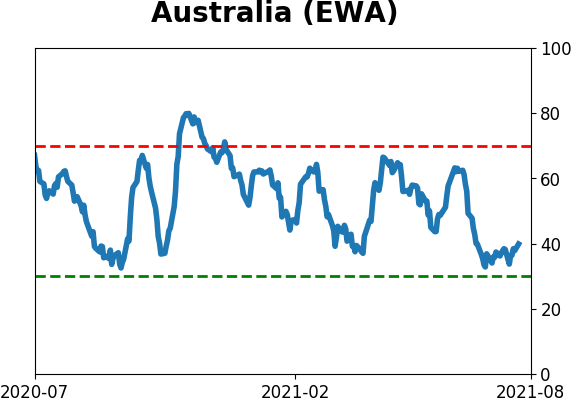
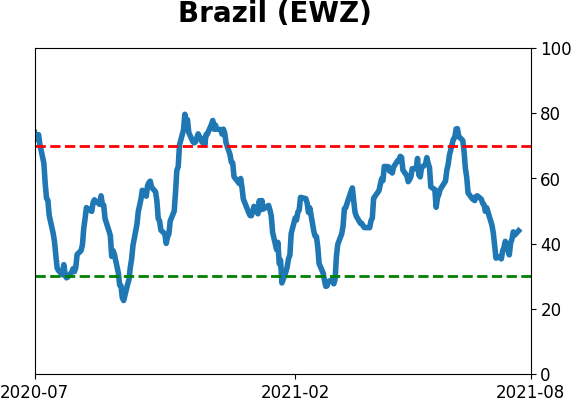
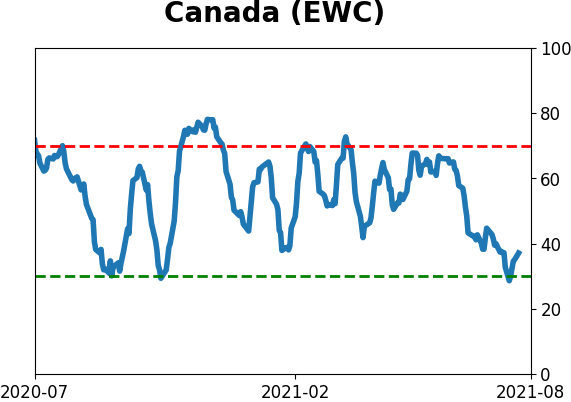
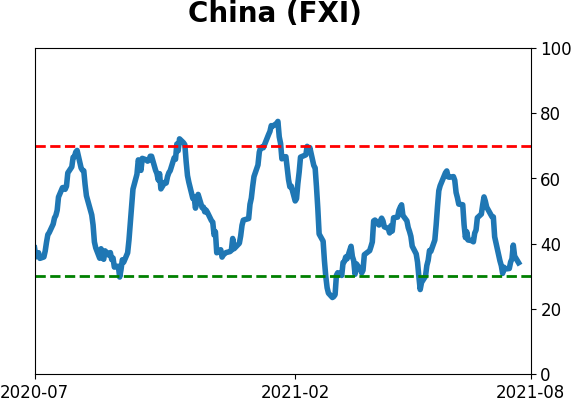
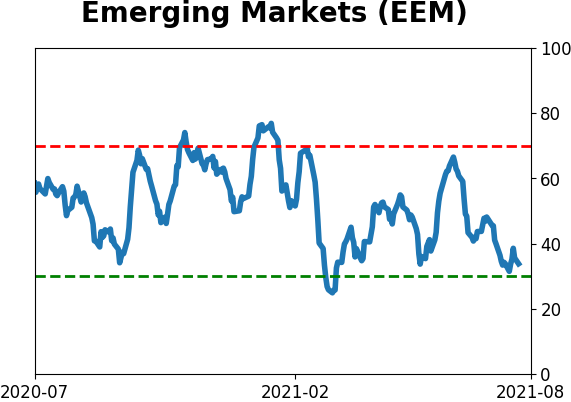
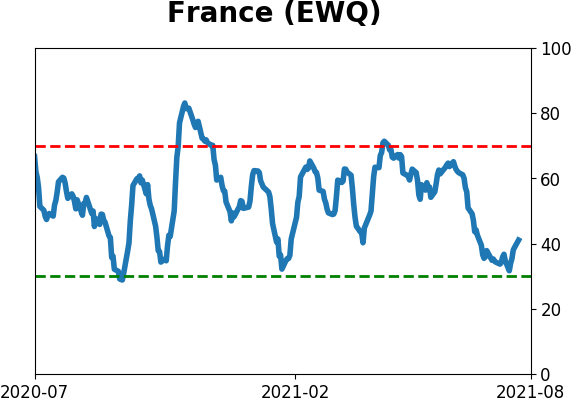
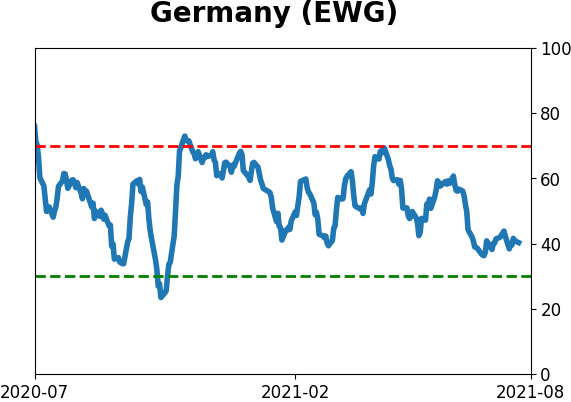
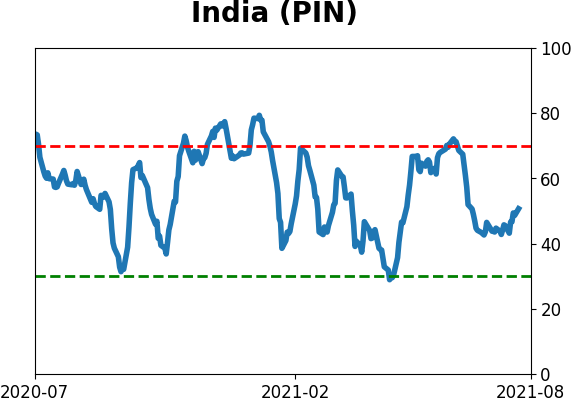
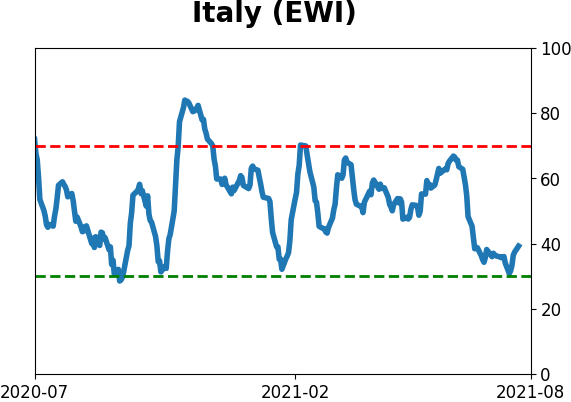
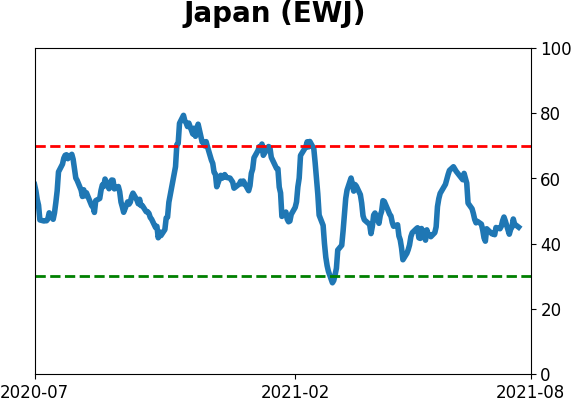
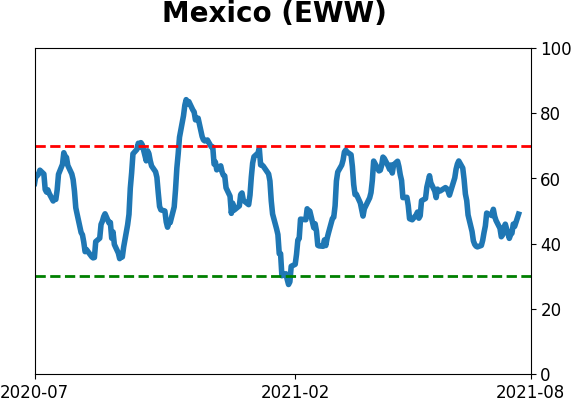
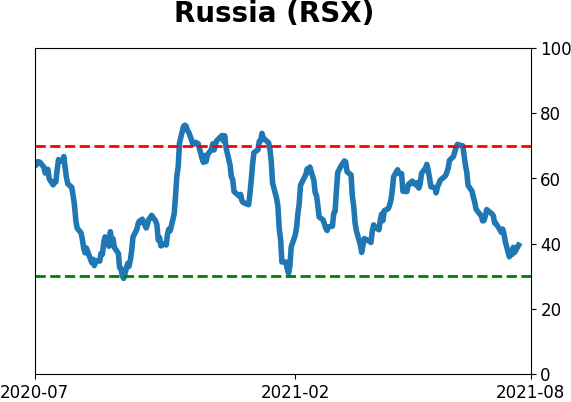
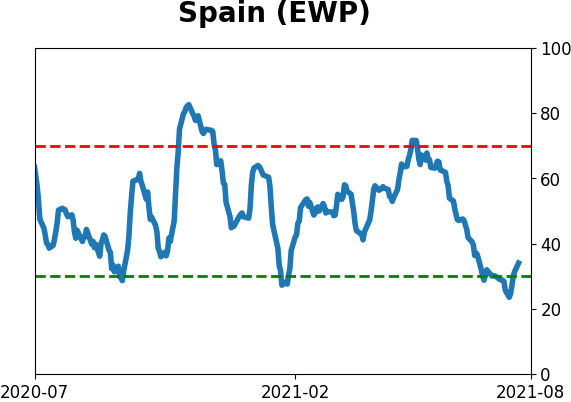
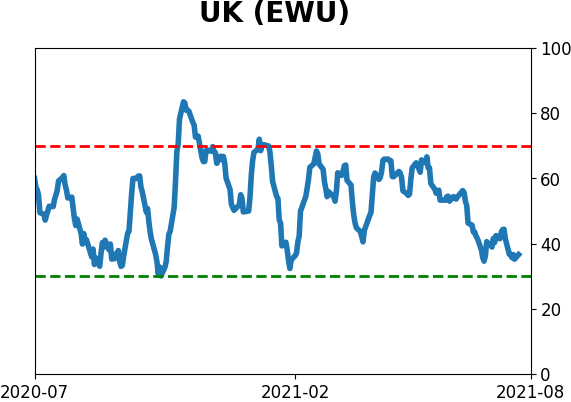
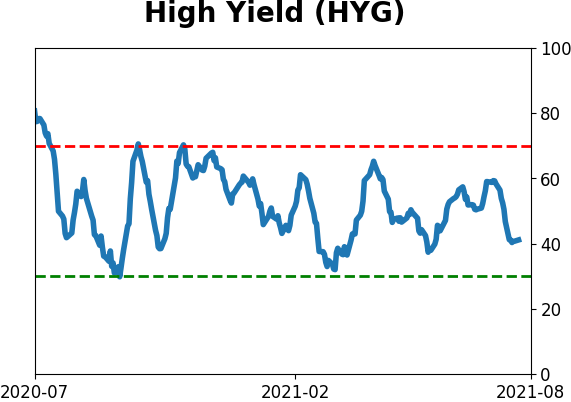
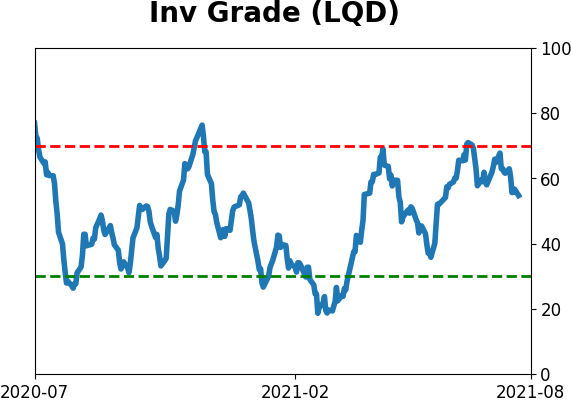
Sentiment Around The World
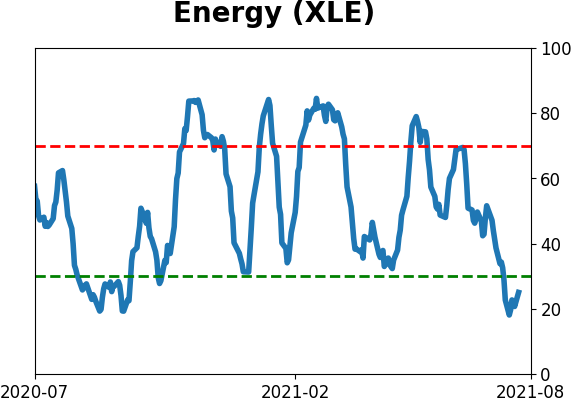
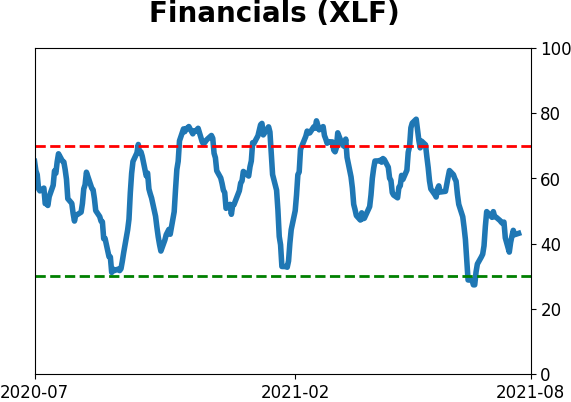
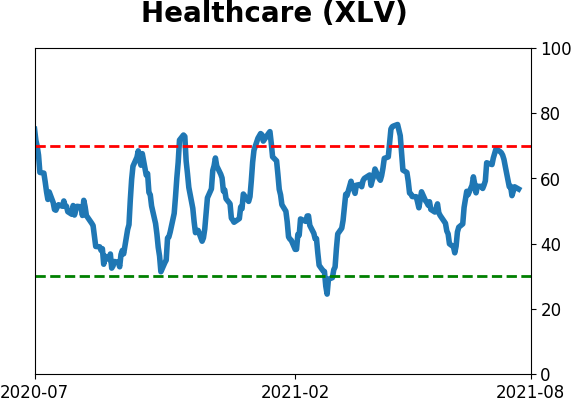
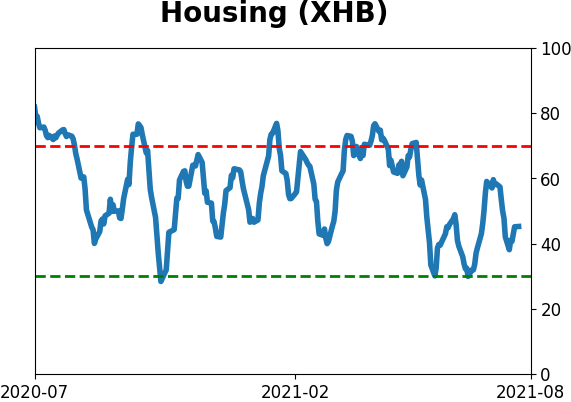
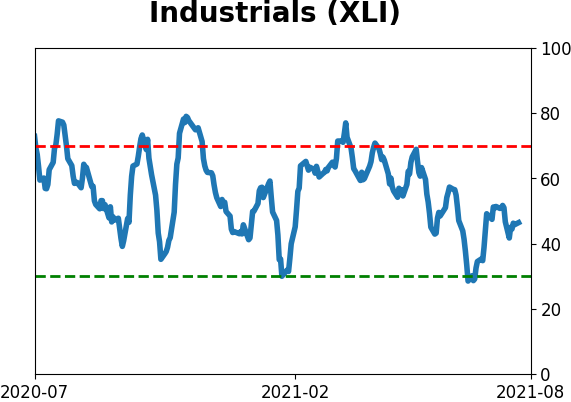
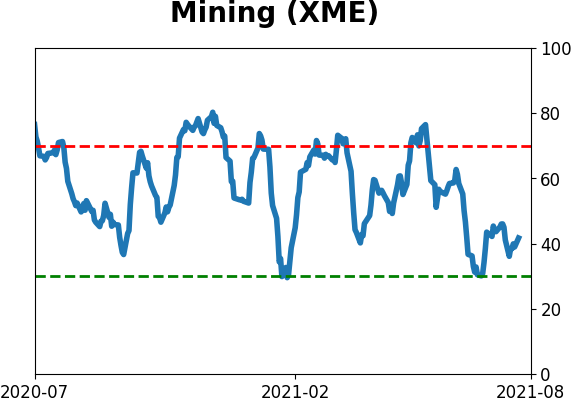
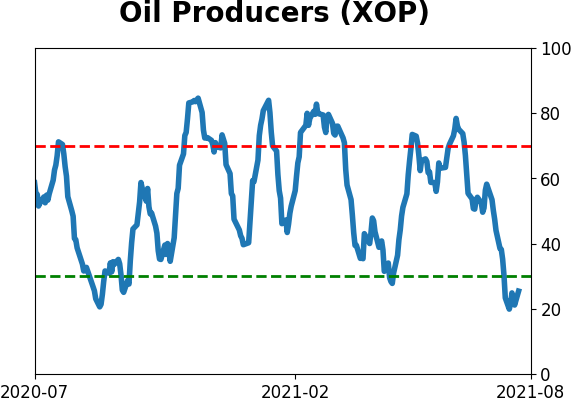
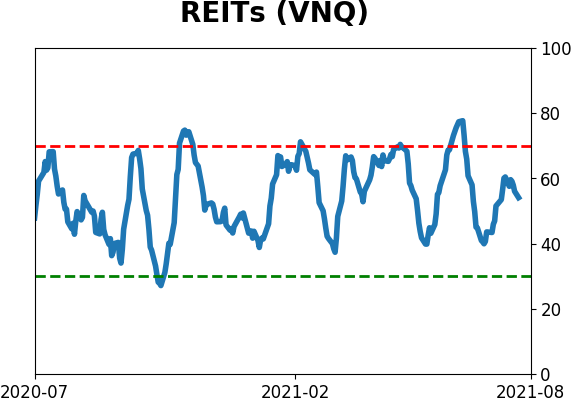
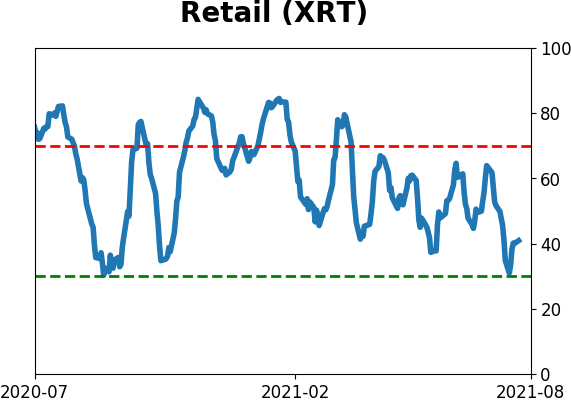
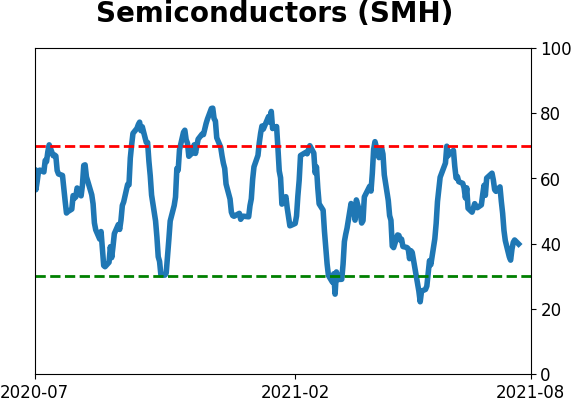
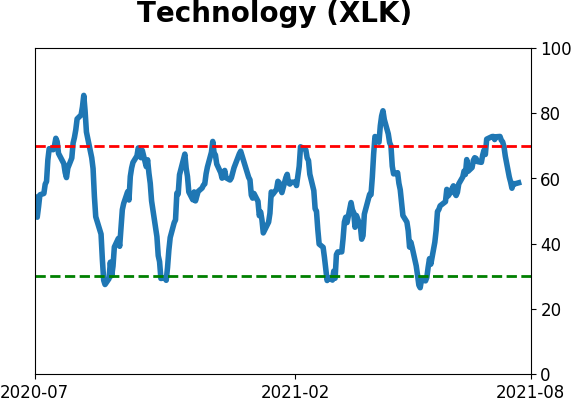
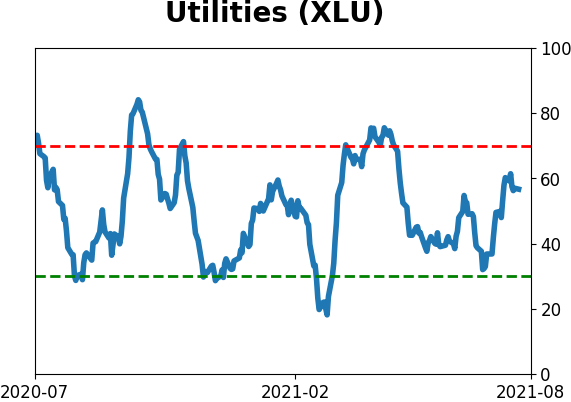
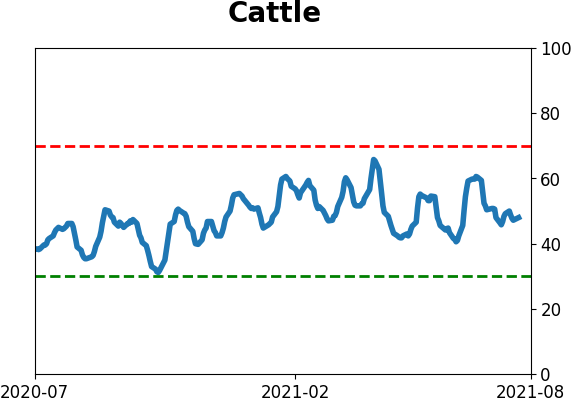
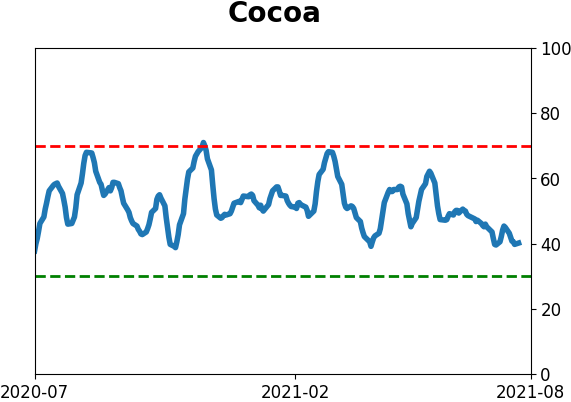
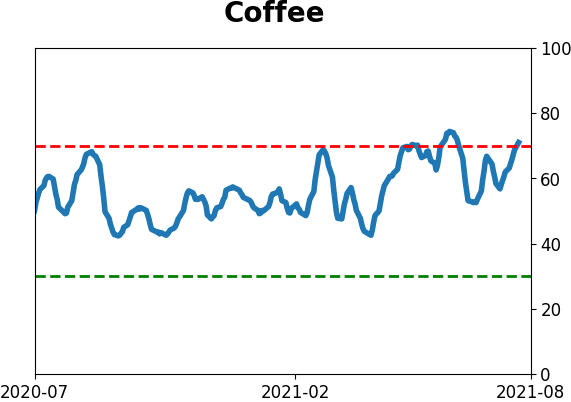
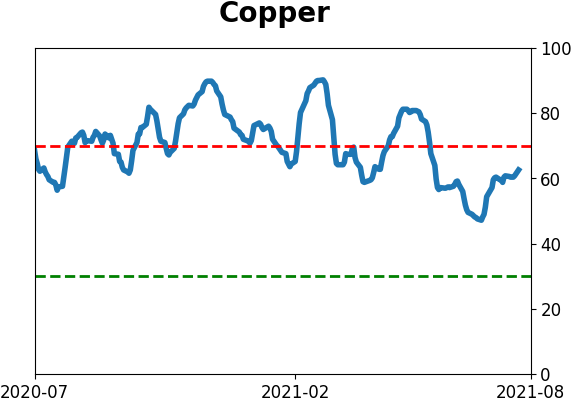
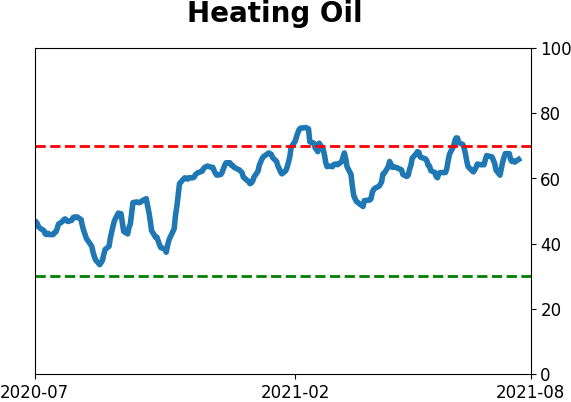
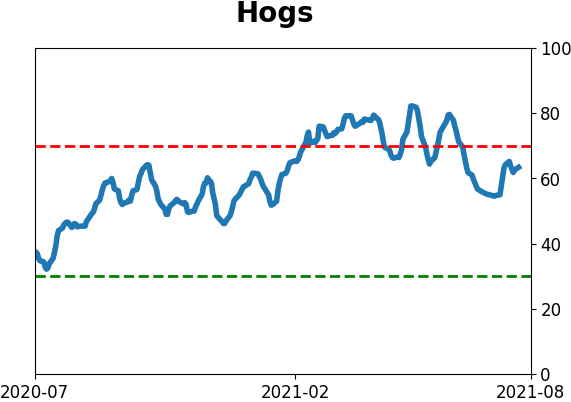
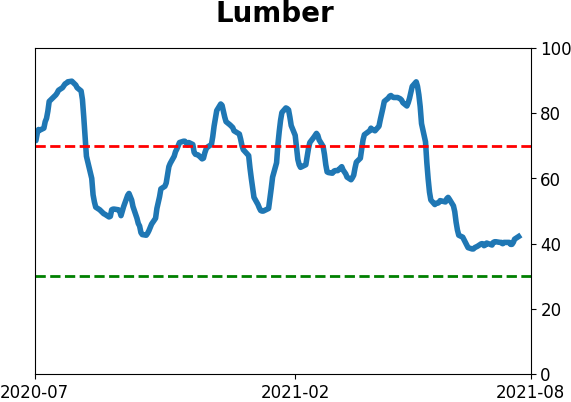
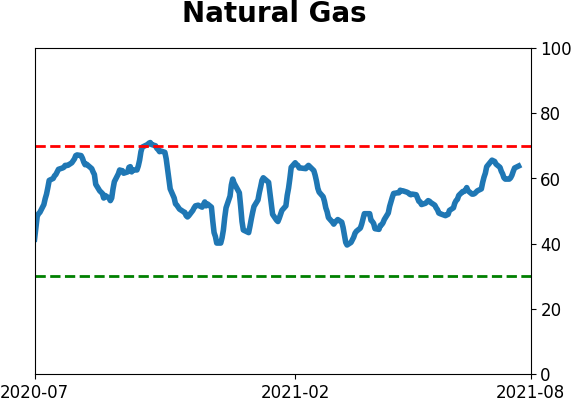
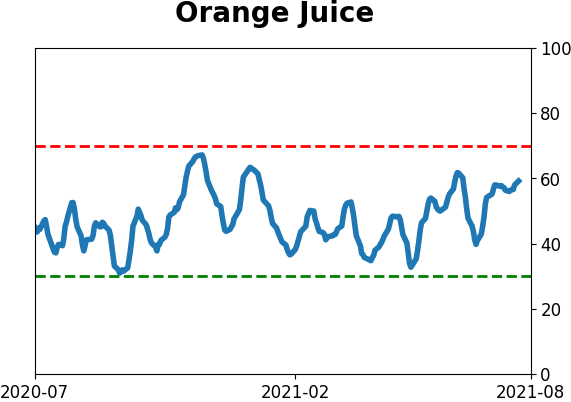
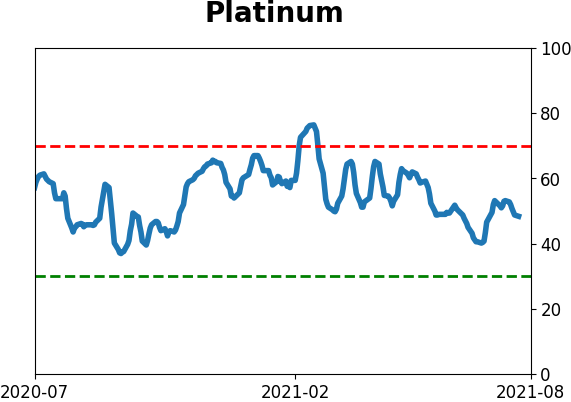
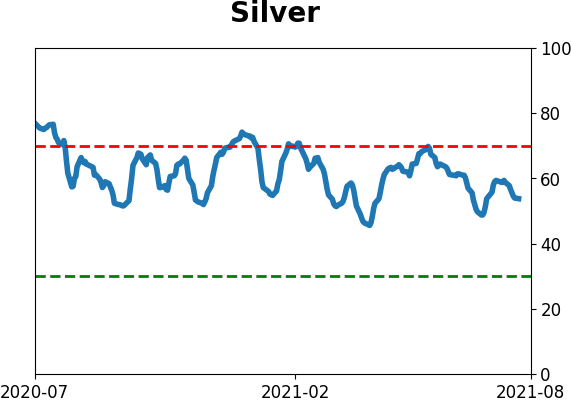
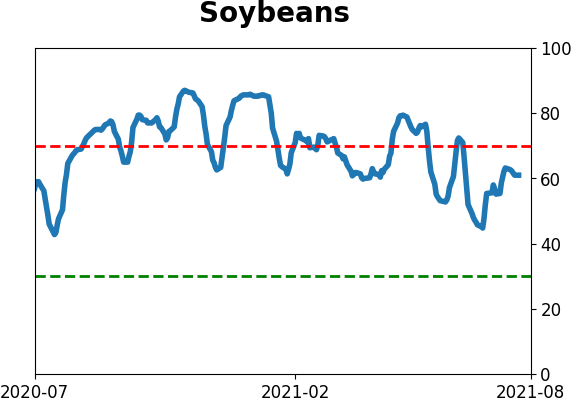
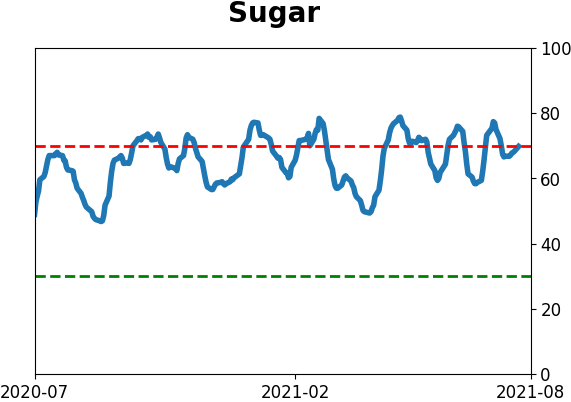
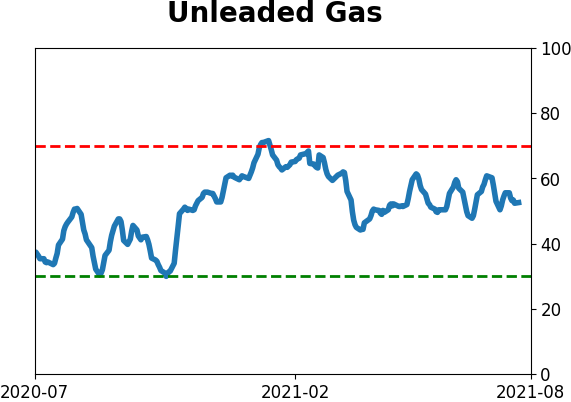
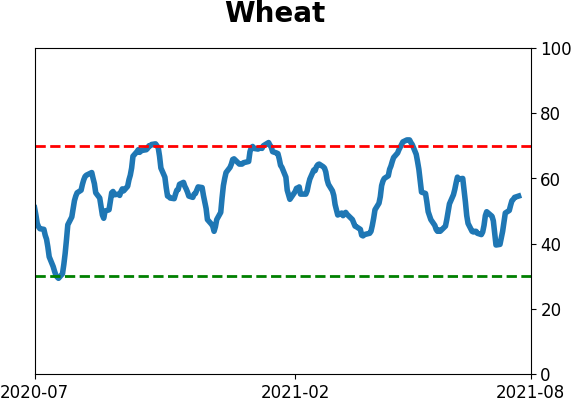
Optimism Index Thumbnails
|
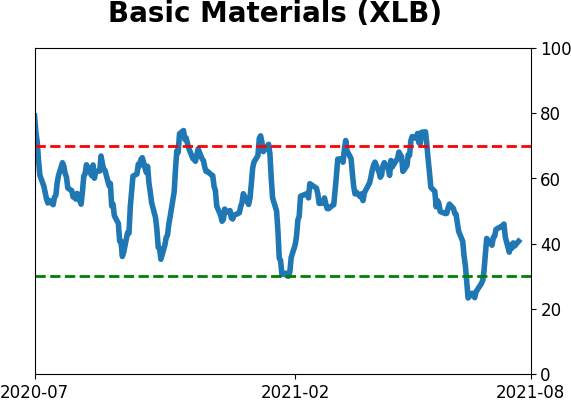
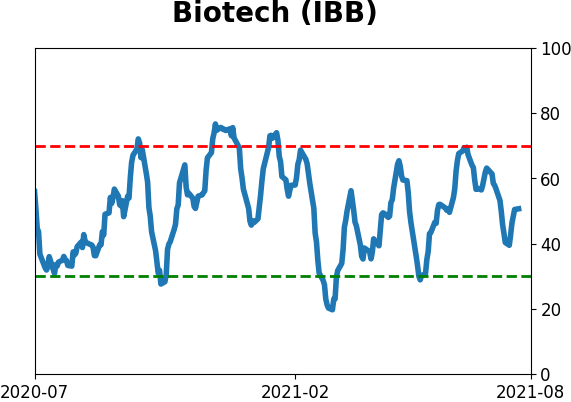
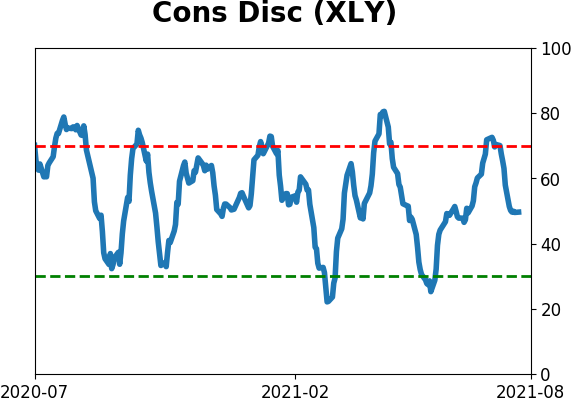
Sector ETF's - 10-Day Moving Average
|
|
|
Country ETF's - 10-Day Moving Average
|
|
|
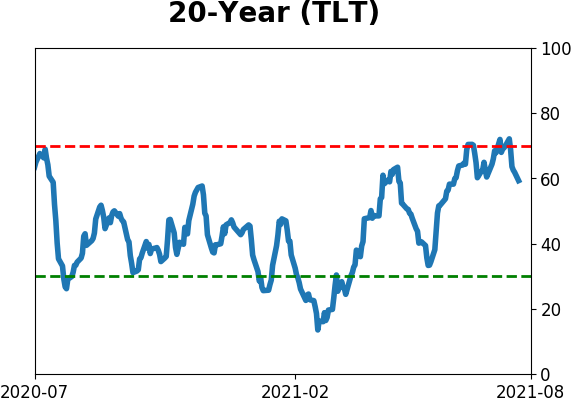
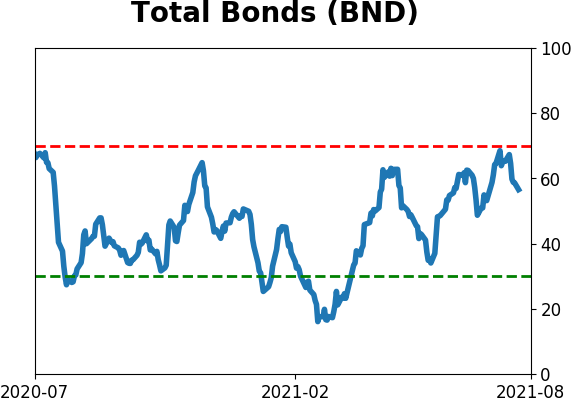
Bond ETF's - 10-Day Moving Average
|
|
|
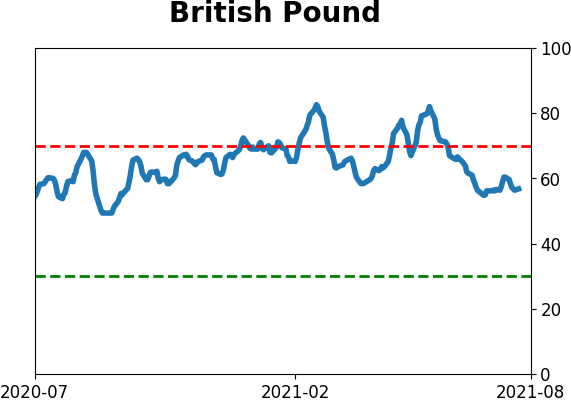
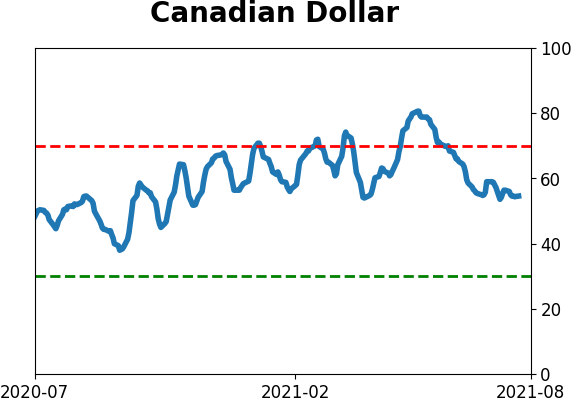
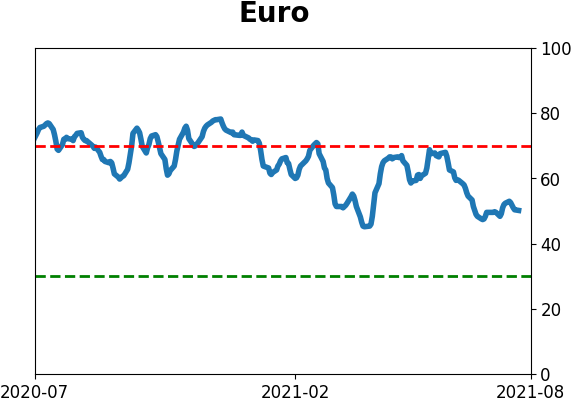
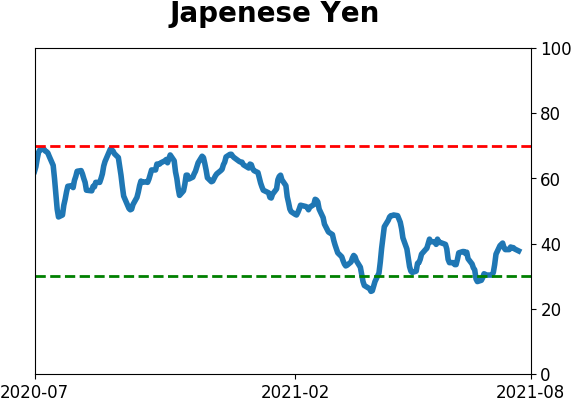
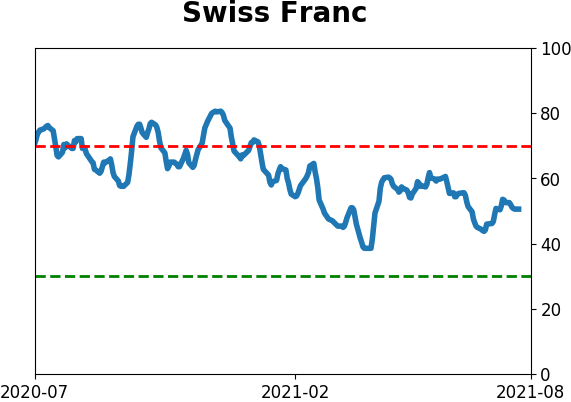
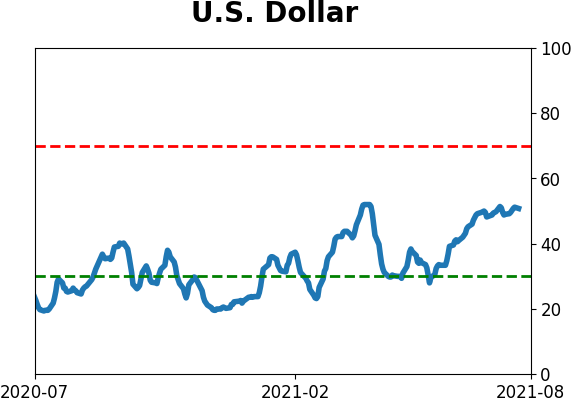
Currency ETF's - 5-Day Moving Average
|
|
|
Commodity ETF's - 5-Day Moving Average
|
|