Headlines
|
|
A trend change signal with a perfect record:
For only the 11th time since 1928, the S&P 500 reversed from above its 50-day moving average to below it in six sessions and with the index only six days removed from a high. Comparable trend reversals preceded a 100% win rate for the S&P 500 over six months.
|
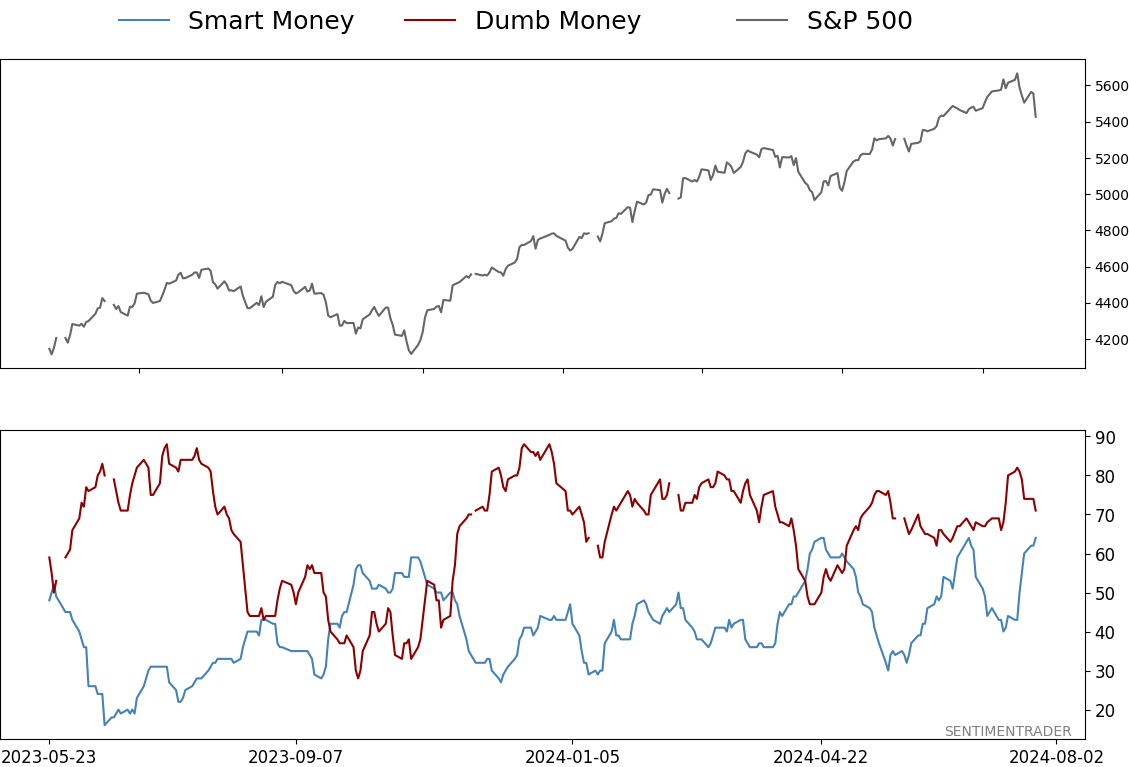
Smart / Dumb Money Confidence
|
Smart Money Confidence: 64%
Dumb Money Confidence: 71%
|
|
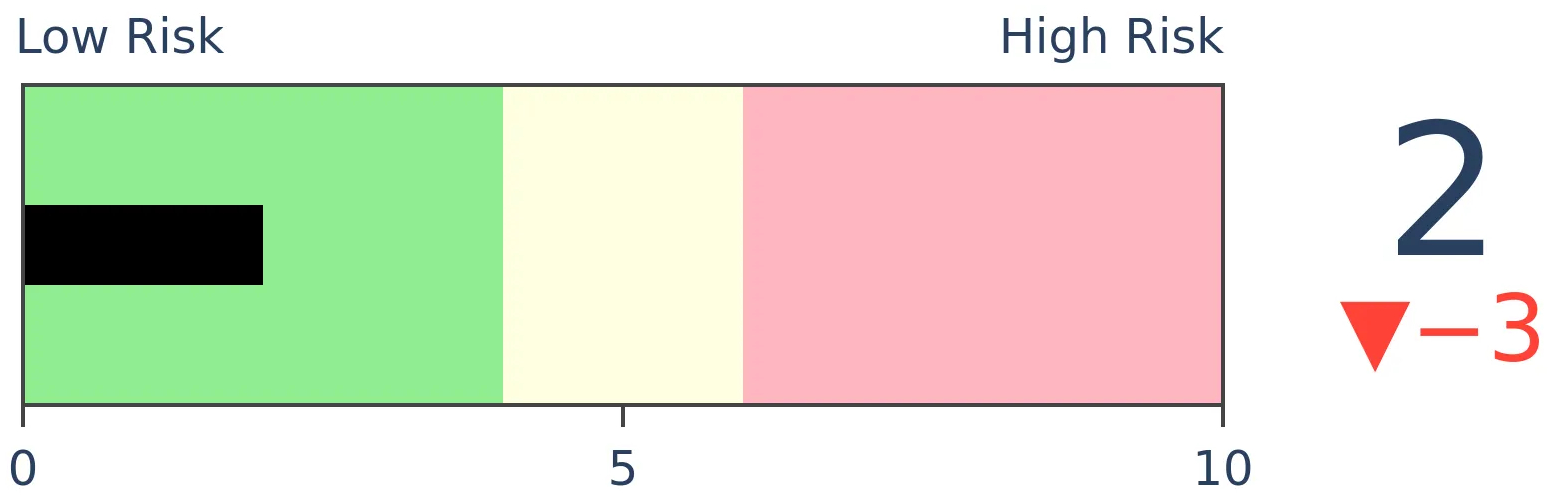
Risk Levels
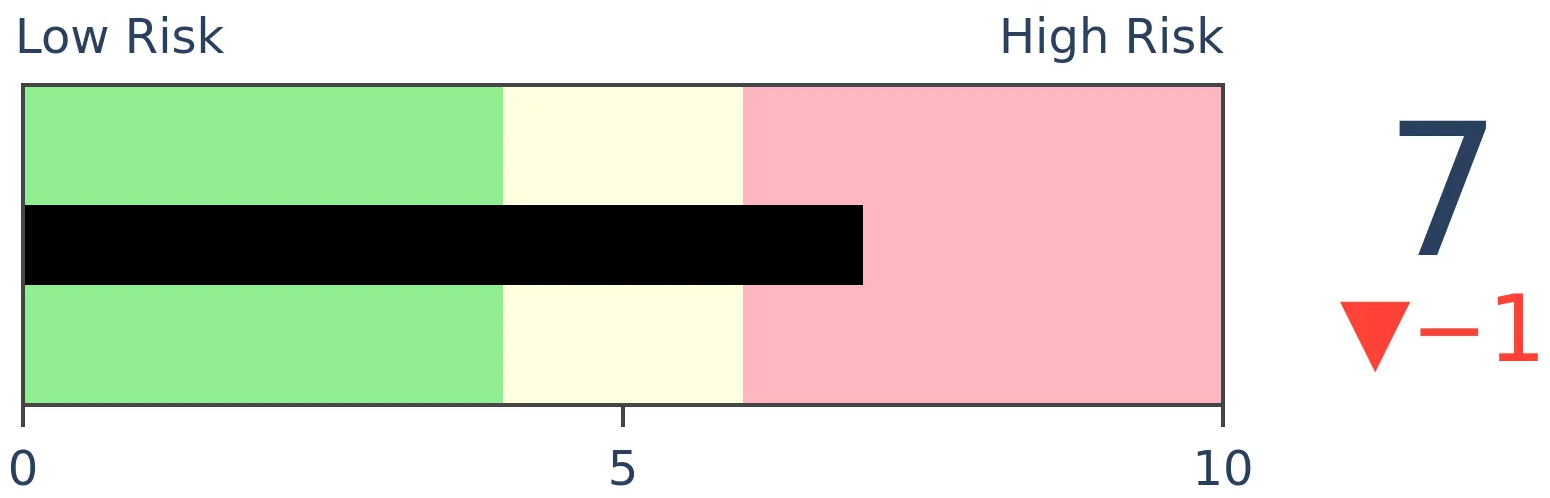
Stocks Short-Term
|
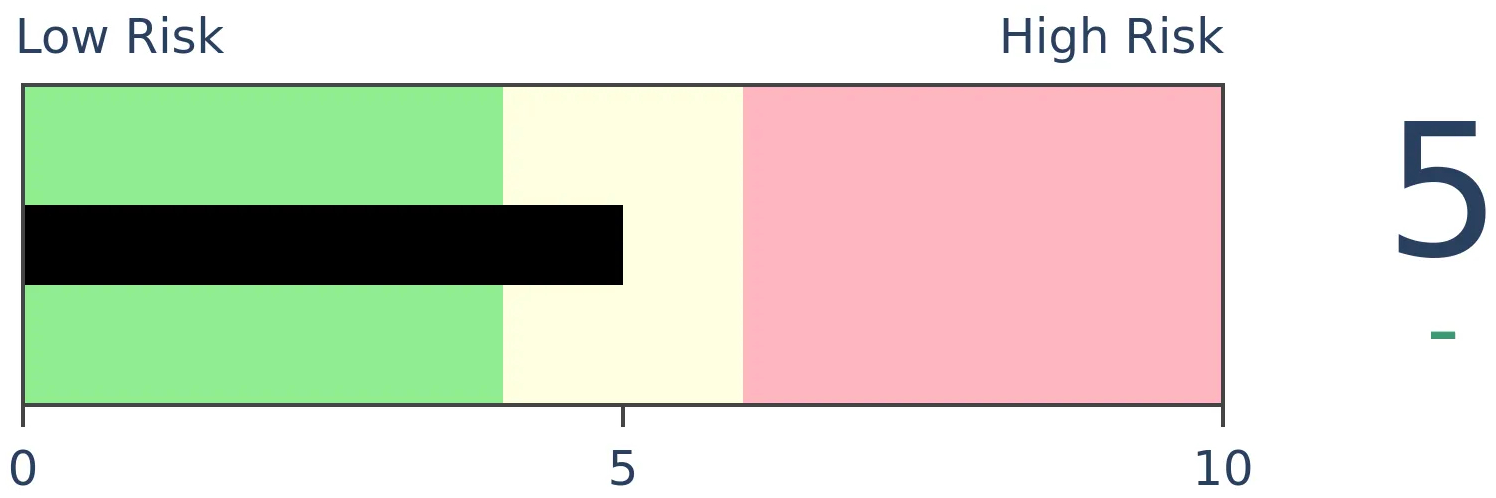
Stocks Medium-Term
|
|
Bonds
|
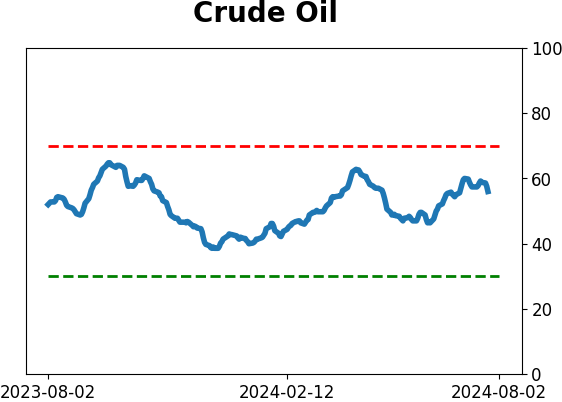
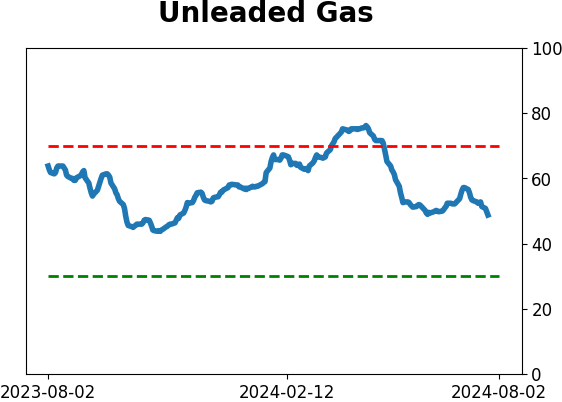
Crude Oil

|
|
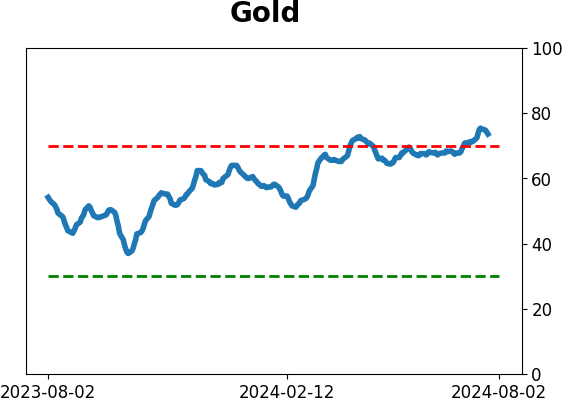
Gold
|
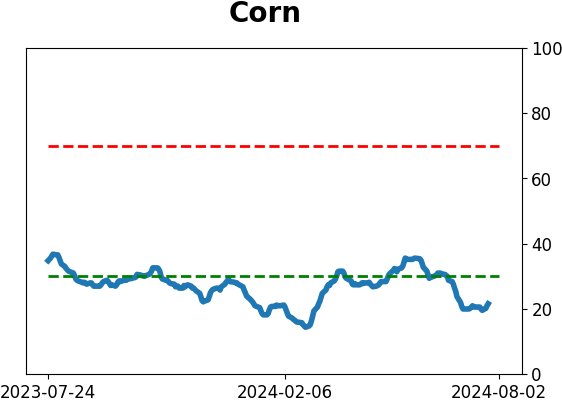
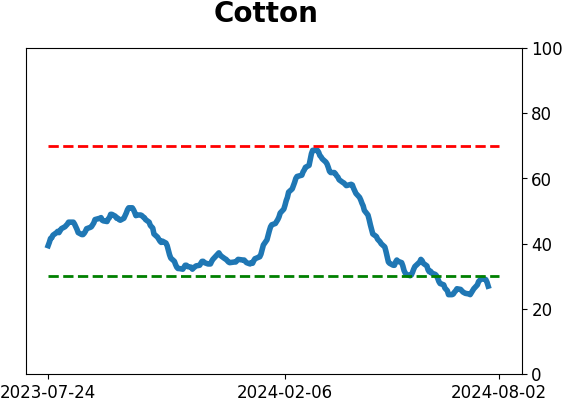
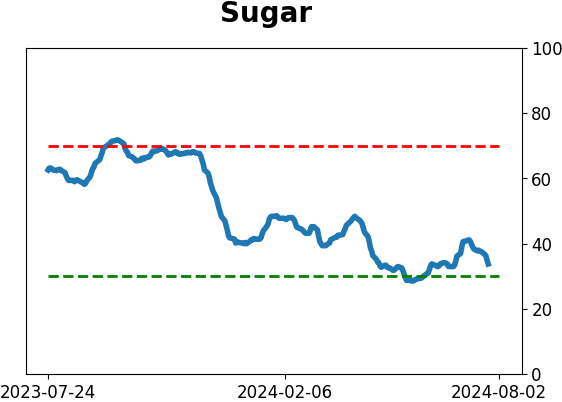
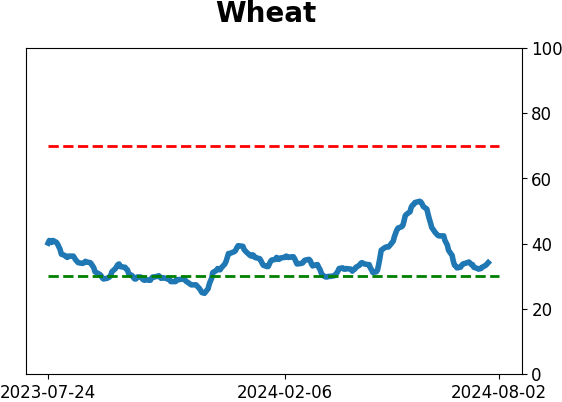
Agriculture

|
|
Research
By Dean Christians
BOTTOM LINE
For only the 11th time since 1928, the S&P 500 reversed from above its 50-day moving average to below it in six sessions and with the index only six days removed from a high. Comparable trend reversals preceded a 100% win rate for the S&P 500 over six months.
FORECAST / TIMEFRAME
SPY -- Up, Long-Term
|
Key points:
- The S&P 500 cycled from 5% above its 50-day average to below the average in only six sessions
- Similar reversals displayed excellent returns and consistency for the S&P 500 over the ensuing six months
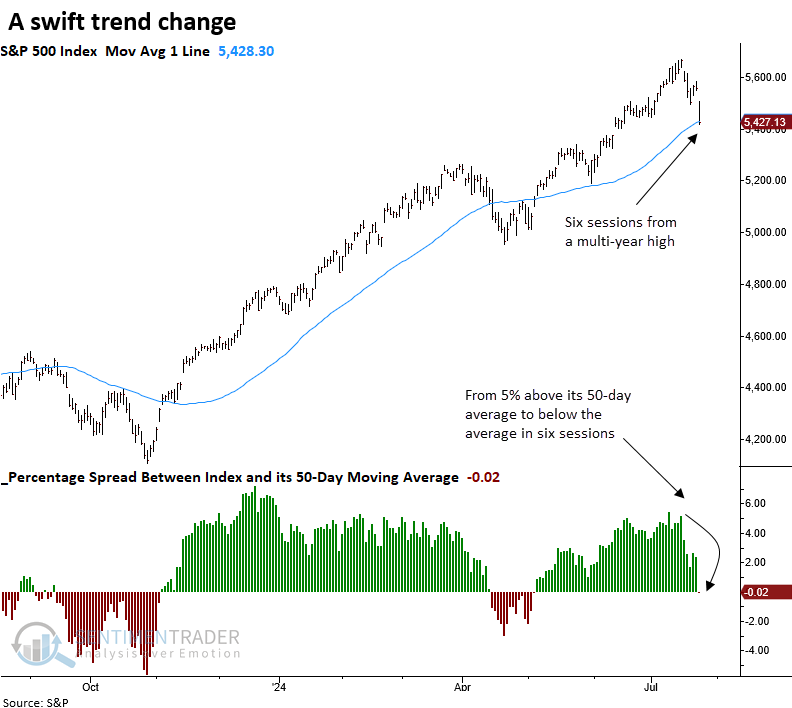
A swift medium-term trend change within the context of a long-term uptrend
Scholars of market history who have studied various peaks will tell you that tops are typically a process. In most cases, price momentum stalls, leading to sideways price action before a break lower. Occasionally, this consolidation phase does not play out, and a market forms what is known as a V-shaped top.
V-tops tend to be sharp and swift, a phenomenon similar to the recent price action in the S&P 500.
Over the last six sessions, the world's most benchmarked index cycled from 5% above its 50-day moving average to below it, with the index only six days removed from a multi-year high, creating a V-shaped top.
The previous instance occurred in February 2018, with the S&P 500 falling 10% from peak to trough.
Similar swift trend changes preceded positive returns
While the sample size is small, whenever the S&P 500 cycled from 5% above its 50-day moving average to below it in six sessions or fewer, with the index only six days from a multi-year high, the world's most benchmarked index displayed outstanding returns and consistency.
Over the following six months, the S&P 500 never experienced a loss, indicating that V-shaped reversals during a long-term uptrend rarely coincide with major peaks. Instead, they often signal a brief panic among investors concerned about forfeiting significant gains.
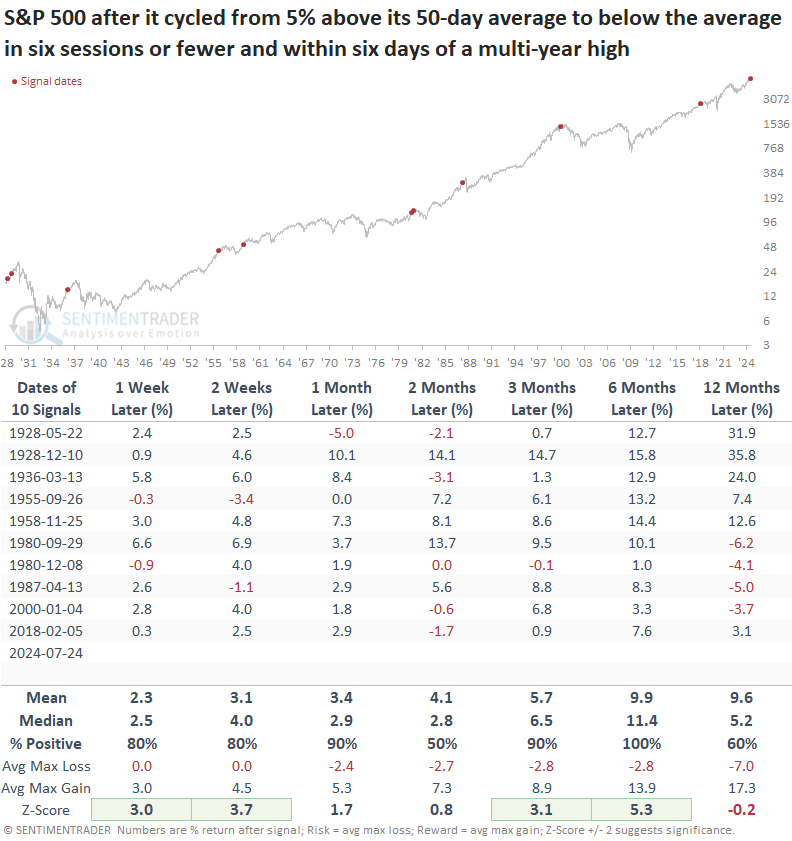
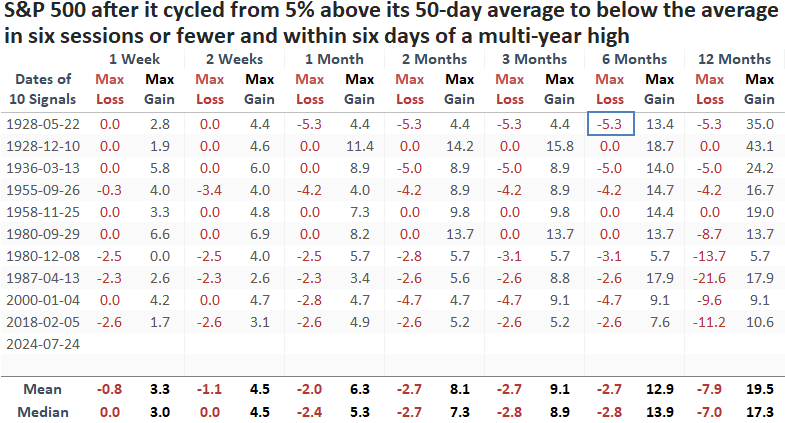
Over the subsequent six months, the maximum gain surpassed the maximum loss in nine out of ten precedents. Furthermore, that one instance, recorded in 1928, was only -5.3%.
Some potential outcomes
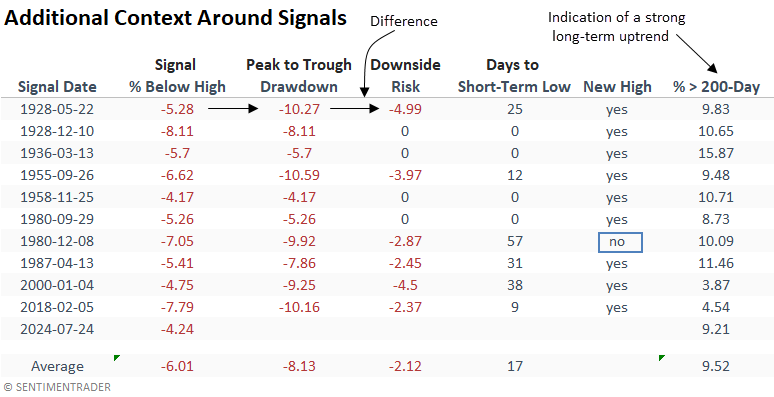
Following similar trend reversals, several scenarios could unfold, including the potential for a 10% correction, as seen in 1928, 1955, and 2018, or an immediate low, as occurred in 1928, 1936, 1958, and 1980.
In all but one case, in December 1980, the S&P 500 closed at a new high, and except for 2018, it typically achieved the high within a few months.
What the research tells us...
The S&P 500 is currently experiencing a correction characterized by a swift reversal from above its 50-day average to below in only a handful of trading sessions. This downturn has resulted in a V-shaped top, a pattern typically found during strong uptrends when investors rush to lock in profits. Following similar precedents, the S&P 500 was higher over the subsequent six months every time. However, investors should not rule out additional downside or even sideways chop in the near term before the uptrend resumes.
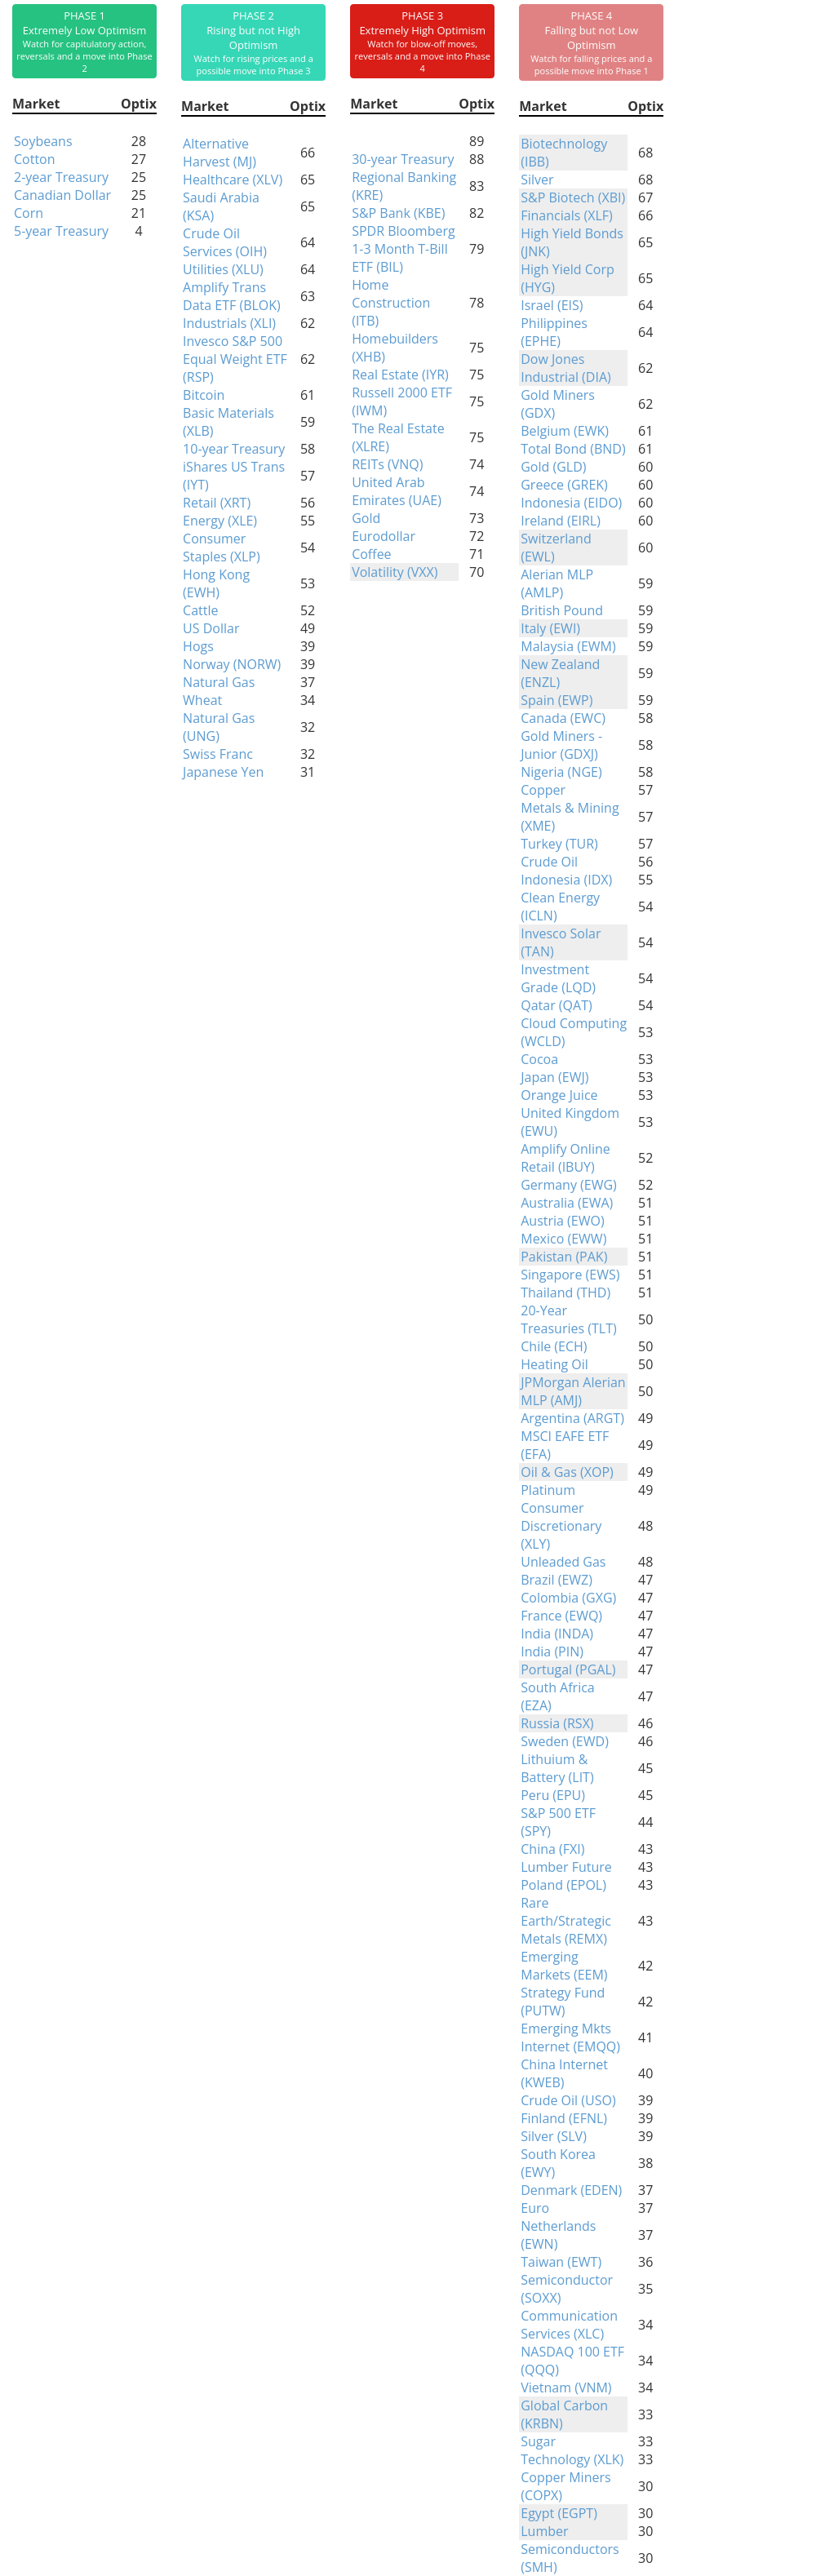
Indicators at Extremes
Phase Table
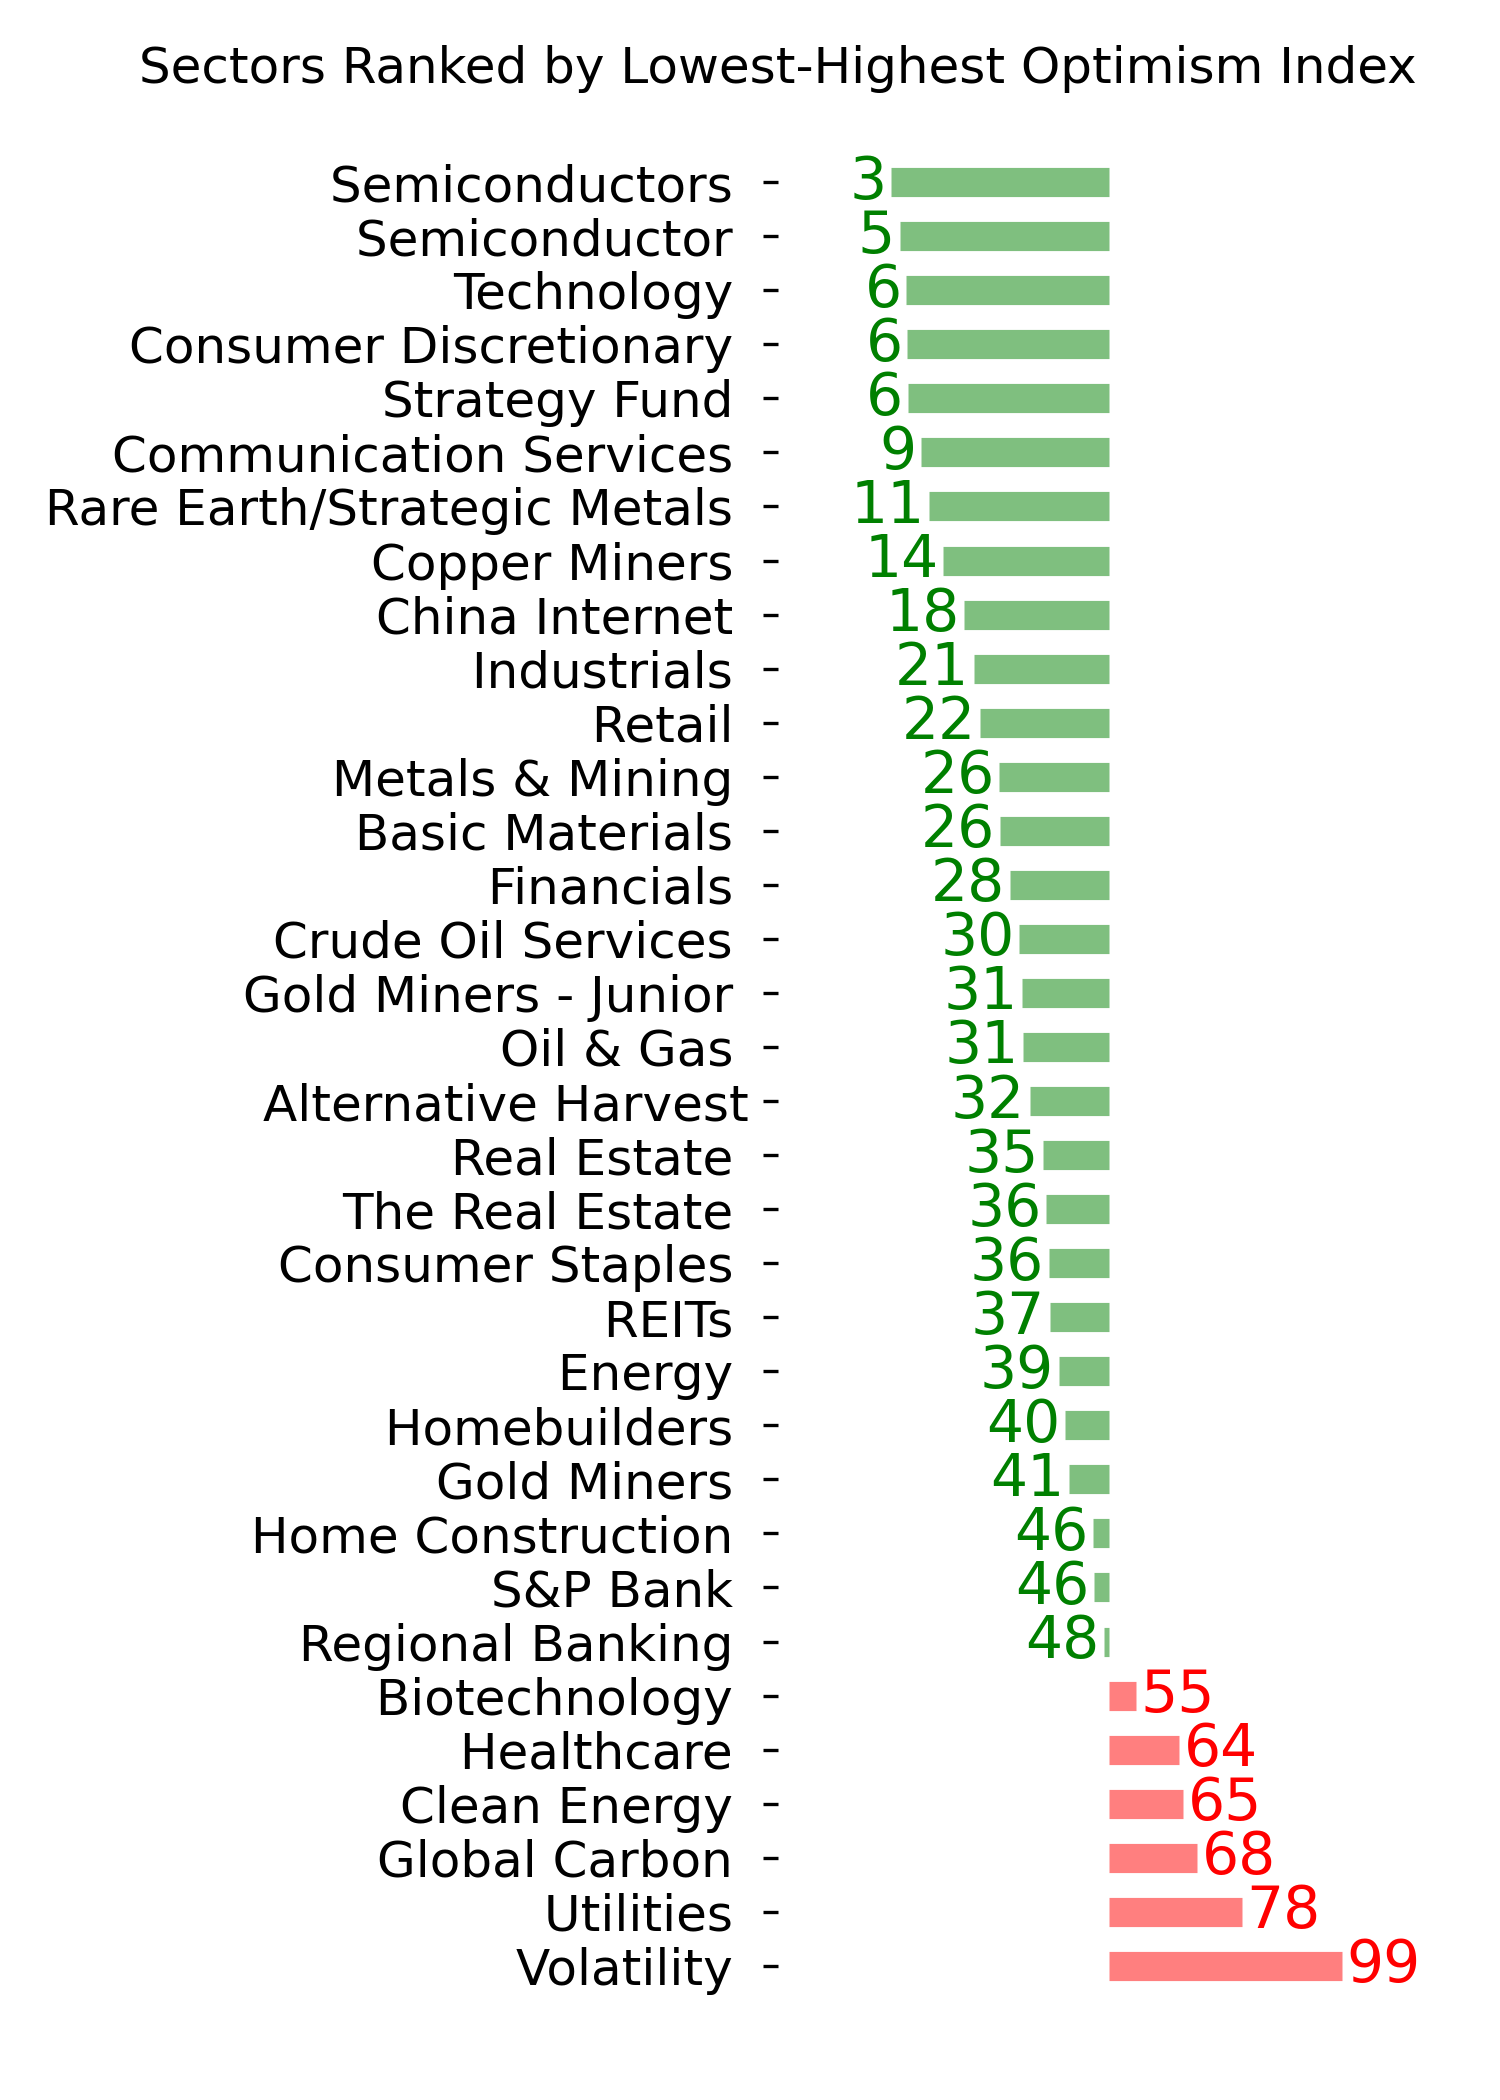
Ranks
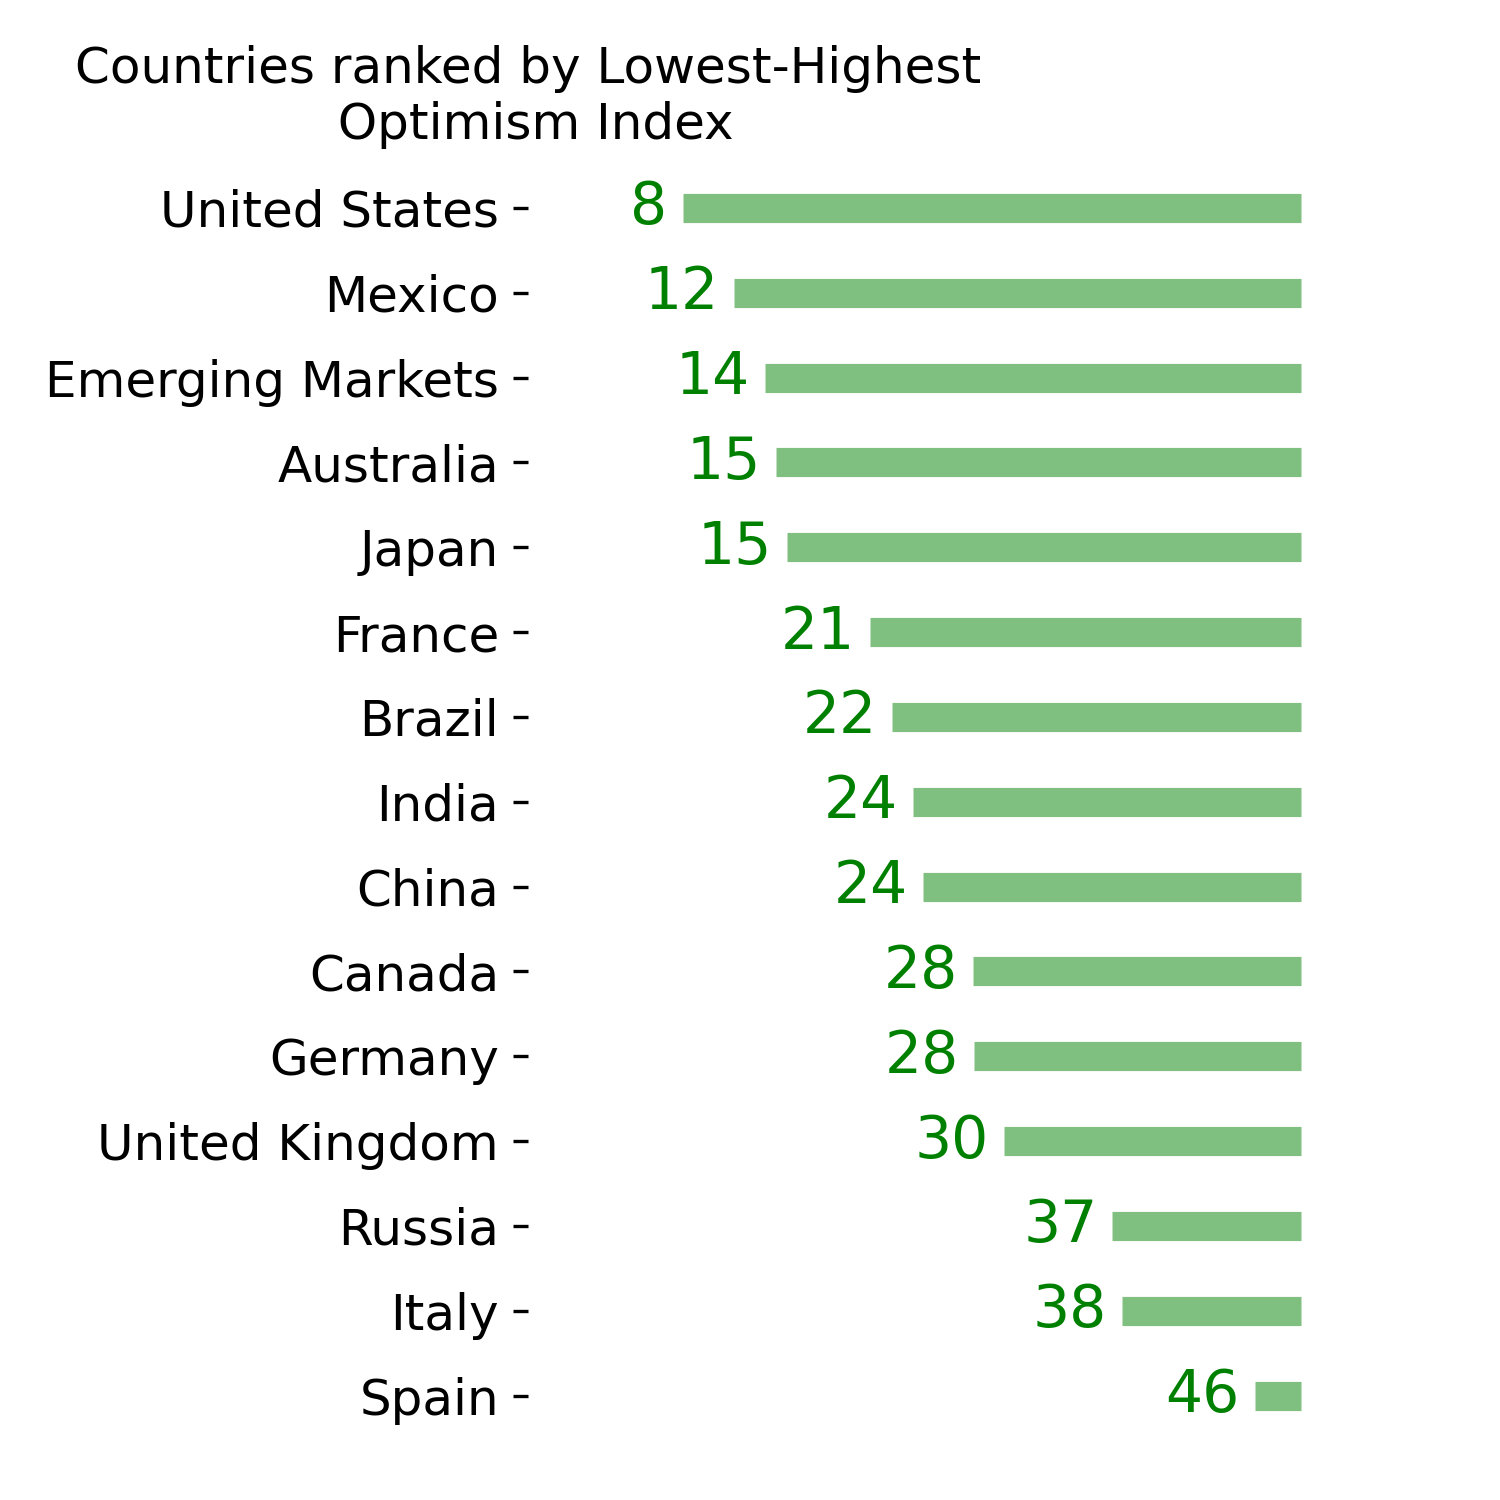
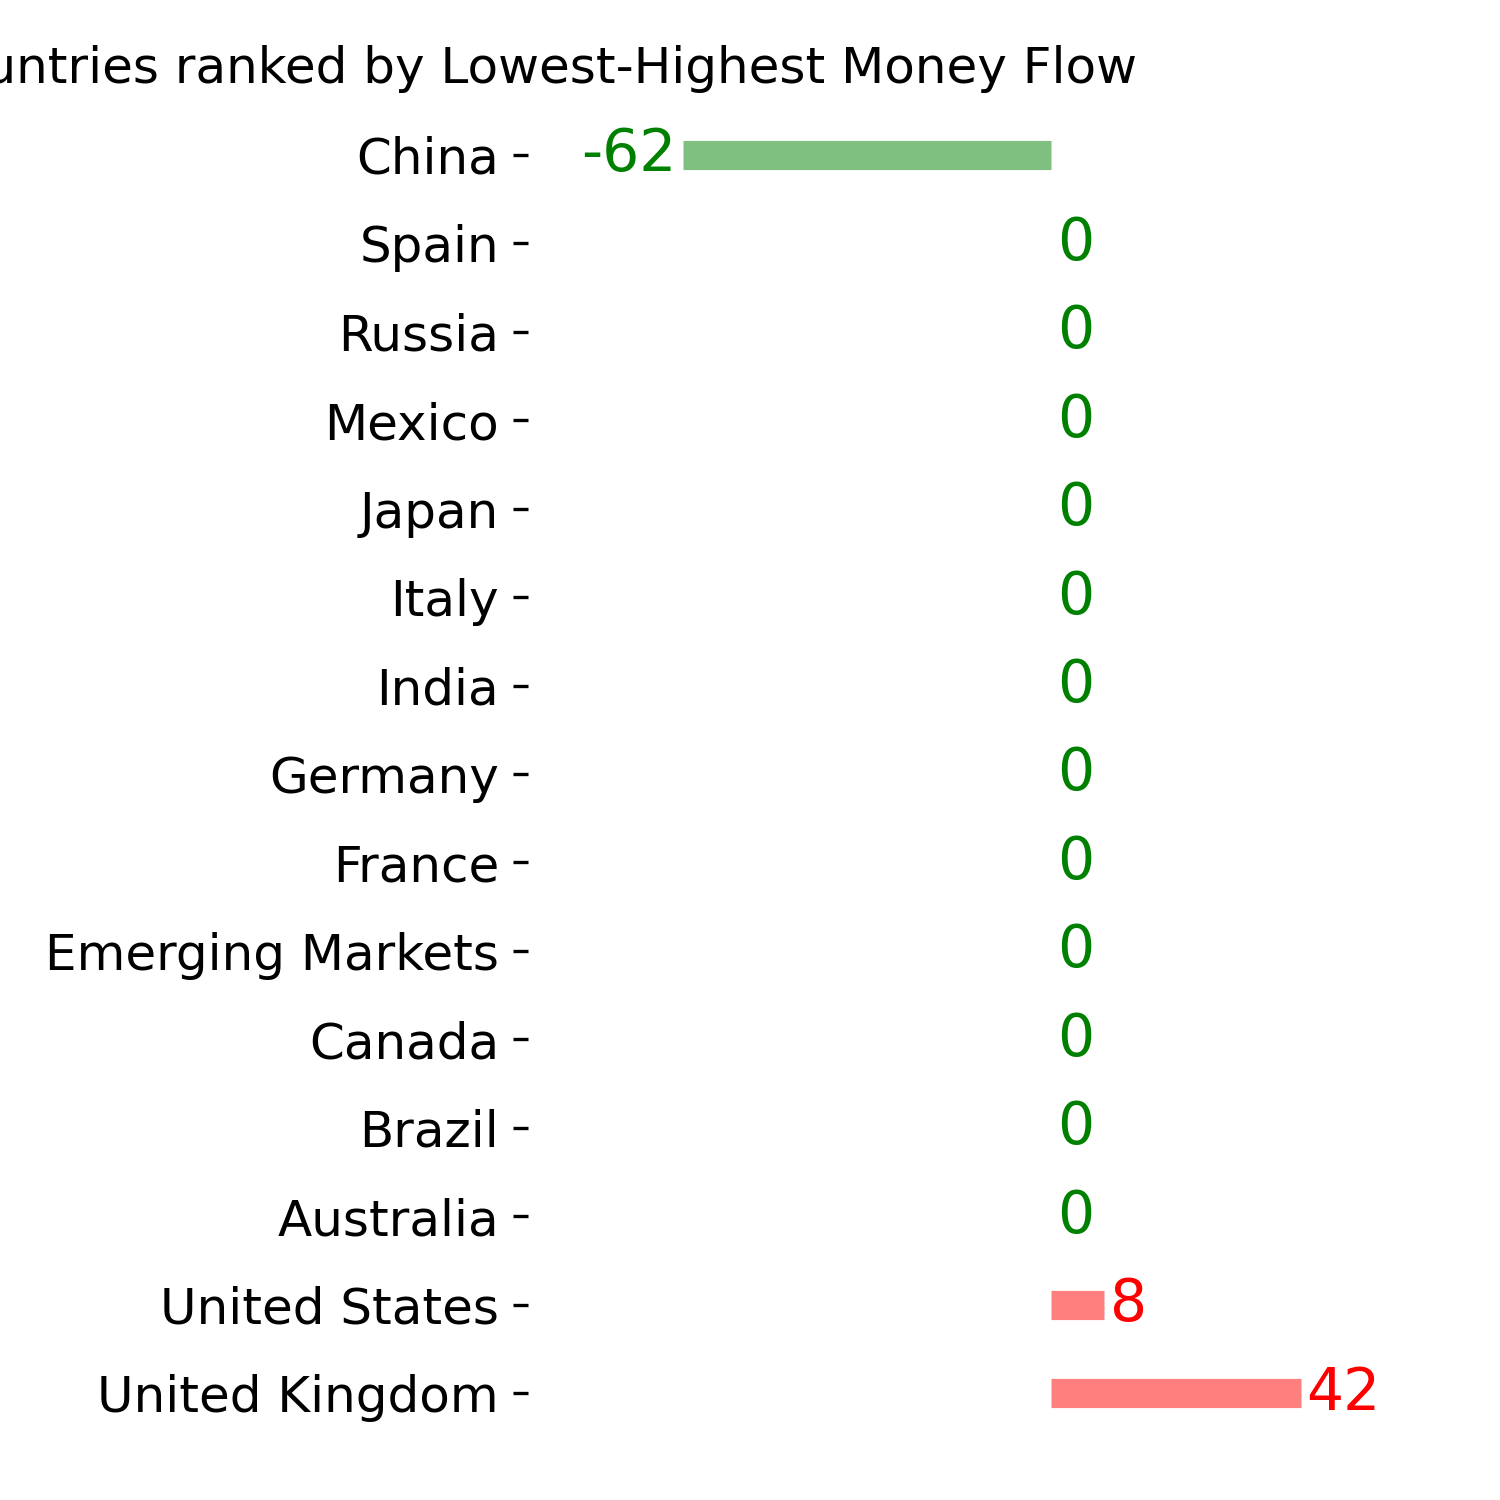
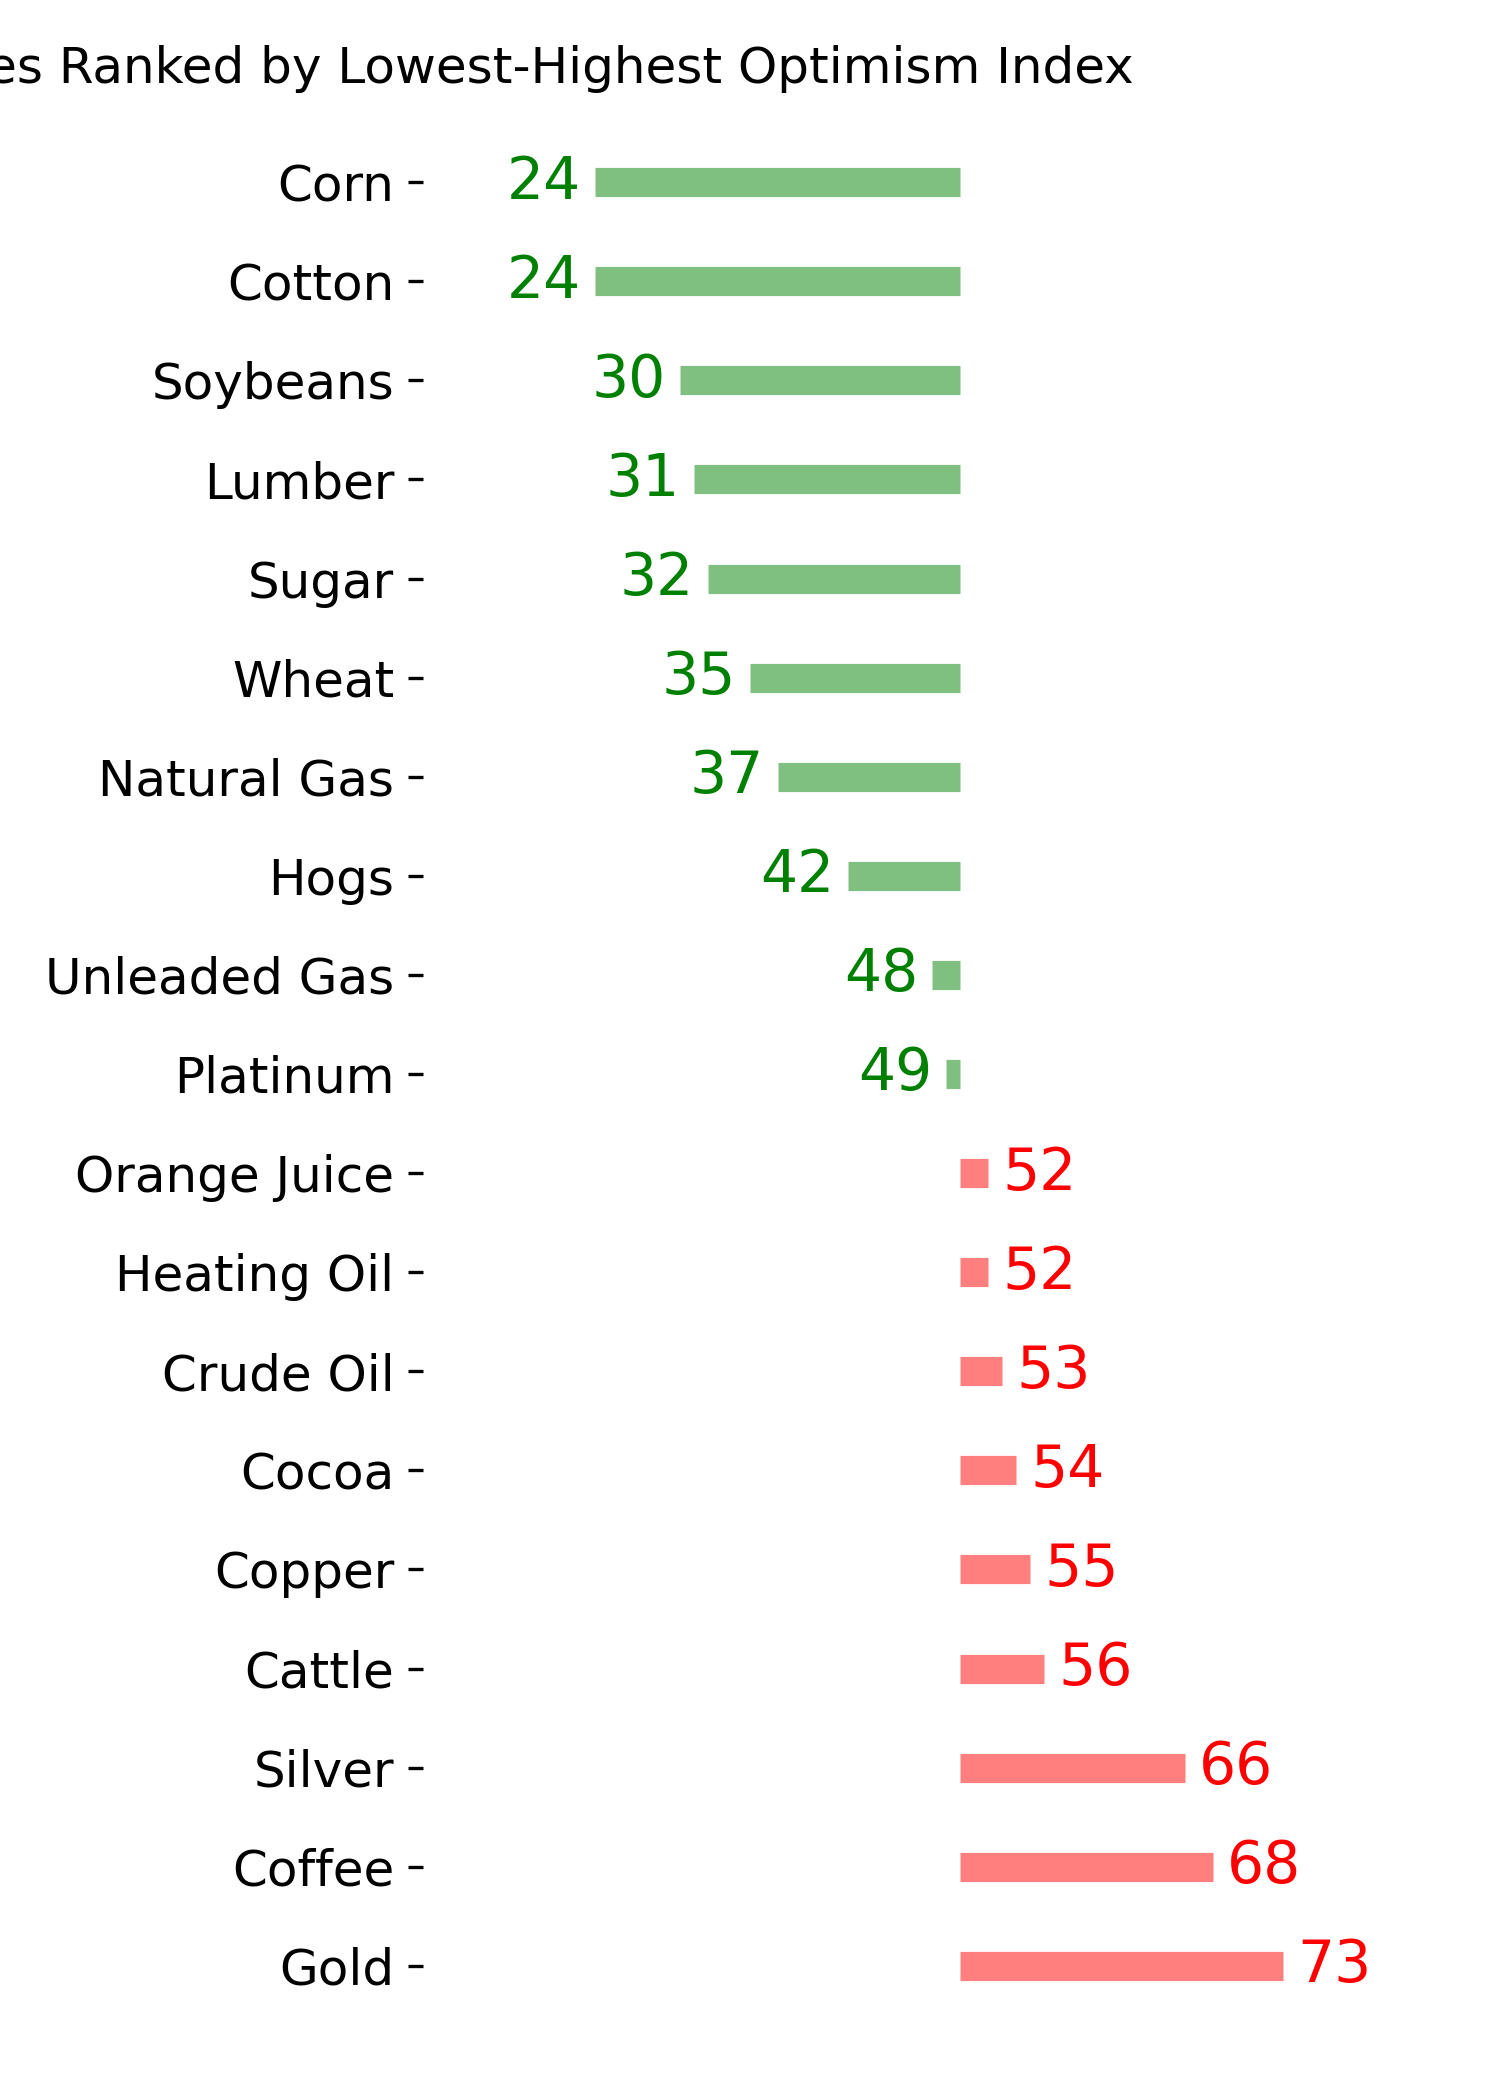
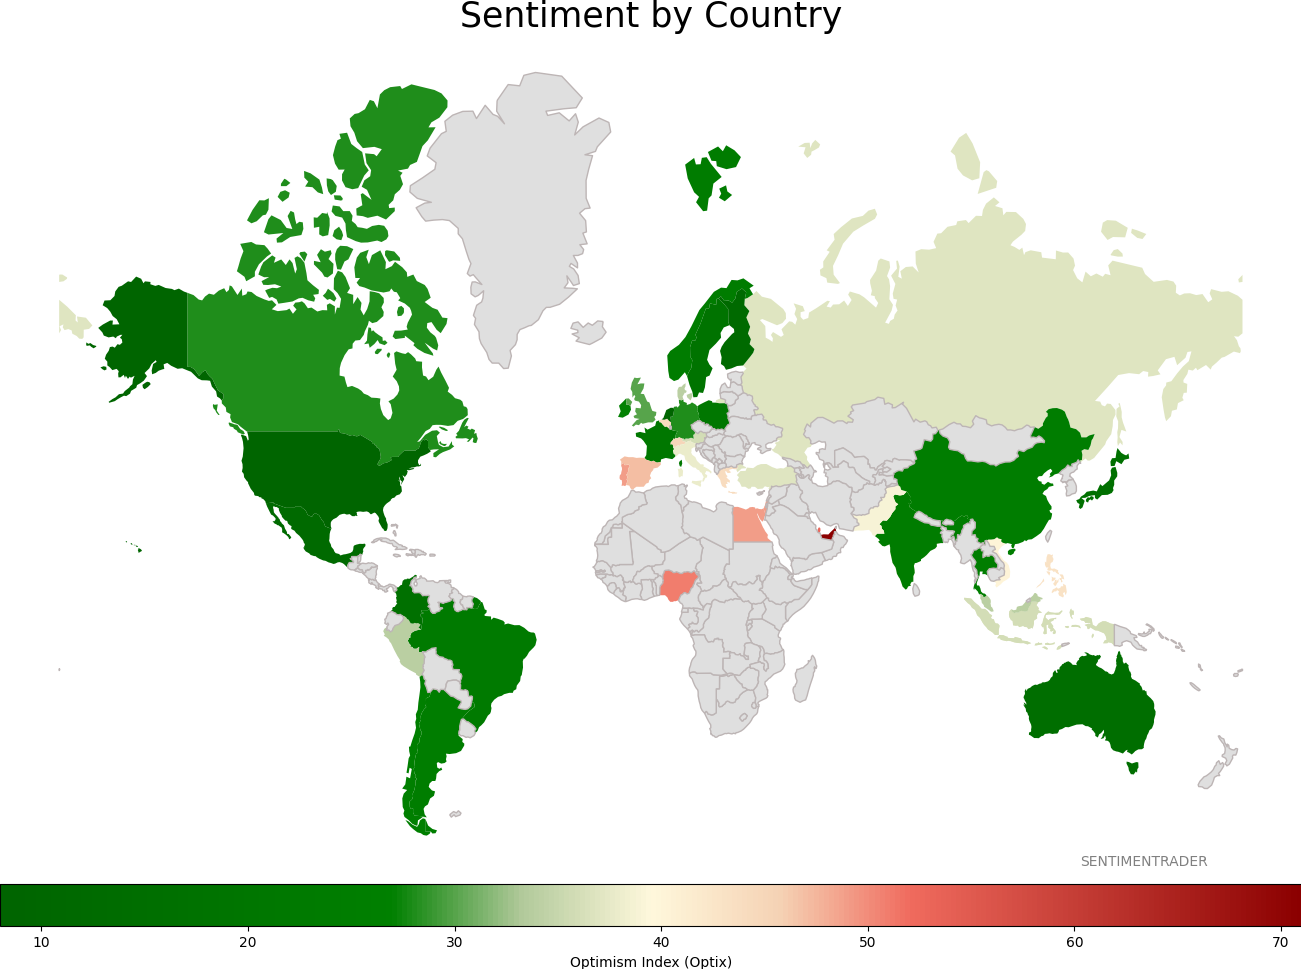
Sentiment Around The World
Optimism Index Thumbnails
|
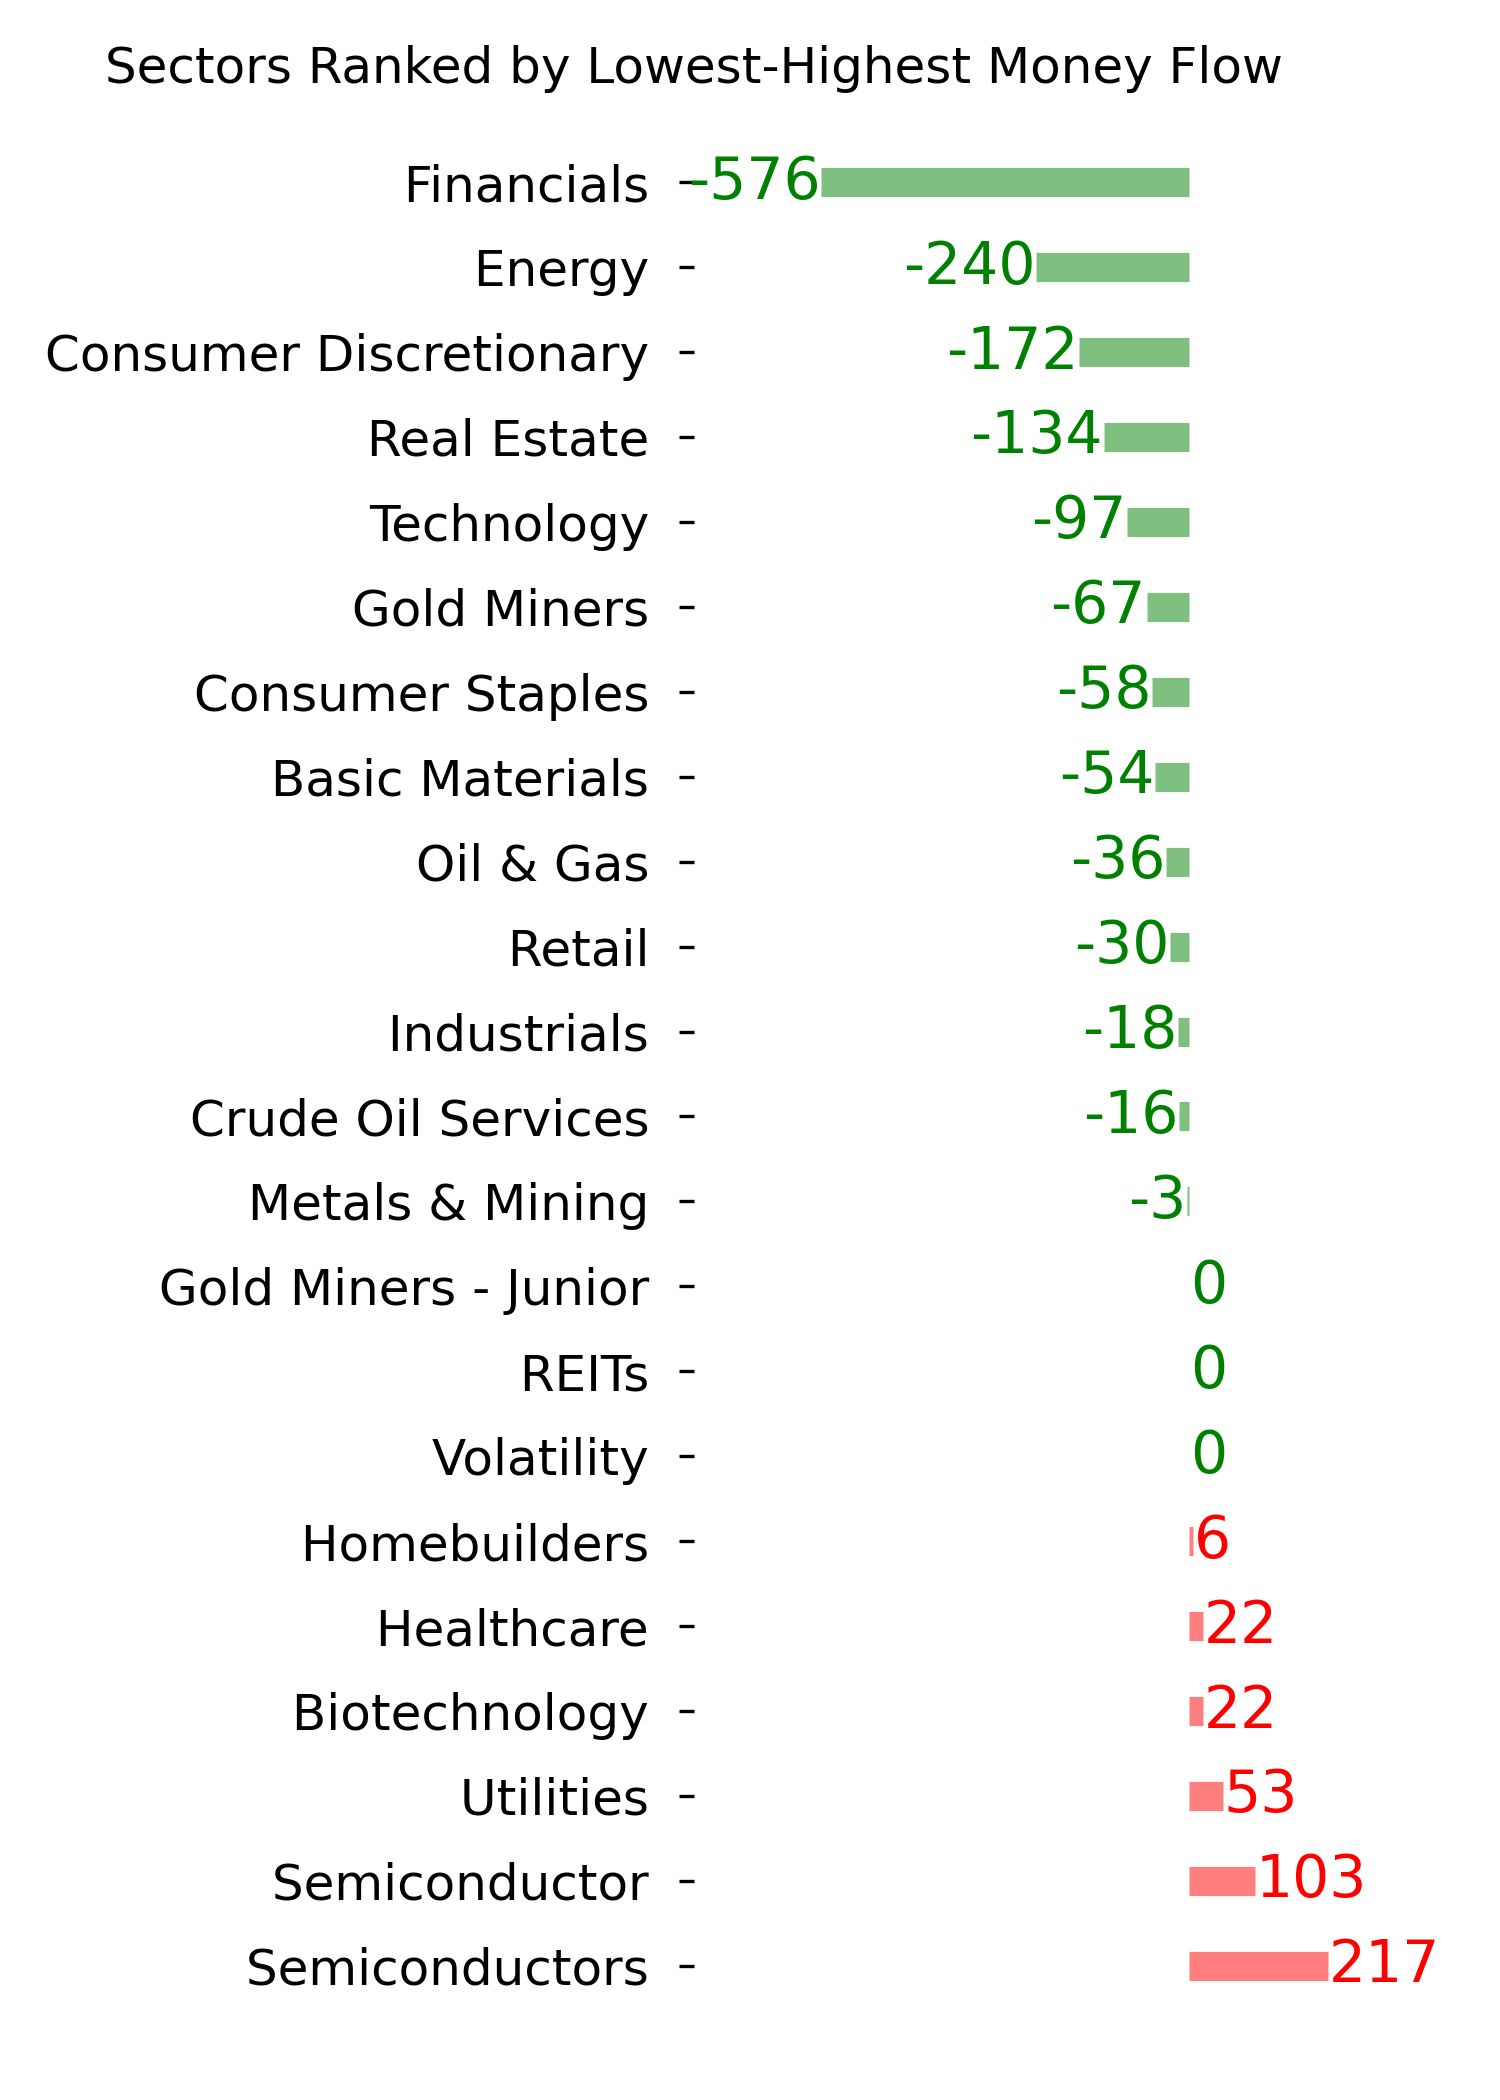
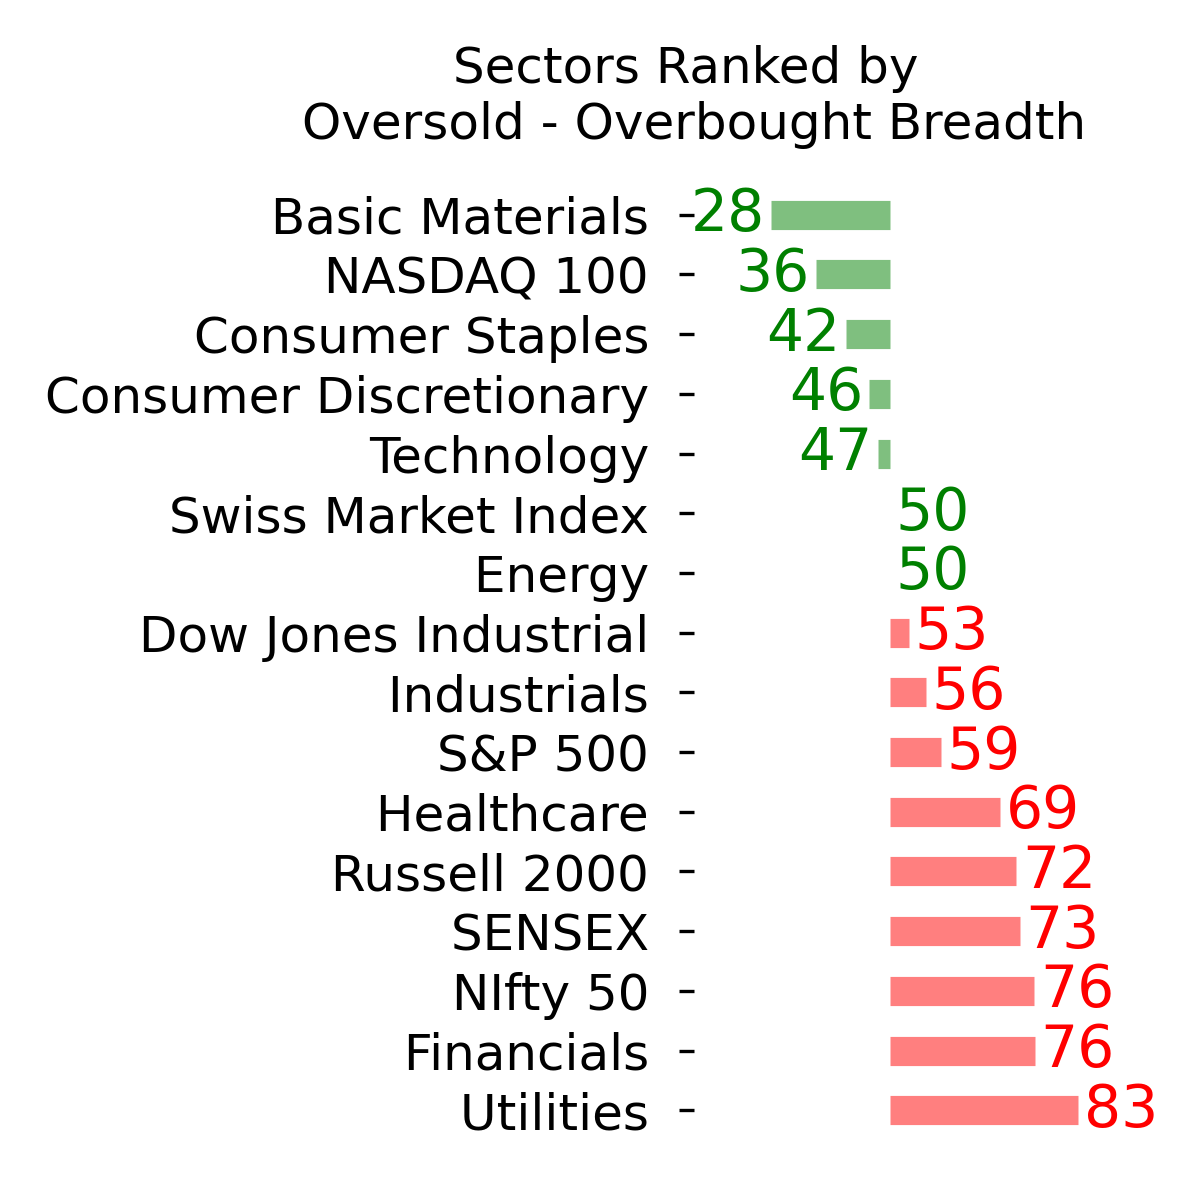
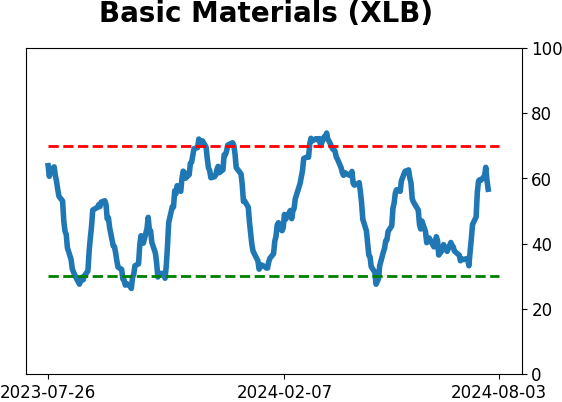
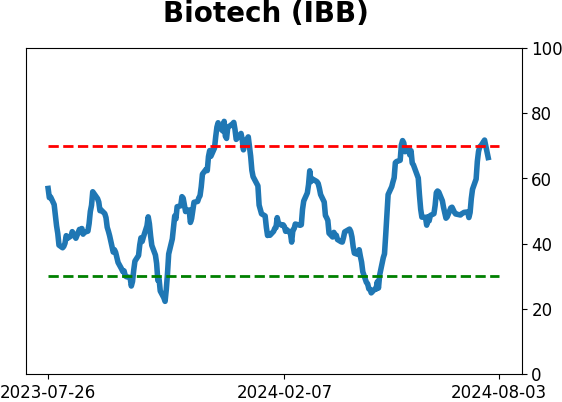
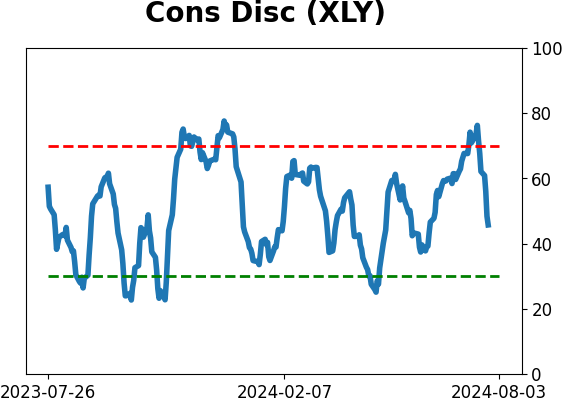
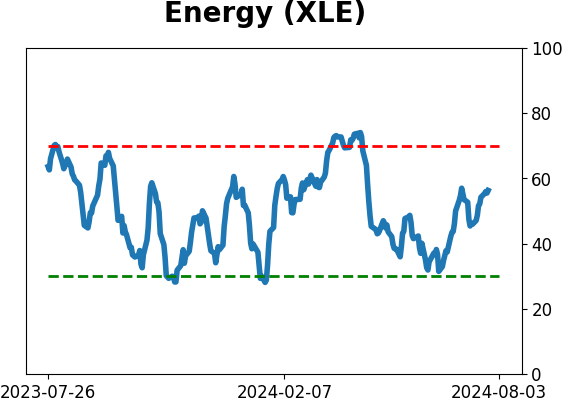
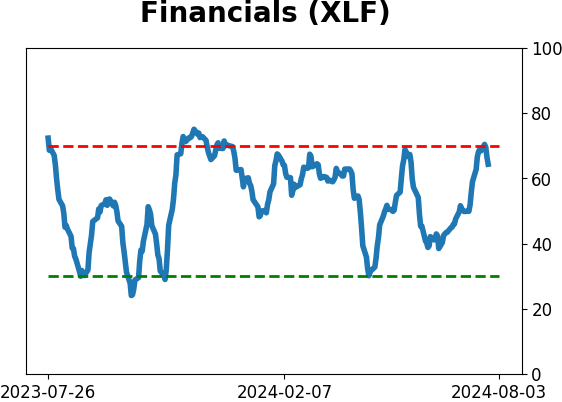
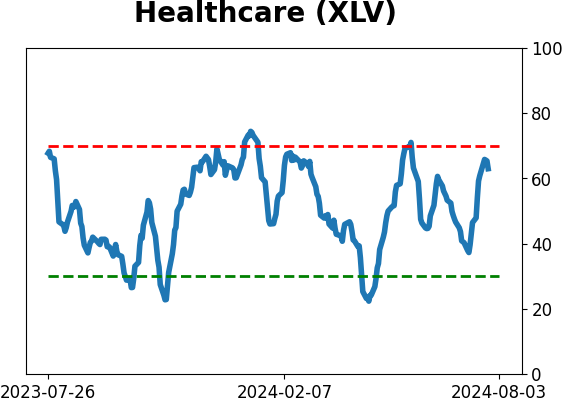
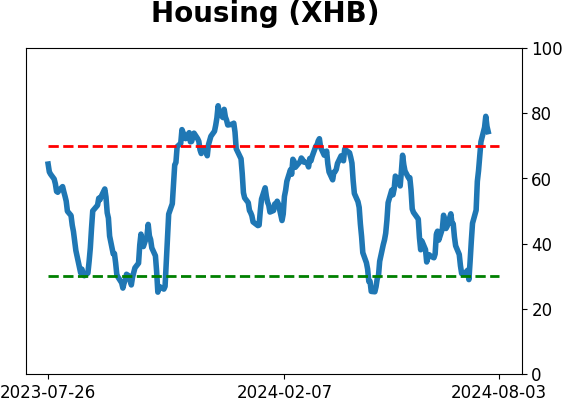
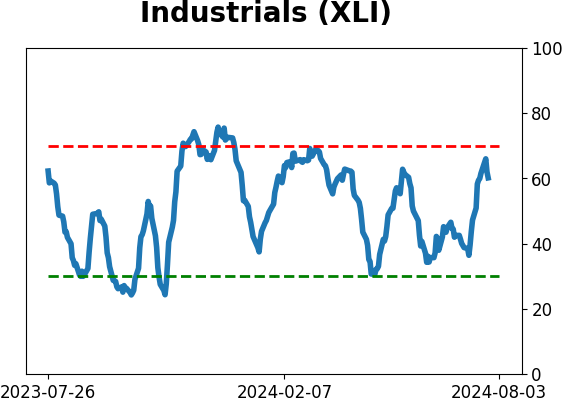
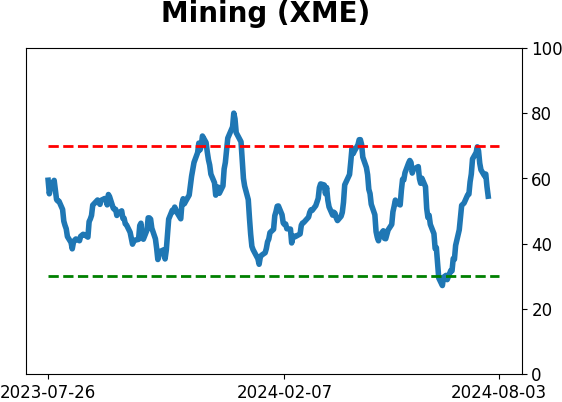
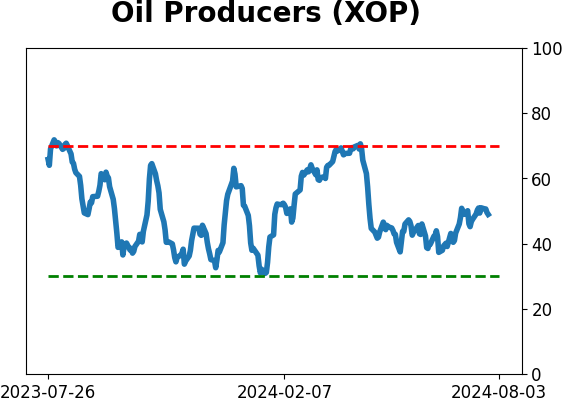
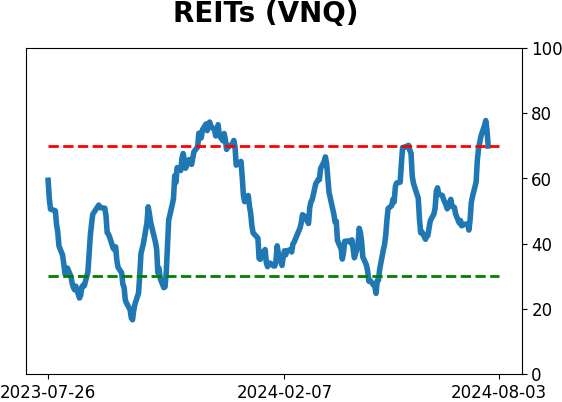
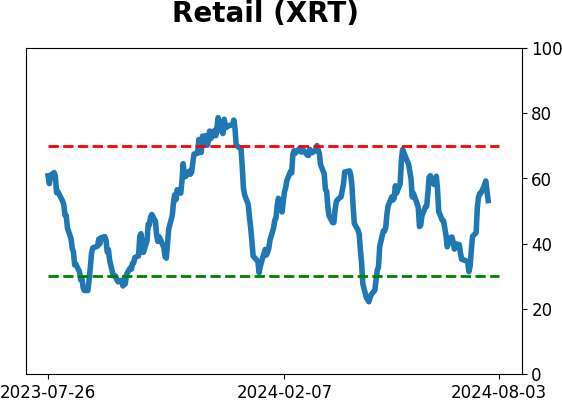
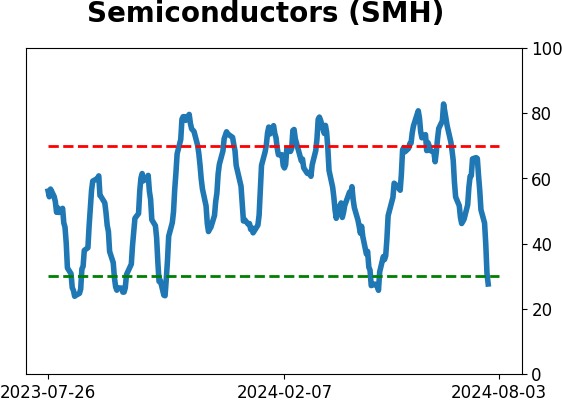
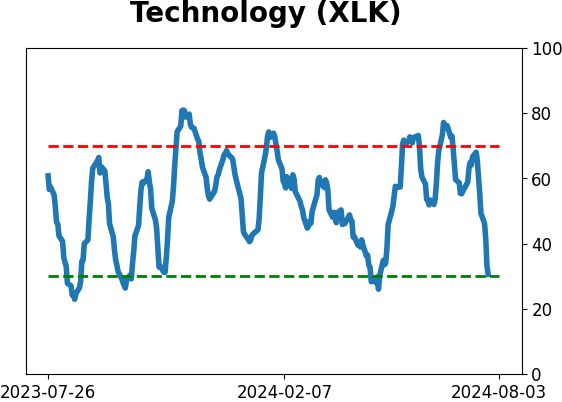
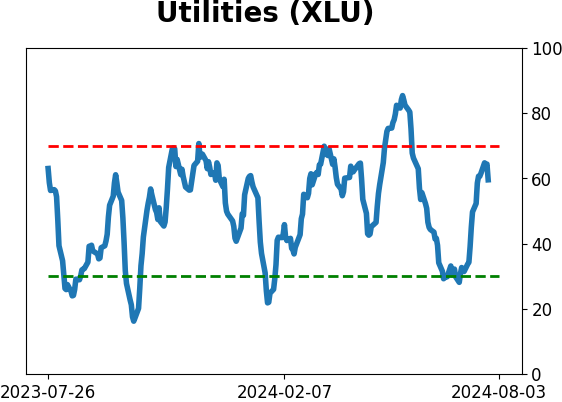
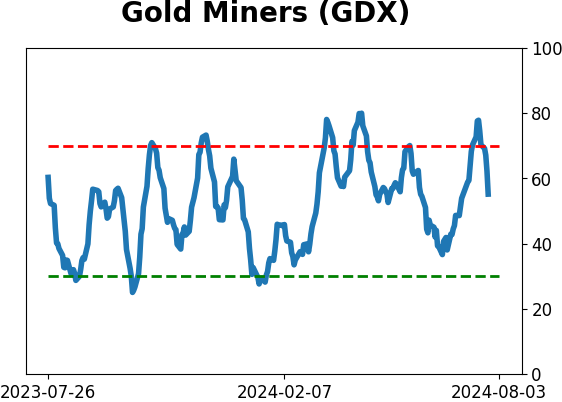
Sector ETF's - 10-Day Moving Average
|
|
|
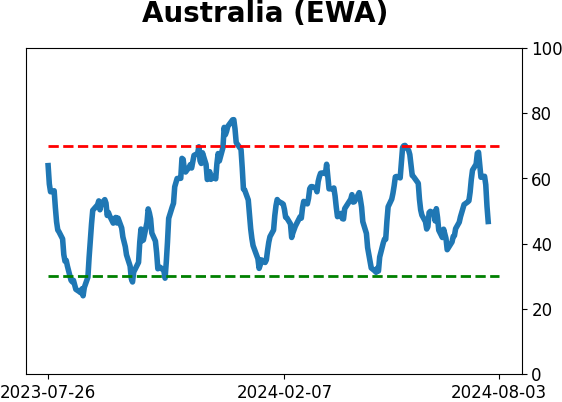
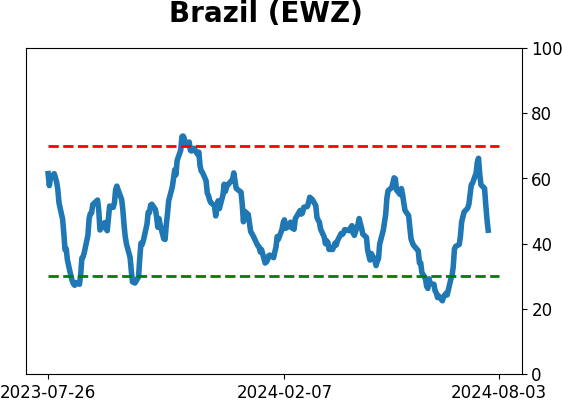
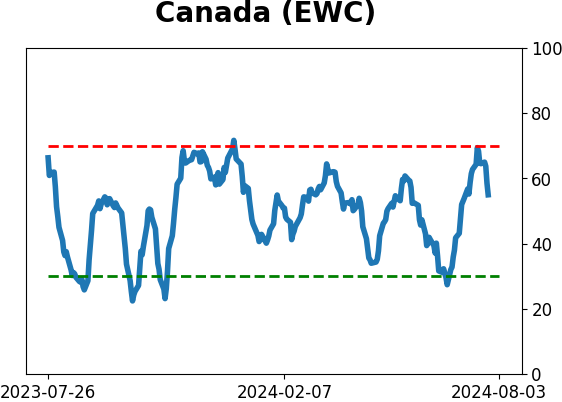
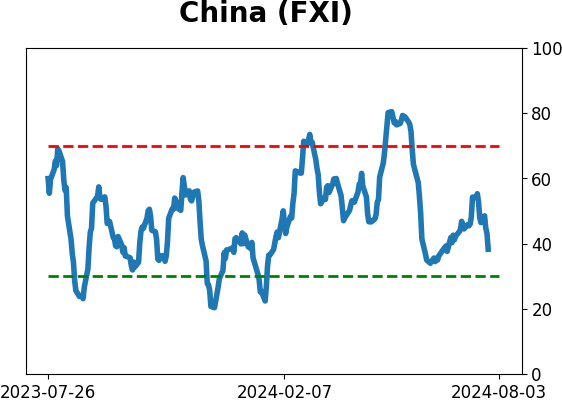
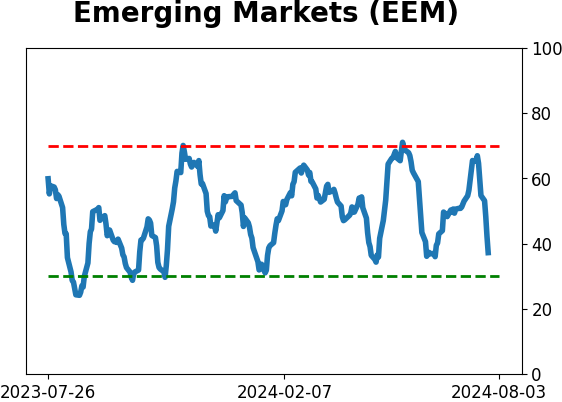
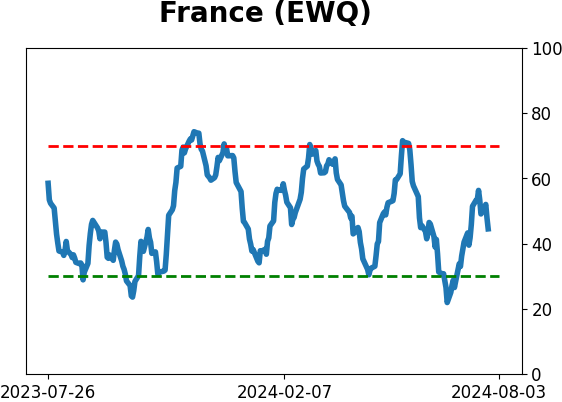
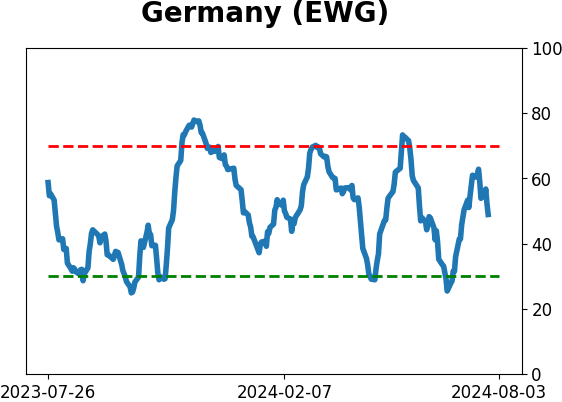
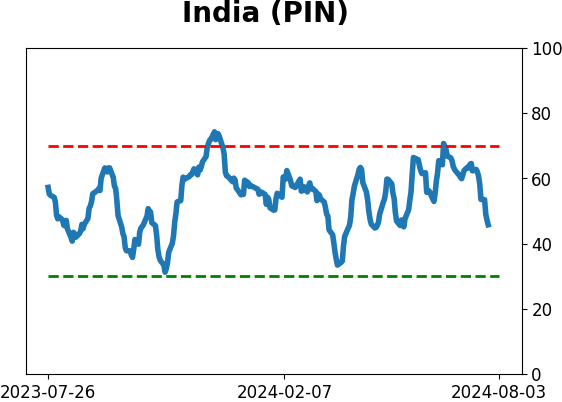
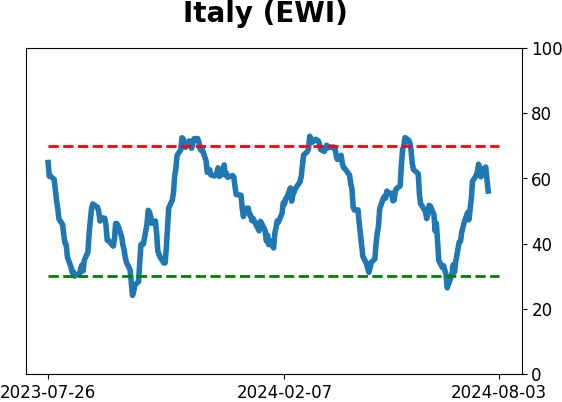
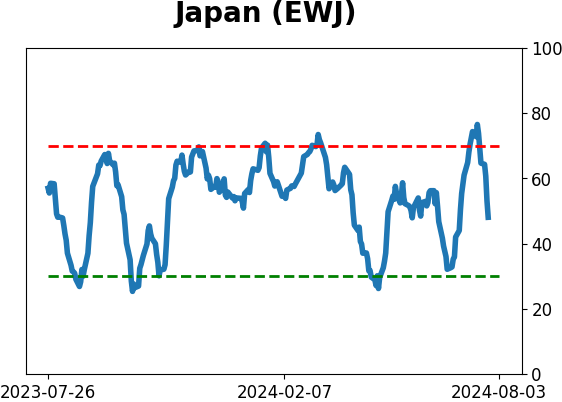
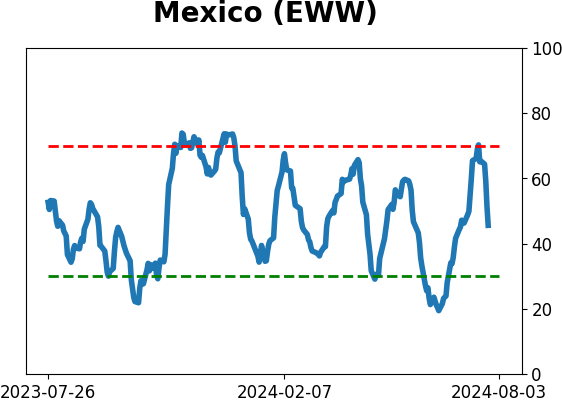
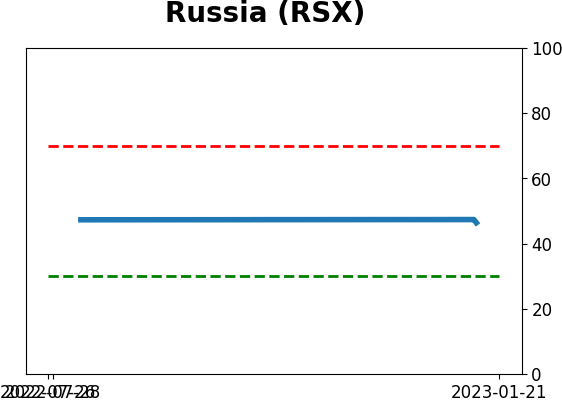
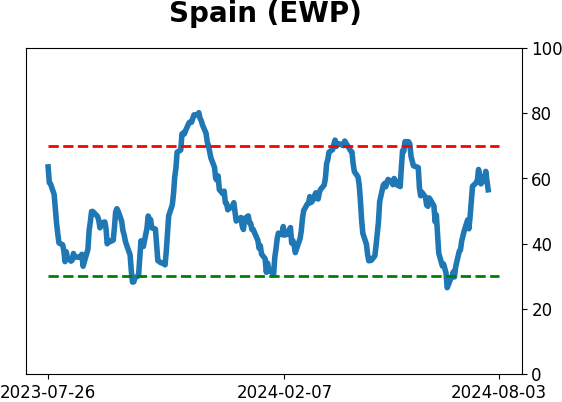
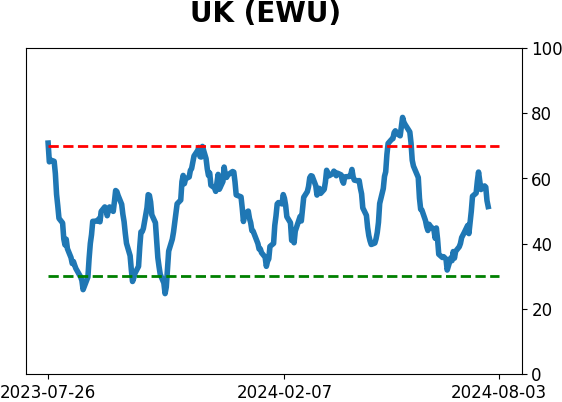
Country ETF's - 10-Day Moving Average
|
|
|
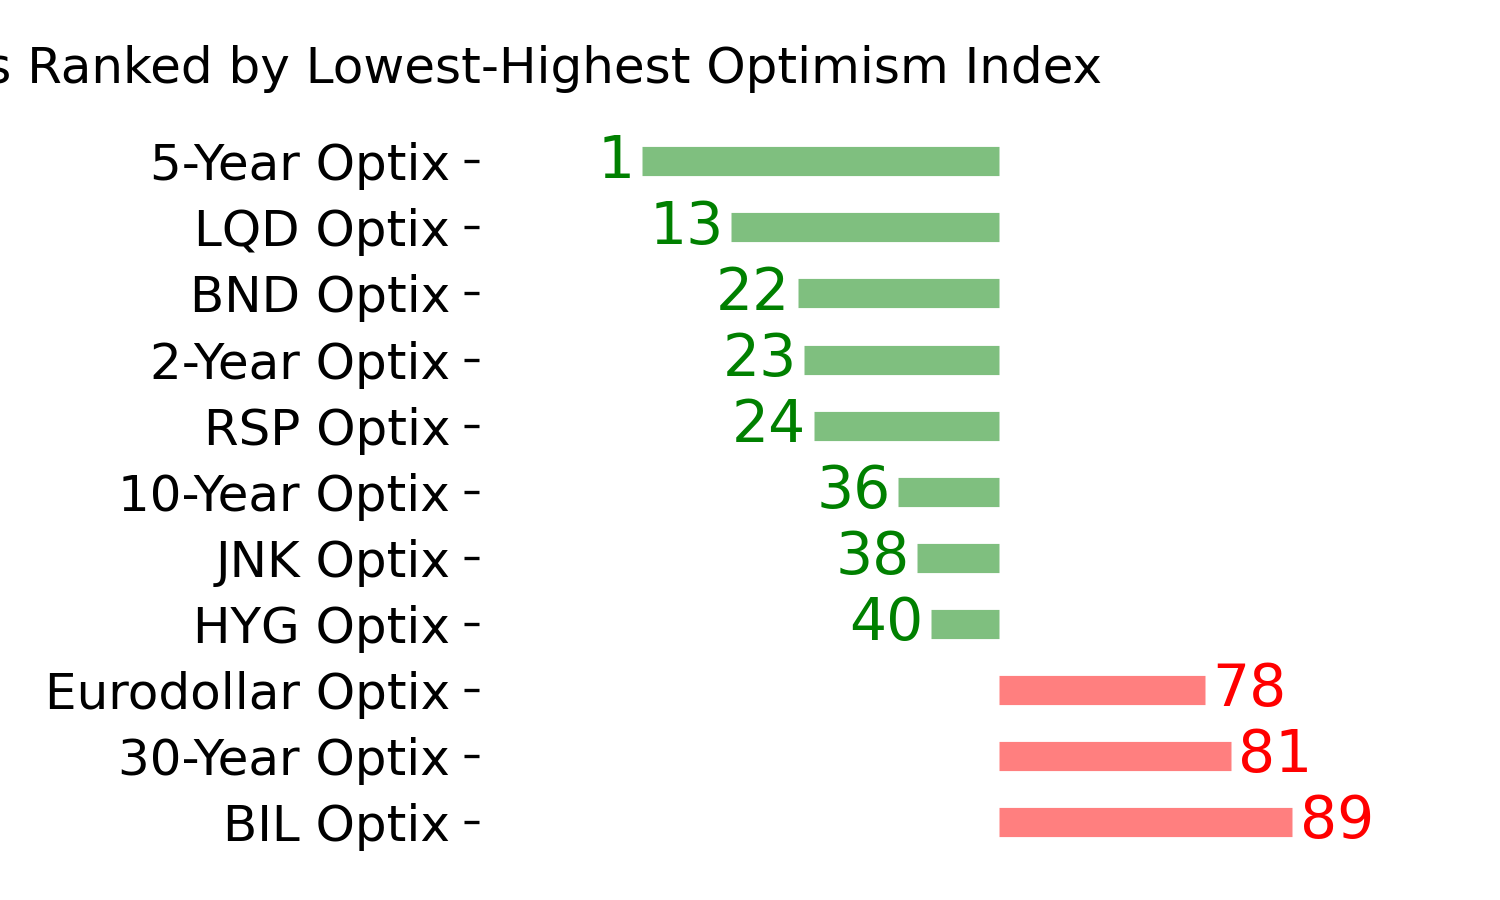
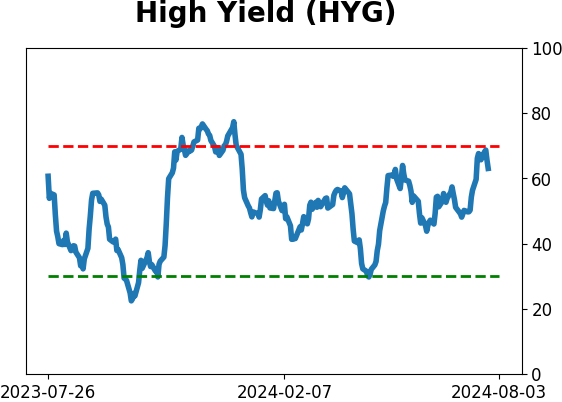
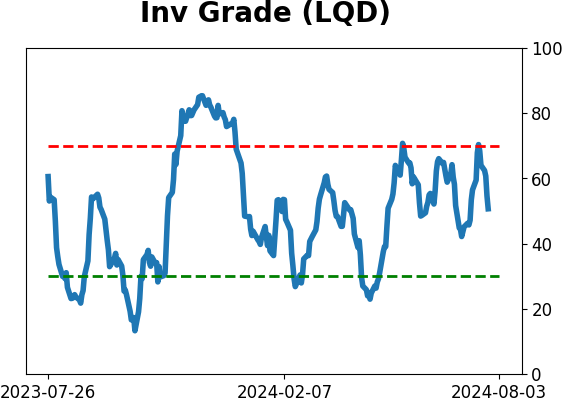
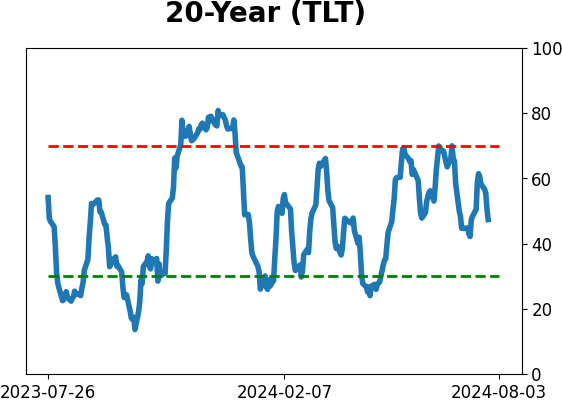
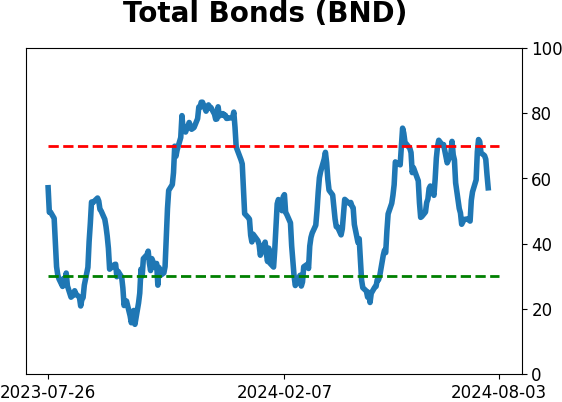
Bond ETF's - 10-Day Moving Average
|
|
|
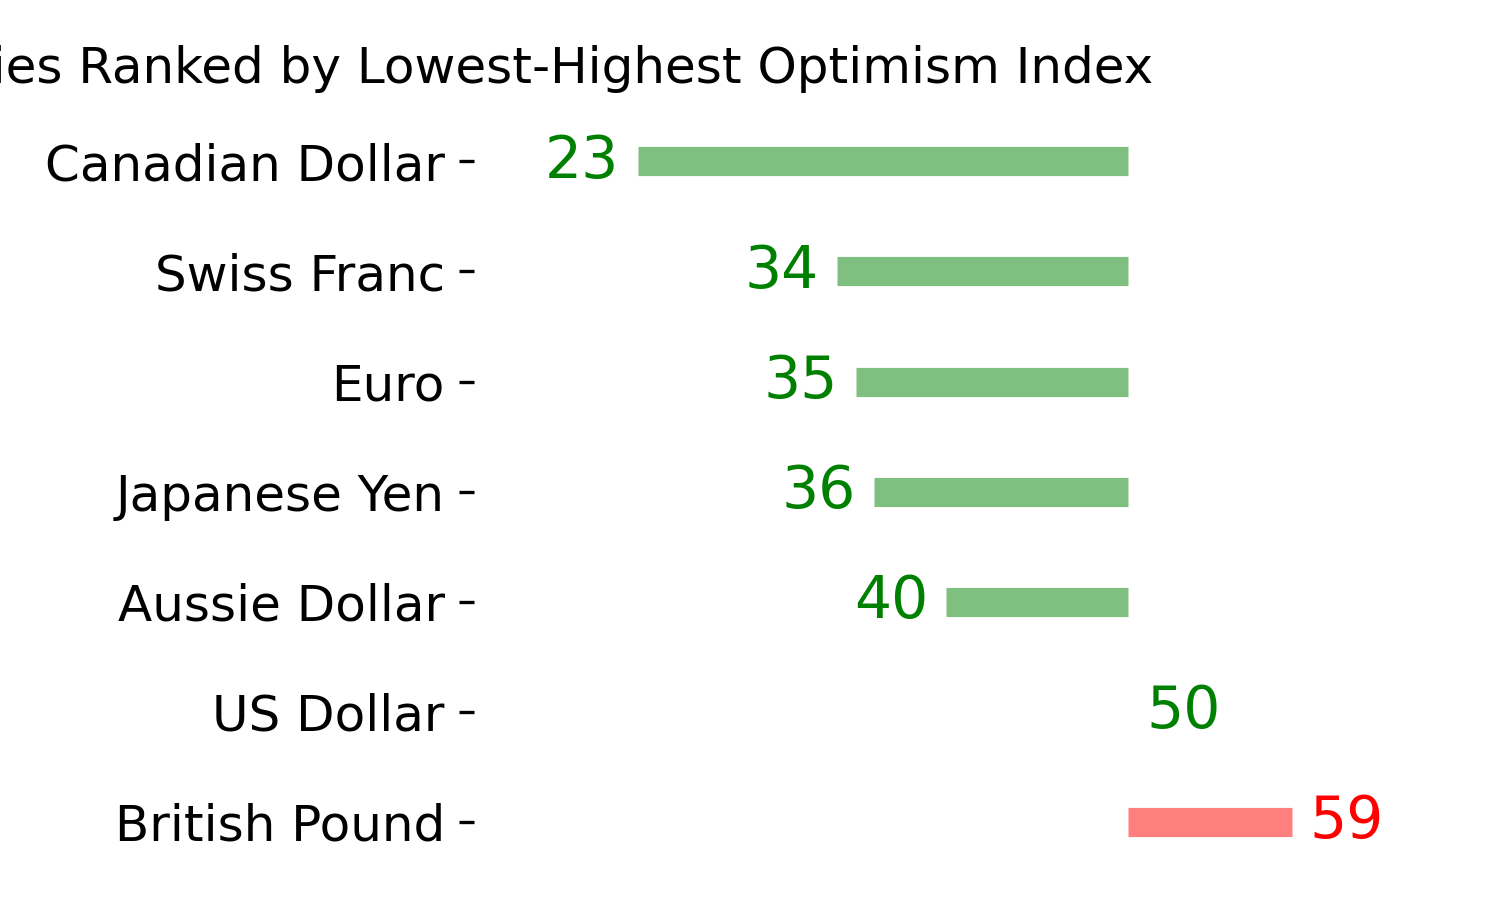
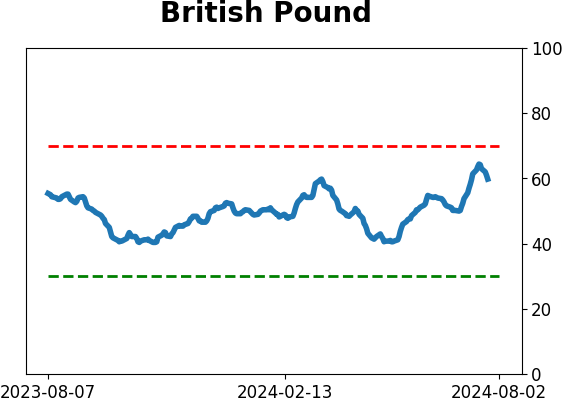
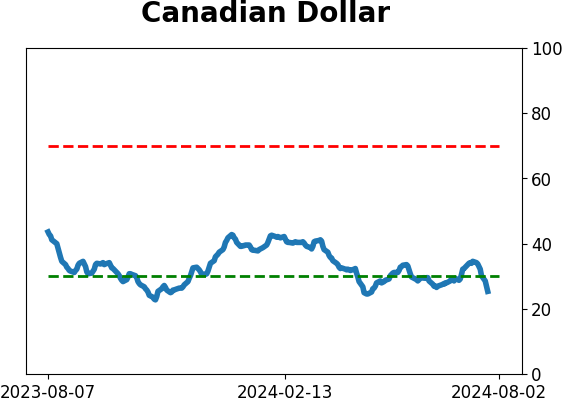
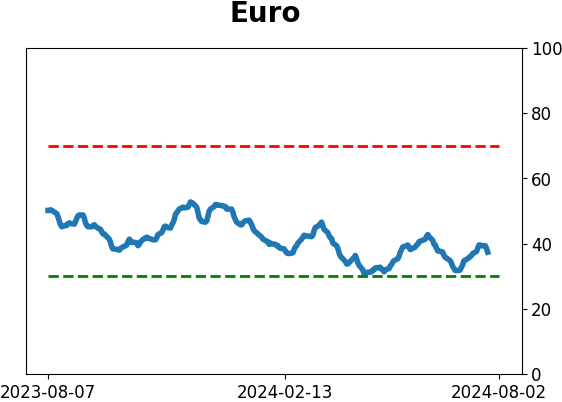
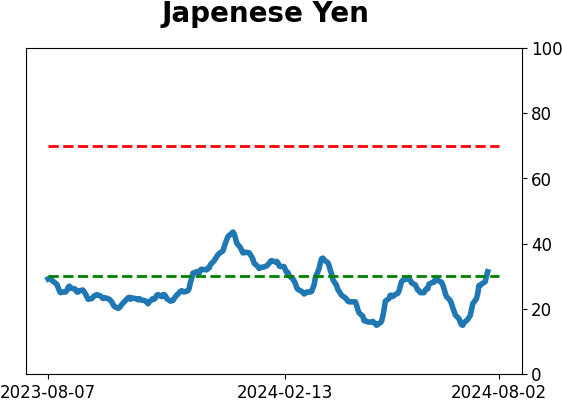
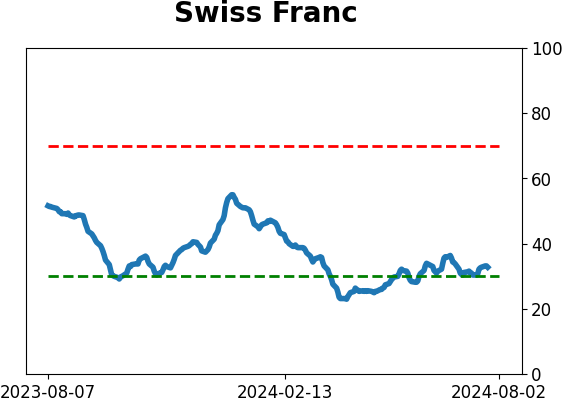
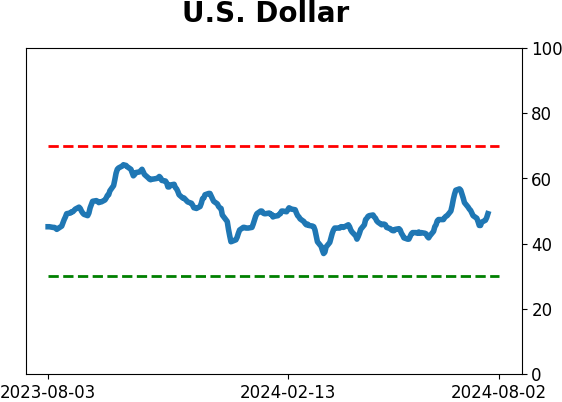
Currency ETF's - 5-Day Moving Average
|
|
|
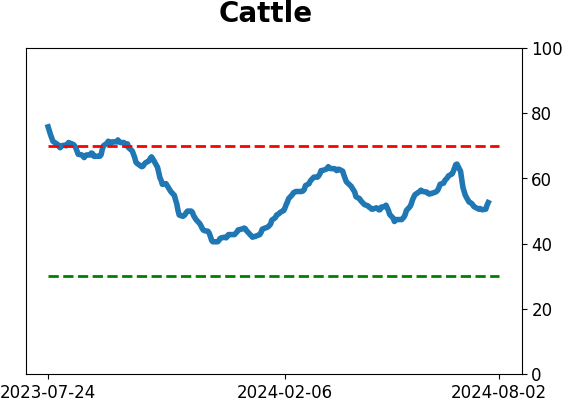
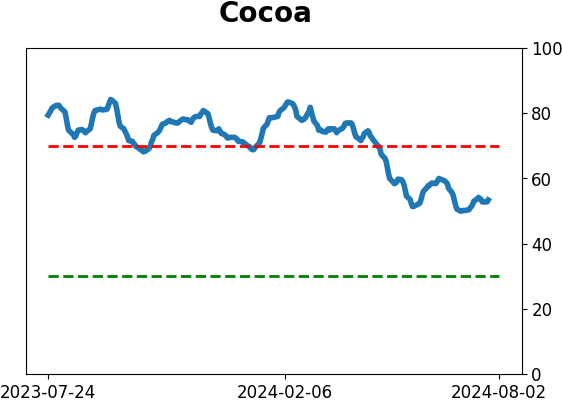
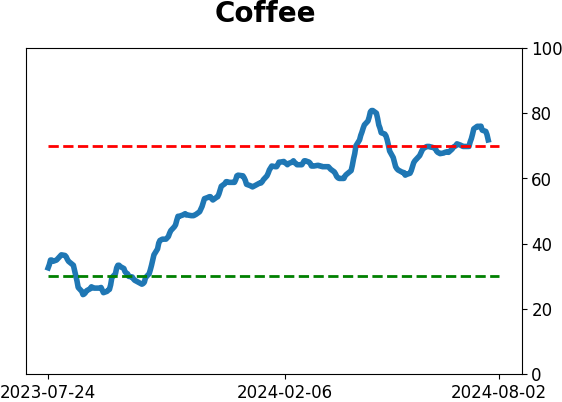
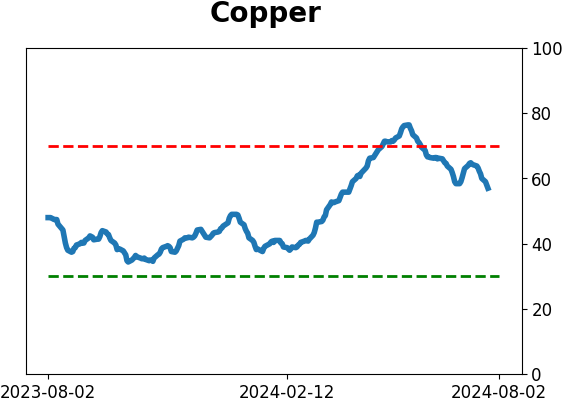
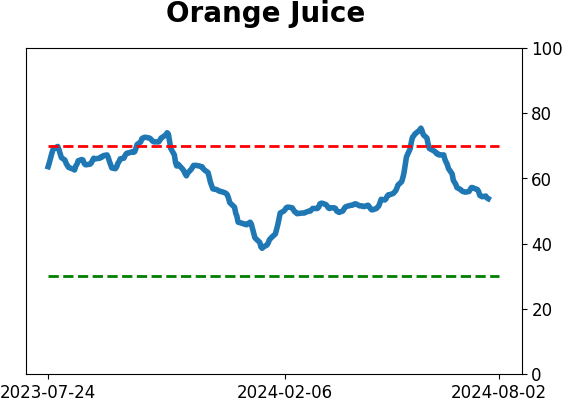
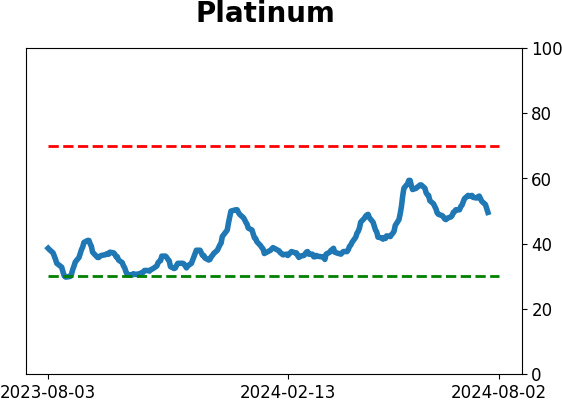
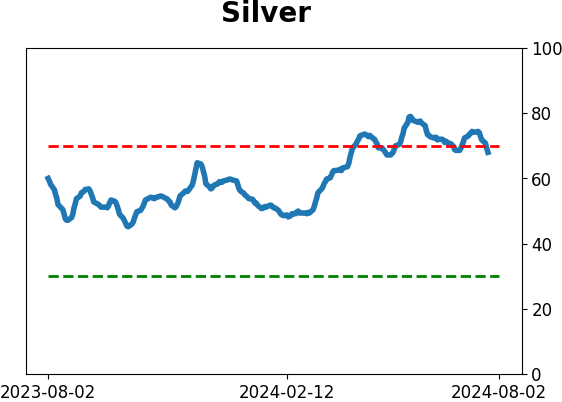
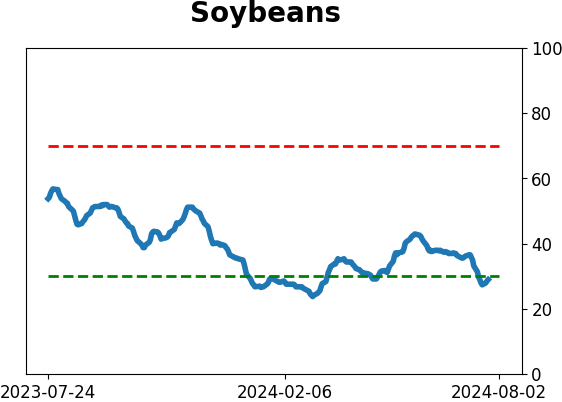
Commodity ETF's - 5-Day Moving Average
|
|