Headlines
|
|
It's been a while since a scary drop:
The S&P 500 hasn't suffered more than a 1% down day for two months. That's a long time, and making contrarian investors nervous since it suggests complacency. But the ends of long streaks without a big decline had a consistent tendency to lead to rebounds and further price gains.
|
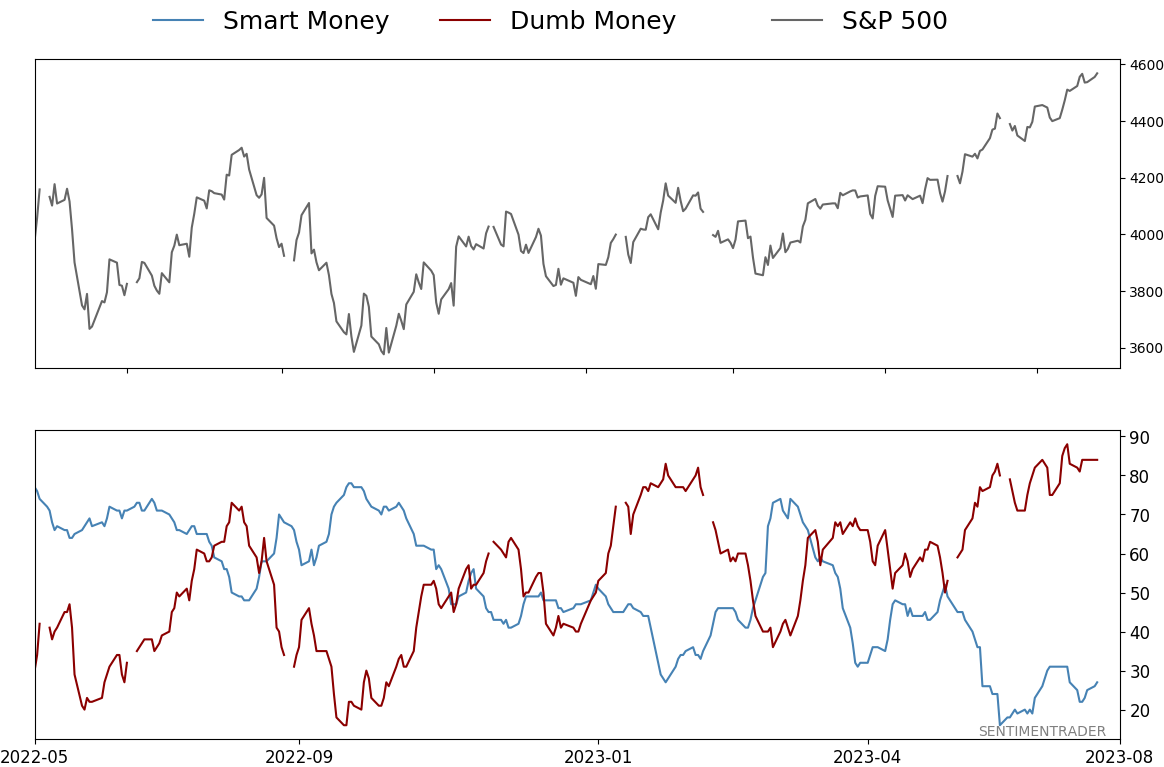
Smart / Dumb Money Confidence
|
Smart Money Confidence: 27%
Dumb Money Confidence: 84%
|
|
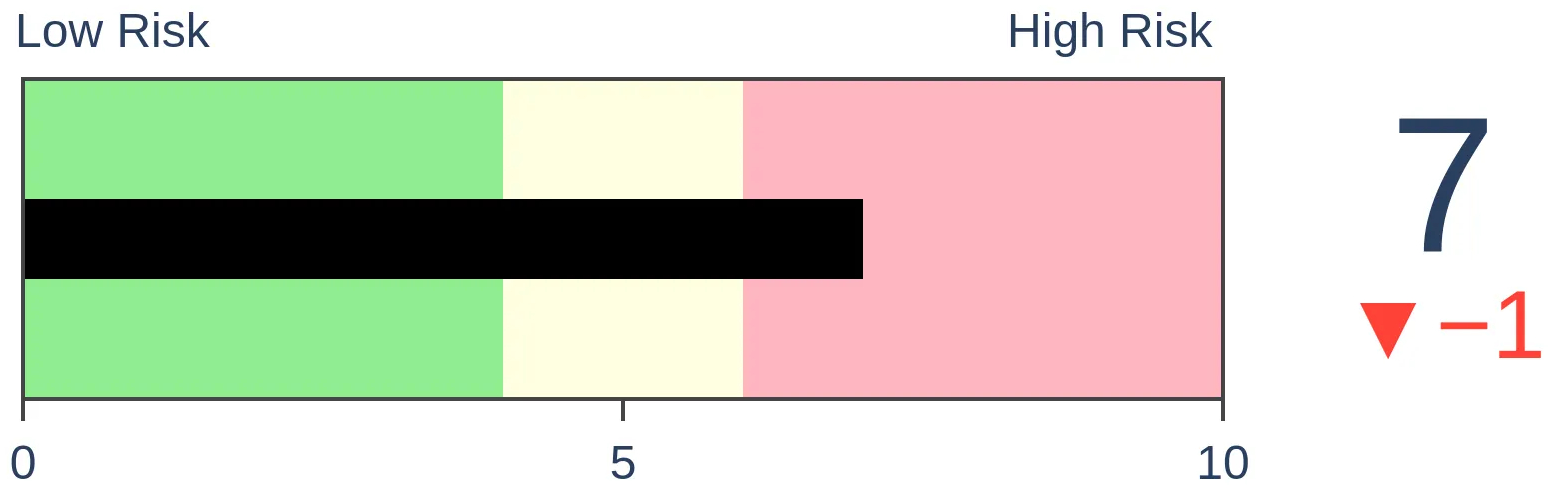
Risk Levels
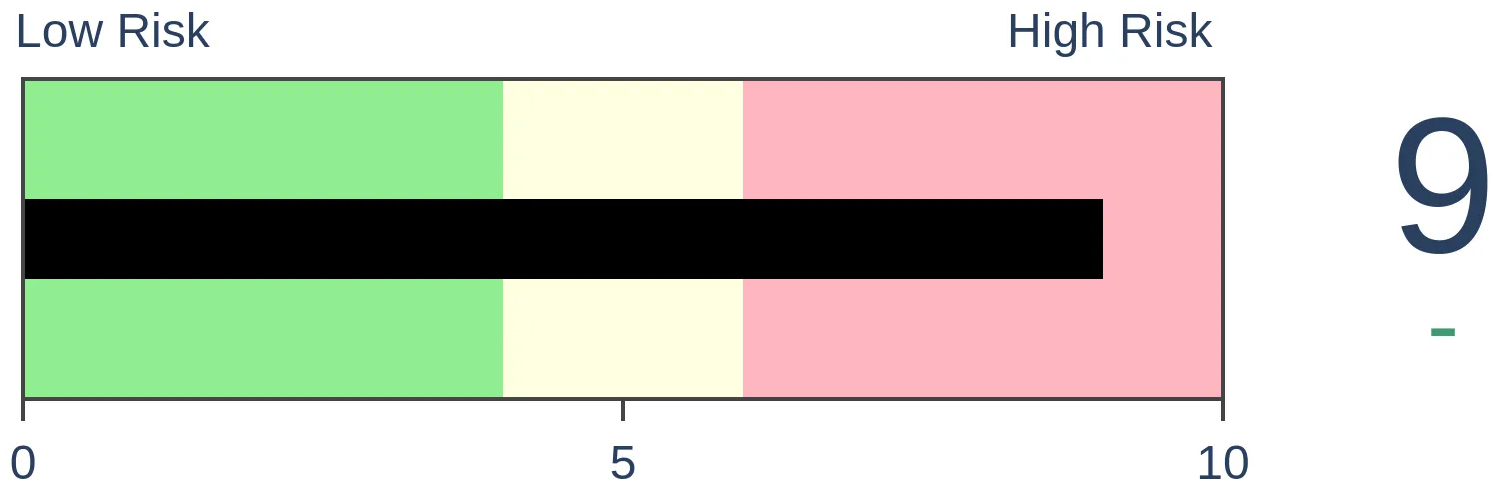
Stocks Short-Term
|
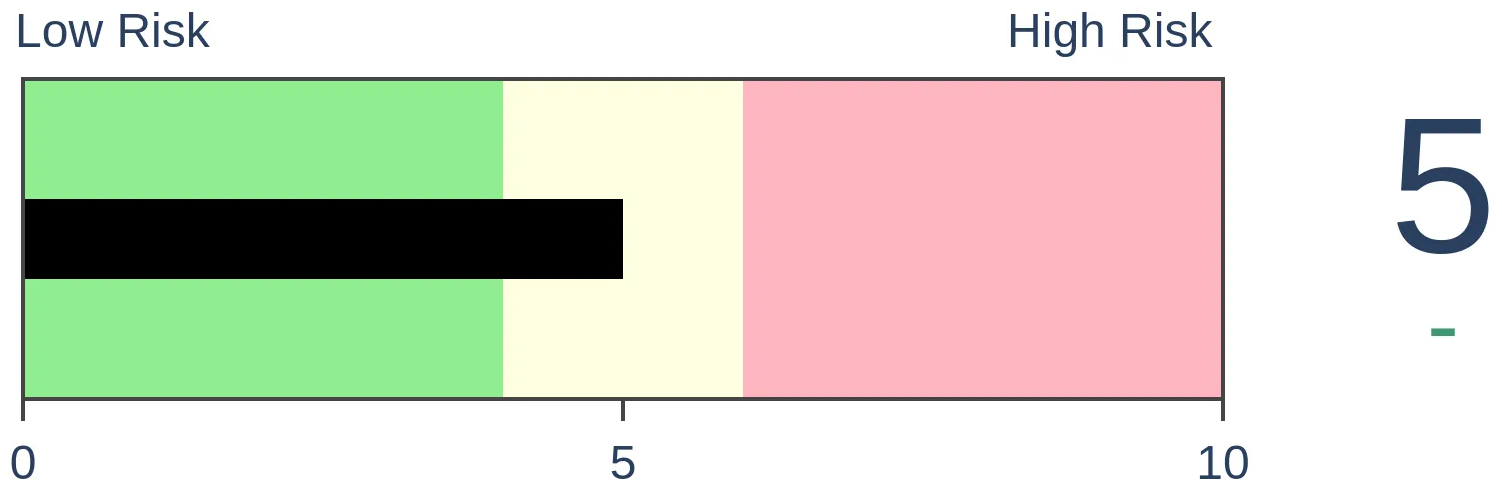
Stocks Medium-Term
|
|
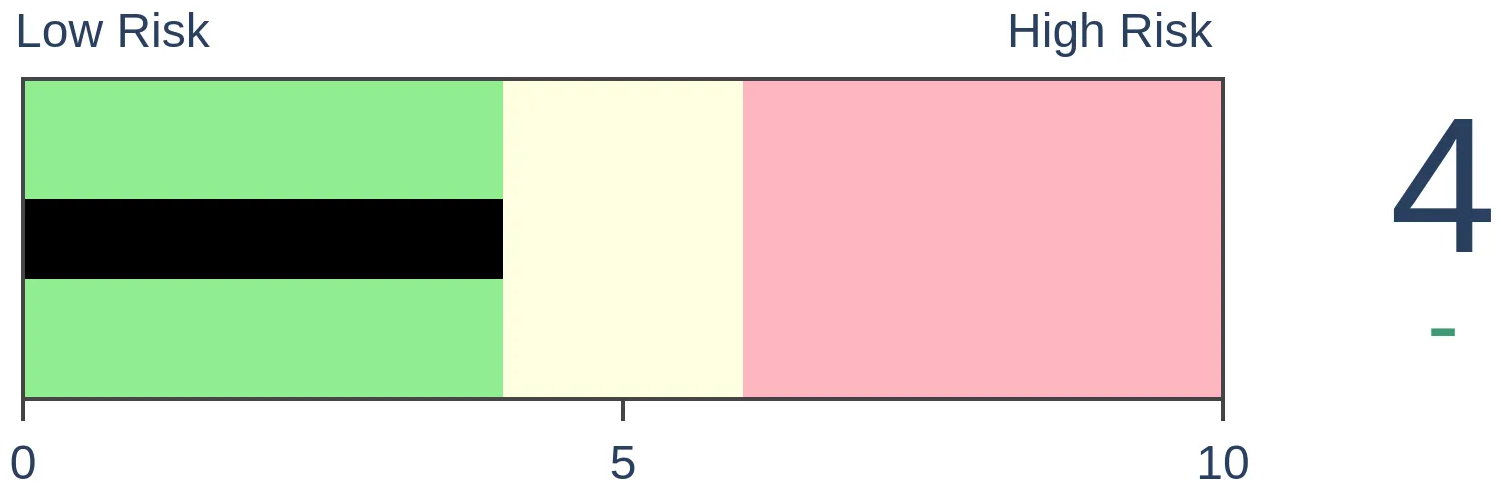
Bonds

|
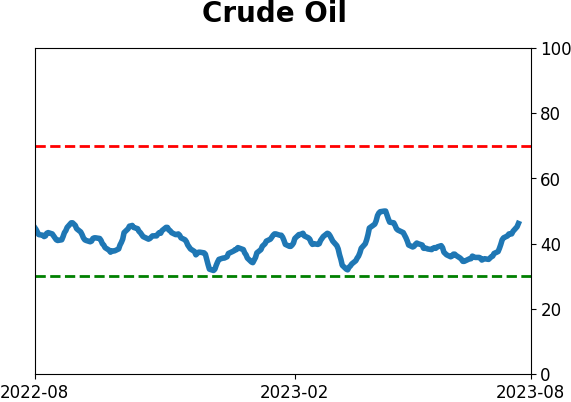
Crude Oil
|
|
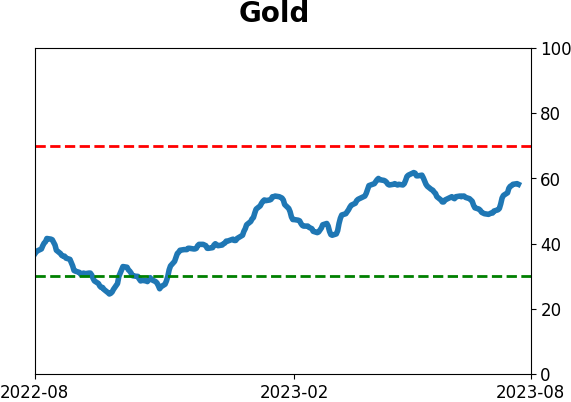
Gold

|
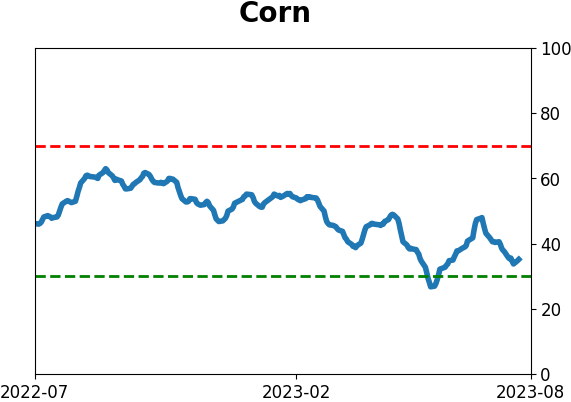
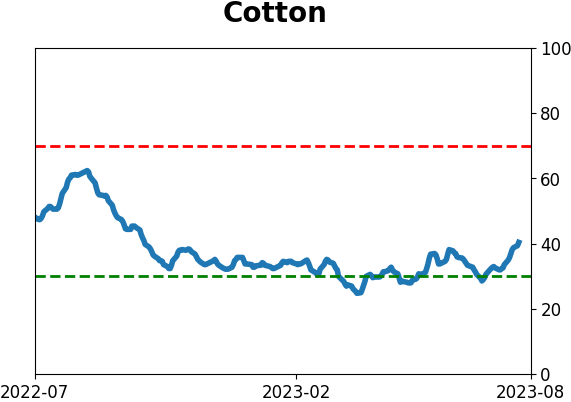
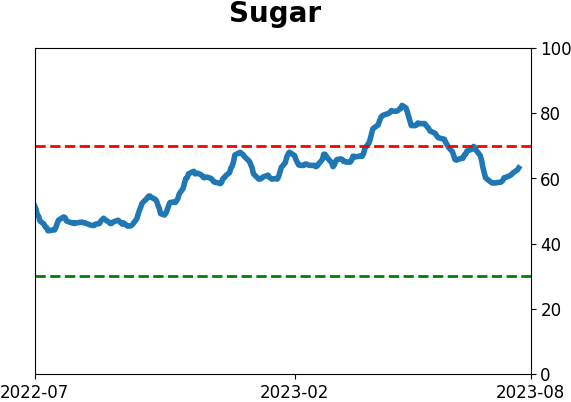
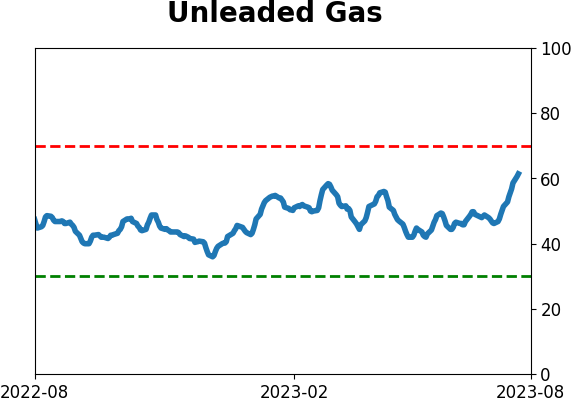
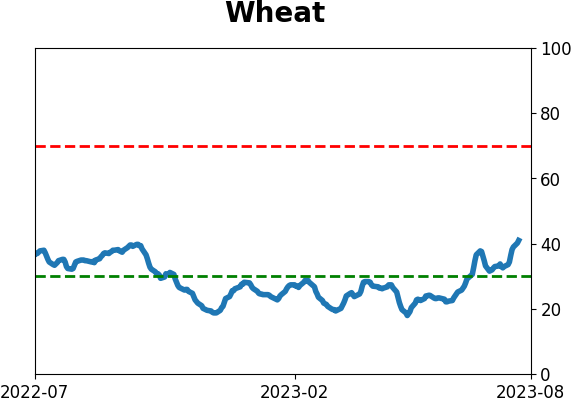
Agriculture
|
|
Research
By Jason Goepfert
BOTTOM LINE
The S&P 500 hasn't suffered more than a 1% down day for two months. That's a long time, and making contrarian investors nervous since it suggests complacency. But the ends of long streaks without a big decline had a consistent tendency to lead to rebounds and further price gains.
FORECAST / TIMEFRAME
None
|
Key points:
- The S&P 500 hasn't suffered more than a 1% daily decline for two months
- While it's a long streak, it's far from historically extreme
- Even so, the ends of long streaks of calm tended to precede gains for the index
It's been months since stocks took a big dip
It's been a while since investors got slapped hard, and it's making some of us nervous. We're going on two months now since the most benchmarked index in the world took more than a 1% daily dip. That's nearly three times as long as it's been since the last 1% up day.
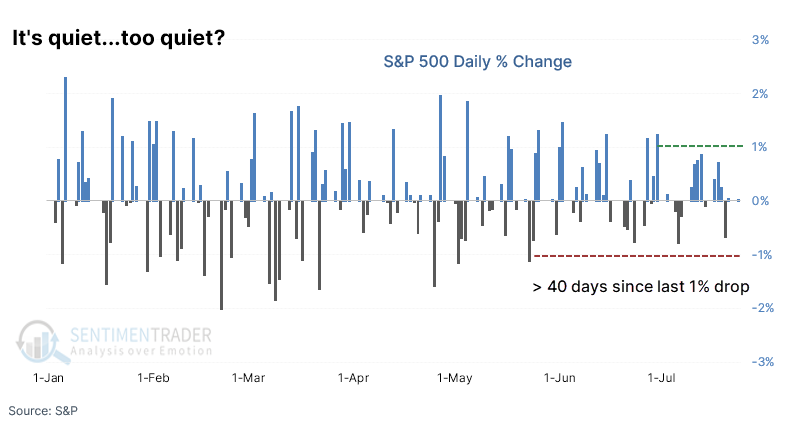
One of the scary charts du jour circulating amongst the usual tripe on social media suggests that the ends of long streaks without a significant down day have preceded some big declines as complacent investors panic. This did happen as stocks were peaking in early 2020 ahead of the pandemic. So there's that.
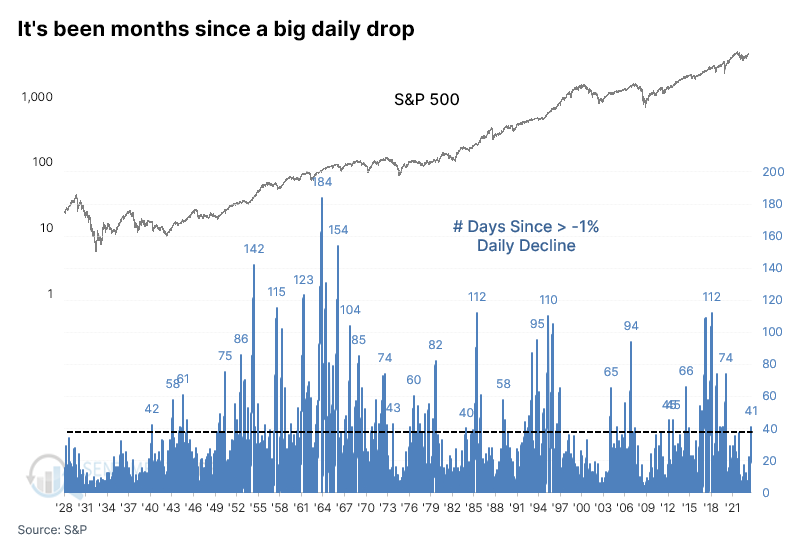
Still, we're far from what could be considered an extreme streak without a big down day. It's gone on much, much longer than two months. Let's pretend the streak ends today or anytime after and see how the S&P 500 fared after similar conditions.
Ends of long streaks of calm preceded mostly more gains
The table below shows the ends of streaks of more than 40 sessions without a 1% down day, along with at least one day when the S&P hit a 52-week high in the past two weeks.
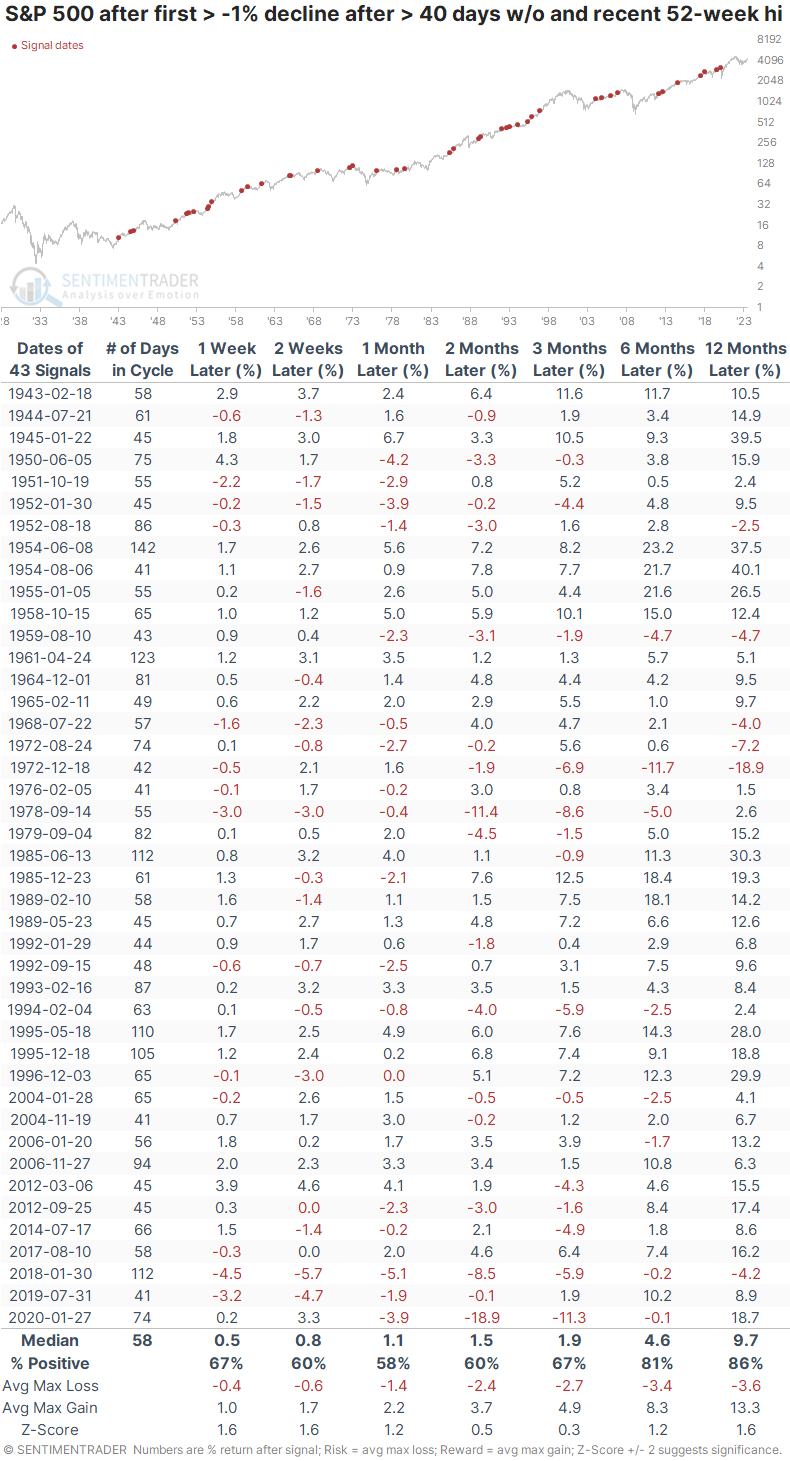
The results weren't too bad. The S&P outperformed a random return across all time frames, though its consistency, median return, and risk/reward ratio were just okay. At least disproves the notion that we should get scared once the 1% down-day streak ends. It preceded a nasty and protracted decline in the months ahead only once. Twice if we're being generous. Four times if we're being extremely generous.
It has also been a few weeks since a 1% up day. Let's modify the study to look at the streaks above, but there also hadn't been more than a 1% up day within the past two to four weeks. It shows us times of truly calm conditions.
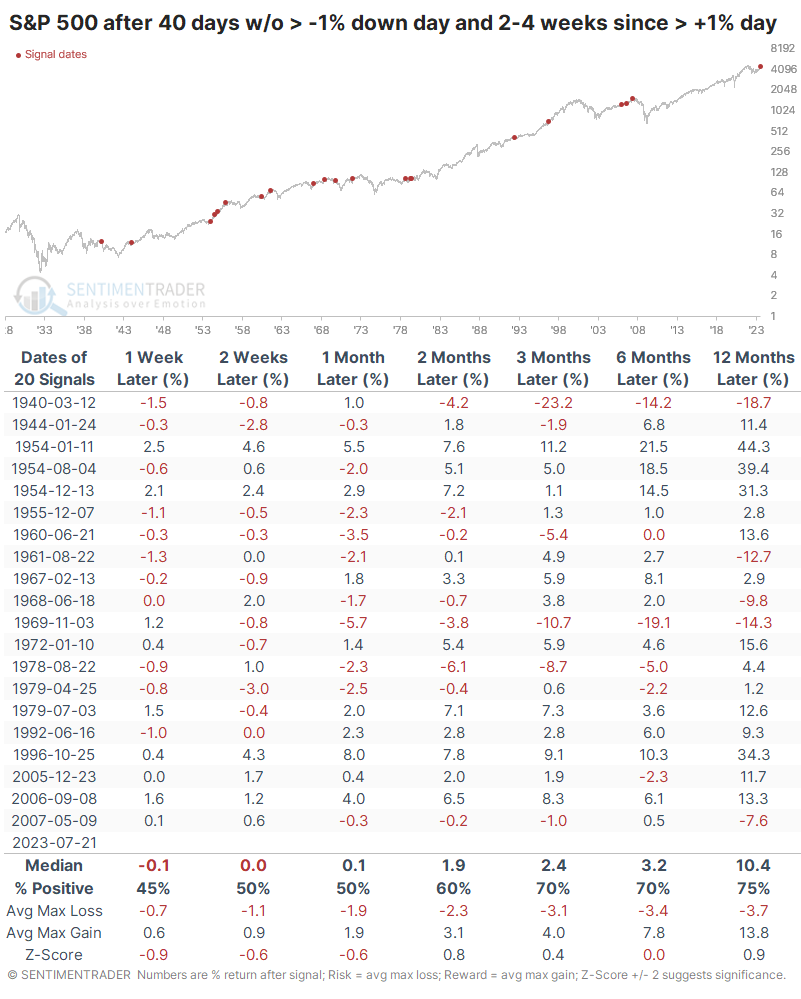
The returns after these signals were less kind. The S&P's forward returns were about in line with random, may slightly lower overall. Consistency declined, and the risk/reward ratio was less forgiving than in the first study. But still, stocks tended to rise, not fall. Only two out of twenty signals could be considered slam-dunk medium-term sell signals.
What the research tells us...
Adding to the long and growing list of things people want to scare others about, stocks have been calm lately. It's been months since the last big down day. The trouble with assuming that's a contrary sign and a reason to sell stocks is that like many things we've discussed since October, we're witnessing behavior almost exclusively witnessed during bull markets.
This kind of activity doesn't happen, or happens very infrequently, during bear markets. During 2002, the longest streak without a +/-1% day was 20 sessions. In 2008 and 2022, it was 17 sessions. We've already gone twice that long in 2023. Add it to the list of things that increase the probability that the environment has changed since the historically disastrous 2022.
Indicators at Extremes
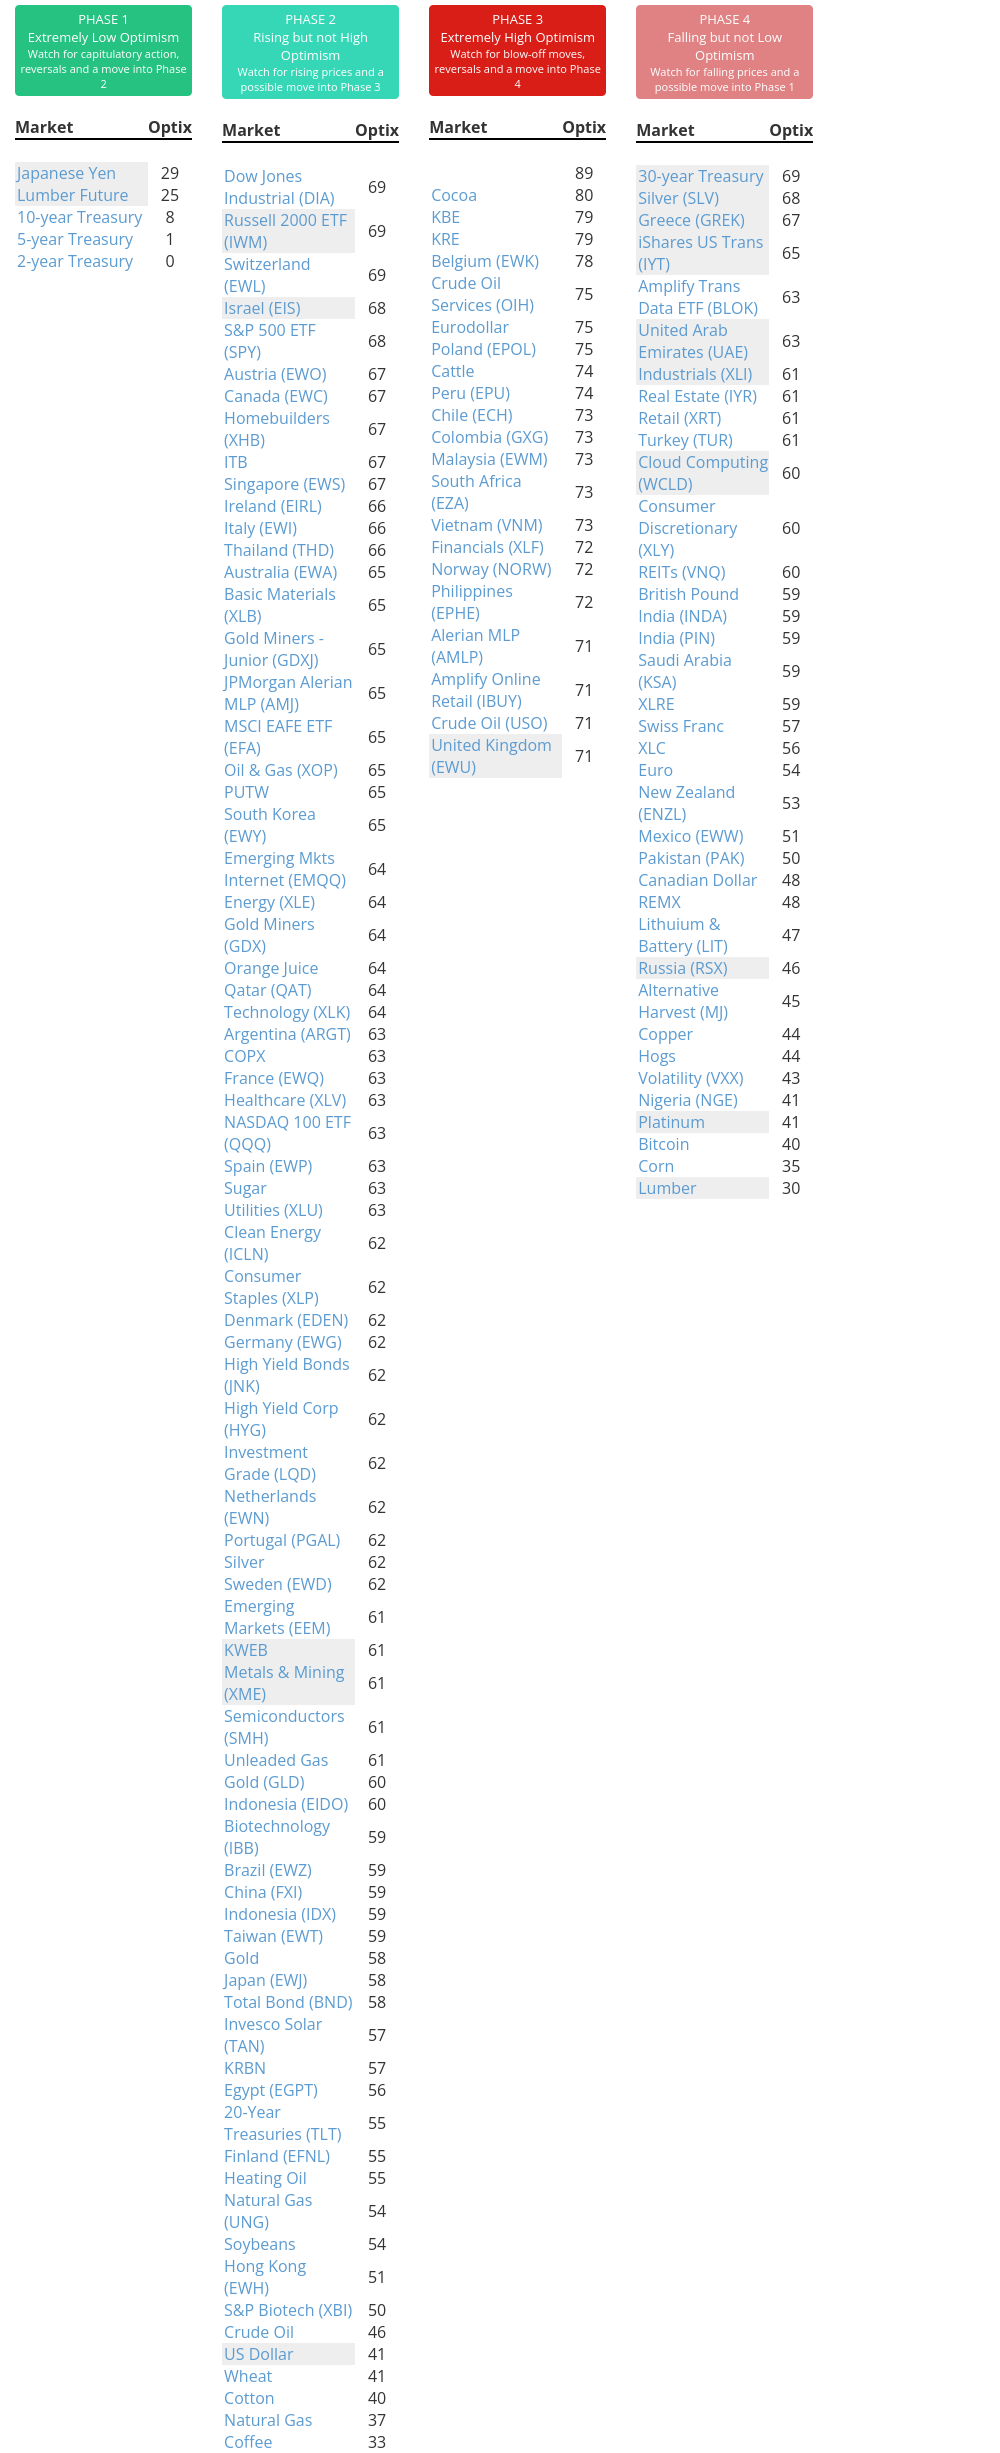
Phase Table
Ranks
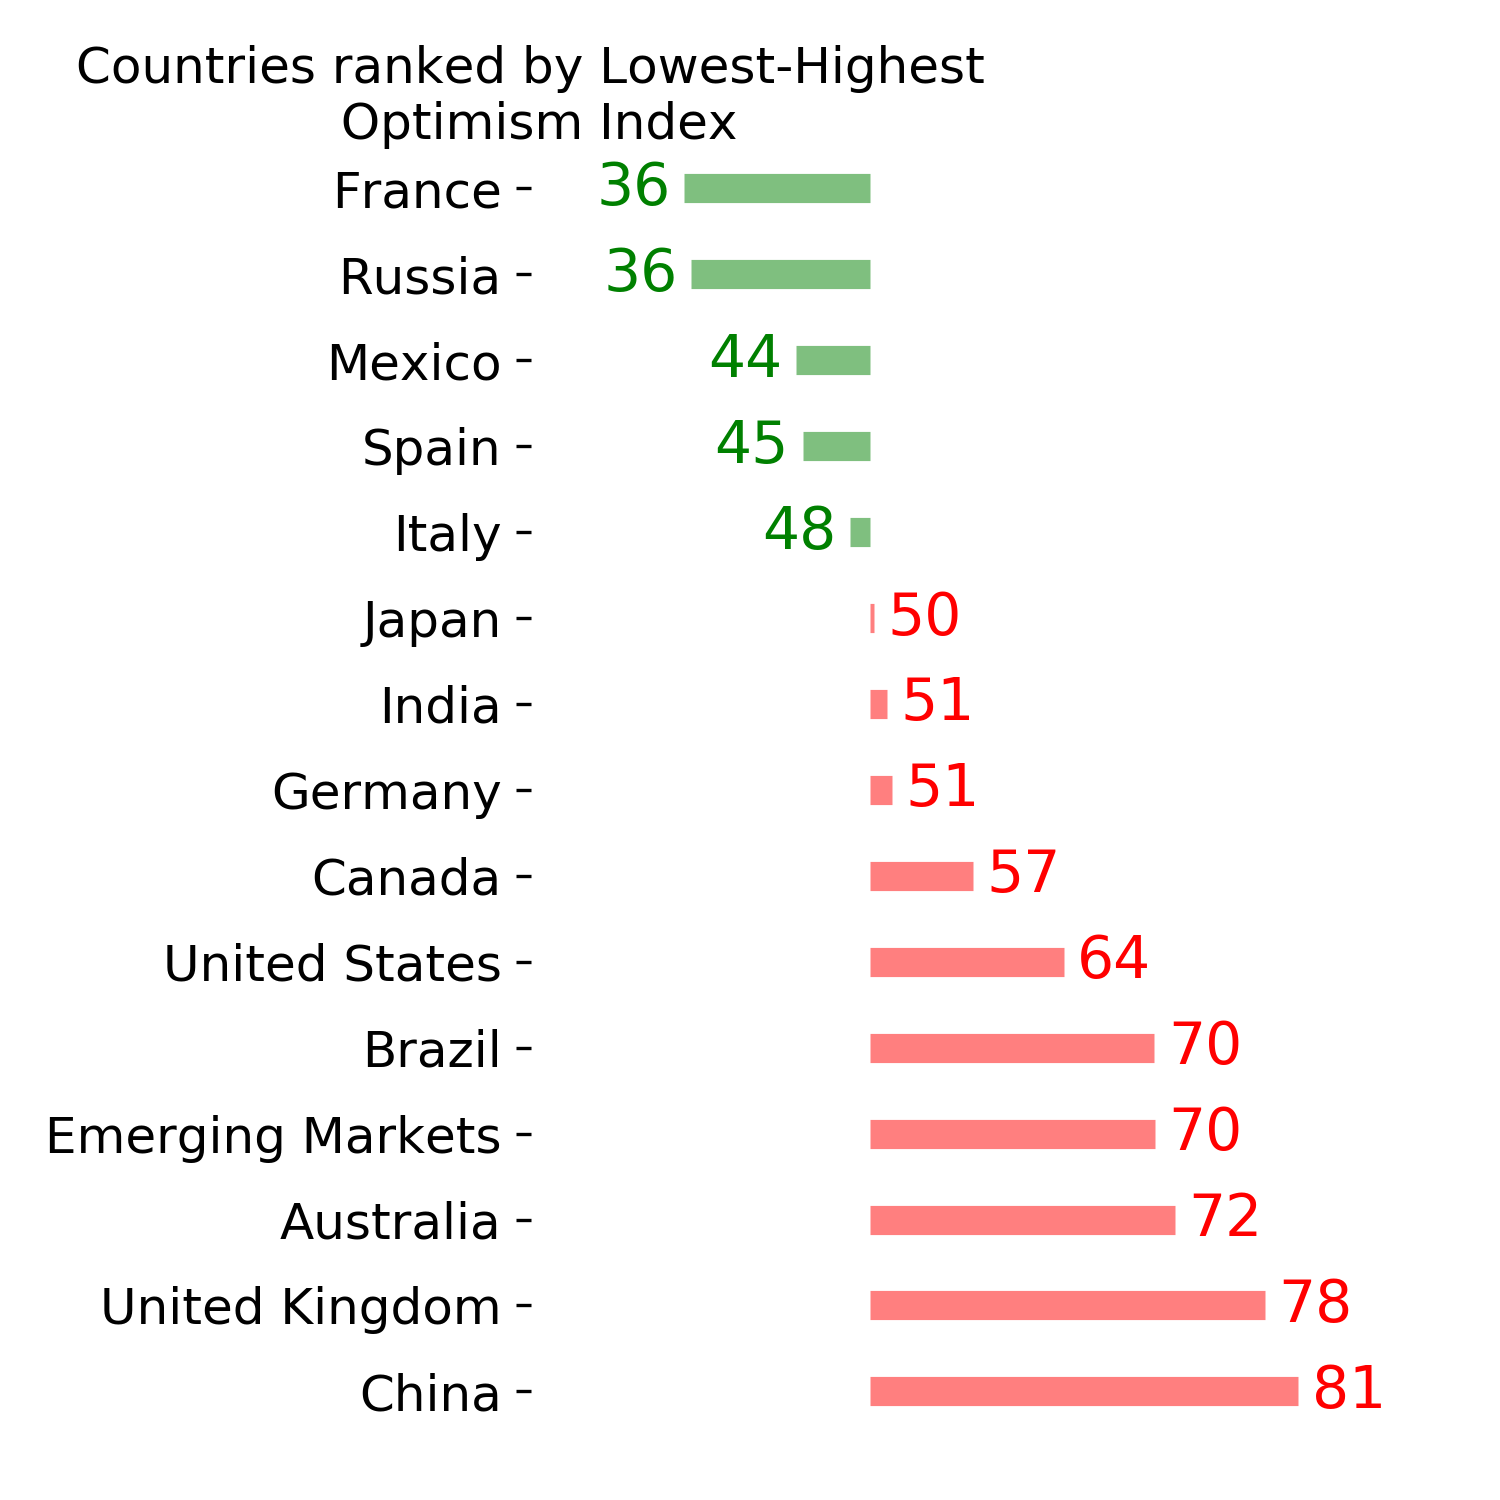
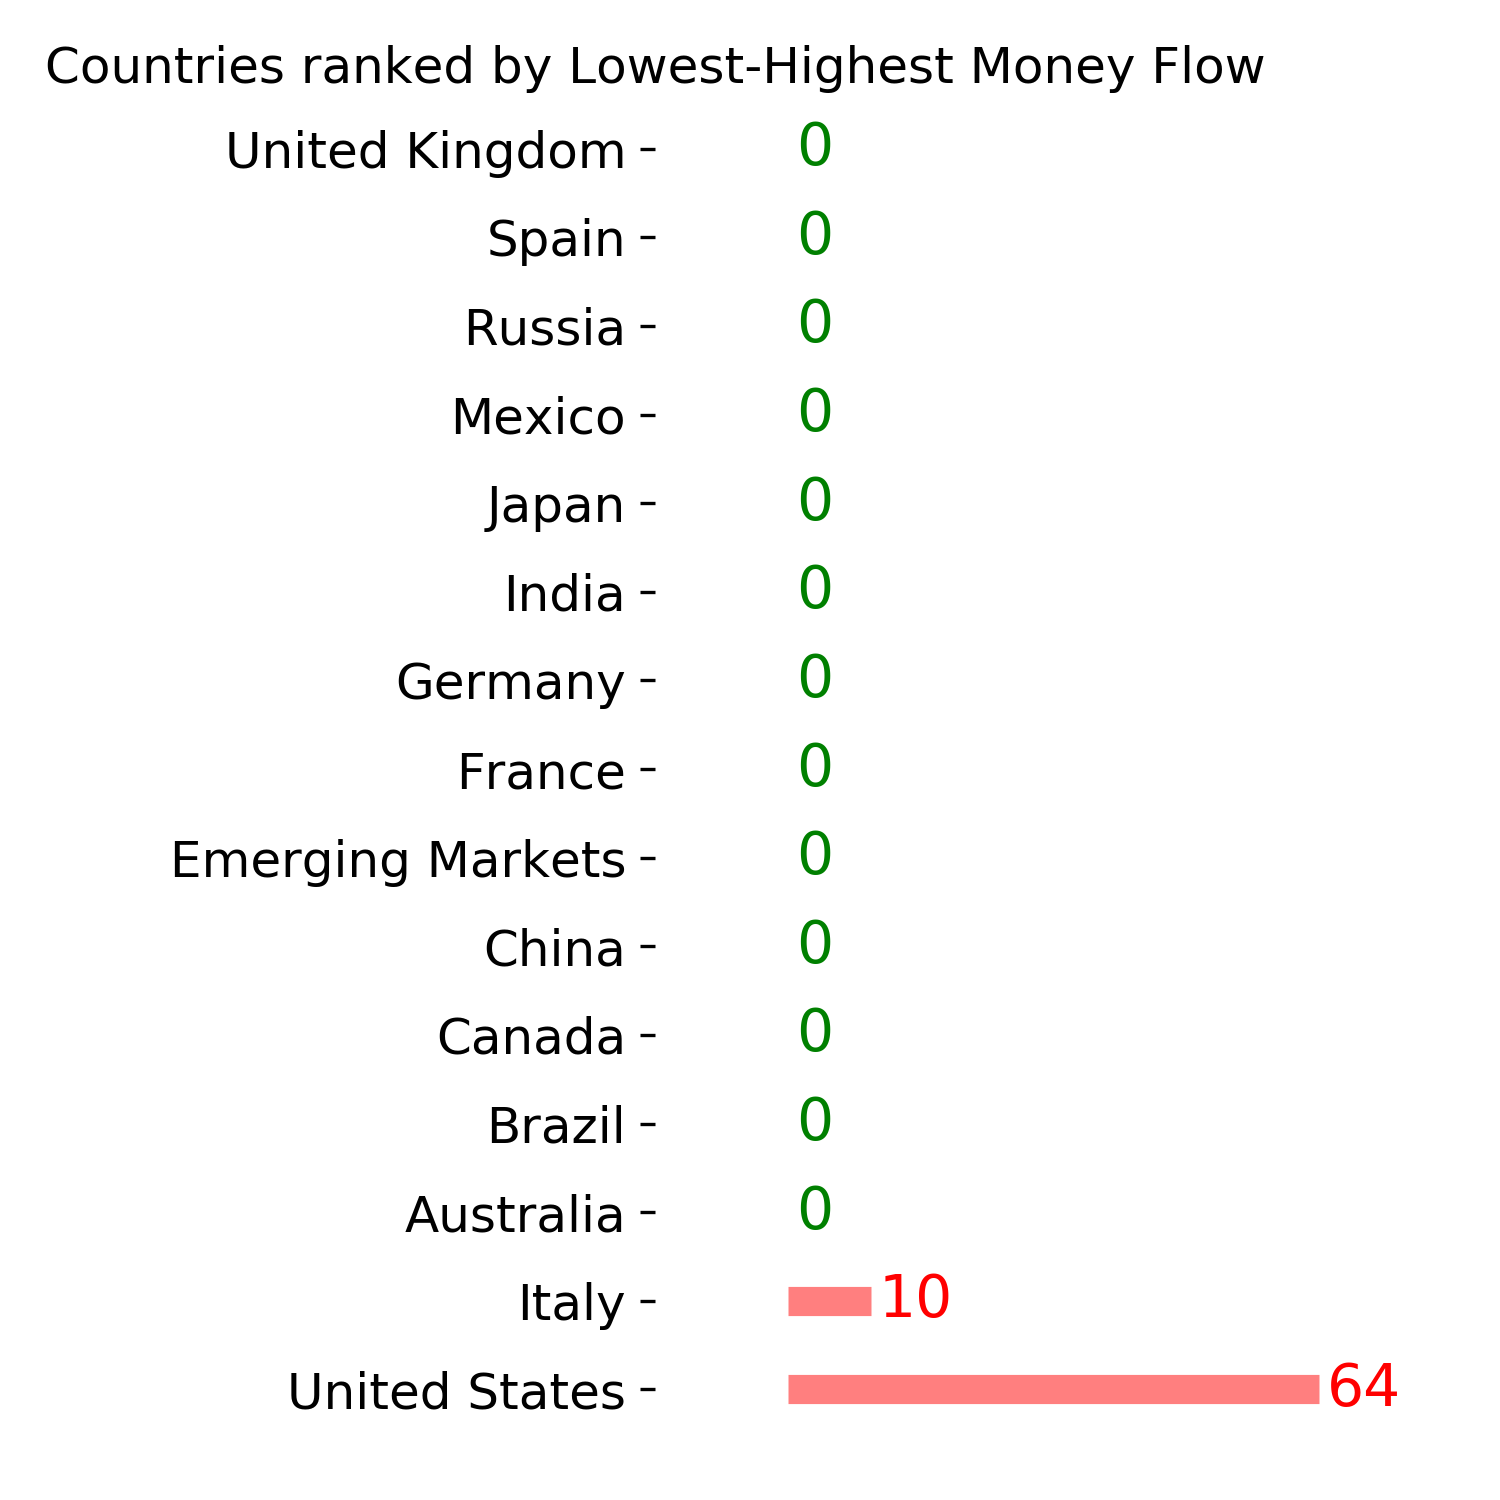
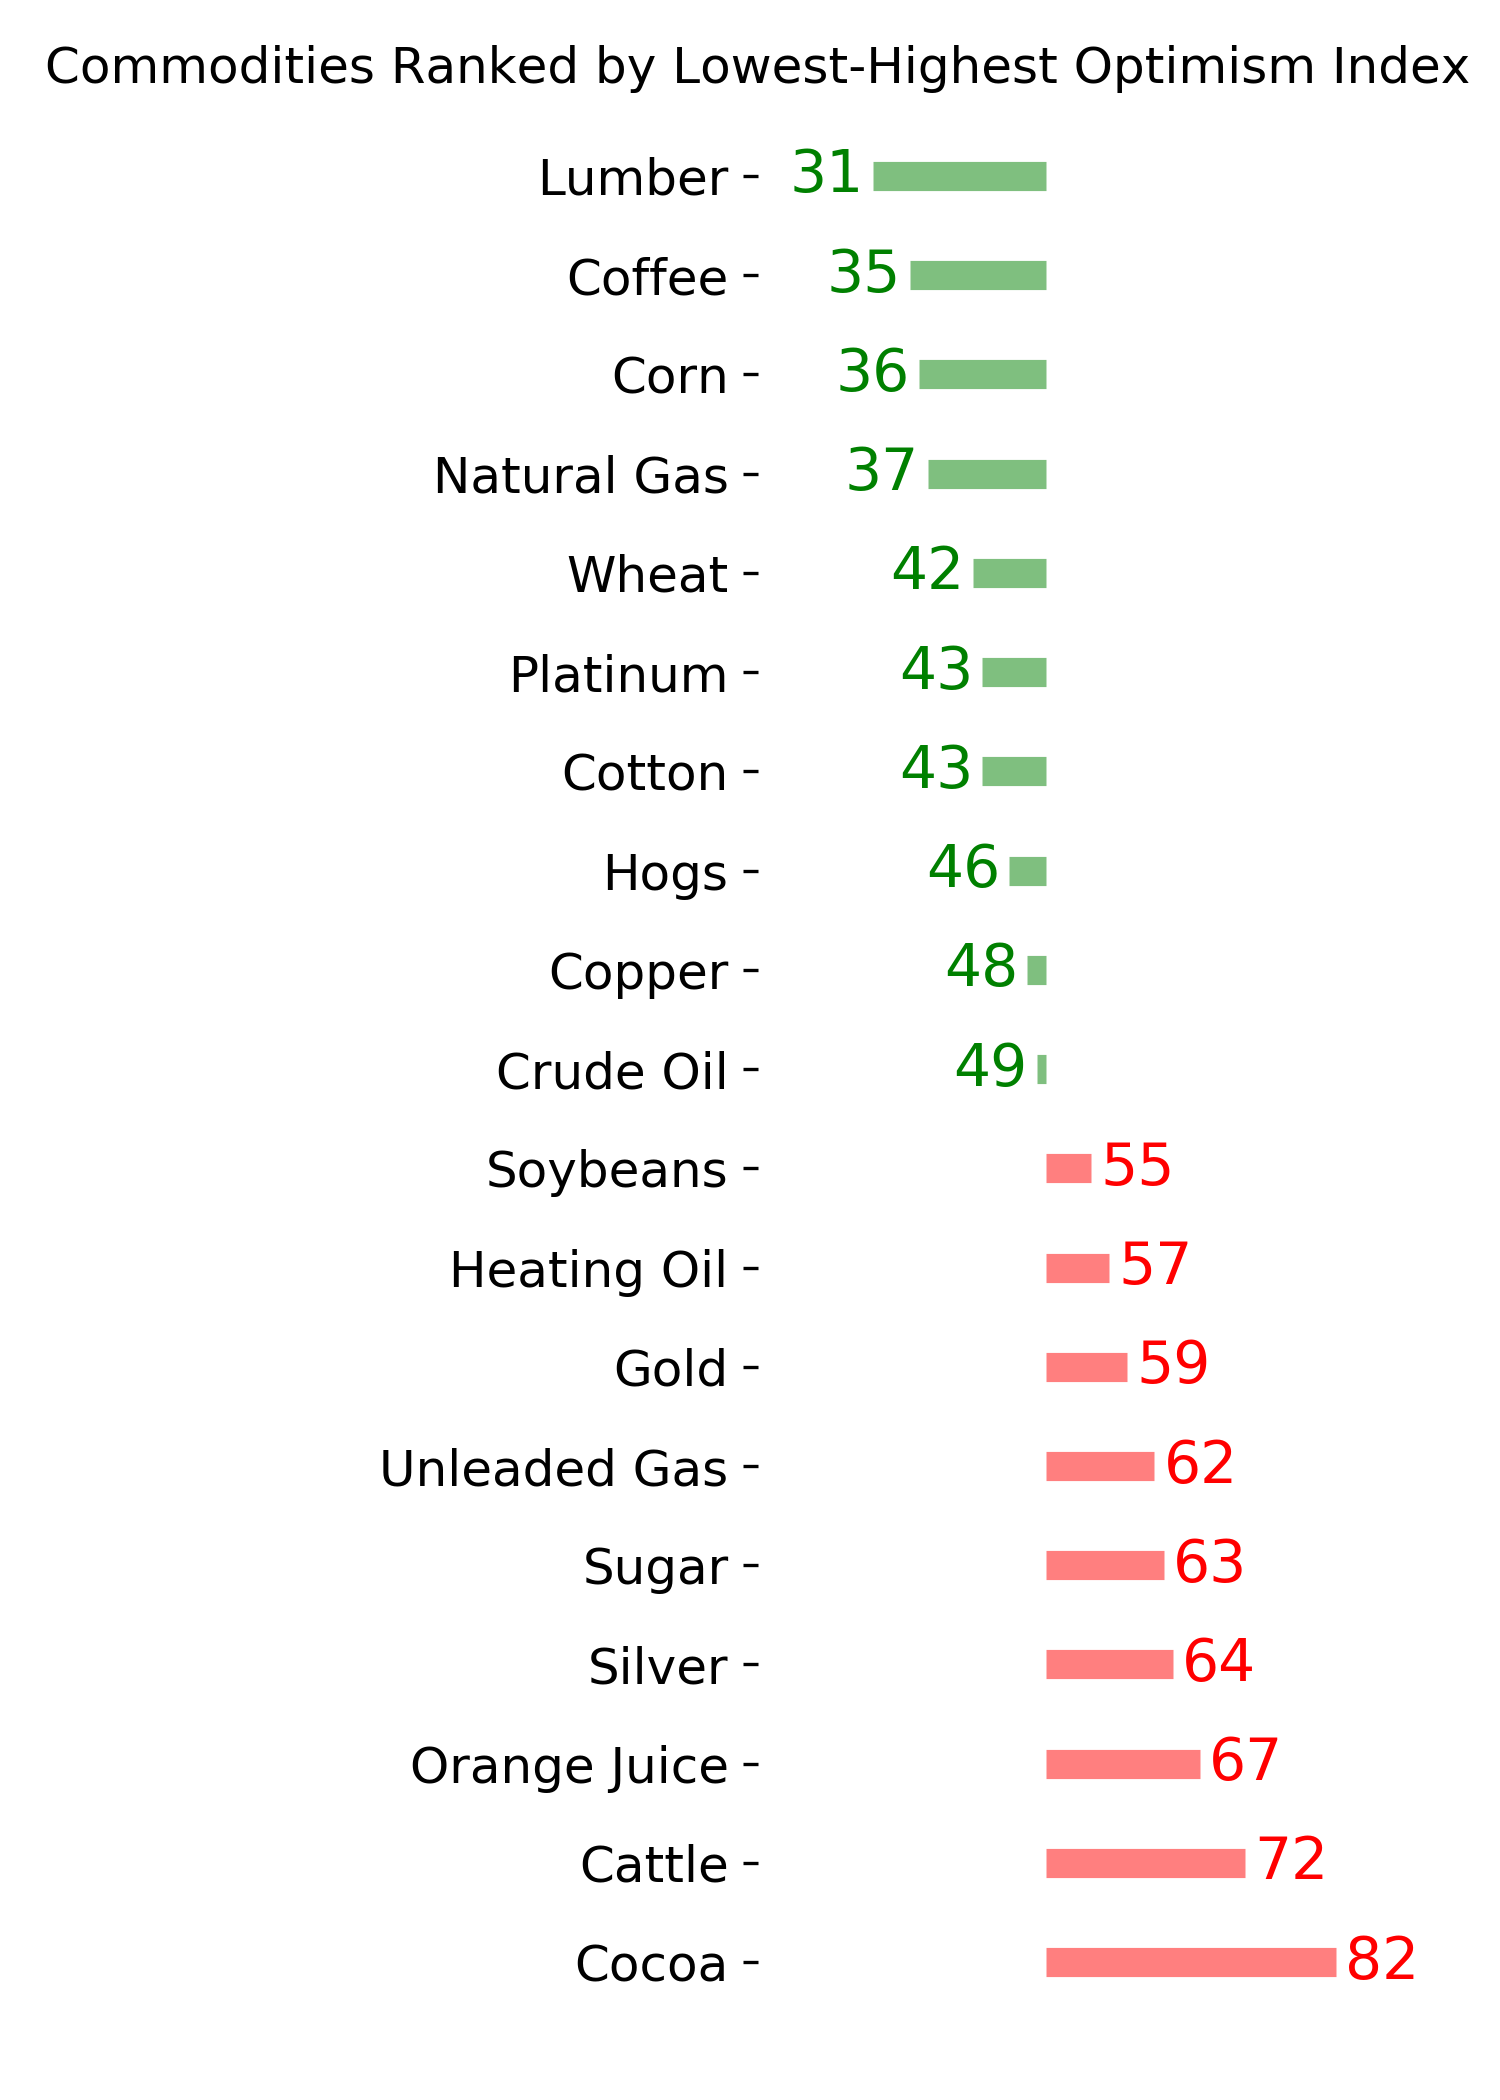
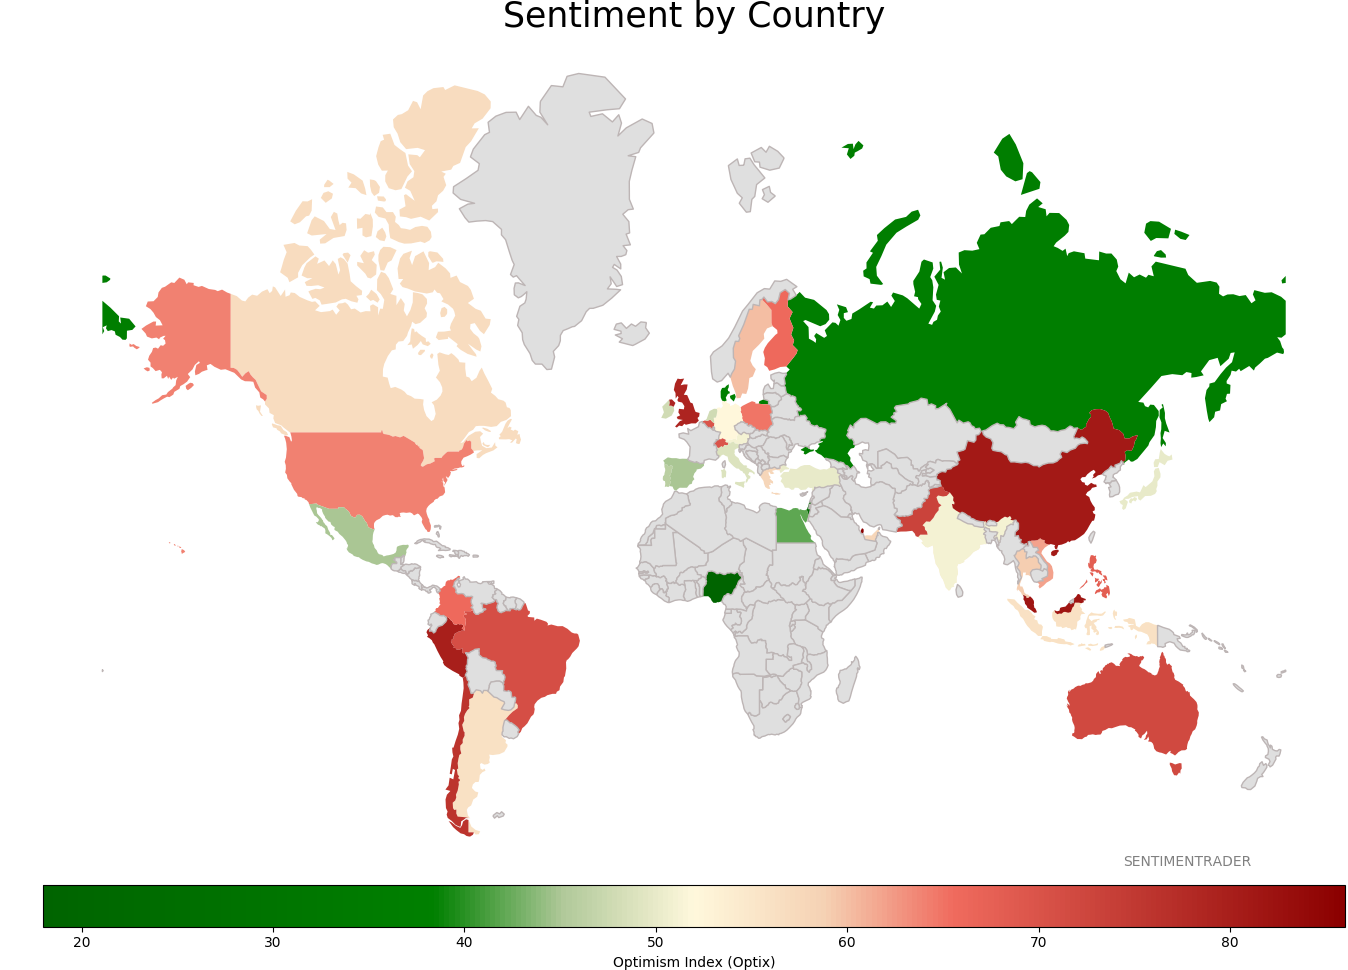
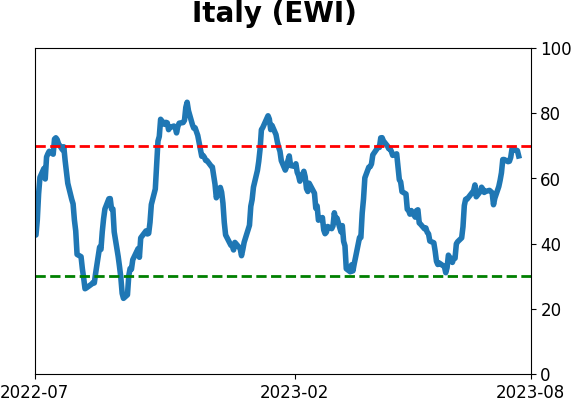
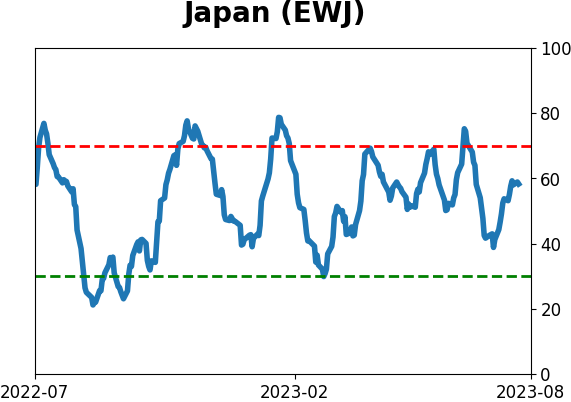
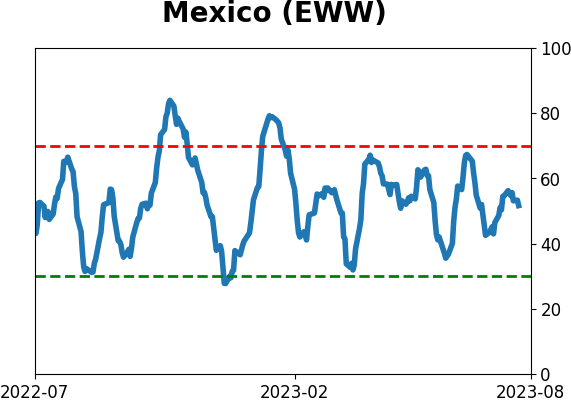
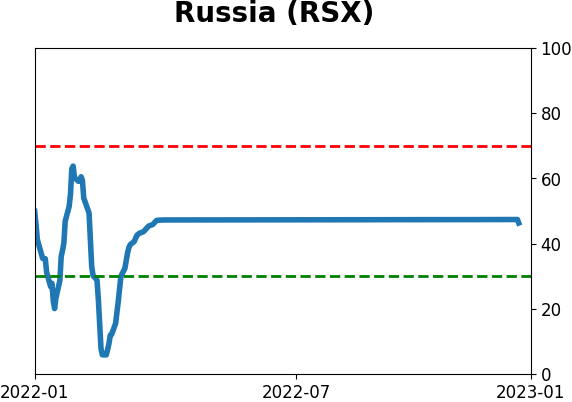
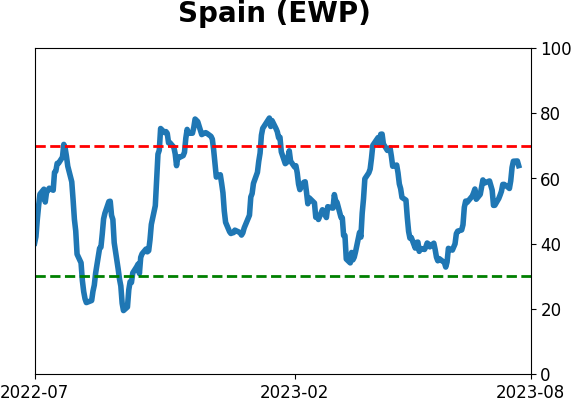
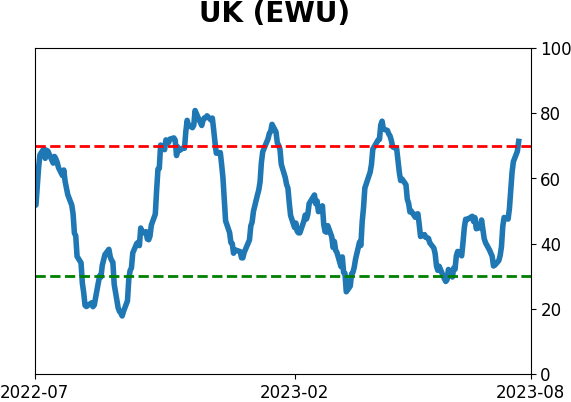
Sentiment Around The World
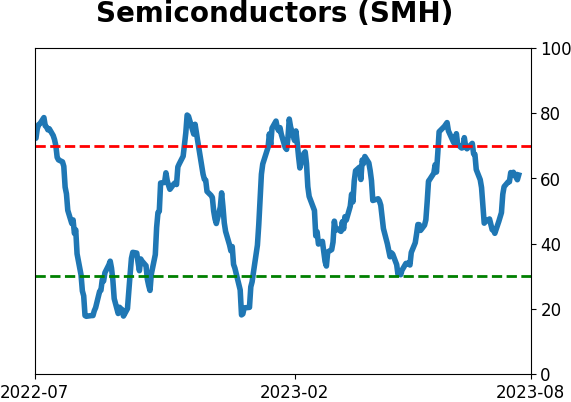
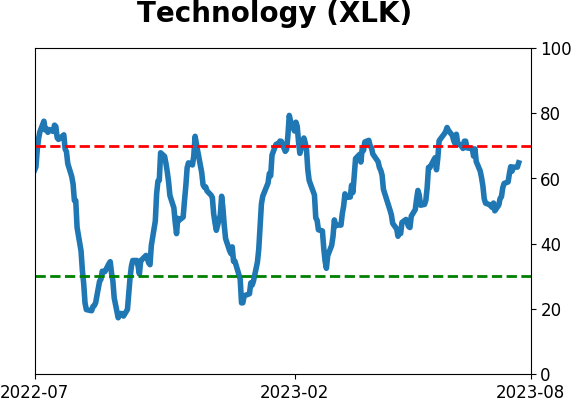
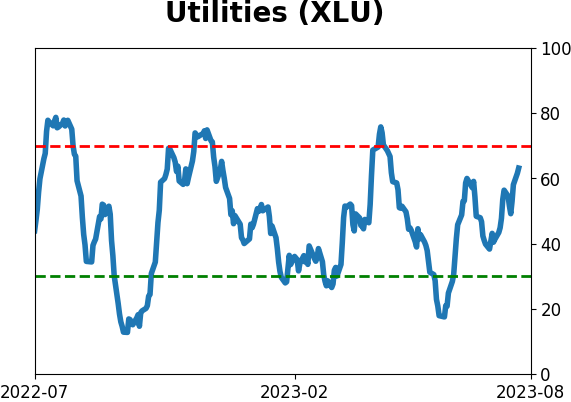
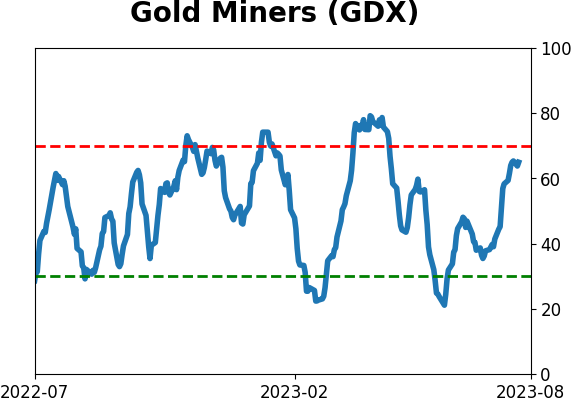
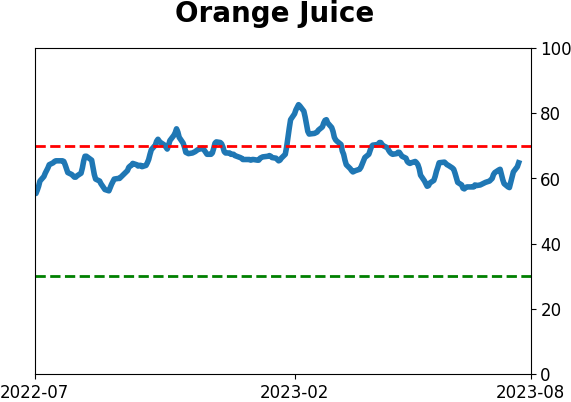
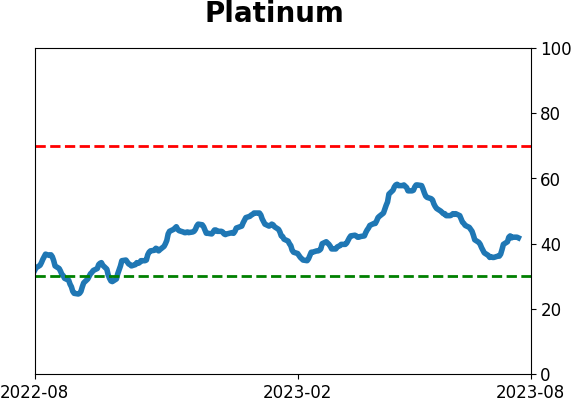
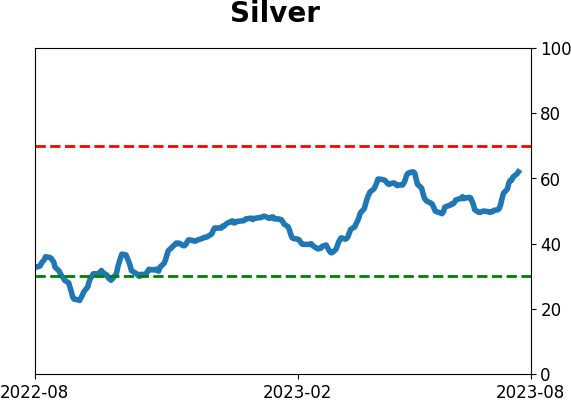
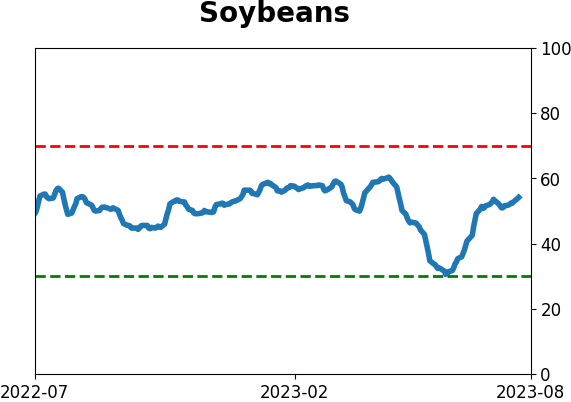
Optimism Index Thumbnails
|
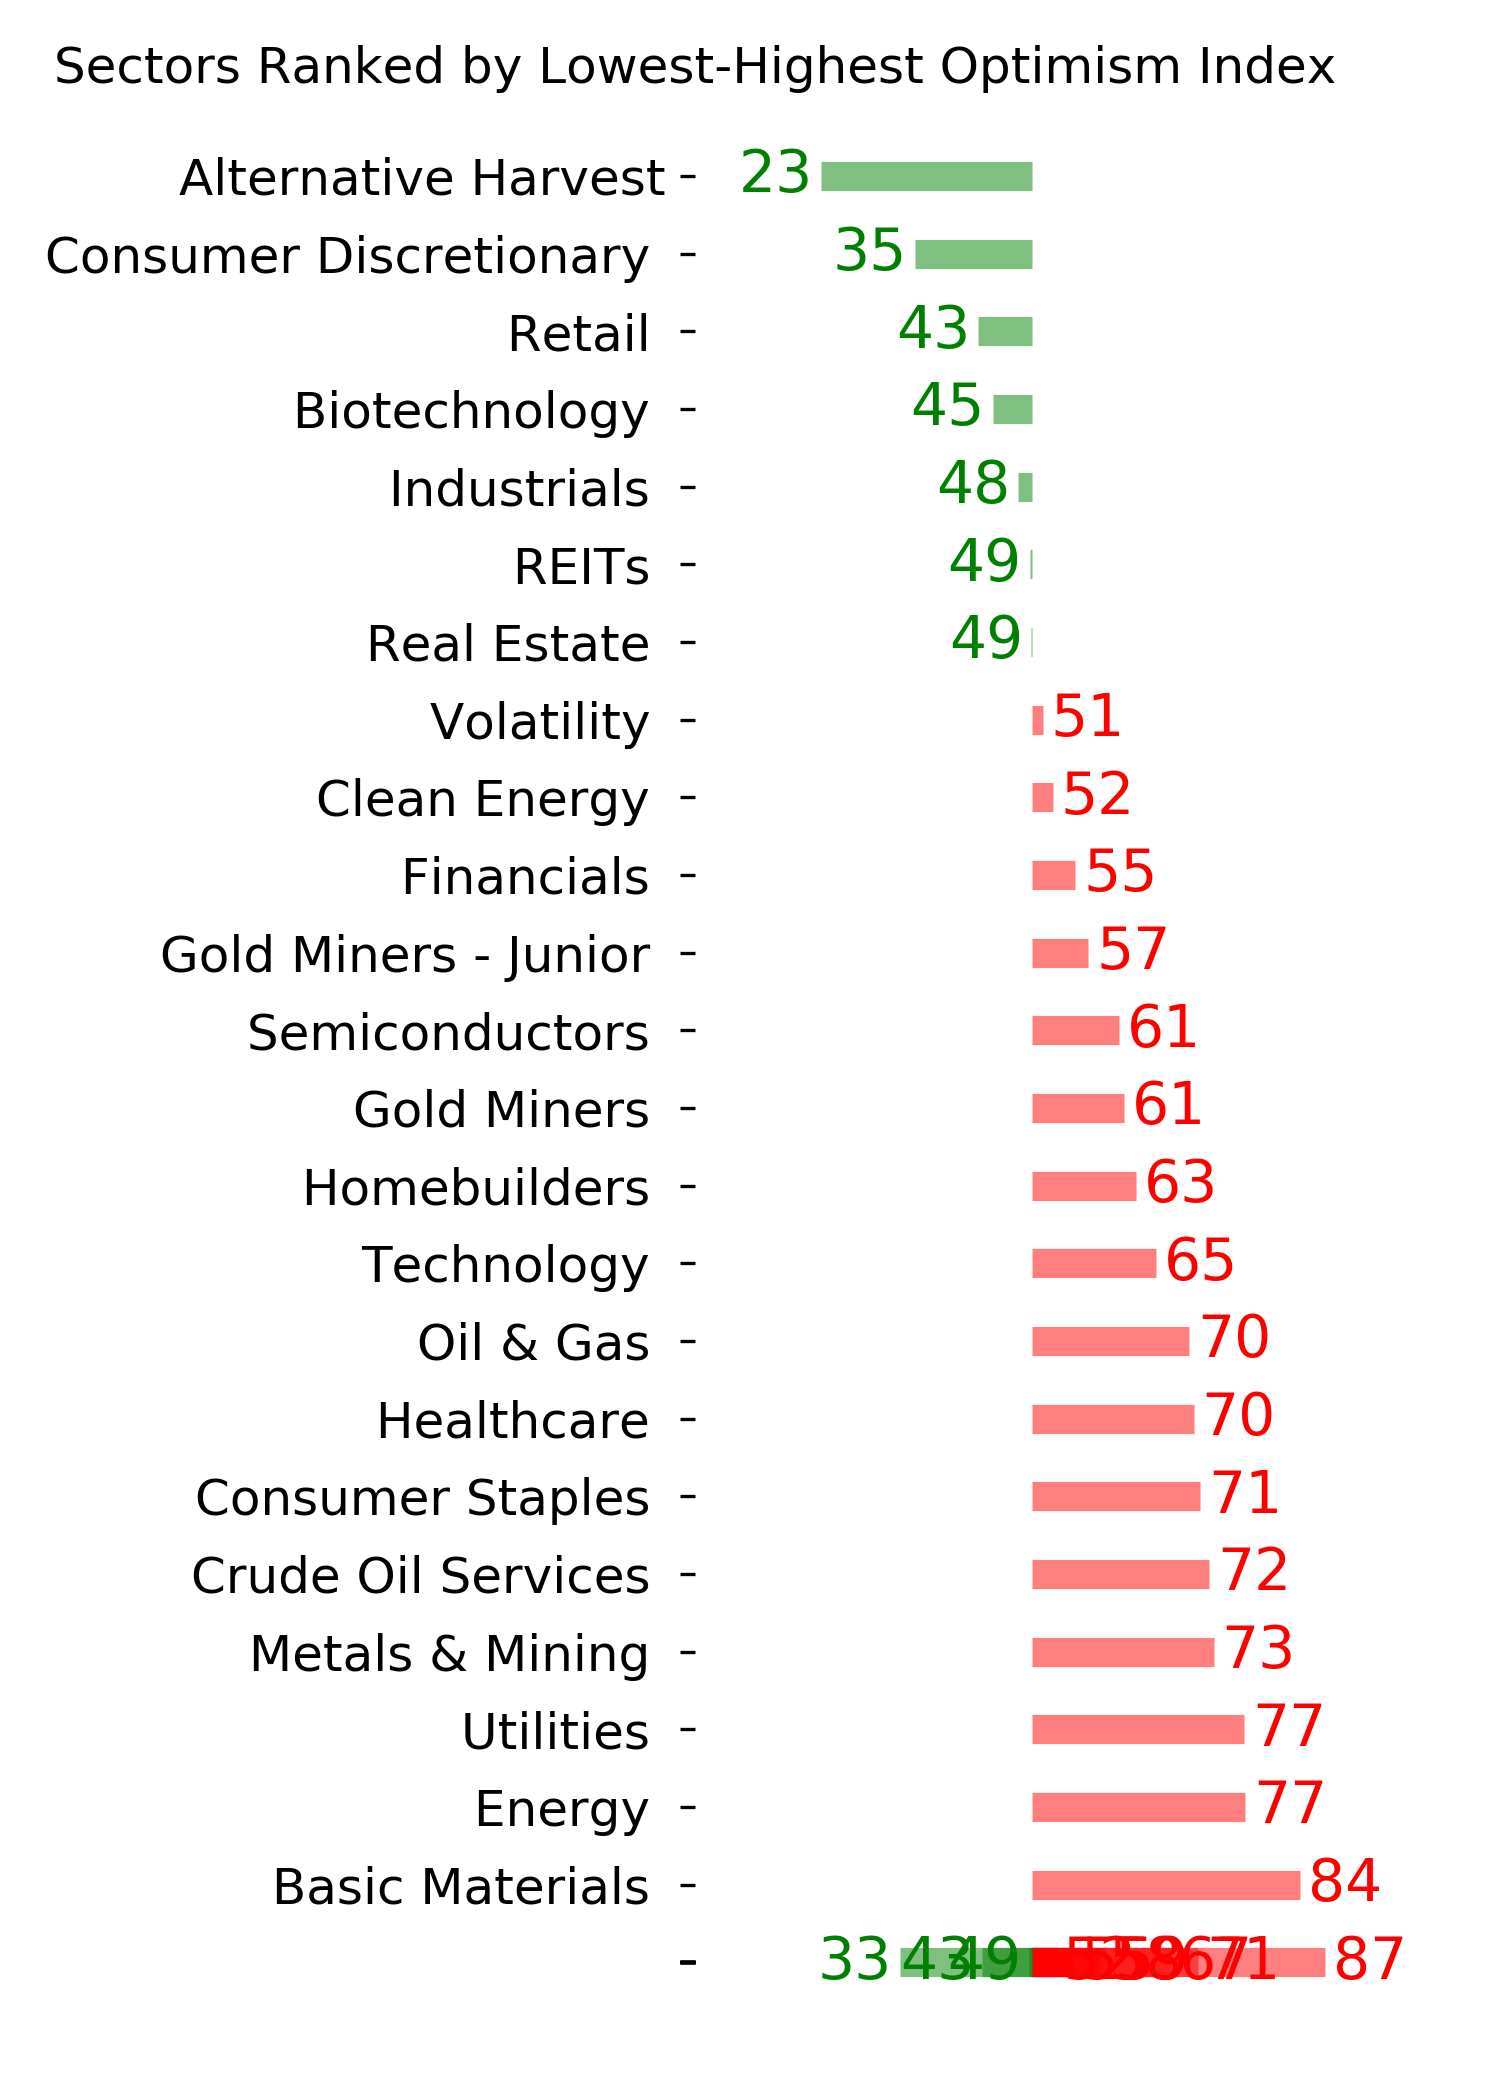
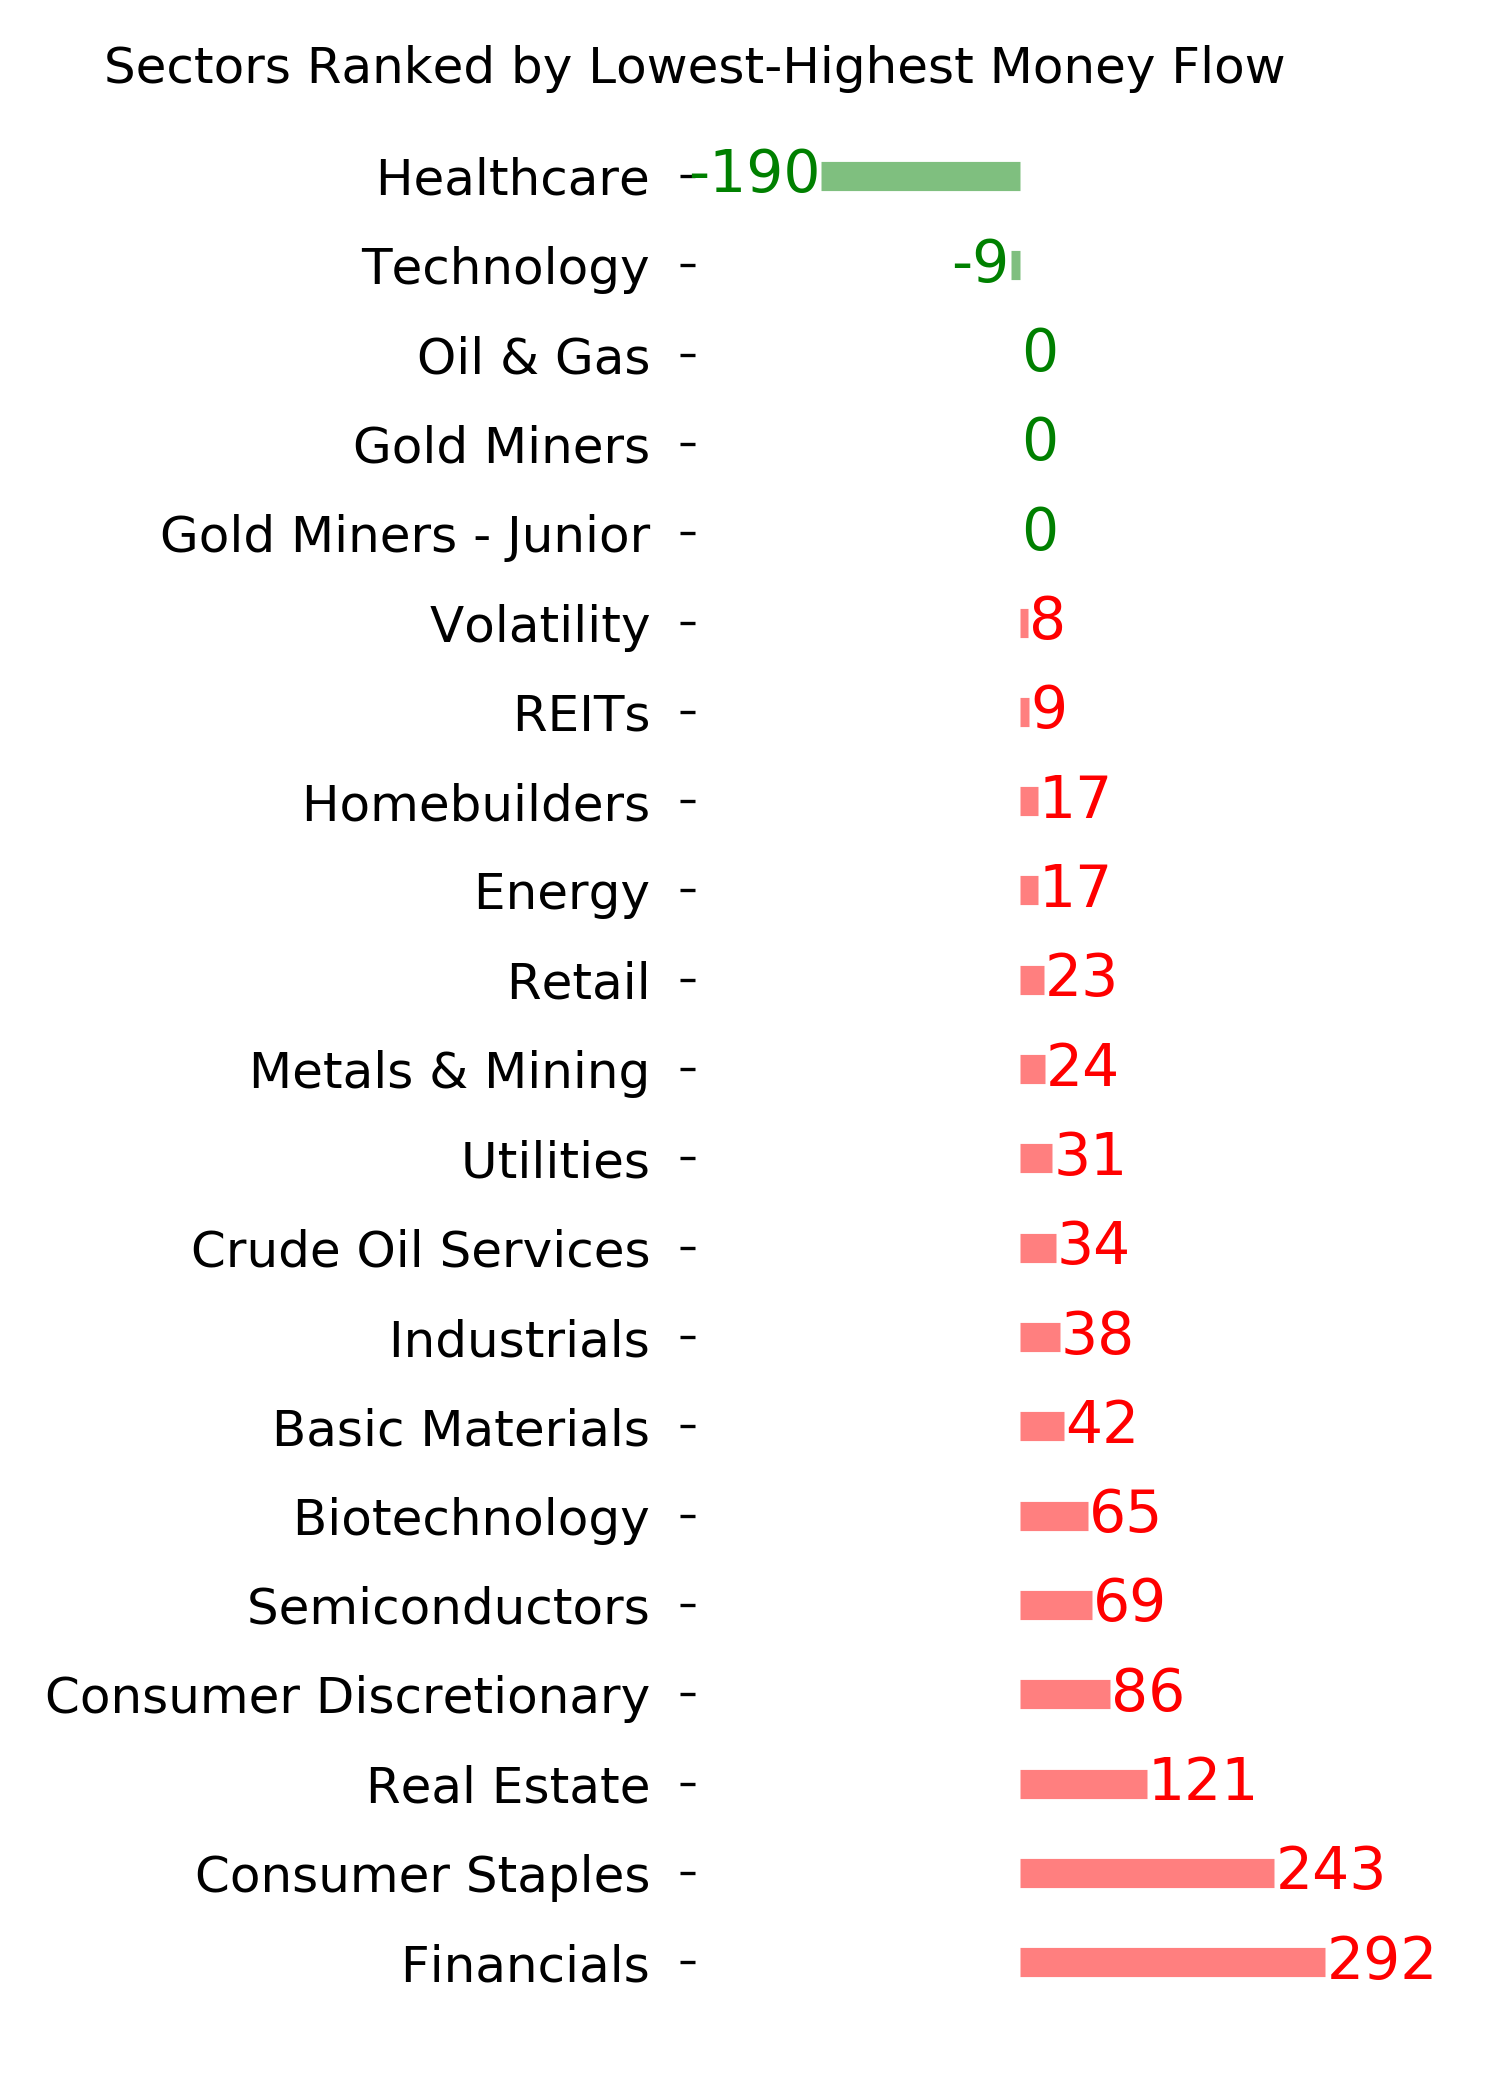
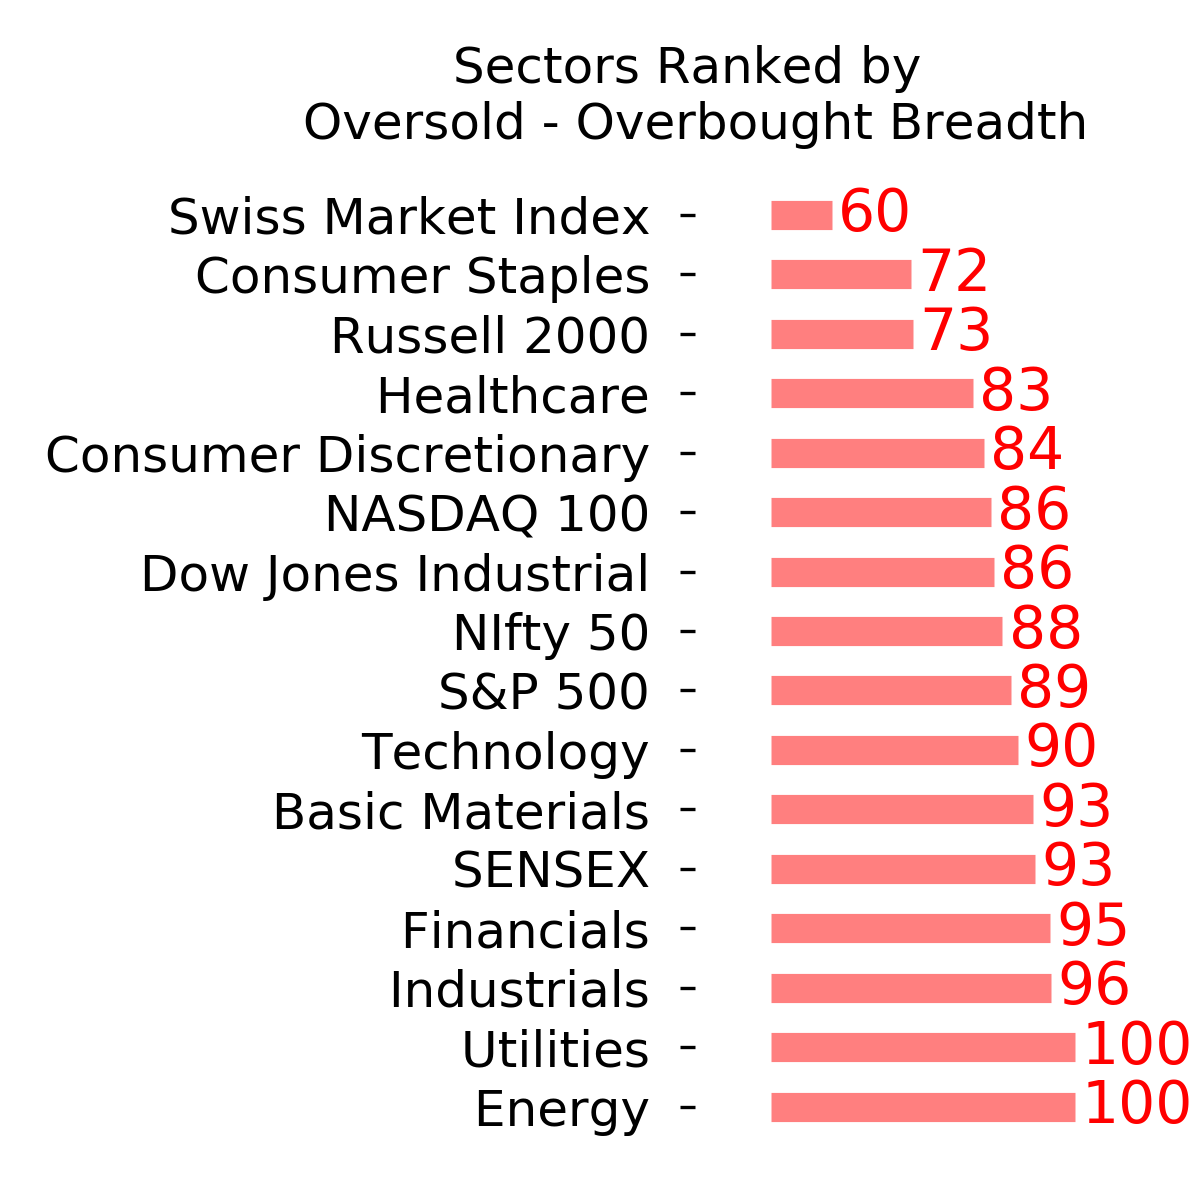
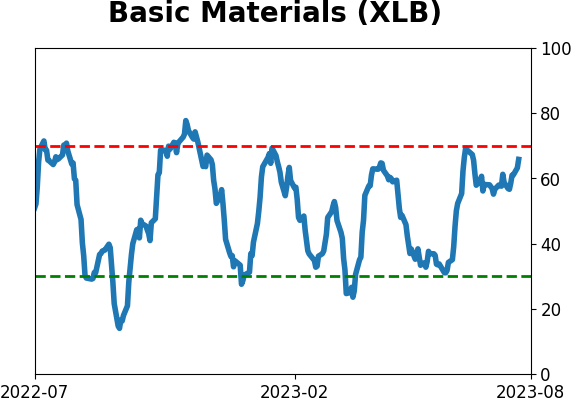
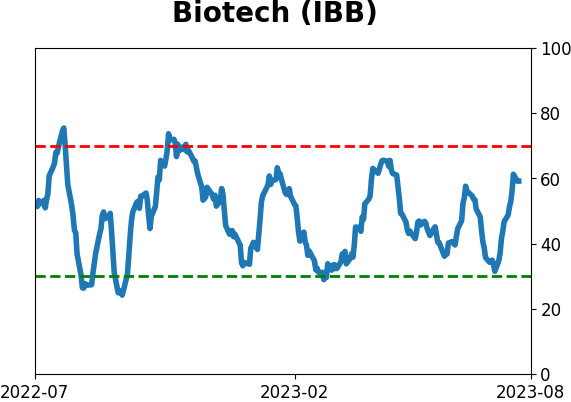
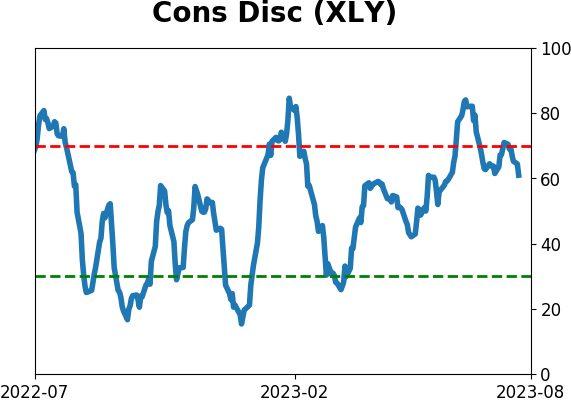
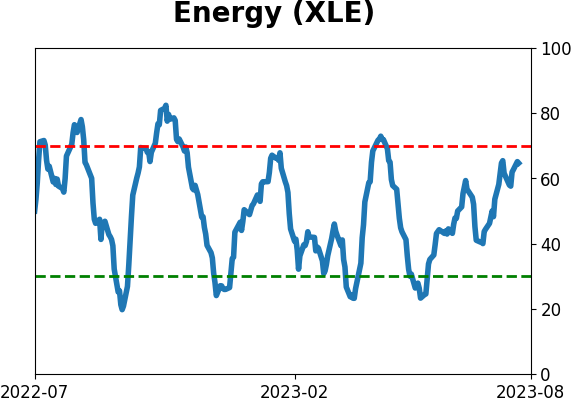
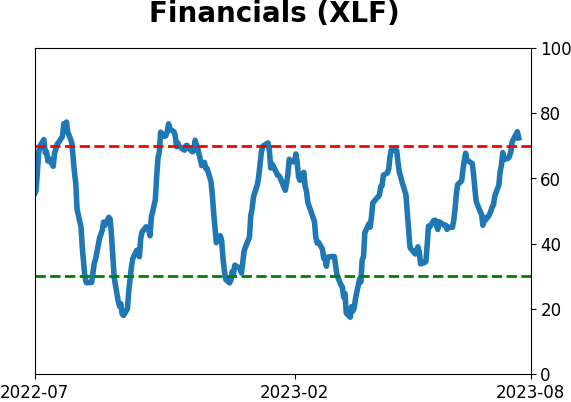
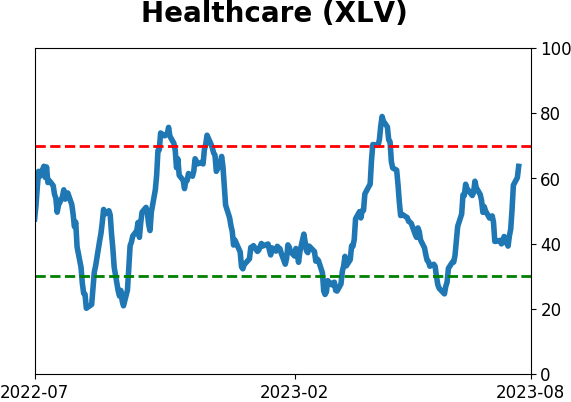
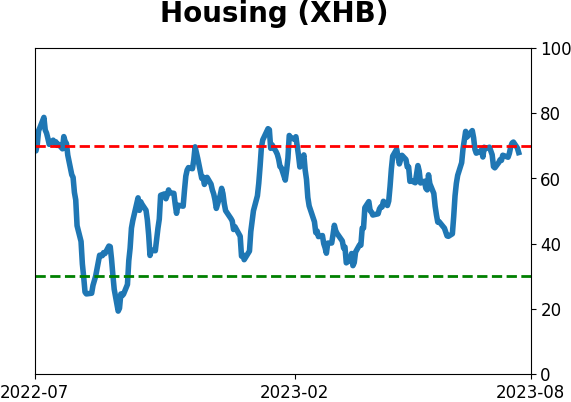
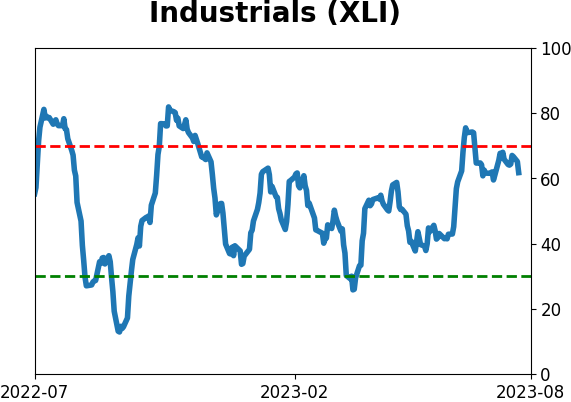
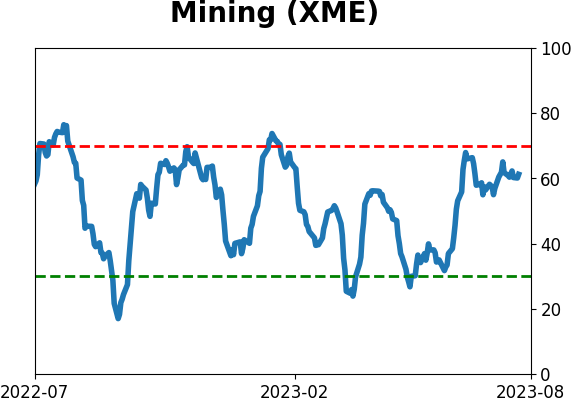
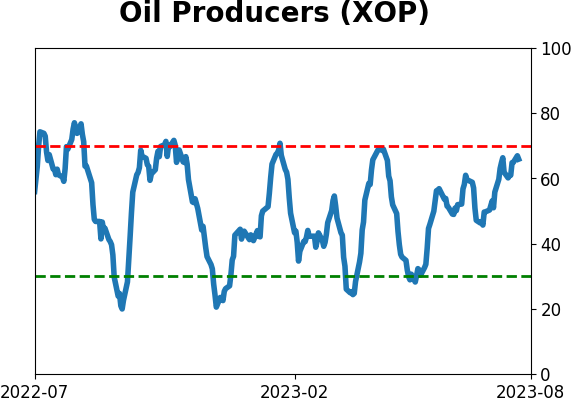
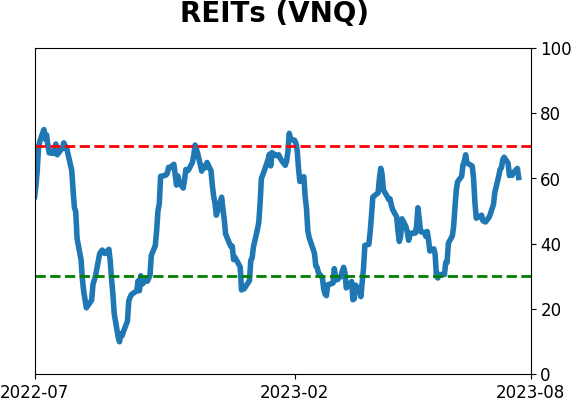
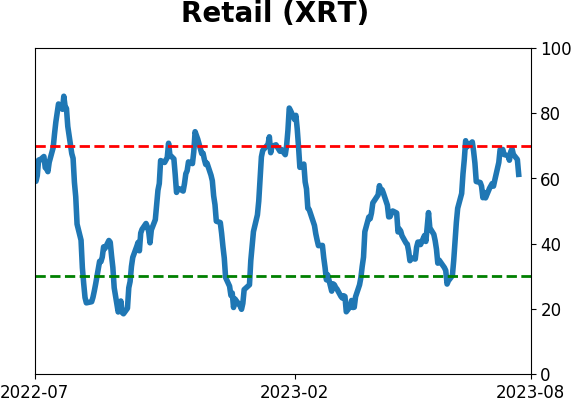
Sector ETF's - 10-Day Moving Average
|
|
|
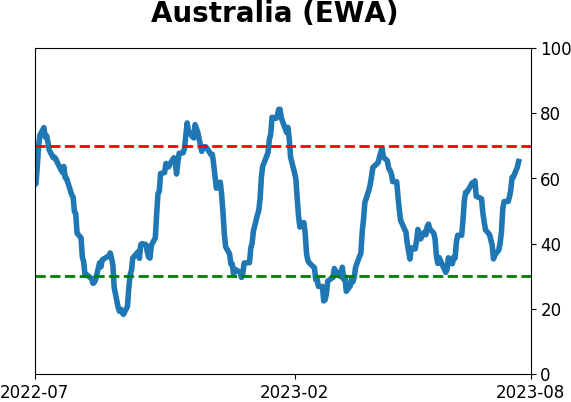
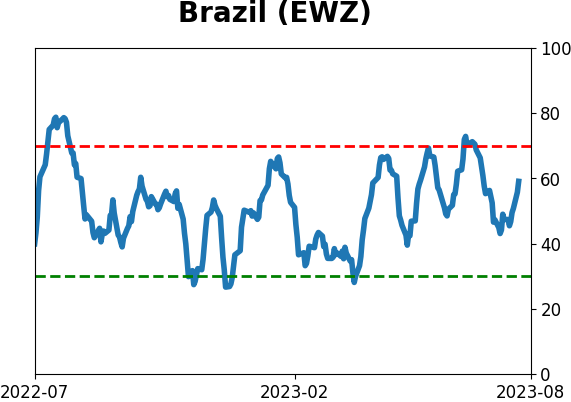
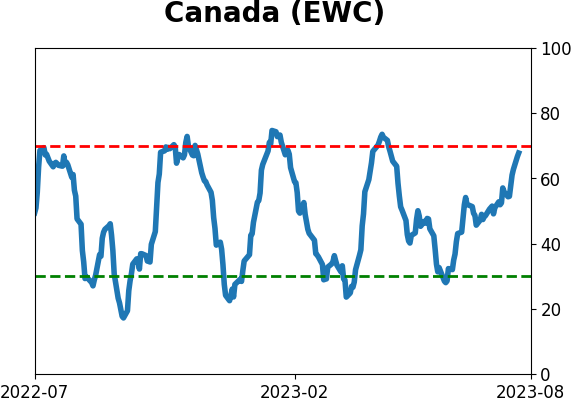
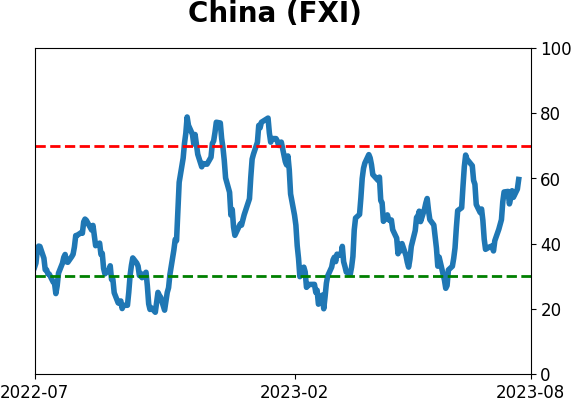
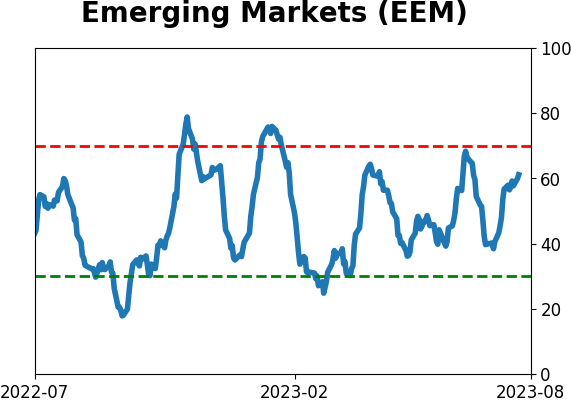
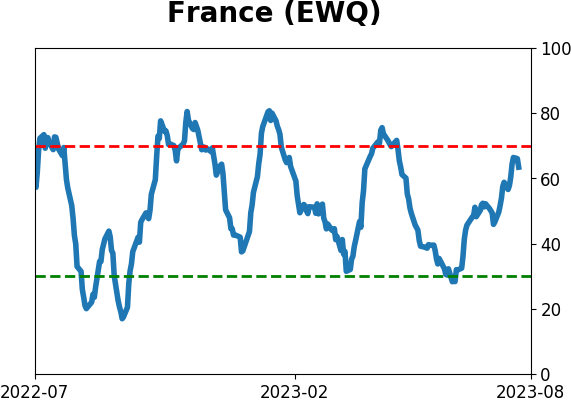
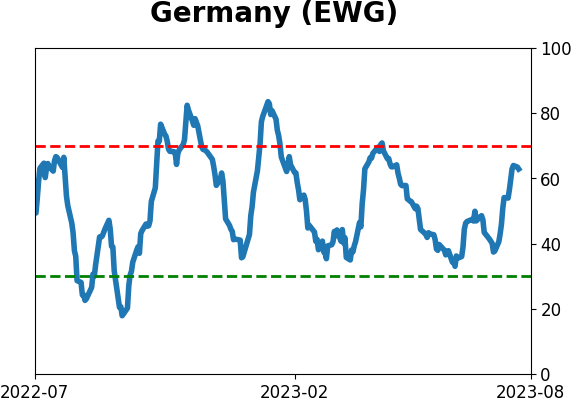
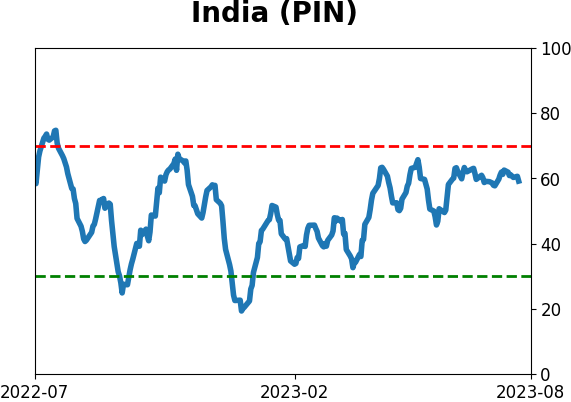
Country ETF's - 10-Day Moving Average
|
|
|
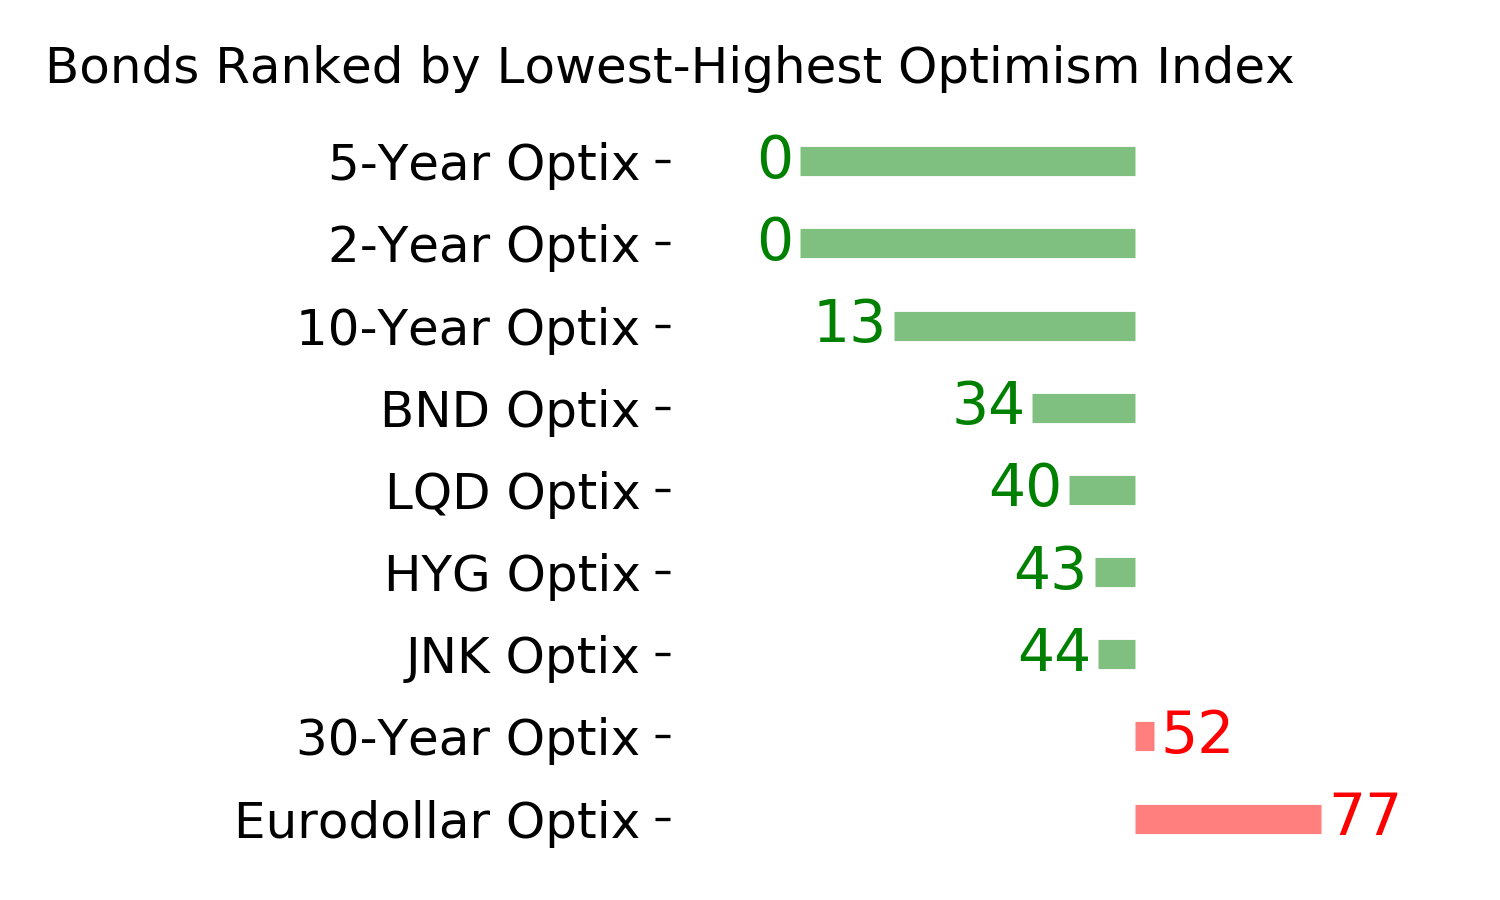
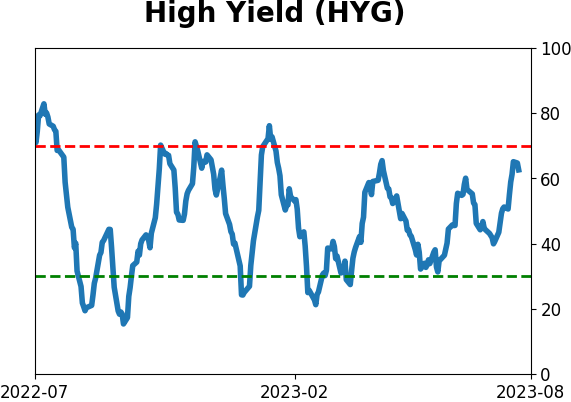
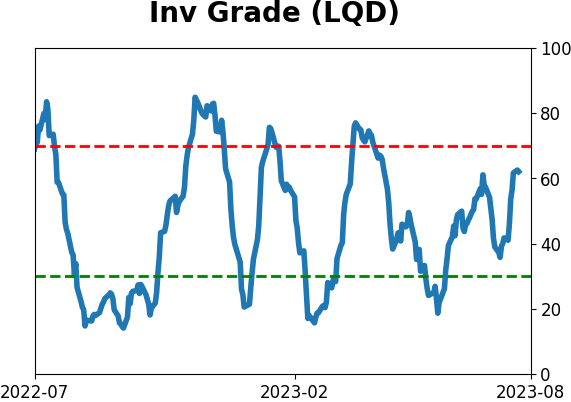
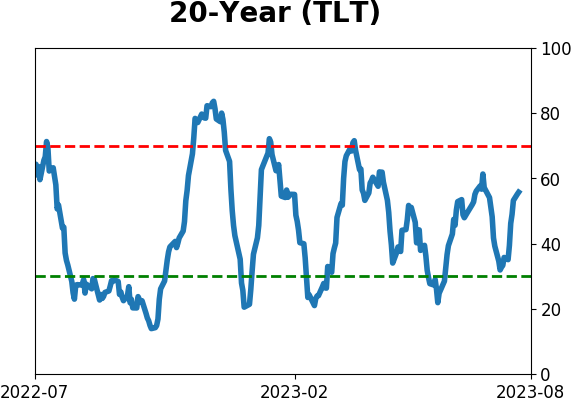
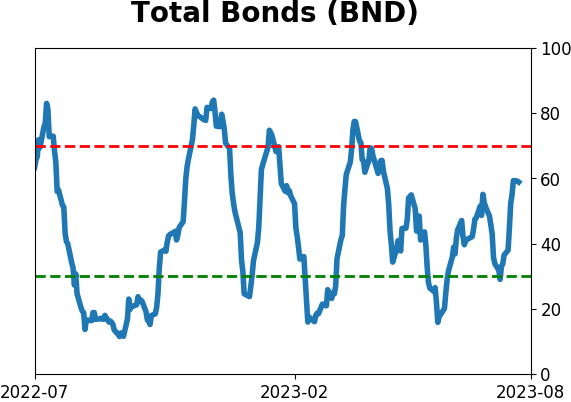
Bond ETF's - 10-Day Moving Average
|
|
|
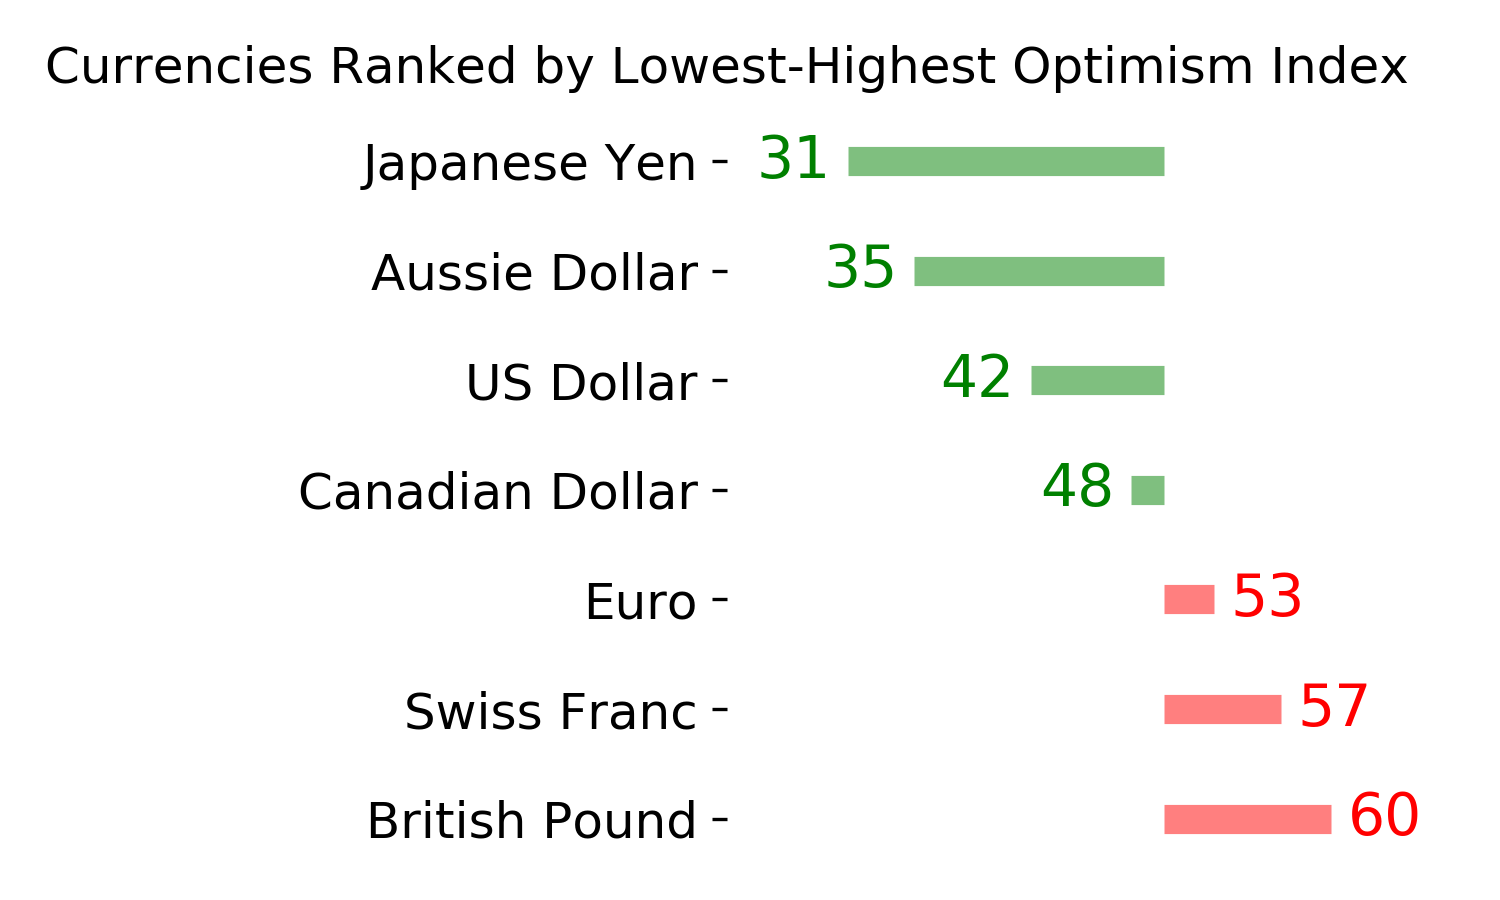
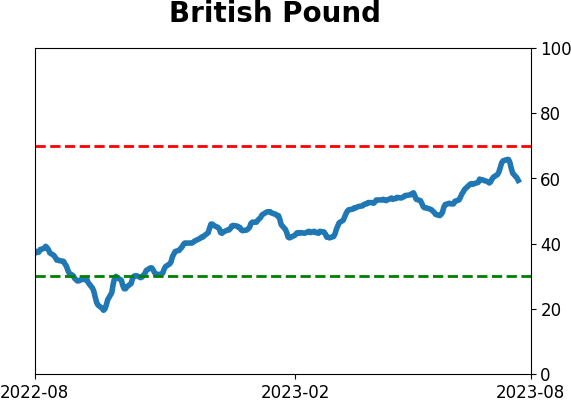
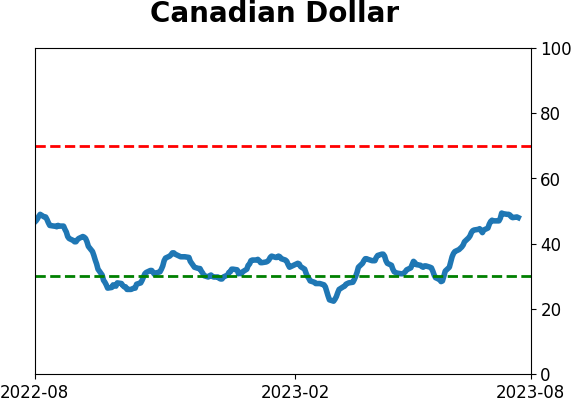
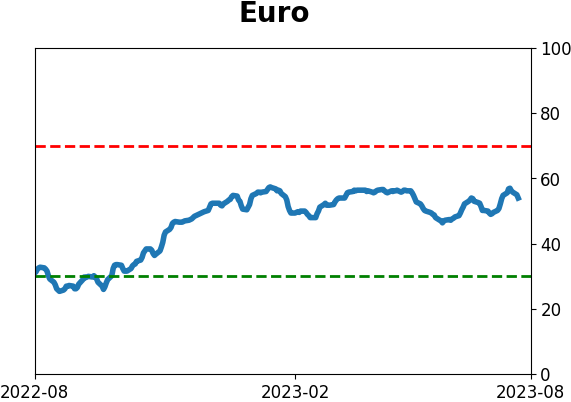
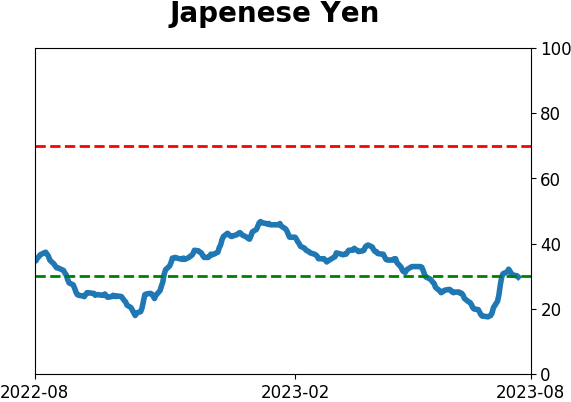
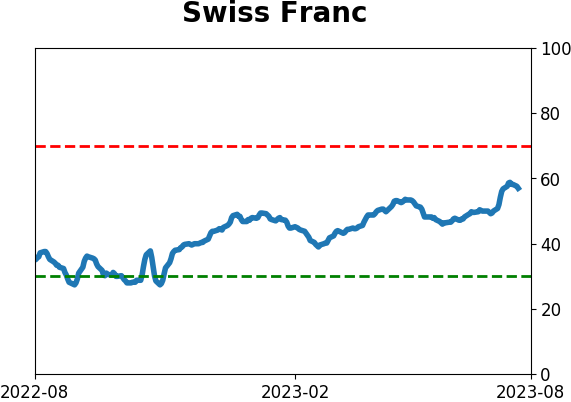
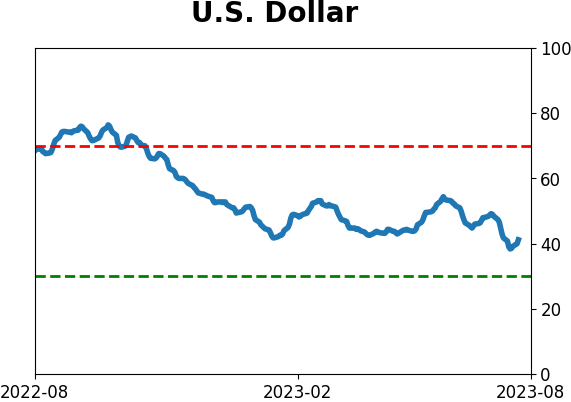
Currency ETF's - 5-Day Moving Average
|
|
|
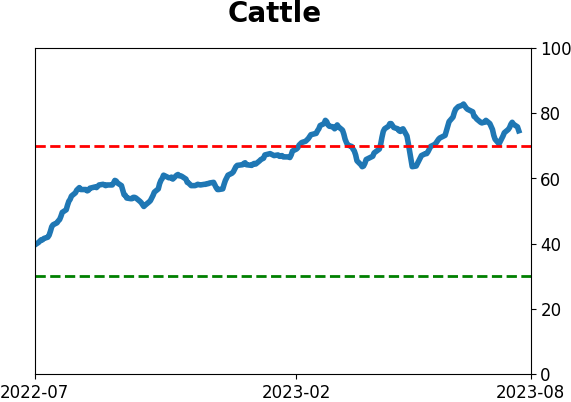
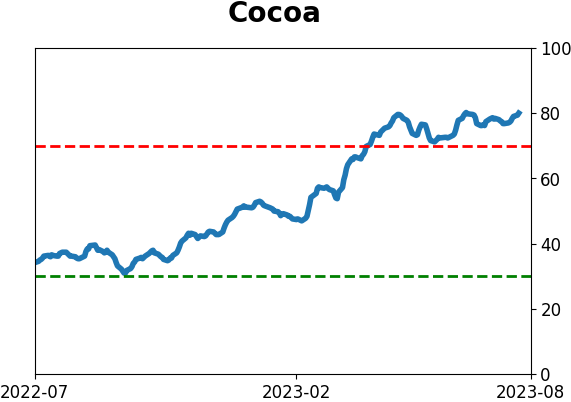
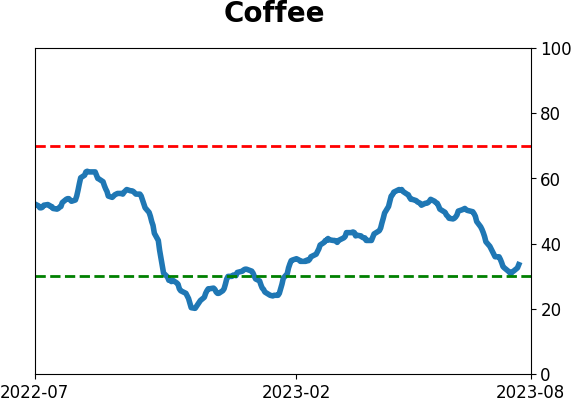
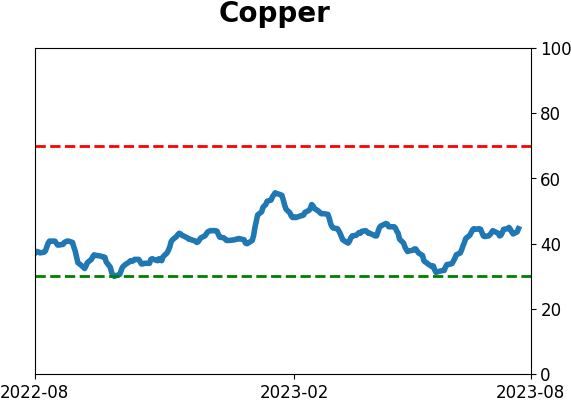
Commodity ETF's - 5-Day Moving Average
|
|