Headlines
|
|
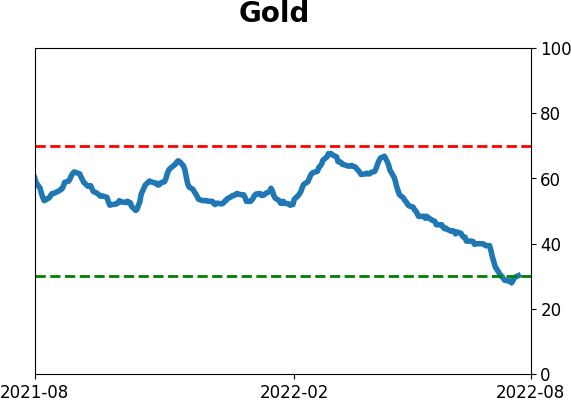
Traders bet that gold and miners will continue a historic plunge:
Gold and mining stocks have quite a few factors pointing to a rally. The biggest problem with that is they also had these a few weeks ago, and yet miners continue to see selling pressure. This is one of those markets where "extreme can always get more extreme" gets proven with regularity, and traders are betting the decline will continue.
|
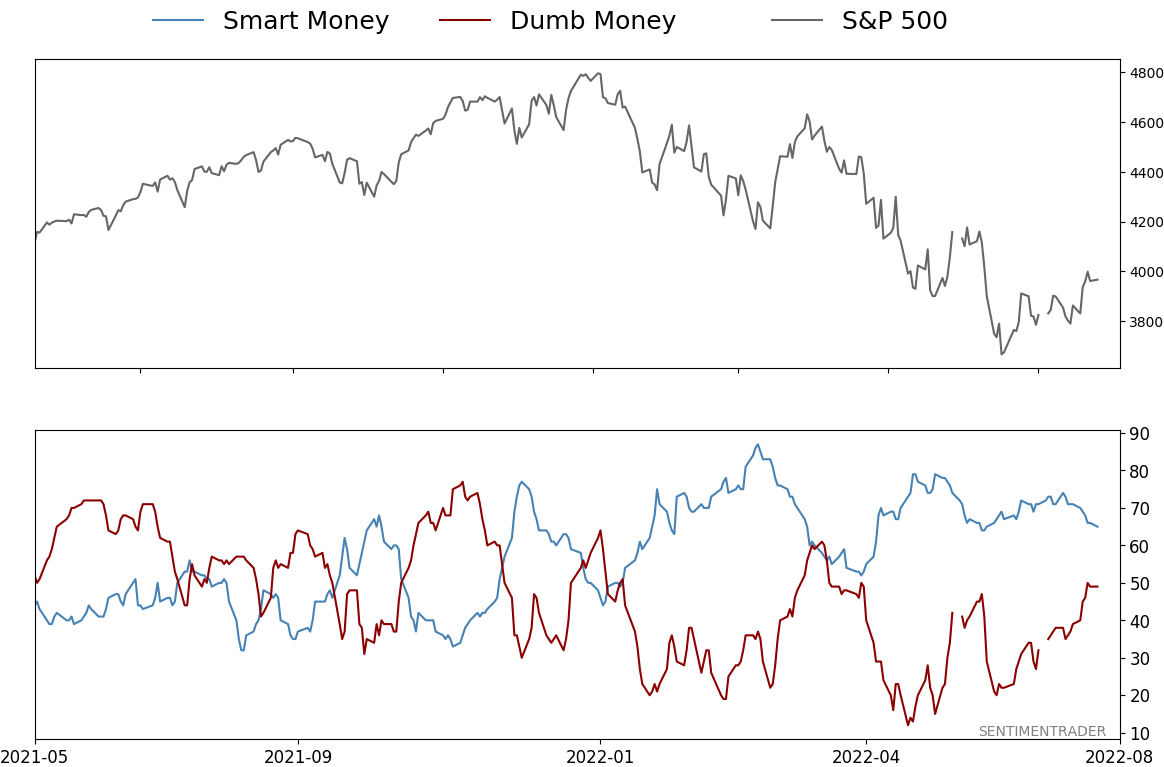
Smart / Dumb Money Confidence
|
Smart Money Confidence: 65%
Dumb Money Confidence: 49%
|
|
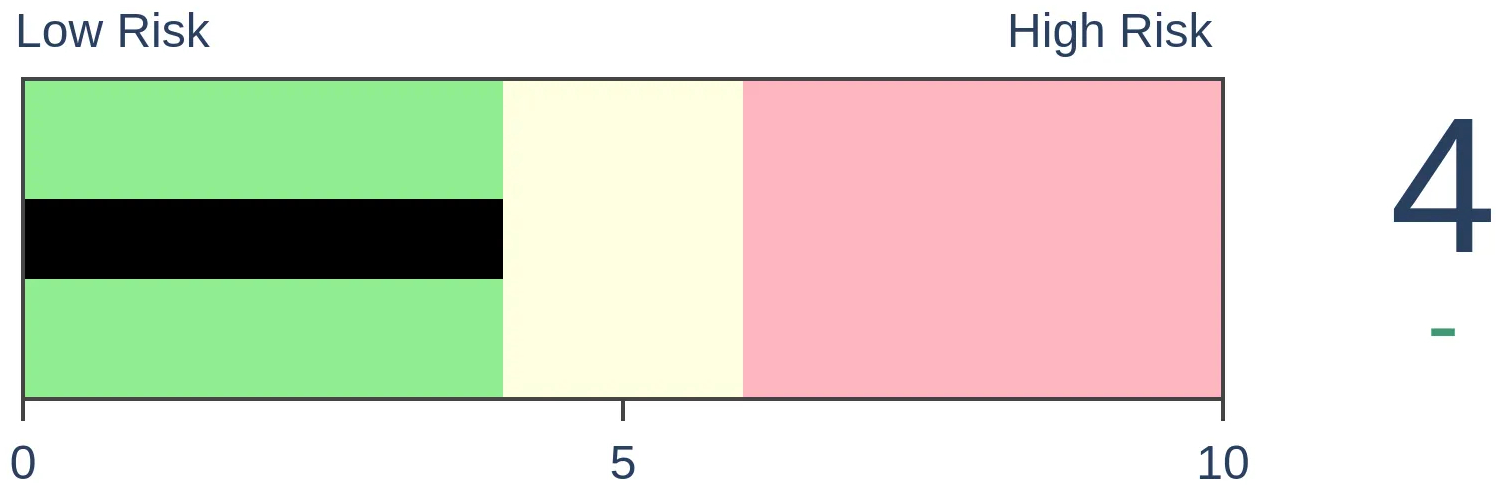
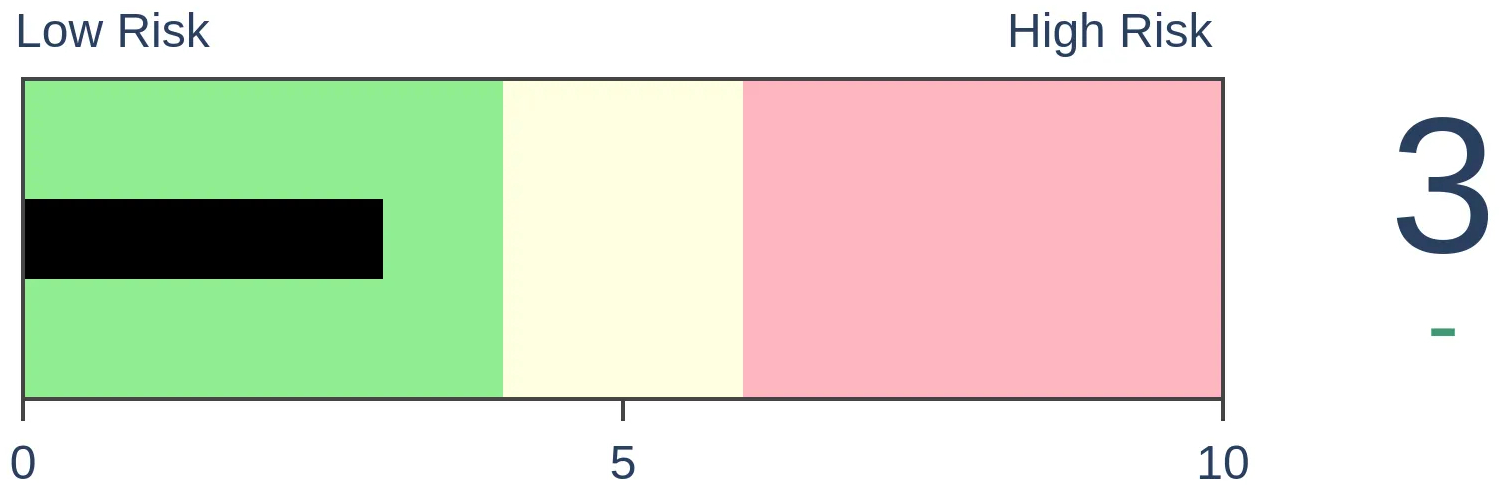
Risk Levels
Stocks Short-Term
|
Stocks Medium-Term

|
|
Bonds
|
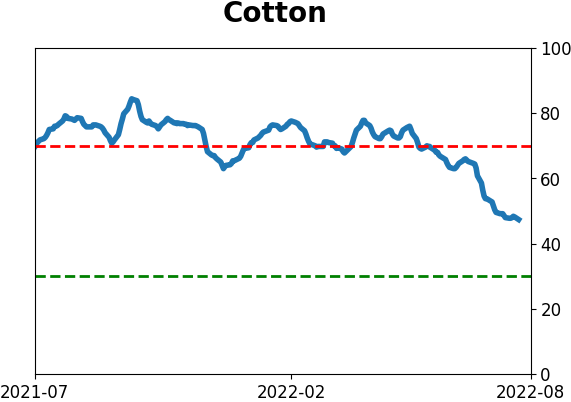
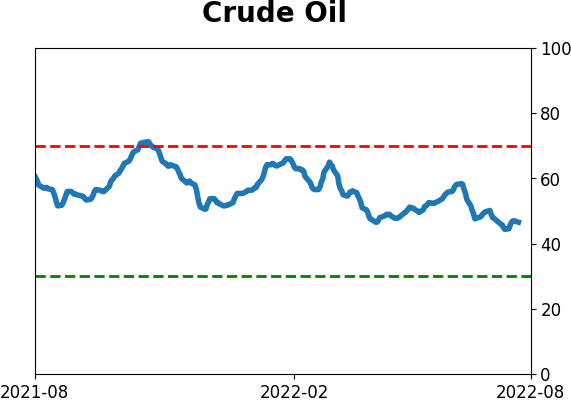
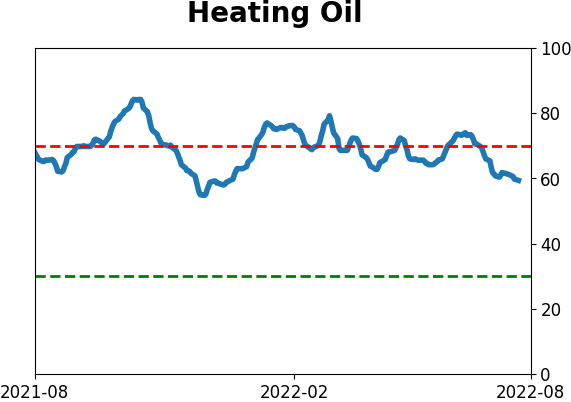
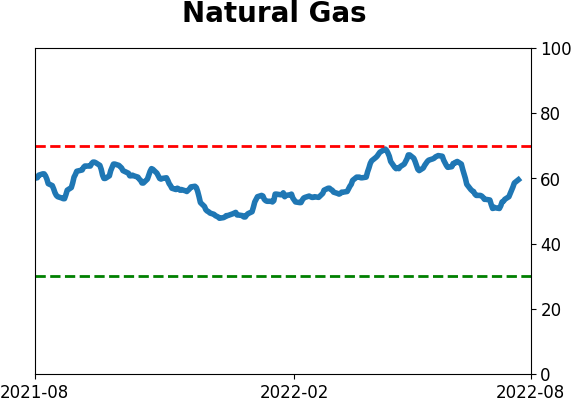
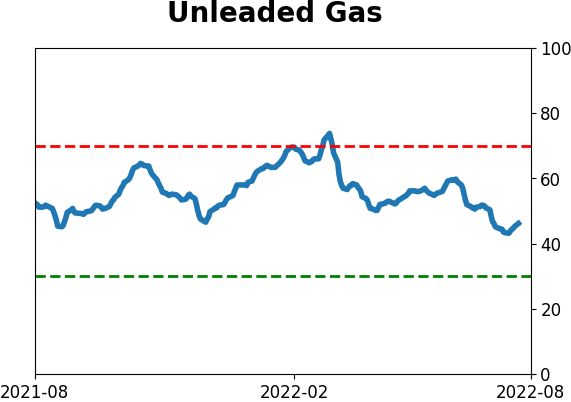
Crude Oil
|
|
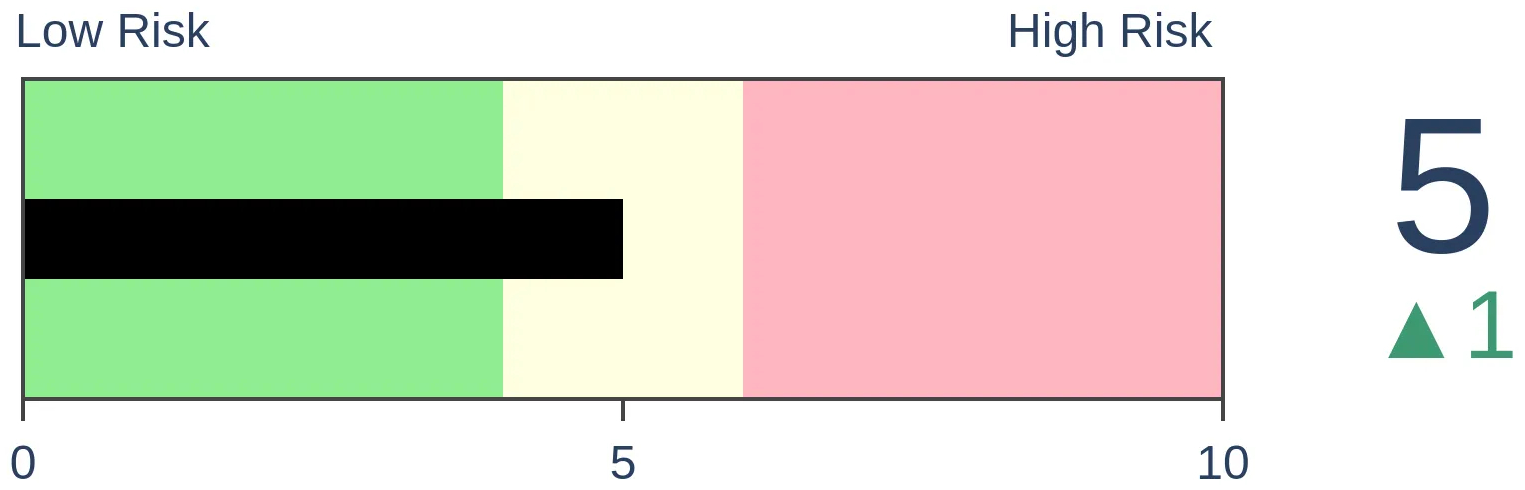
Gold
|
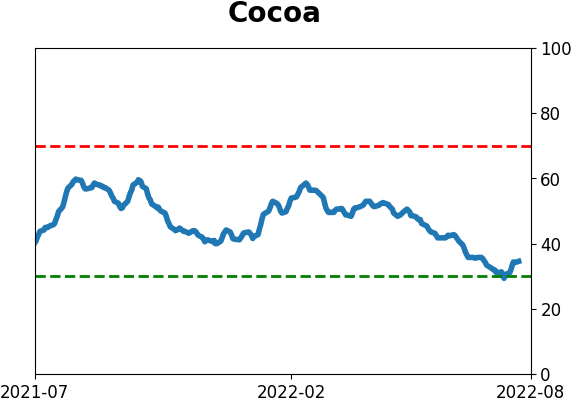
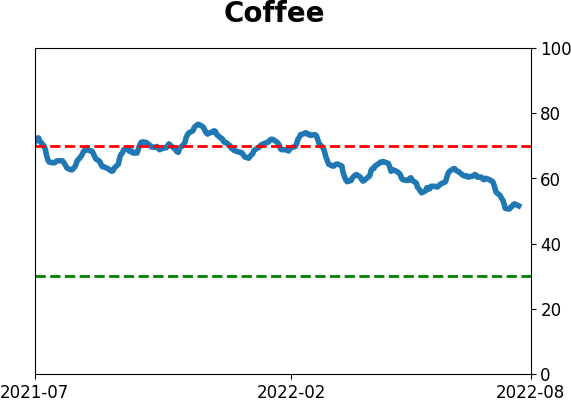
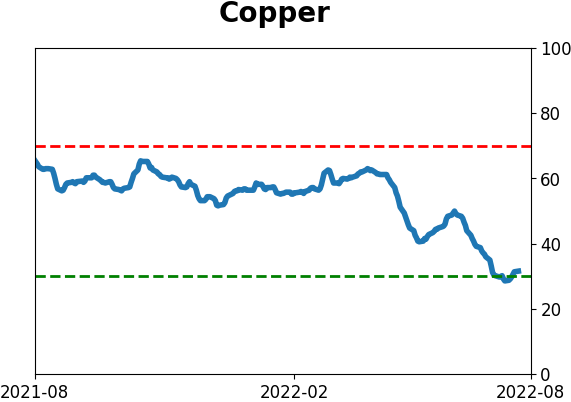
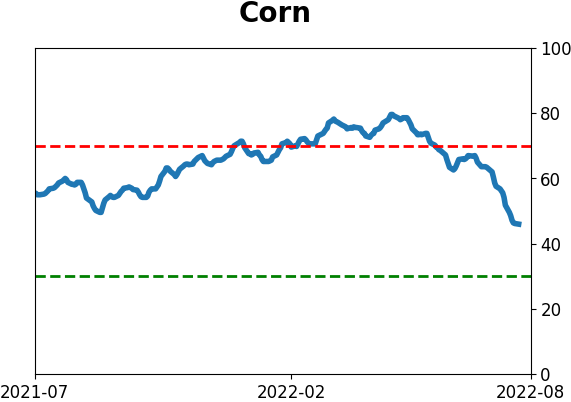
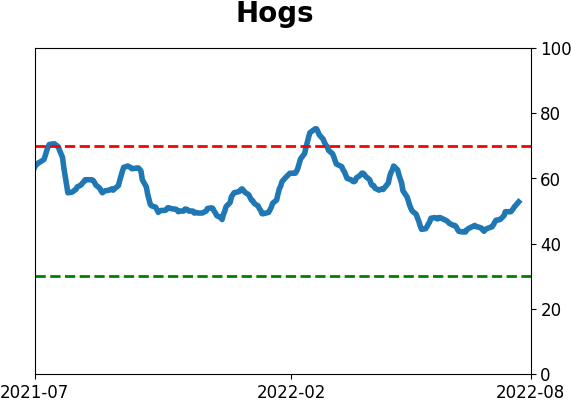
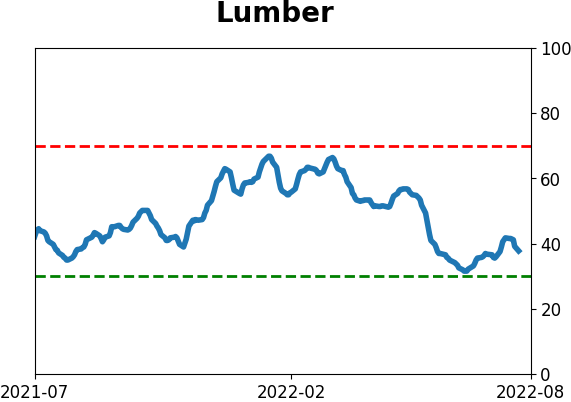
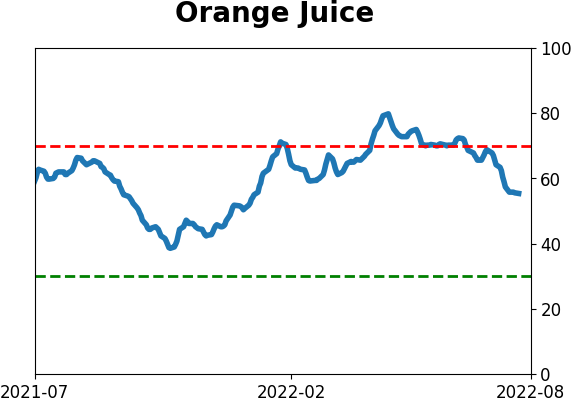
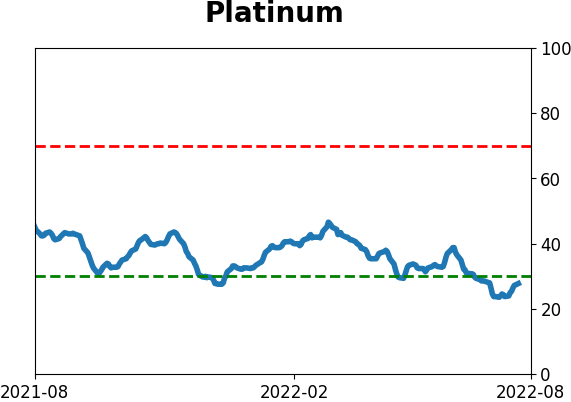
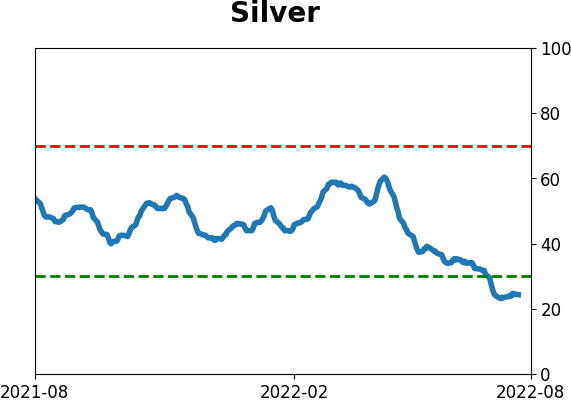
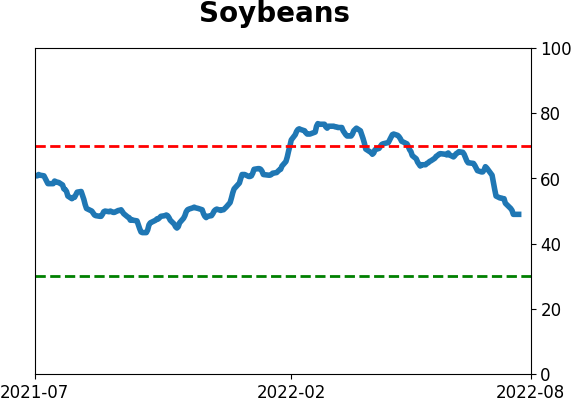
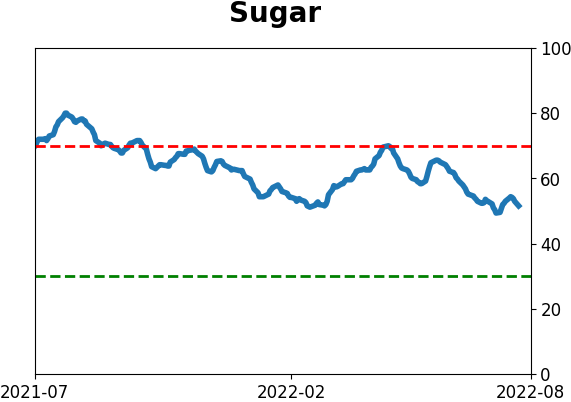
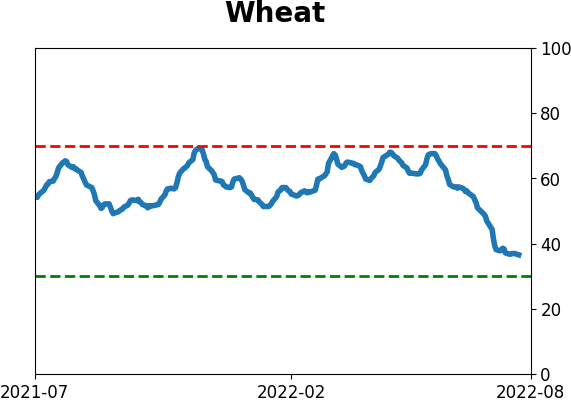
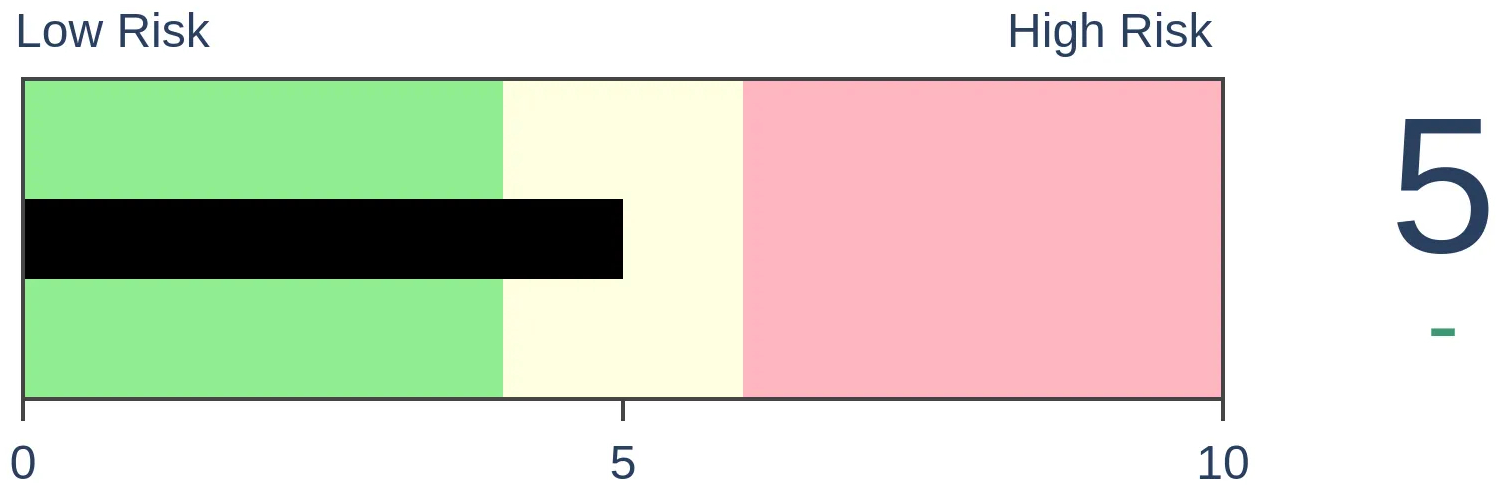
Agriculture

|
|
Research
By Jason Goepfert
BOTTOM LINE
Gold and mining stocks have quite a few factors pointing to a rally. The biggest problem with that is they also had these a few weeks ago, and yet miners continue to see selling pressure. This is one of those markets where "extreme can always get more extreme" gets proven with regularity, and traders are betting the decline will continue.
FORECAST / TIMEFRAME
None
|
Key points:
- Gold and mining stocks have suffered a steady plunge twice in recent months
- The decline triggered a sustained rise in stocks falling to 52-week lows
- Traders have jumped on the idea that metals and miners will continue to decline
A historically steady plunge
There may be no more frustrating market to trade than gold, and gold mining stocks by extension. If you get the big moves right, they can be great, but much of the time, their moves have nothing to do with sentiment, valuations, technicals, or logic.
A few weeks ago, we saw that selling pressure in miners had been so severe that it triggered one of the most extreme panic breadth readings in 40 years. Every other time this has happened, miners rebounded over the next few weeks. Until this time. Sigh.
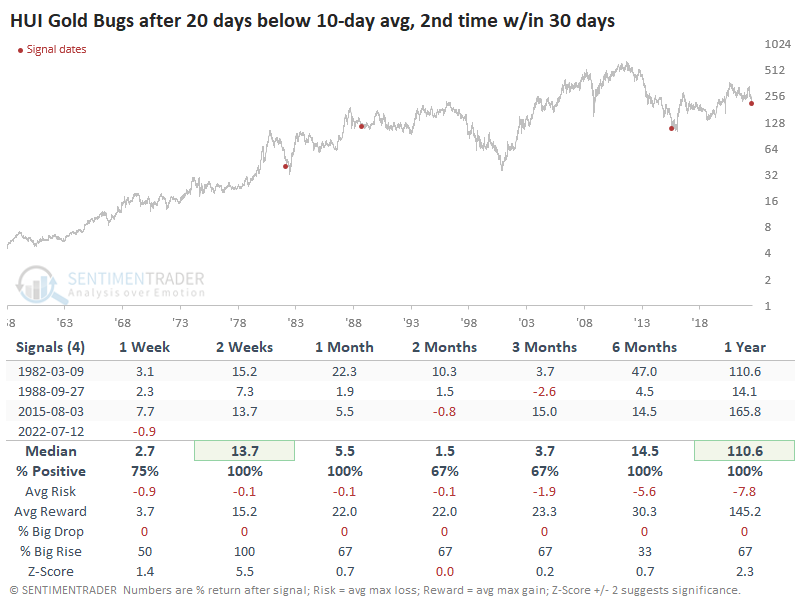
For the 2nd time almost in succession, the HUI Gold Bugs Index closed below its 10-day average for 20 days straight. Because the 10-day average follows prices so closely, closing below it for 20 days straight happens only during straight-down moves. And gold miners suffered that fate twice almost back-to-back.
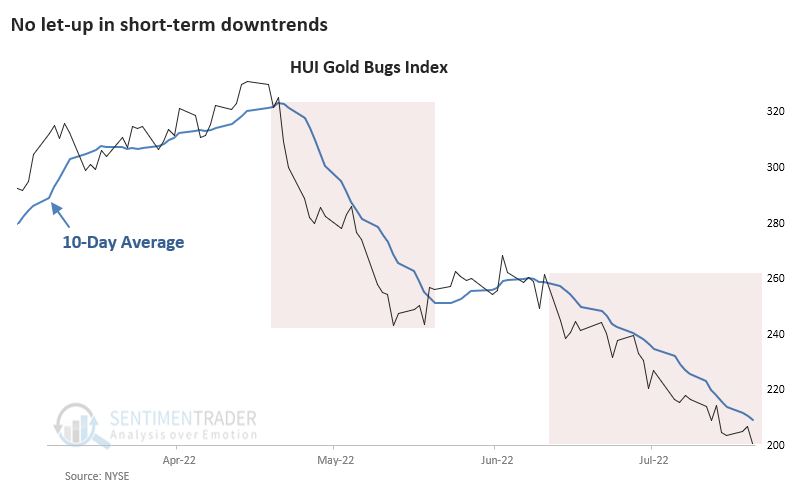
The index has suffered nearly back-to-back incessant short-term selling only three other times. All led to snapback rallies, for what that's worth. This was triggered over a week ago, and miners are still dragging.
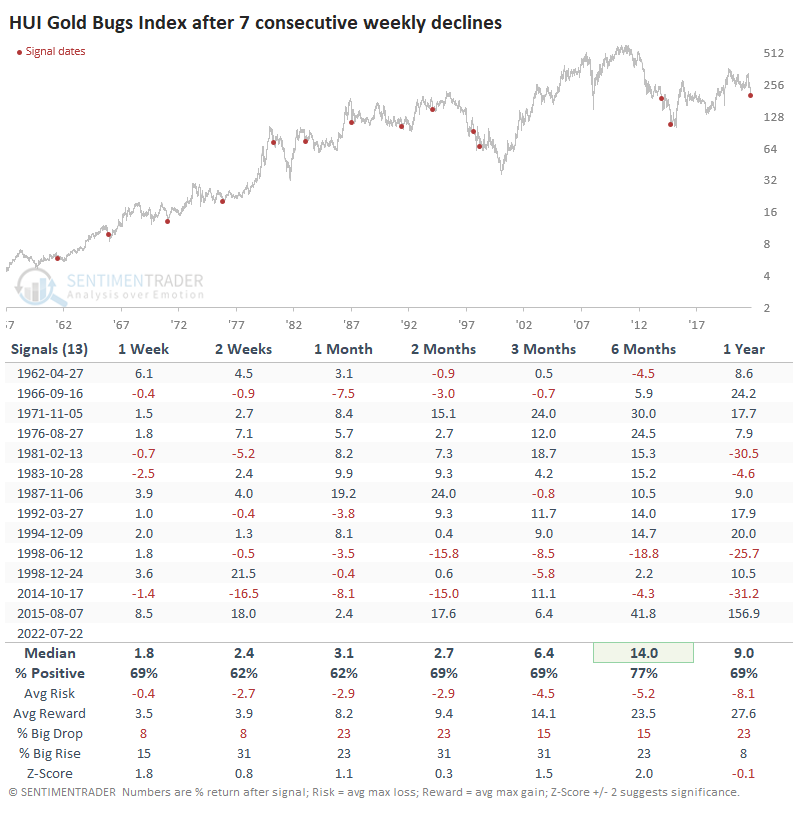
The persistent daily declines mean that on a weekly basis, gold bugs haven't been able to get off the mat. Last week marked the 7th consecutive weekly drop.
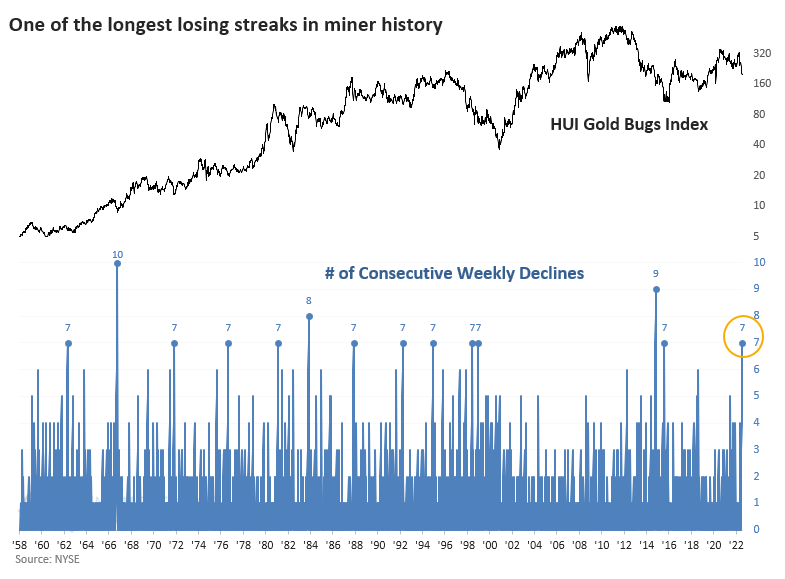
The other times when the Gold Bugs Index fell seven weeks in a row, it tended to rebound over the medium-term. After the 13 signals, all but two saw more "reward" than "risk" over the next six months.
This is definitely one of those markets where we have to be careful about the "extreme can always get more extreme" bromides. Jay outlined some extremes in gold the other day, and they have positively impacted forward returns in miners.
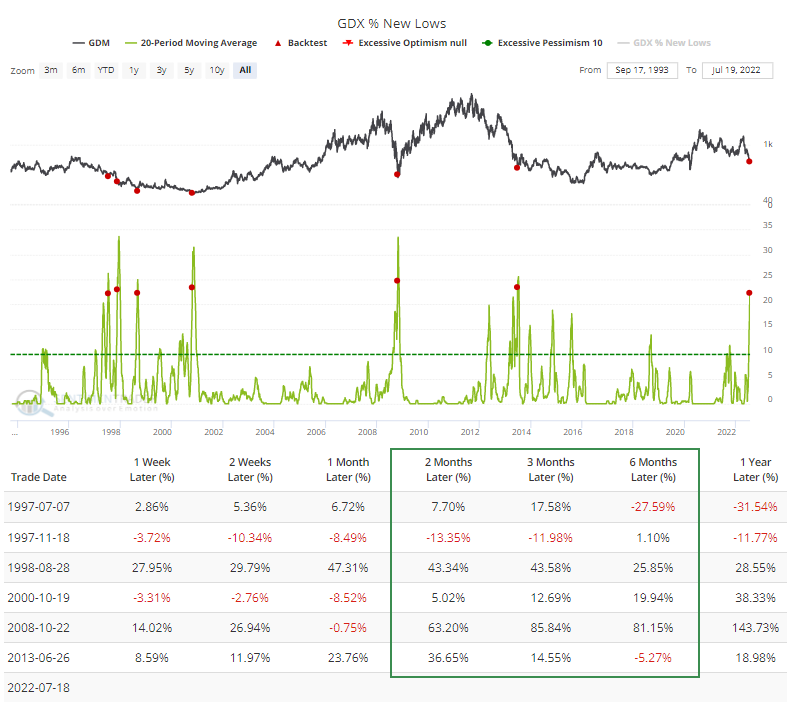
Miners themselves have registered some extremes. The 20-day average of 52-week lows crossed above 22% of stocks at new lows. That preceded gains for gold mining stocks between two and six months later.
Traders are betting on more of a decline
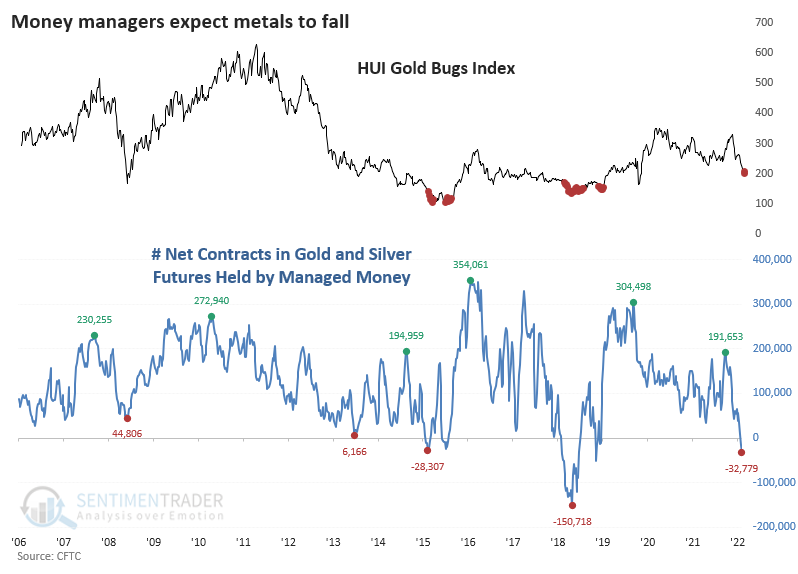
The horrid slide in gold and plunge in mining stocks has led hedge funds, Commodity Pool Operators, and other money managers to slash their bets on metals prices. As of the latest week, they're aggressively betting those contracts will continue to fall.
In gold and silver combined, money managers hold 32,000 more contracts short than long. That's the 2nd-most aggressive bet on a decline since the inception of the data 16 years ago. The few times when managers were net short by any amount roughly equated with times when gold miners formed a medium- to long-term bottom.
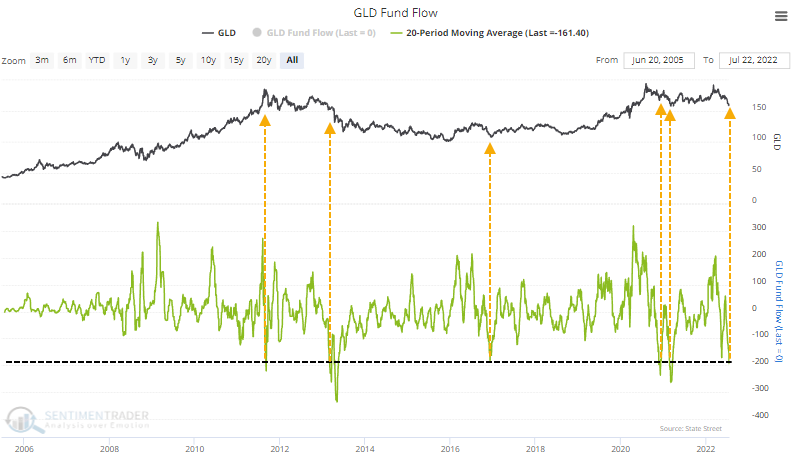
They're certainly not the only investors who are ill-positioned if gold and other metals find a way to rise. Traders in the GLD exchange-traded fund recently pulled an average of almost $200 million daily from the fund over 20 days. That's one of the most egregious outflows since the fund's inception.
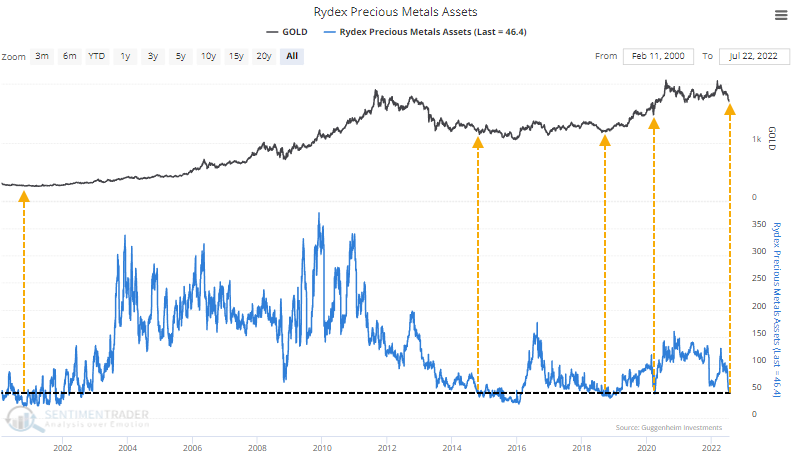
The market times who frequent the Rydex Precious Metals fund have given up, with assets in the fund dwindling to less than $50 million. When these particular traders get excited or despondent about any particular sector or asset, there has been a consistent tendency over the past two decades to make them regret it.
What the research tells us...
Be careful, most of all. There are more and more factors pointing to a rally in gold and mining stocks, but that was the case a few weeks ago. A market that just keeps rolling over extremes is one to treat with caution, and miners qualify in that regard. More than anything, there is enough evidence to suggest that actively betting against precious metals and mining stocks at this point is highly risky. Whether that translates into a low-risk opportunity for buyers is another matter; these markets have disappointed them too many times in recent weeks to have a high degree of confidence.
Indicators at Extremes
Phase Table
Ranks
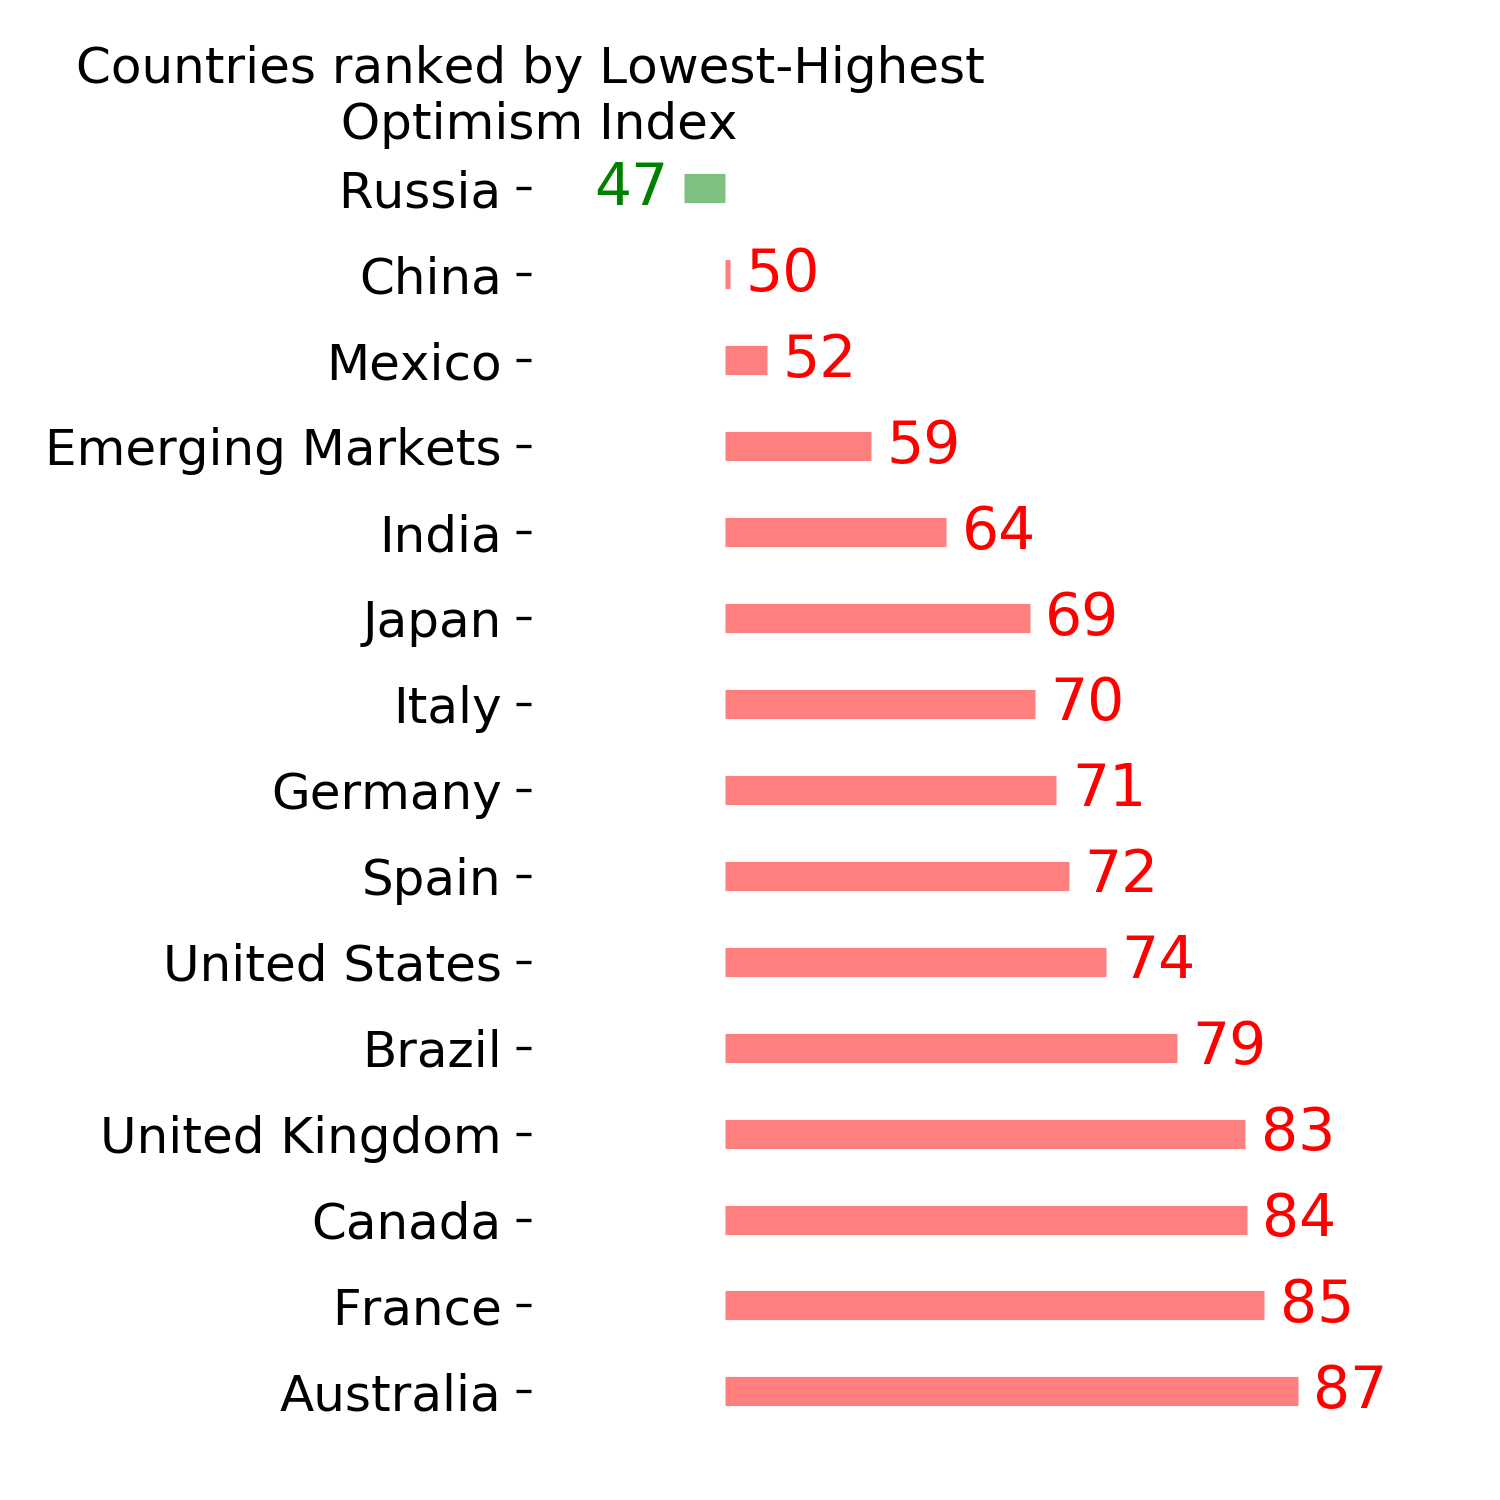
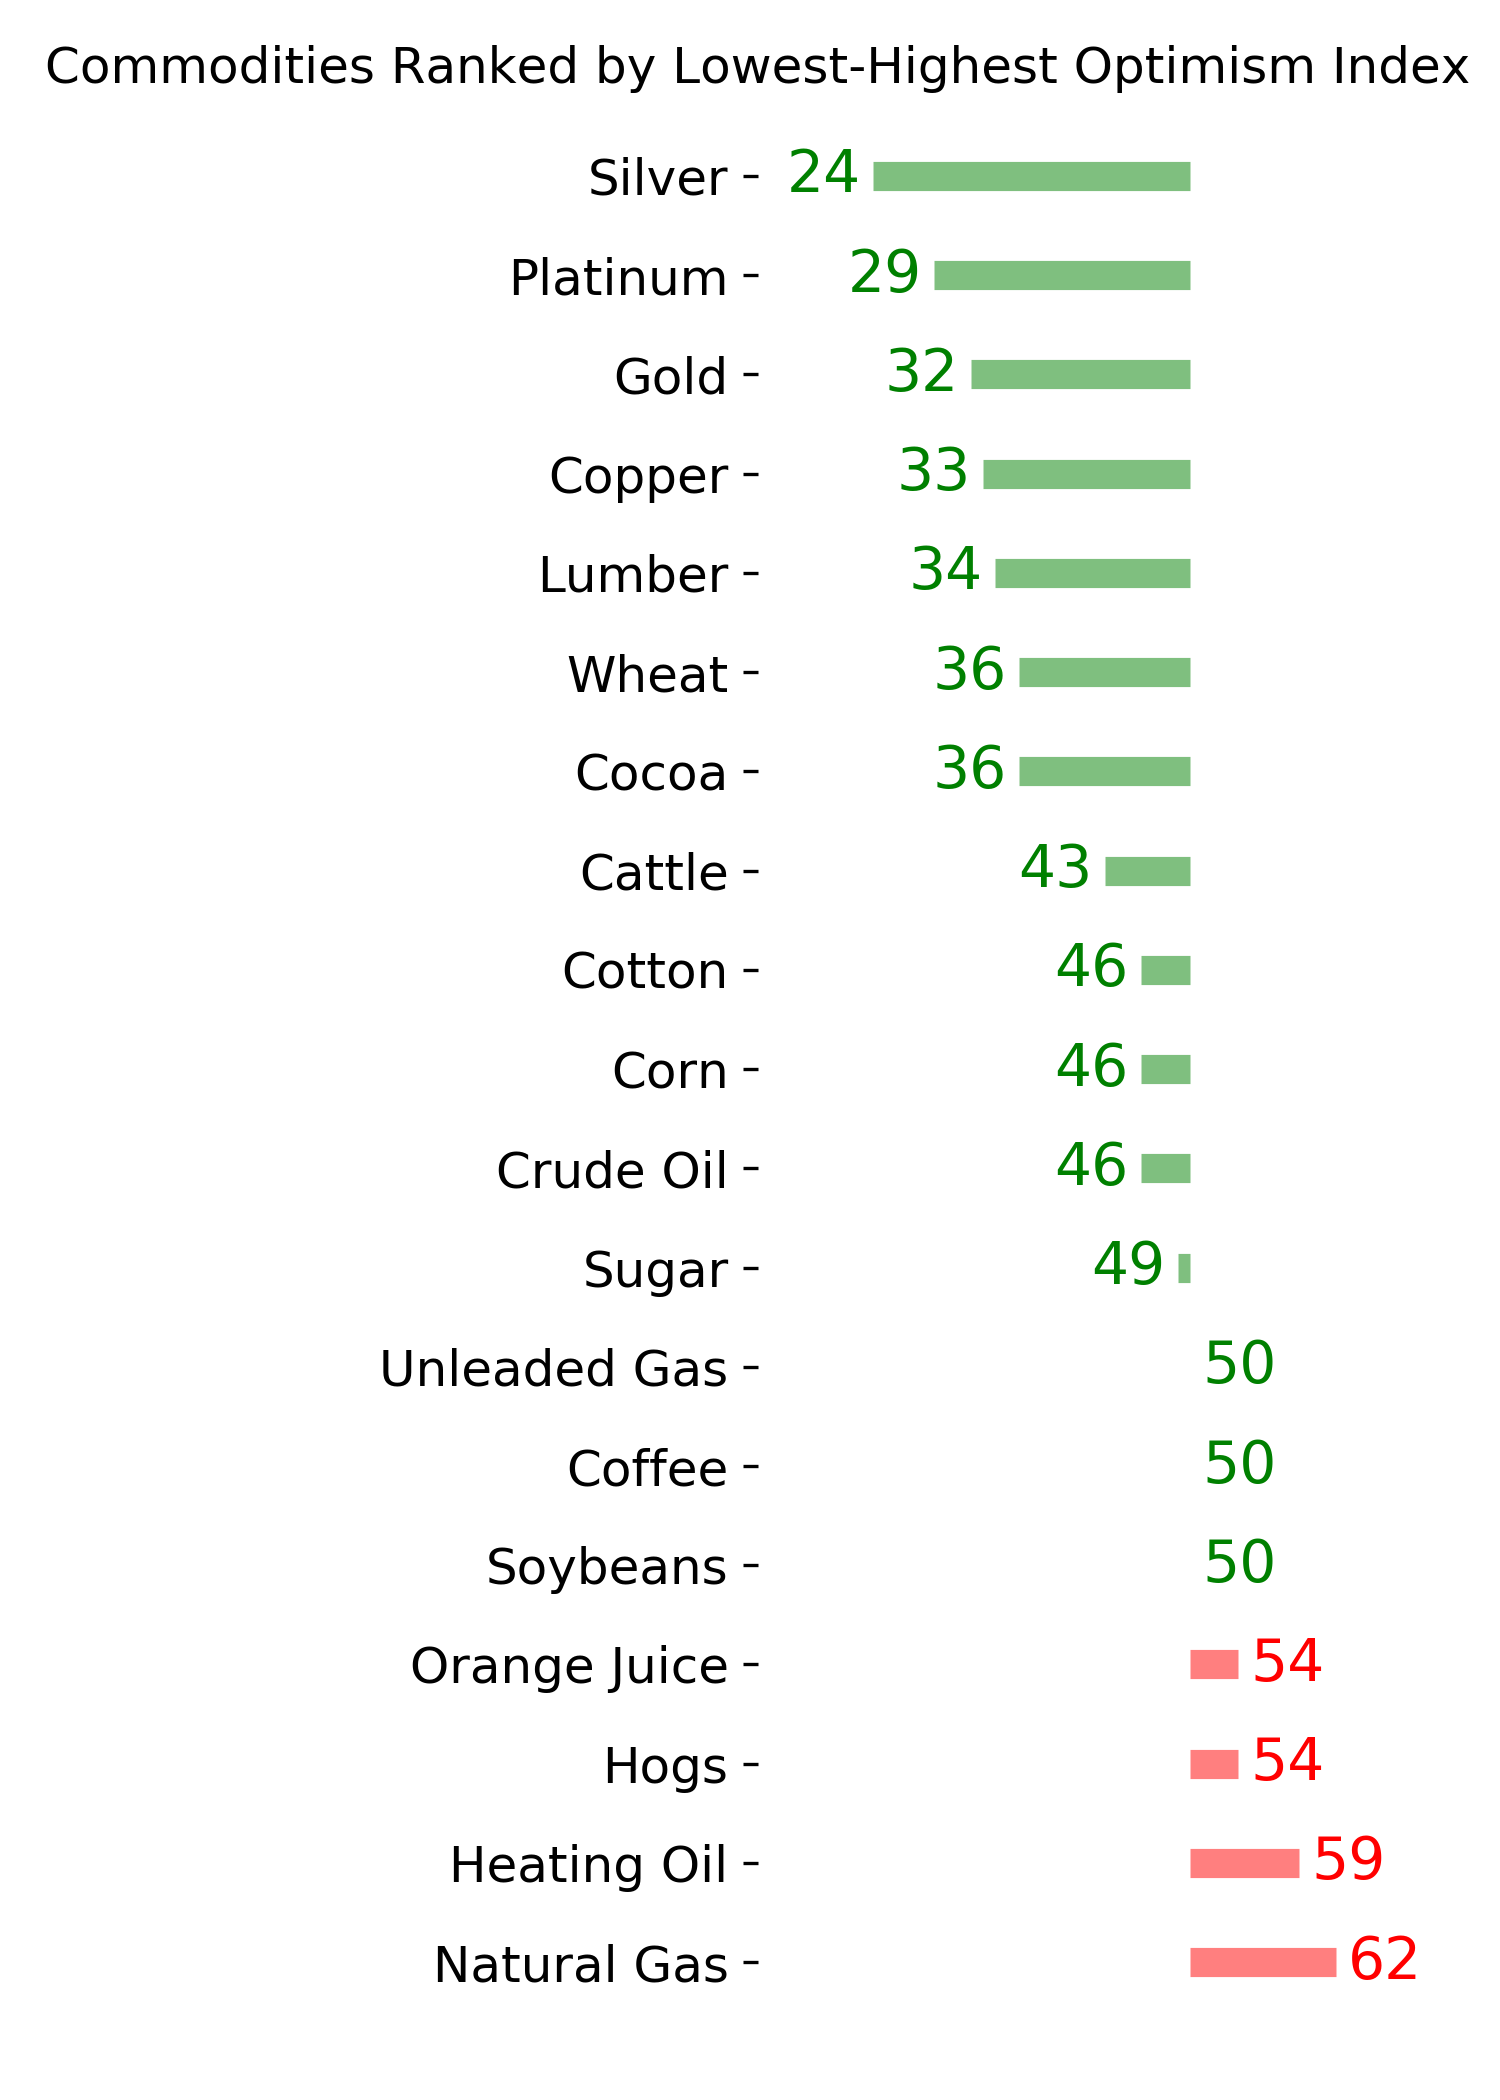
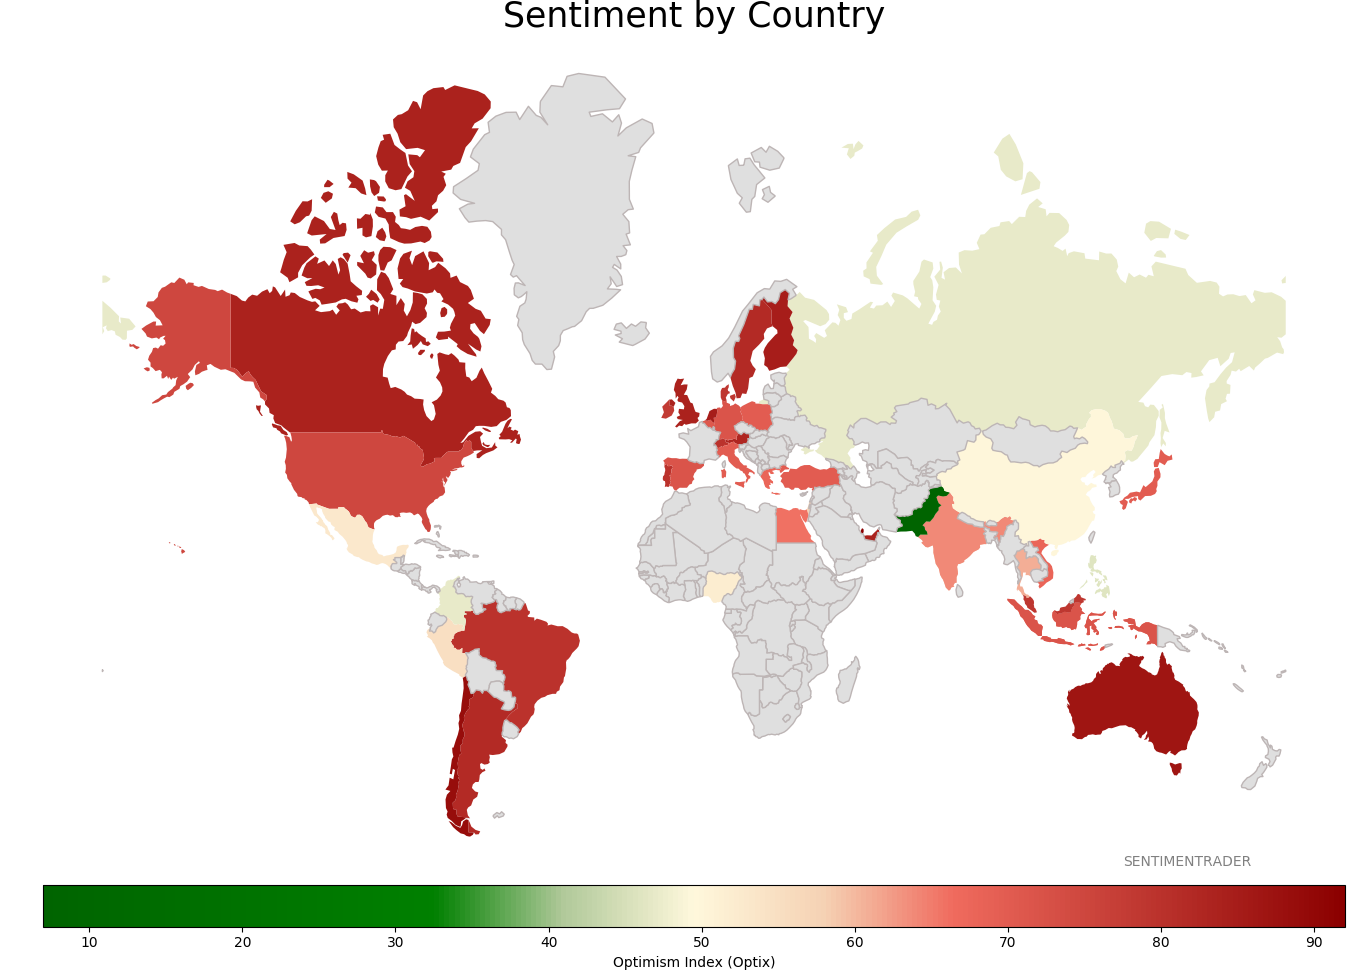
Sentiment Around The World
Optimism Index Thumbnails
|
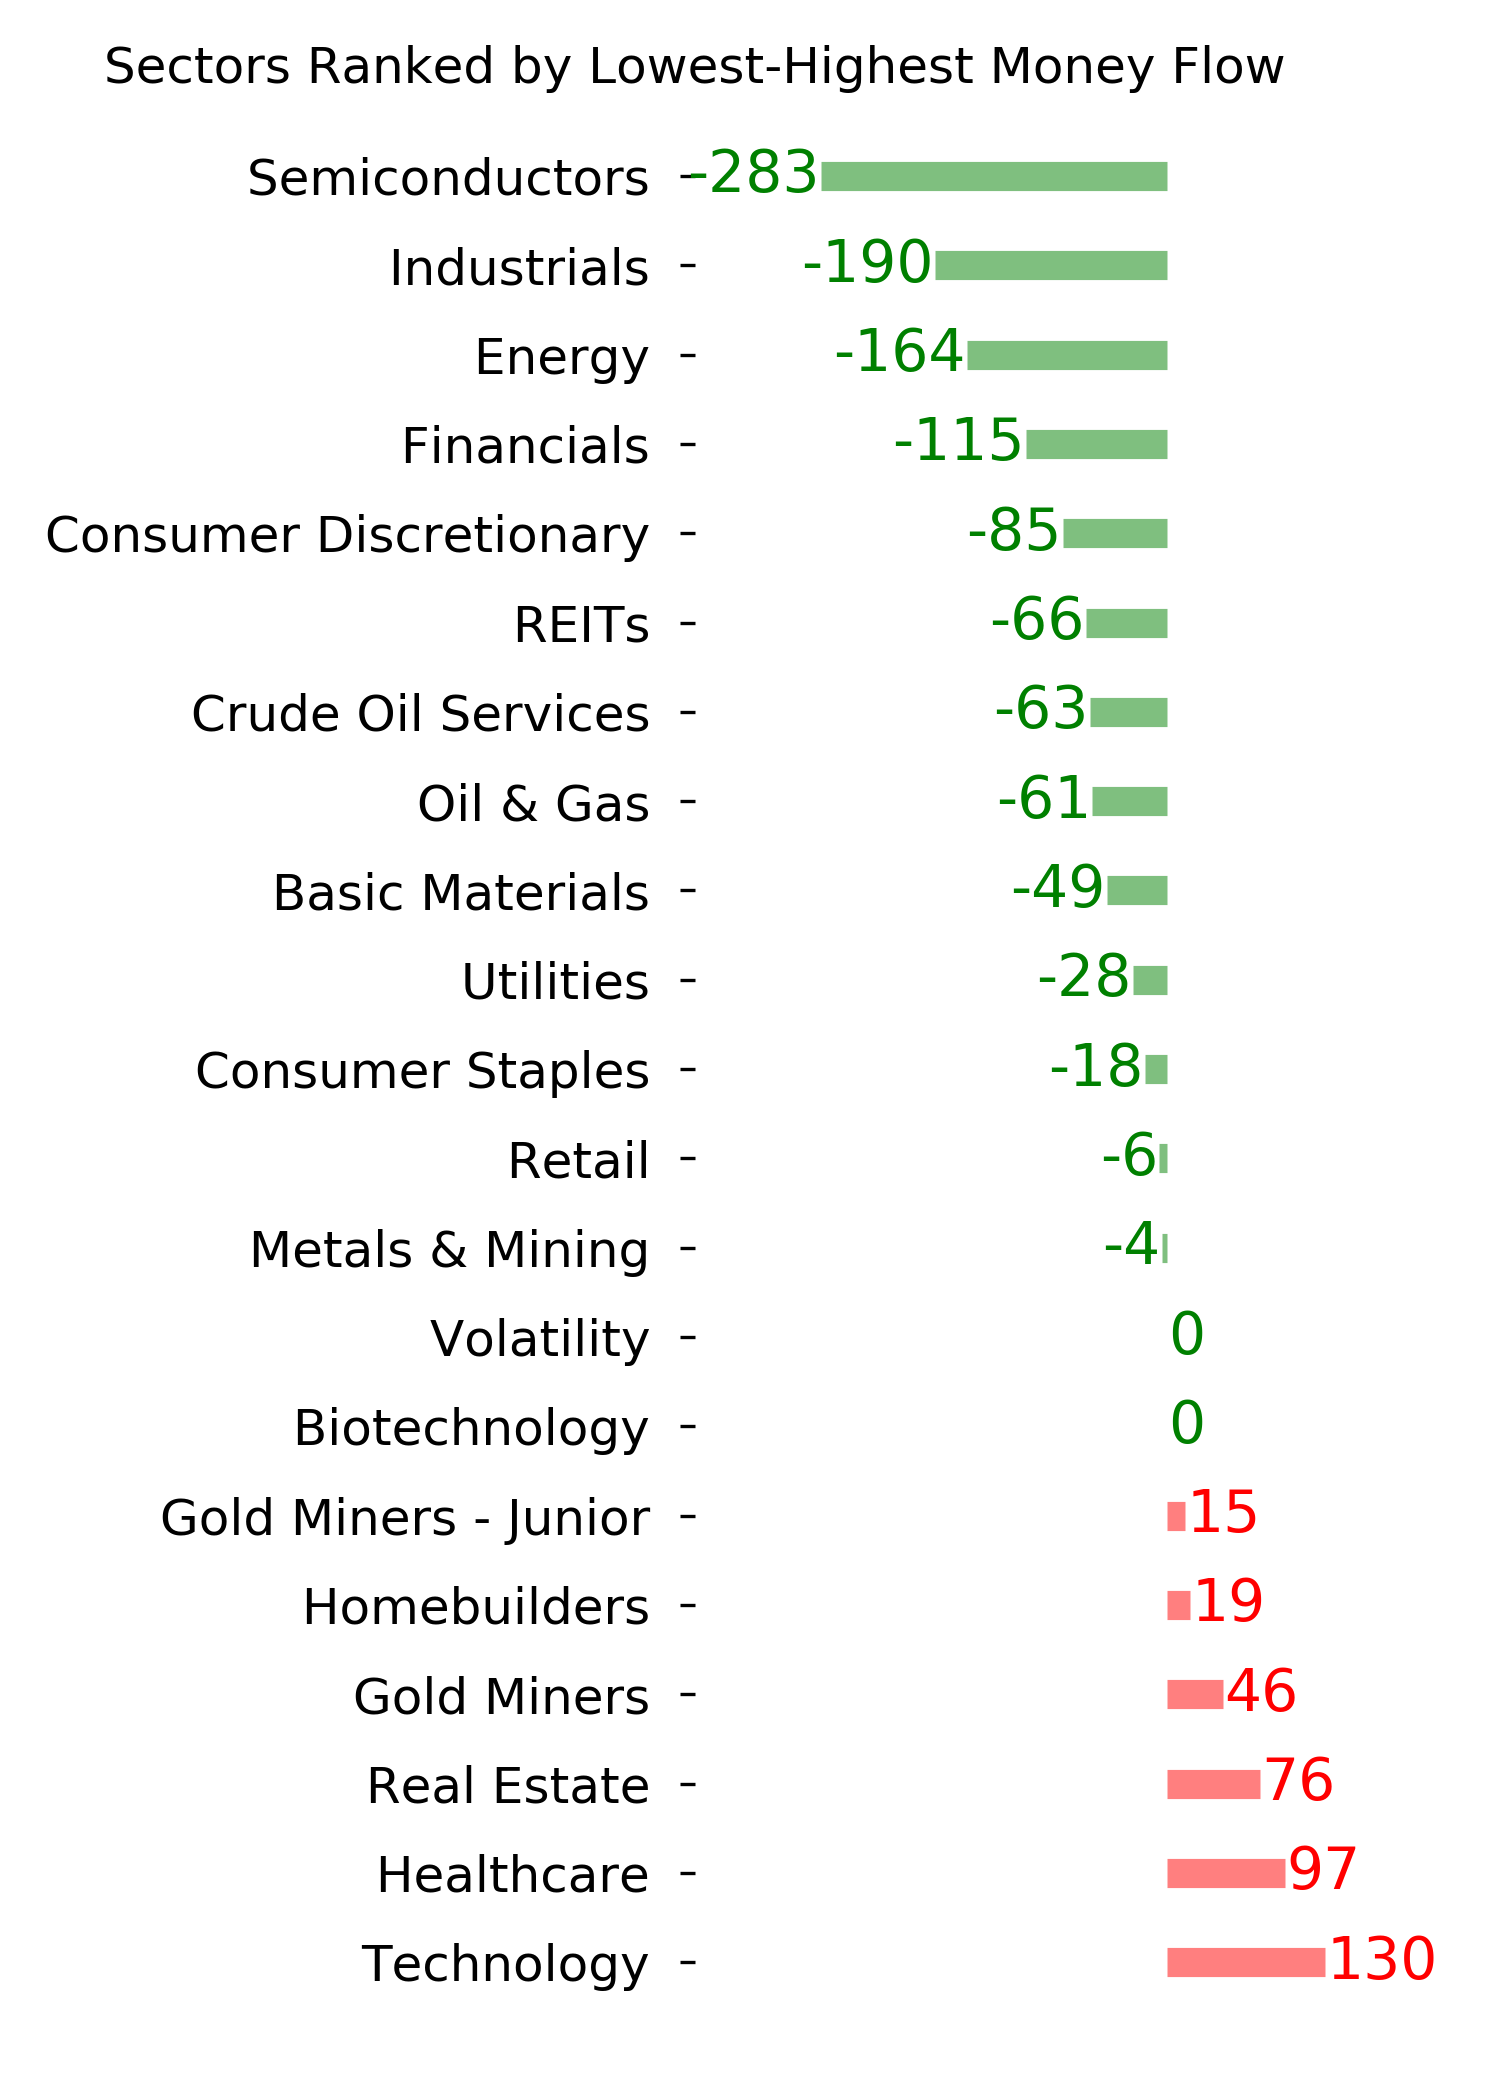
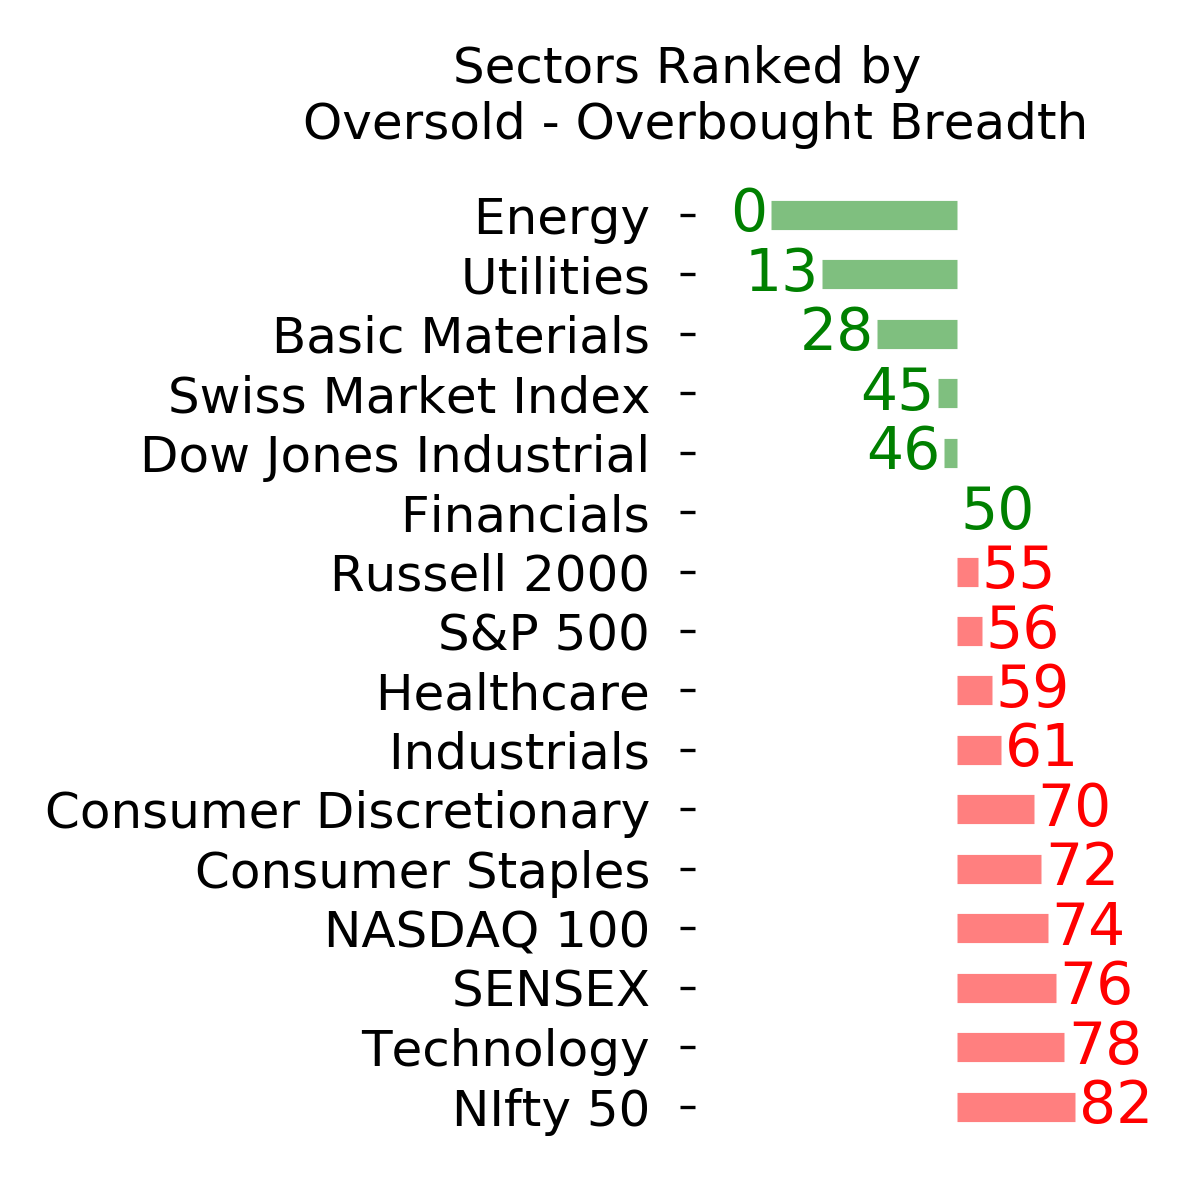
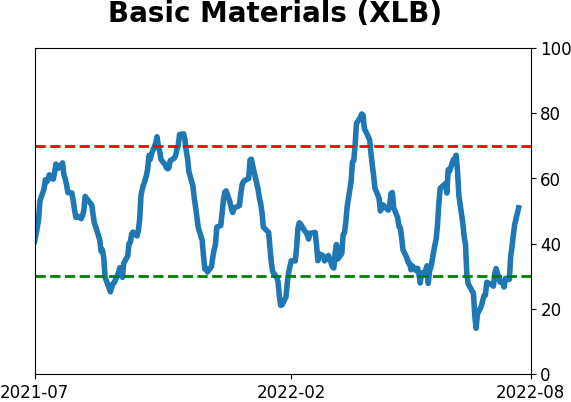
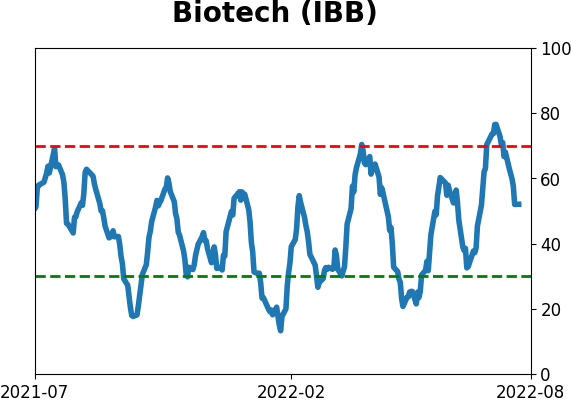
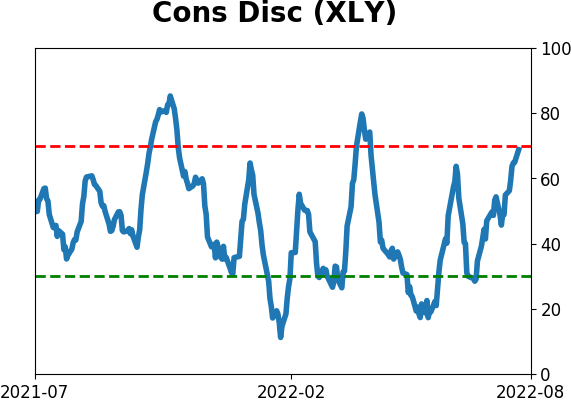
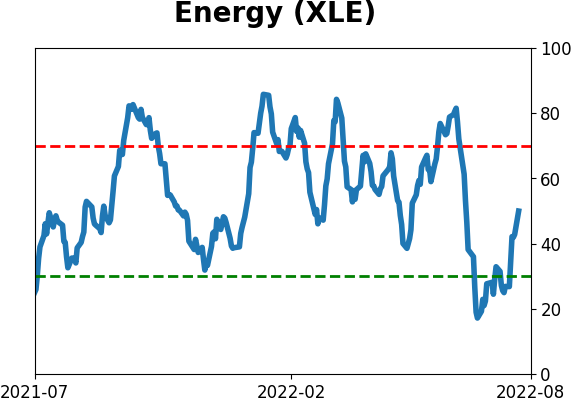
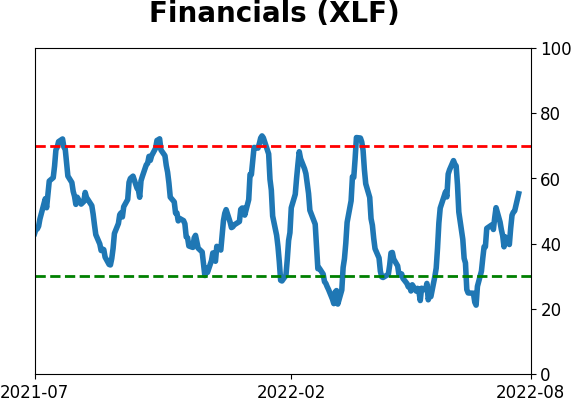
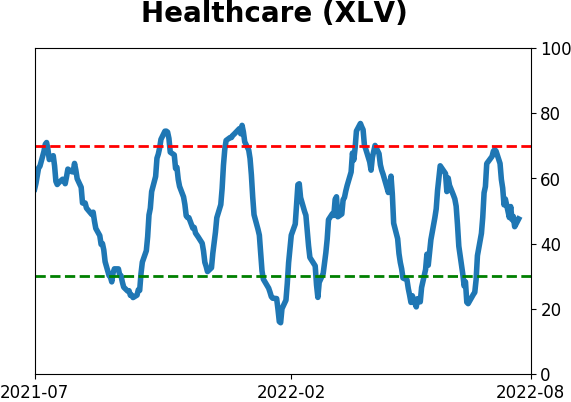
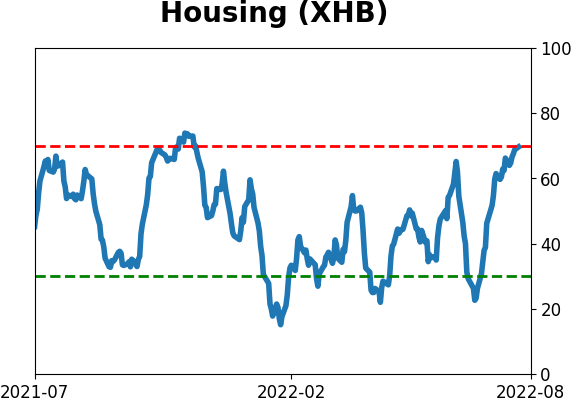
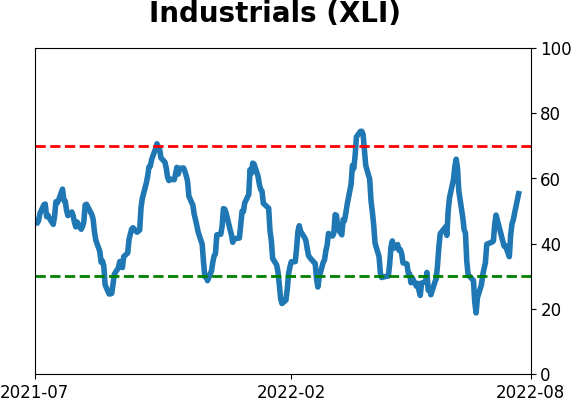
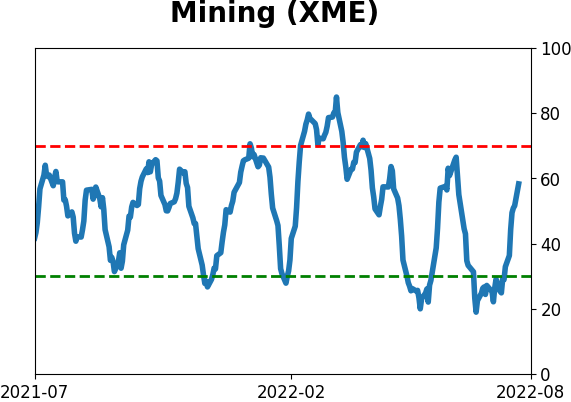
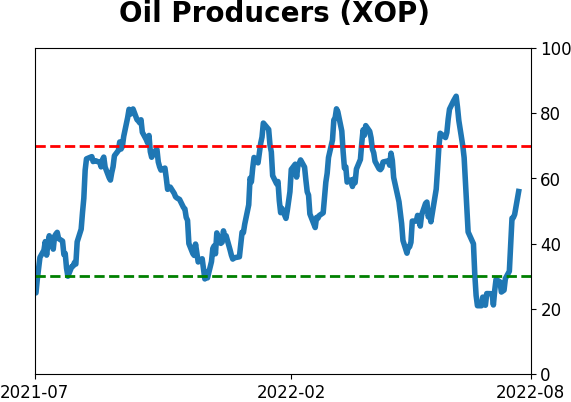
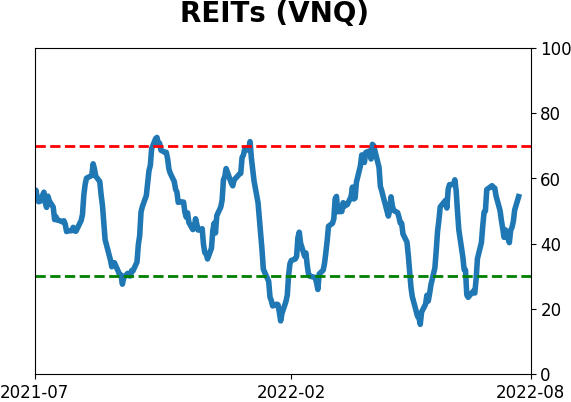
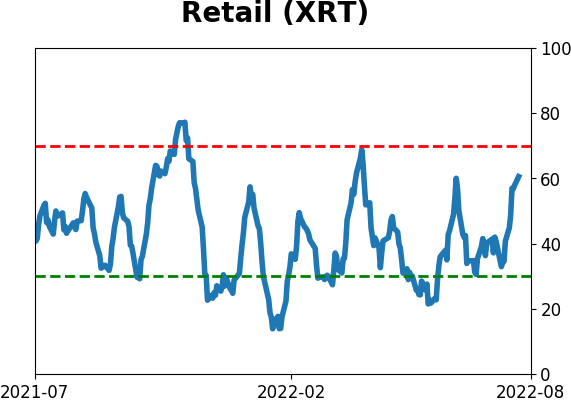
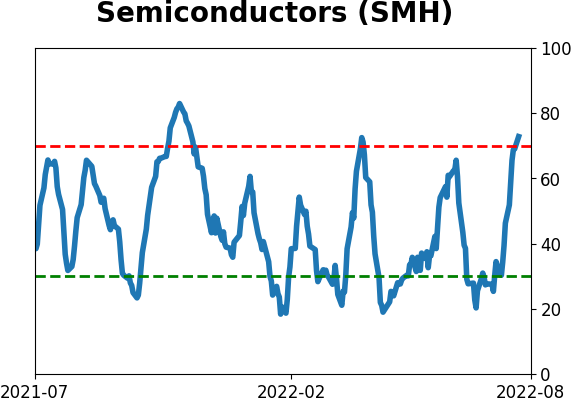
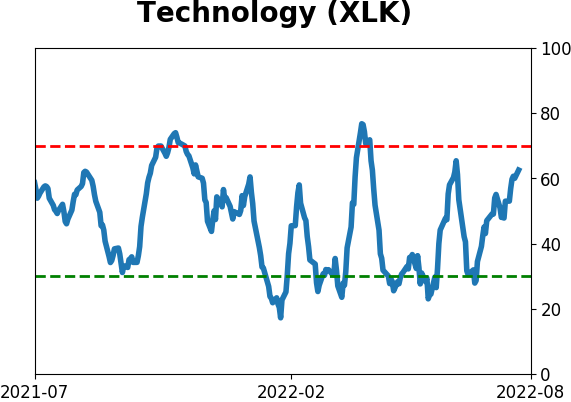
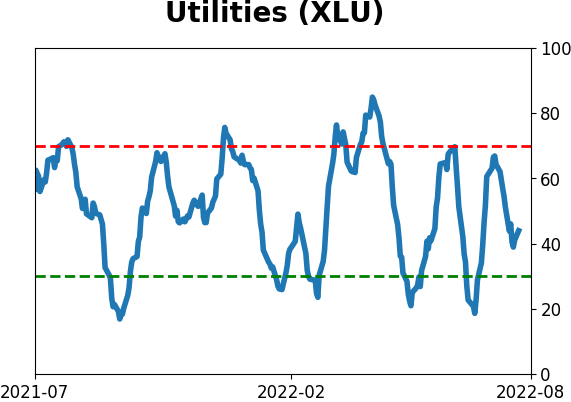
Sector ETF's - 10-Day Moving Average
|
|
|
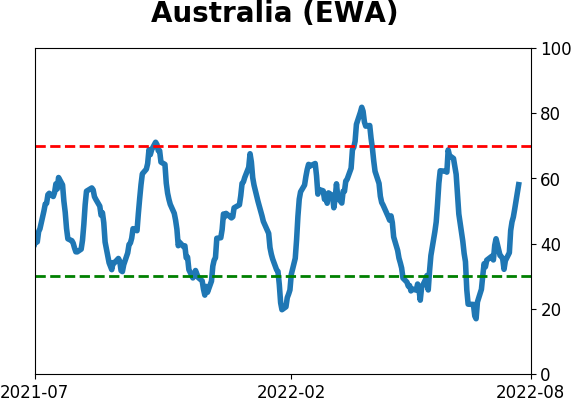
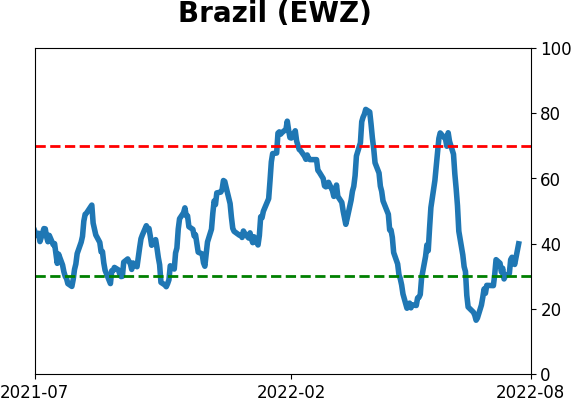
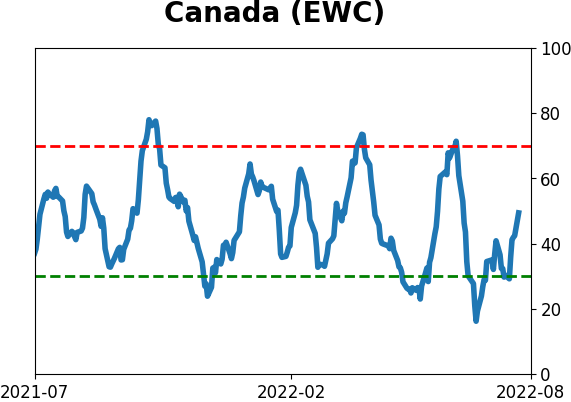
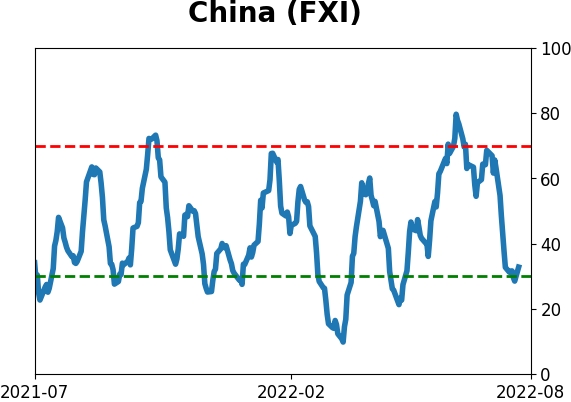
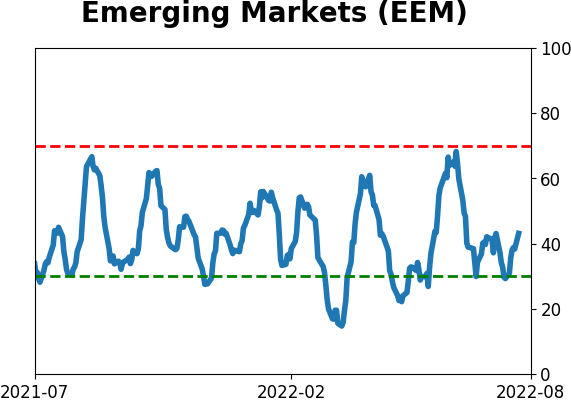
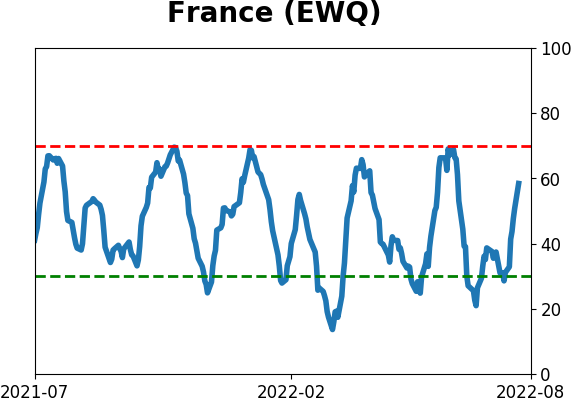
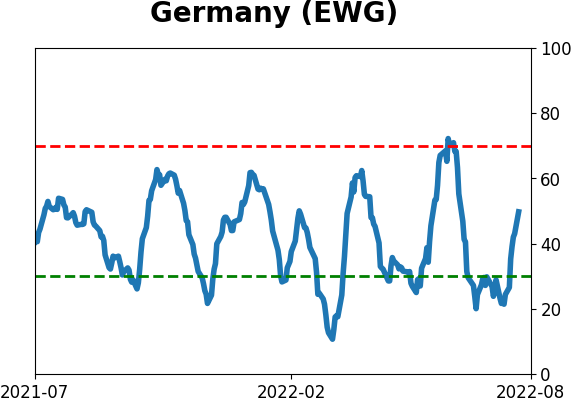
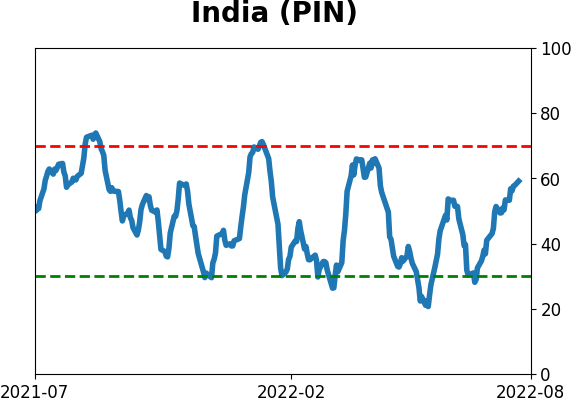
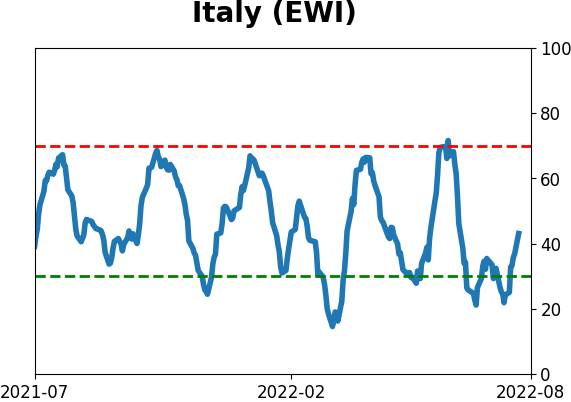
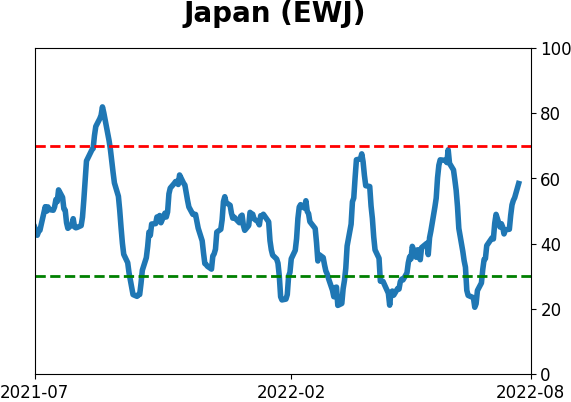
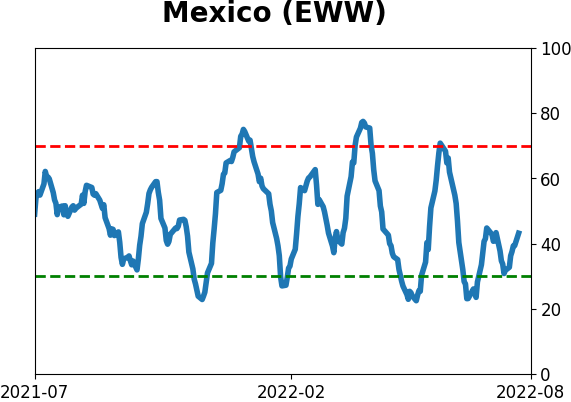
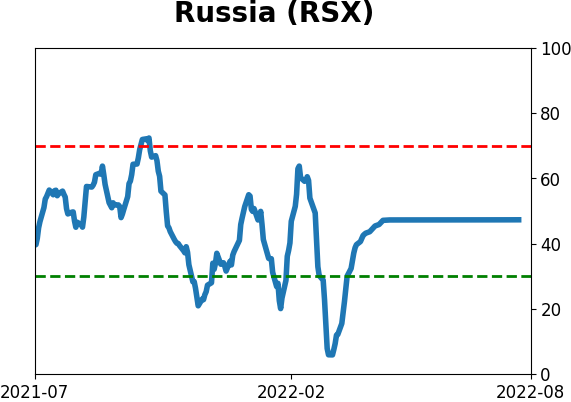
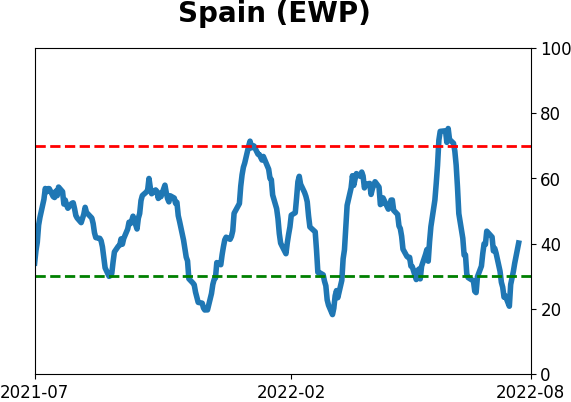
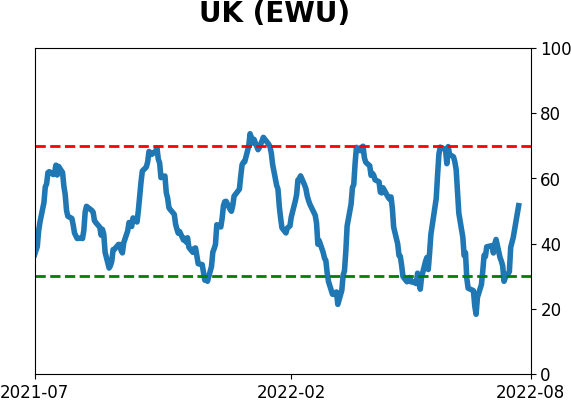
Country ETF's - 10-Day Moving Average
|
|
|
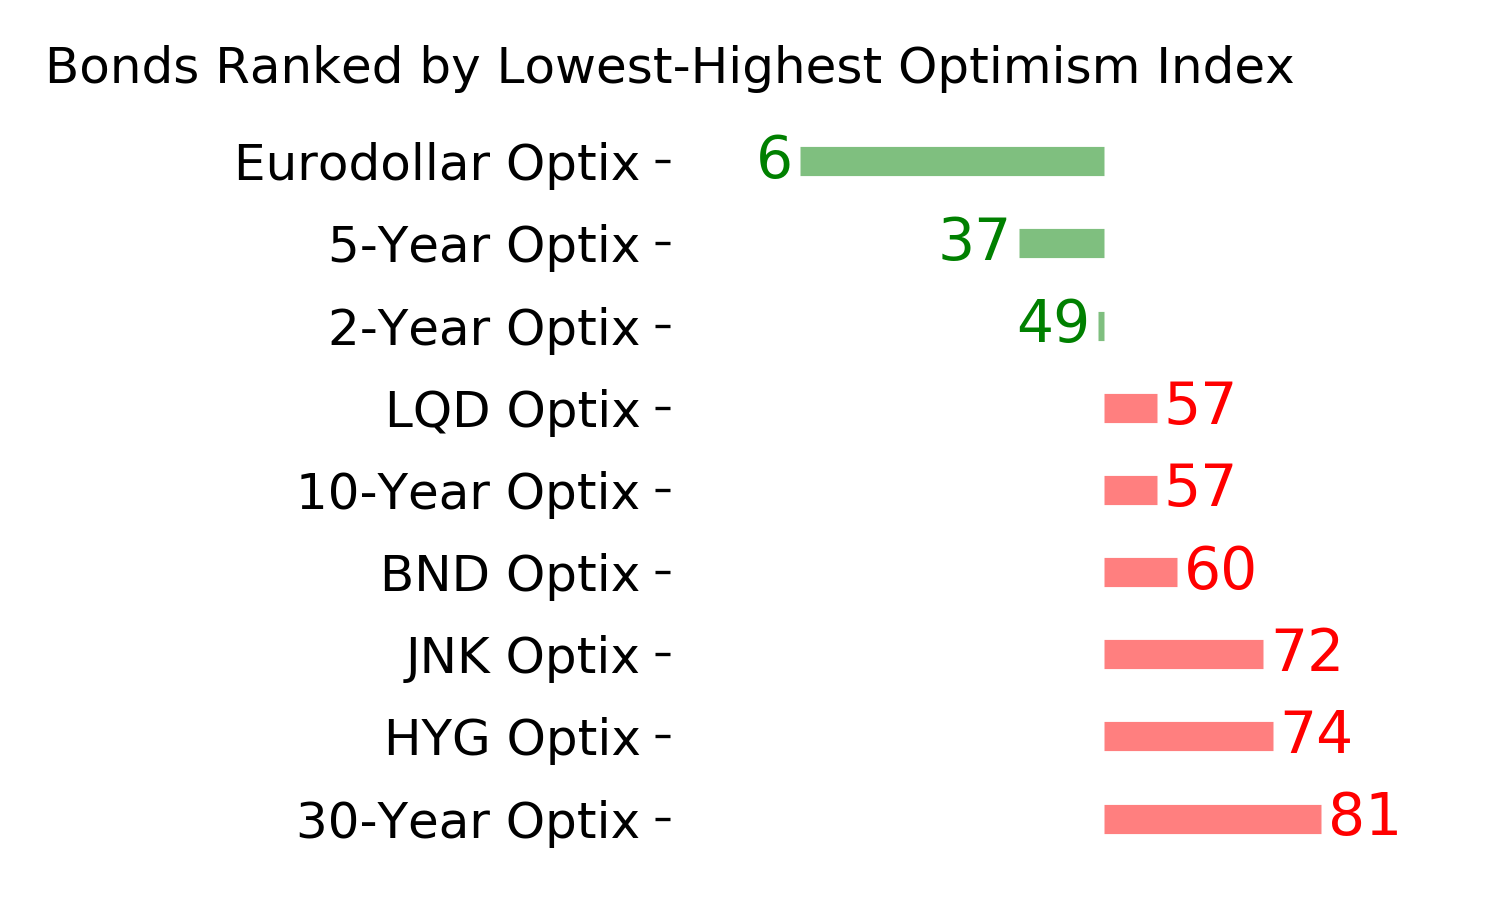
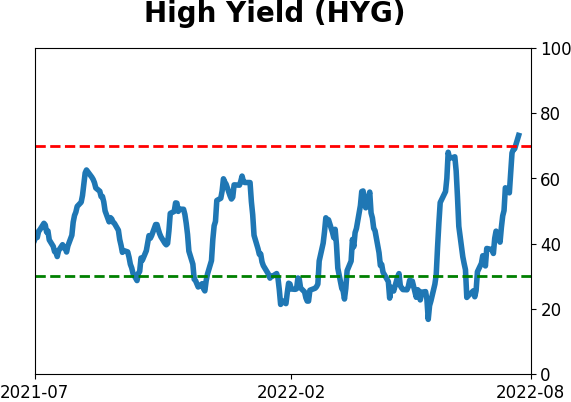
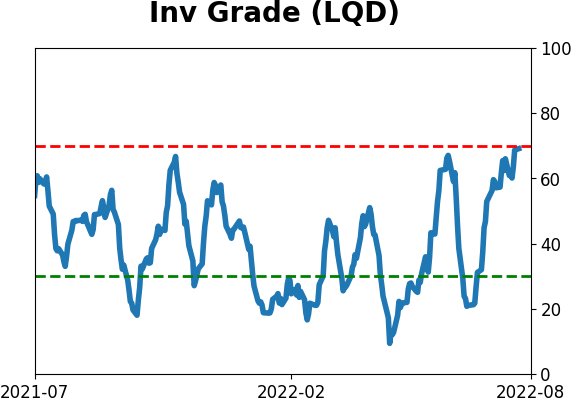
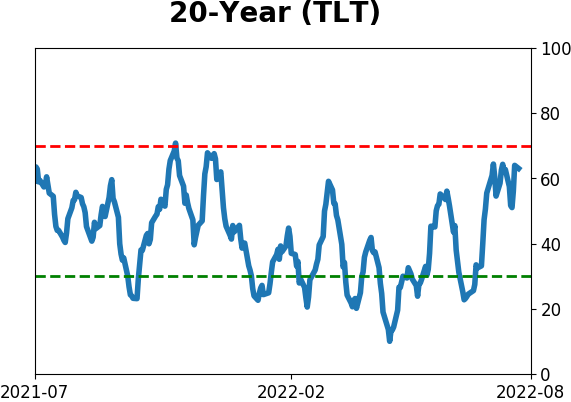
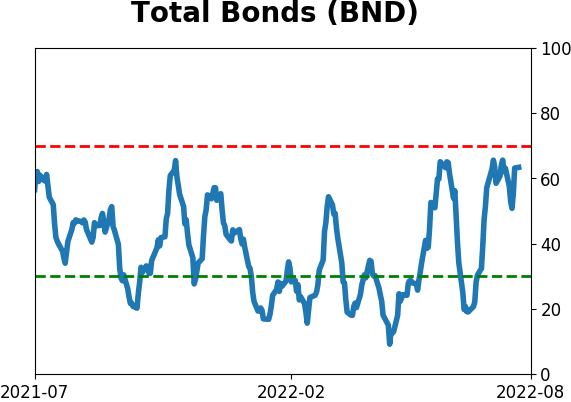
Bond ETF's - 10-Day Moving Average
|
|
|
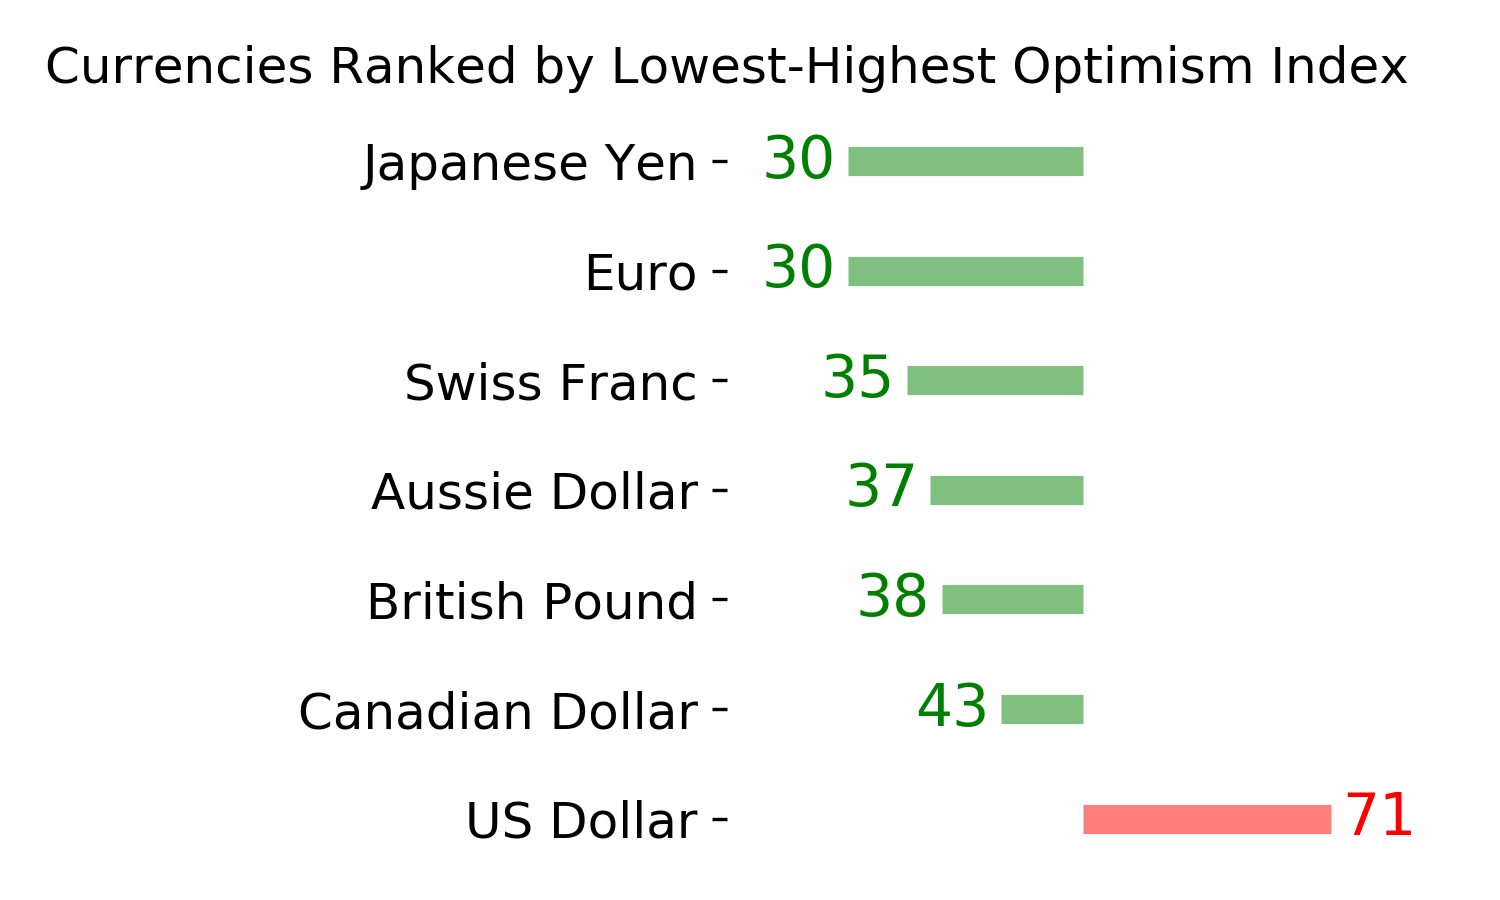
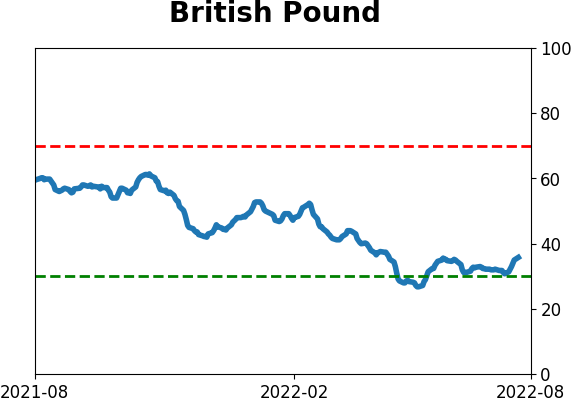
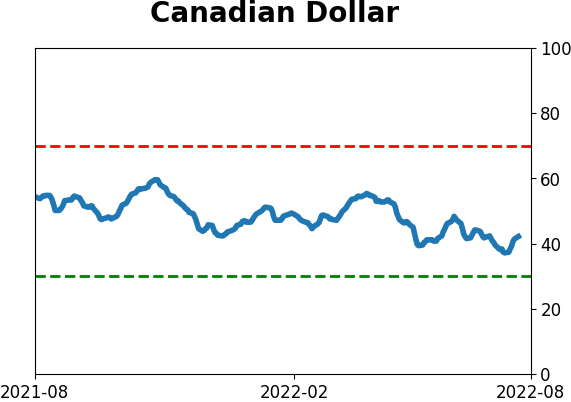
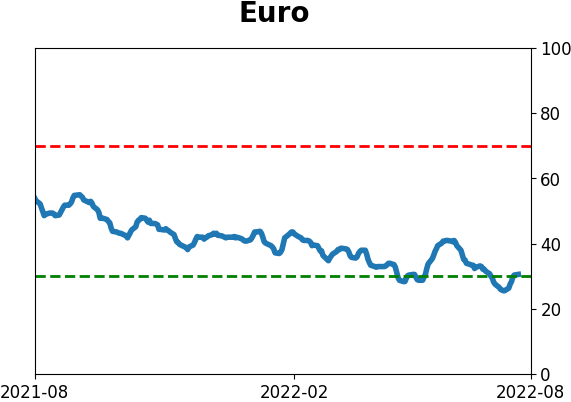
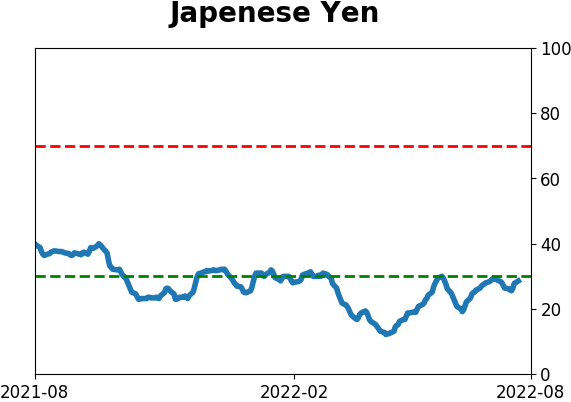
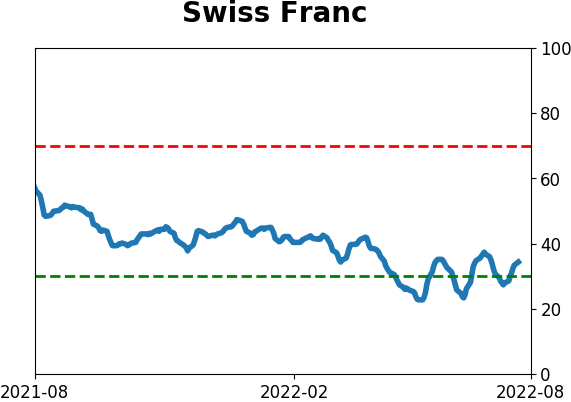
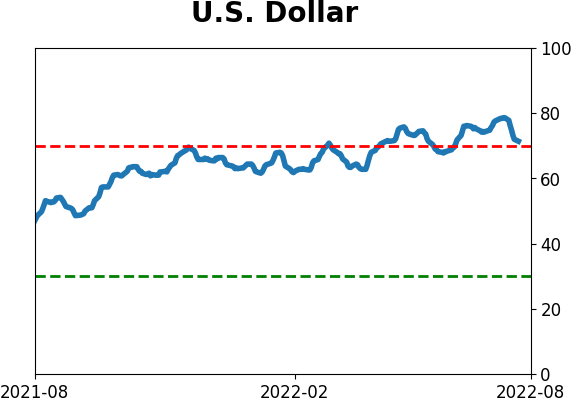
Currency ETF's - 5-Day Moving Average
|
|
|
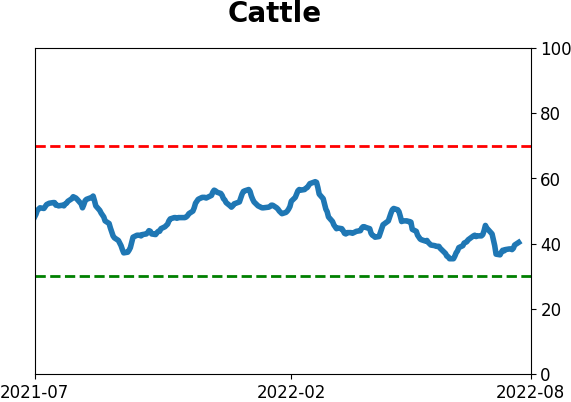
Commodity ETF's - 5-Day Moving Average
|
|