Headlines
|
|
Nearing record persistence of risk-on behavior:
Investors have been in risk-on mode for nine months. It's been 180 days since the Risk On / Off Indicator was below 50%, one of the longest streaks in almost 25 years. Similar behavior rarely led to immediate and meaningful losses. However, it was rare to see further short-term gains sustained.
|
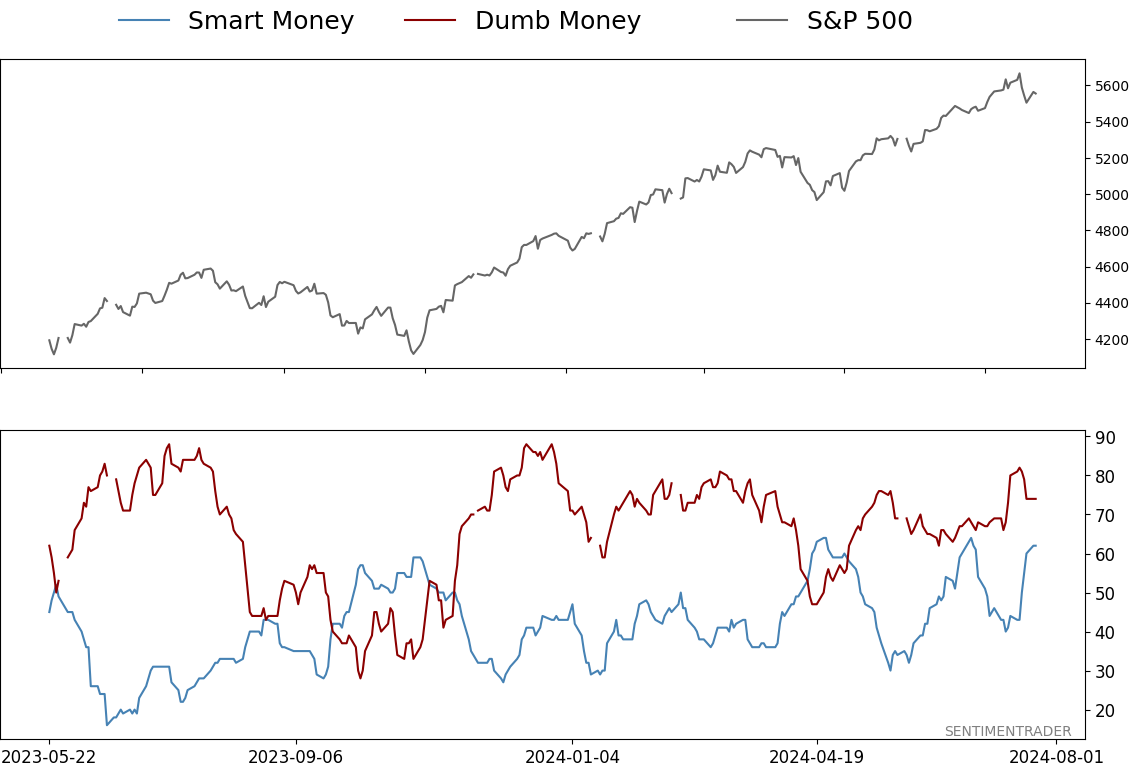
Smart / Dumb Money Confidence
|
Smart Money Confidence: 62%
Dumb Money Confidence: 74%
|
|
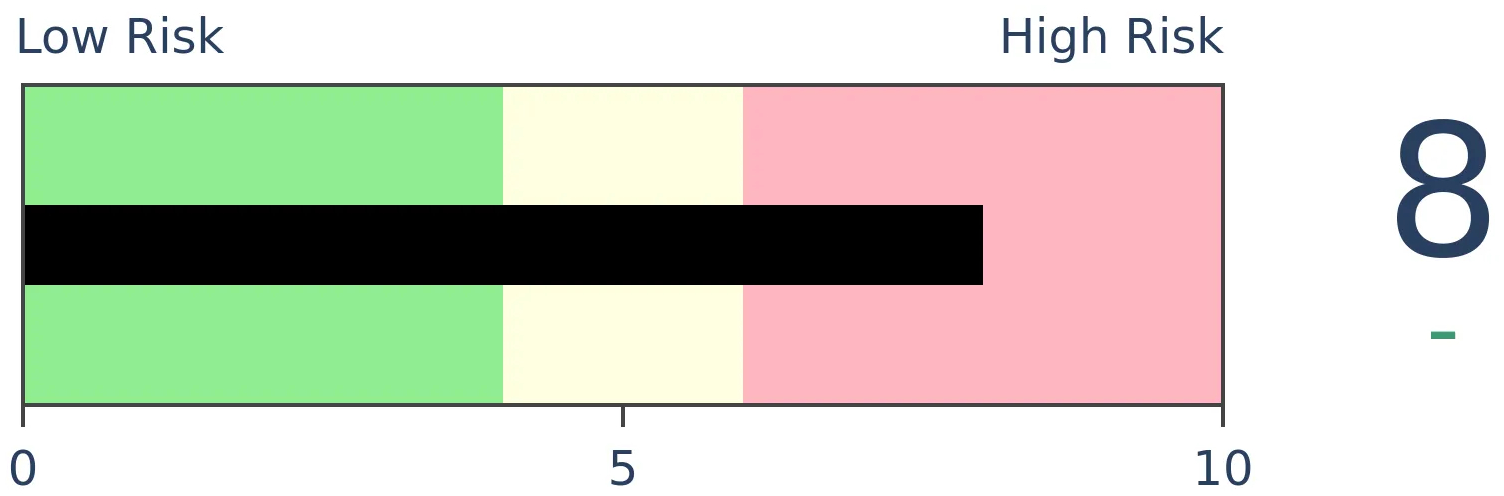
Risk Levels
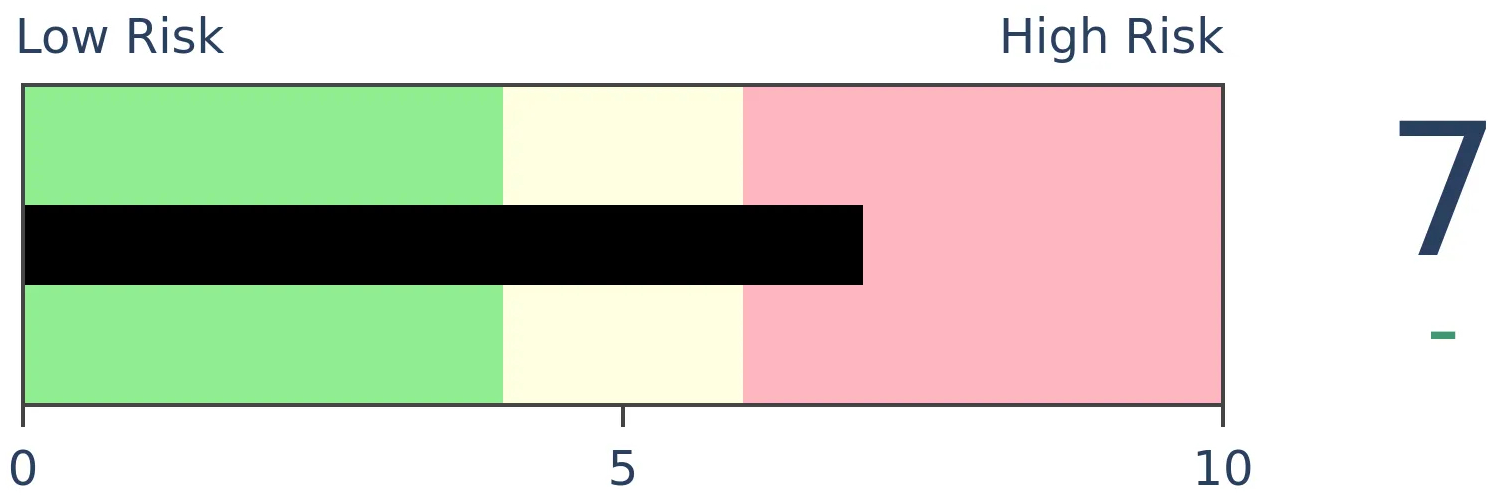
Stocks Short-Term

|
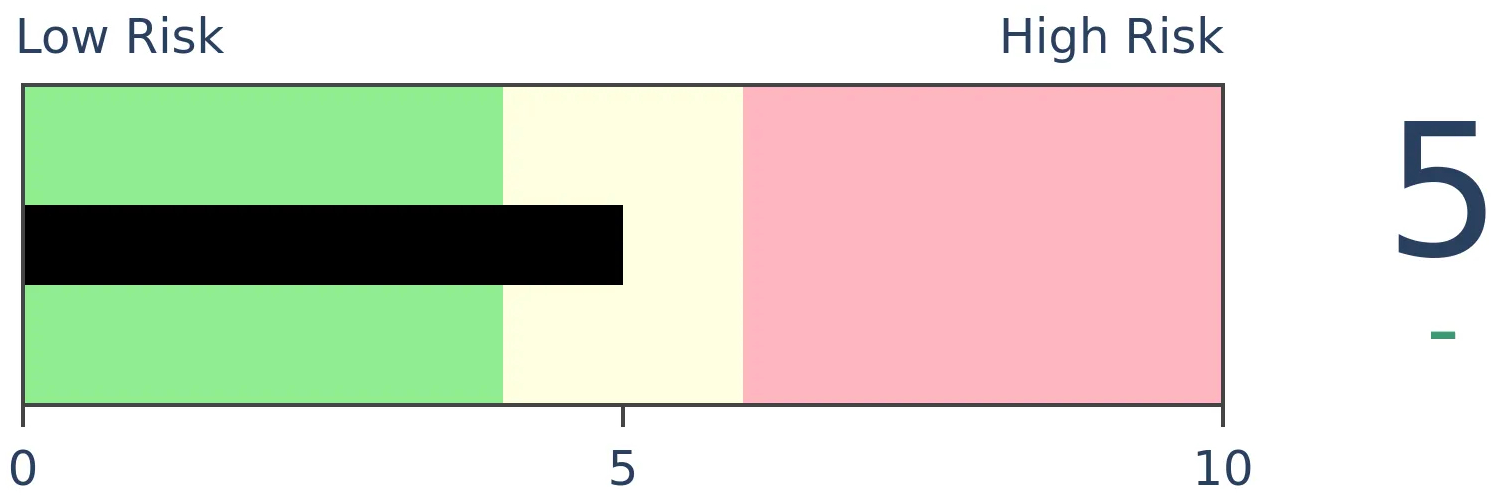
Stocks Medium-Term
|
|
Bonds

|
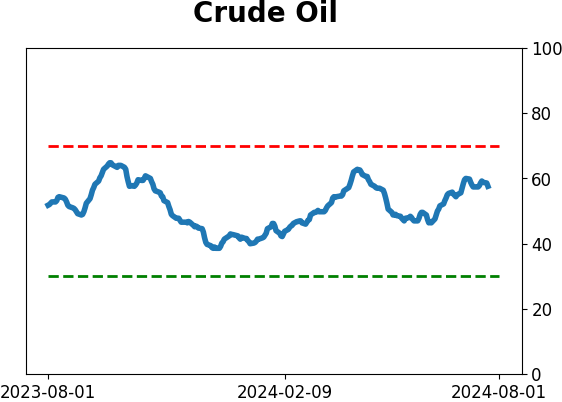
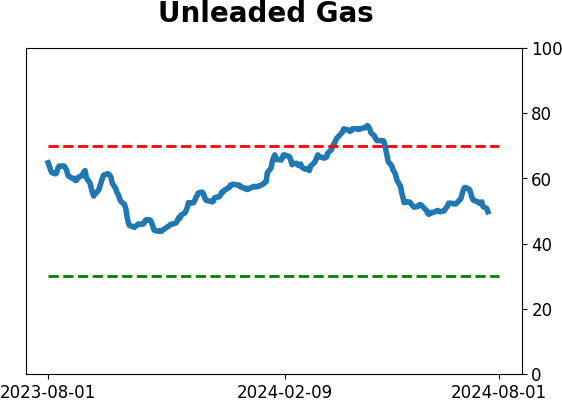
Crude Oil

|
|
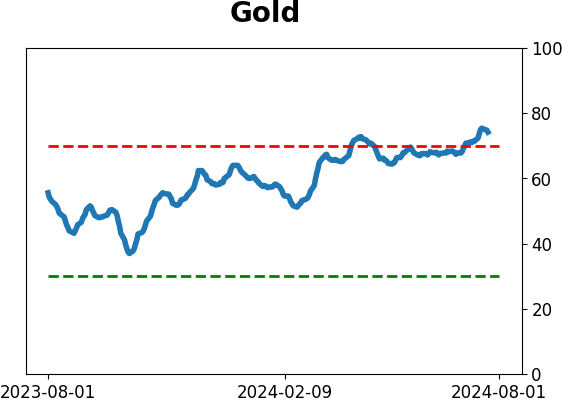
Gold
|
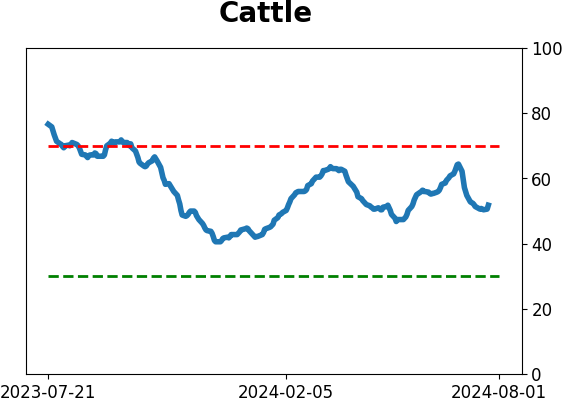
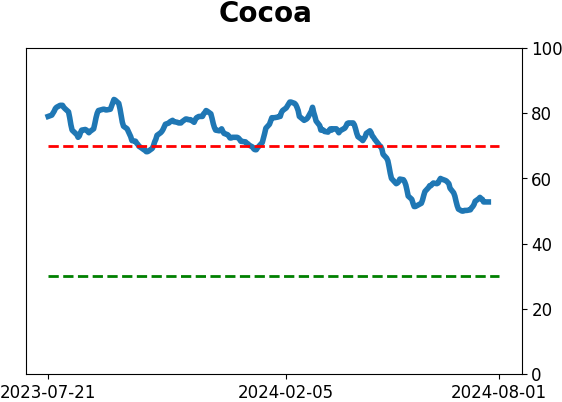
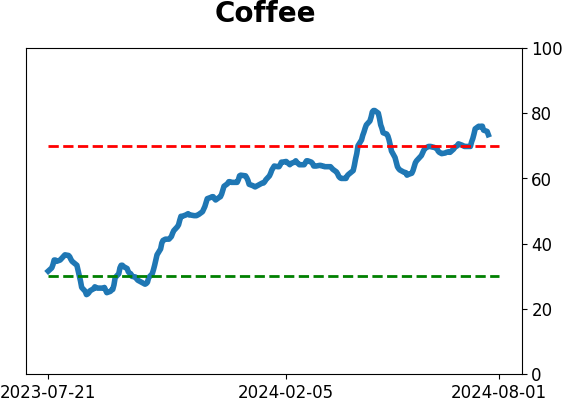
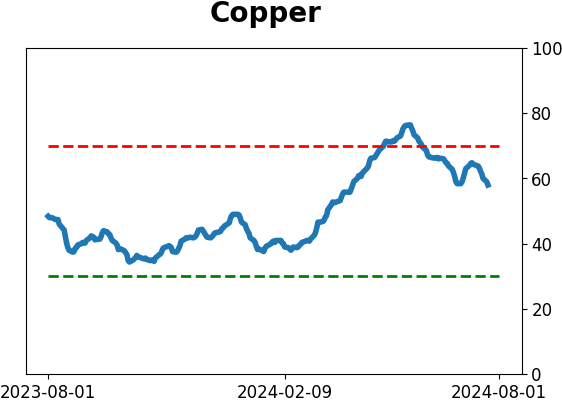
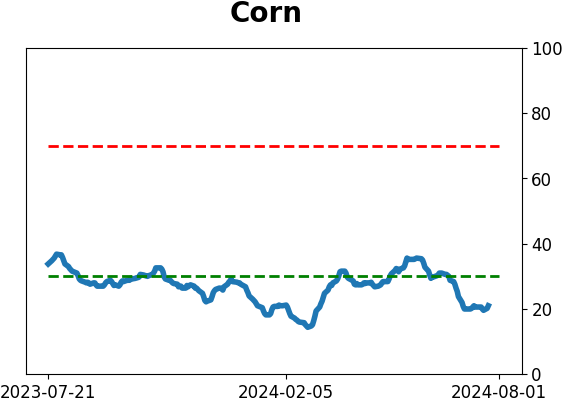
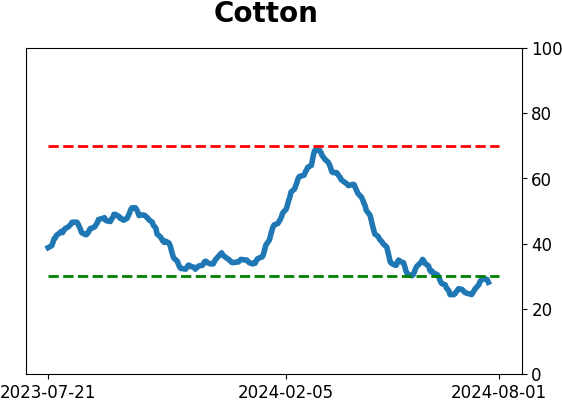
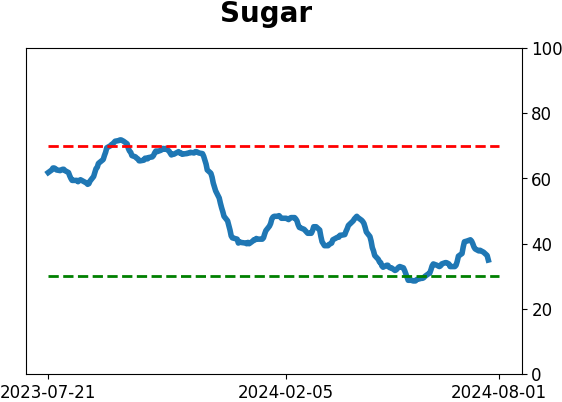
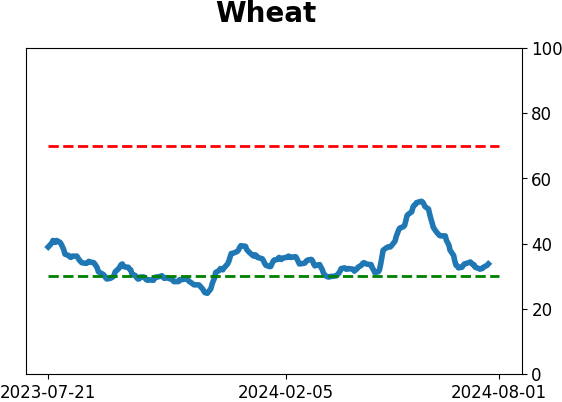
Agriculture
|
|
Research
By Jason Goepfert
BOTTOM LINE
Investors have been in risk-on mode for nine months. It's been 180 days since the Risk On / Off Indicator was below 50%, one of the longest streaks in almost 25 years. Similar behavior rarely led to immediate and meaningful losses. However, it was rare to see further short-term gains sustained.
FORECAST / TIMEFRAME
None
|
Key points:
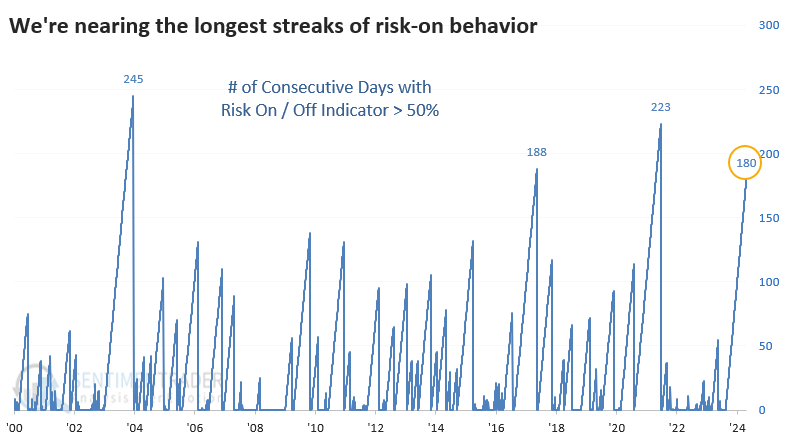
- A majority of core indicators have been in risk-on mode for 180 straight days
- That's nearing the longest streaks of such behavior in nearly 25 years
- Other periods of very persistent and high optimism didn't necessarily lead to losses, but upside expectations should be muted
Risk-on (and on and on)
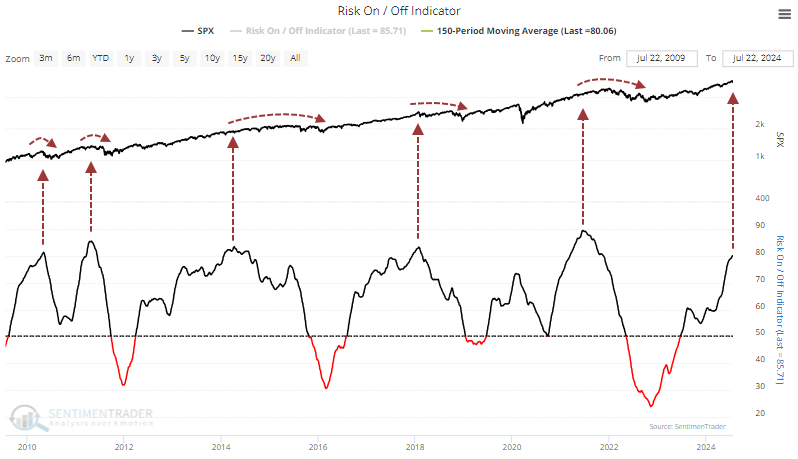
Investors have been held a risk-on attitude for weeks. Months, actually. According to the Risk On / Off Indicator, most of the 21 core indicators have been in risk-on mode for 180 days. That's approaching the 2021 streak for persistence.
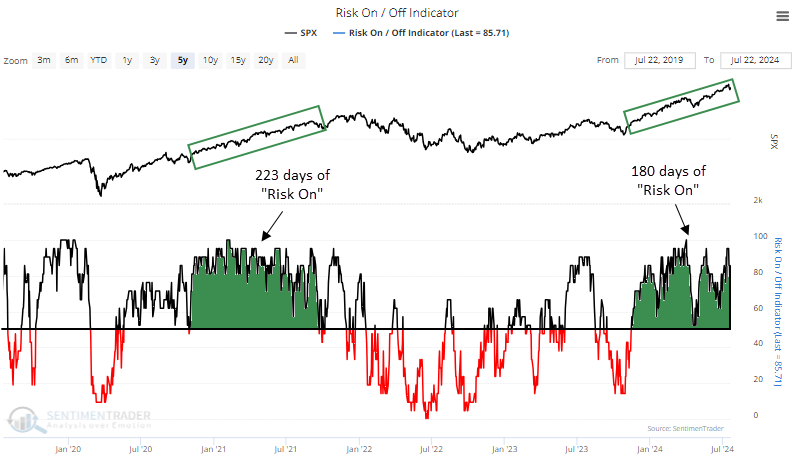
That 2021 stretch was one of the longest since we started calculating this measure in 2000, nearly 25 years ago. Only three streaks have been longer than the current one.
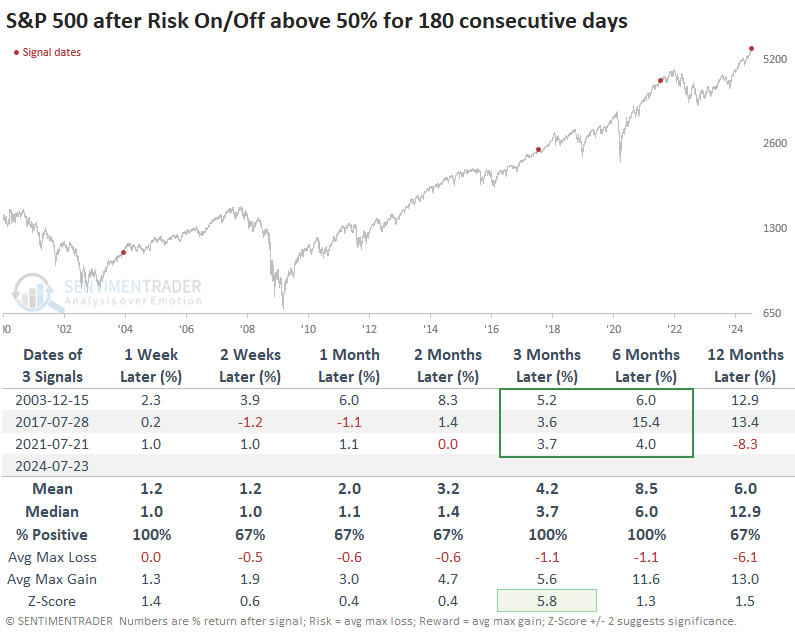
Just because investors were in risk-on mode for a long time didn't mean it was a negative for stock prices. It's mostly the opposite, actually. The sample size is laughably small, but the S&P 500 rose each time over the next 3-6 months.
Its maximum drawdown was less than -2% over the next six months after each signal, while its maximum gain averaged +11.6%. At some point, however, those gains were erased, even if it took years.
Persistent and lopsided
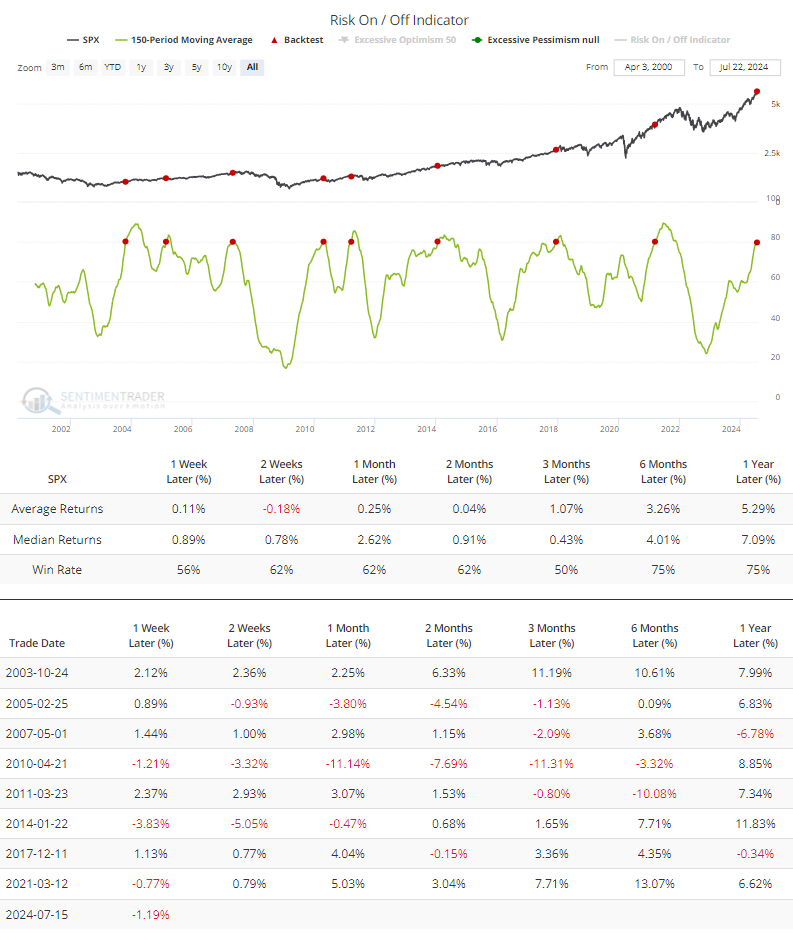
More troubling is just how risk-on the risk-on behavior has been. It has averaged more than 80% over the past 150 days. Other times it got this high since the financial crisis, further short-term gains were eventually erased.
According to the Backtest Engine, the S&P's returns in the months ahead were mixed. Over the next three months, it rose 44% of the time. But we can see how shorter-term gains tended to ease longer-term. Only two signals showed meaningful gains over the next 2-3 months, though those eased as the months wore on.
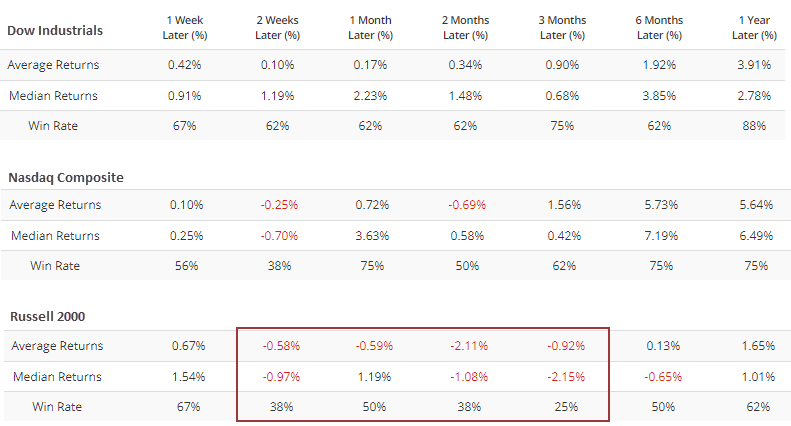
The Backtest Engine lets us see how other indexes and funds performed after these signals. Among the major equity indexes, the small-cap Russell 2000 fared the worst.
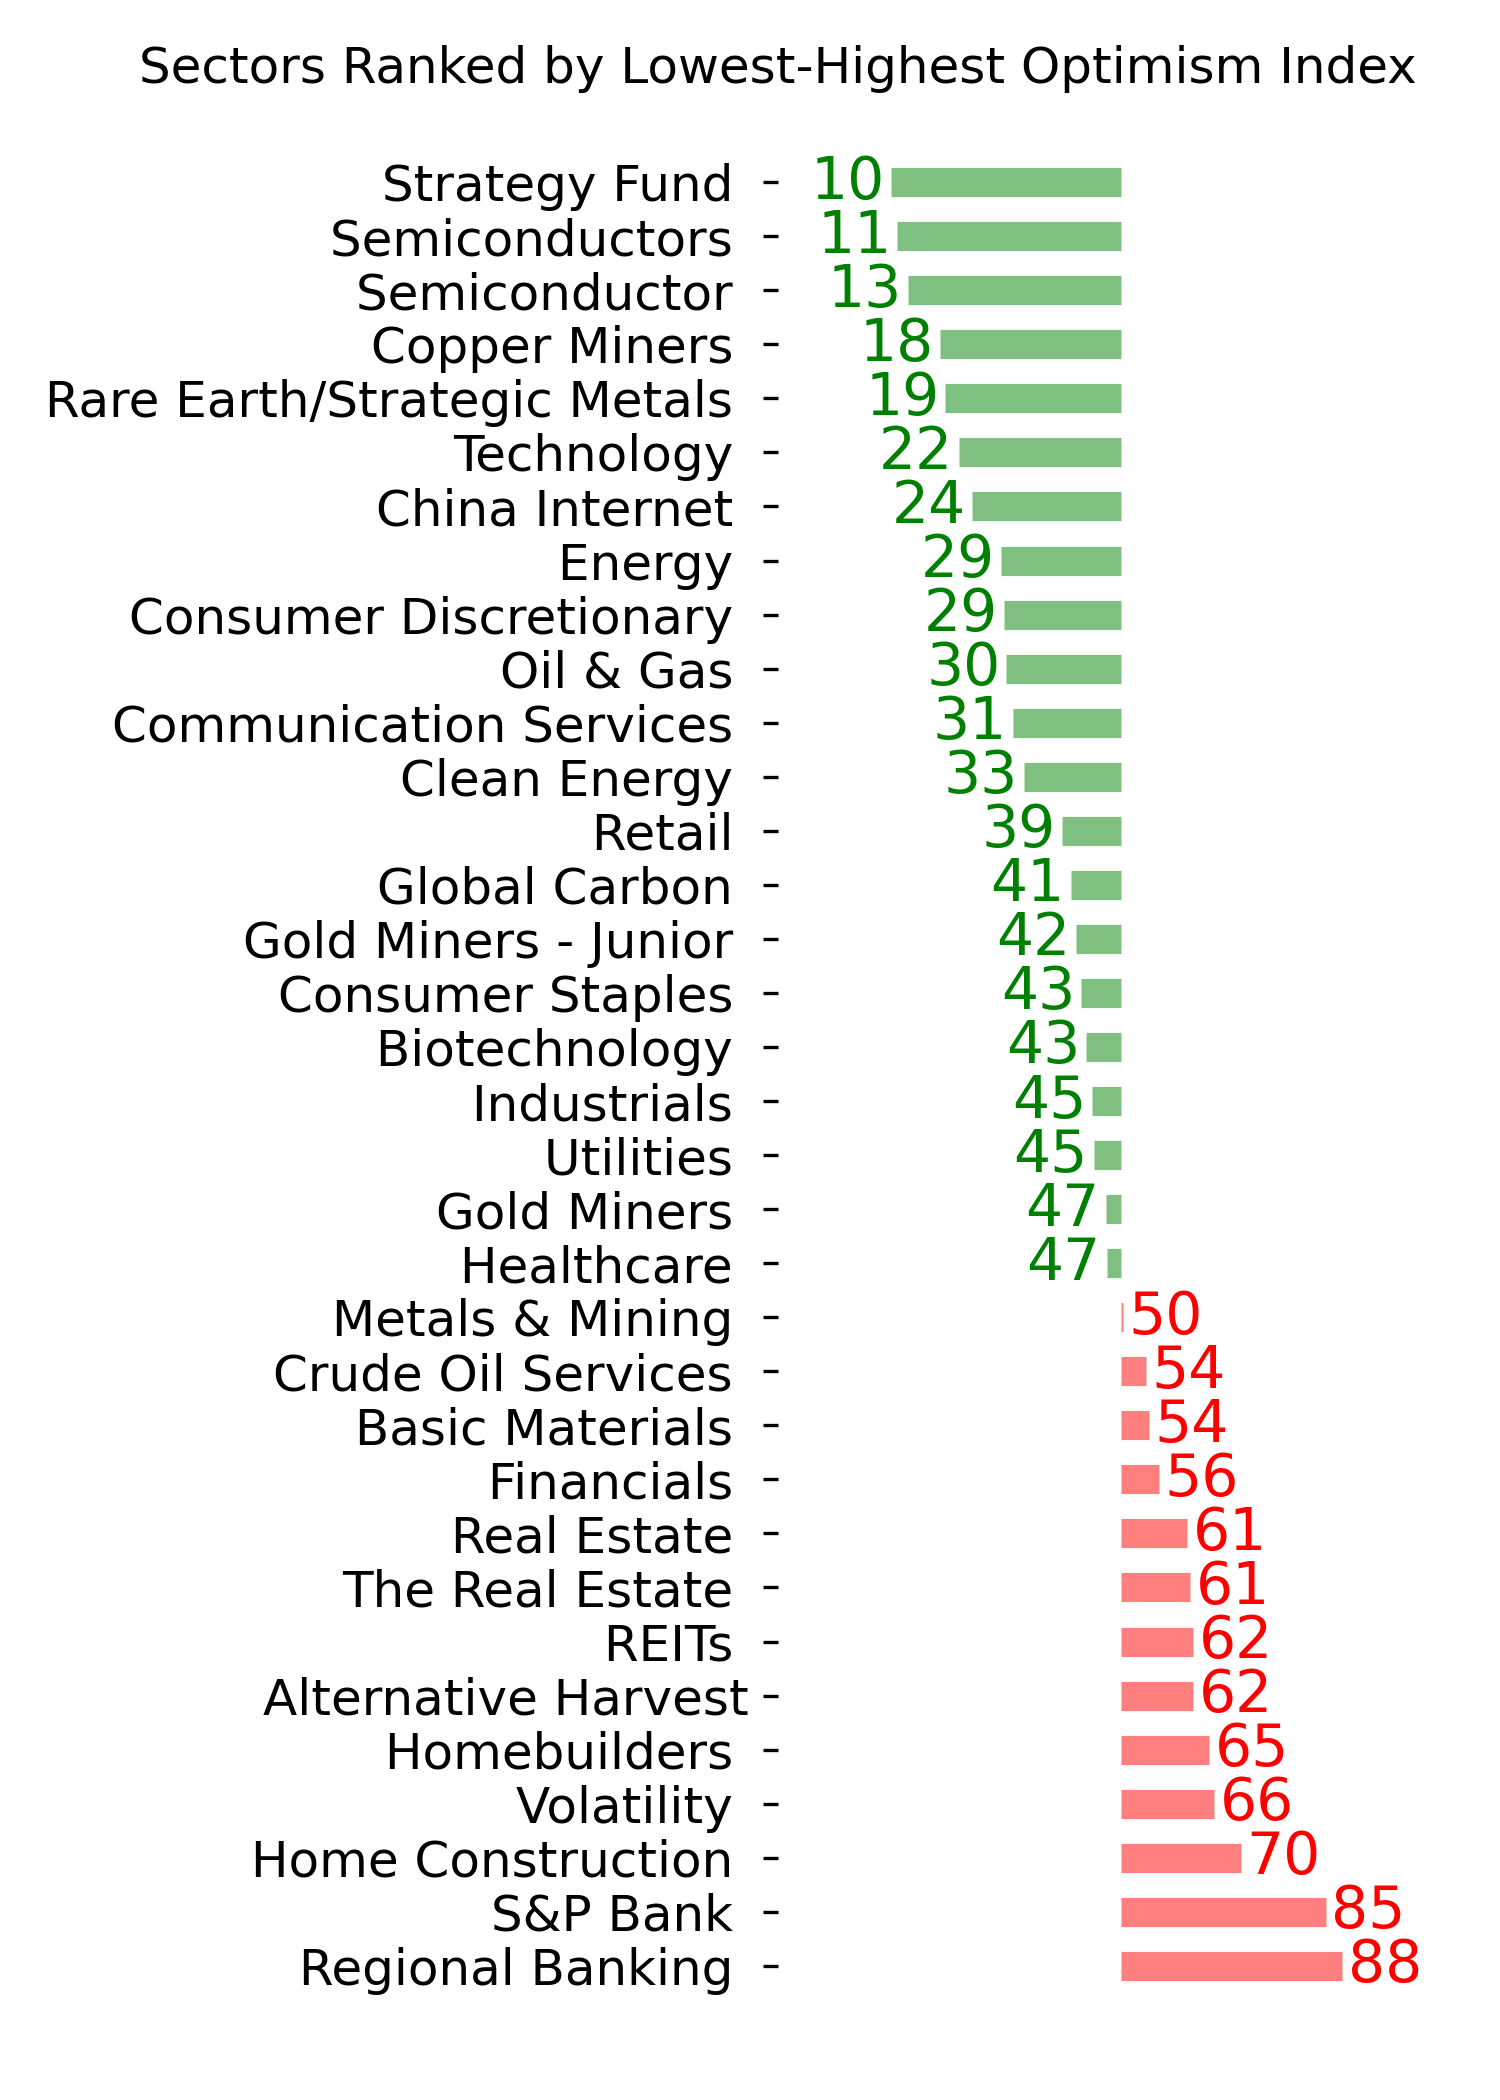
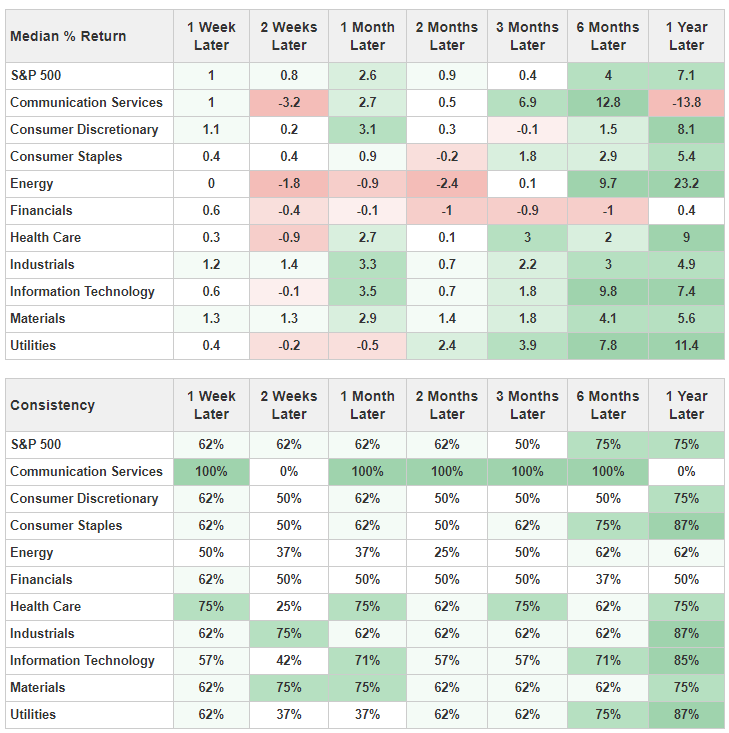
Using version 2.0 of the Engine (click here to load the parameters, then click the Run Backtest button), we can also see how major sectors performed after these extended periods of risk-on behavior. We shouldn't be too surprised that defensive stocks like health care, staples, and utilities tended to hold up better than most.
What the research tells us...
Investors are very confident, and it's hard to blame them. The average stock is catching up to the indexes, which has relieved some of the most troubling behavior from a month ago. Stocks are recovering quickly from short-term mini-panics, and we're hovering near record highs even with some of the most remarkable political developments in U.S. history.
Experienced investors understand that it's usually wise to be wary when it seems like we're in a Teflon market. While momentum can carry for weeks or even months, those short-term good feelings are almost always wiped away when the next disruption interrupts the good feelings. The fact that investors have been in a risk-on mood for nine months adds to the idea that nothing can take stocks down at this point, and that's also a reason to be a bit wary about counting on further sustained outsized gains.
Indicators at Extremes
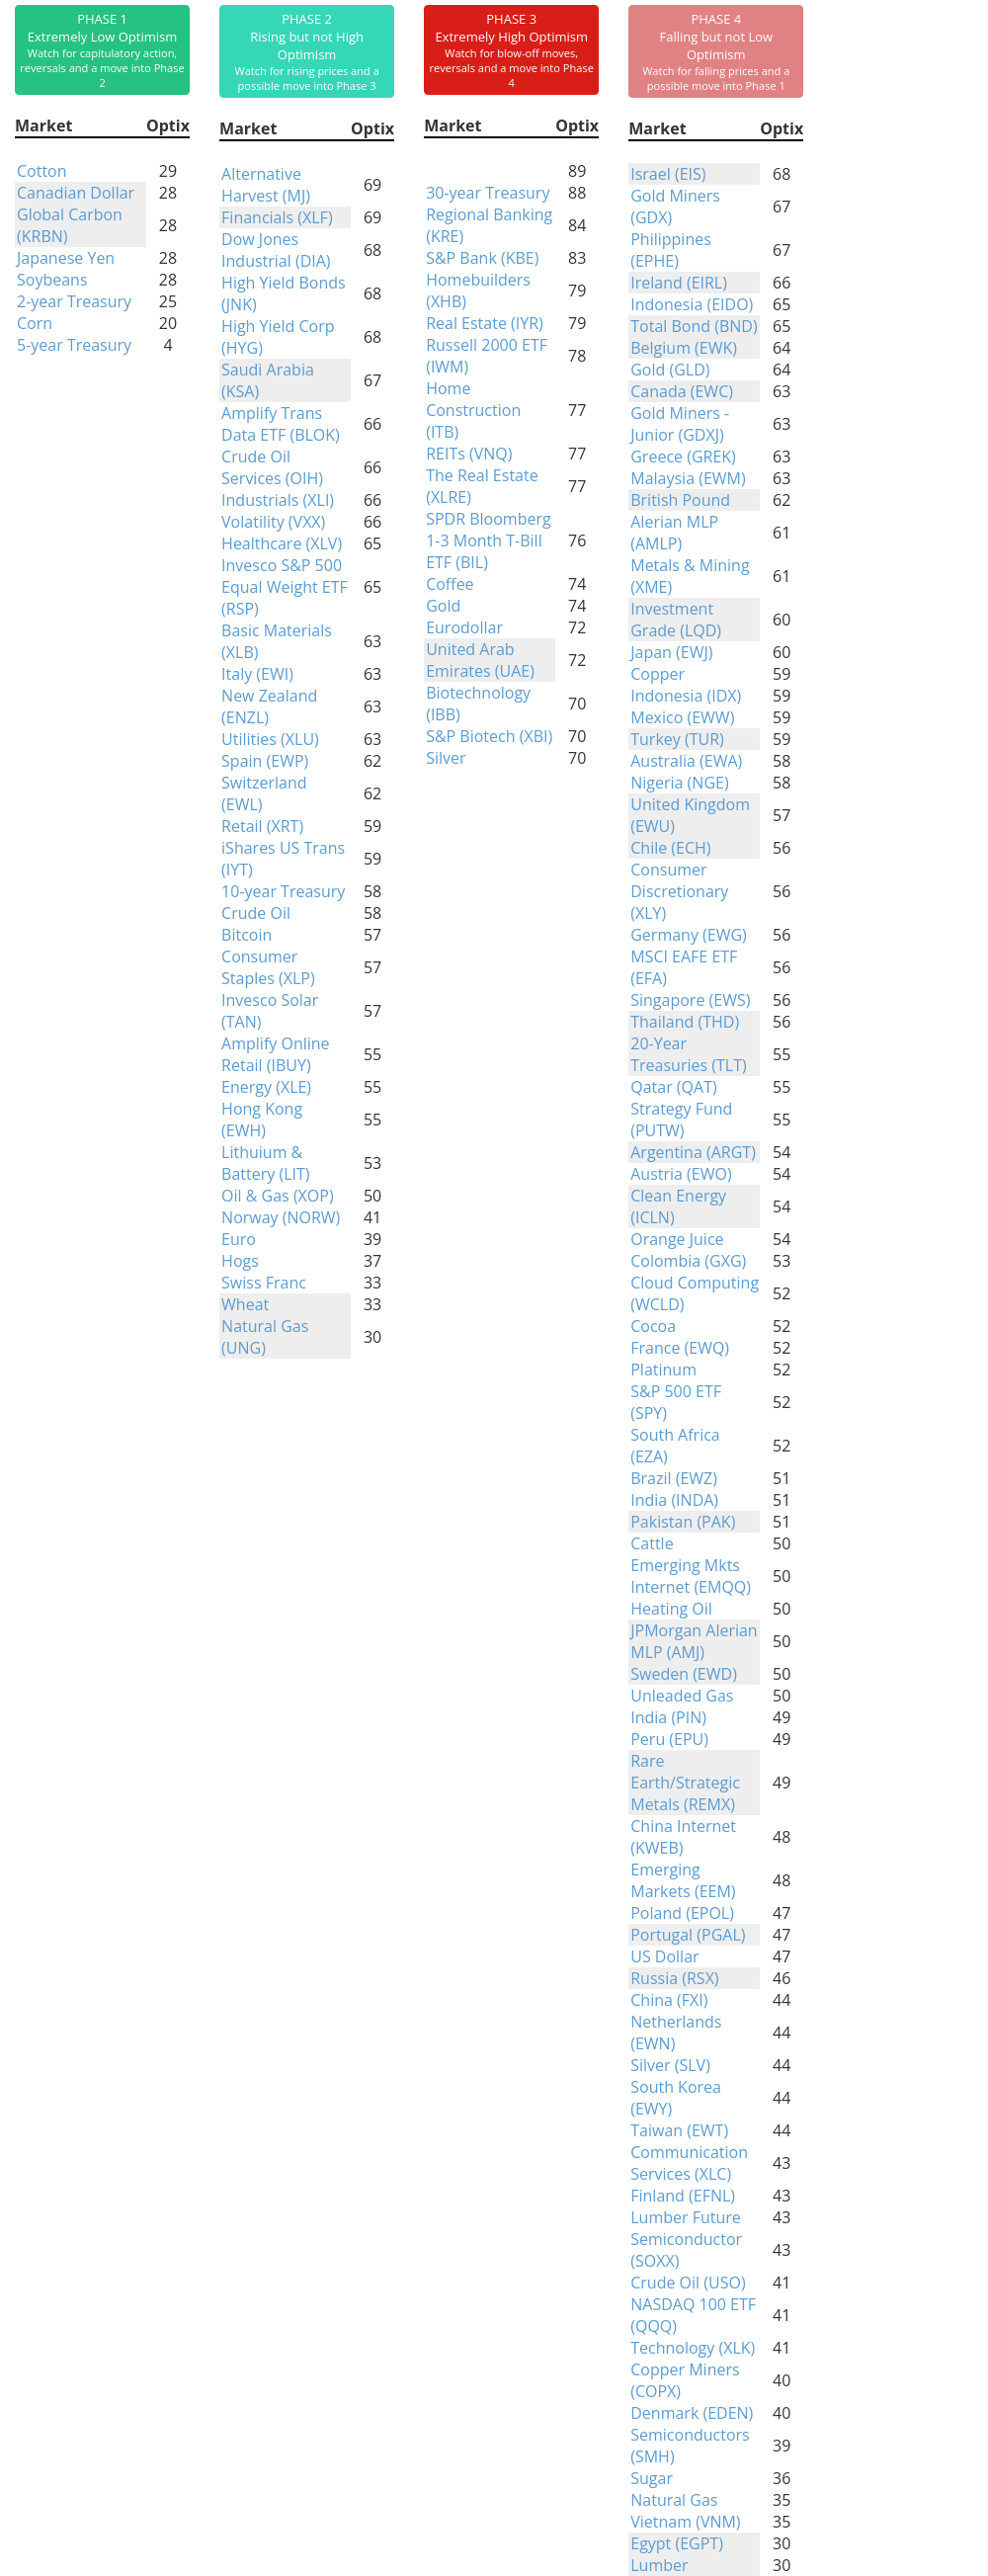
Phase Table
Ranks
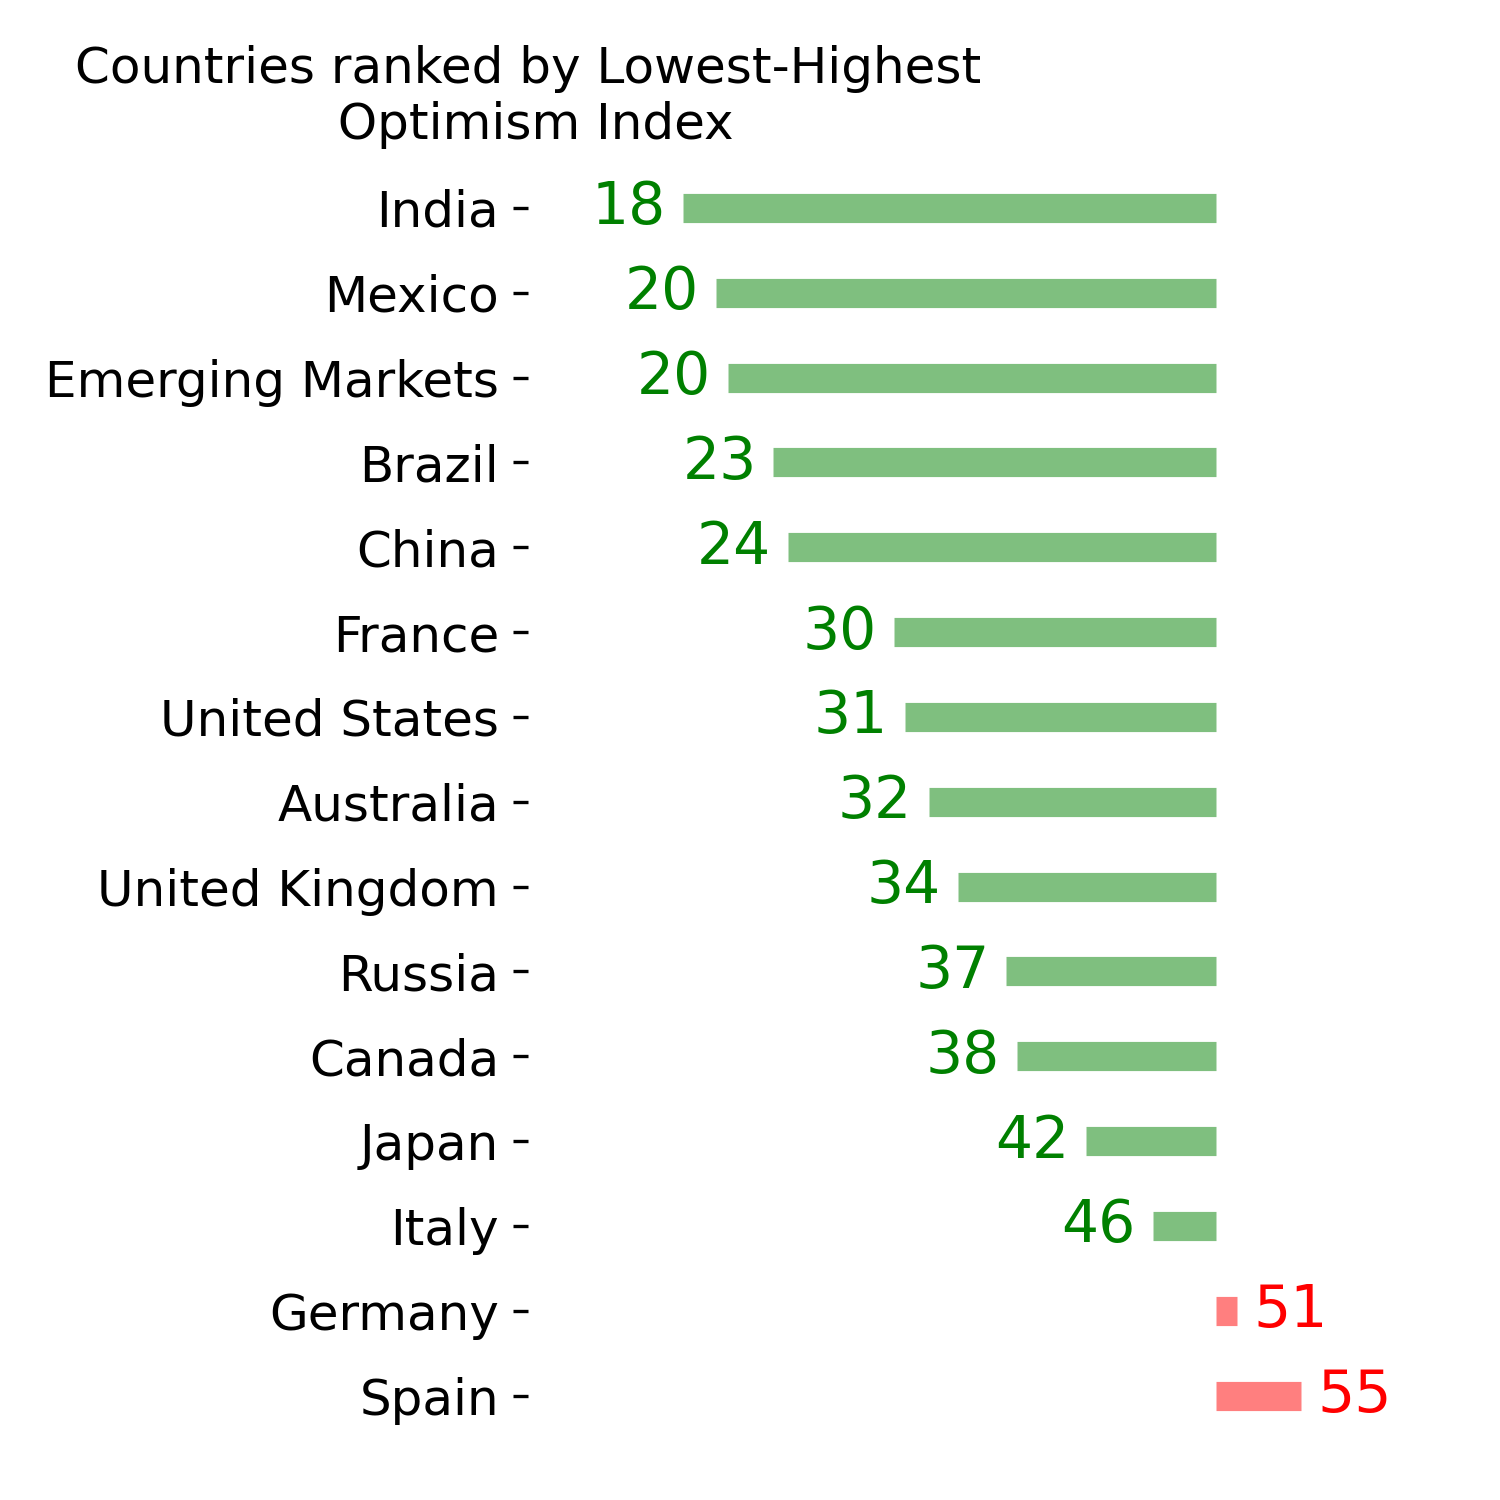
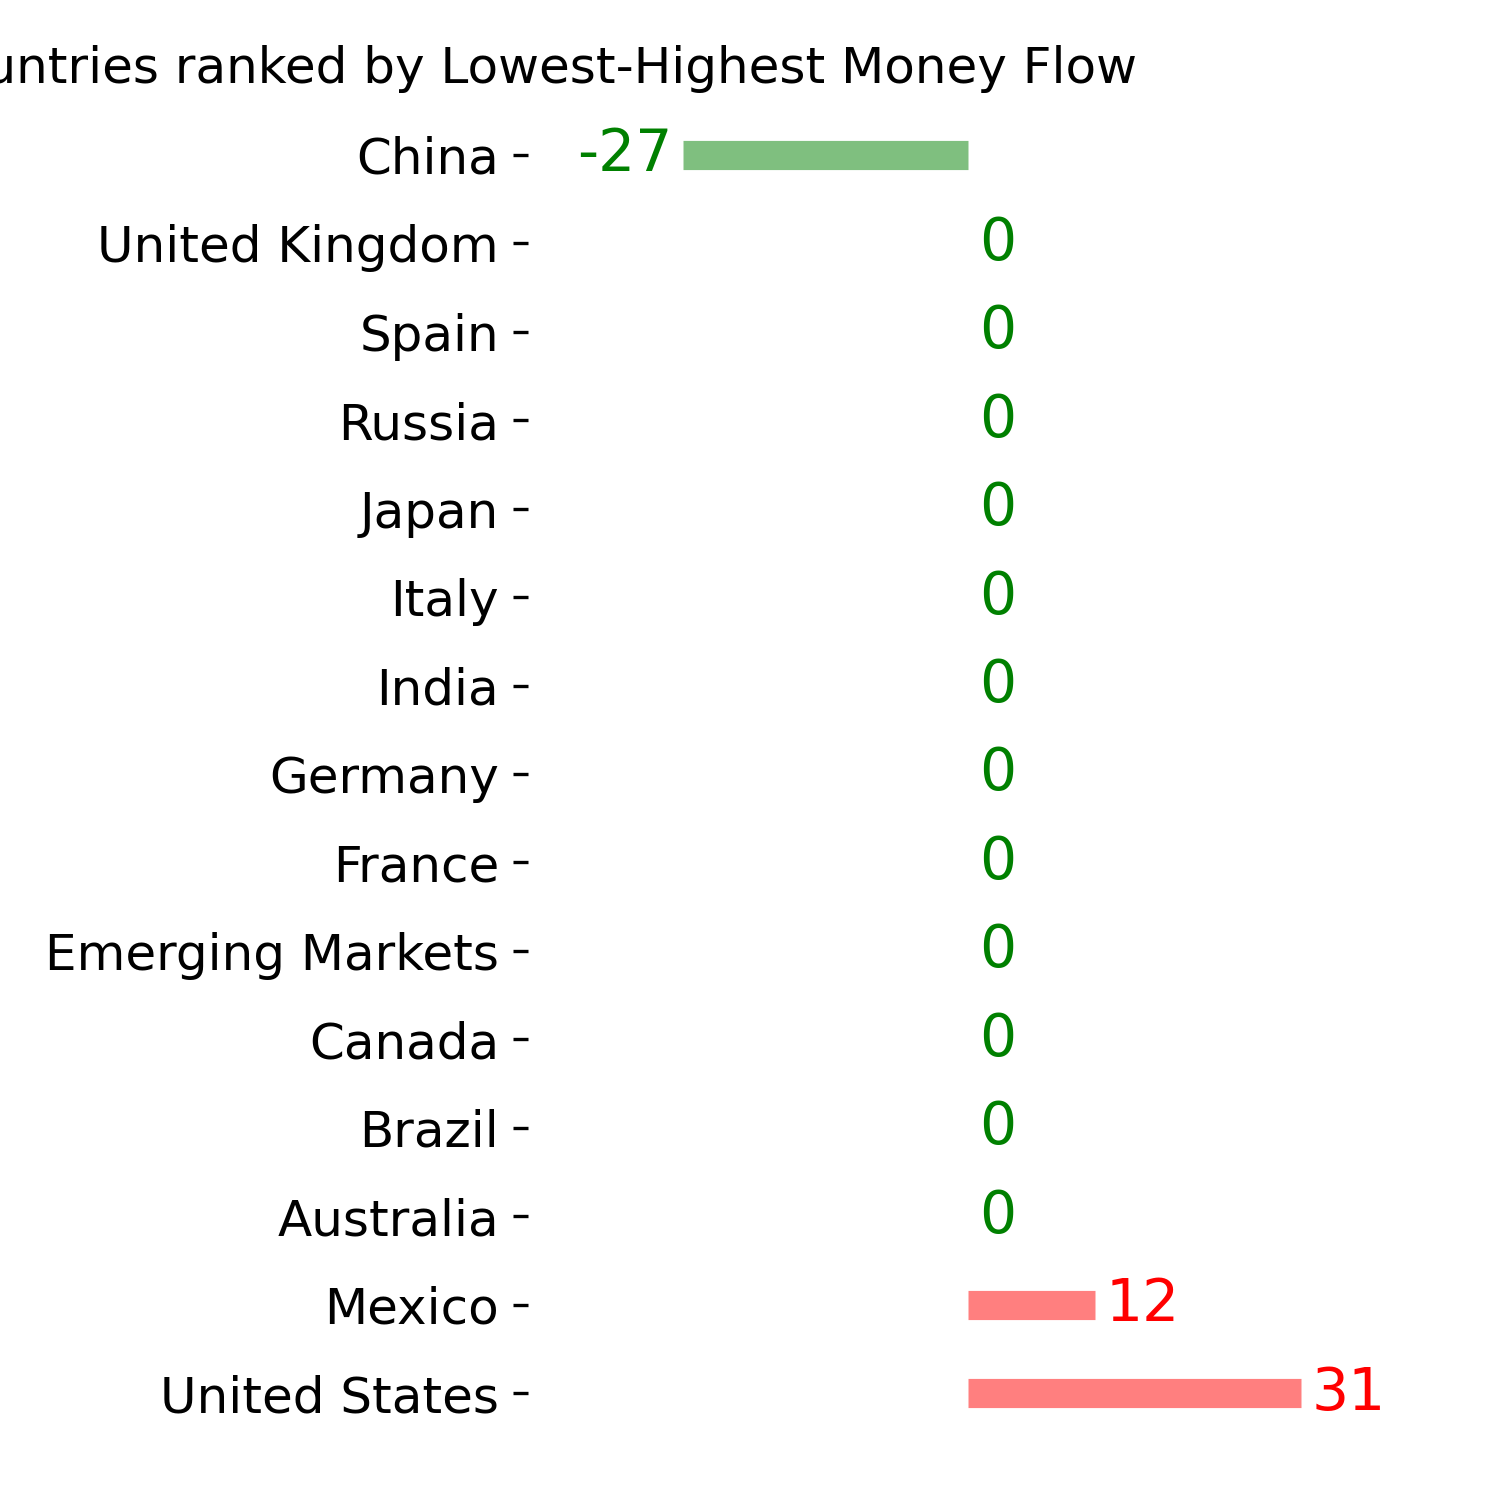
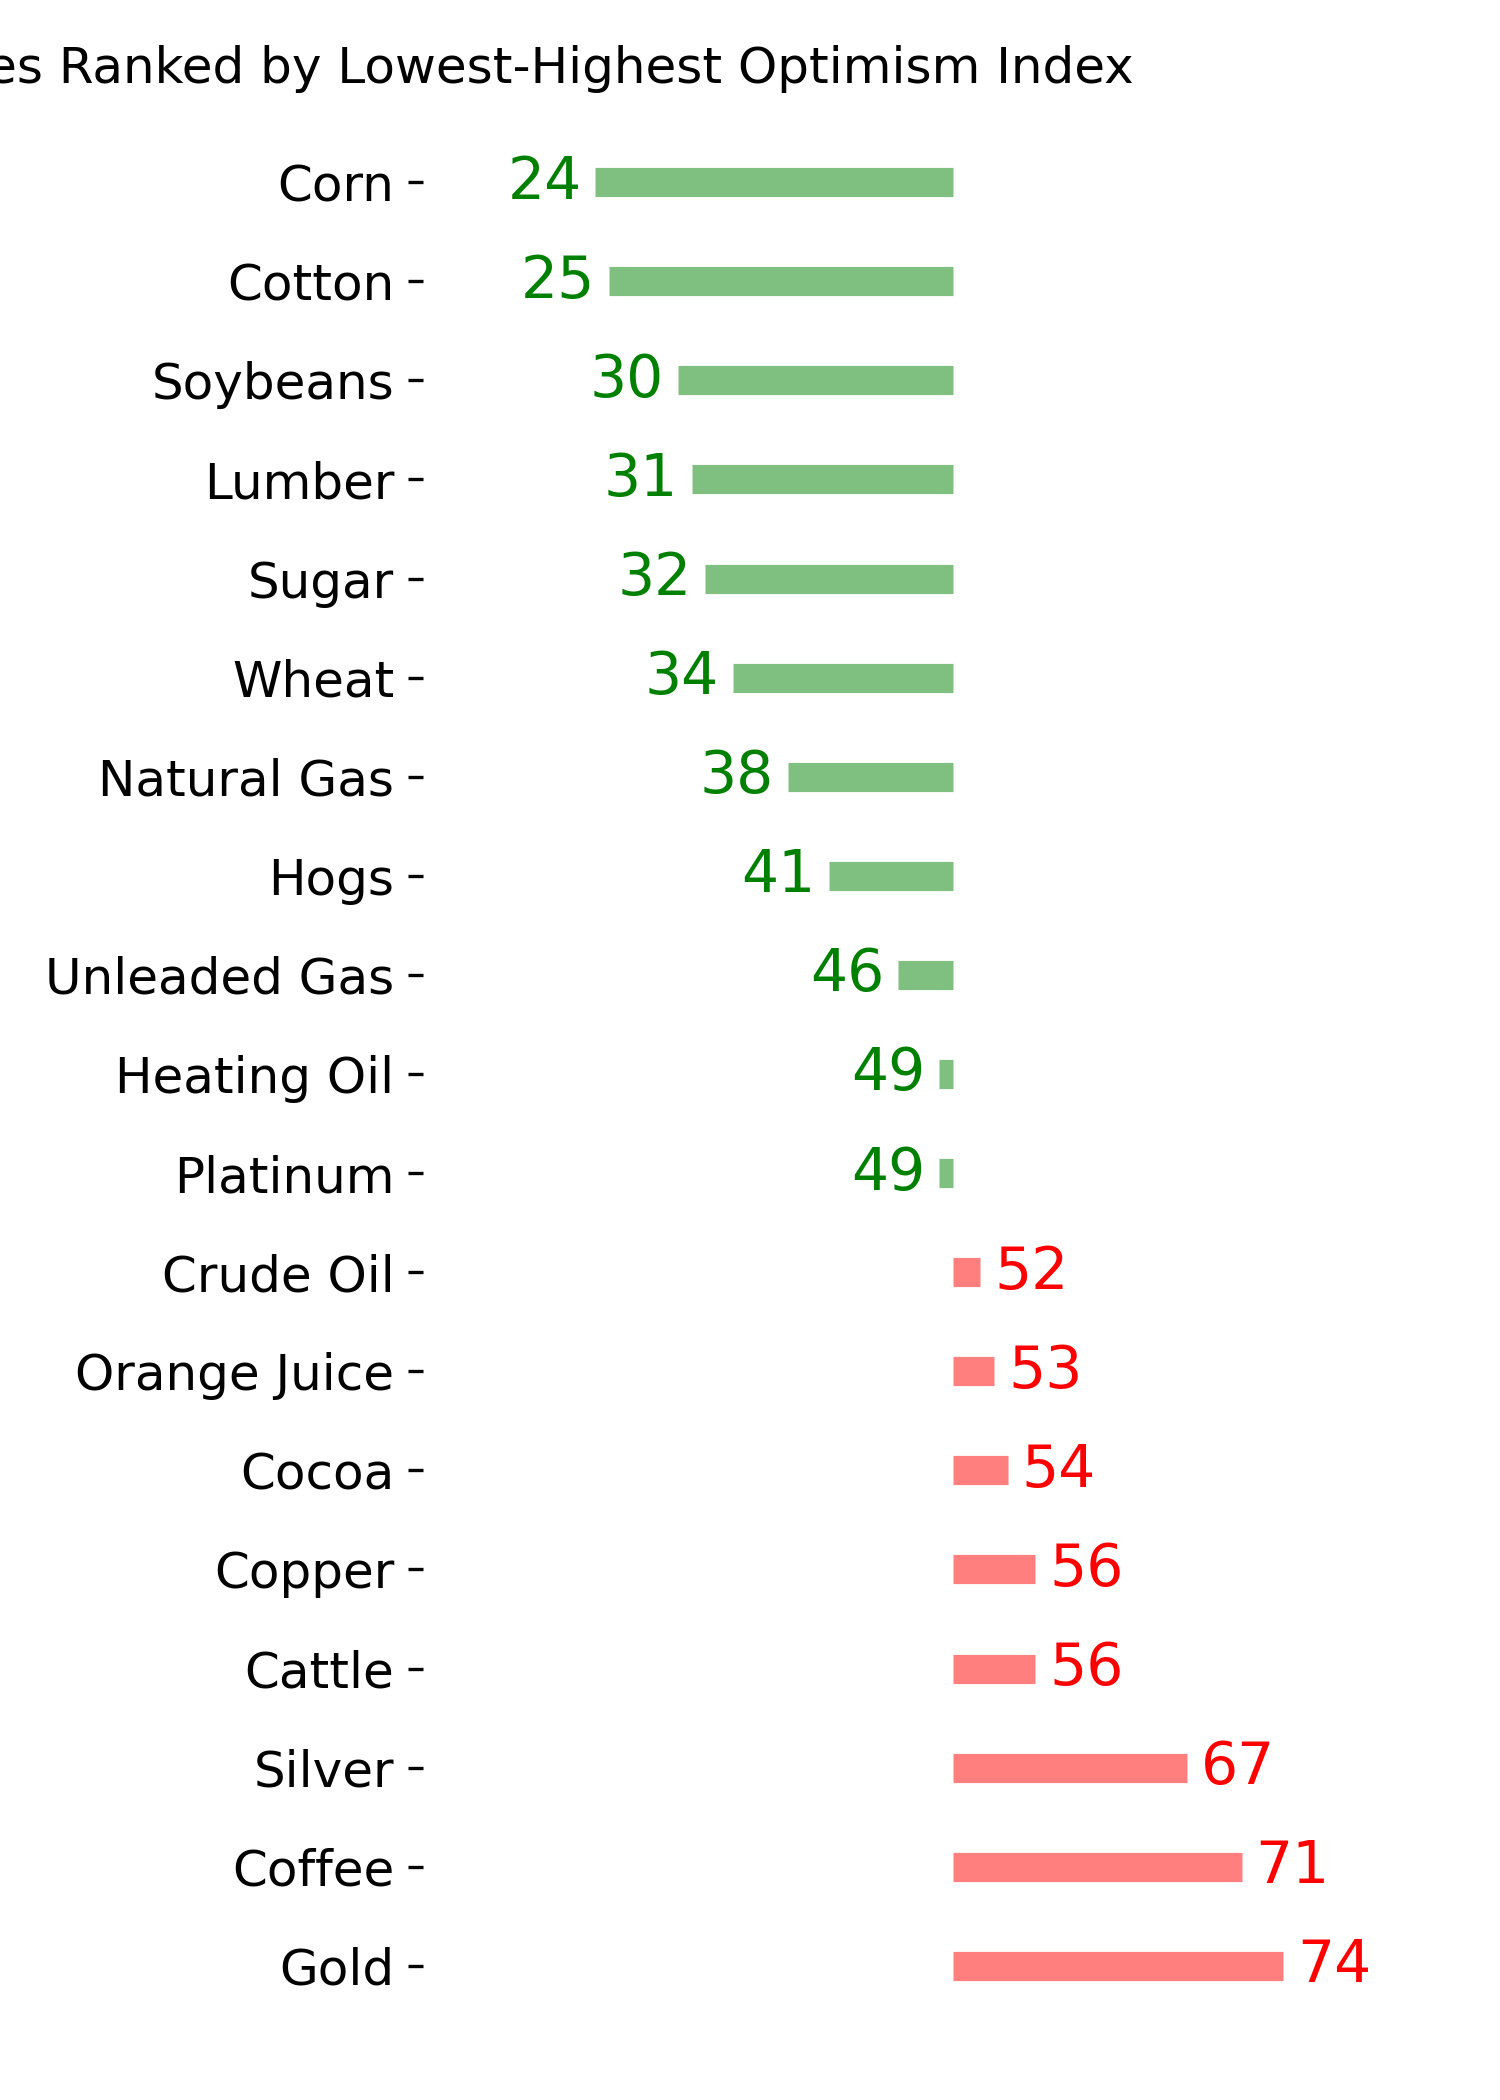
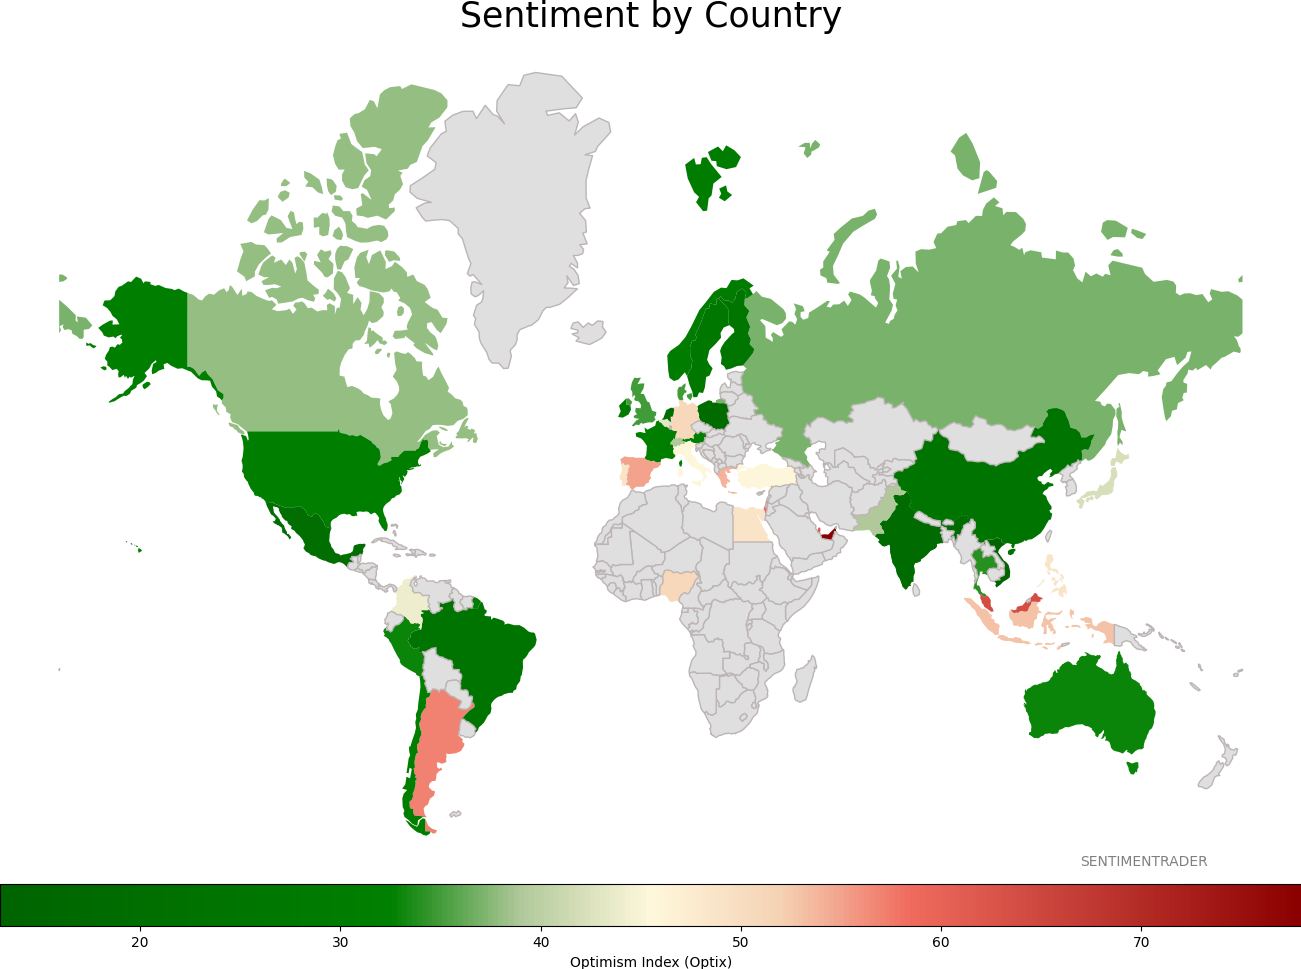
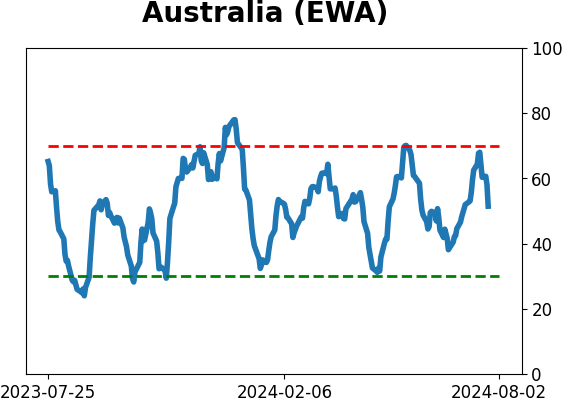
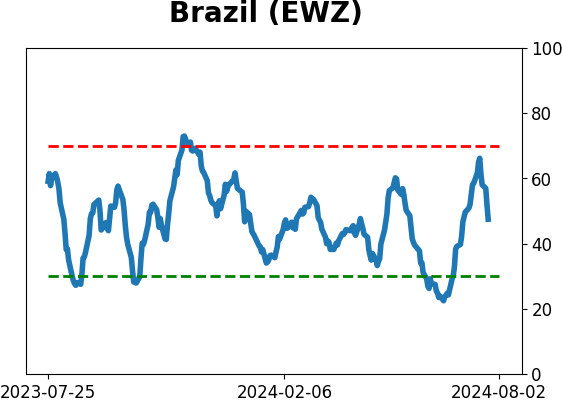
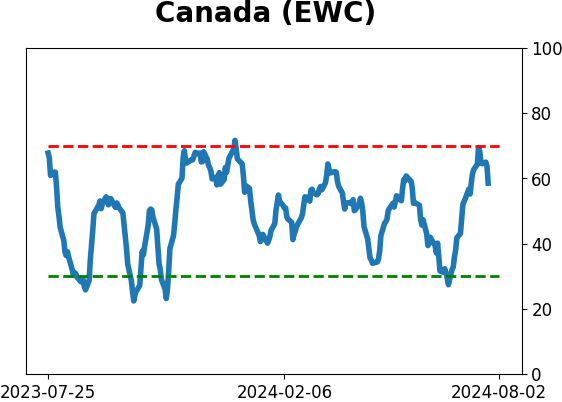
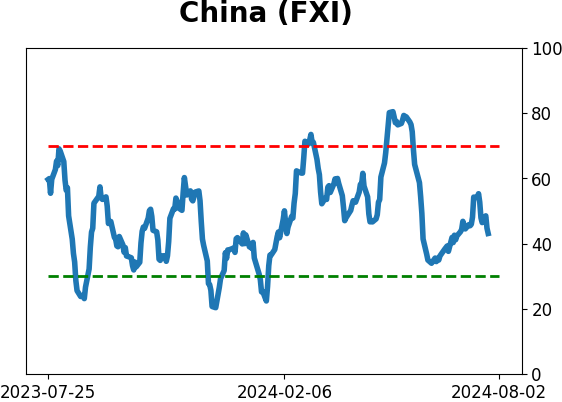
Sentiment Around The World
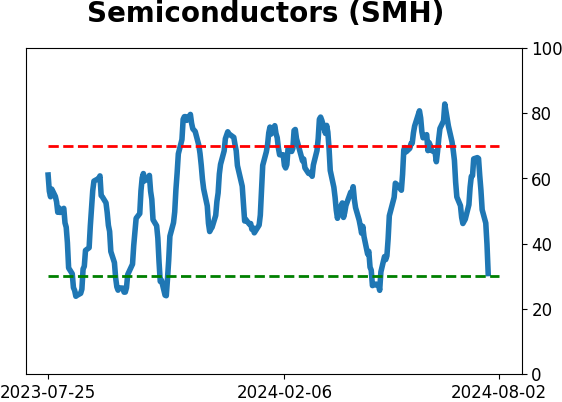
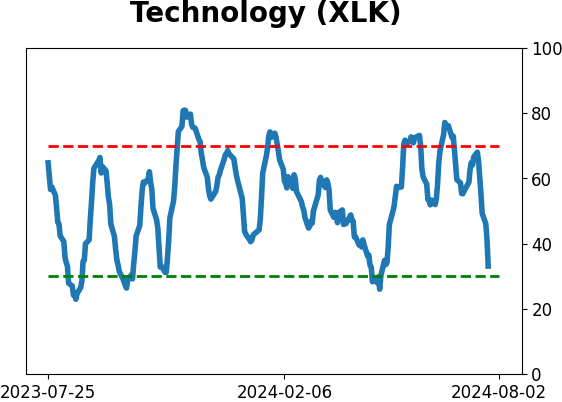
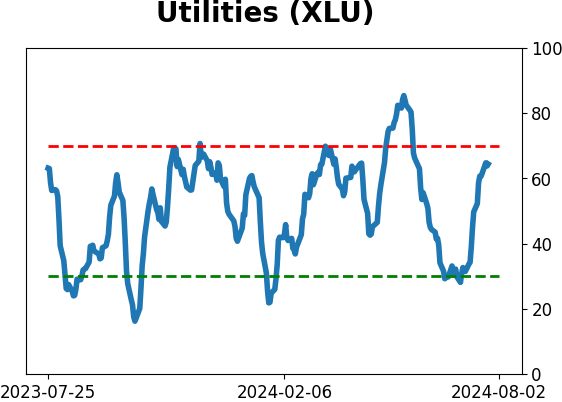
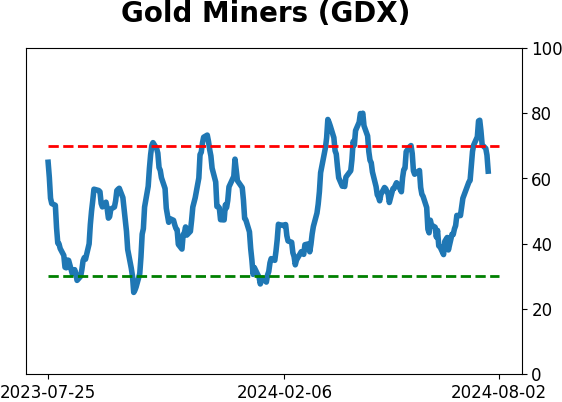
Optimism Index Thumbnails
|
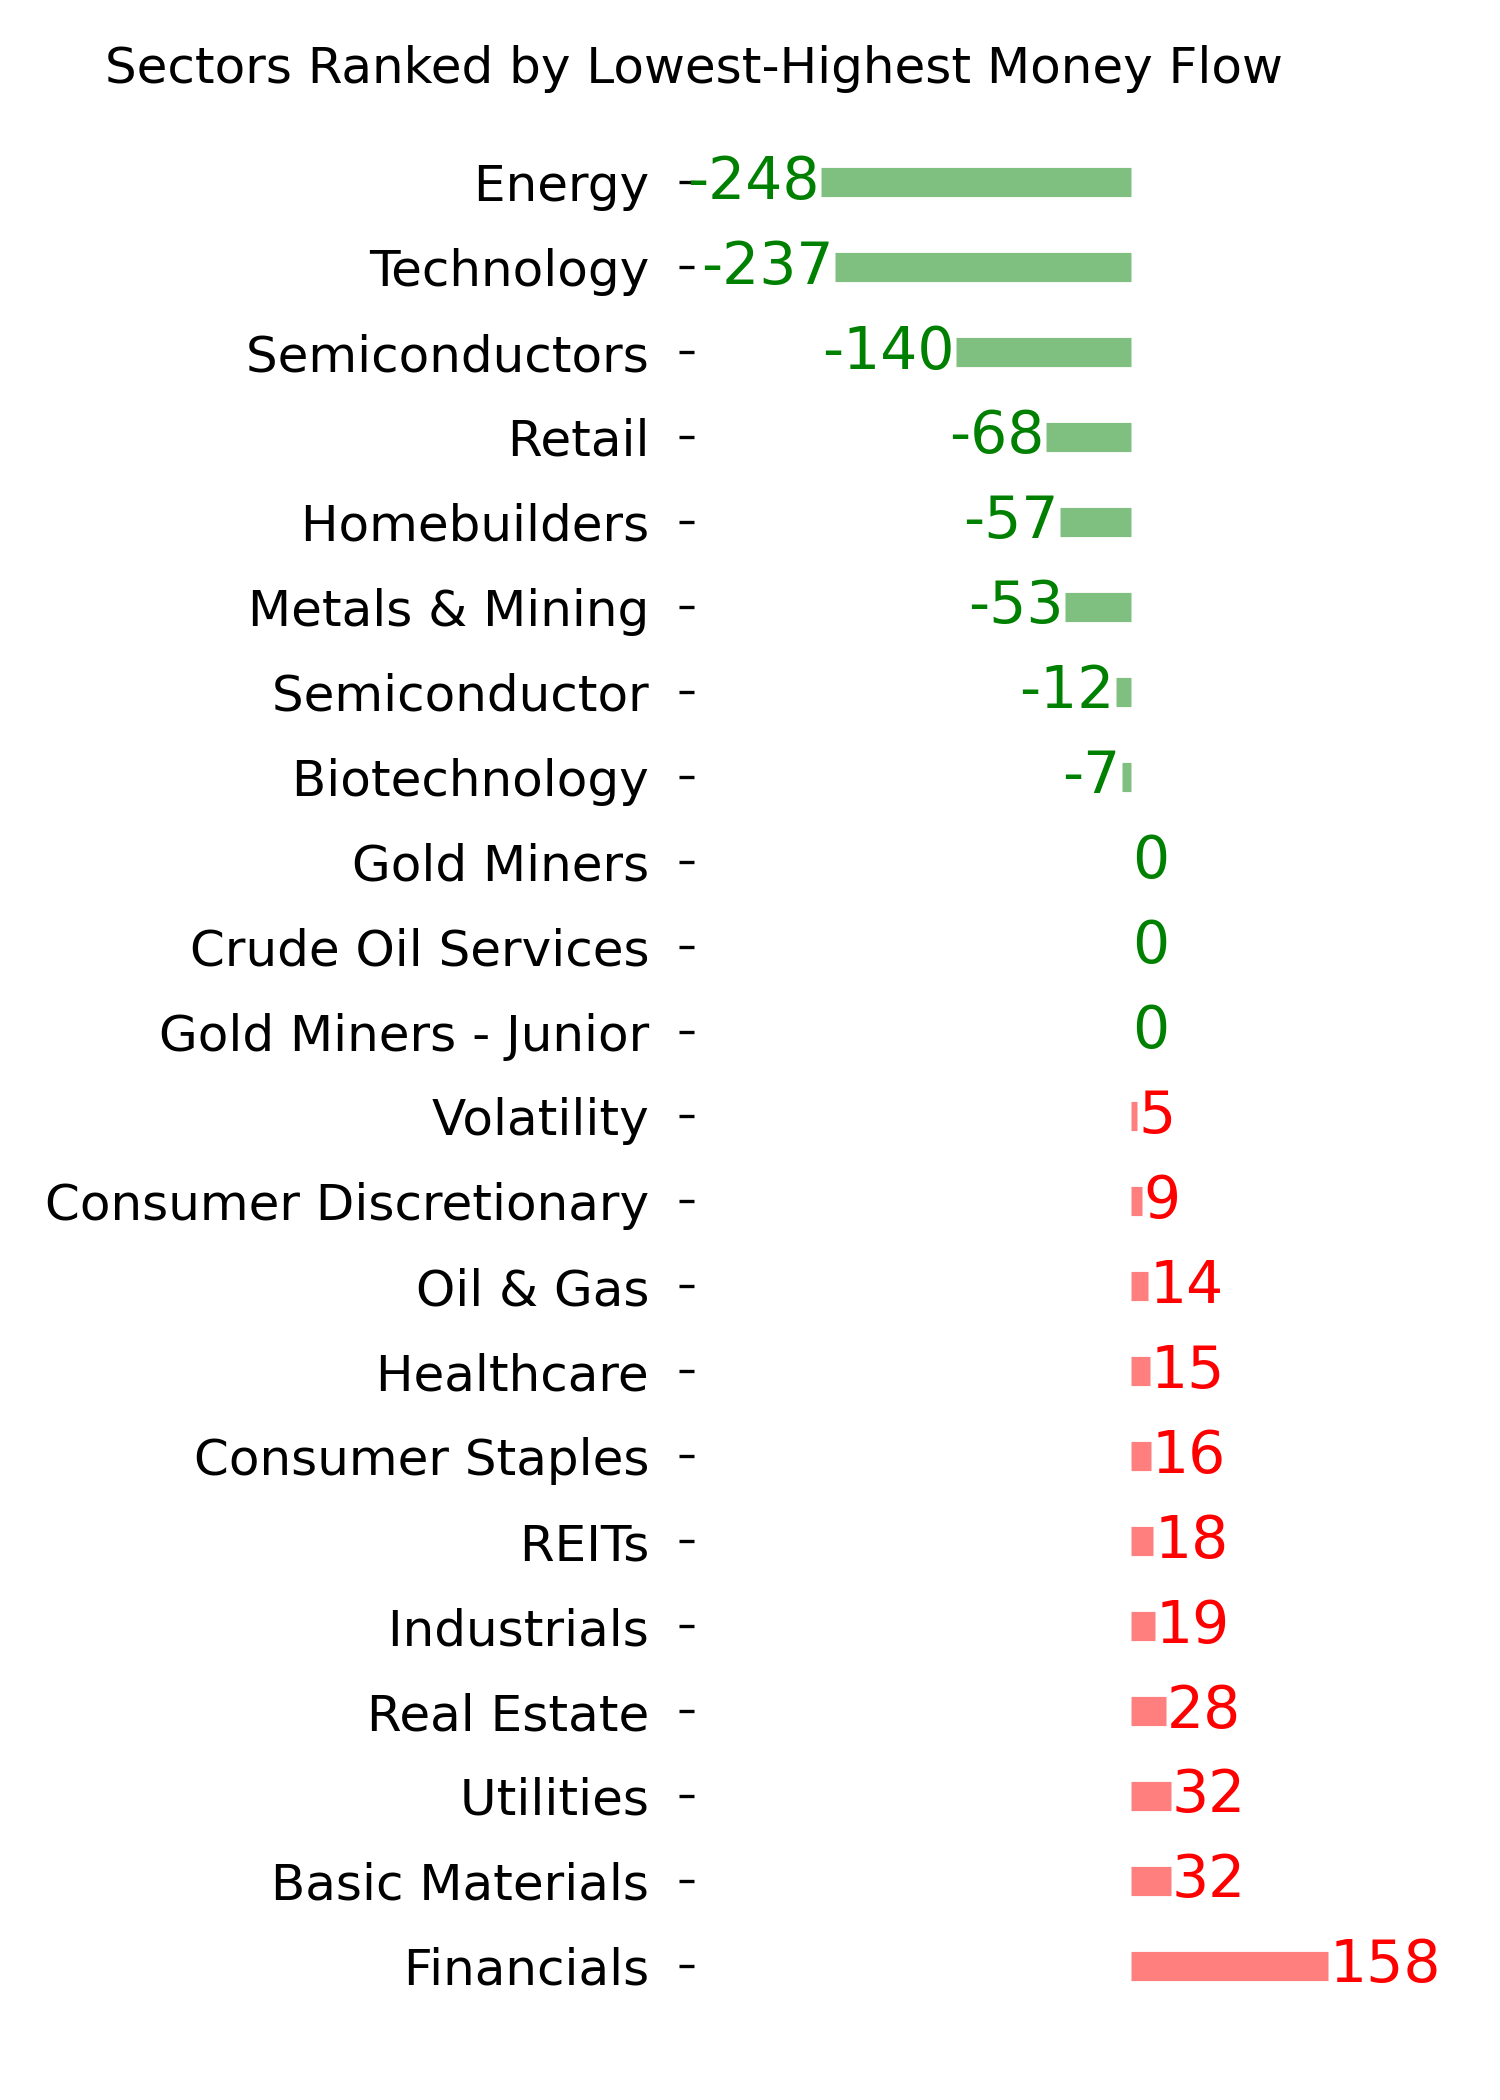
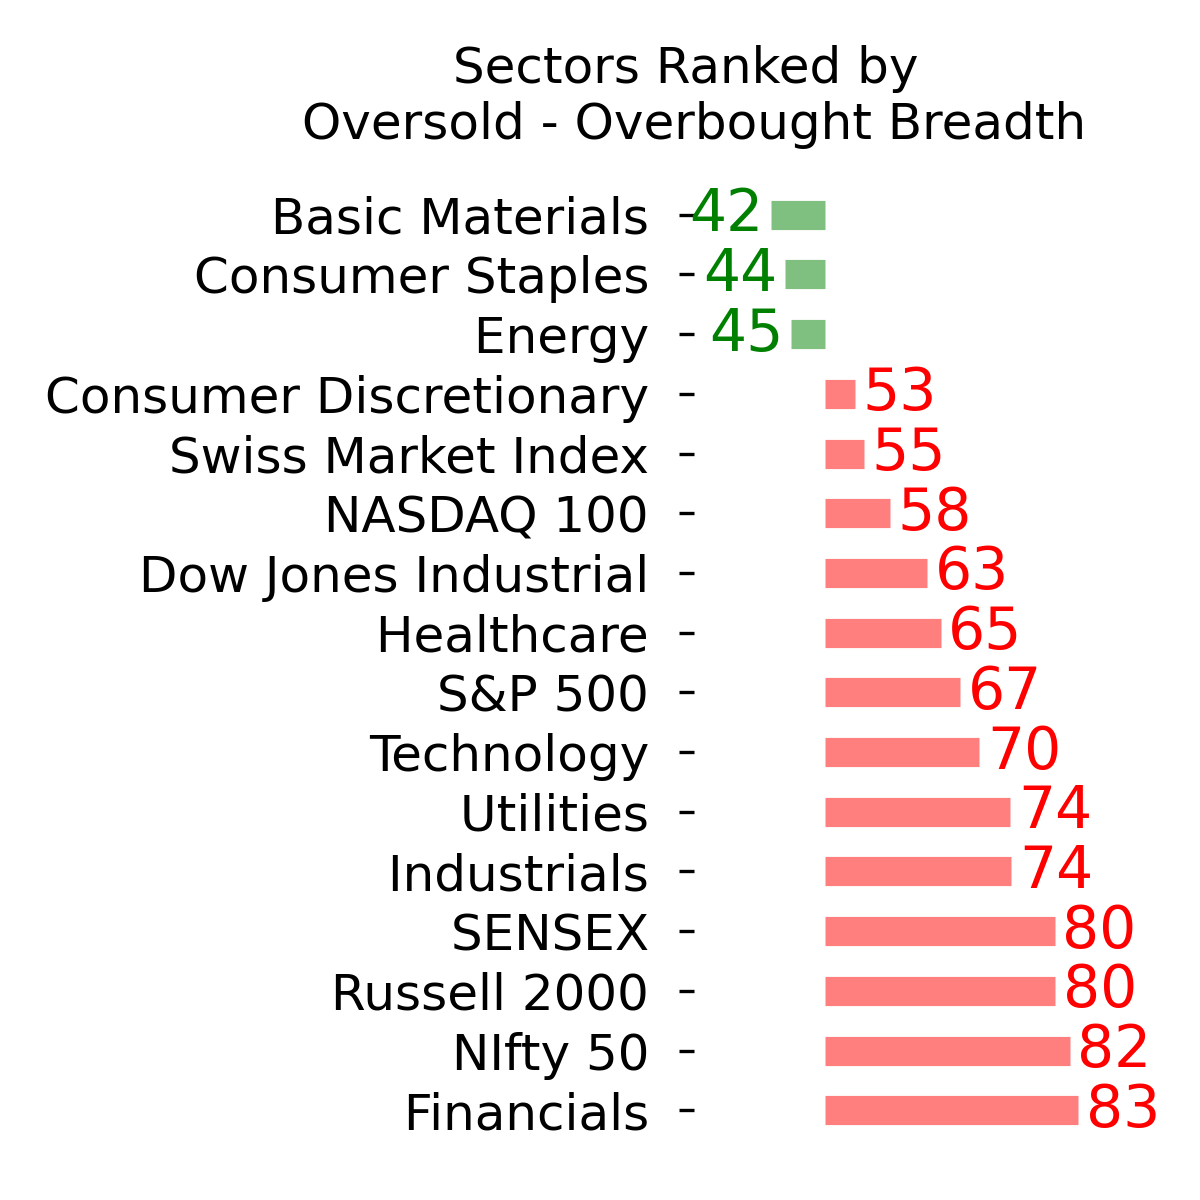
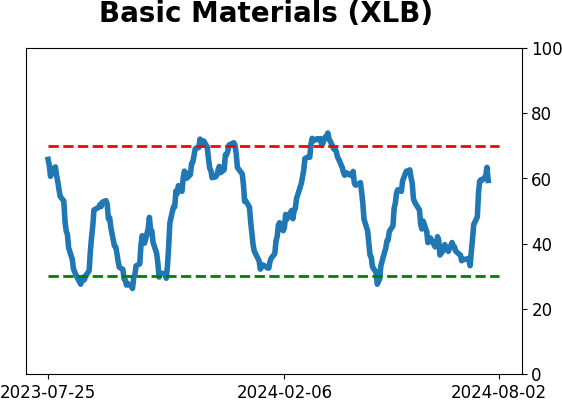
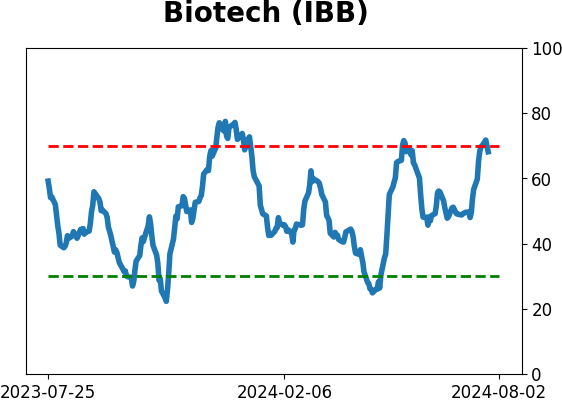
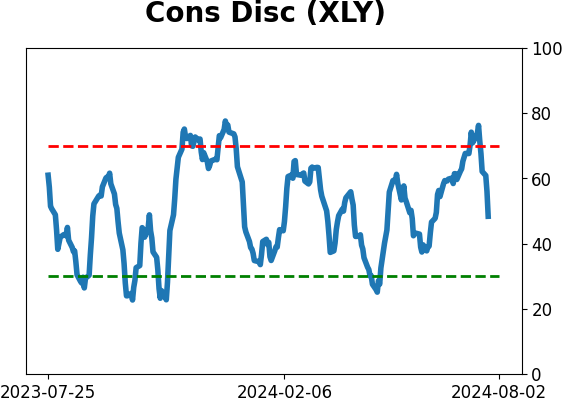
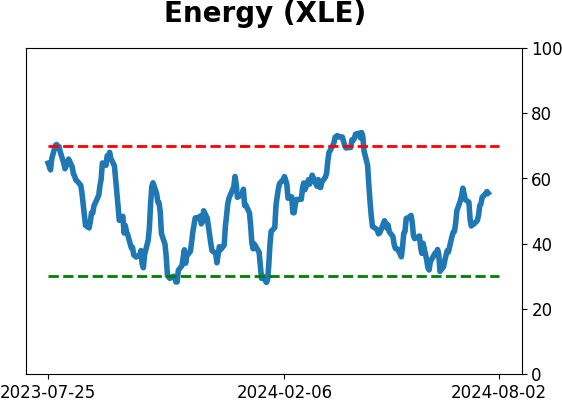
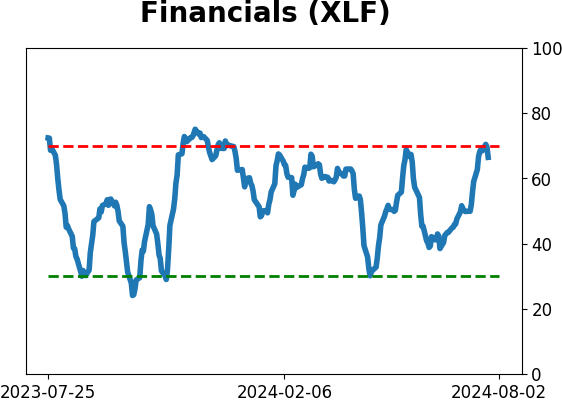
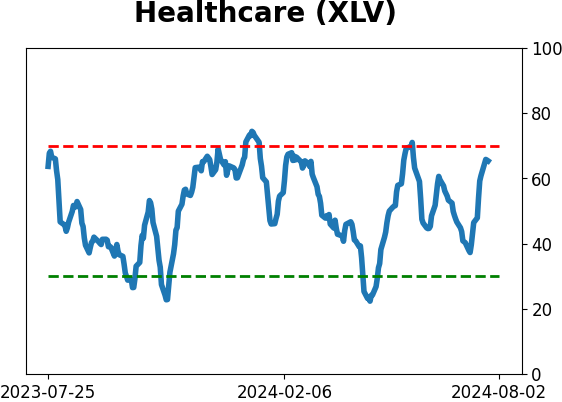
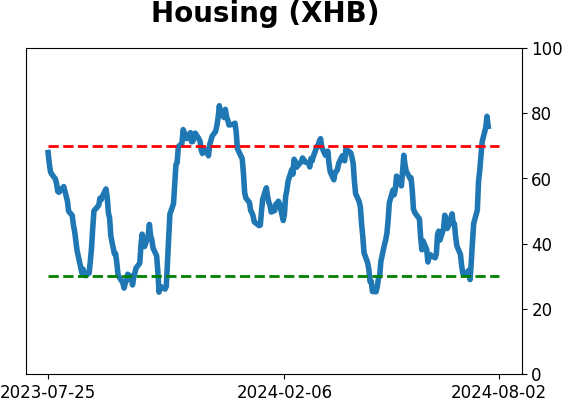
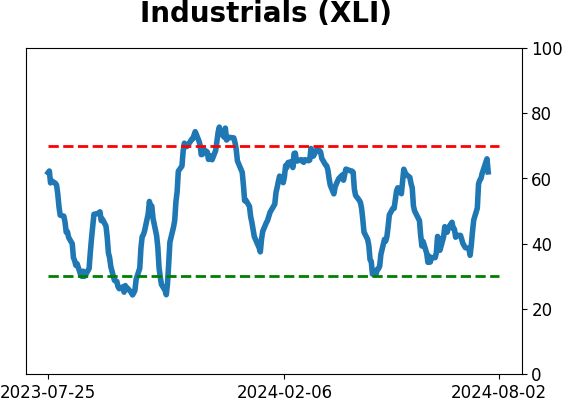
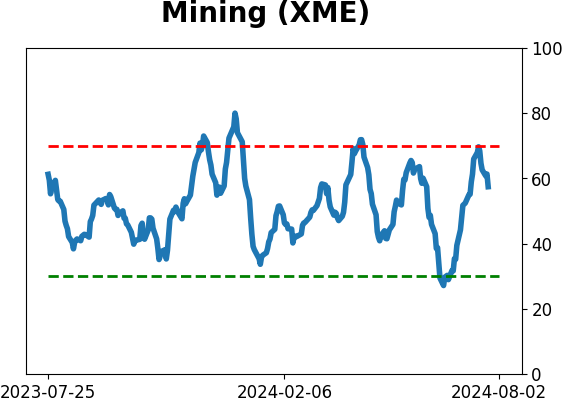
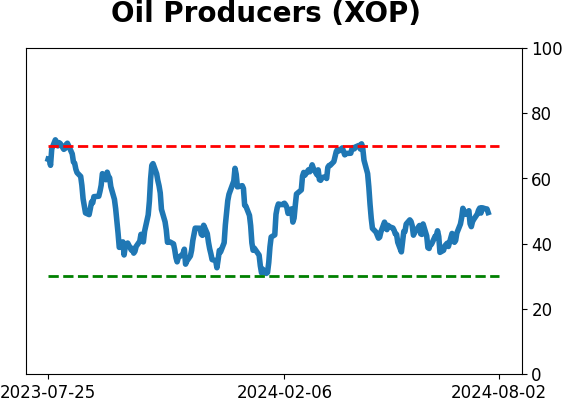
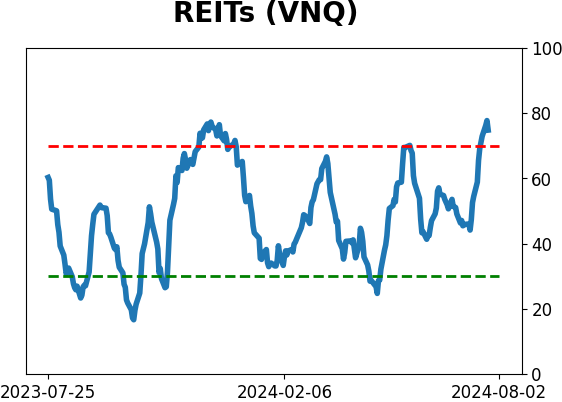
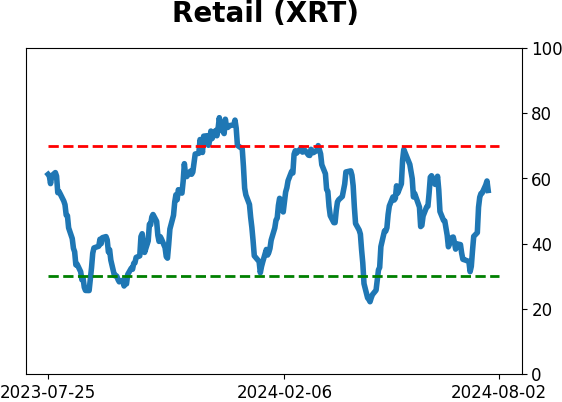
Sector ETF's - 10-Day Moving Average
|
|
|
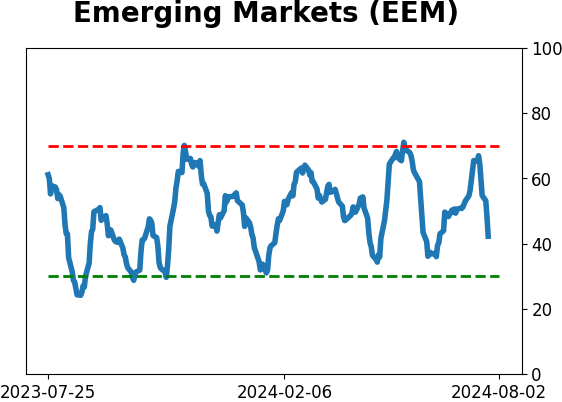
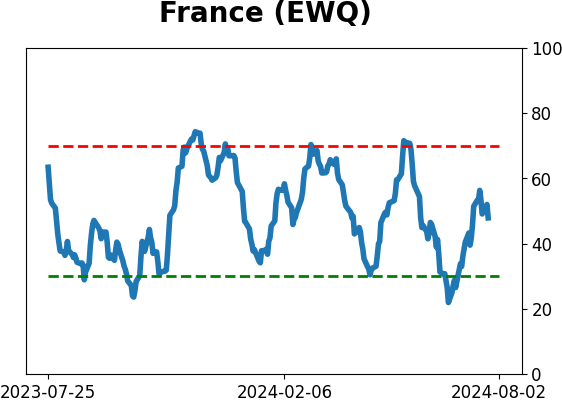
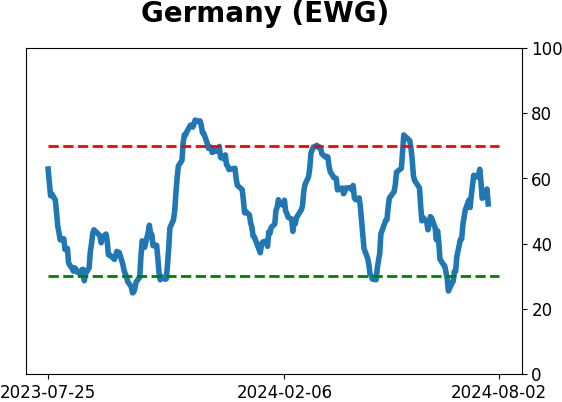
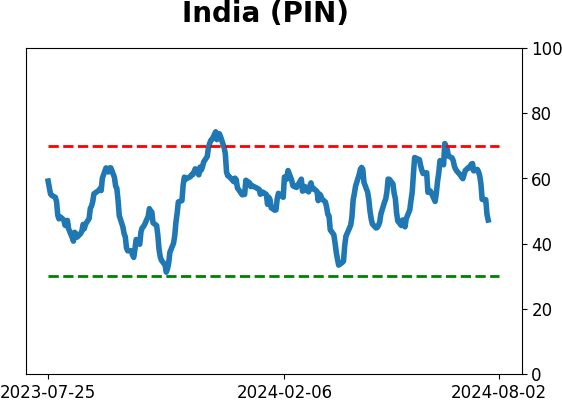
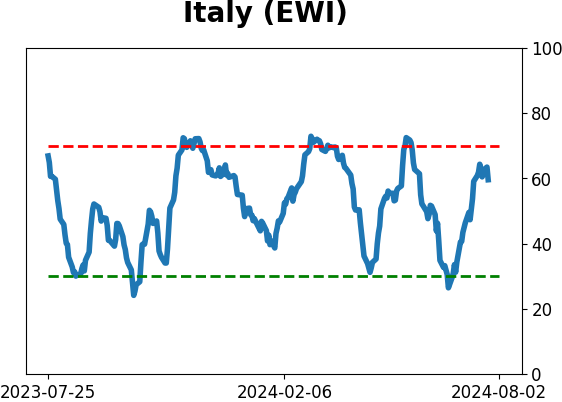
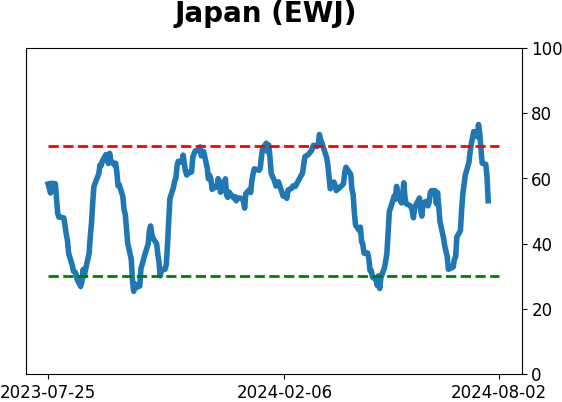
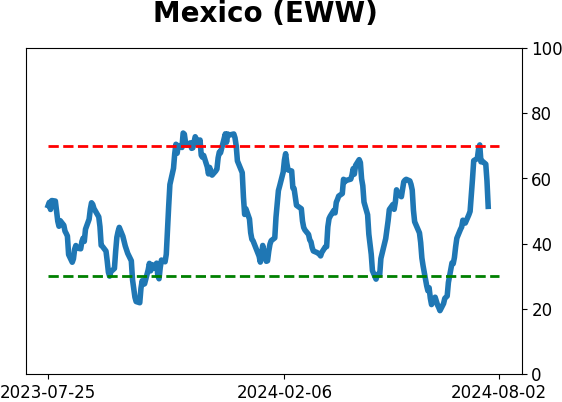
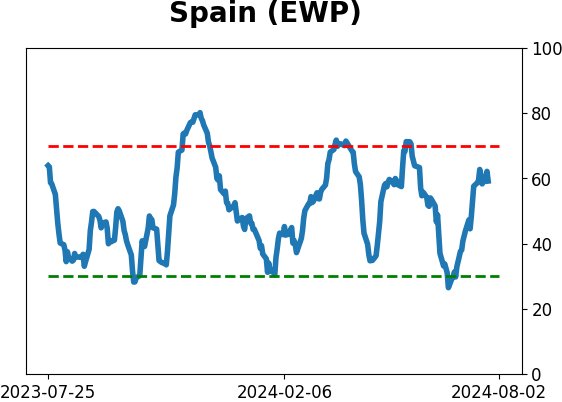
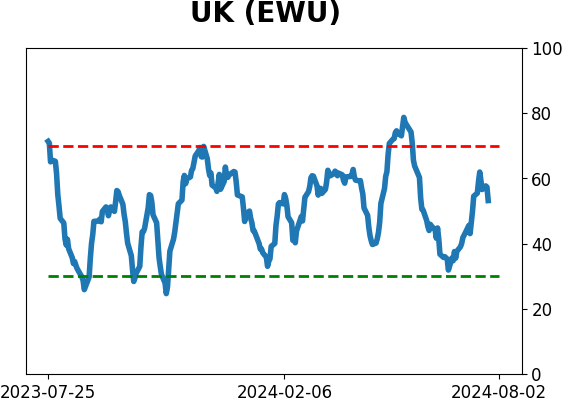
Country ETF's - 10-Day Moving Average
|
|
|
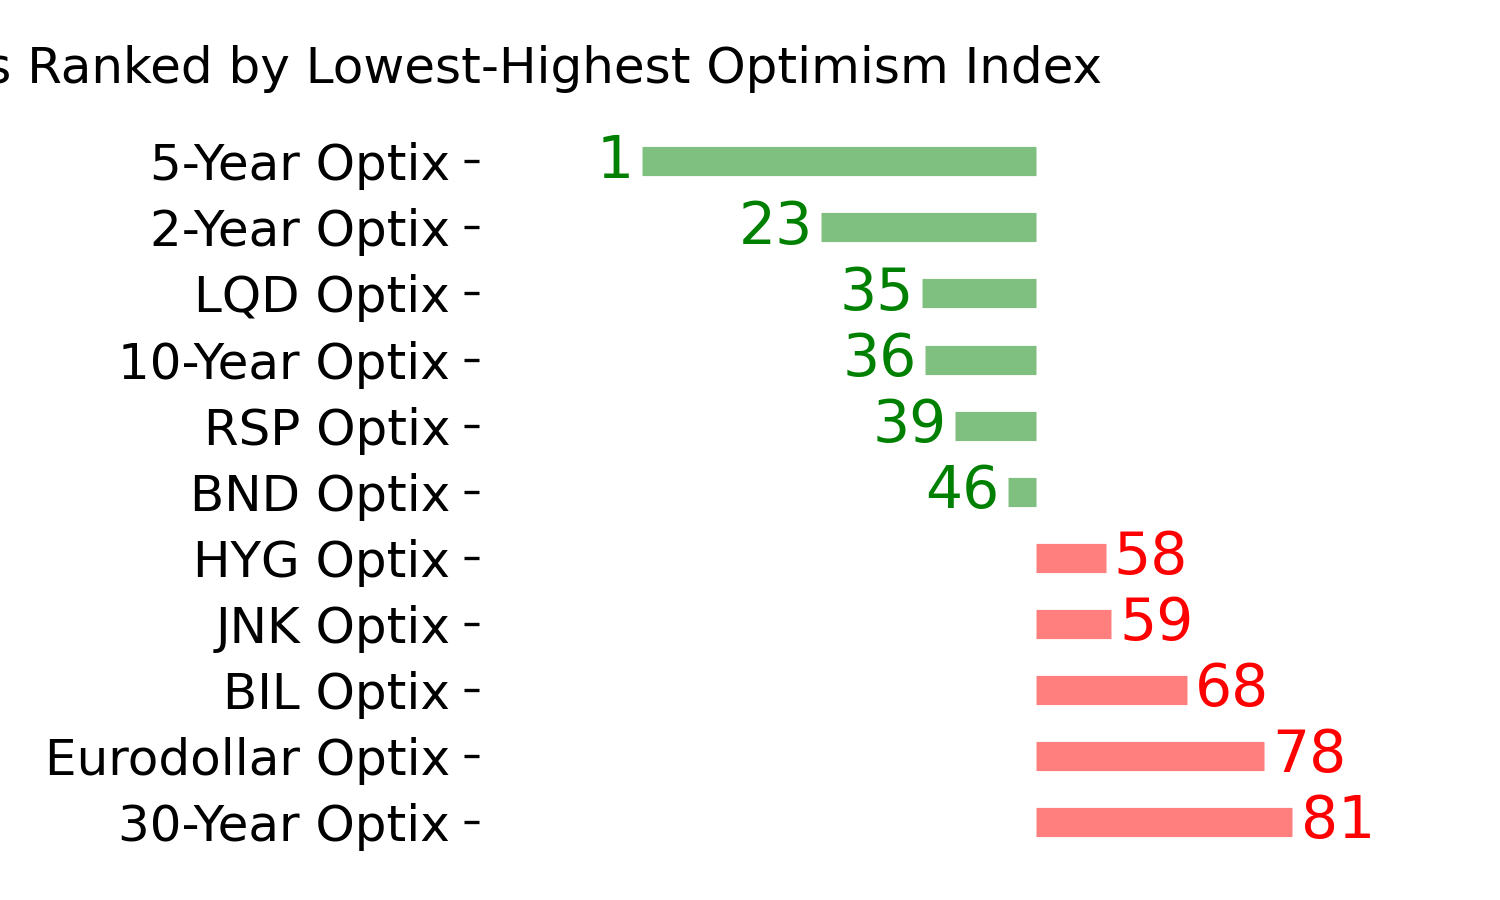
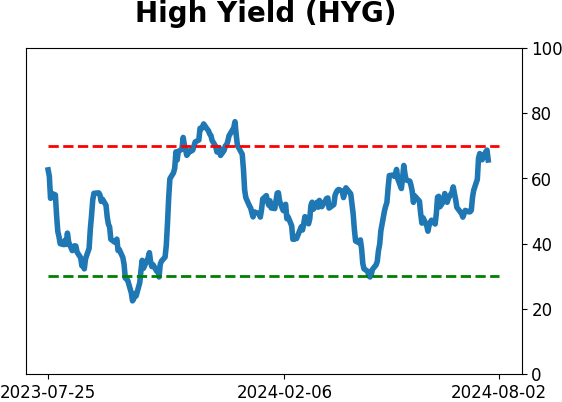
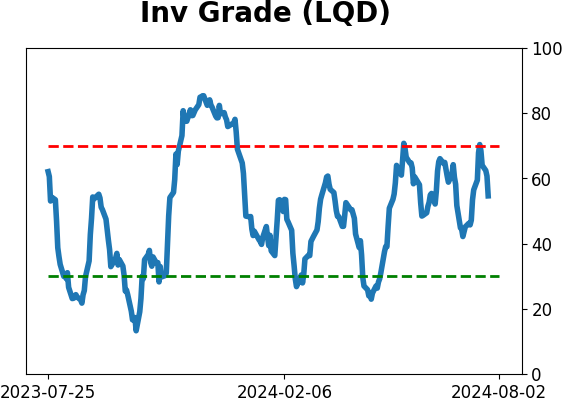
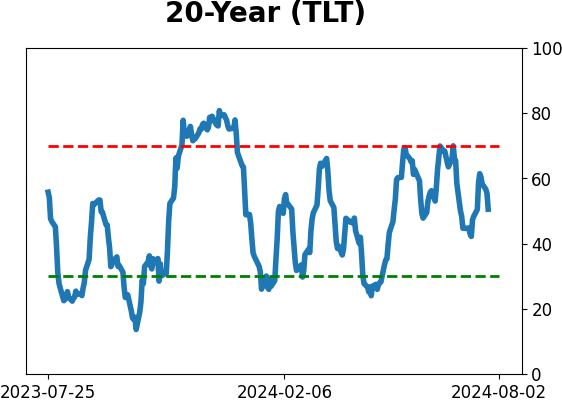
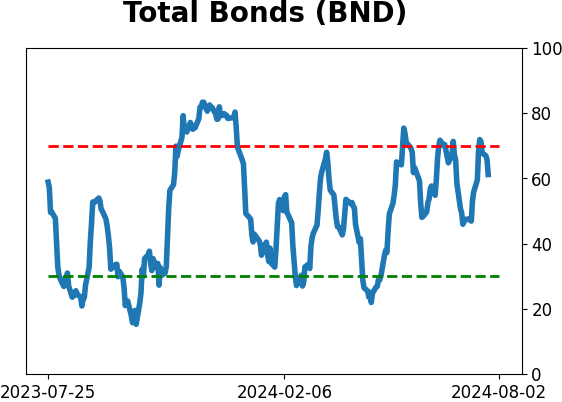
Bond ETF's - 10-Day Moving Average
|
|
|
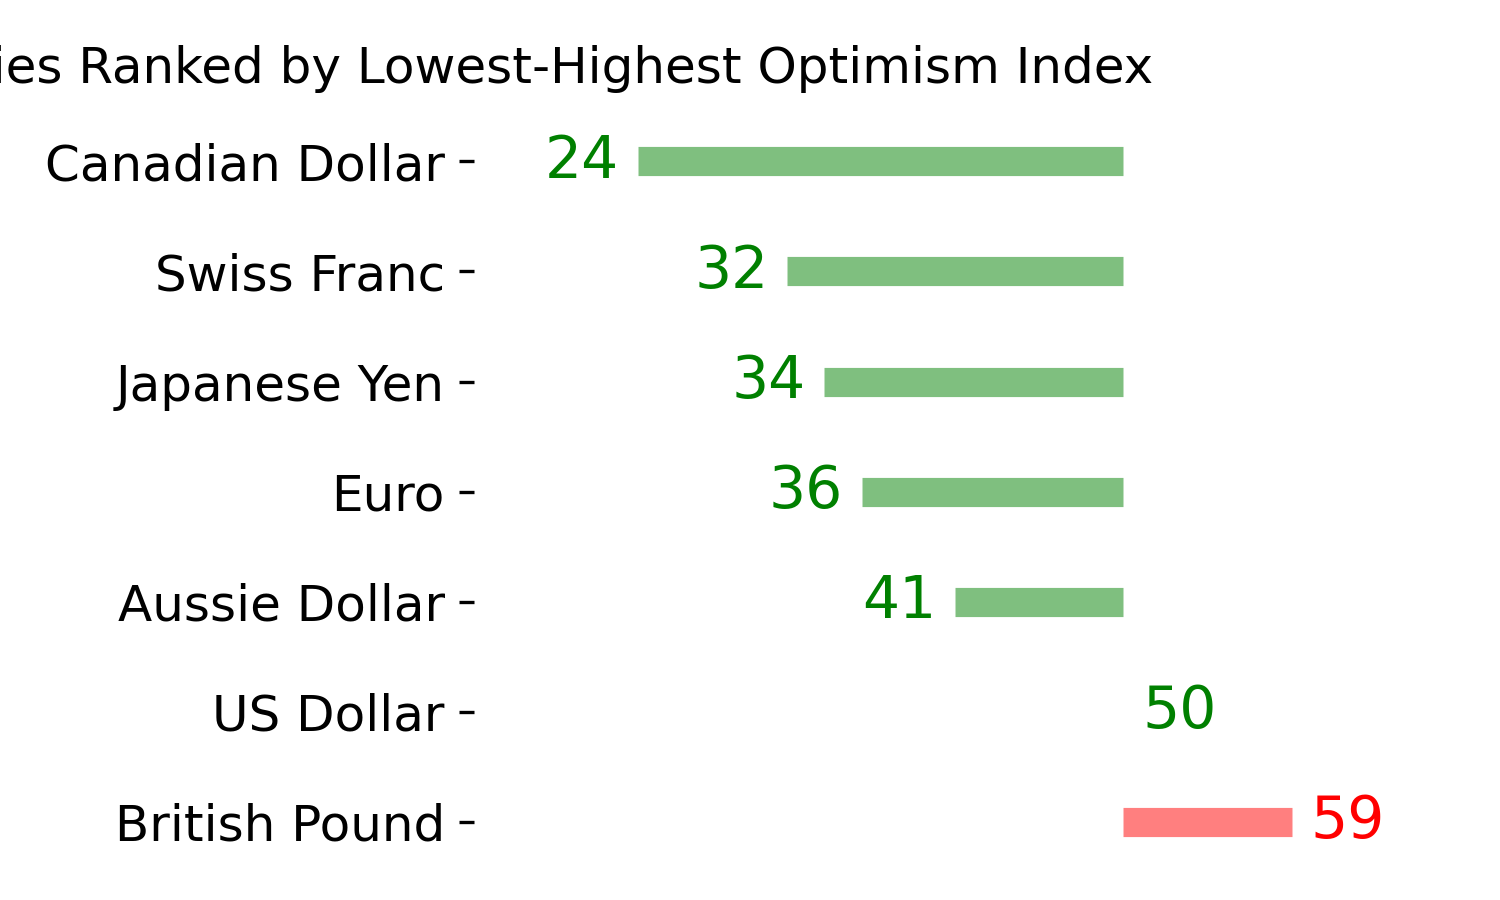
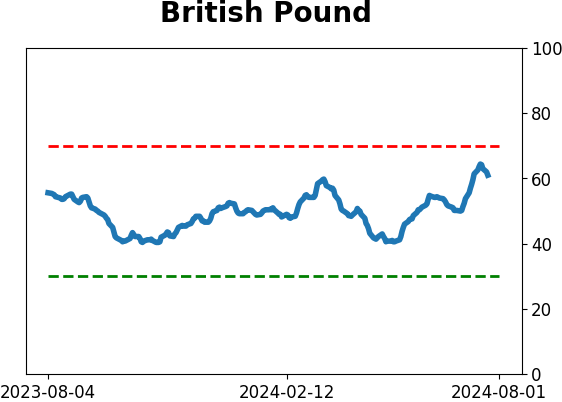
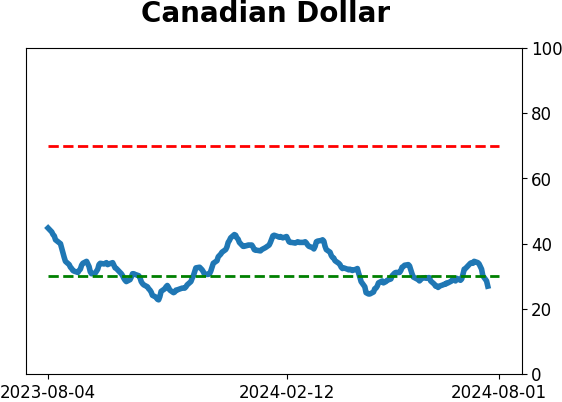
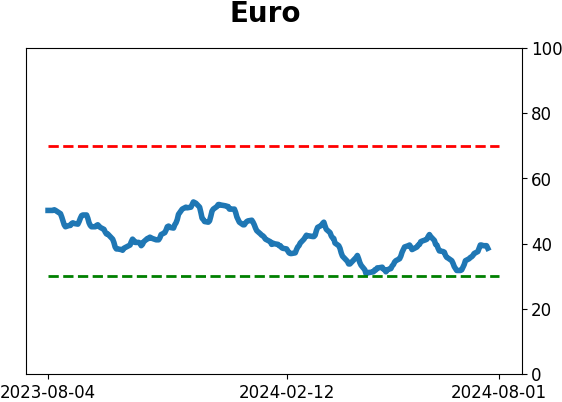
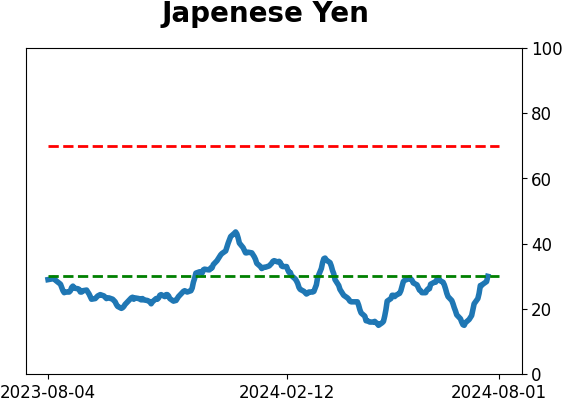
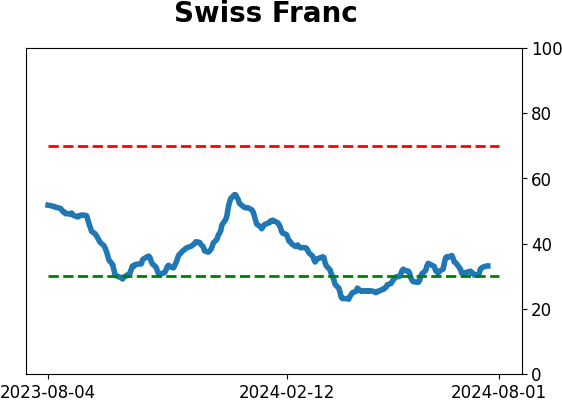
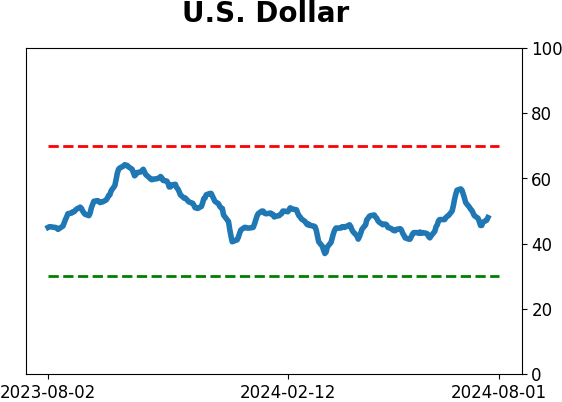
Currency ETF's - 5-Day Moving Average
|
|
|
Commodity ETF's - 5-Day Moving Average
|
|