Headlines
|
|
According to the paper of record, investors are all in:
The most respected financial publication in the world highlighted a handful of indicators showing investors are excessively optimistic, with the implication stocks may soon suffer. Over the past 30 years, there have been a few instances of similar behavior, but none preceded an imminent and sustained pullback.
|
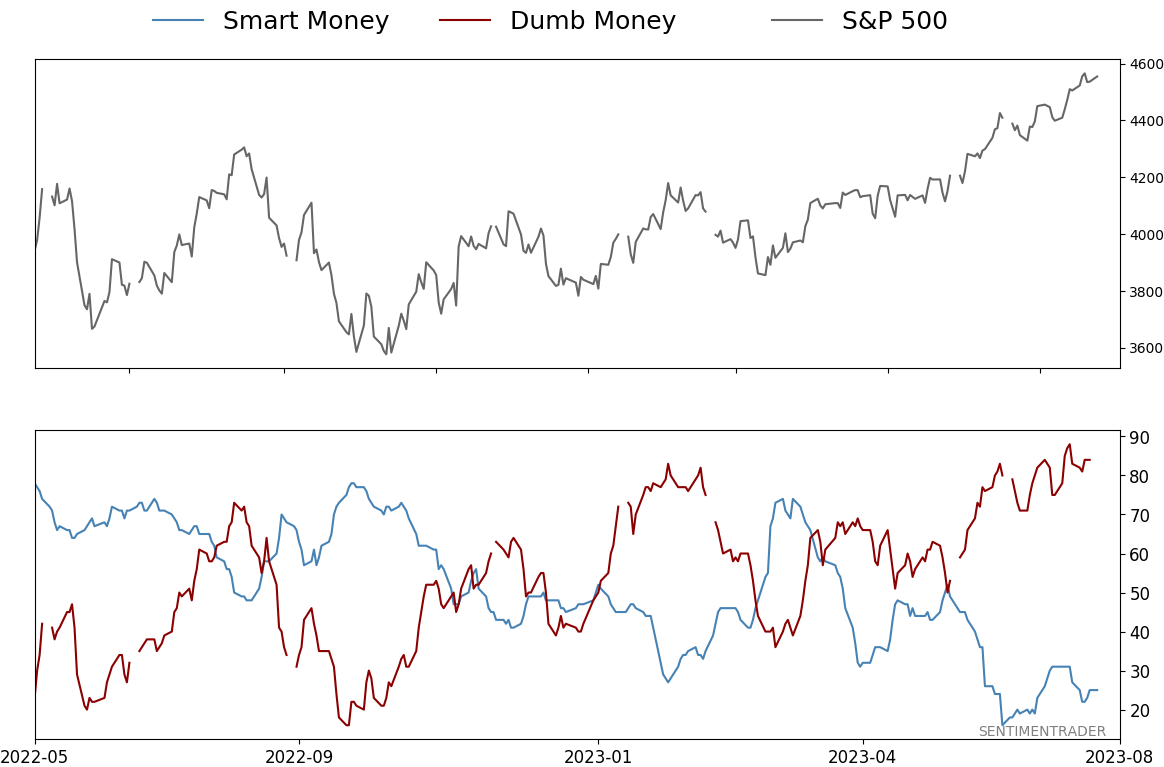
Smart / Dumb Money Confidence
|
Smart Money Confidence: 25%
Dumb Money Confidence: 84%
|
|
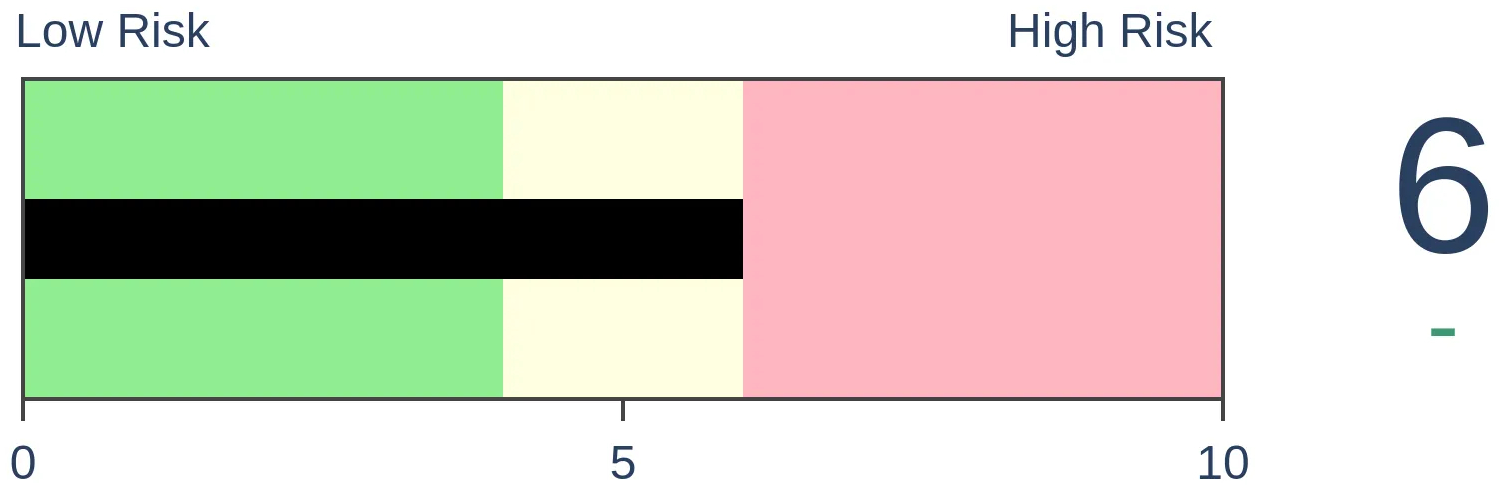
Risk Levels
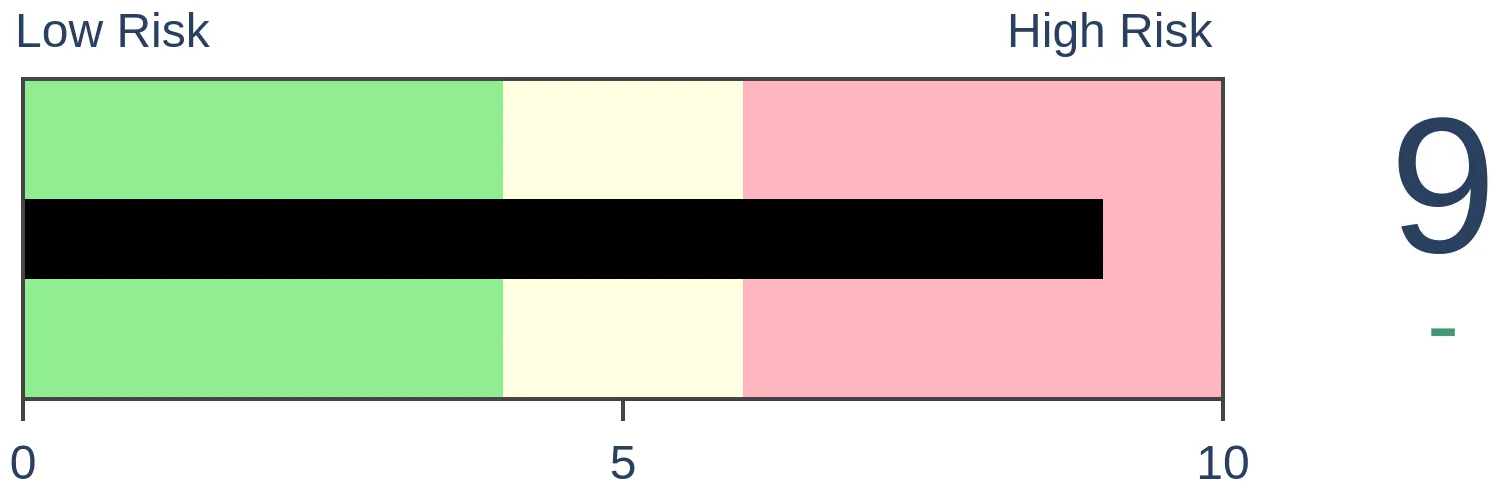
Stocks Short-Term
|
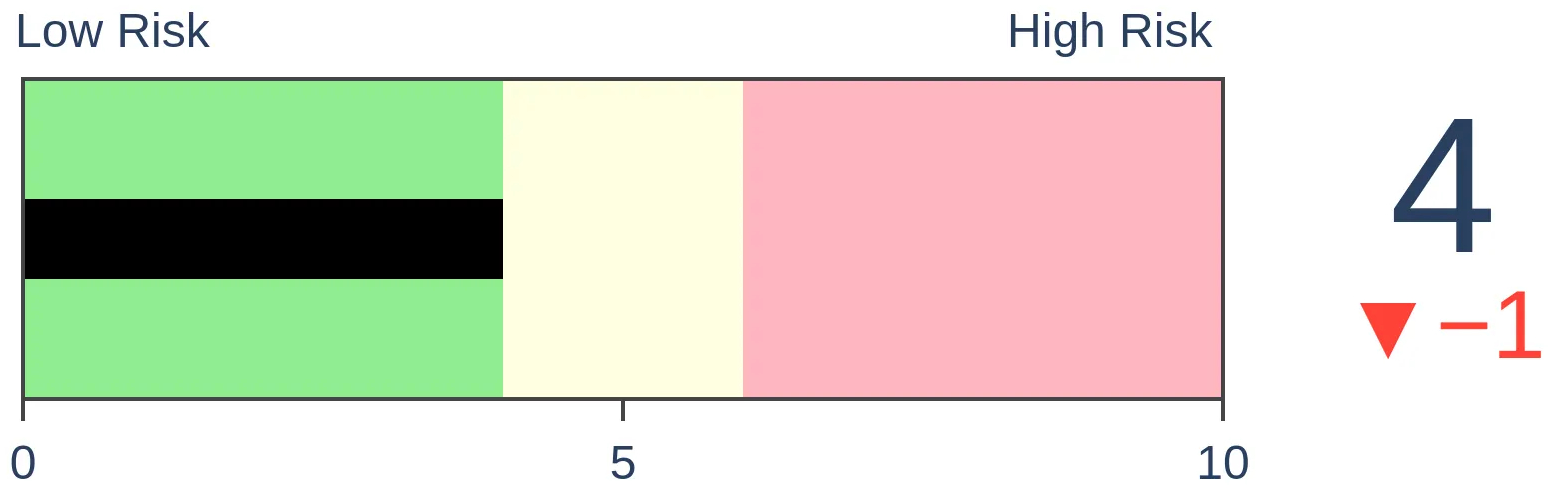
Stocks Medium-Term
|
|
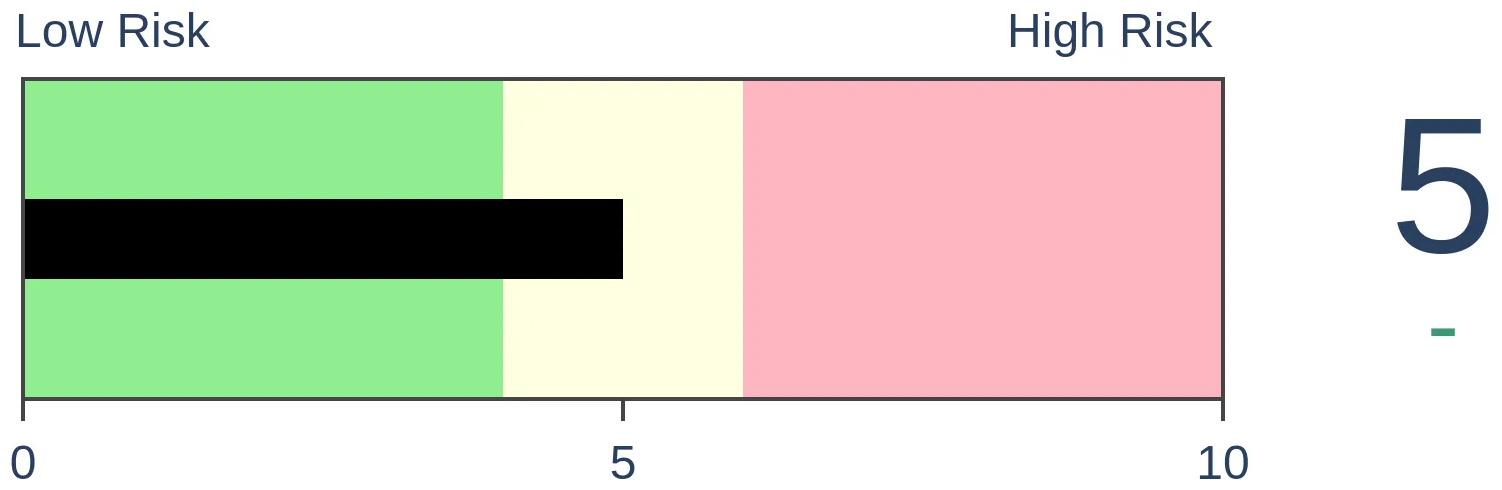
Bonds
|
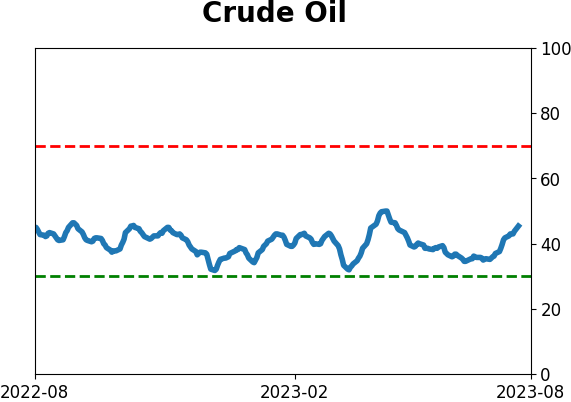
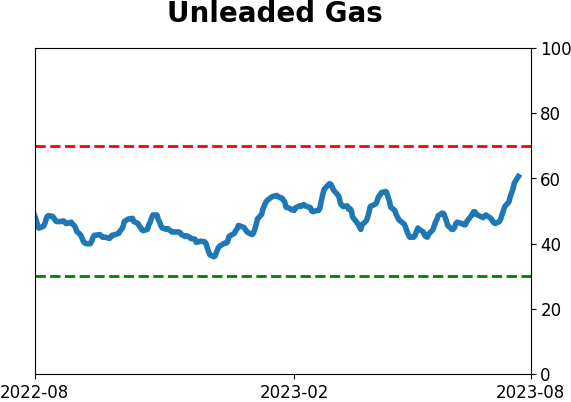
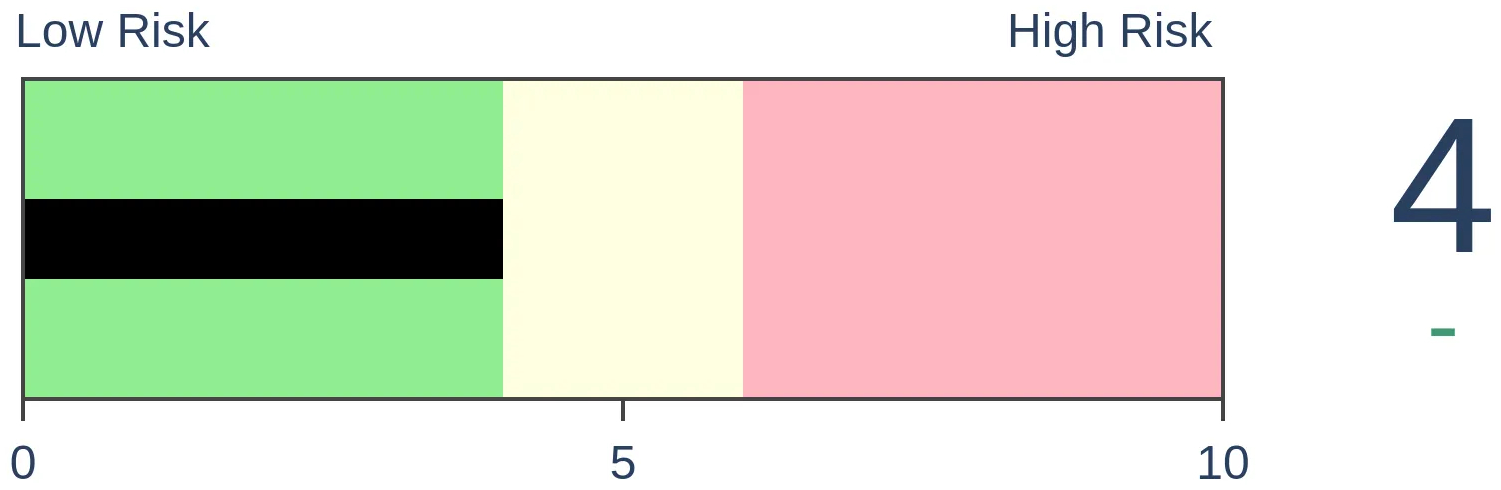
Crude Oil
|
|
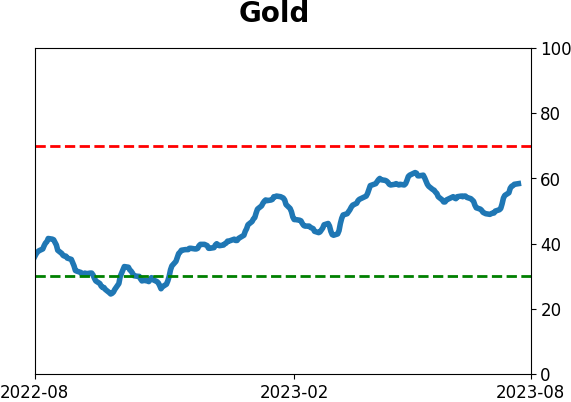
Gold
|
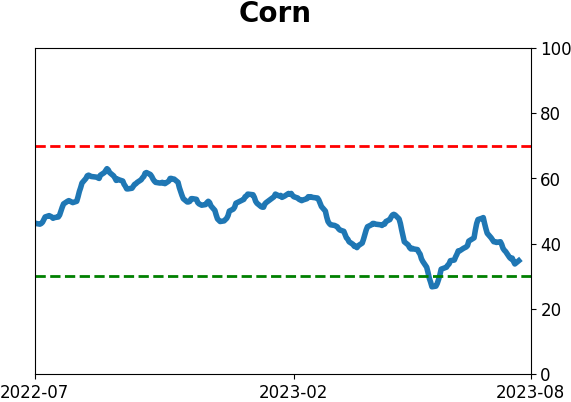
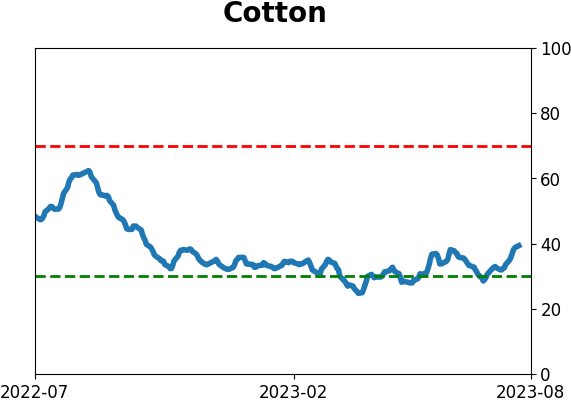
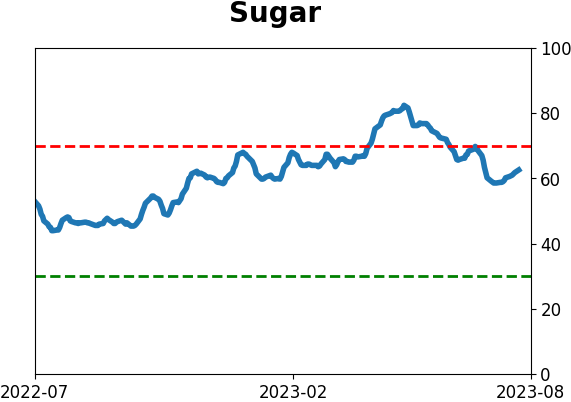
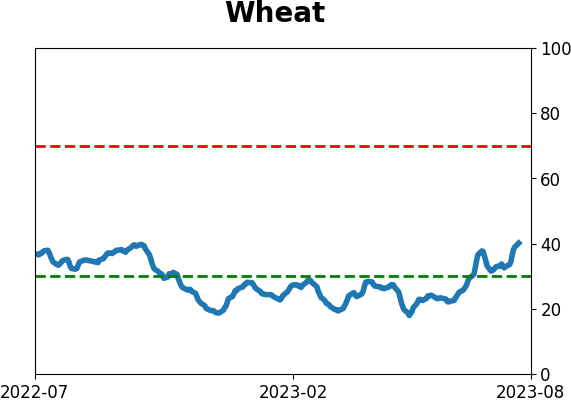
Agriculture

|
|
Research
By Jason Goepfert
BOTTOM LINE
The most respected financial publication in the world highlighted a handful of indicators showing investors are excessively optimistic, with the implication stocks may soon suffer. Over the past 30 years, there have been a few instances of similar behavior, but none preceded an imminent and sustained pullback.
FORECAST / TIMEFRAME
None
|
Key points:
- A handful of indicators highlighted by the financial paper of record suggest that investors are too optimistic
- For the first time in over 30 years, all the indicators are showing excess optimism
- Forward returns after similar bouts of optimism were mostly positive, however
Indicators suggest investors are historically bullish
Investors are betting like crazy on stocks, and we're back in a bubble. Scary stuff. At least, that's the tone of this article from The Wall Street Journal:
Tech stocks are rising manically, spilling into meme stocks. The cryptoverse is enjoying a resurgence. Bullishness is hitting a fever pitch in the options market. In short, risk-on investments are the most popular they have been since late 2021-right before stocks entered the longest bear market in decades.
By way of evidence, the Journal noted a handful of indicators, roughly representing "sentiment."
- AAII survey bullishness the highest in over a year
- More bulls than bears in the AAII survey for at least 6 weeks
- University of Michigan consumer survey most optimistic in at least a year
- U of M survey biggest jump in optimism in at least a year
- Put/Call Ratio lowest in at least a year
- VIX "fear gauge" is under 14
The implication, as we often see, is that investors are once again way too complacent and ignoring all the danger signs out there. Well, this is easy enough to test.
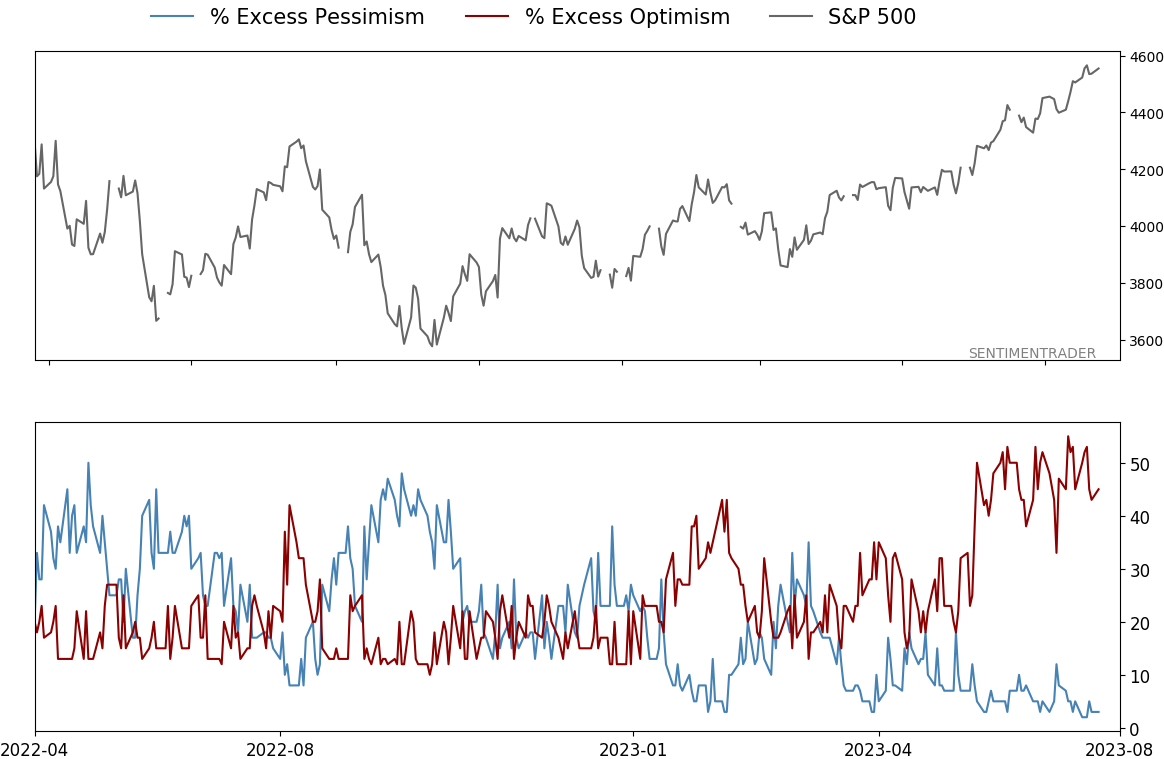
Let's go back as far as we can and use those six measures of sentiment to determine how bullish investors have become, according to the WSJ sentiment model. The chart below assigns a score of "1" to each of the six conditions above if it shows an extreme. So, a reading of 100% would mean that every indicator suggests optimism, while 0% would mean there is pessimism because none of them have triggered.
For the first time since at least 1988, the model is at 100%. That's not a total surprise because the conditions in the article were selected specifically because they've just triggered. It's also not a total surprise that it's never happened before because most of the time, at least one indicator is off doing its own thing.
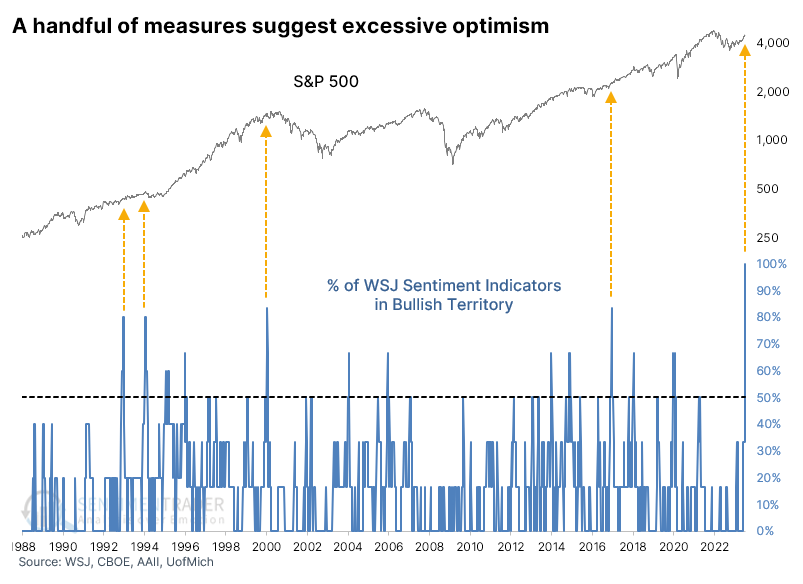
The arrows on the chart highlight those times when the model crossed above 80%, when five of the six indicators triggered excessive optimism. And it wasn't too bad for stocks, though one ultimately led to the pricking of the internet bubble in 2000.
Returns weren't too bad when investors were extremely optimistic
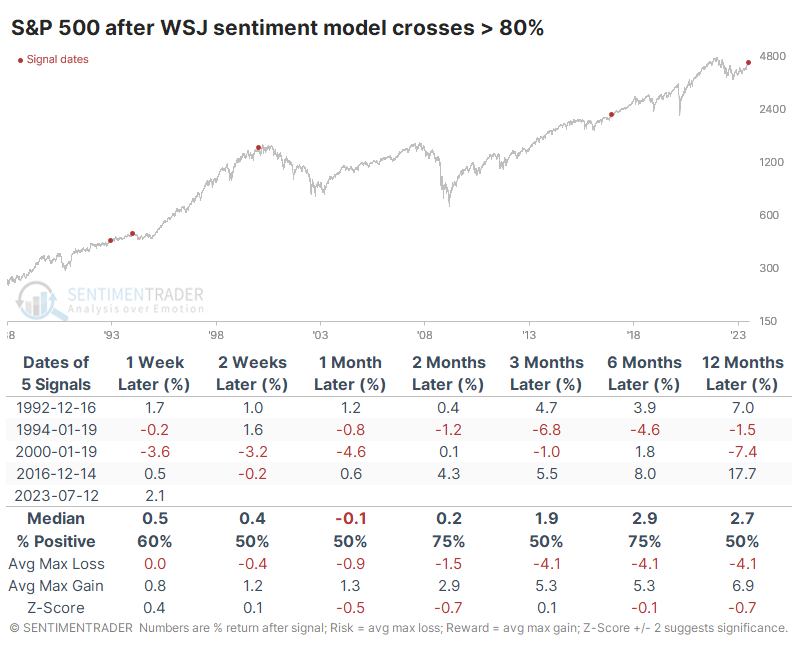
The table below shows returns in the S&P 500 after the signals in the chart above. Gains were muted over the next six months, but so were losses. None of the signals preceded a loss of more than -8.5% for the S&P within the next six months, but none gained more than +8.5%, either.
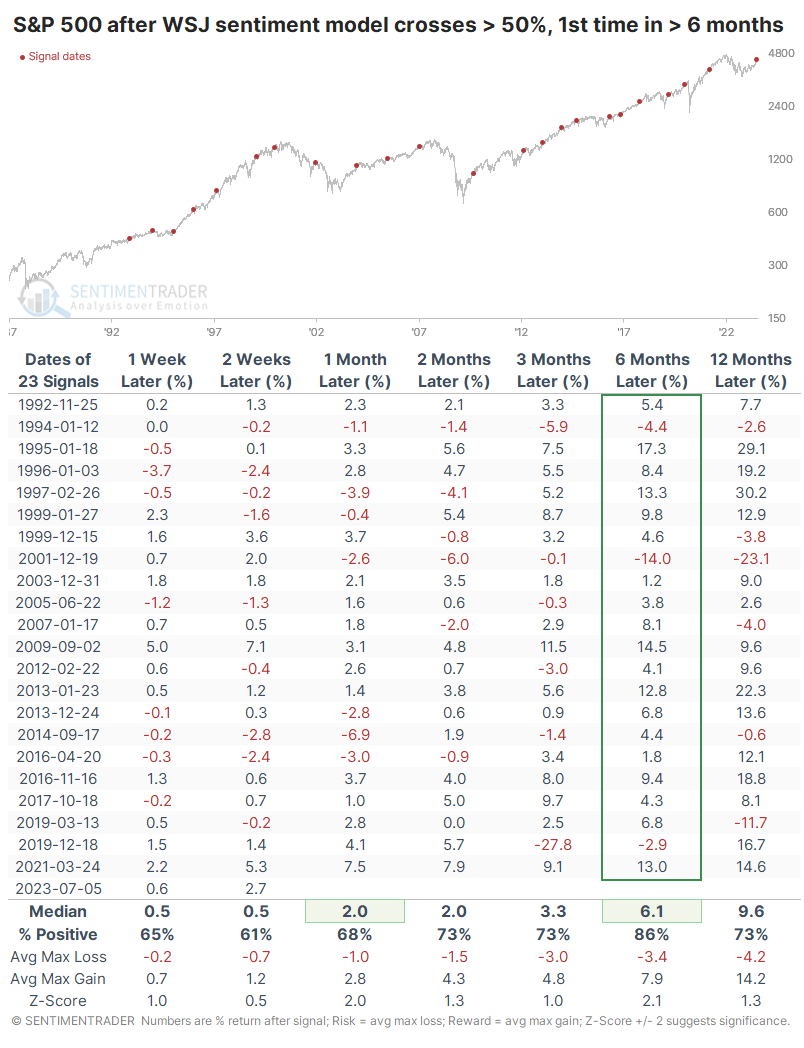
It's hard to reach much into such a tiny sample size, so the table below looks at returns following lesser extremes. These are times when at least half of the signals were triggered for the first time in at least six months.
Again, the S&P's performance wasn't too bad. Six months later, it showed a gain 86% of the time, with a median return quite a bit higher than a random return during the study period. Of 22 signals, 18 saw more reward than risk over the next year.
What the research tells us...
At the risk of getting awfully repetitive, I'll reiterate something I've noted for many months. After a year like 2022, investors will want to bail at the faintest hint of other investors getting optimistic. We've looked at an inordinate number of studies showing that behavior, as we've witnessed since October, would be extraordinarily rare during an ongoing bear market, so the probability we're in a bull market environment is high and has been for more than seven months.
There is little doubt that sentiment has become optimistic, perhaps even excessively so. But the first bout of excessive optimism following a severe depression like 2022 tends to lead to higher prices, not lower ones. Gains are often muted, but so are losses. The indicators cherry-picked by the WSJ are no exception.
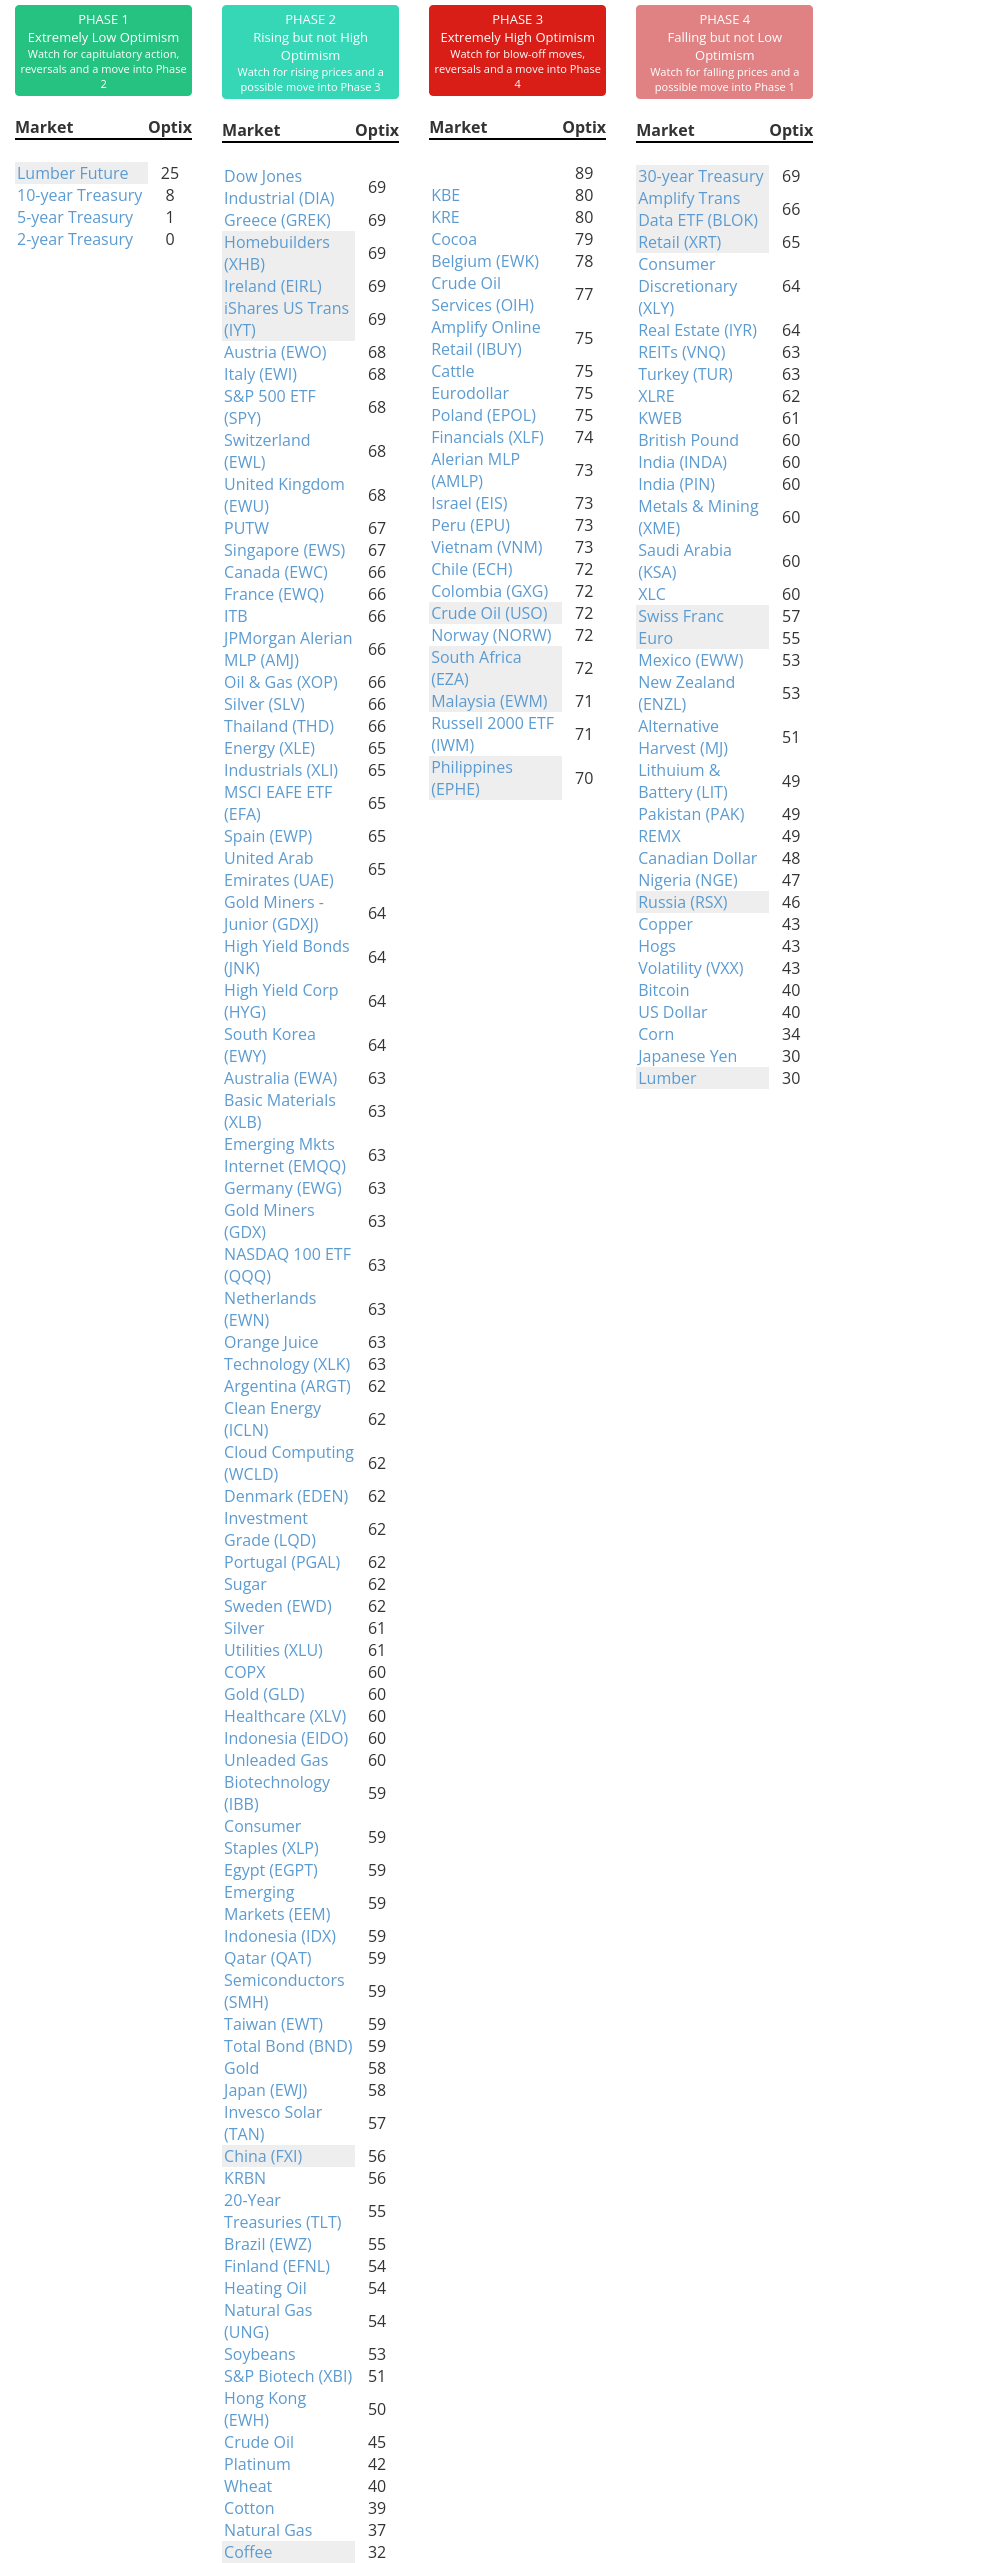
Indicators at Extremes
Phase Table
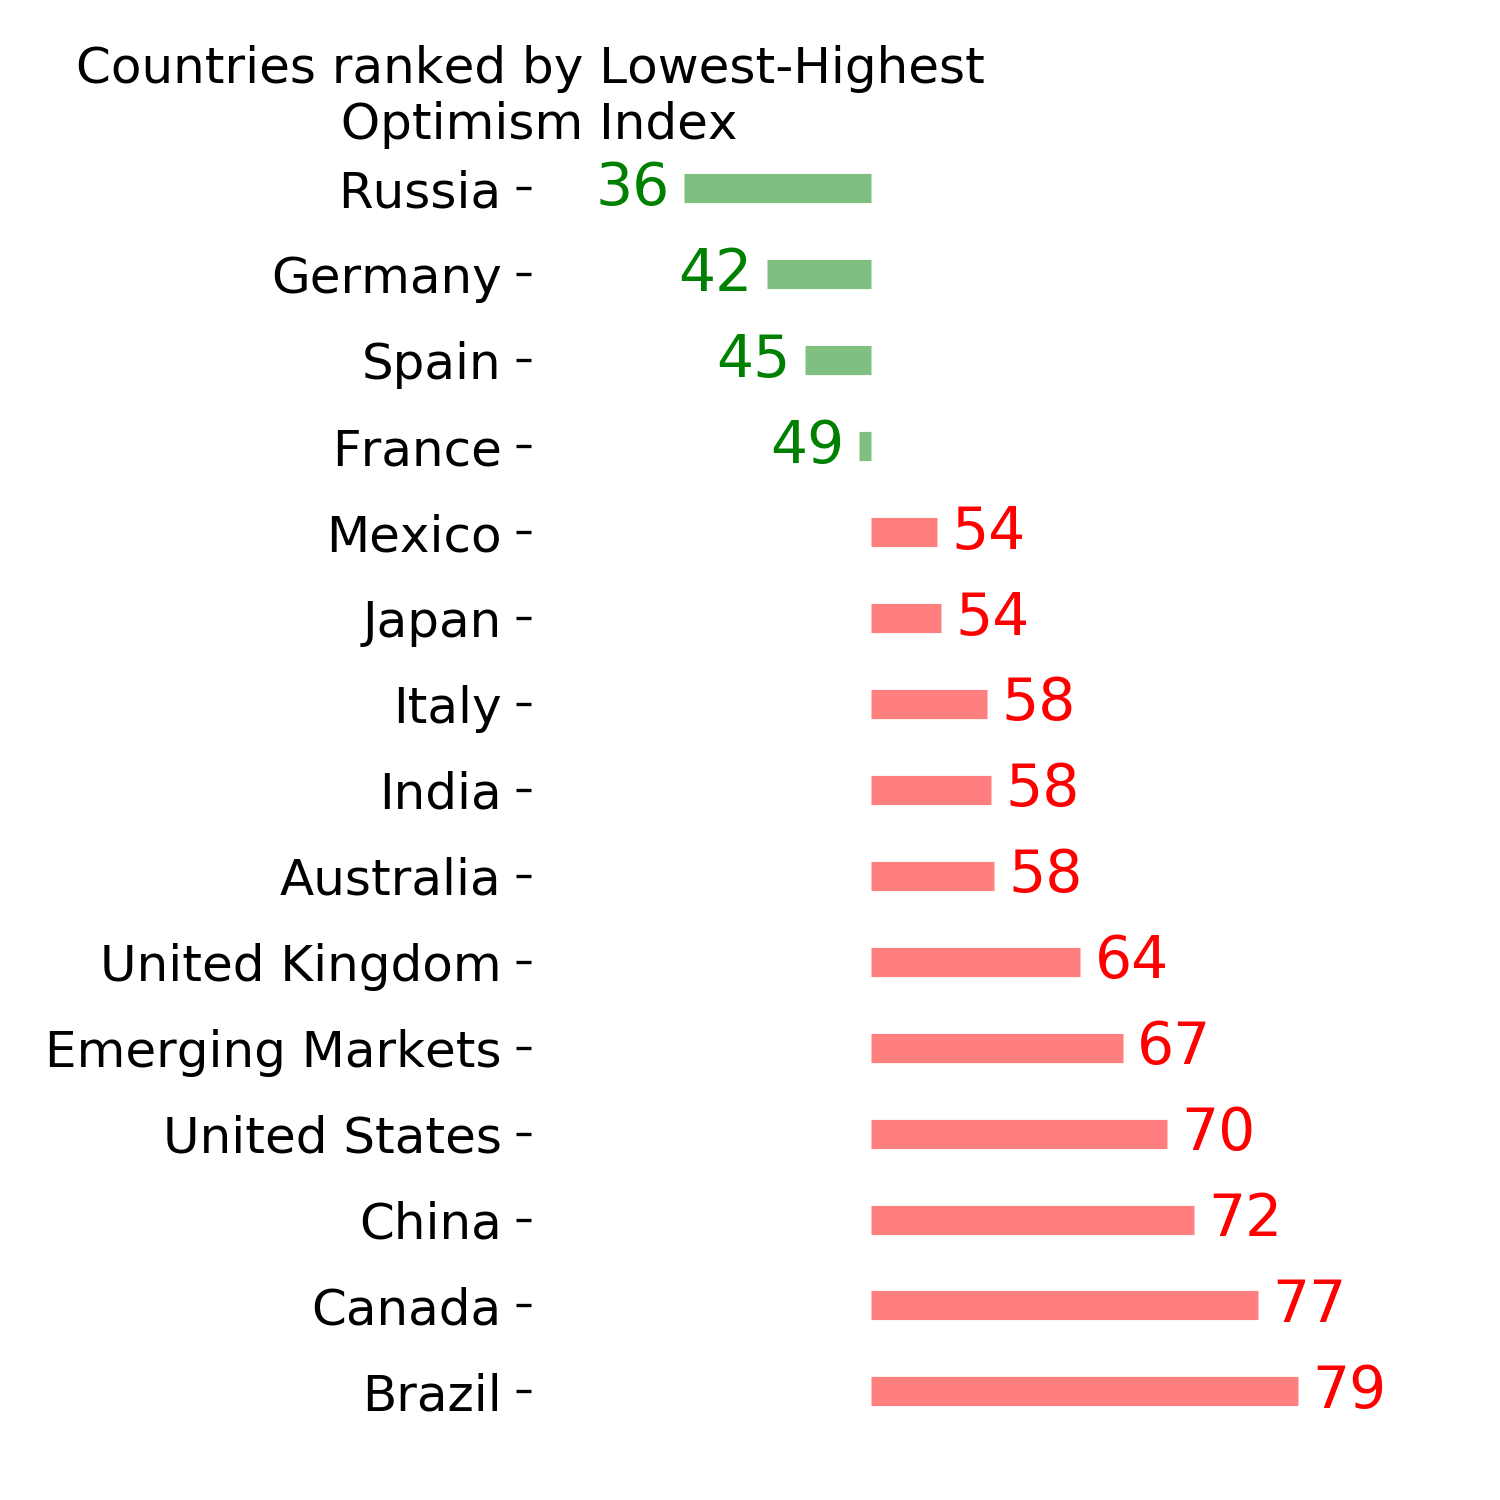
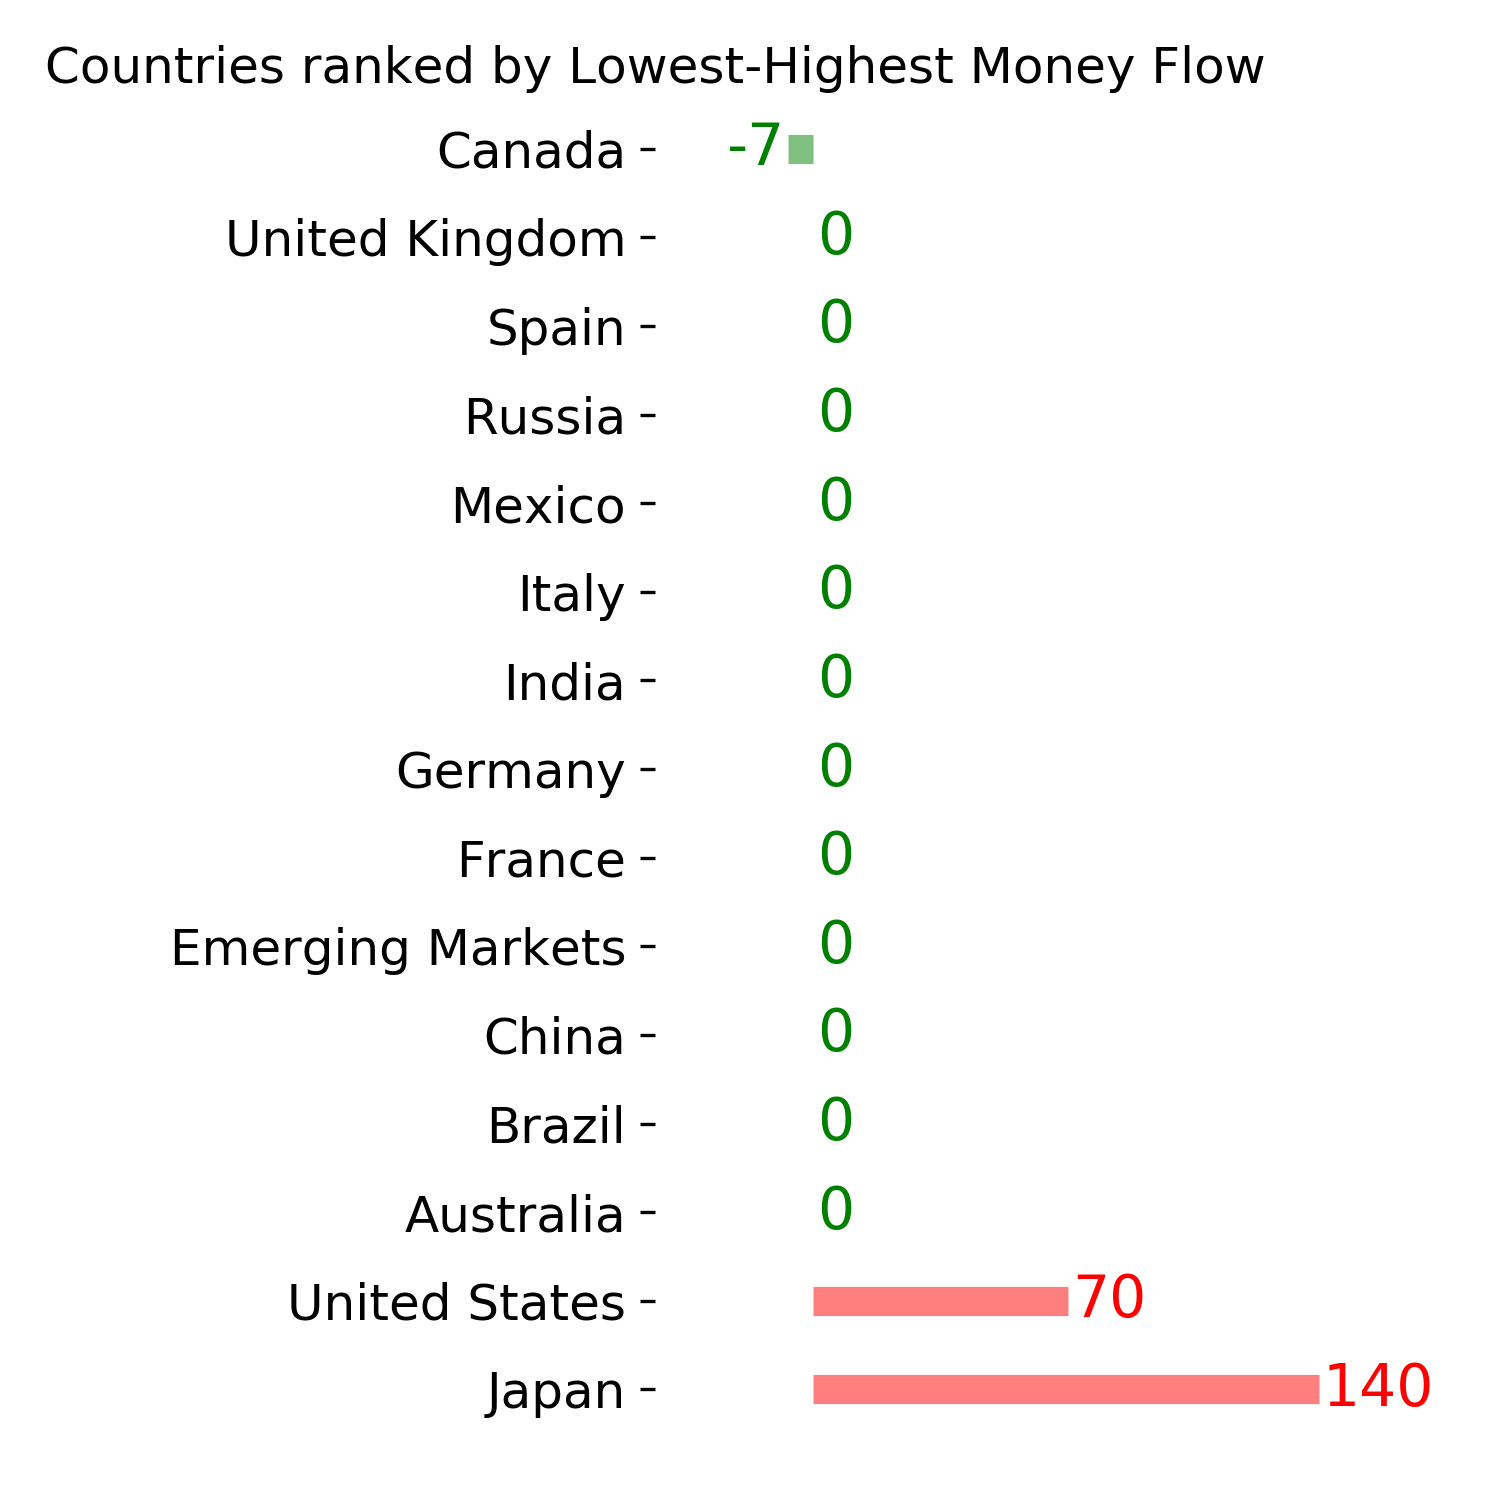
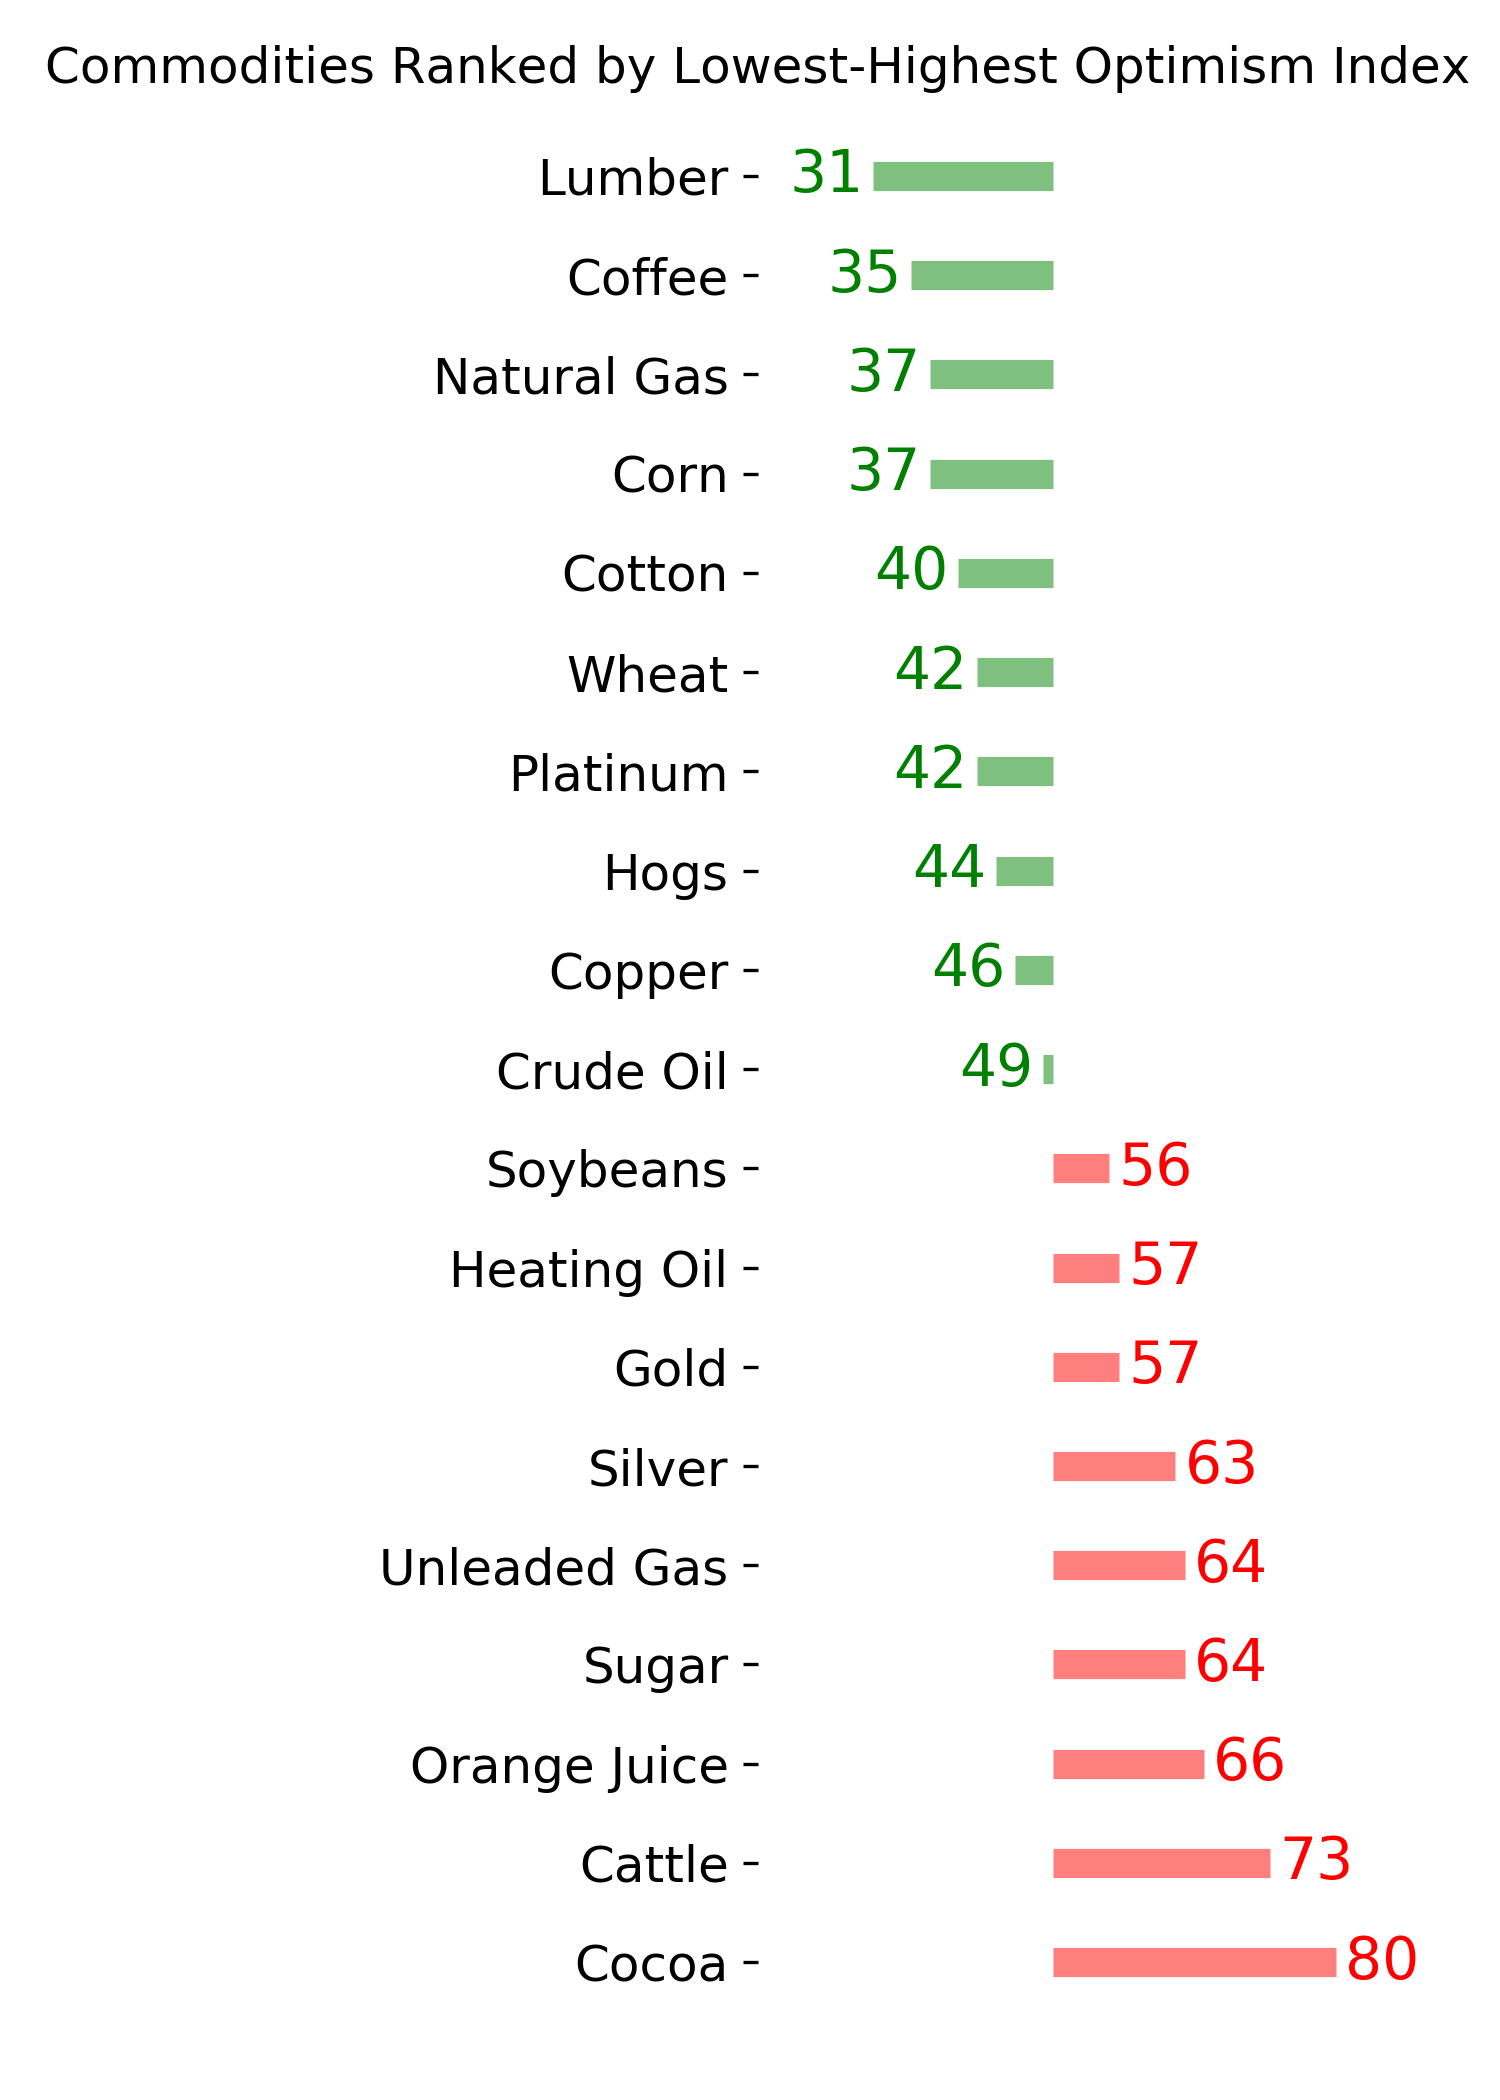
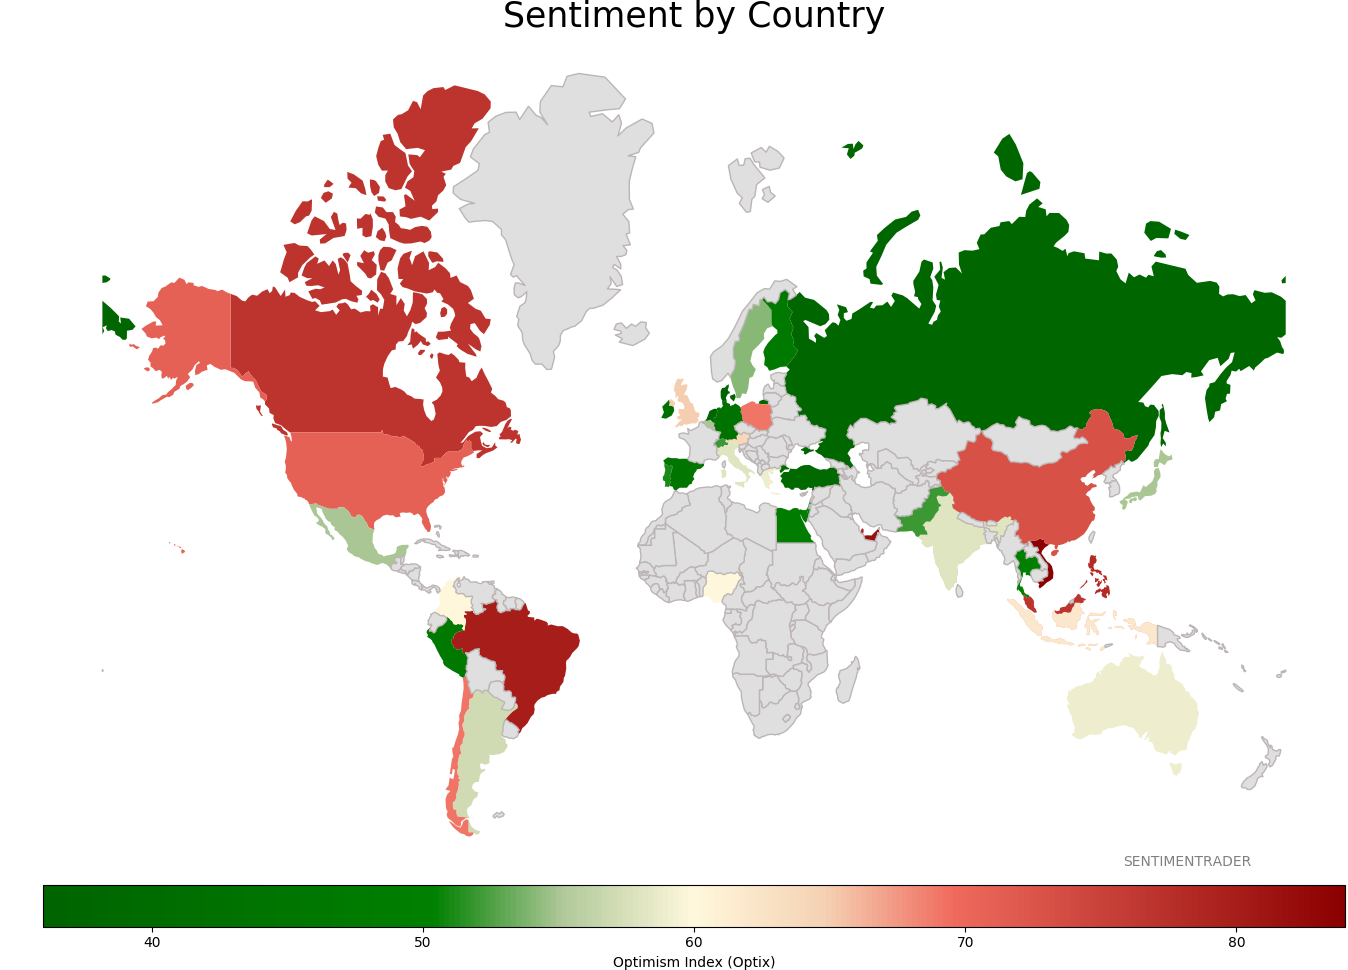
Ranks
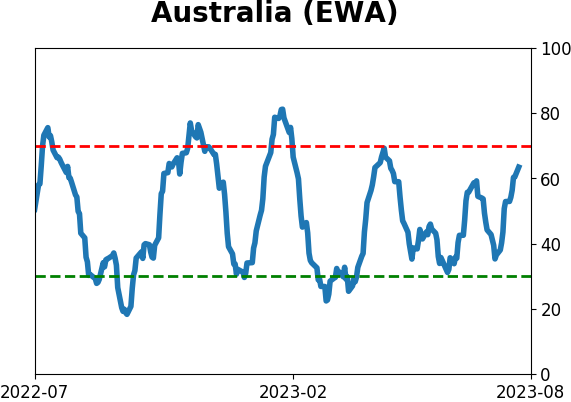
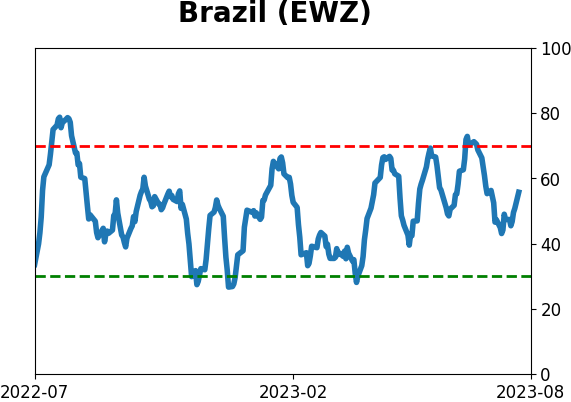
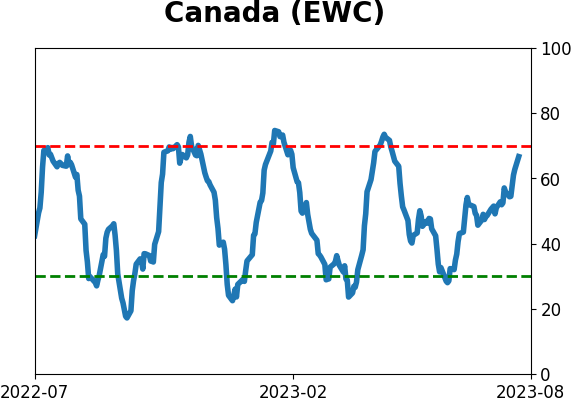
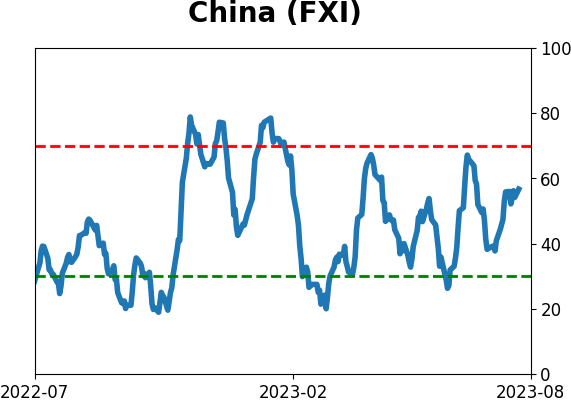
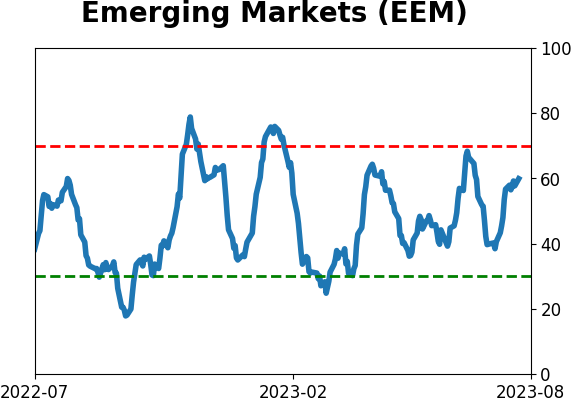
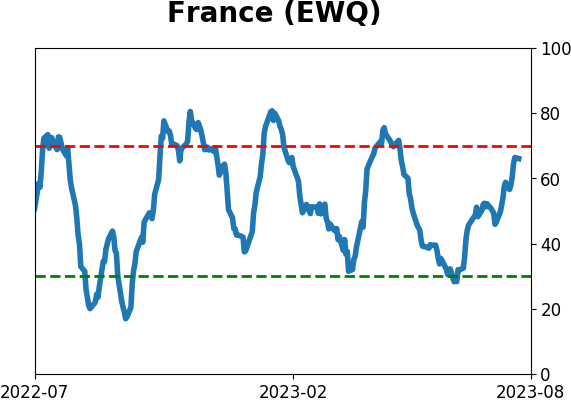
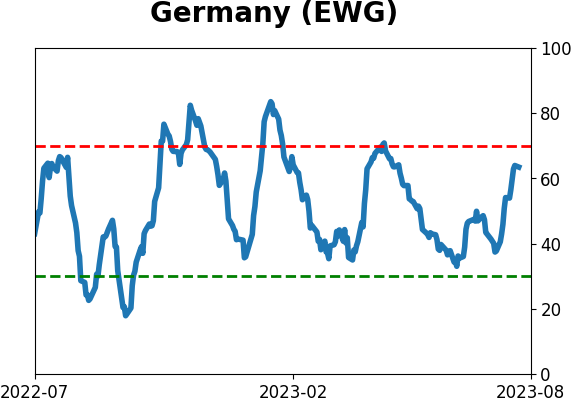
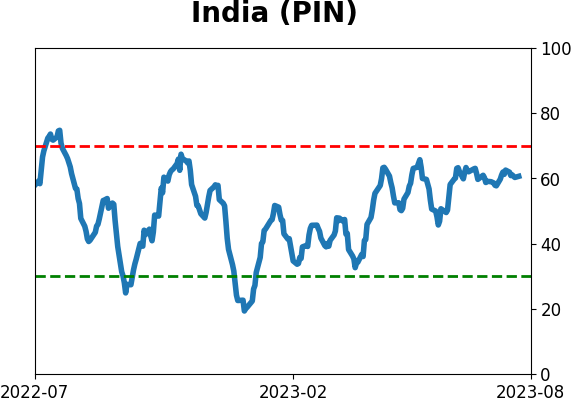
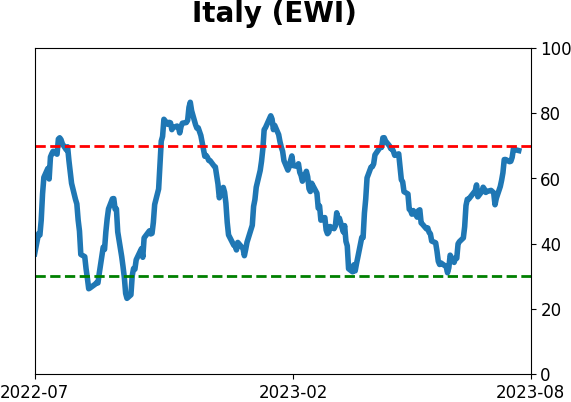
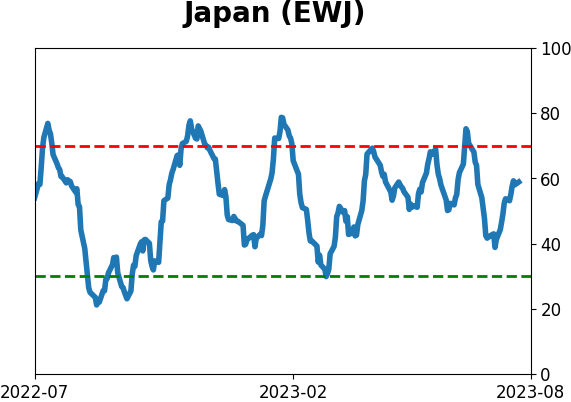
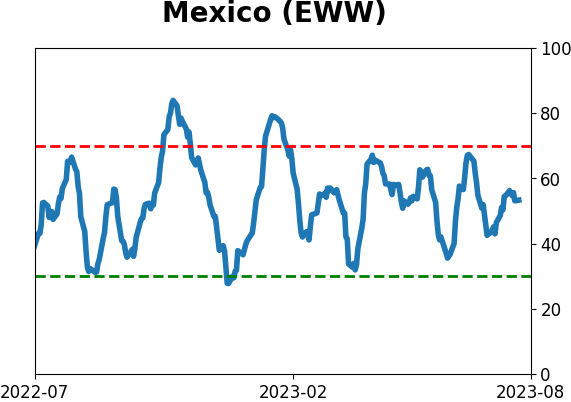
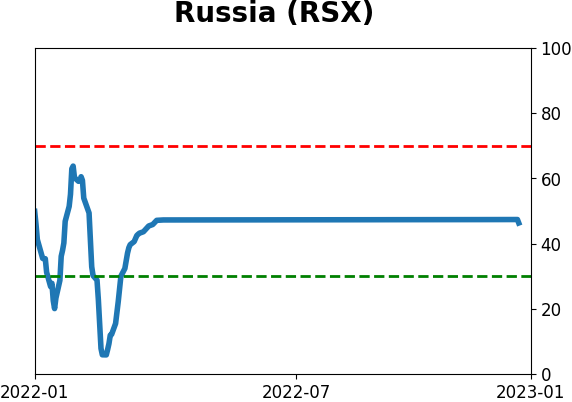
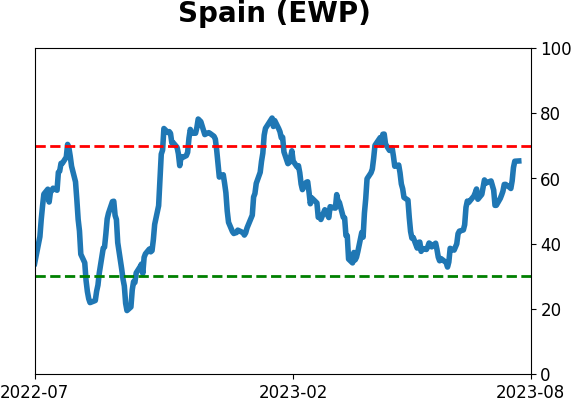
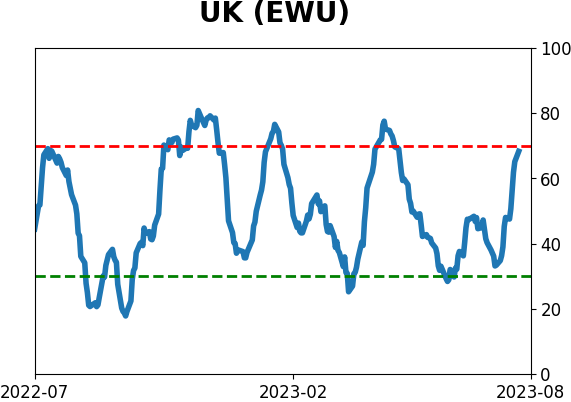
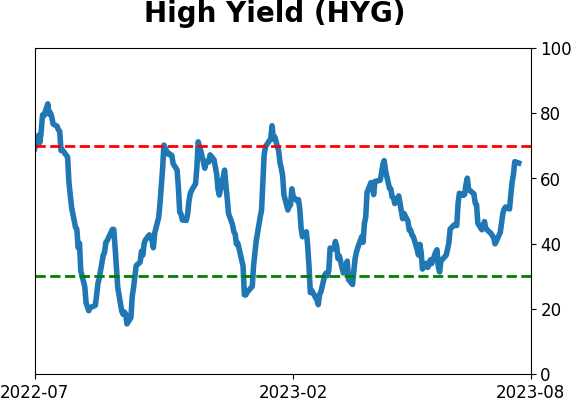
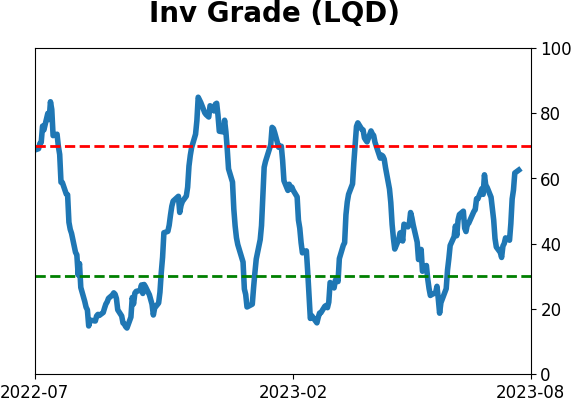
Sentiment Around The World
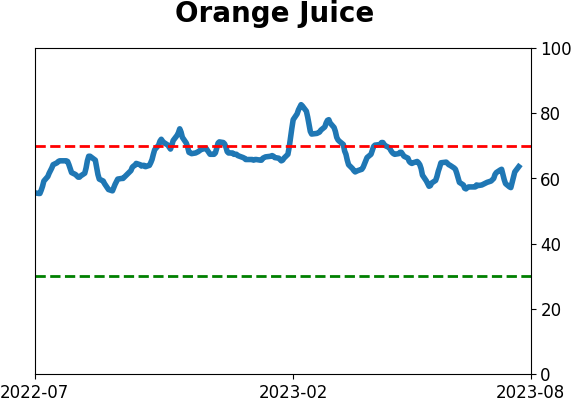
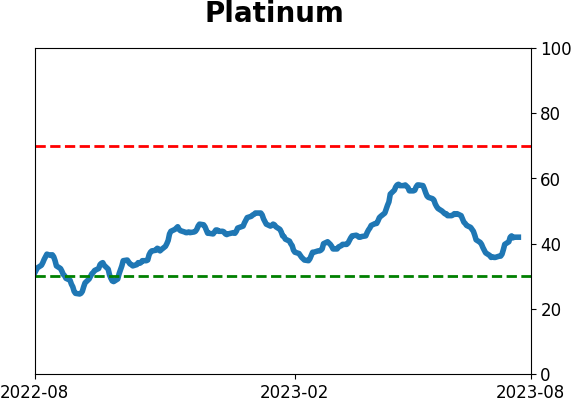
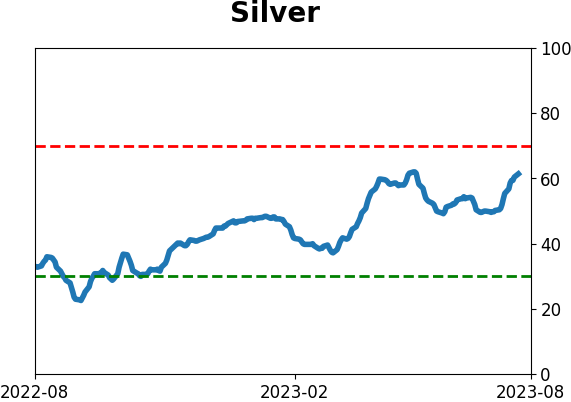
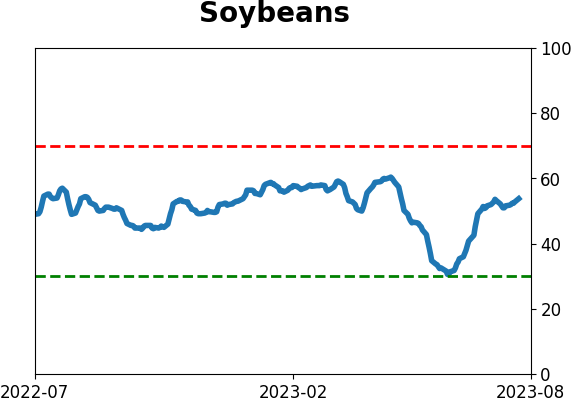
Optimism Index Thumbnails
|
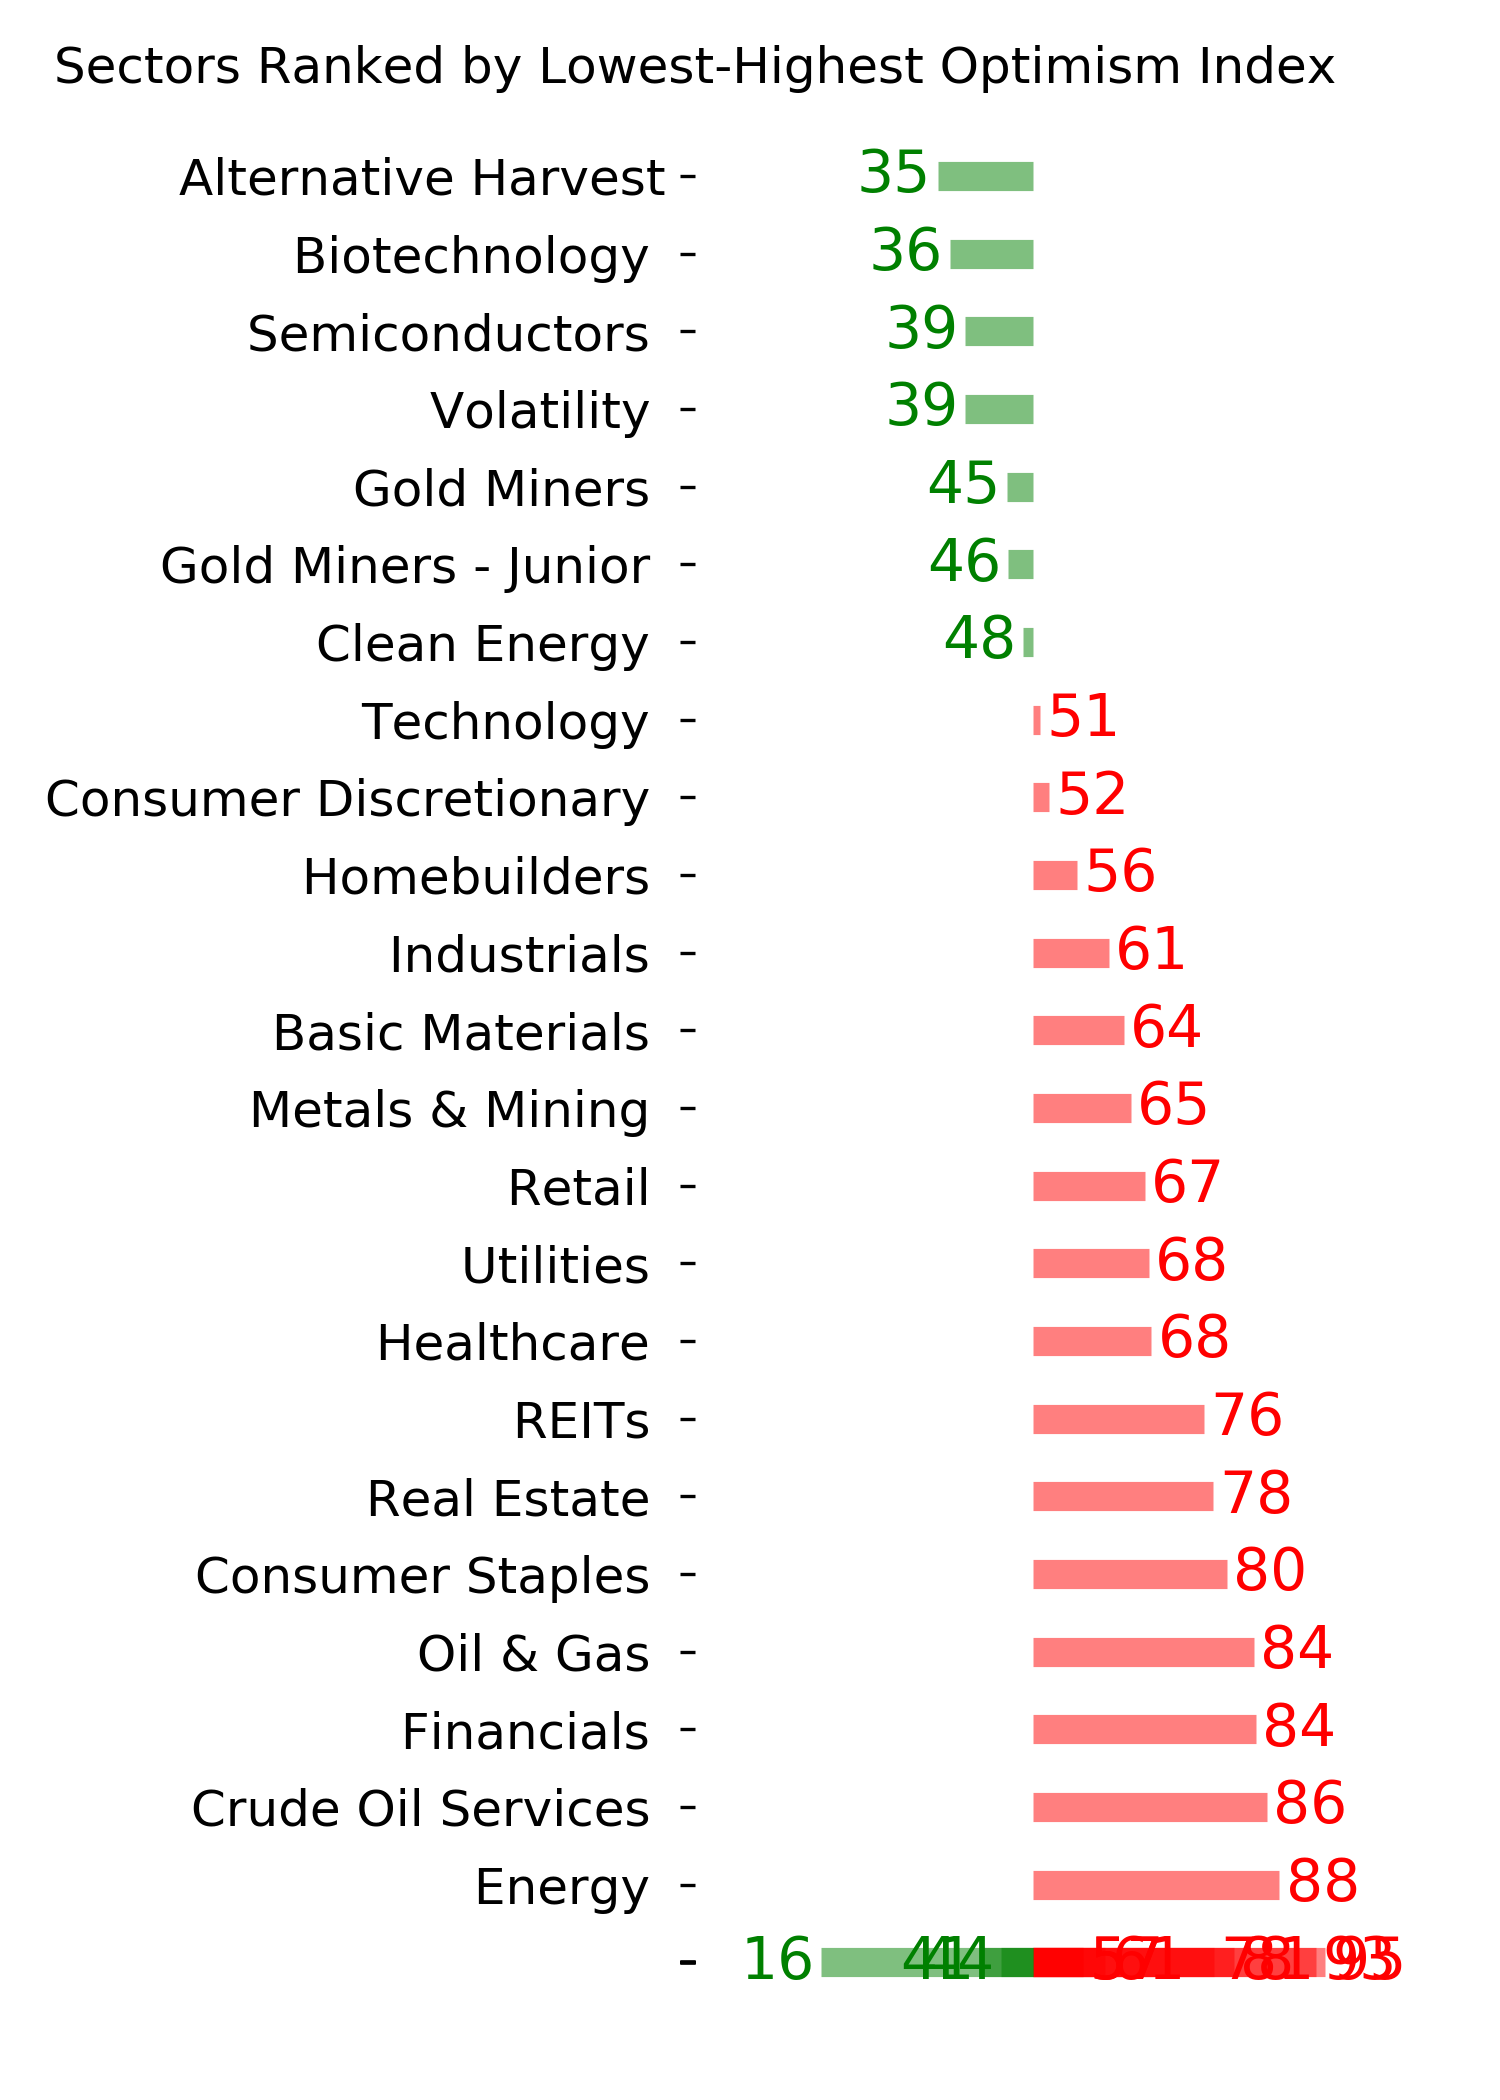
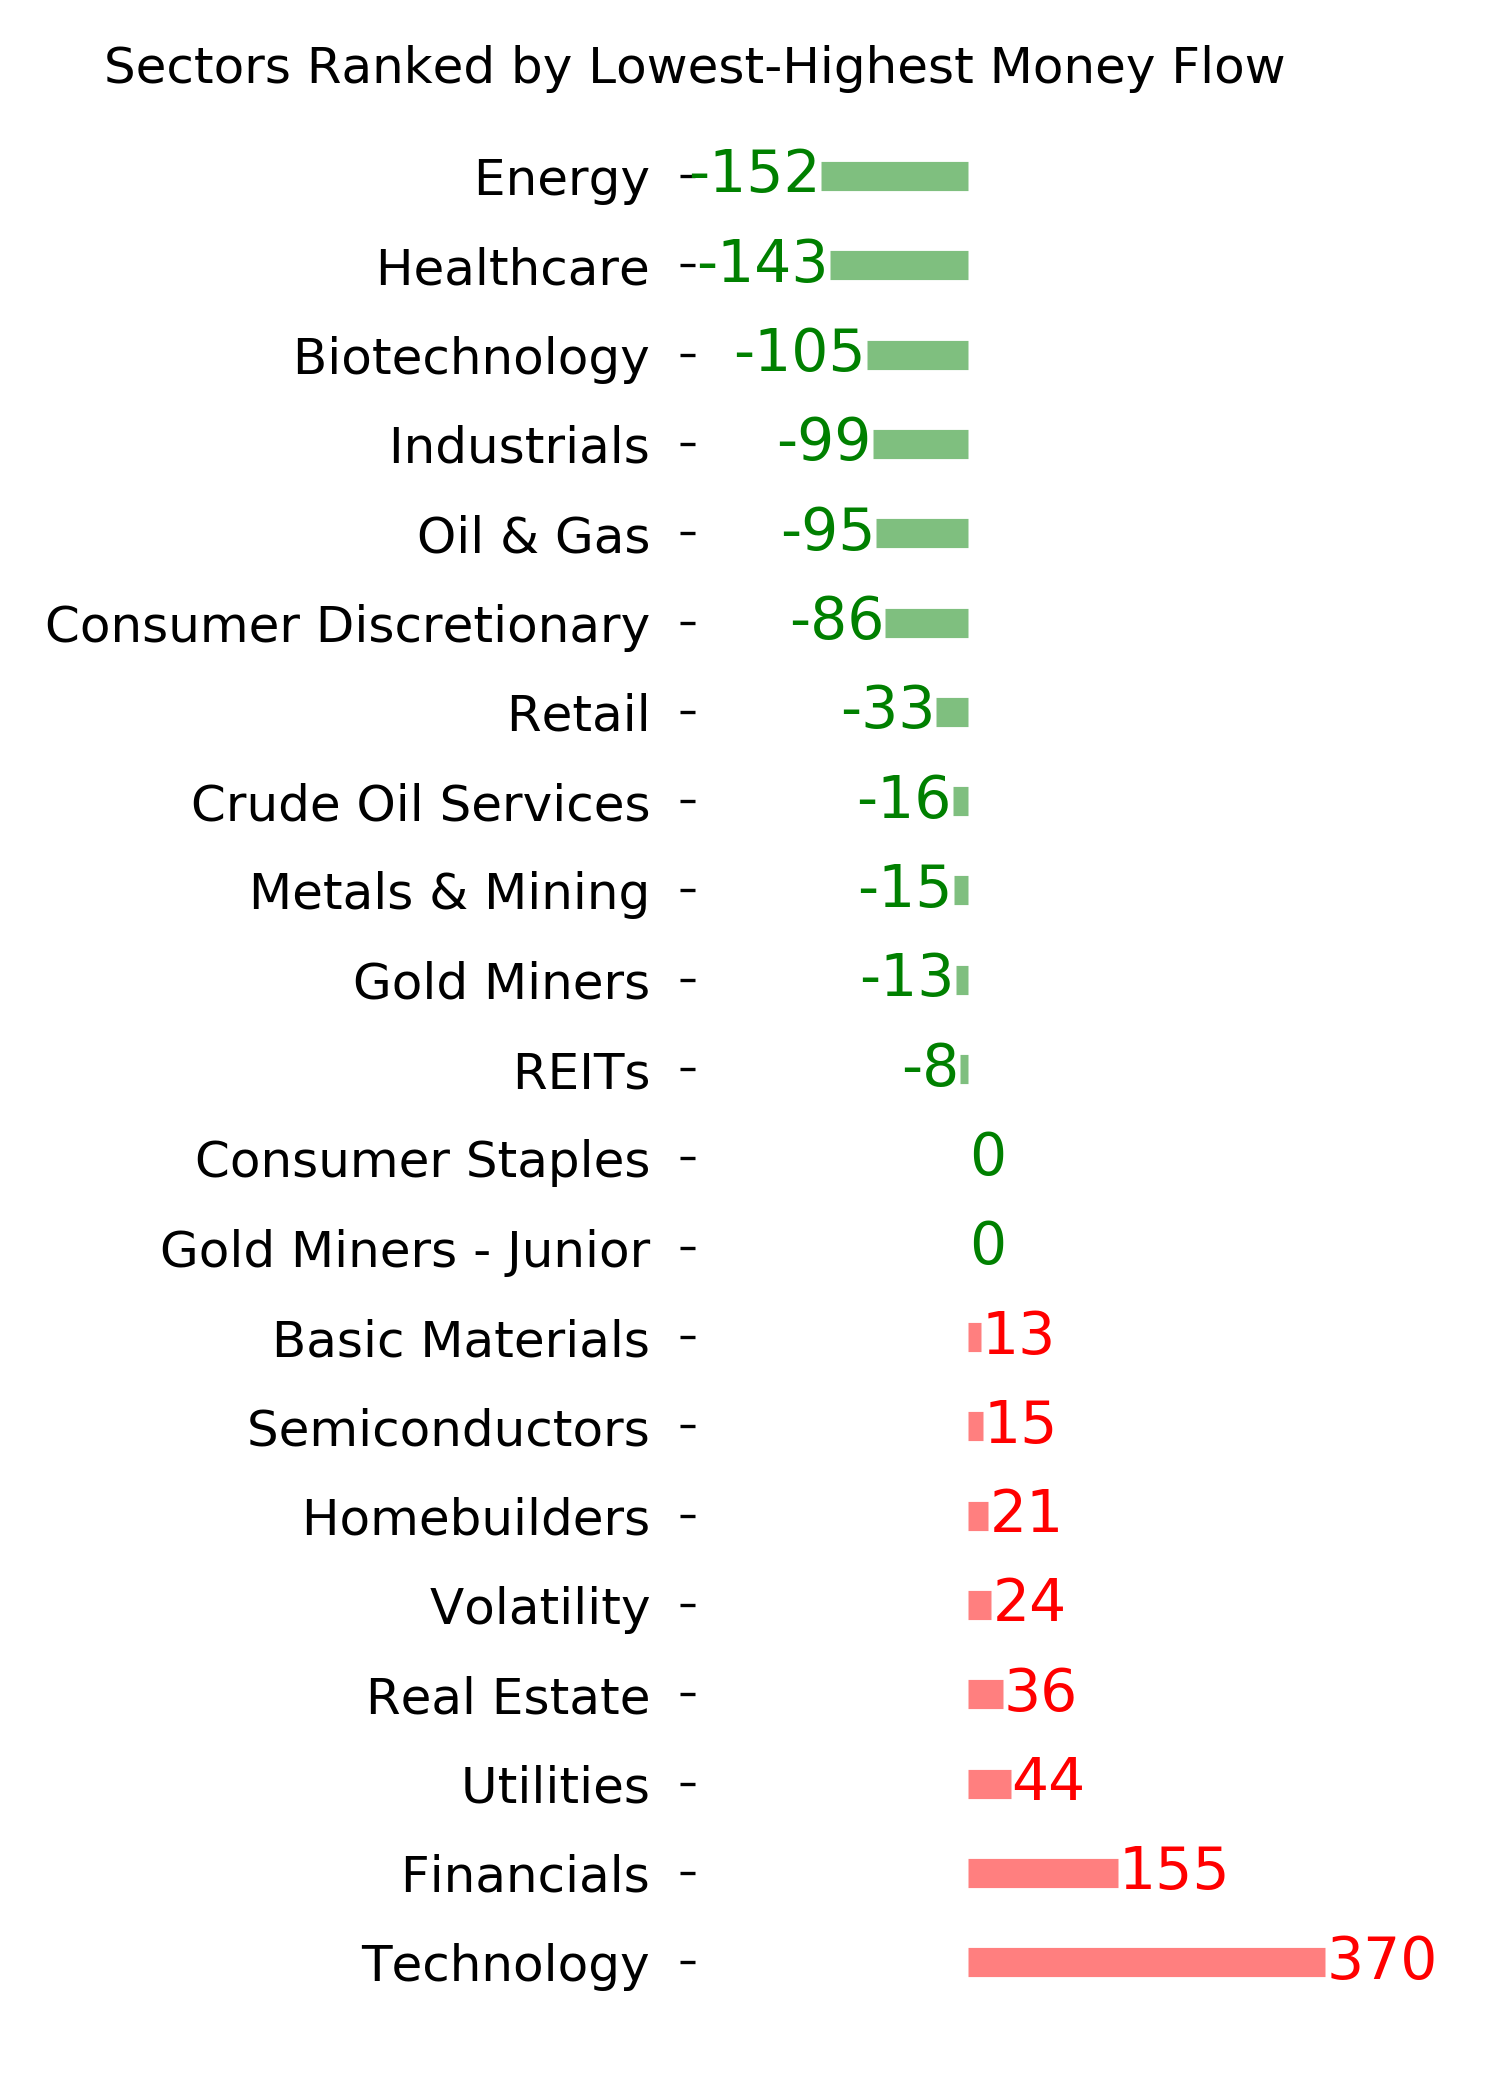
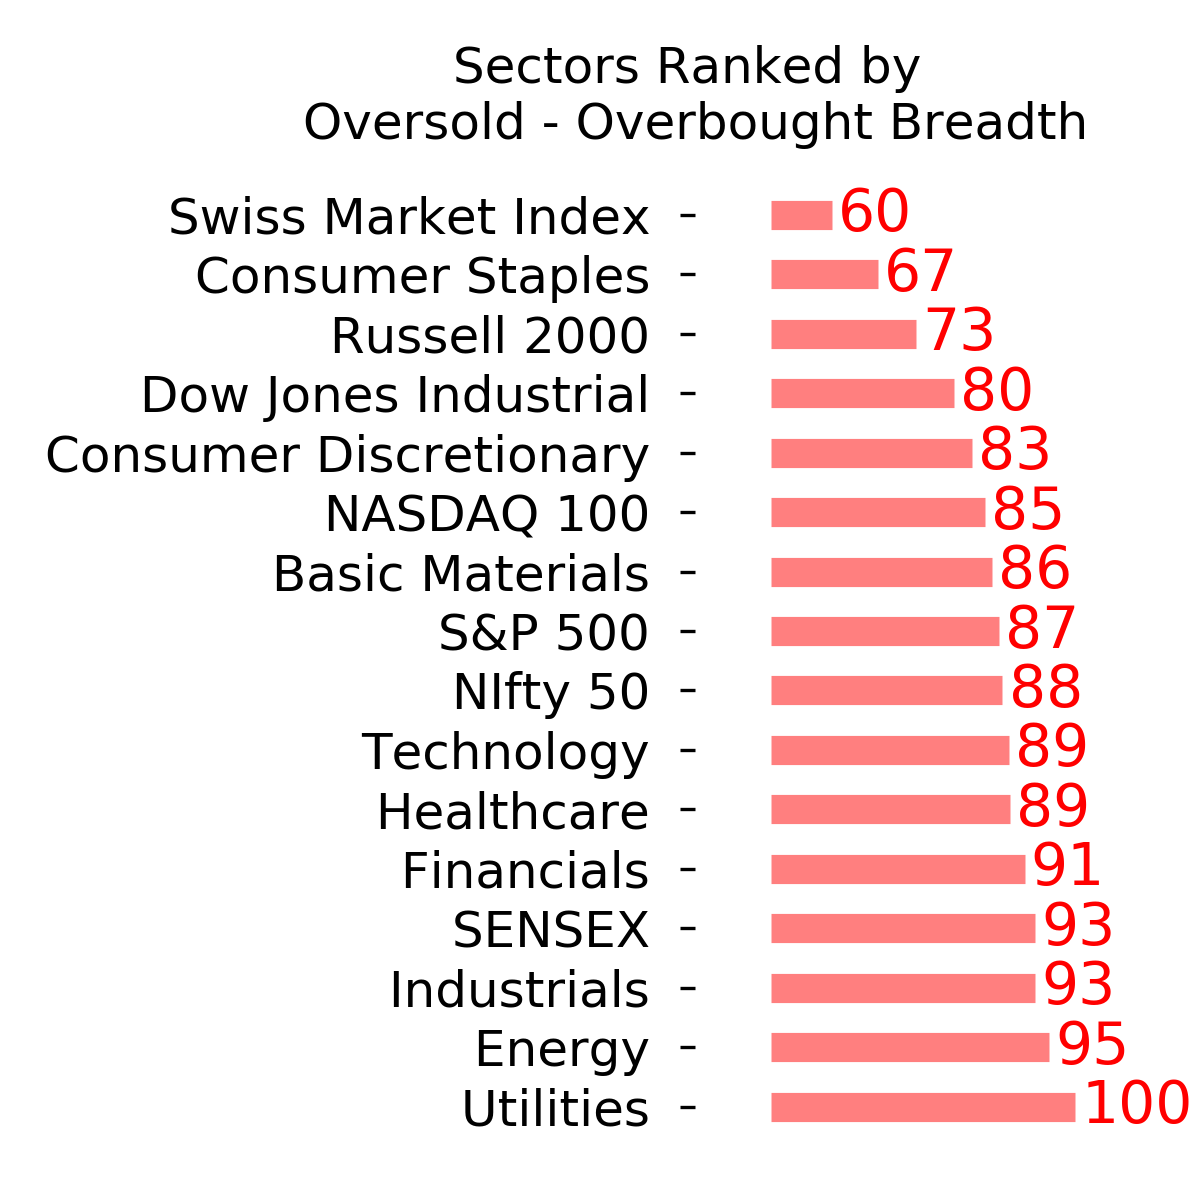
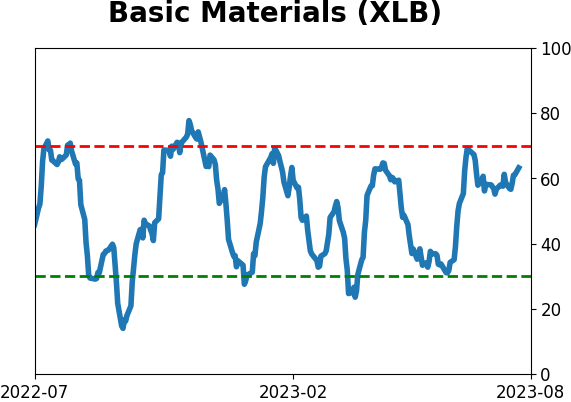
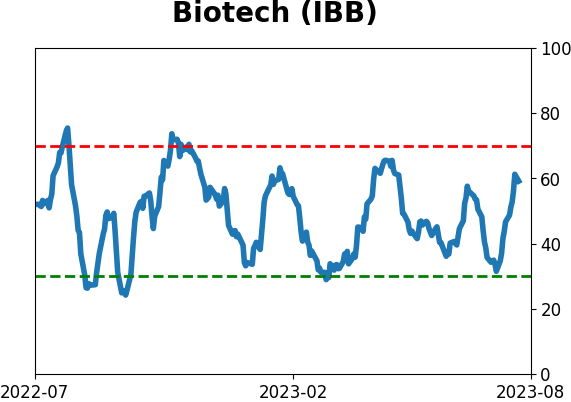
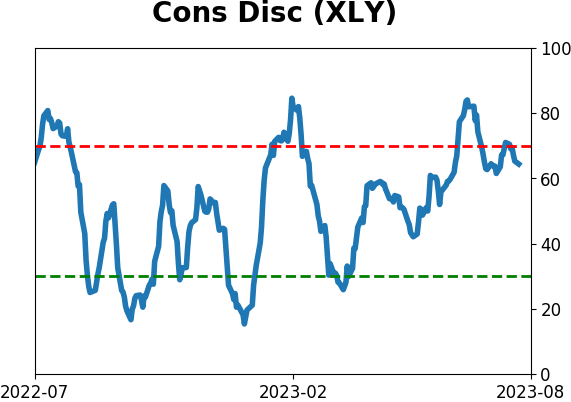
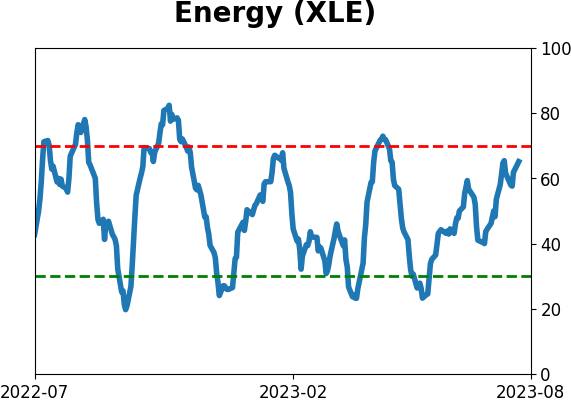
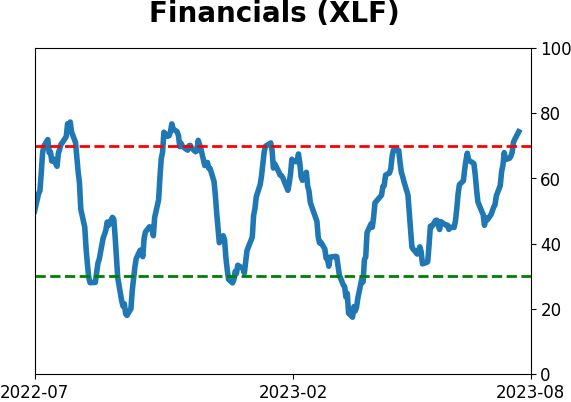
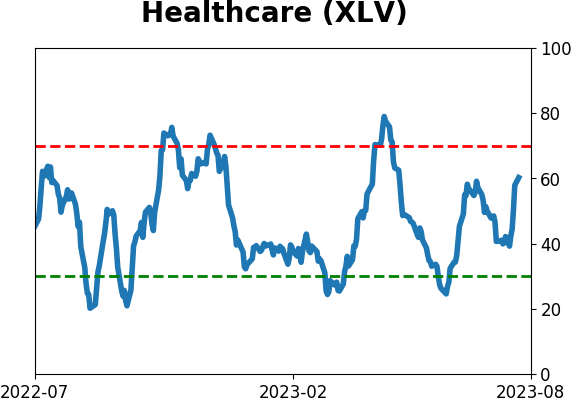
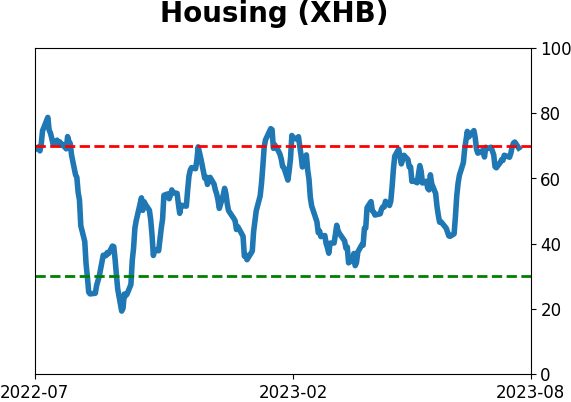
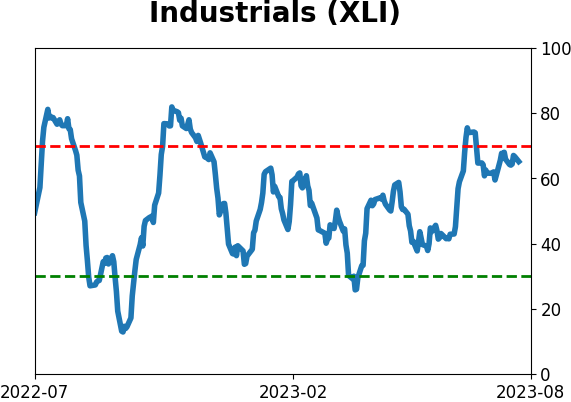
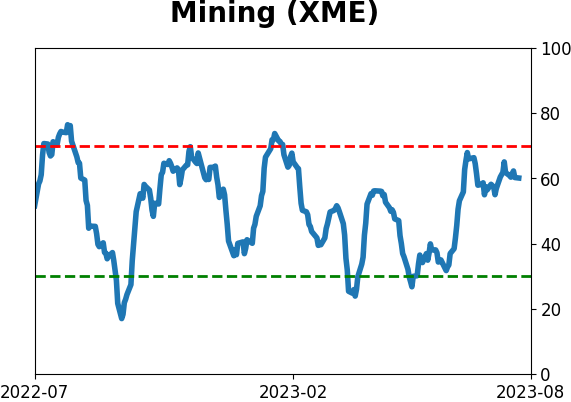
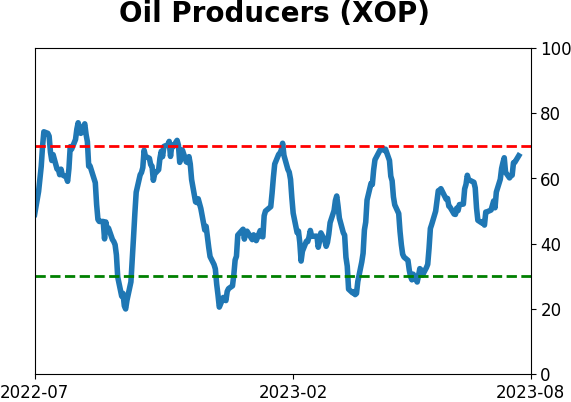
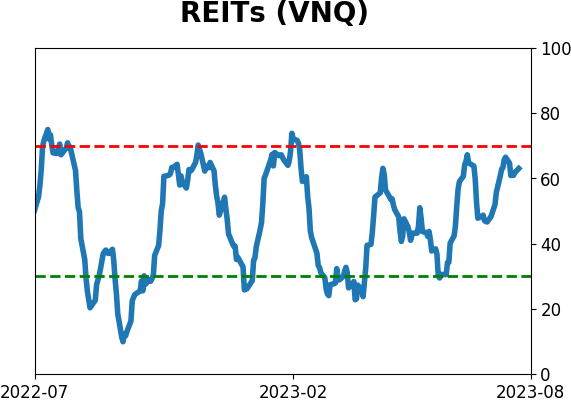
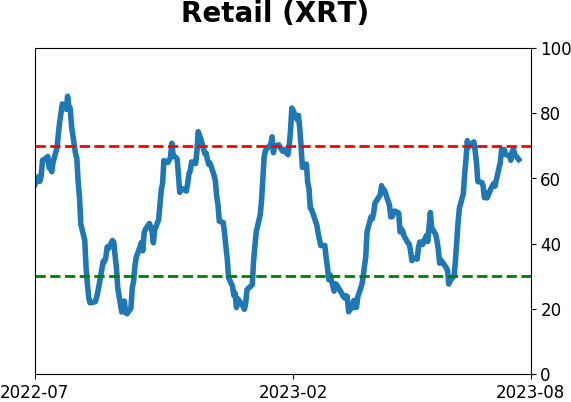
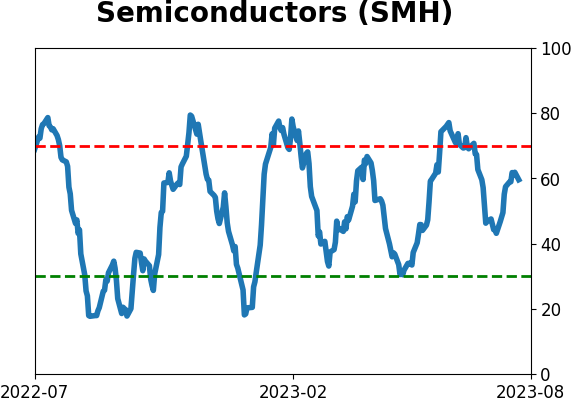
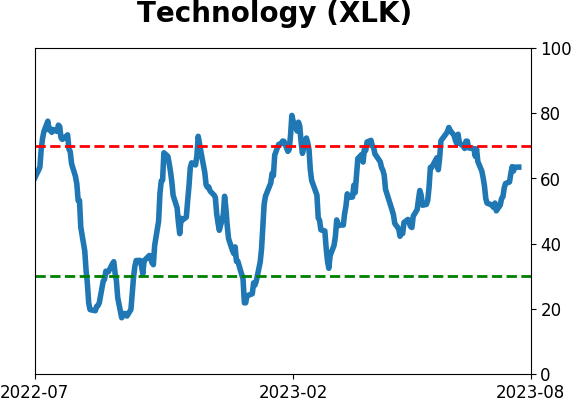
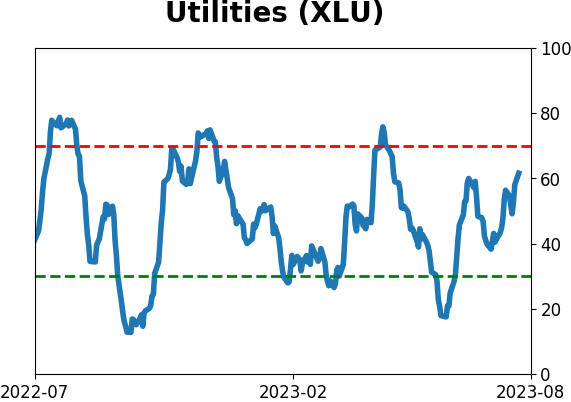
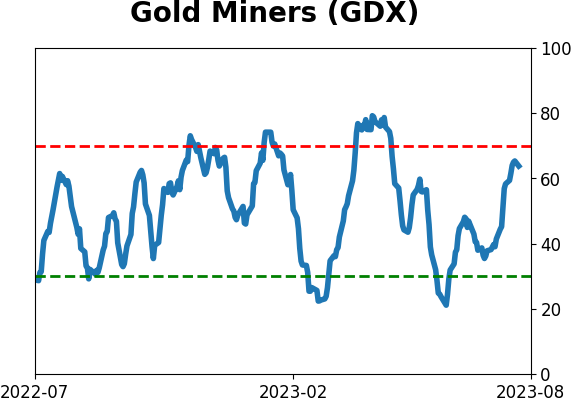
Sector ETF's - 10-Day Moving Average
|
|
|
Country ETF's - 10-Day Moving Average
|
|
|
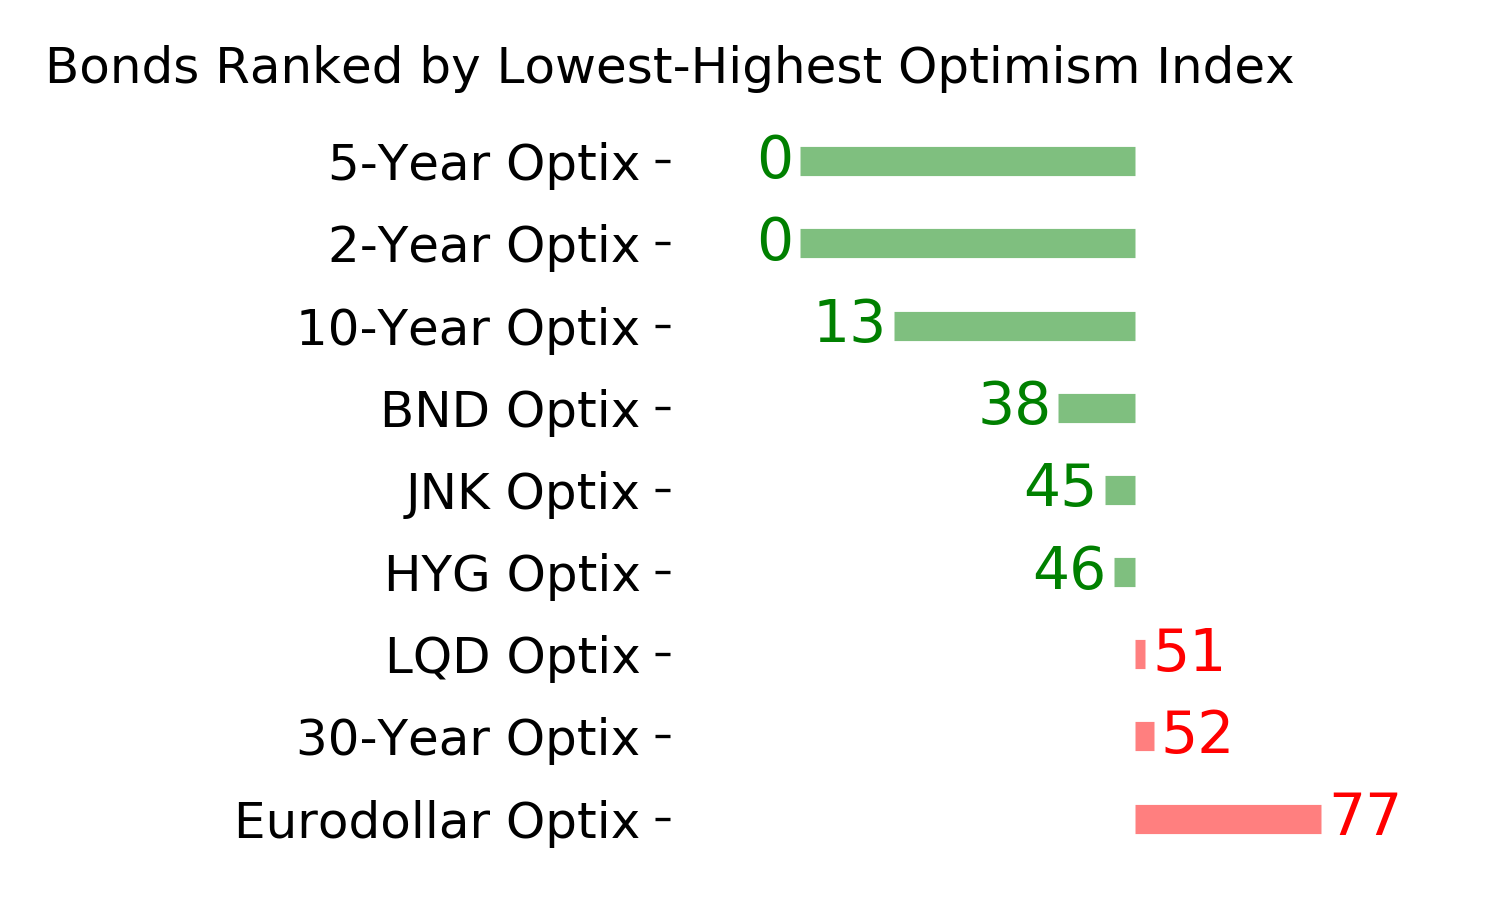
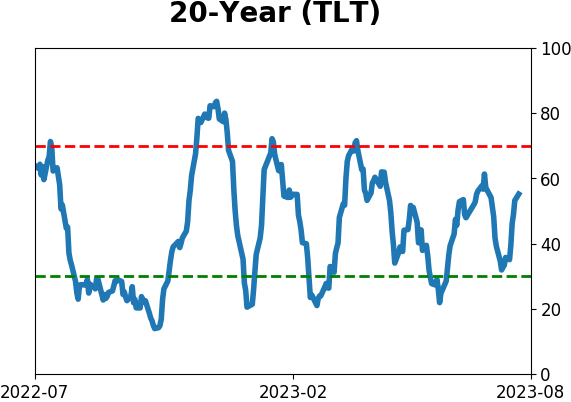
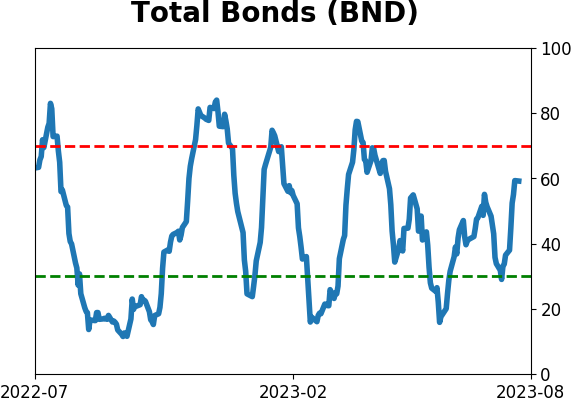
Bond ETF's - 10-Day Moving Average
|
|
|
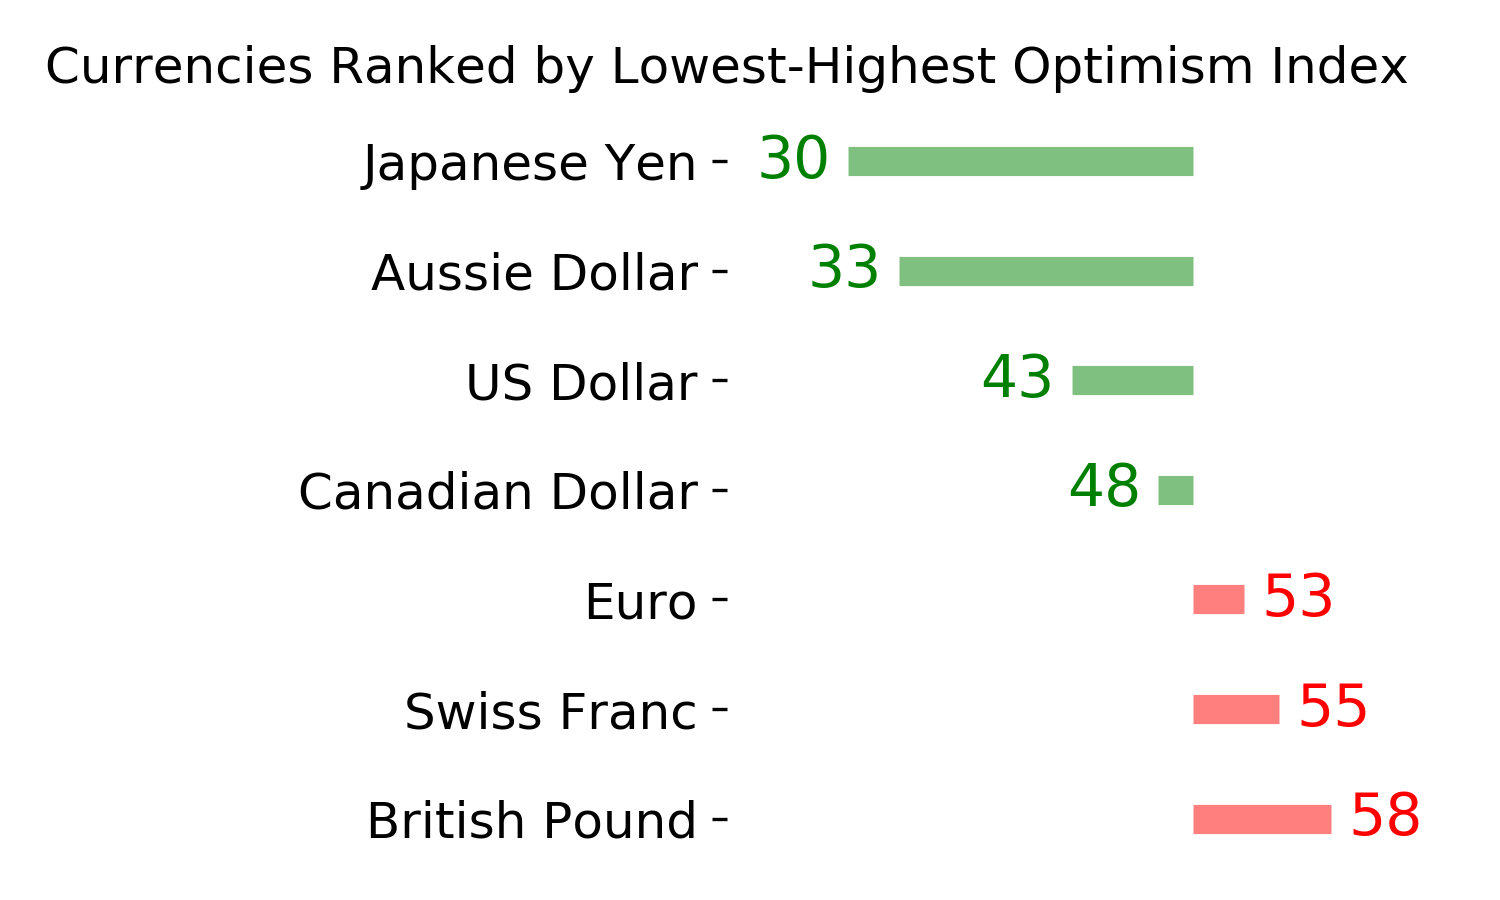
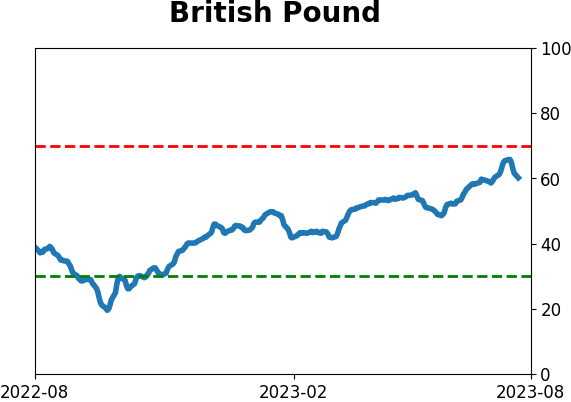
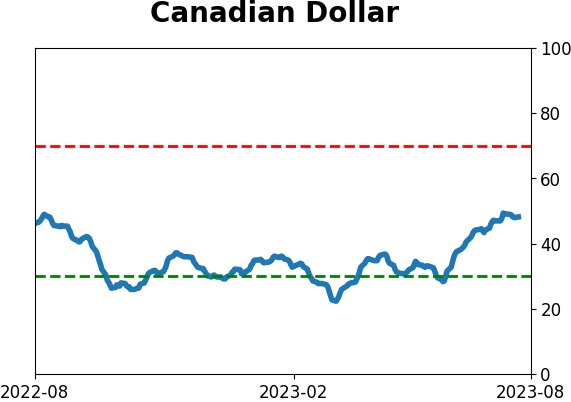
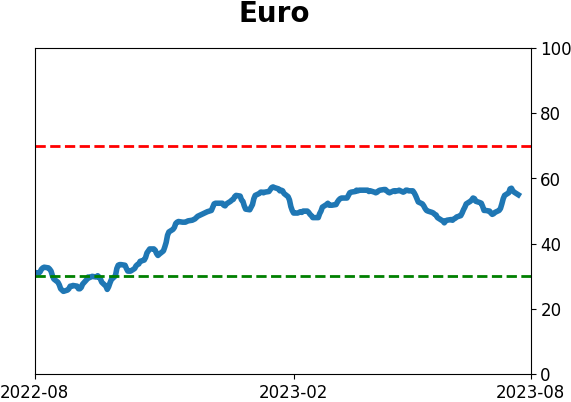
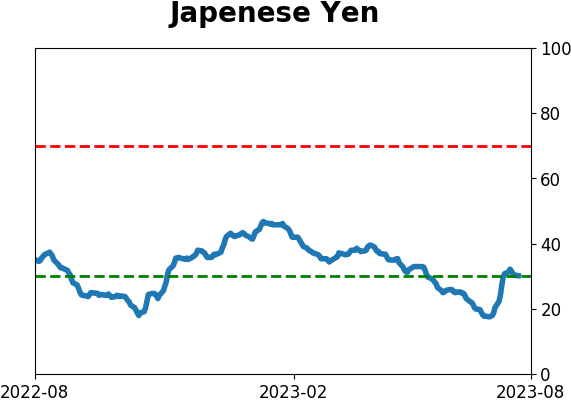
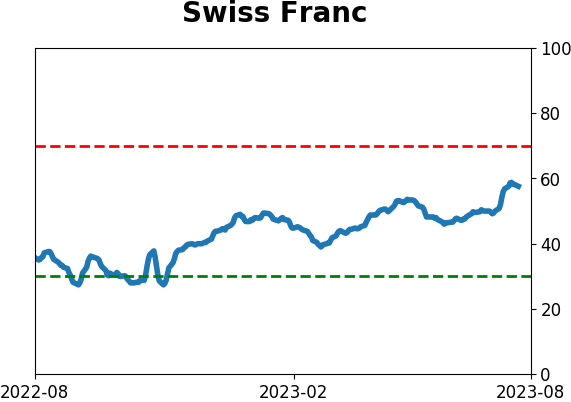
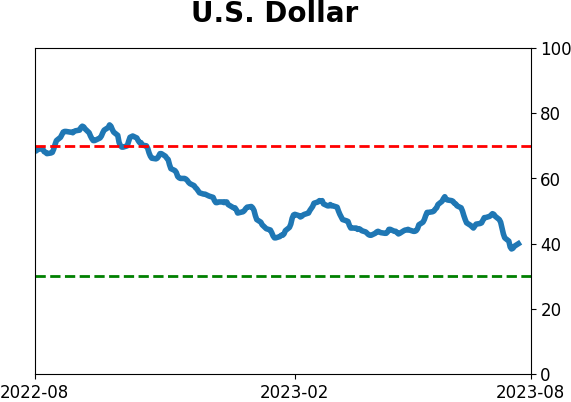
Currency ETF's - 5-Day Moving Average
|
|
|
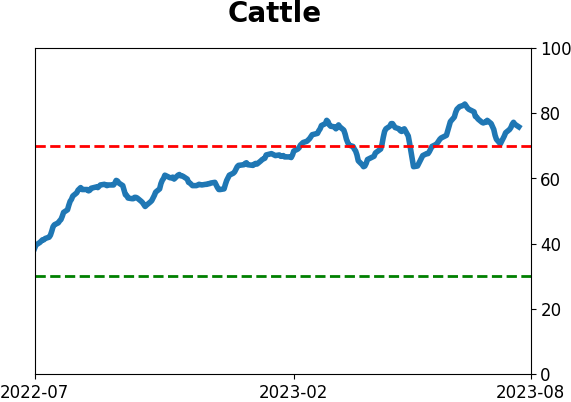
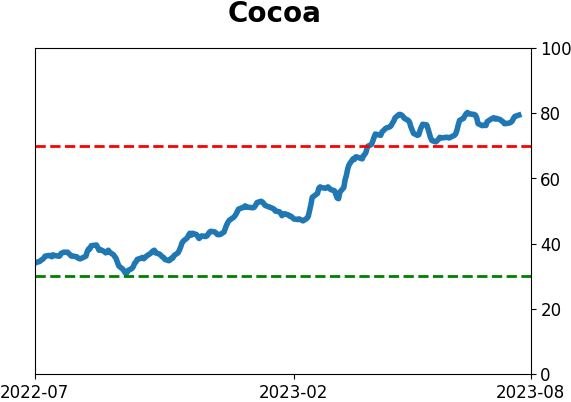
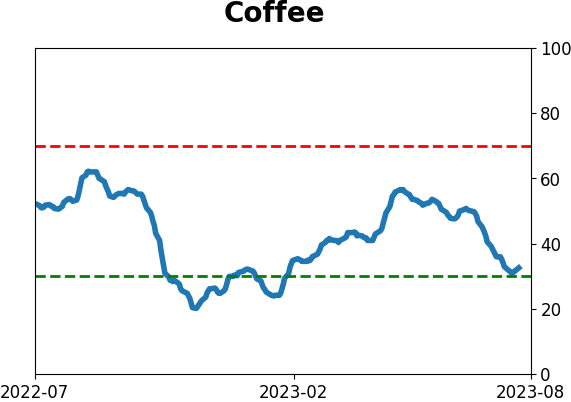
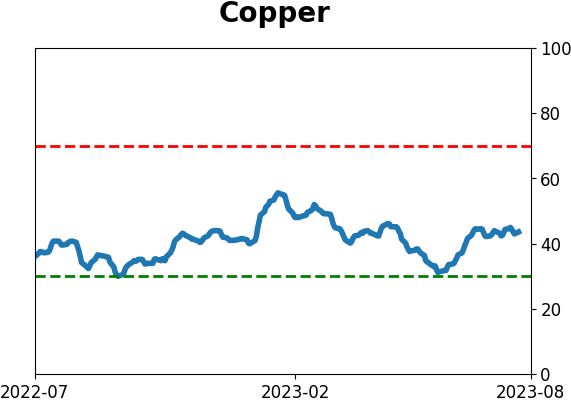
Commodity ETF's - 5-Day Moving Average
|
|