Daily Report : Why it may be time to consider the short side of oil

| View/Print a PDF version of this Report |
Headlines
|
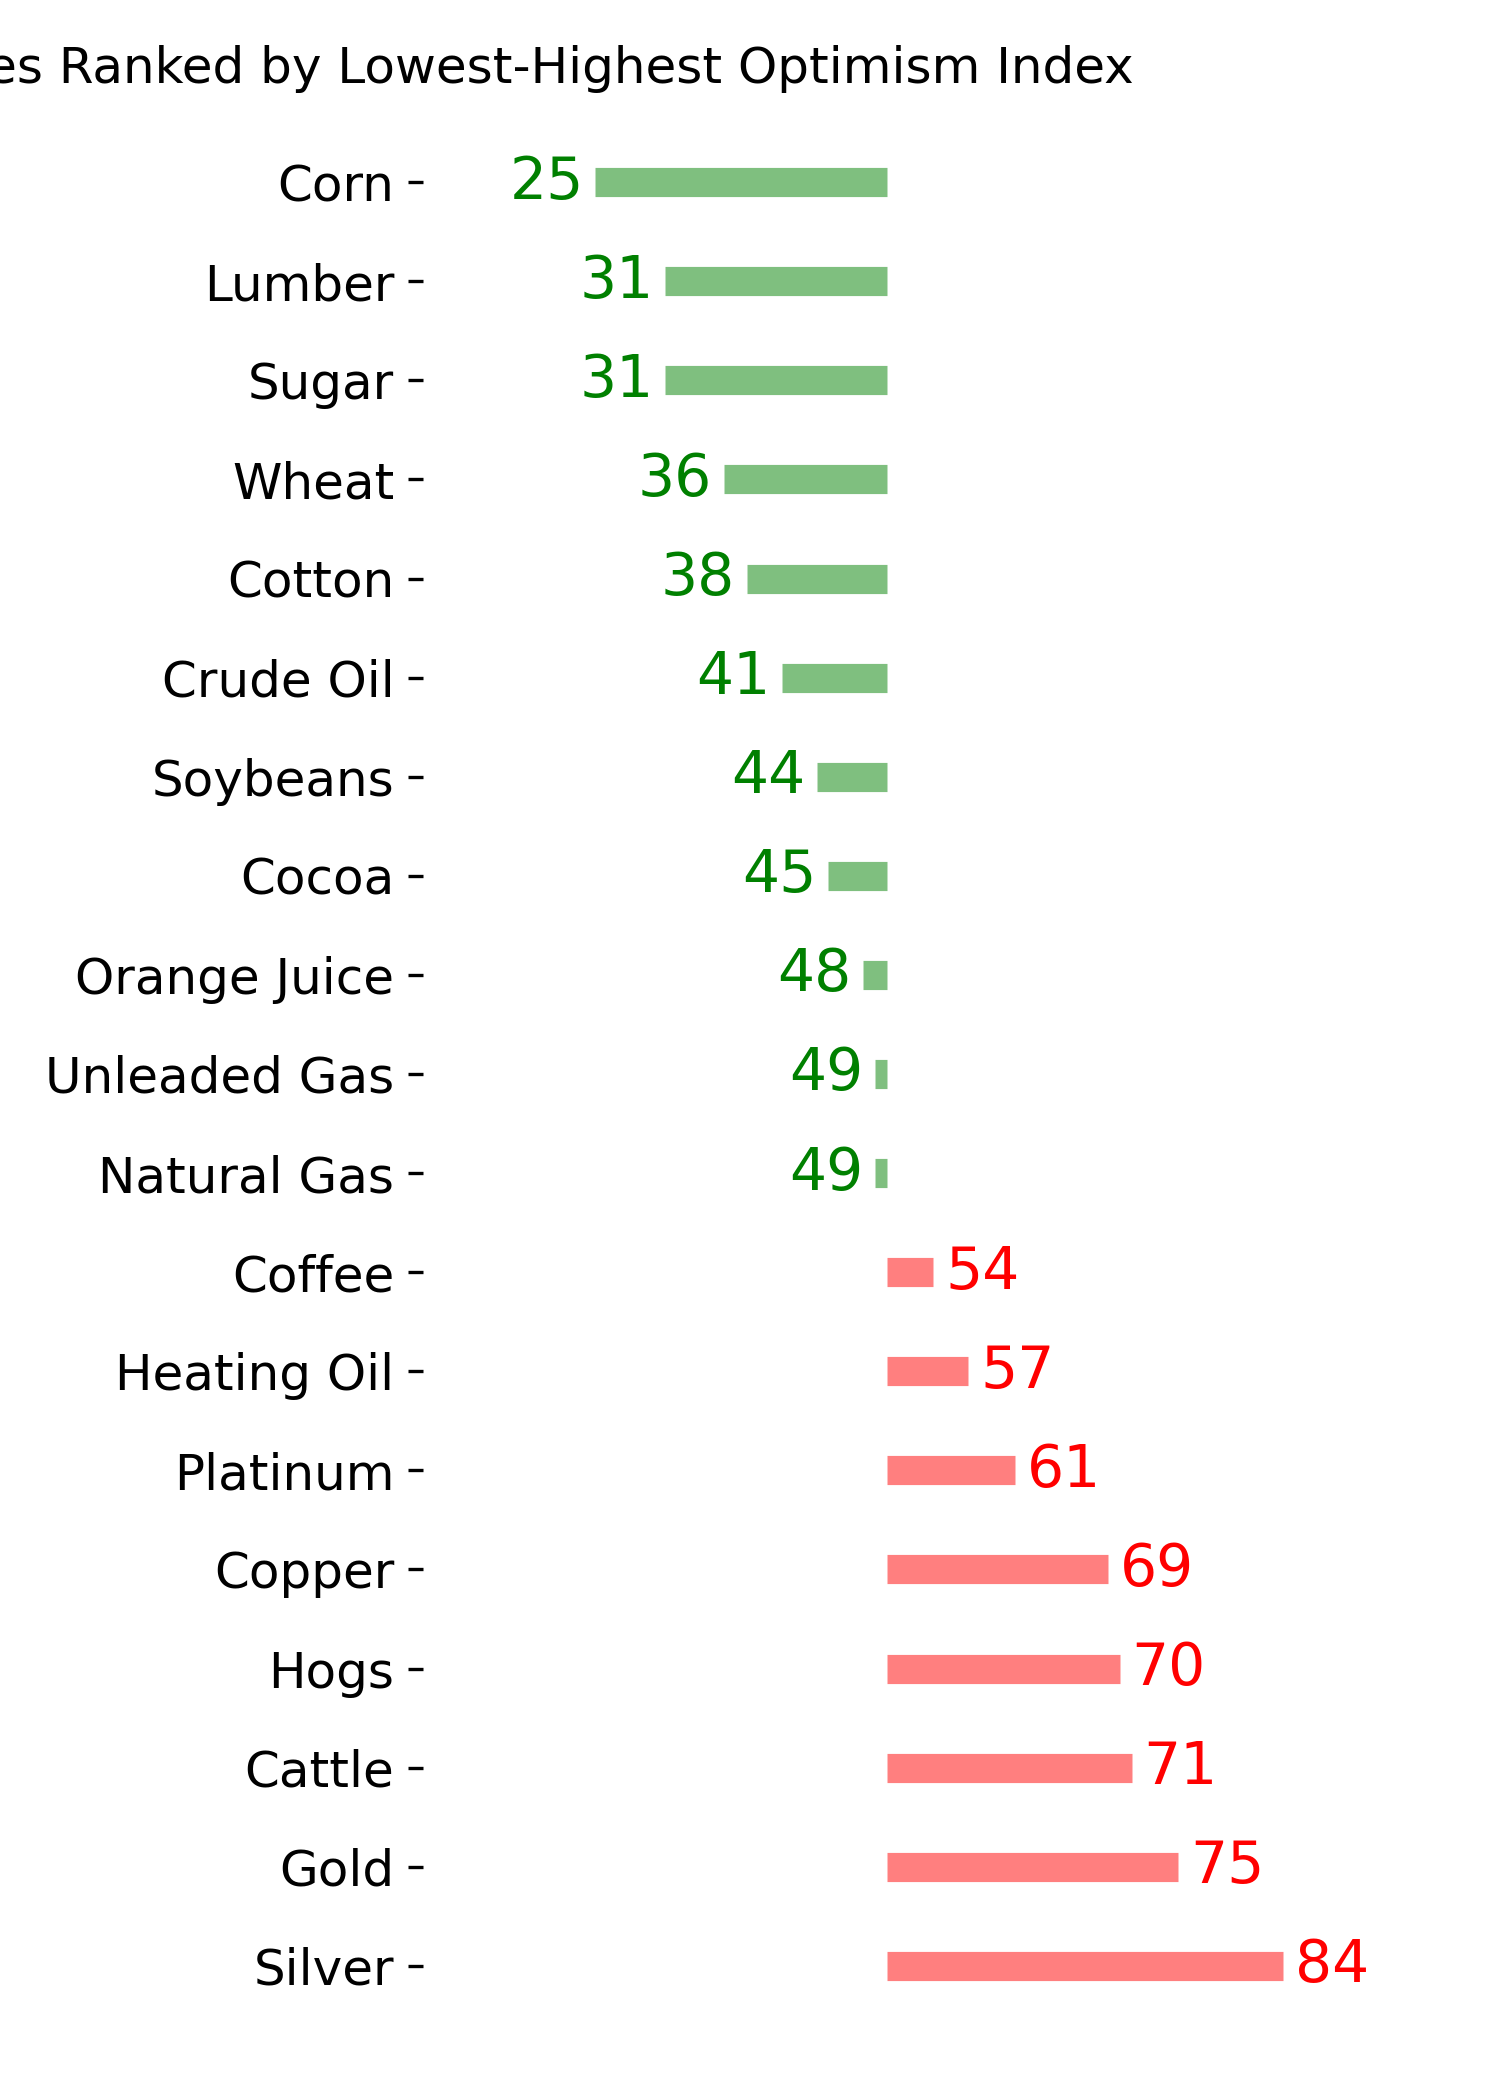
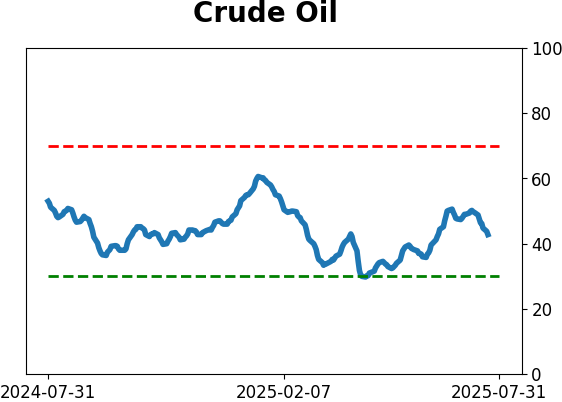
Why it may be time to consider the short side of oil: Crude oil has been holding its own of late, but two seasonal periods in the second half of the year have seen ticker USO shed over 90% of its value over the past 19 years. As a result, aggressive traders should be looking for an opportunity to play the short side. |
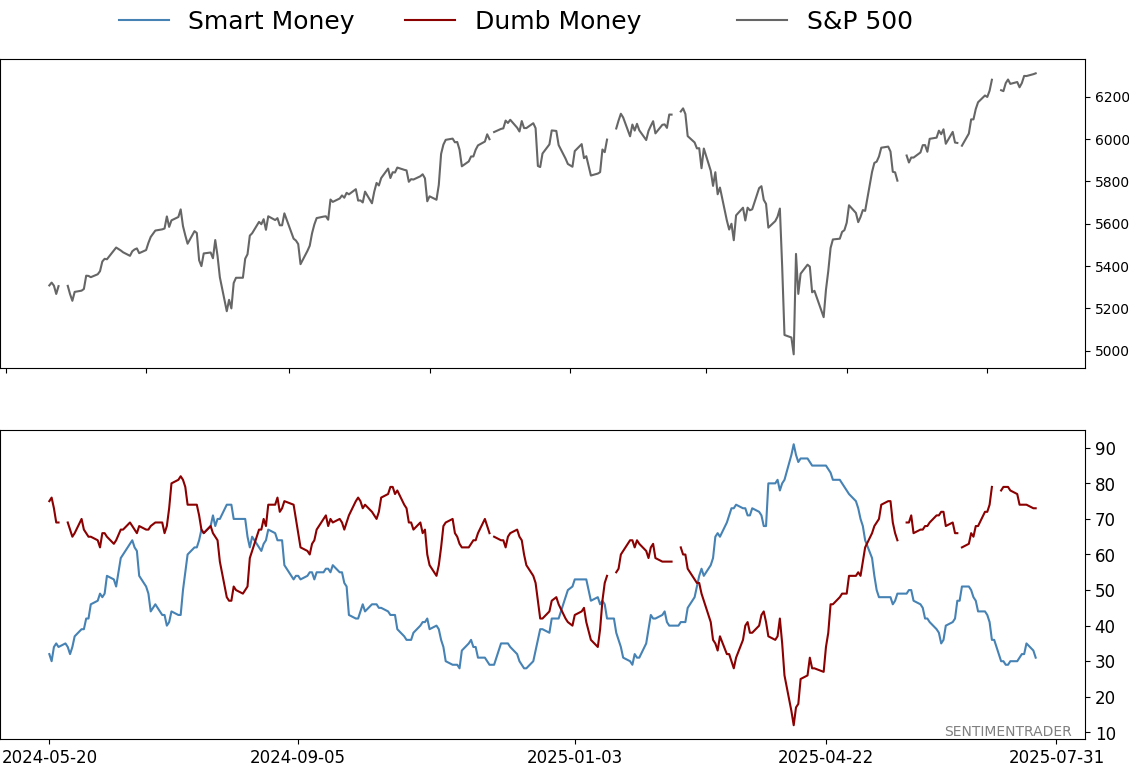
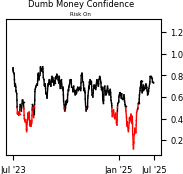
Smart / Dumb Money Confidence
|
|
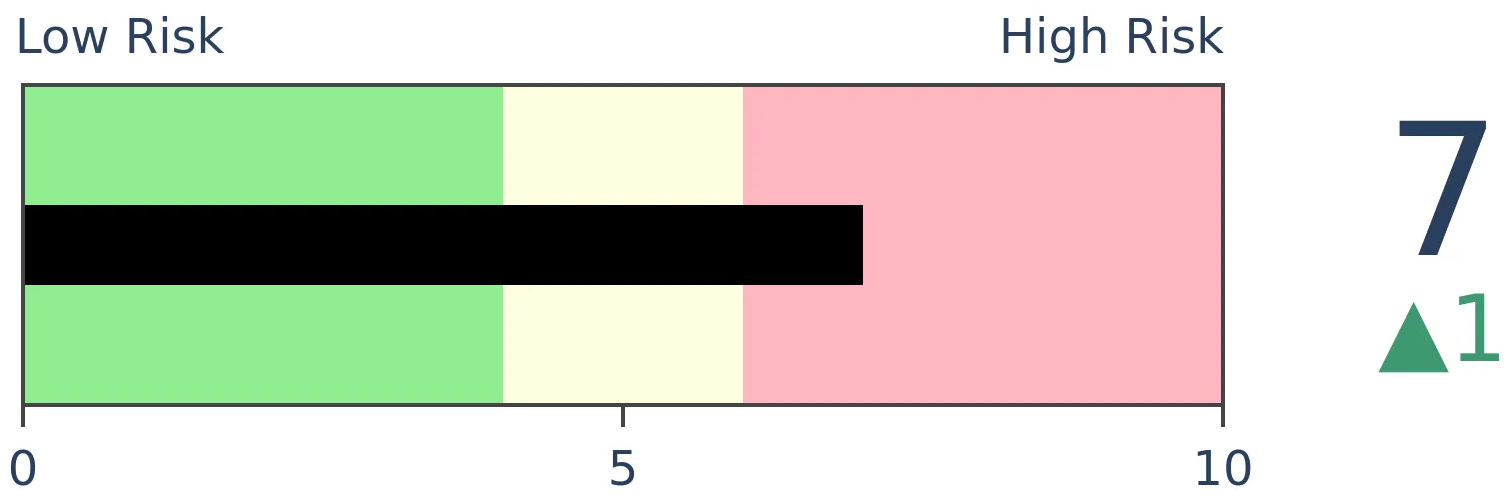
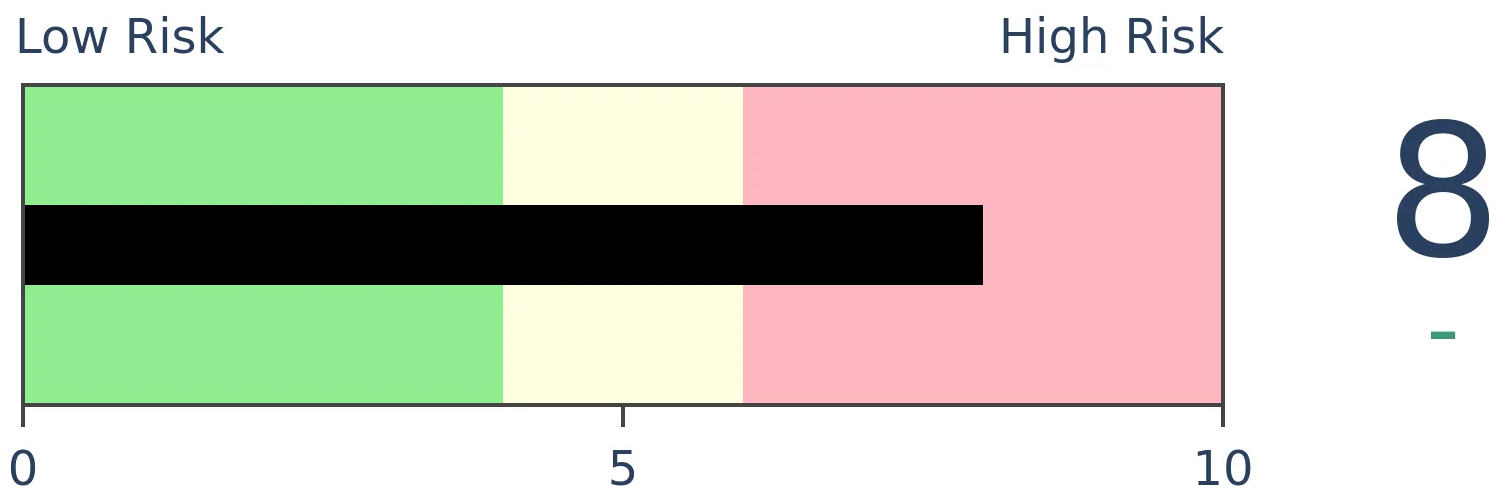
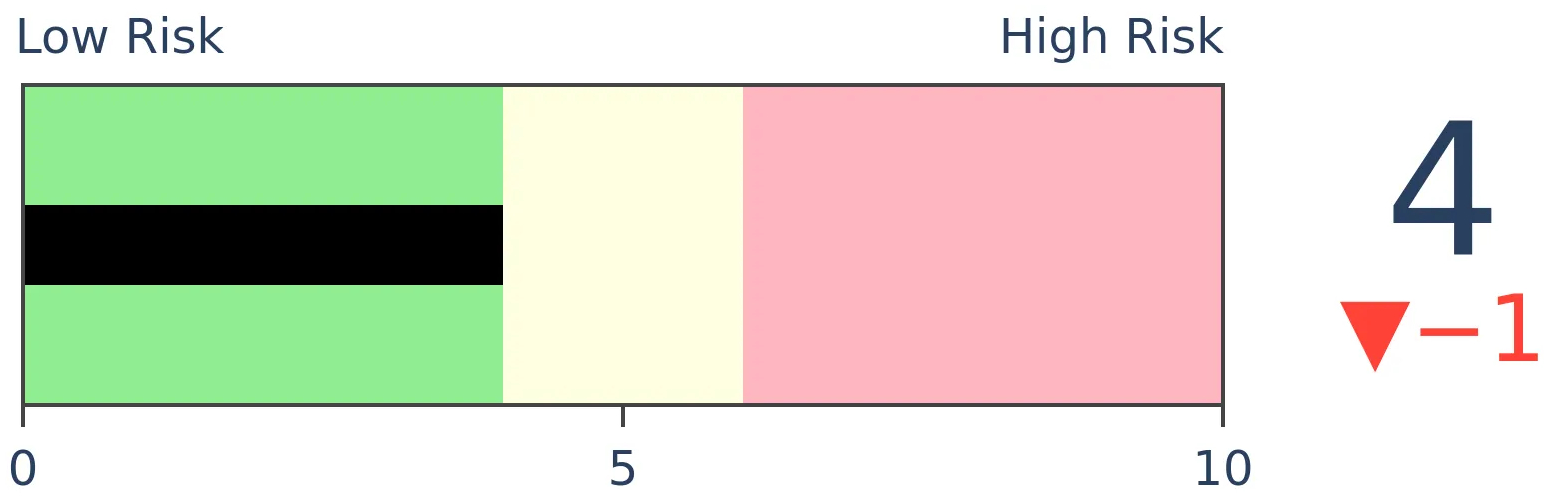
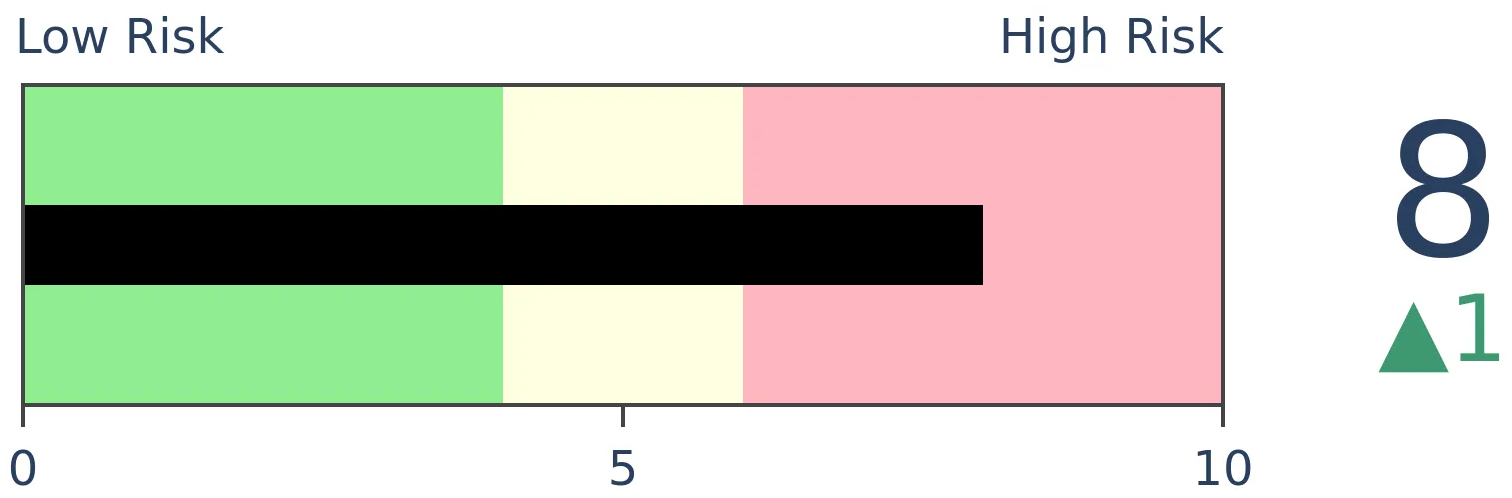
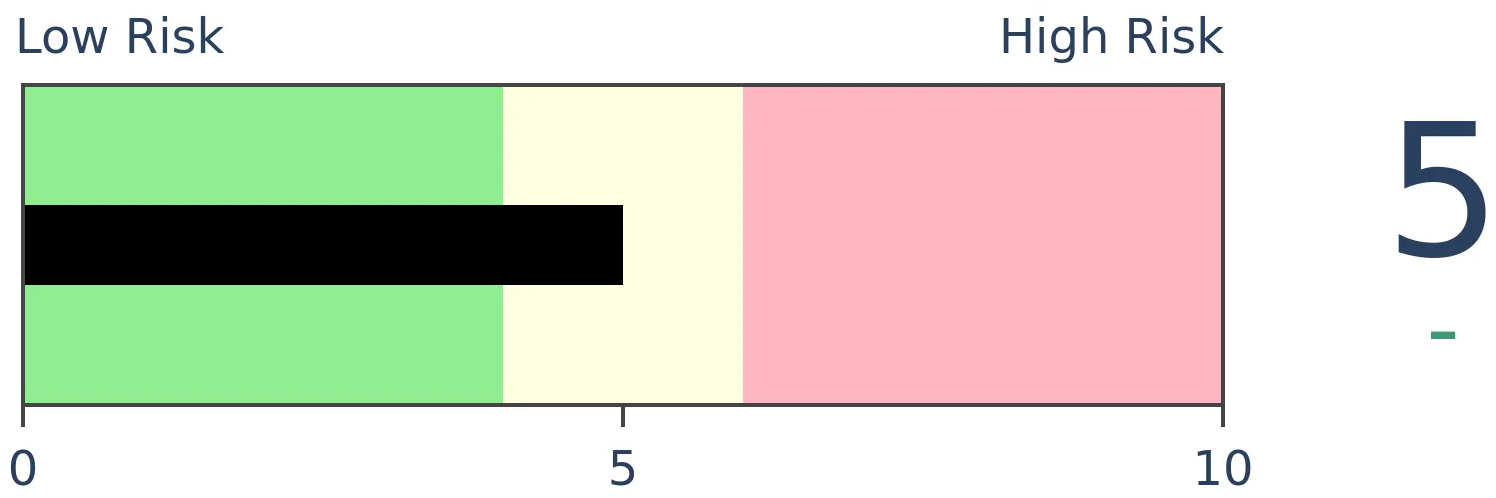
Risk Levels
|
|

|
Research
Why it may be time to consider the short side of oilBy Jay KaeppelBOTTOM LINECrude oil has been holding its own of late, but two seasonal periods in the second half of the year have seen ticker USO shed over 90% of its value over the past 19 years. As a result, aggressive traders should be looking for an opportunity to play the short side. FORECAST / TIMEFRAME |
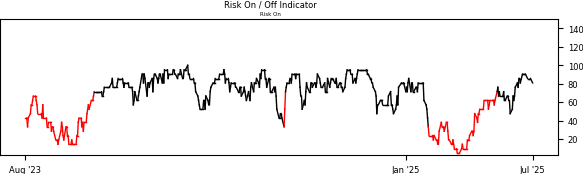
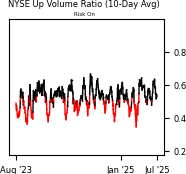
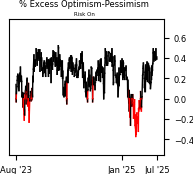
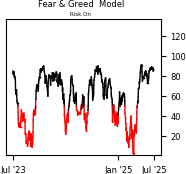
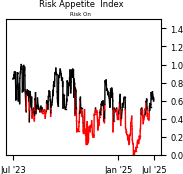
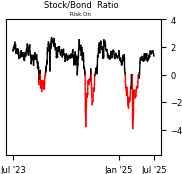
Sentiment Risk On / Risk Off Overview
| ||
|
|
|
|
|
|
|
|
|
|
|
|
Indicators at Extremes
|
|
|
Phase Table
|
|
|
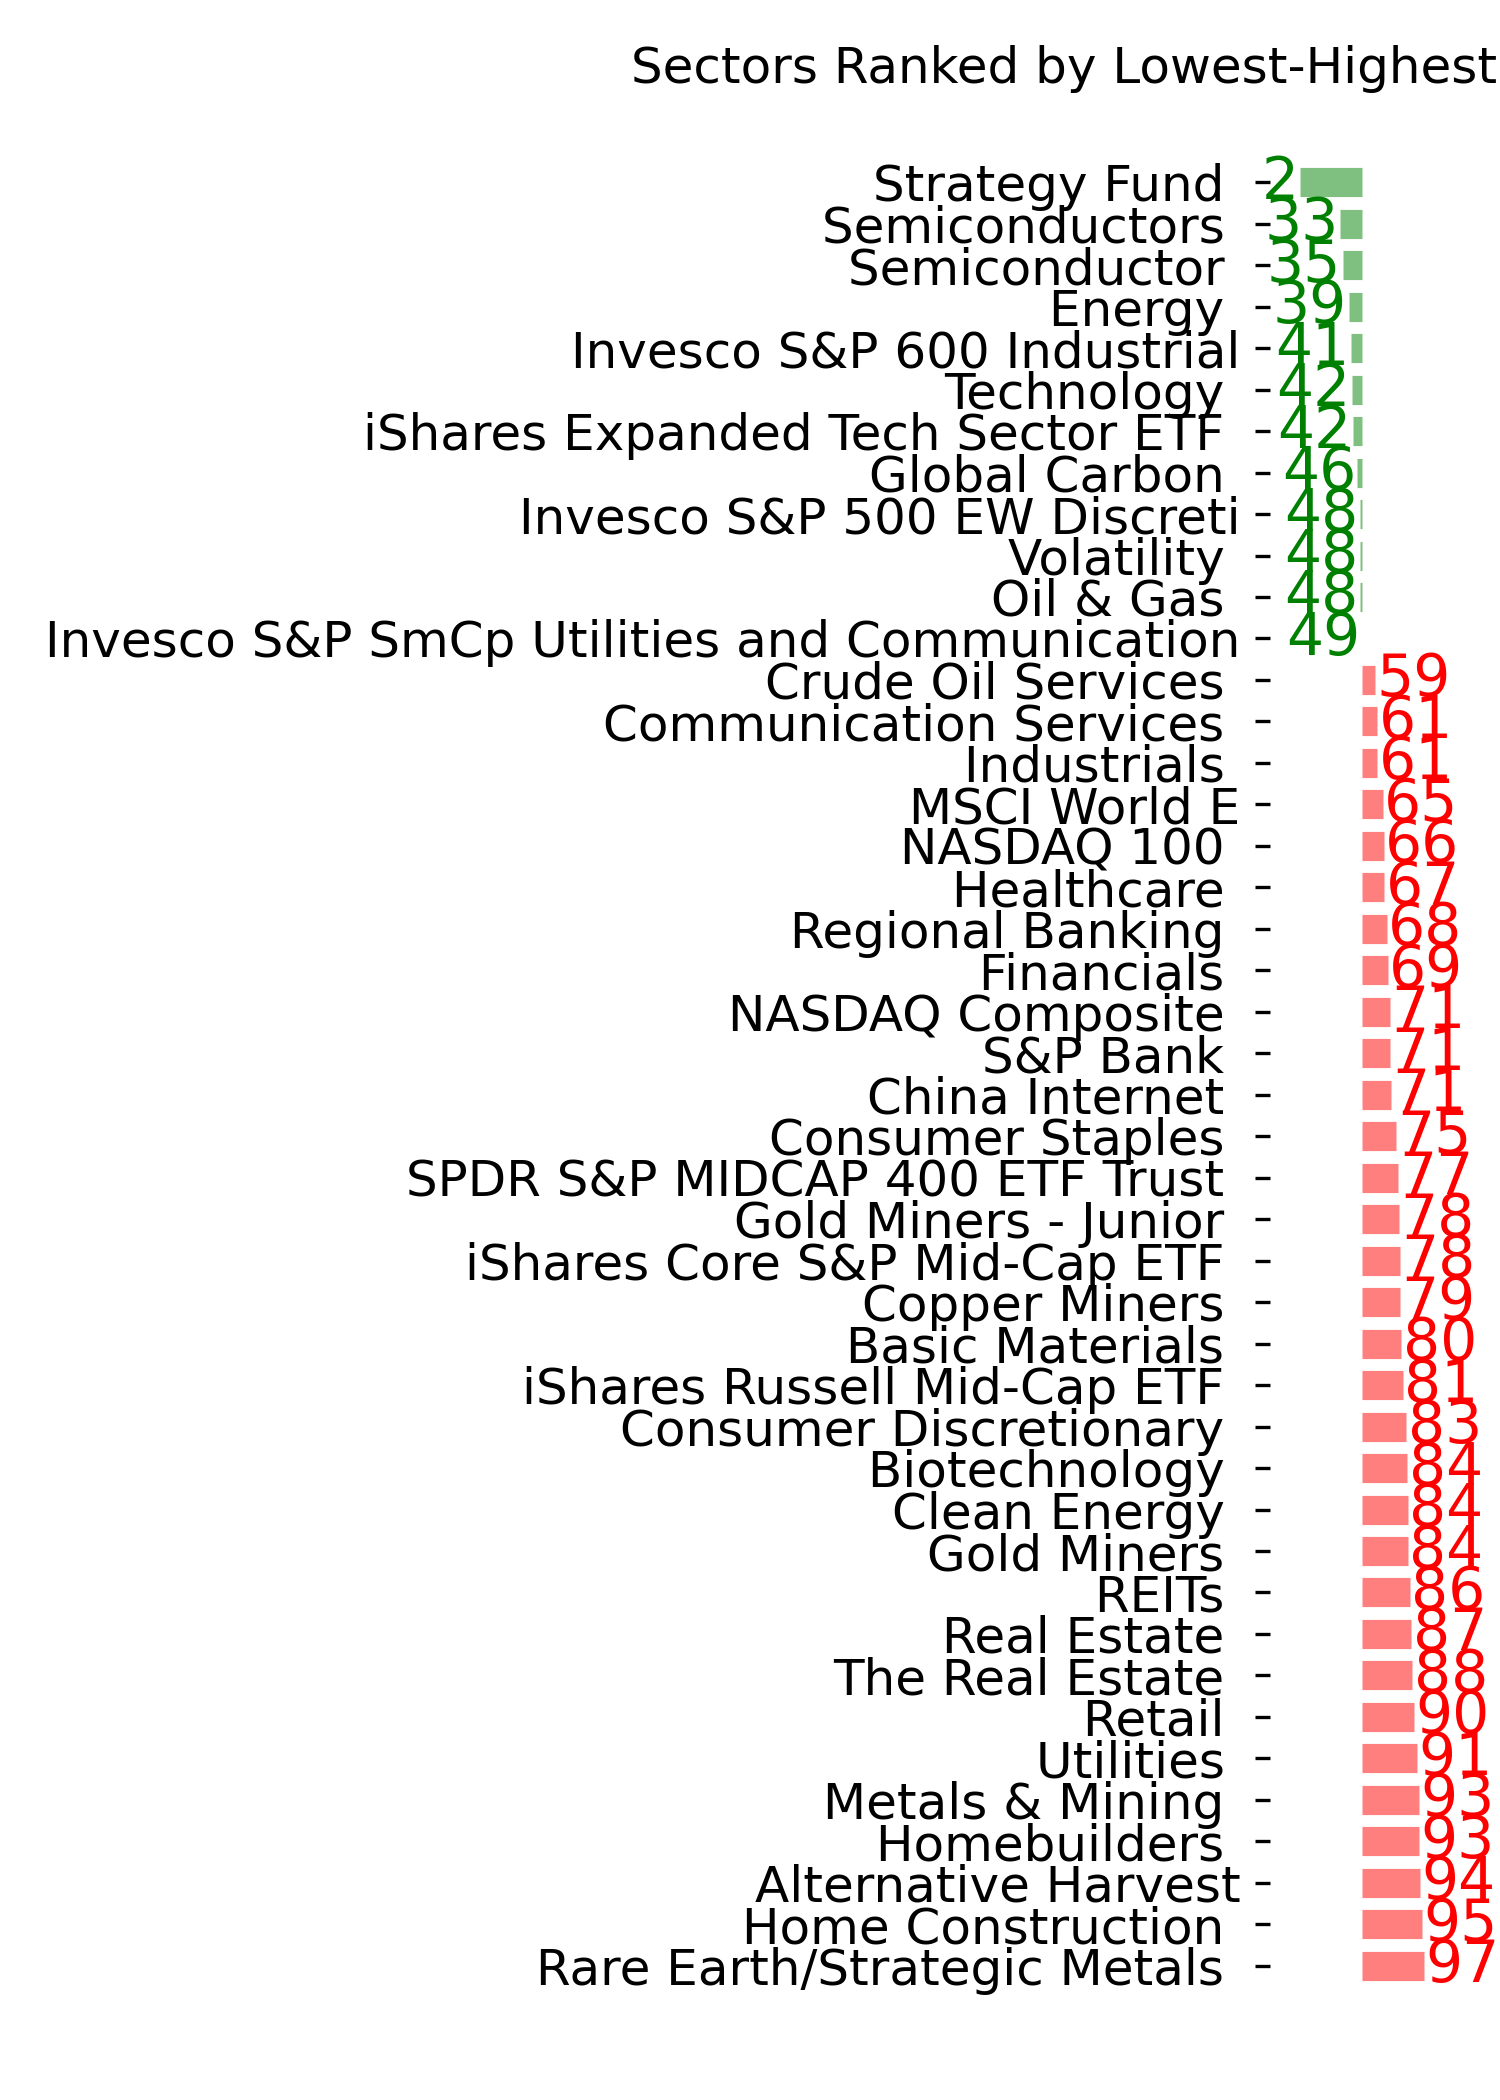
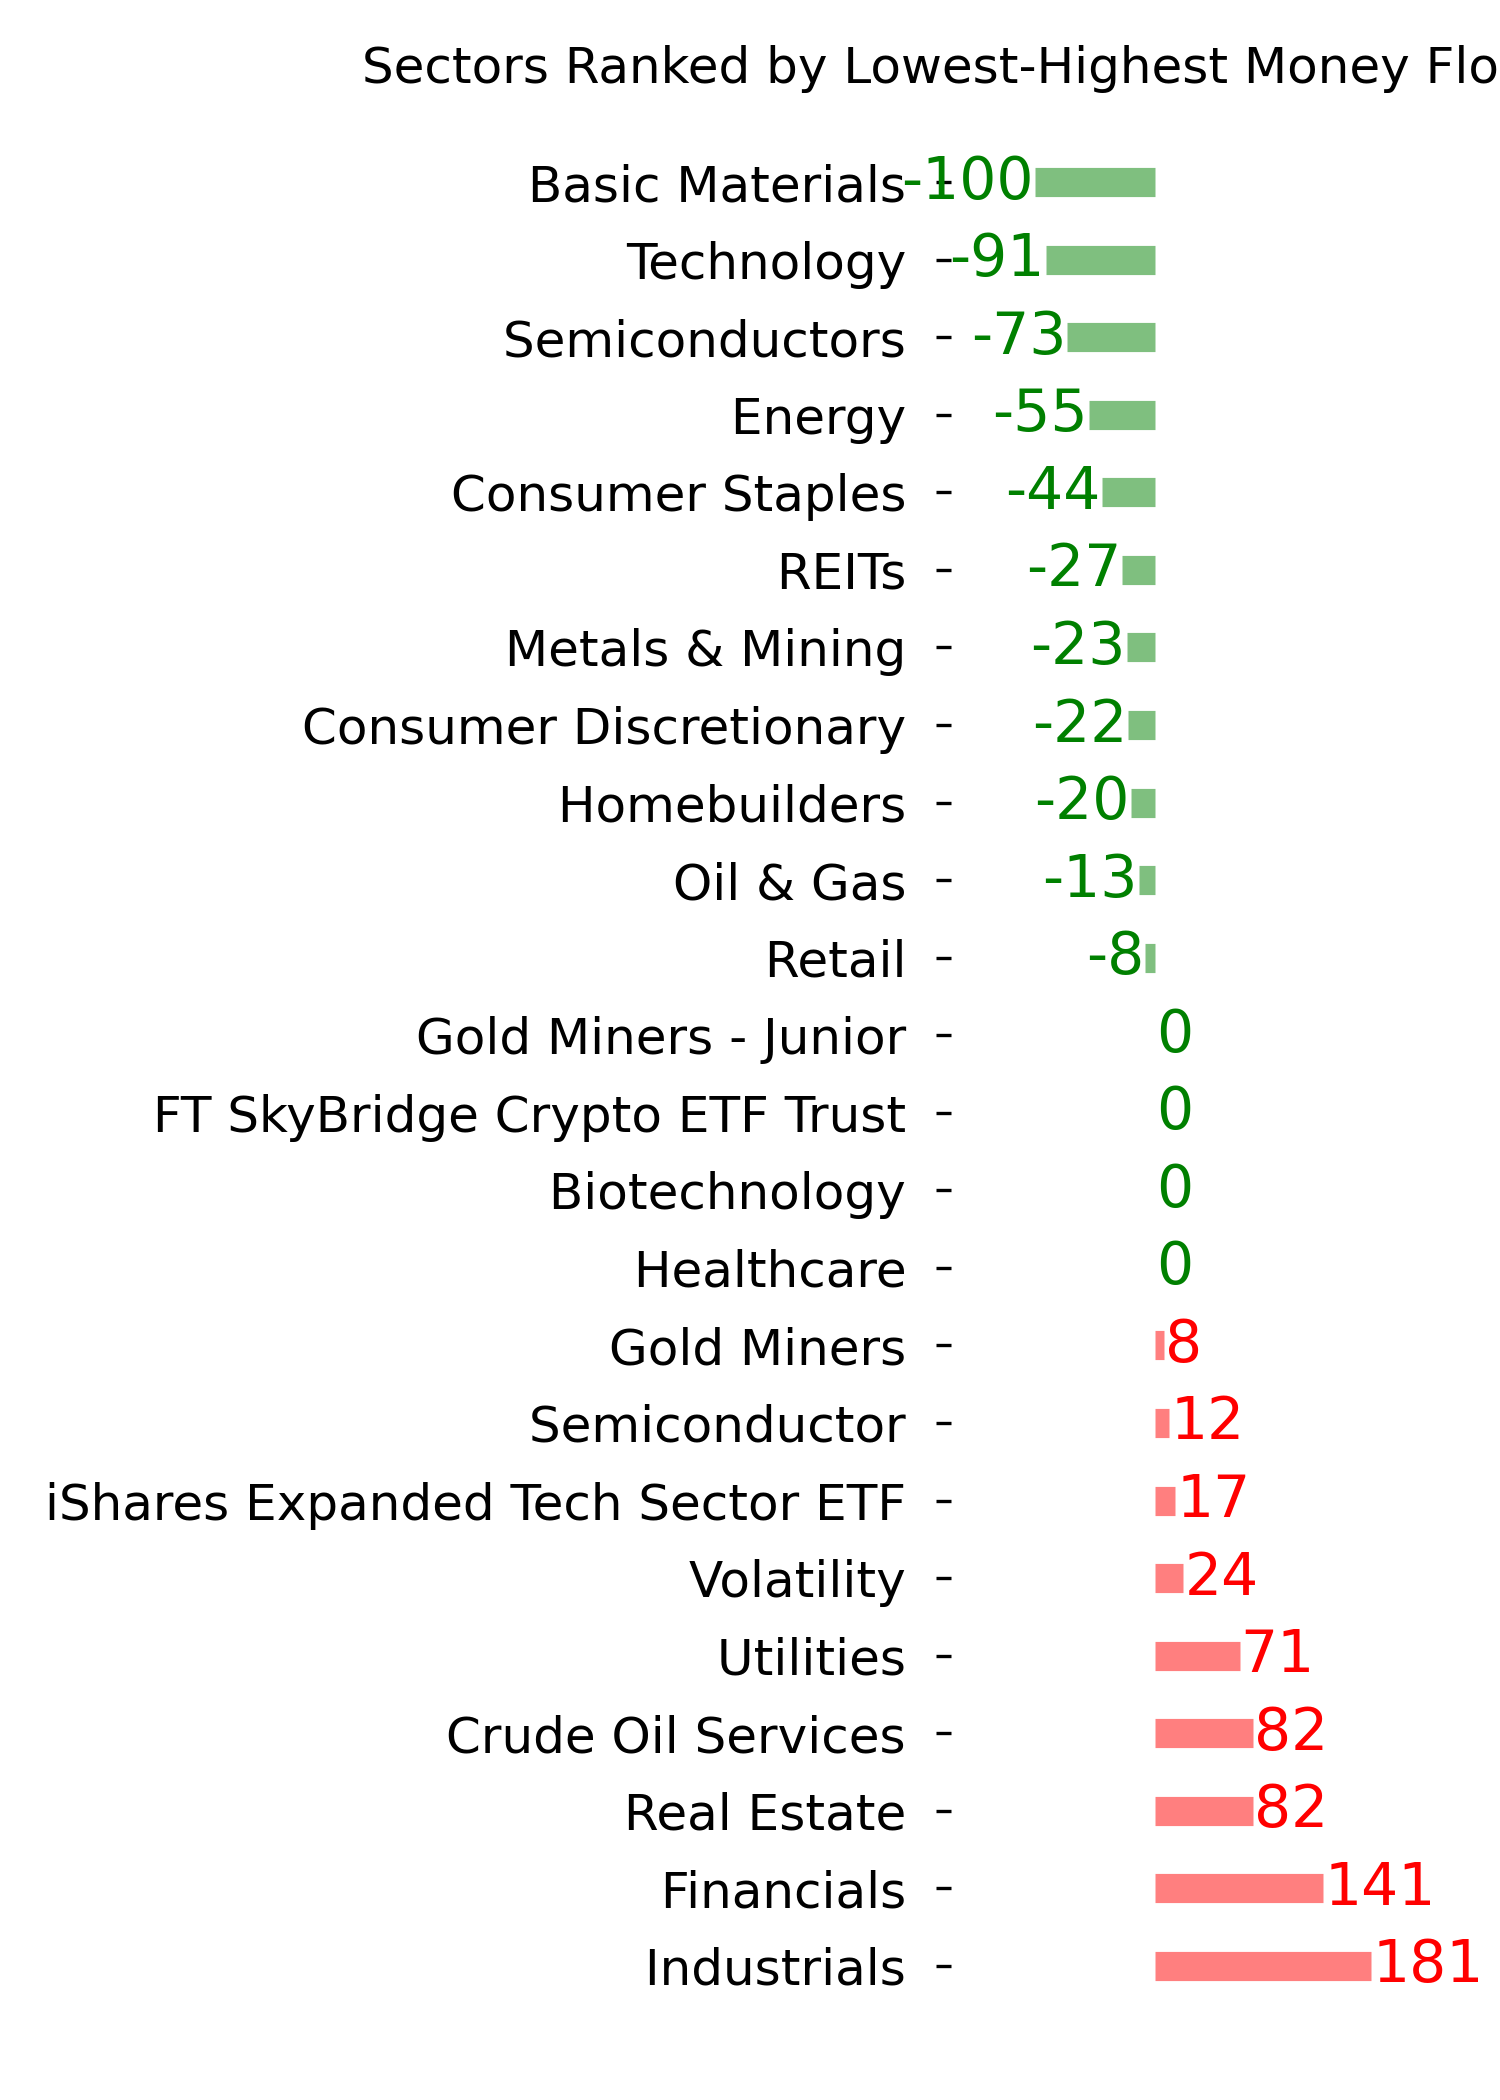
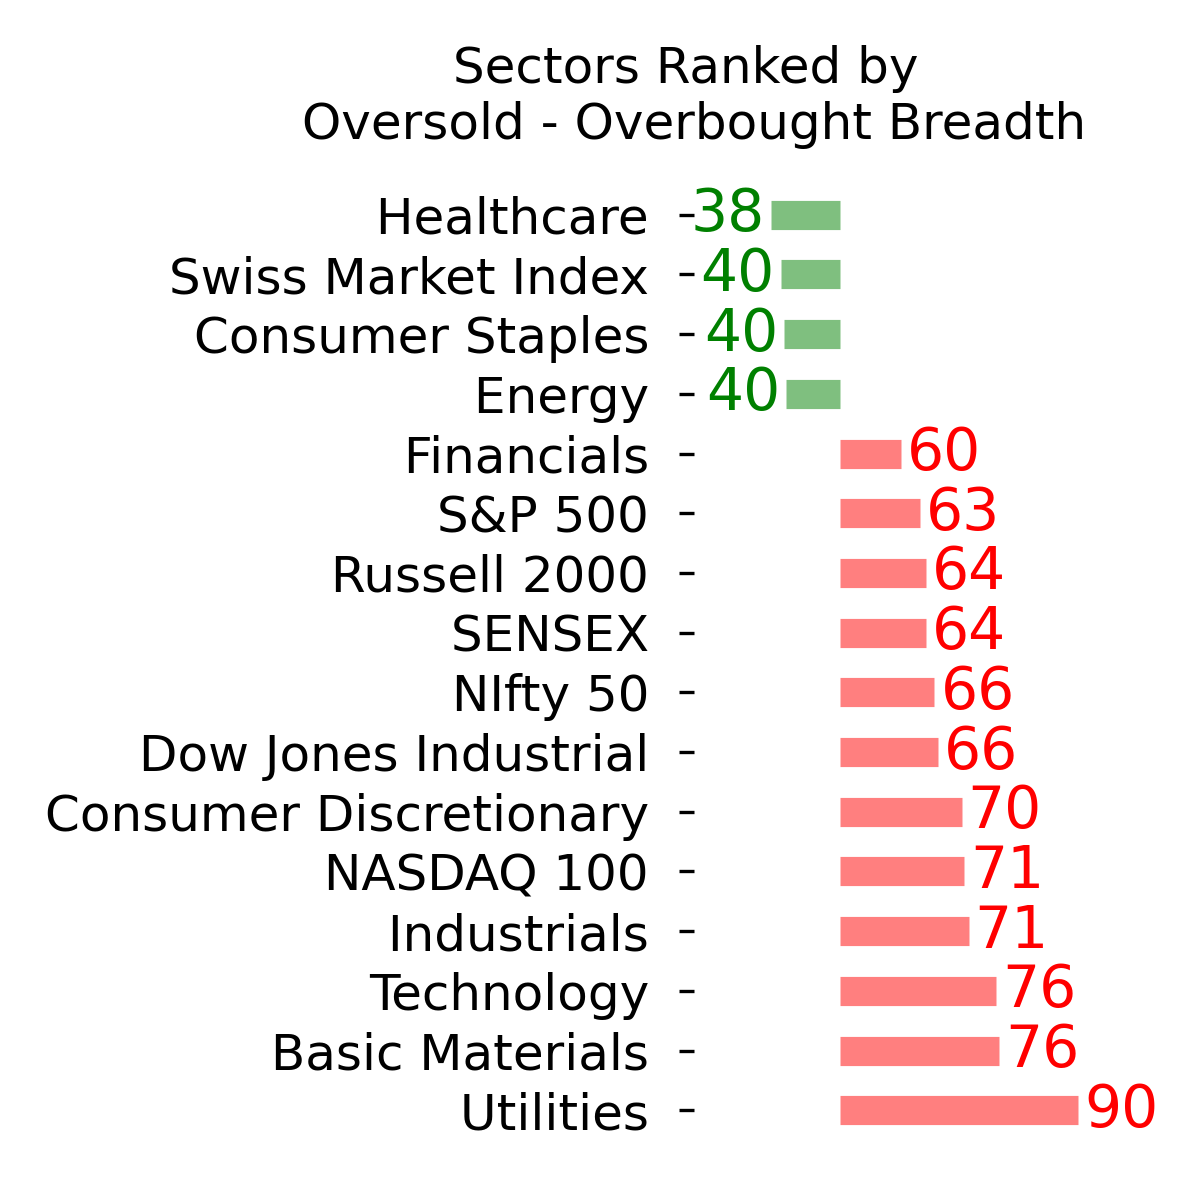
Ranks
|
|
|
|
|
|
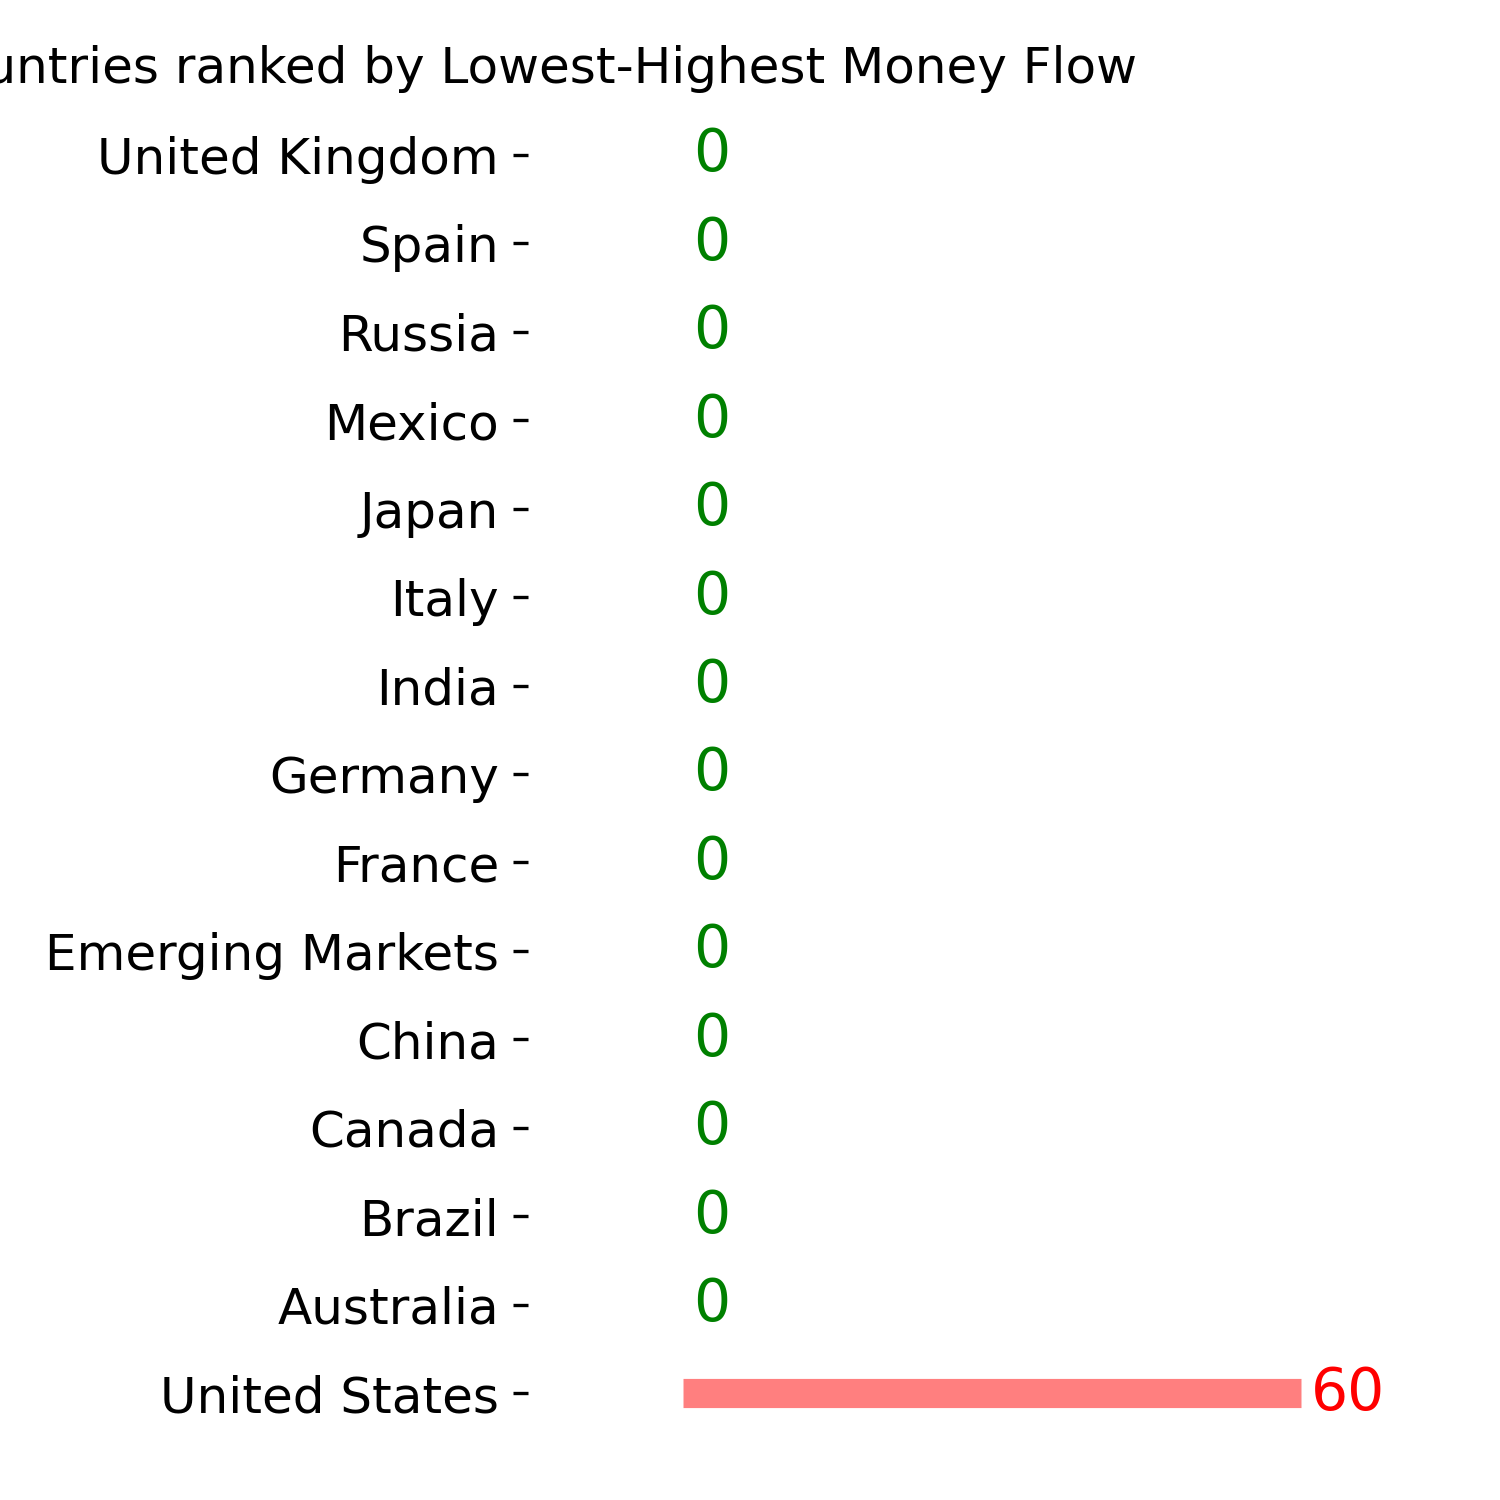
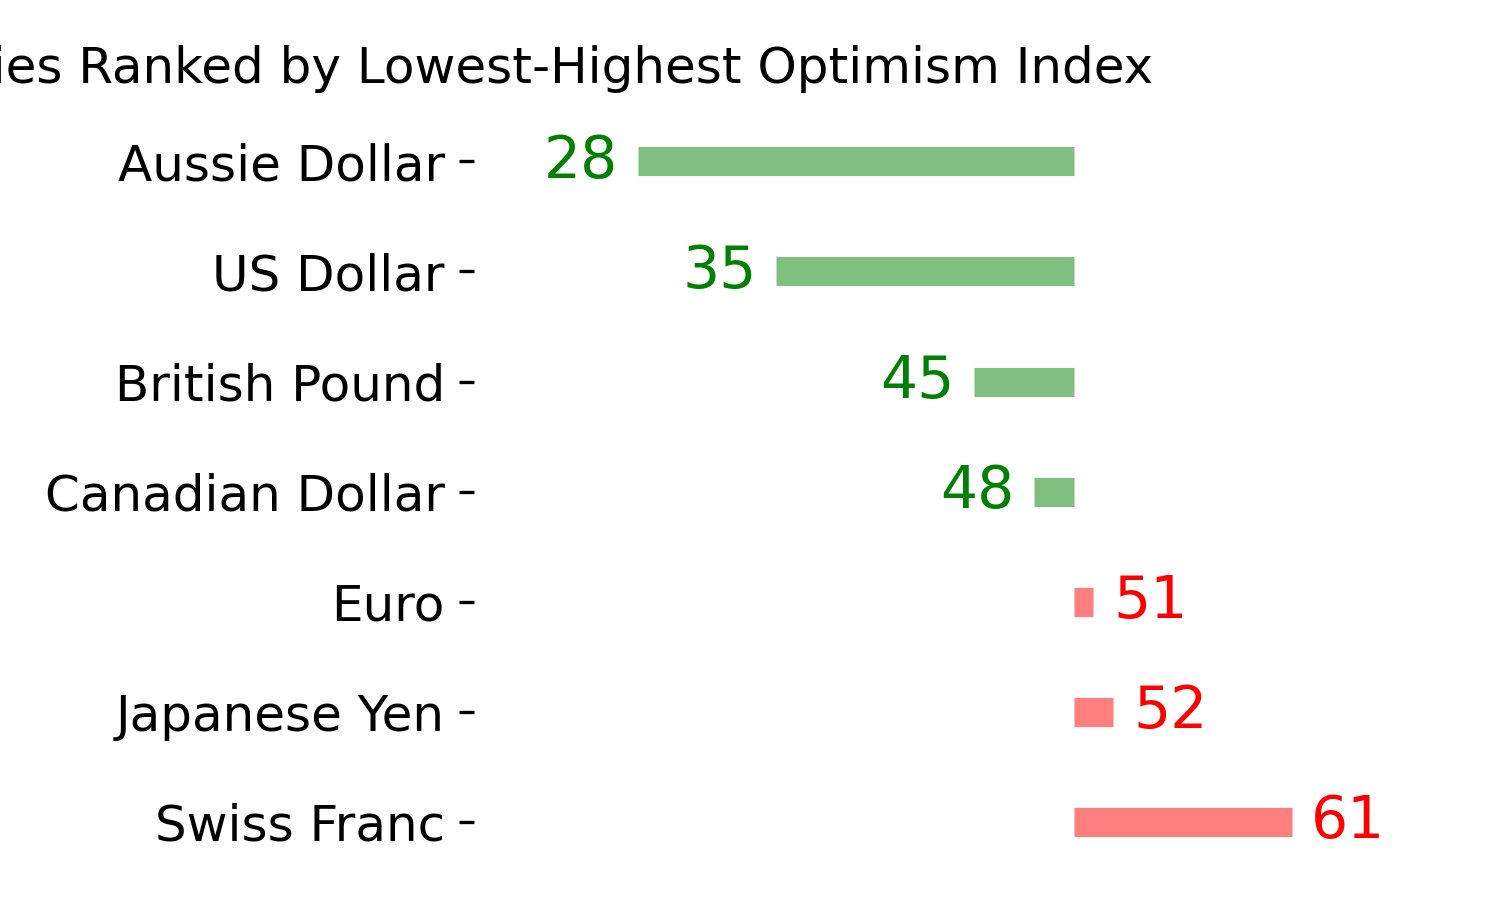
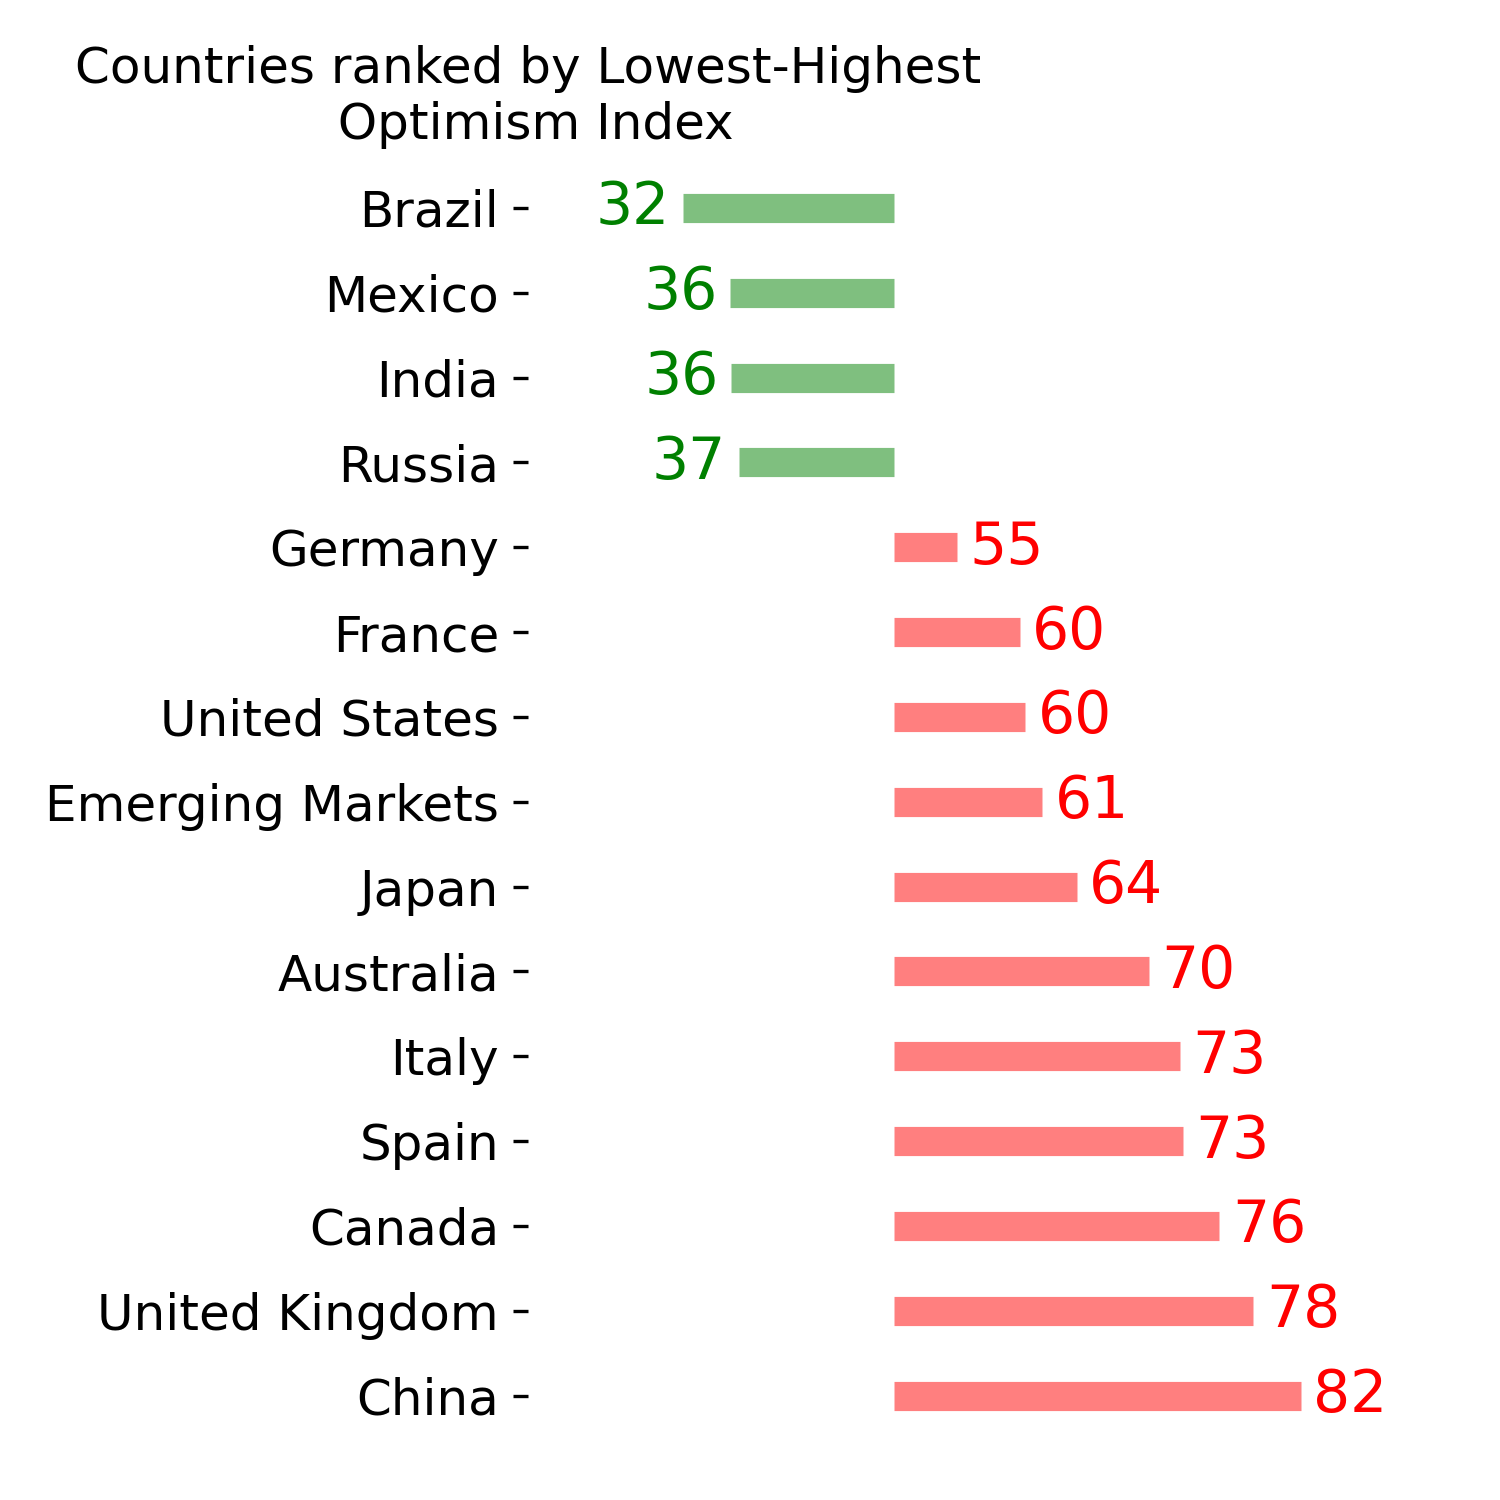
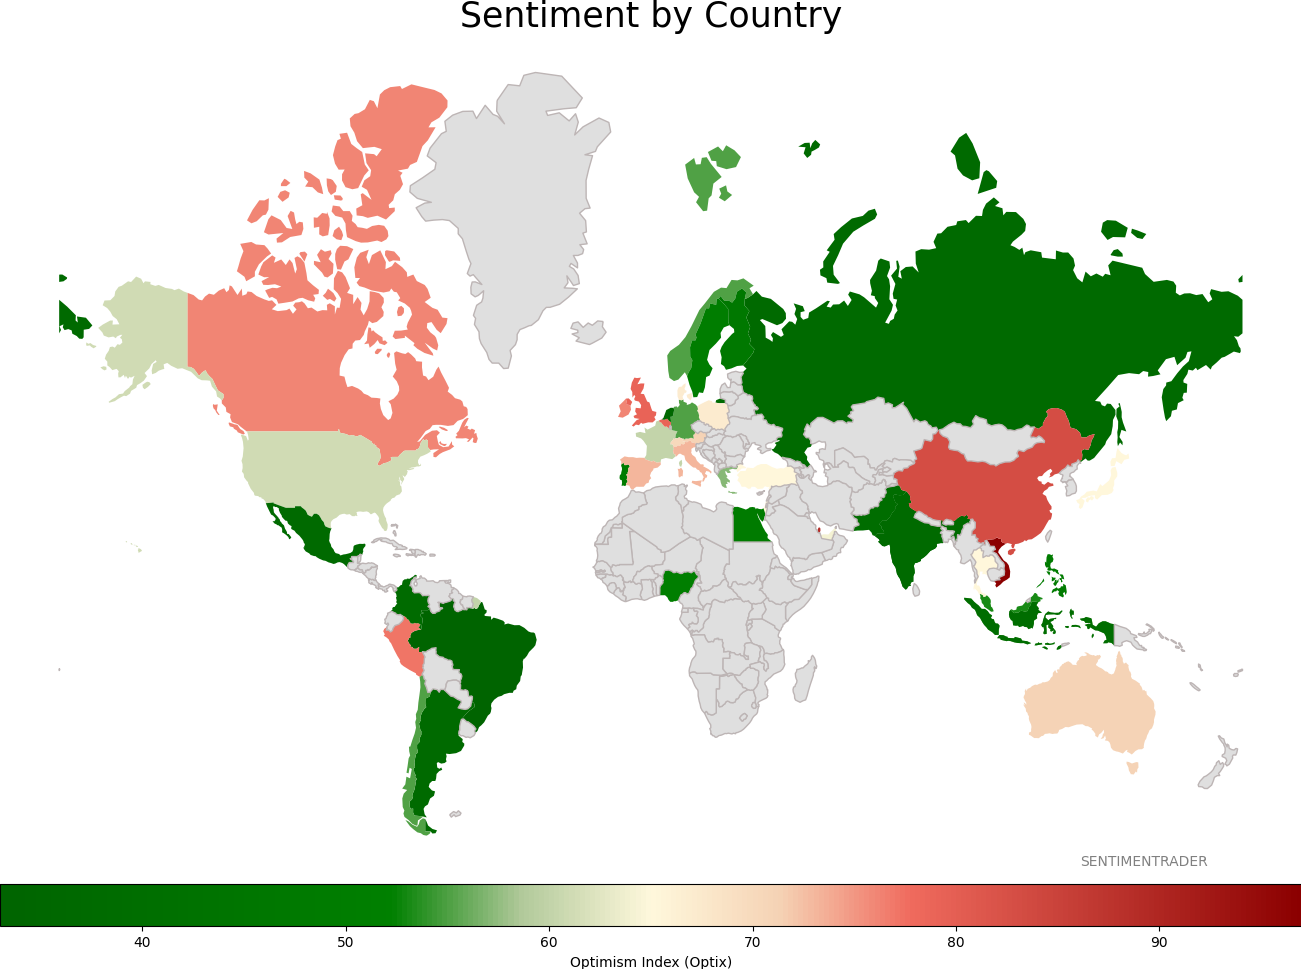
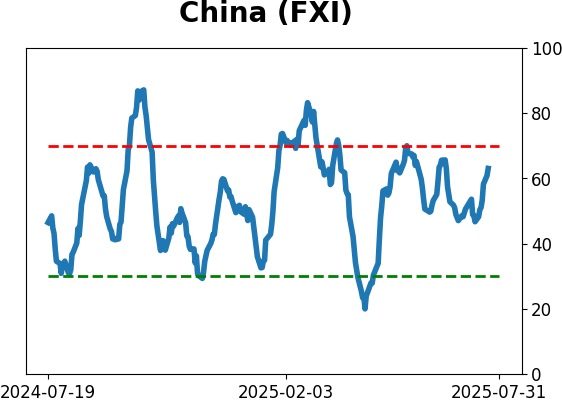
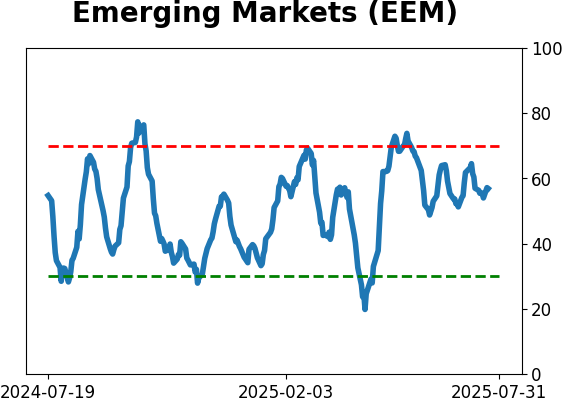
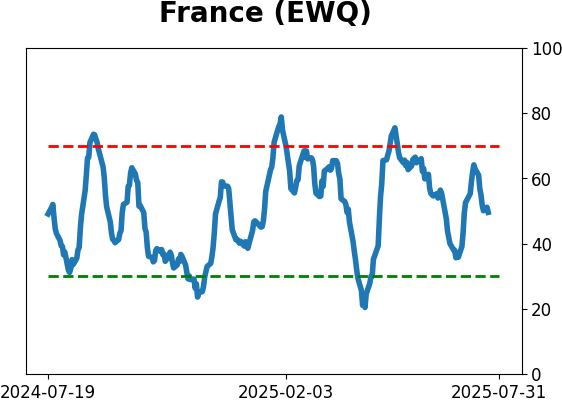
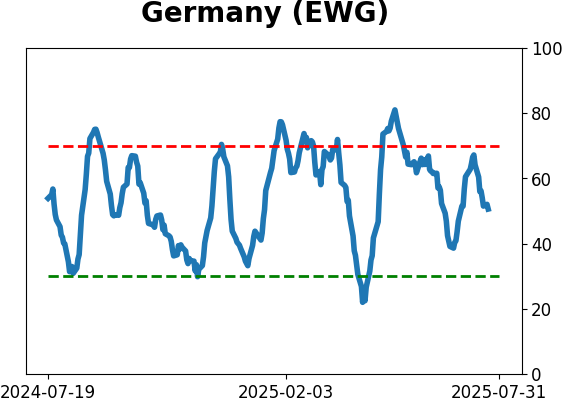
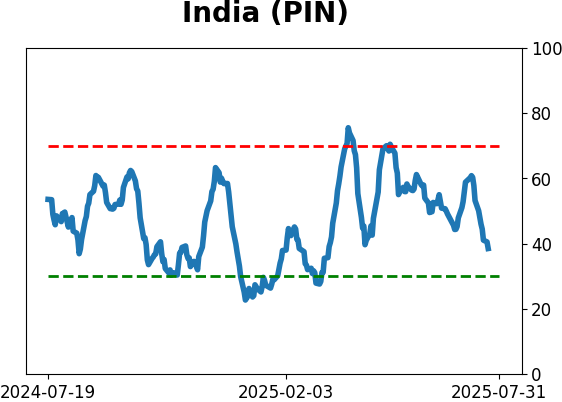
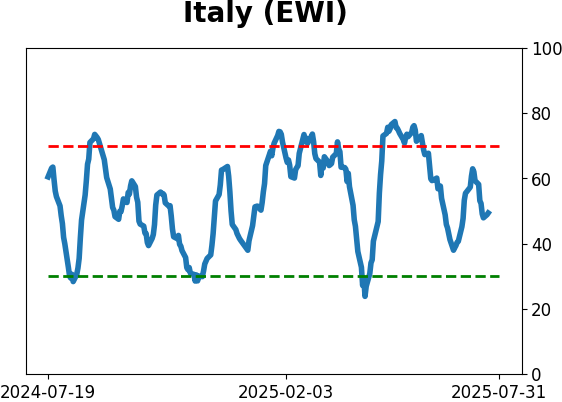
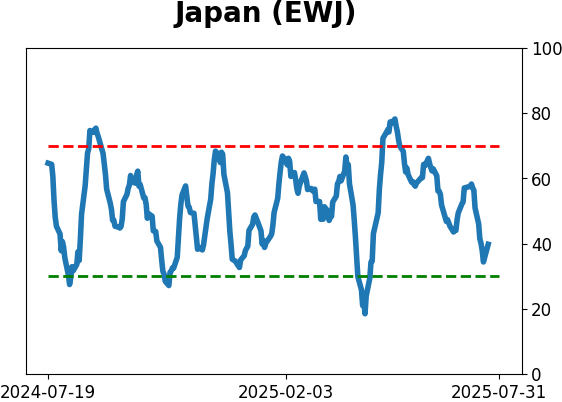
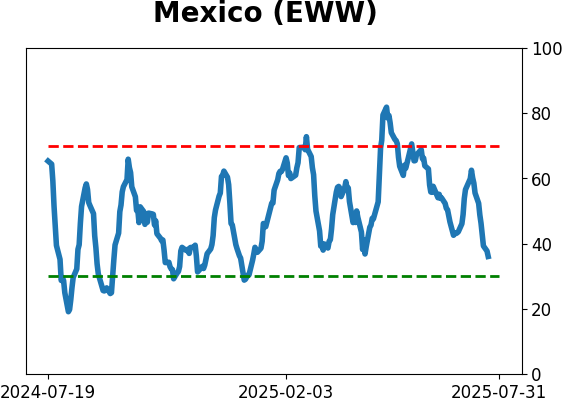
Sentiment Around The World
|
|
|
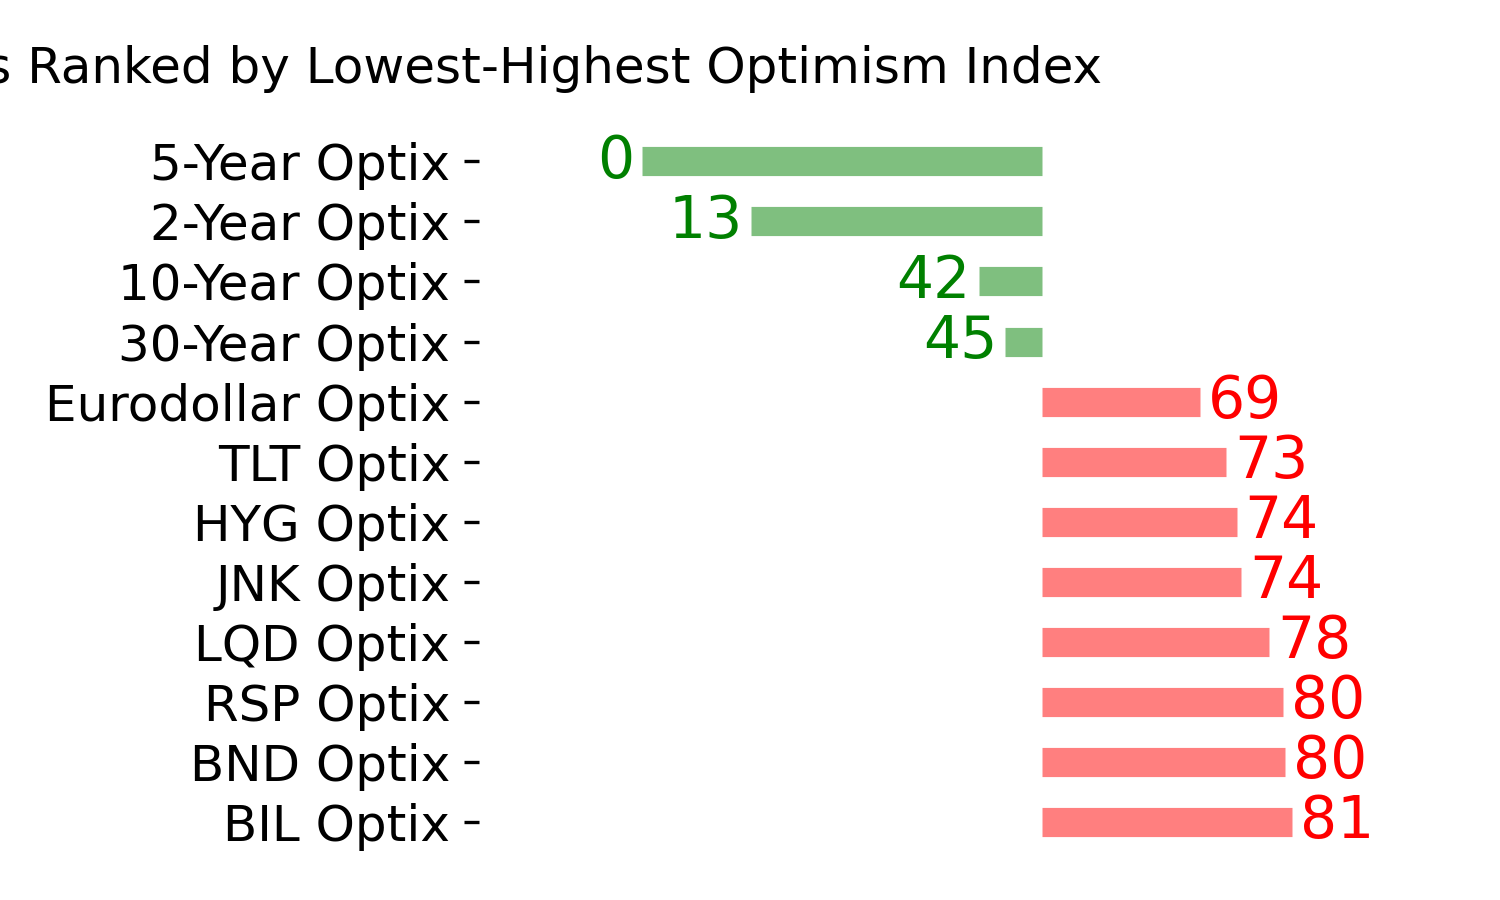
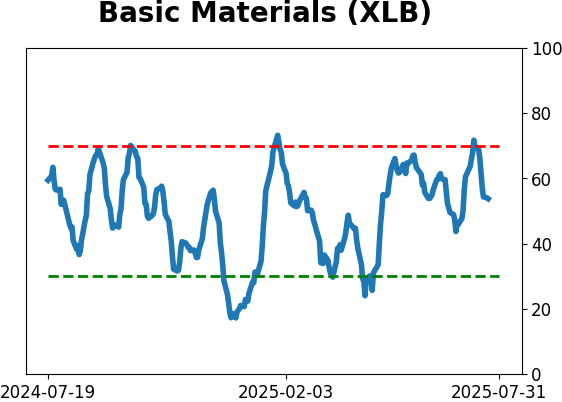
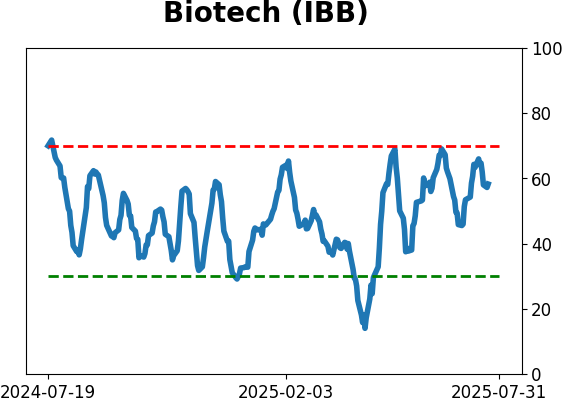
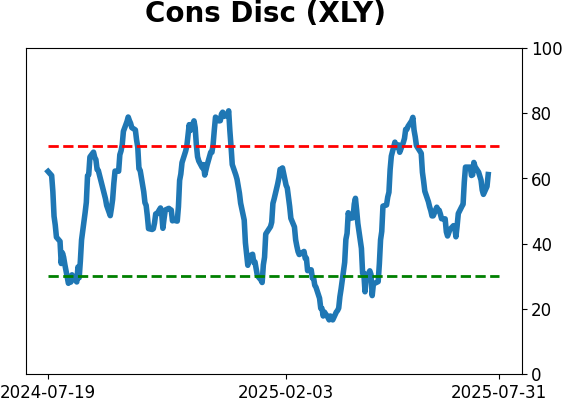
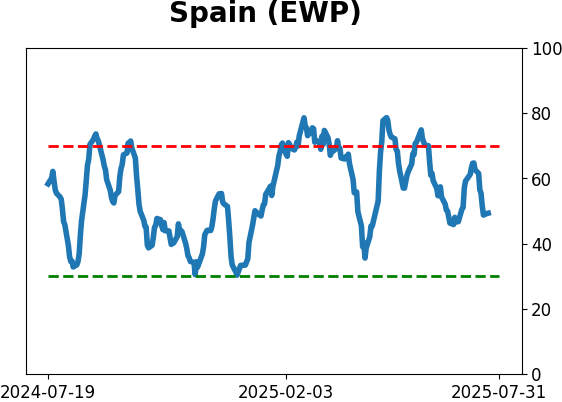
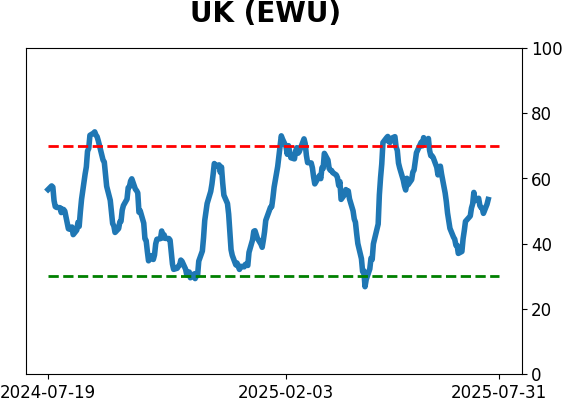
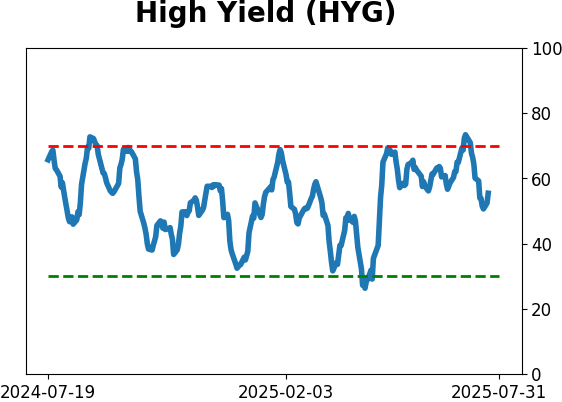
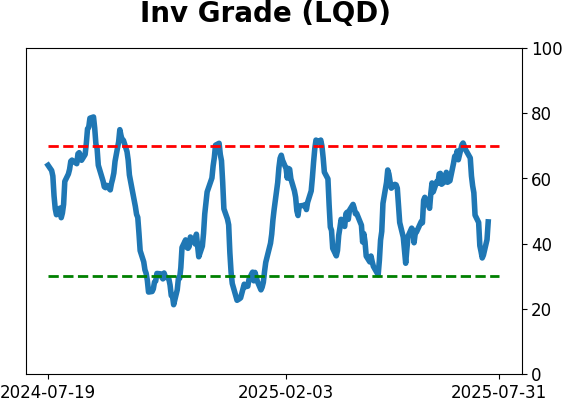
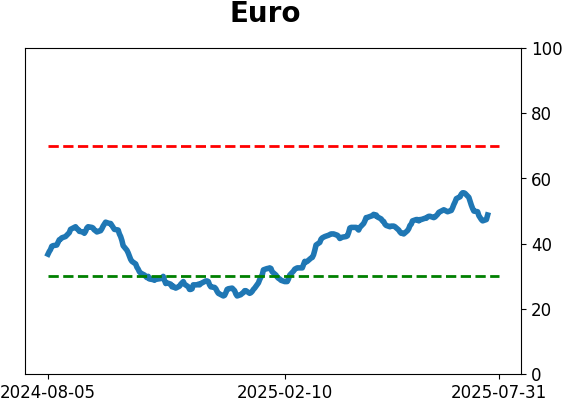
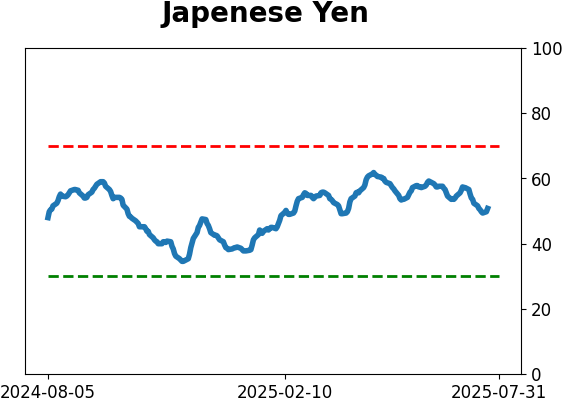
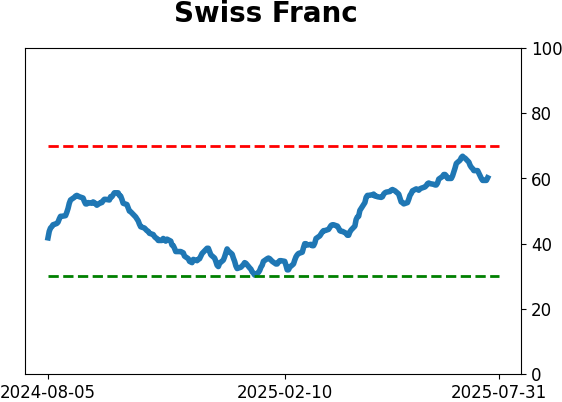
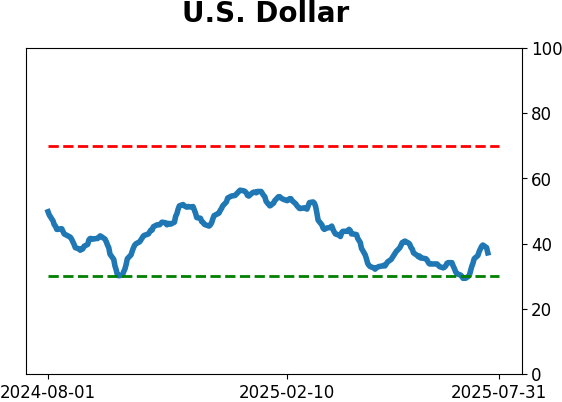
Optimism Index Thumbnails
|
|
|
|
|
|
|
|
|

|
|
|
|
|
|
|
|
|
|

|
|