Headlines
|
|
A reminder of two-way markets:
Investors got a bit of a wake-up call last week as volatility finally entered the chat. The S&P 500 suffered its worst decline in months, and the Nasdaq Composite the worst in over a year. But big one-day declines coming off a record high have rarely morphed into more serious and prolonged losses, especially in the S&P.
|
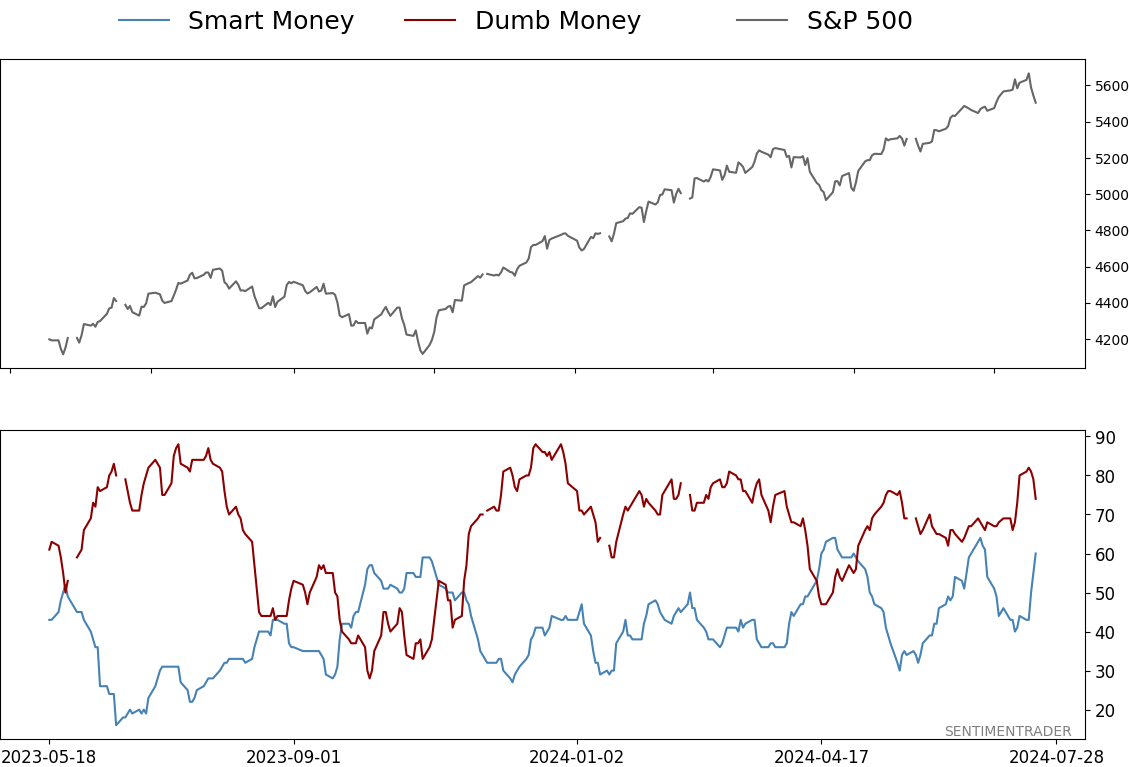
Smart / Dumb Money Confidence
|
Smart Money Confidence: 60%
Dumb Money Confidence: 74%
|
|
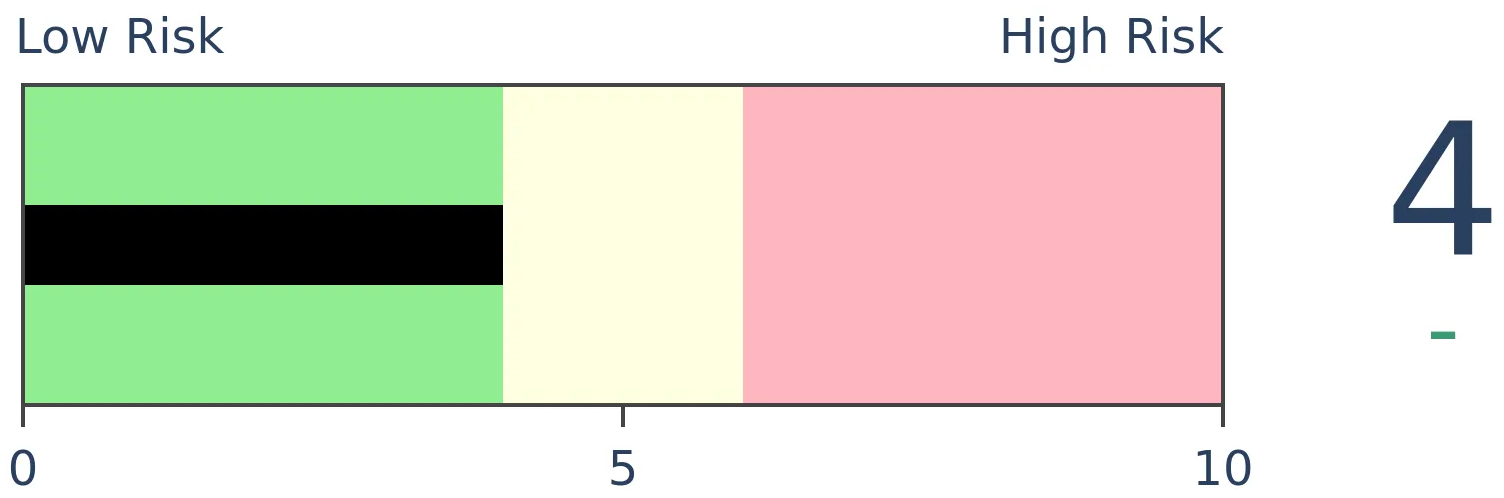
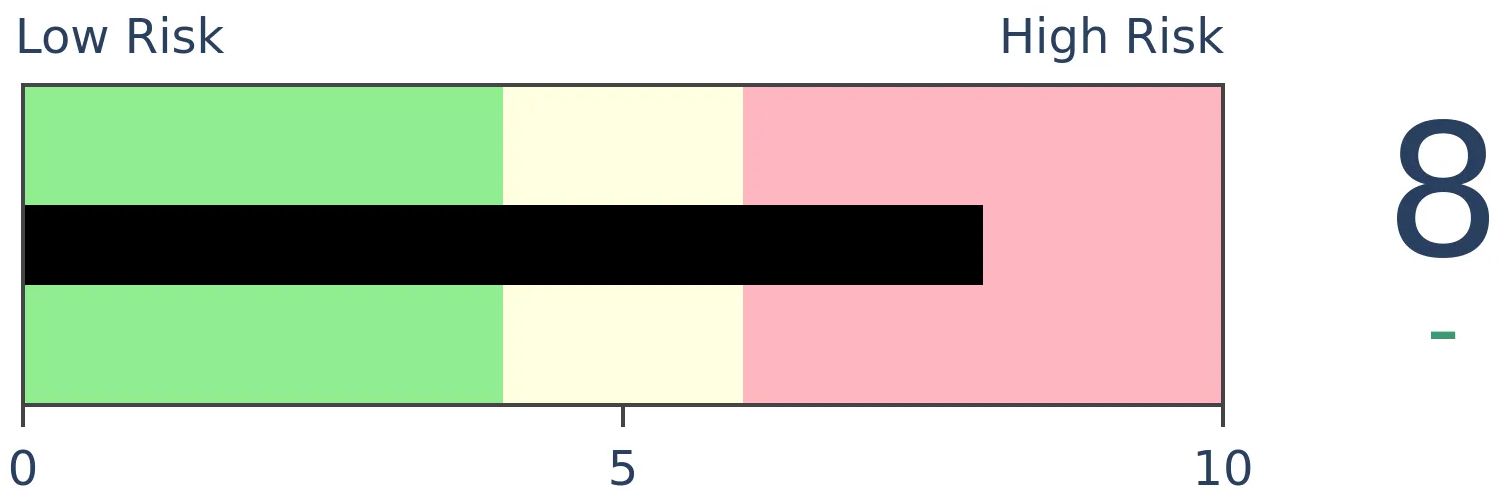
Risk Levels
Stocks Short-Term
|
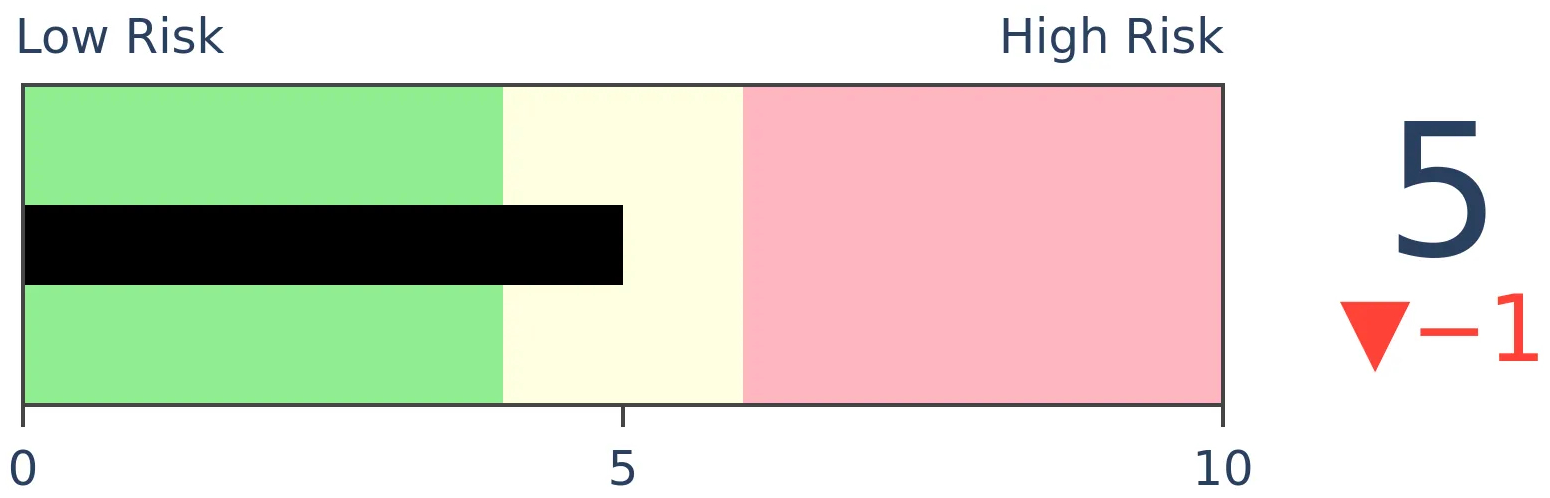
Stocks Medium-Term
|
|
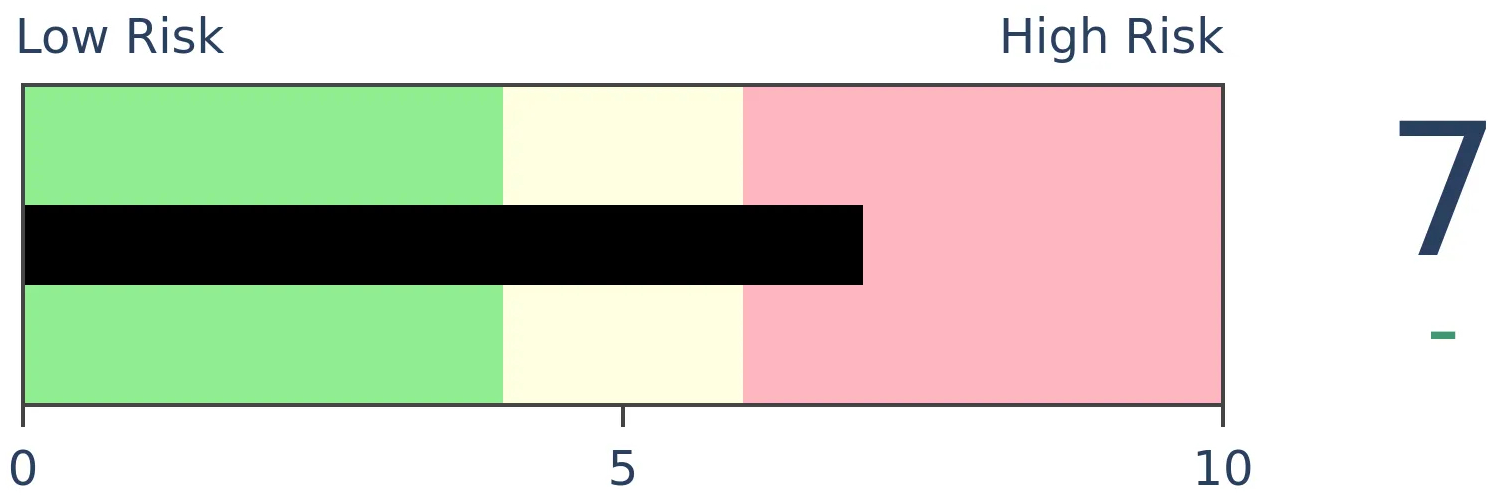
Bonds

|
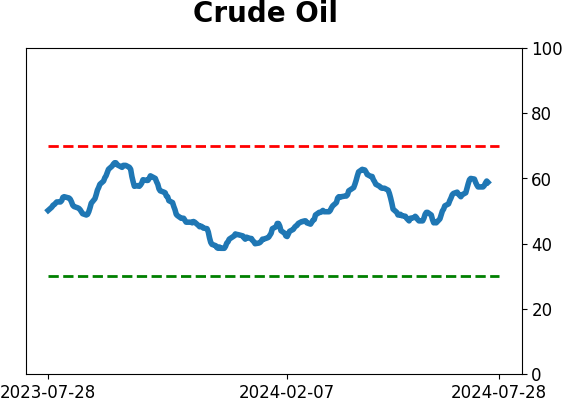
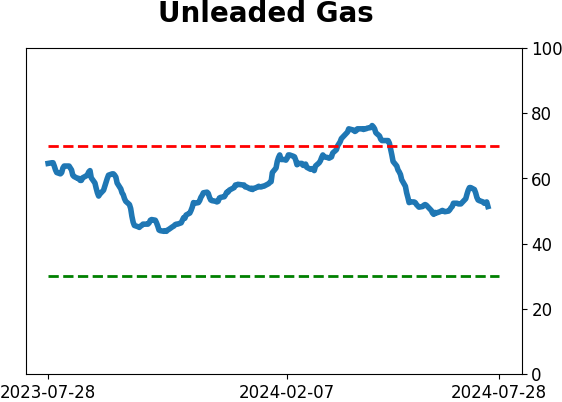
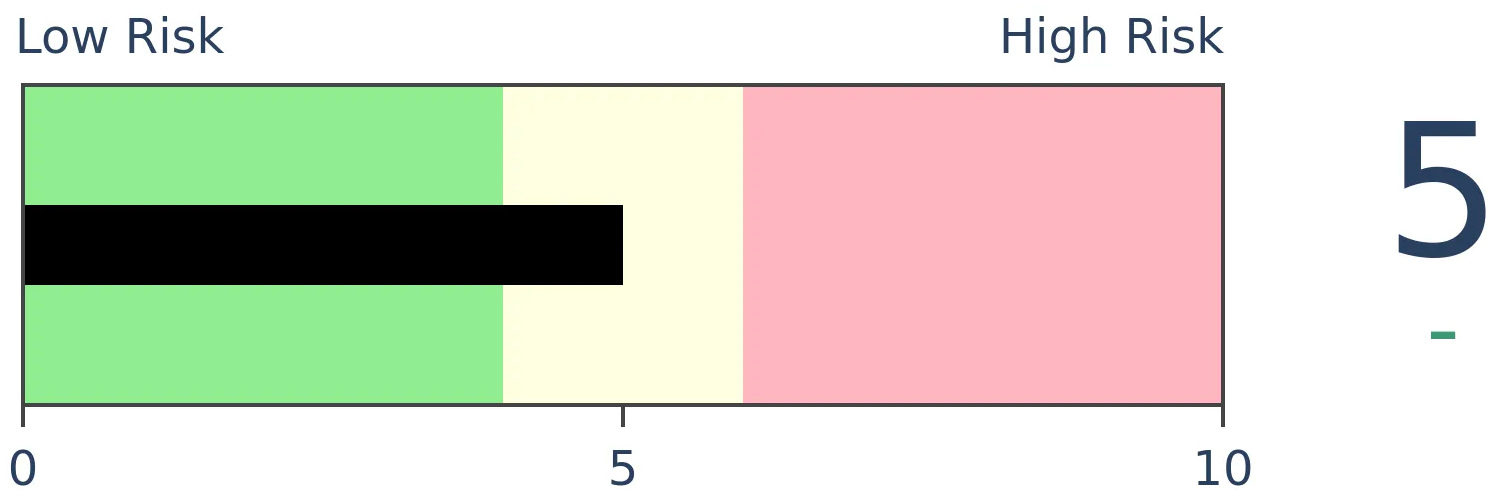
Crude Oil
|
|
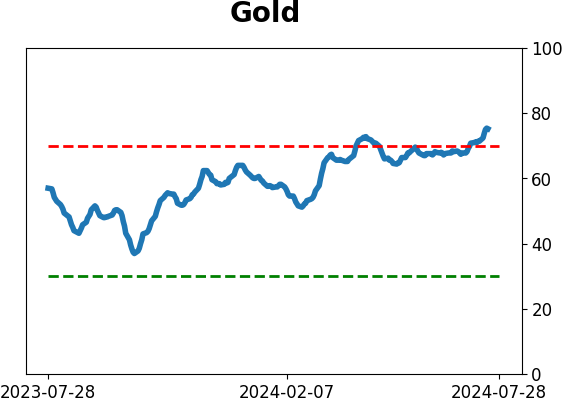
Gold
|
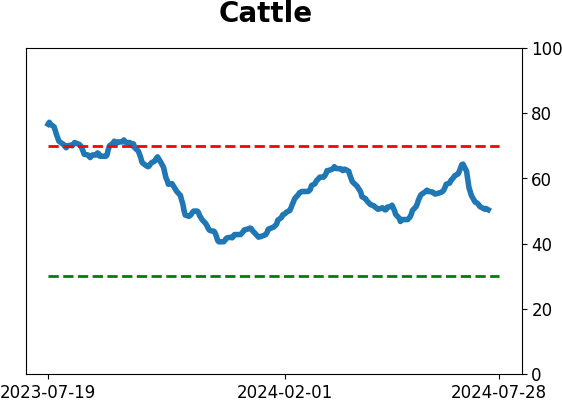
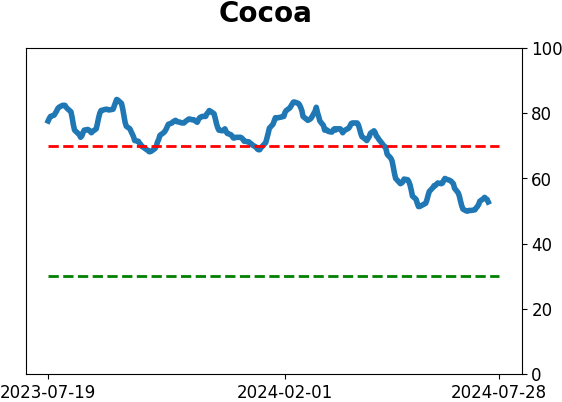
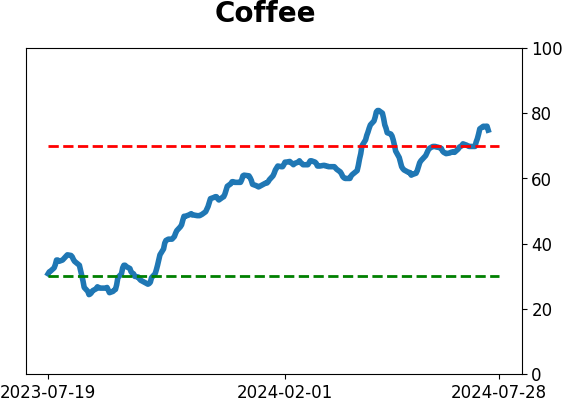
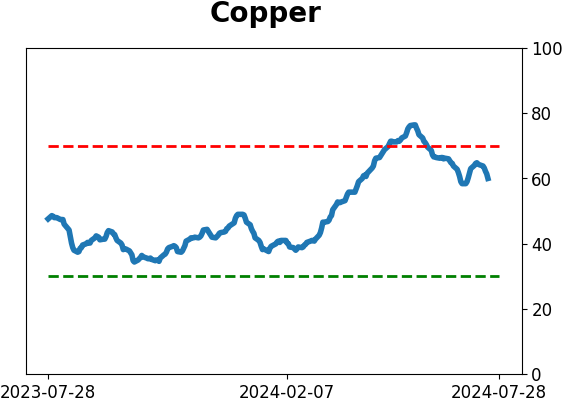
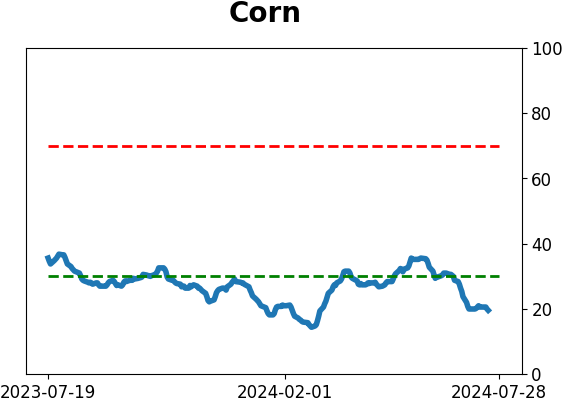
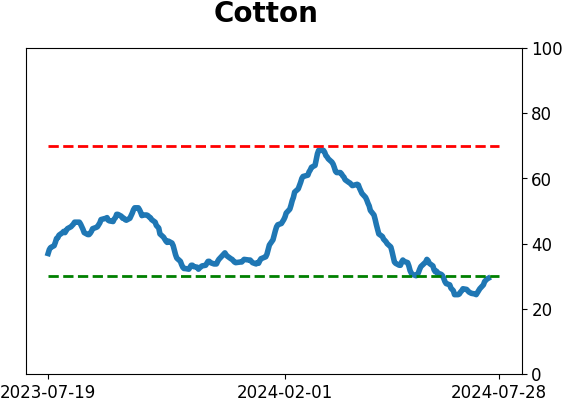
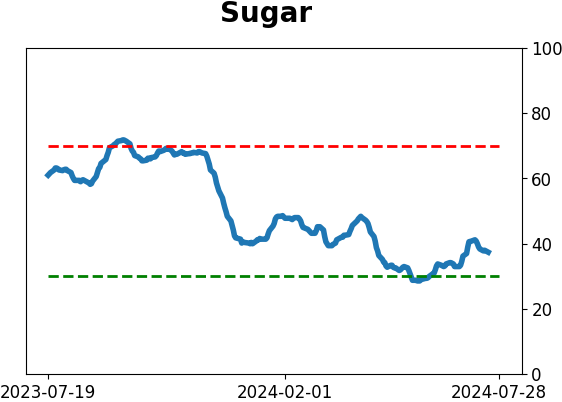
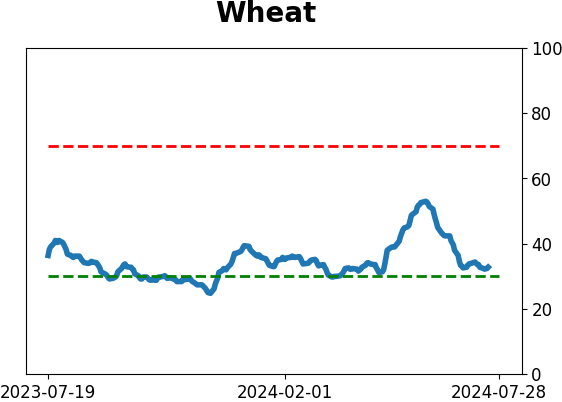
Agriculture
|
|
Research
By Jason Goepfert
BOTTOM LINE
Investors got a bit of a wake-up call last week as volatility finally entered the chat. The S&P 500 suffered its worst decline in months, and the Nasdaq Composite the worst in over a year. But big one-day declines coming off a record high have rarely morphed into more serious and prolonged losses, especially in the S&P.
FORECAST / TIMEFRAME
None
|
Key points:
- The S&P 500 suffered its worst loss in months amid historically high investor optimism
- The Nasdaq Composite fared even worse, with its worst one-day loss in a year while hovering near a record high
- Similar behavior served as wake-up calls to bulls but rarely morphed into severe and prolonged declines
A wake-up call for bulls
Investors had become complacent, then got what happens at some point every time - a slap that reminds them that markets move in both directions.
The S&P 500, the world's most benchmarked index, suffered its worst loss in more than 50 sessions. This type of activity goes by various names on trading desks, many of which shouldn't be printed here.
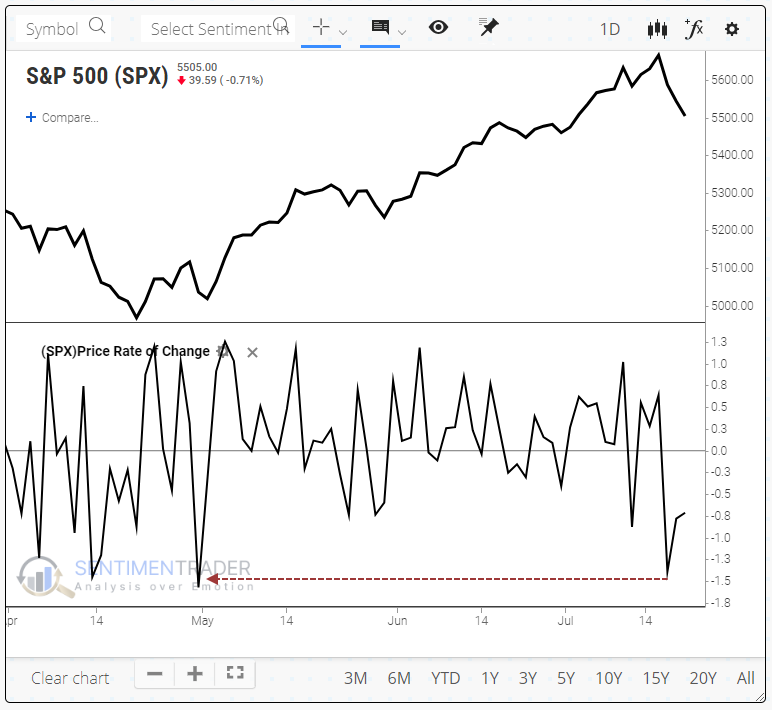
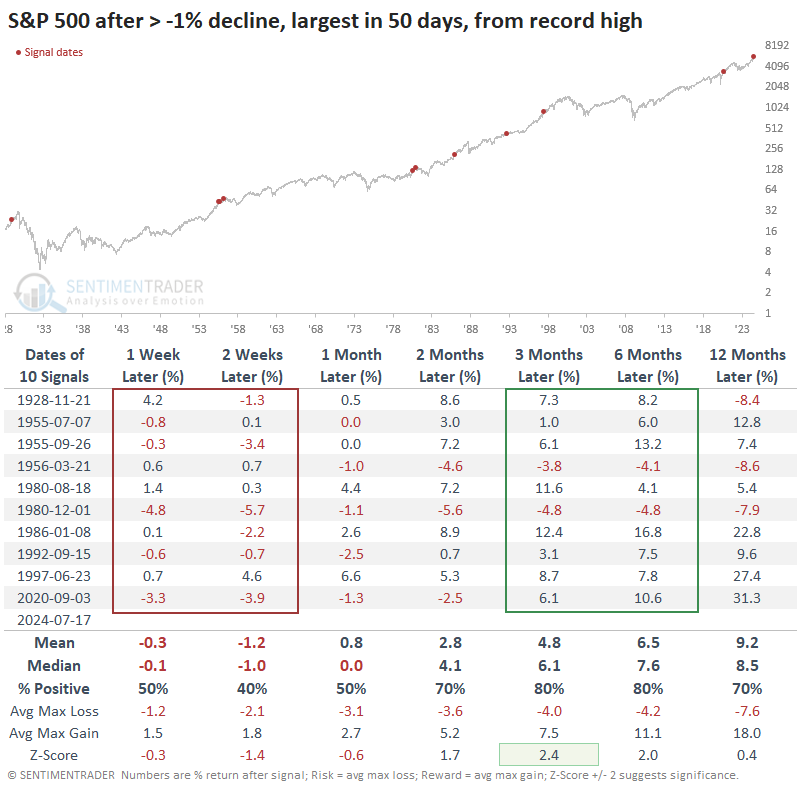
Even though the one-day loss last week was large, the index didn't rebound, and kept adding smaller losses. This isn't all that unusual, as we can see from the table below. It shows us other times the S&P dropped more than -1%, which was the largest in at least 50 days, from what had been a record high level.
The index usually lost ground over the next couple of weeks and then stabilized. By 3-6 months later, it was higher all but twice, both contained.
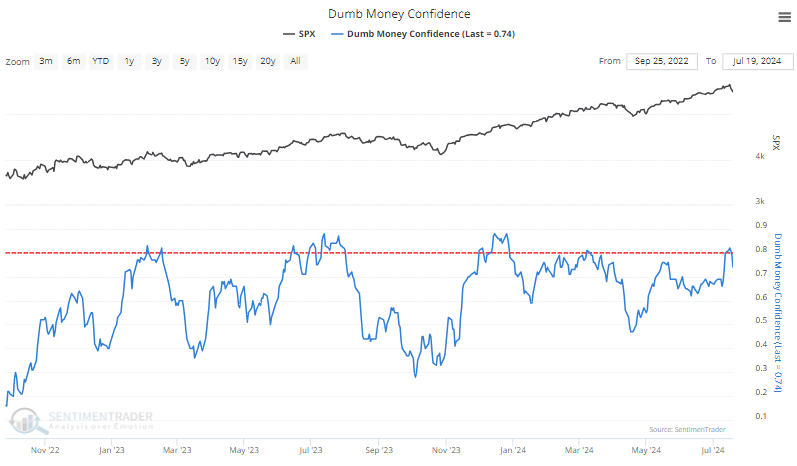
The relatively large decline came during a period of exceptionally high optimism. Even including the day of the 1% loss, Dumb Money Confidence was still above 80%, though it has dipped slightly over the last couple of sessions.
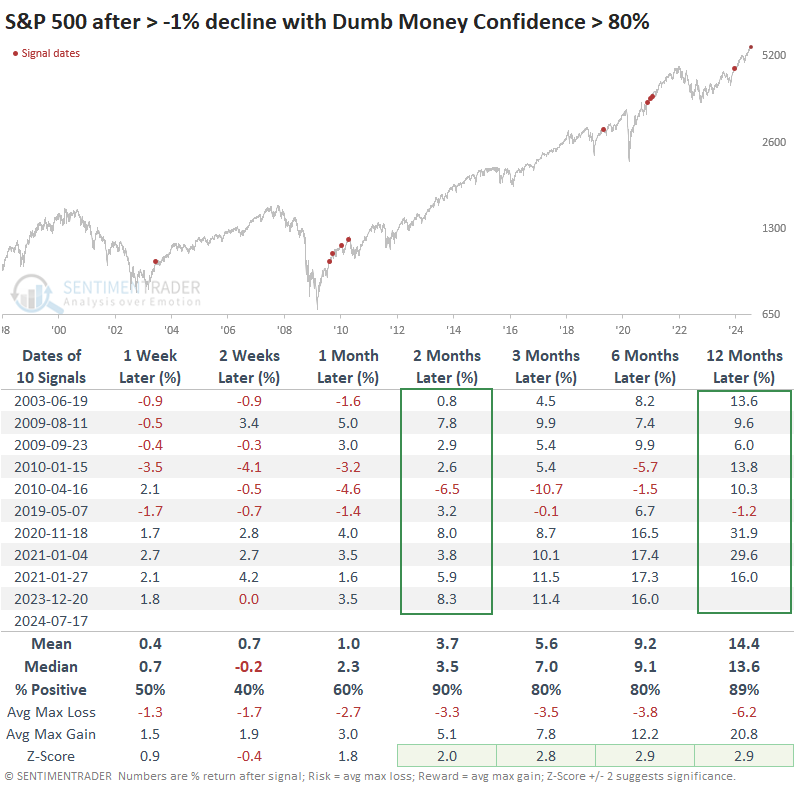
When the S&P had a large daily decline during periods of exceptionally high optimism, it tended to lose more ground over the next two weeks. It wasn't very consistent, though - the index turned around four times almost immediately and tacked on further gains. As we noted several times over the past year and a half, exceptionally high optimism really only occurs during sustained bull markets, and that does not go away easily.
Two months after these big drops, the S&P was higher every time but once. That was around the peak of the 2011 summer tantrum.
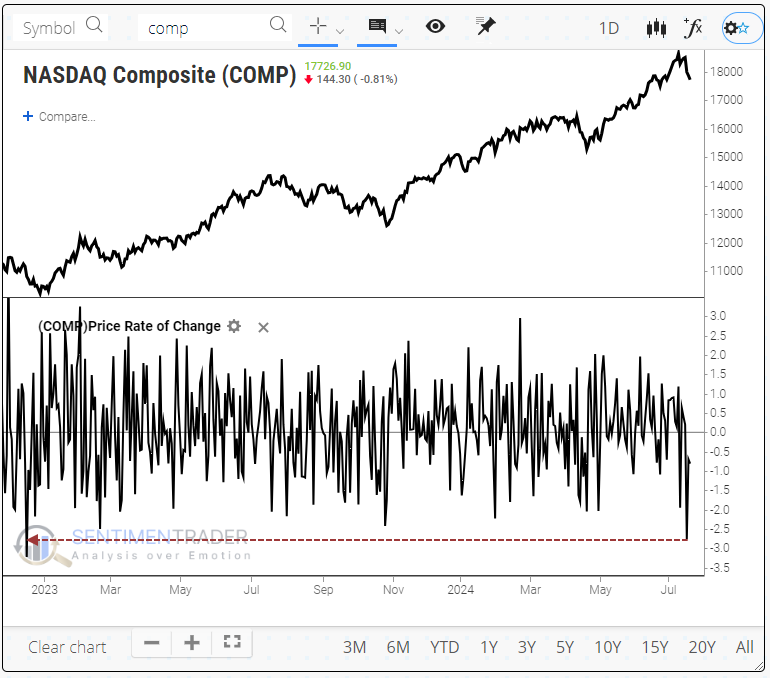
The Nasdaq bore the brunt
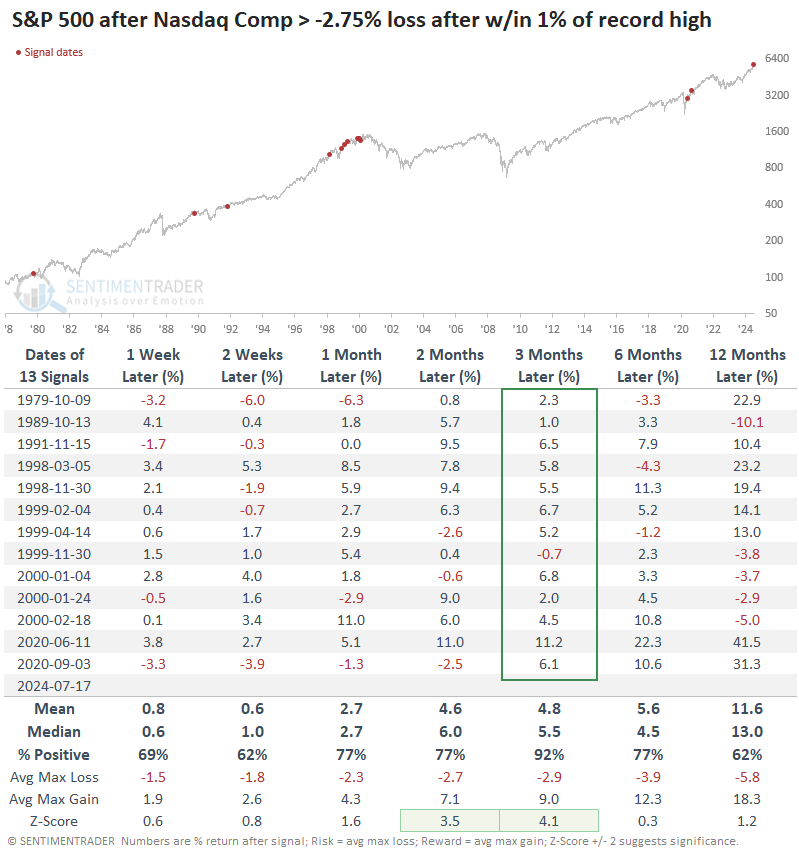
Much of last week's wreckage was focused on some of the previously big winners, so the one-day drop in the Nasdaq was significantly worse. It was the largest one-day drop in well over a year.
A few times, the Nasdaq Composite suffered its worst loss in at least a year when hovering within a spitting distance of a record high. The last time was over 30 years ago, and there have been only five precedents since the index's inception. Four of those saw the index decline further over the next 2-4 weeks, though only one ended up preceding meaningful and sustained losses.
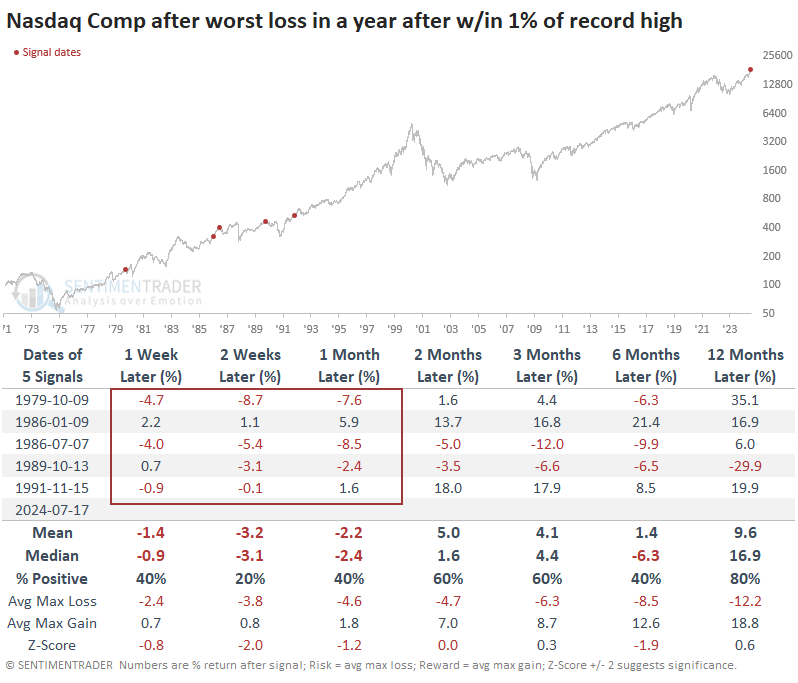
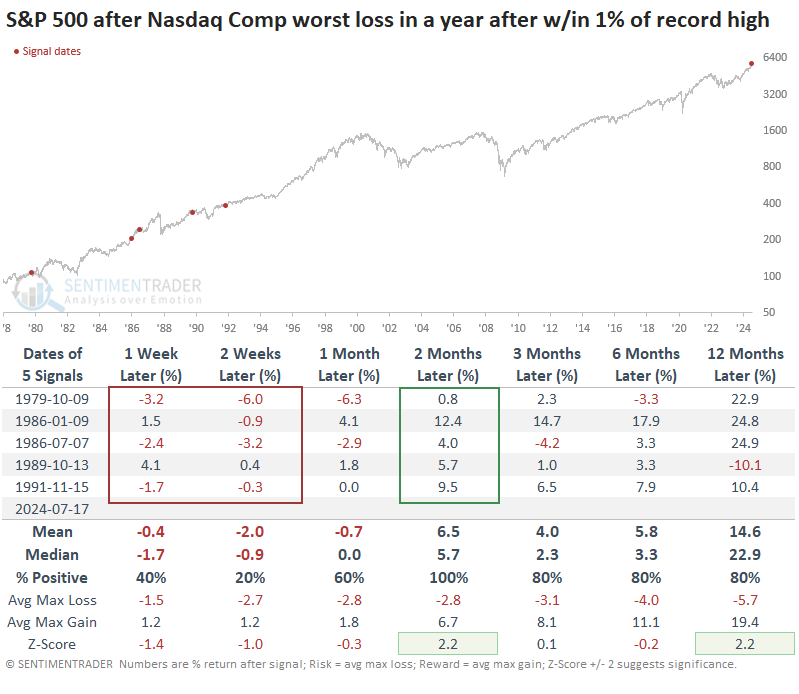
The S&P 500 didn't react too well at first to these losses in the tech-heavy Nasdaq. The S&P also sported losses over the next couple of weeks. However, it also rebounded quickly, with gains every time two months later.
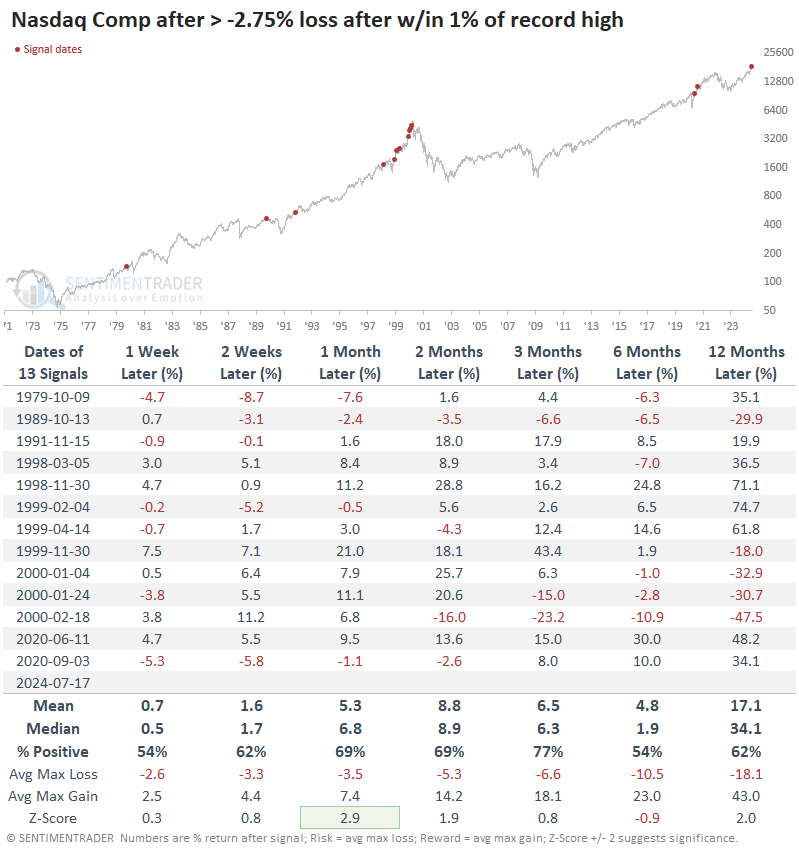
The sample size above is tiny, so if we relax the parameters to look for any loss as large as Wednesday's when the Composite had been within 1% of a record close, then the forward returns improve in the short term. Unfortunately, this also introduces several poor longer-term precedents, as large daily swings are evident at some market peaks.
Again, for the S&P 500, these big Nasdaq declines proved to be good medium-term entry points. The S&P rose over the next three months every time but once, and that "once" was a minuscule loss.
What the research tells us...
This has been an odd market in 2024, especially in the last two months. The average stock was fairing poorly on a historic scale until a week ago, and then it changed in a historic way. The rug got pulled just when things looked like they were becoming more supportive of sustained gains. The only people who think markets are easy are set-it-and-forget investors, liars, and idiots.
The lesson from big single or multiple-day declines from record-high index prices is that while scary, they rarely morph into something more serious and sustained. Most often, there is a new record close within weeks or a few months, especially in the broader indexes like the S&P 500. The short term is more of a toss-up, with a modest negative bias.
Indicators at Extremes
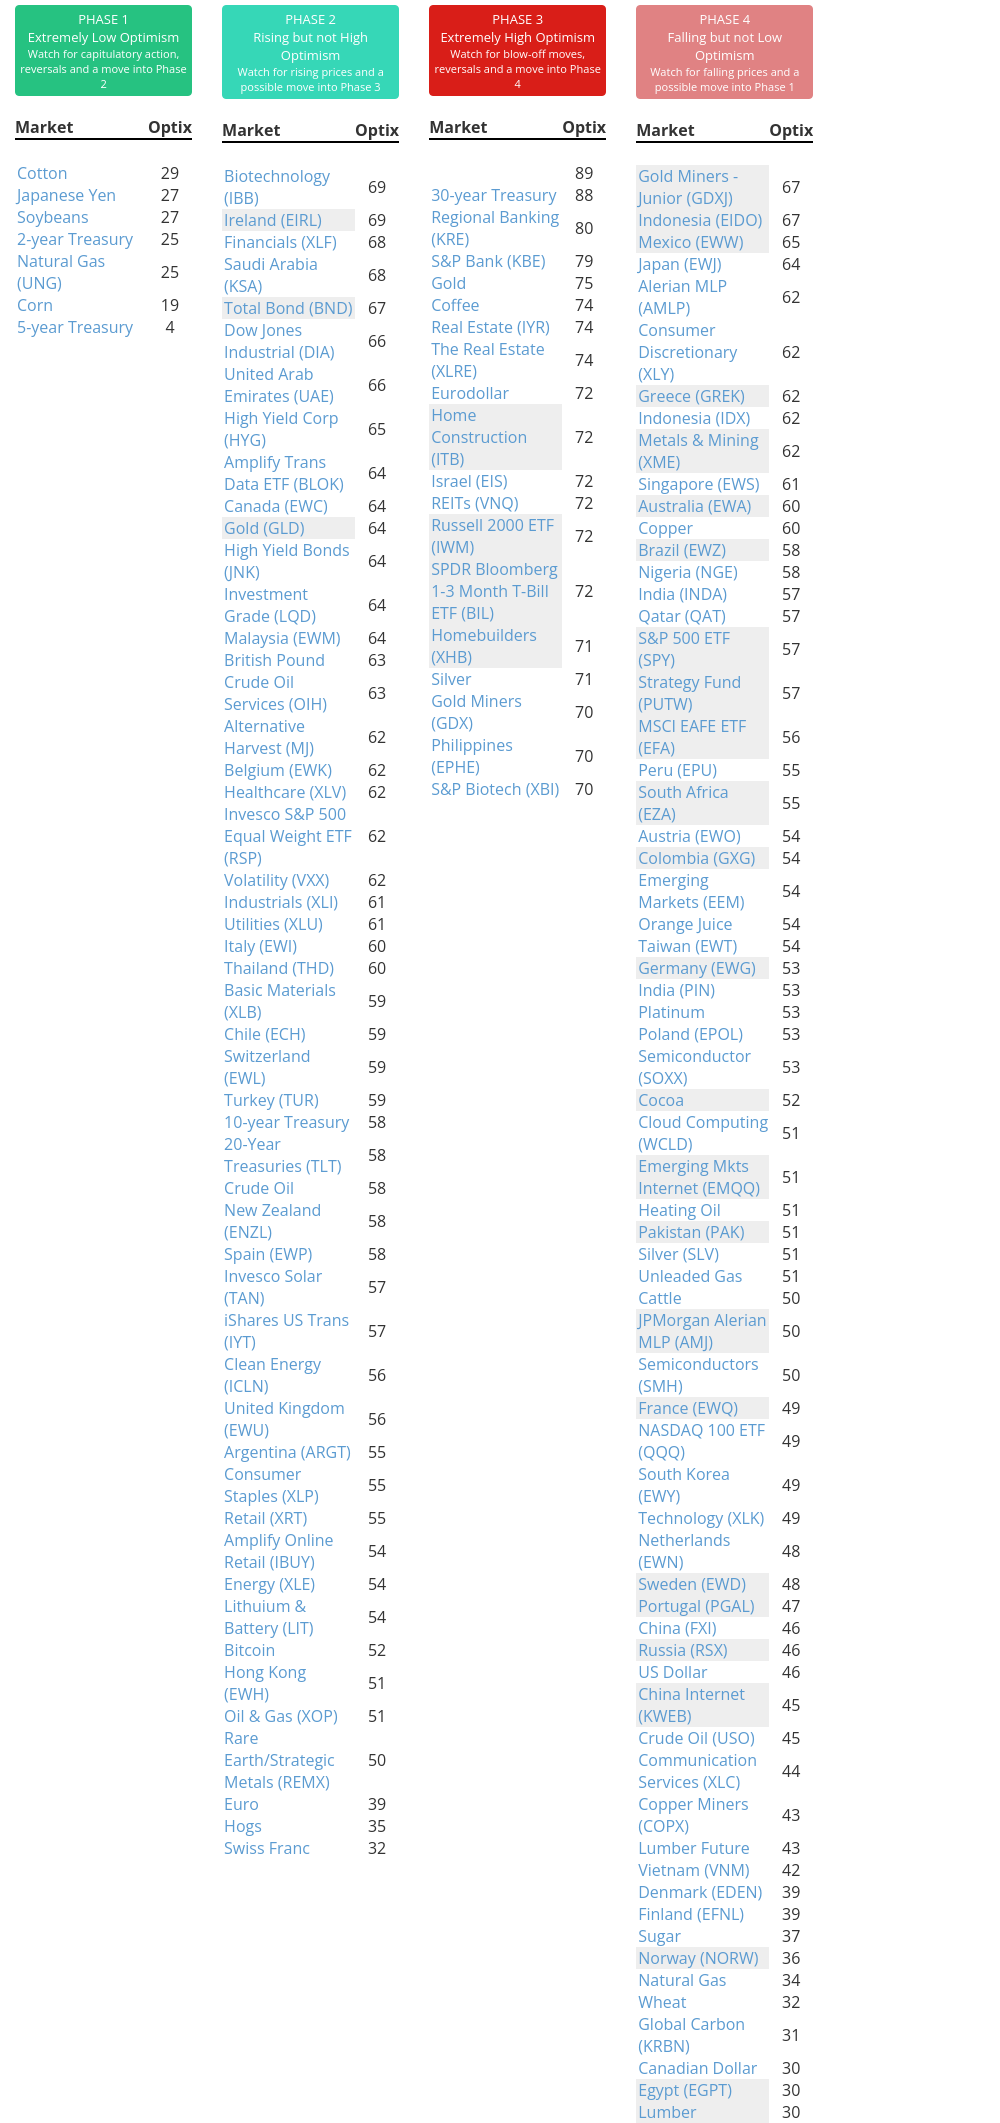
Phase Table
Ranks
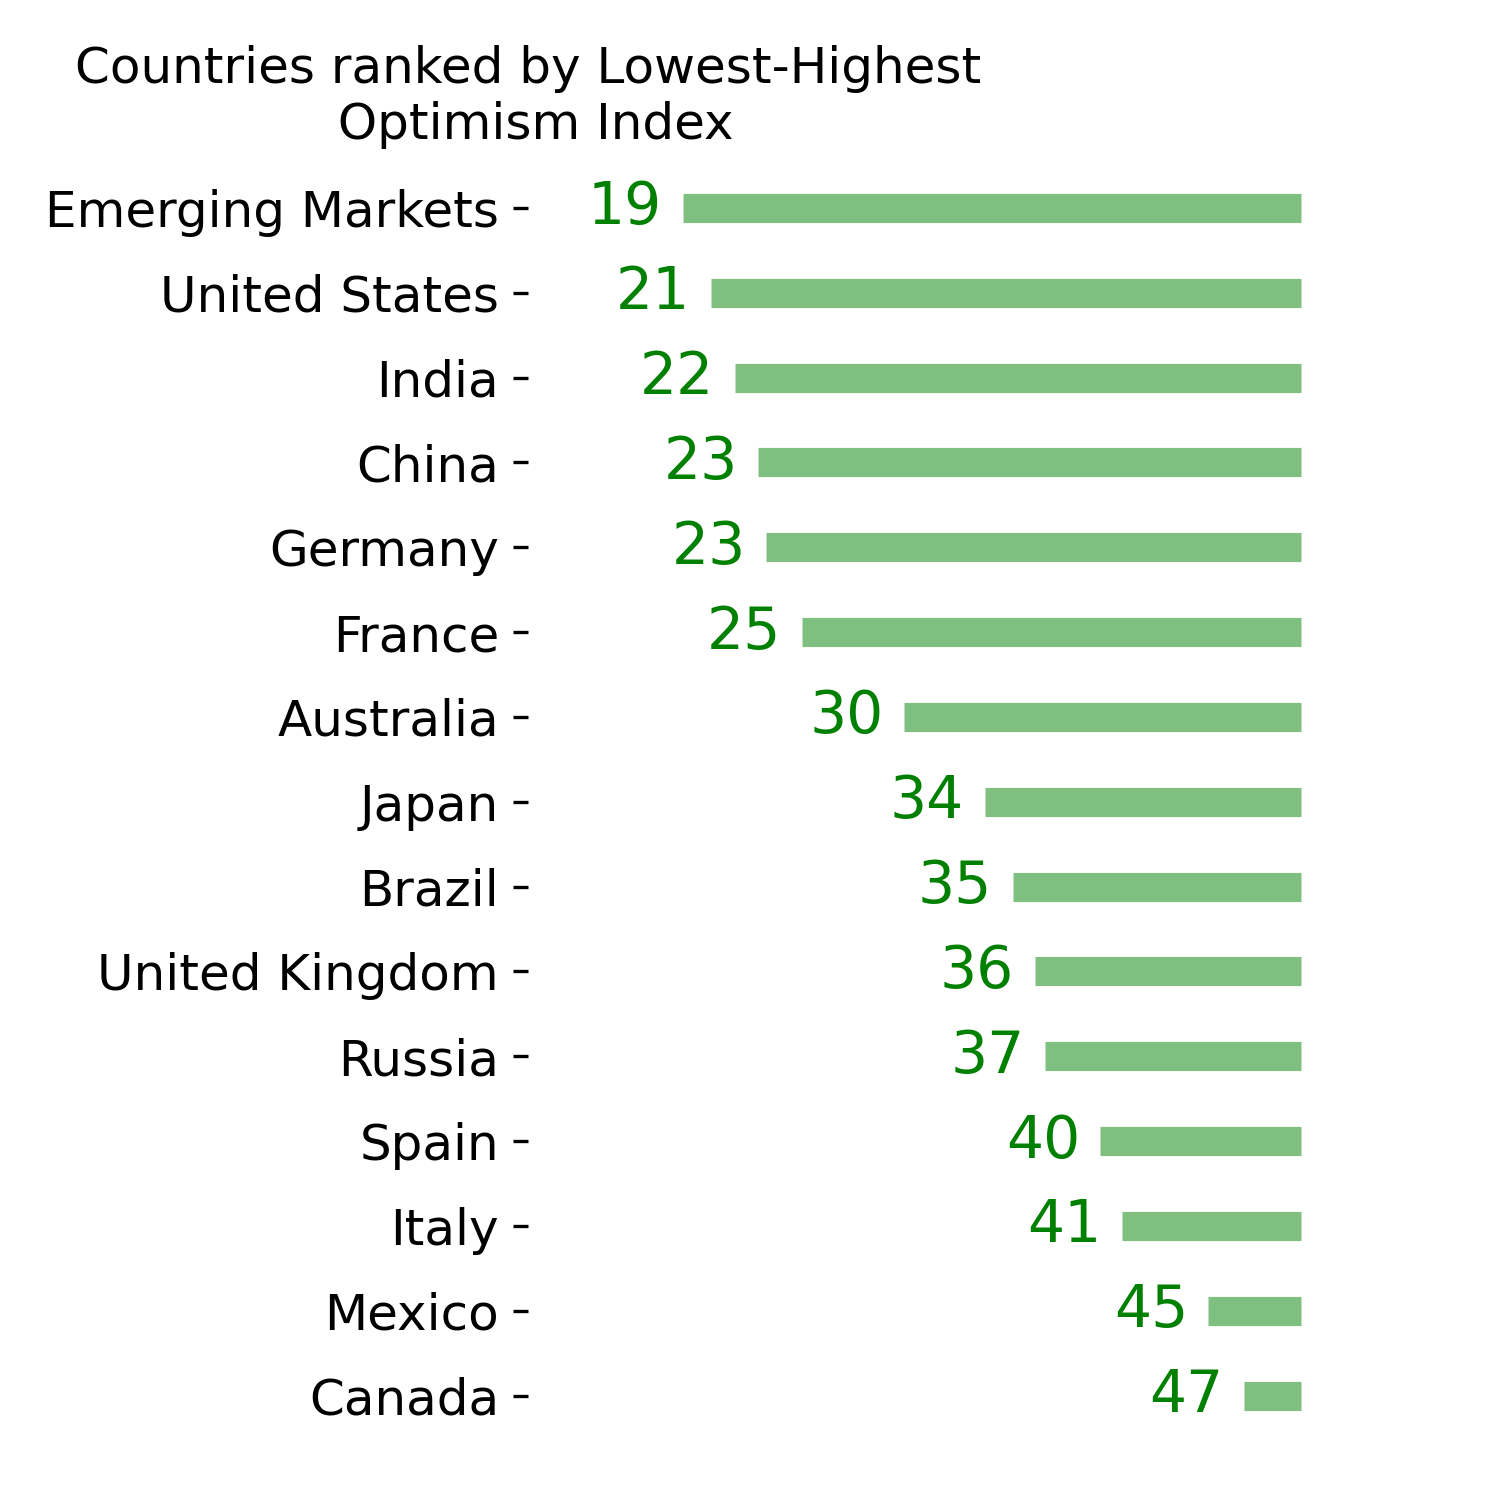
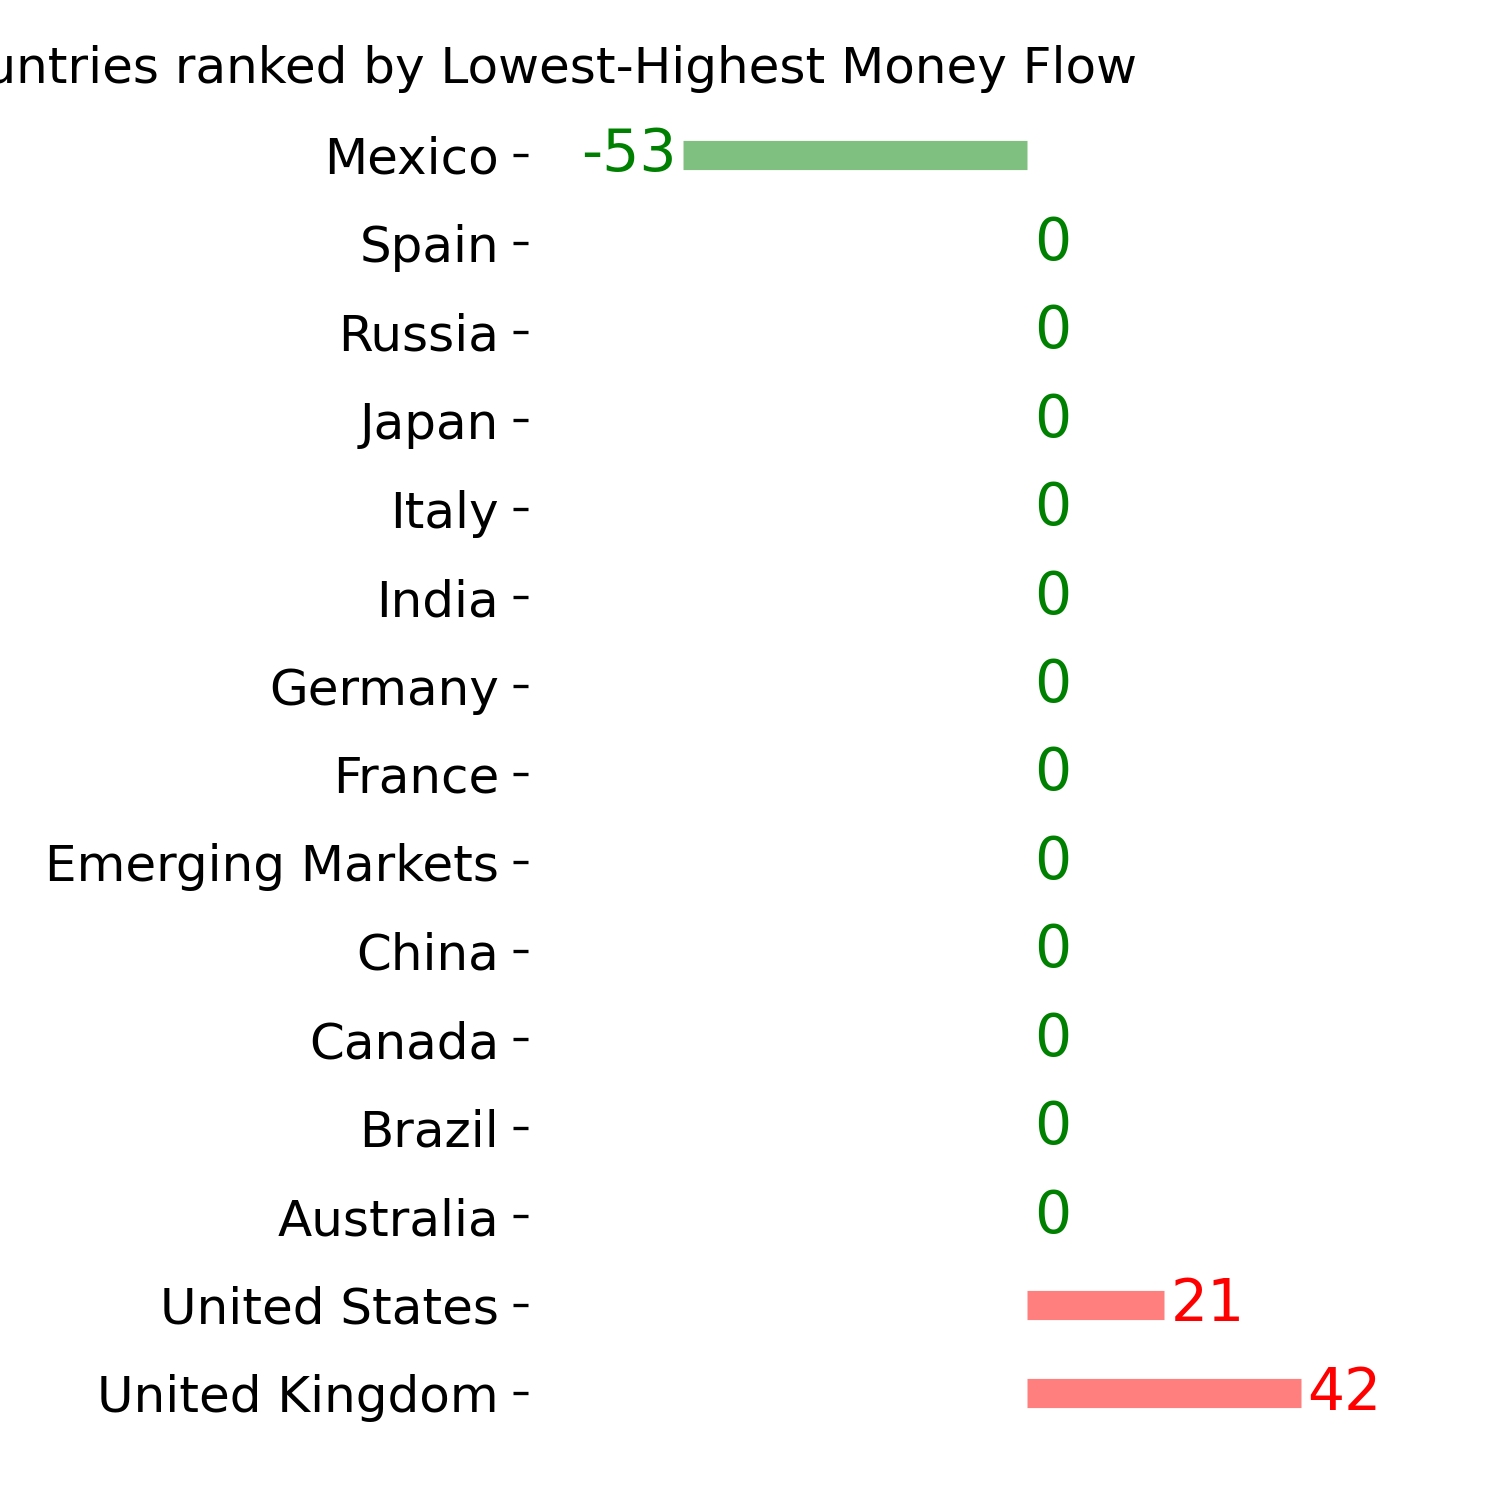
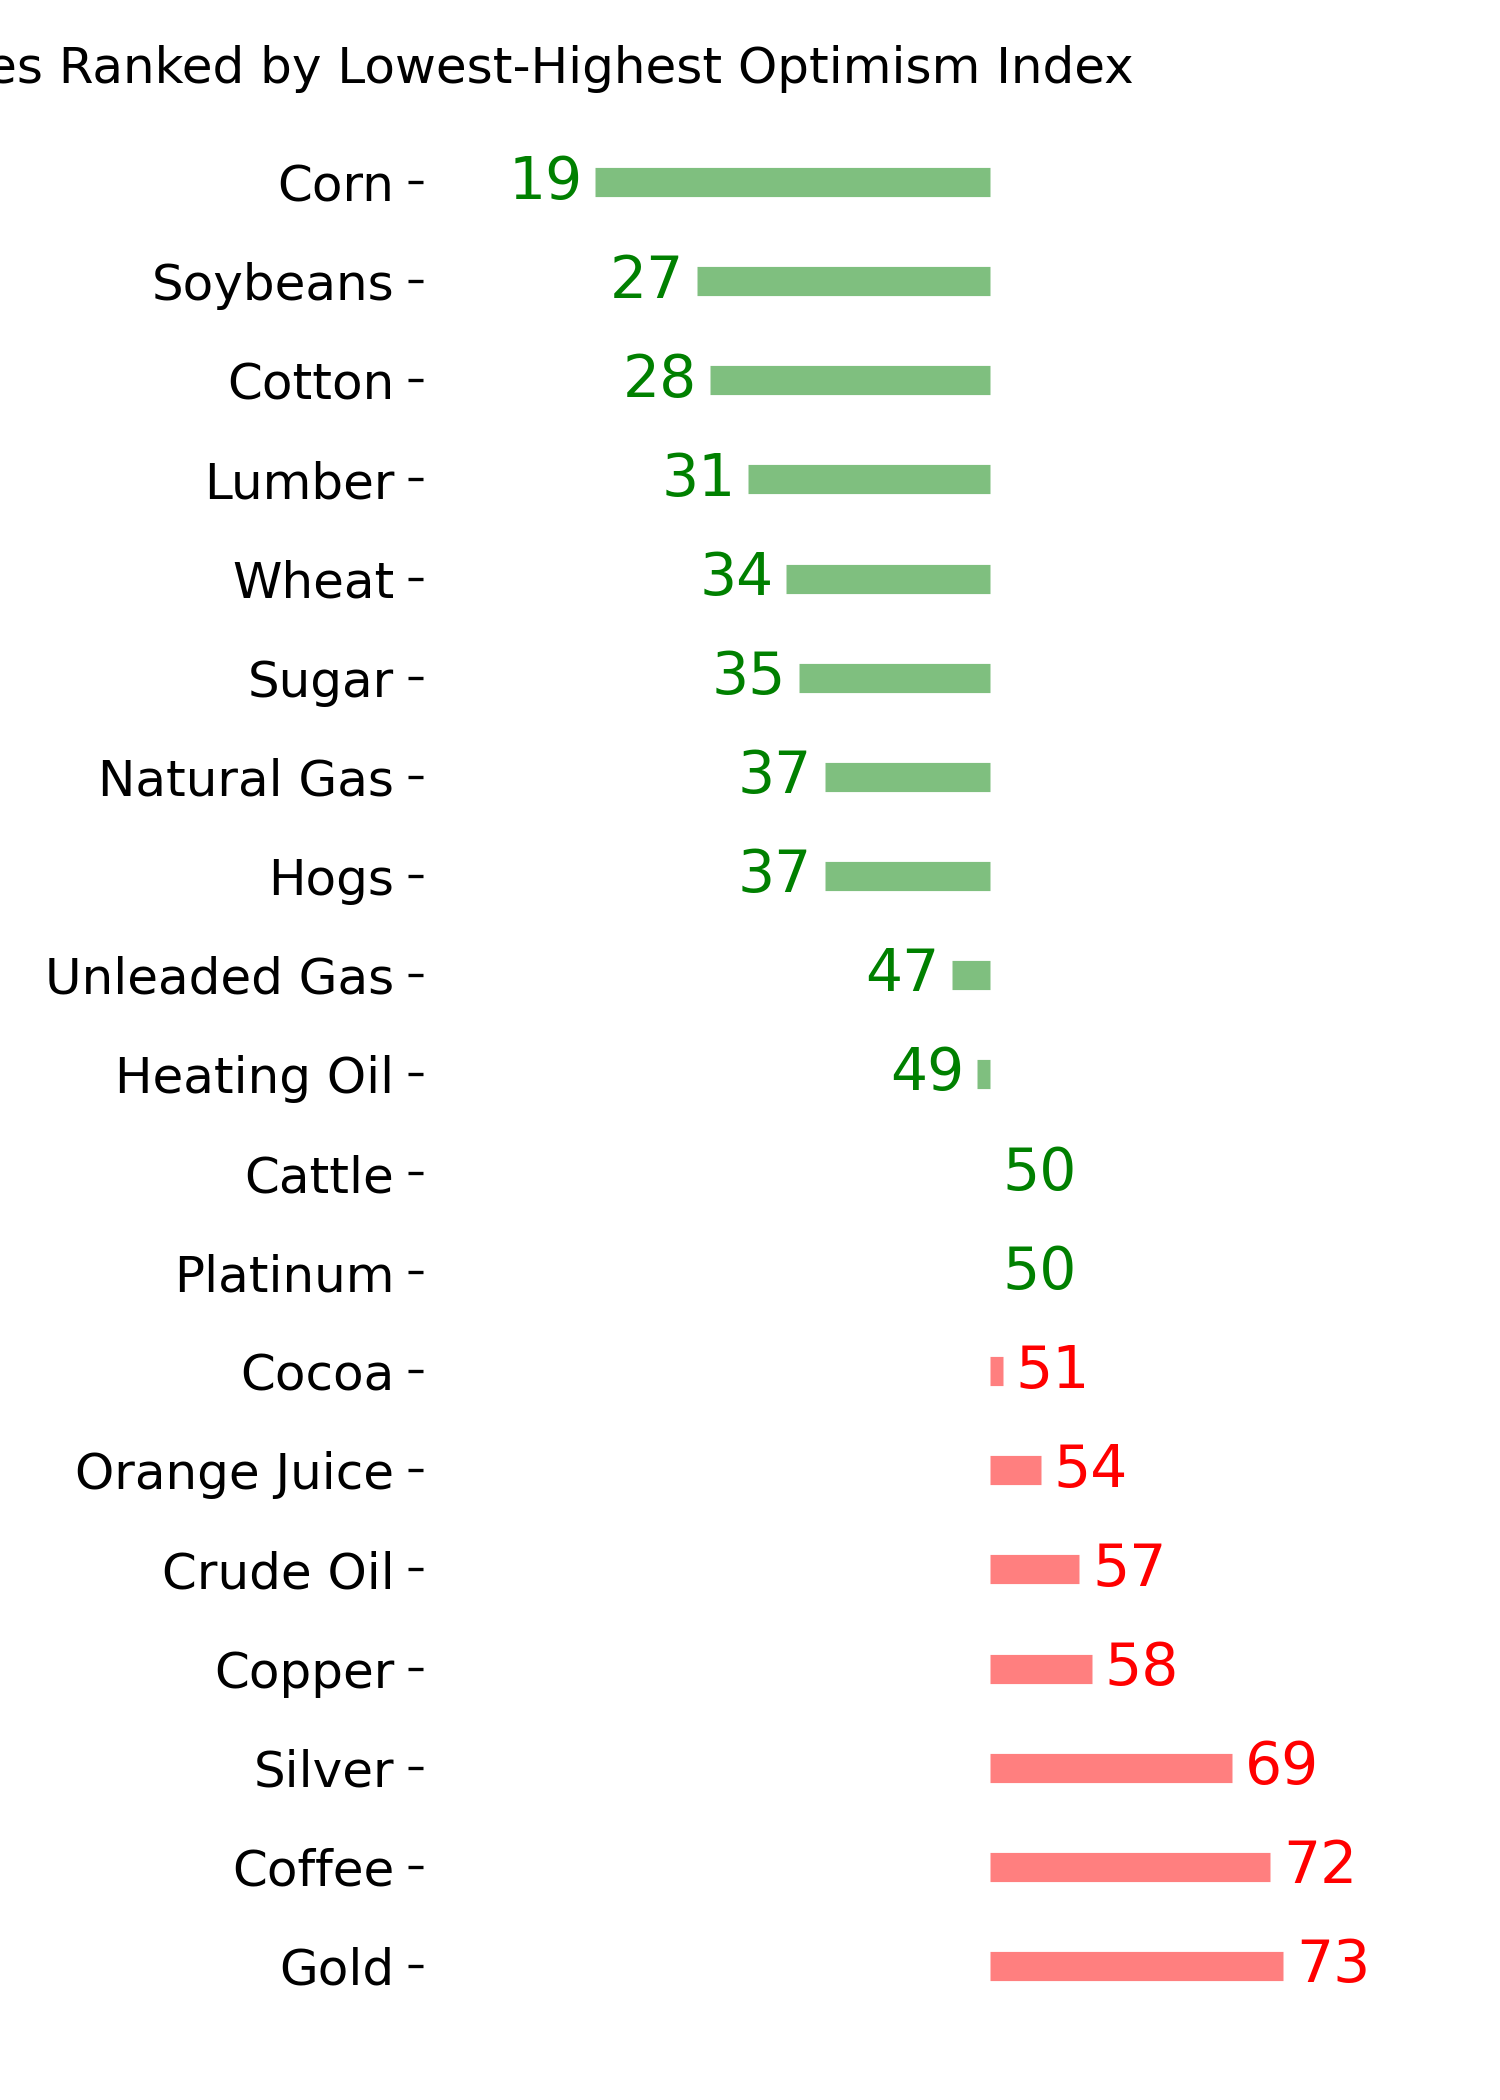
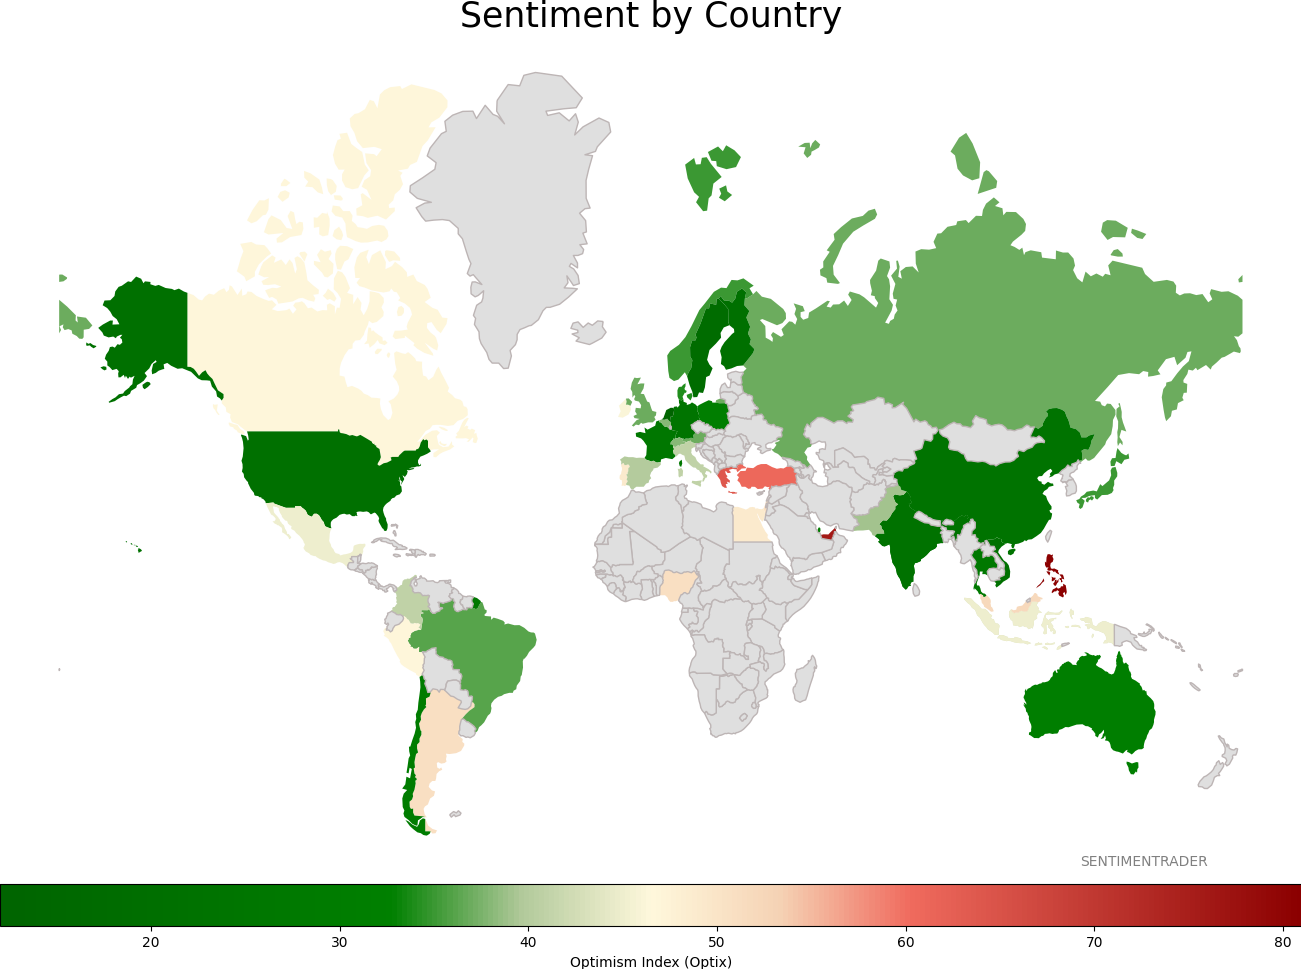
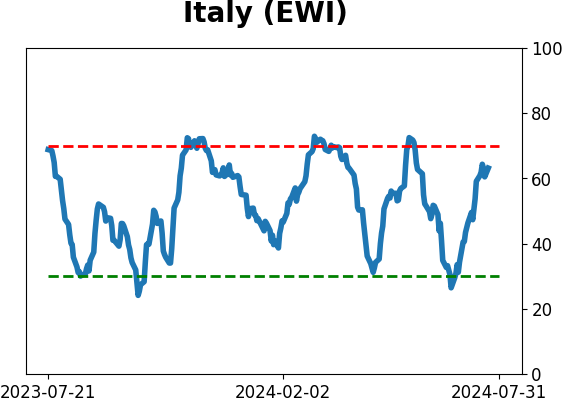
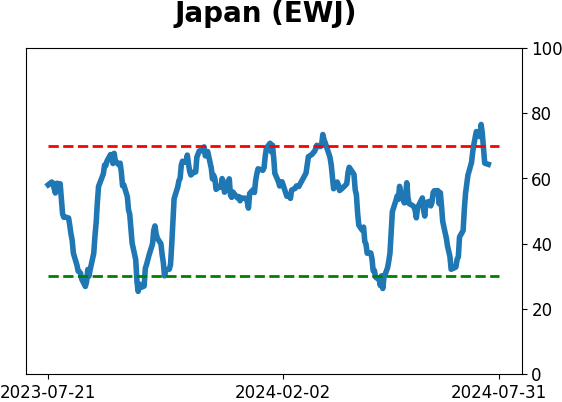
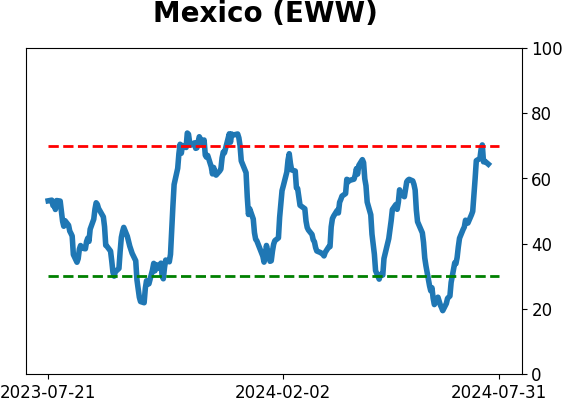
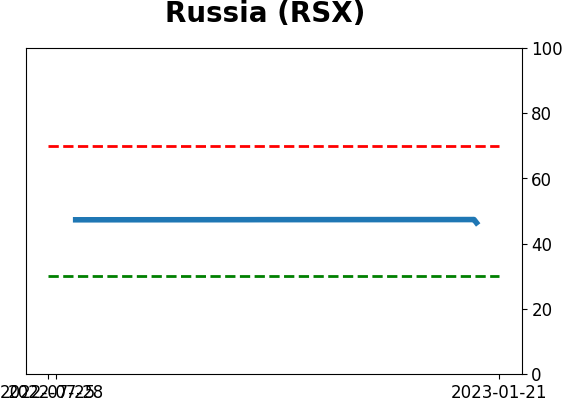
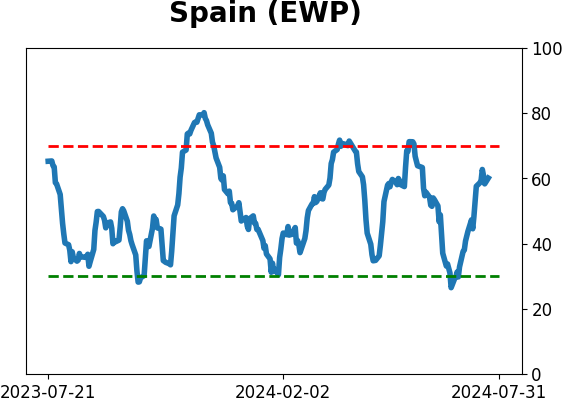
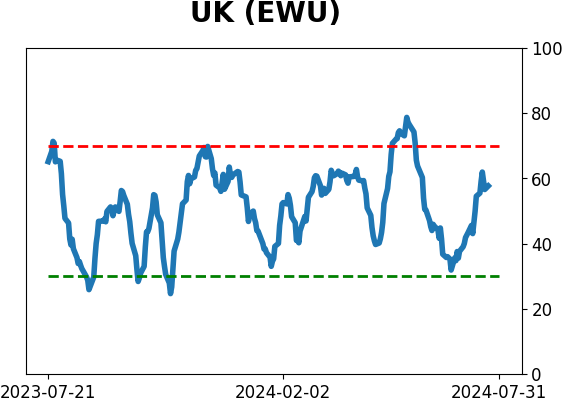
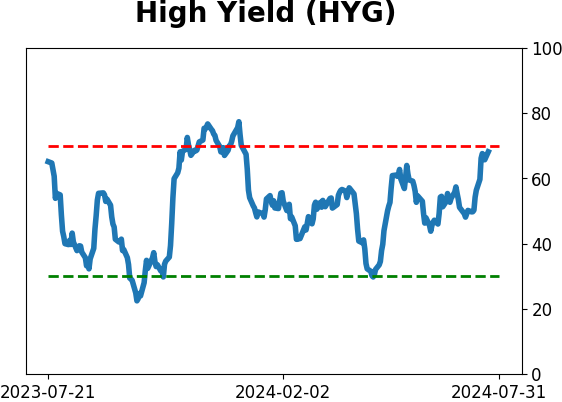
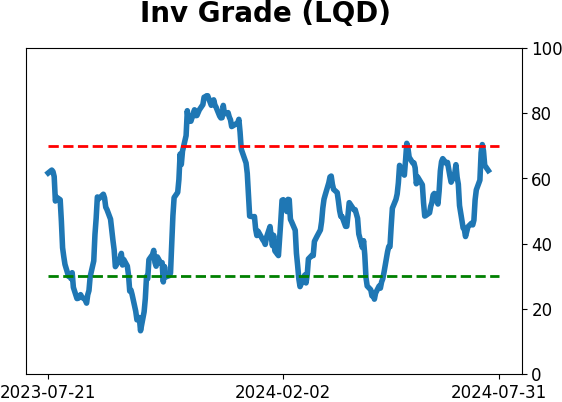
Sentiment Around The World
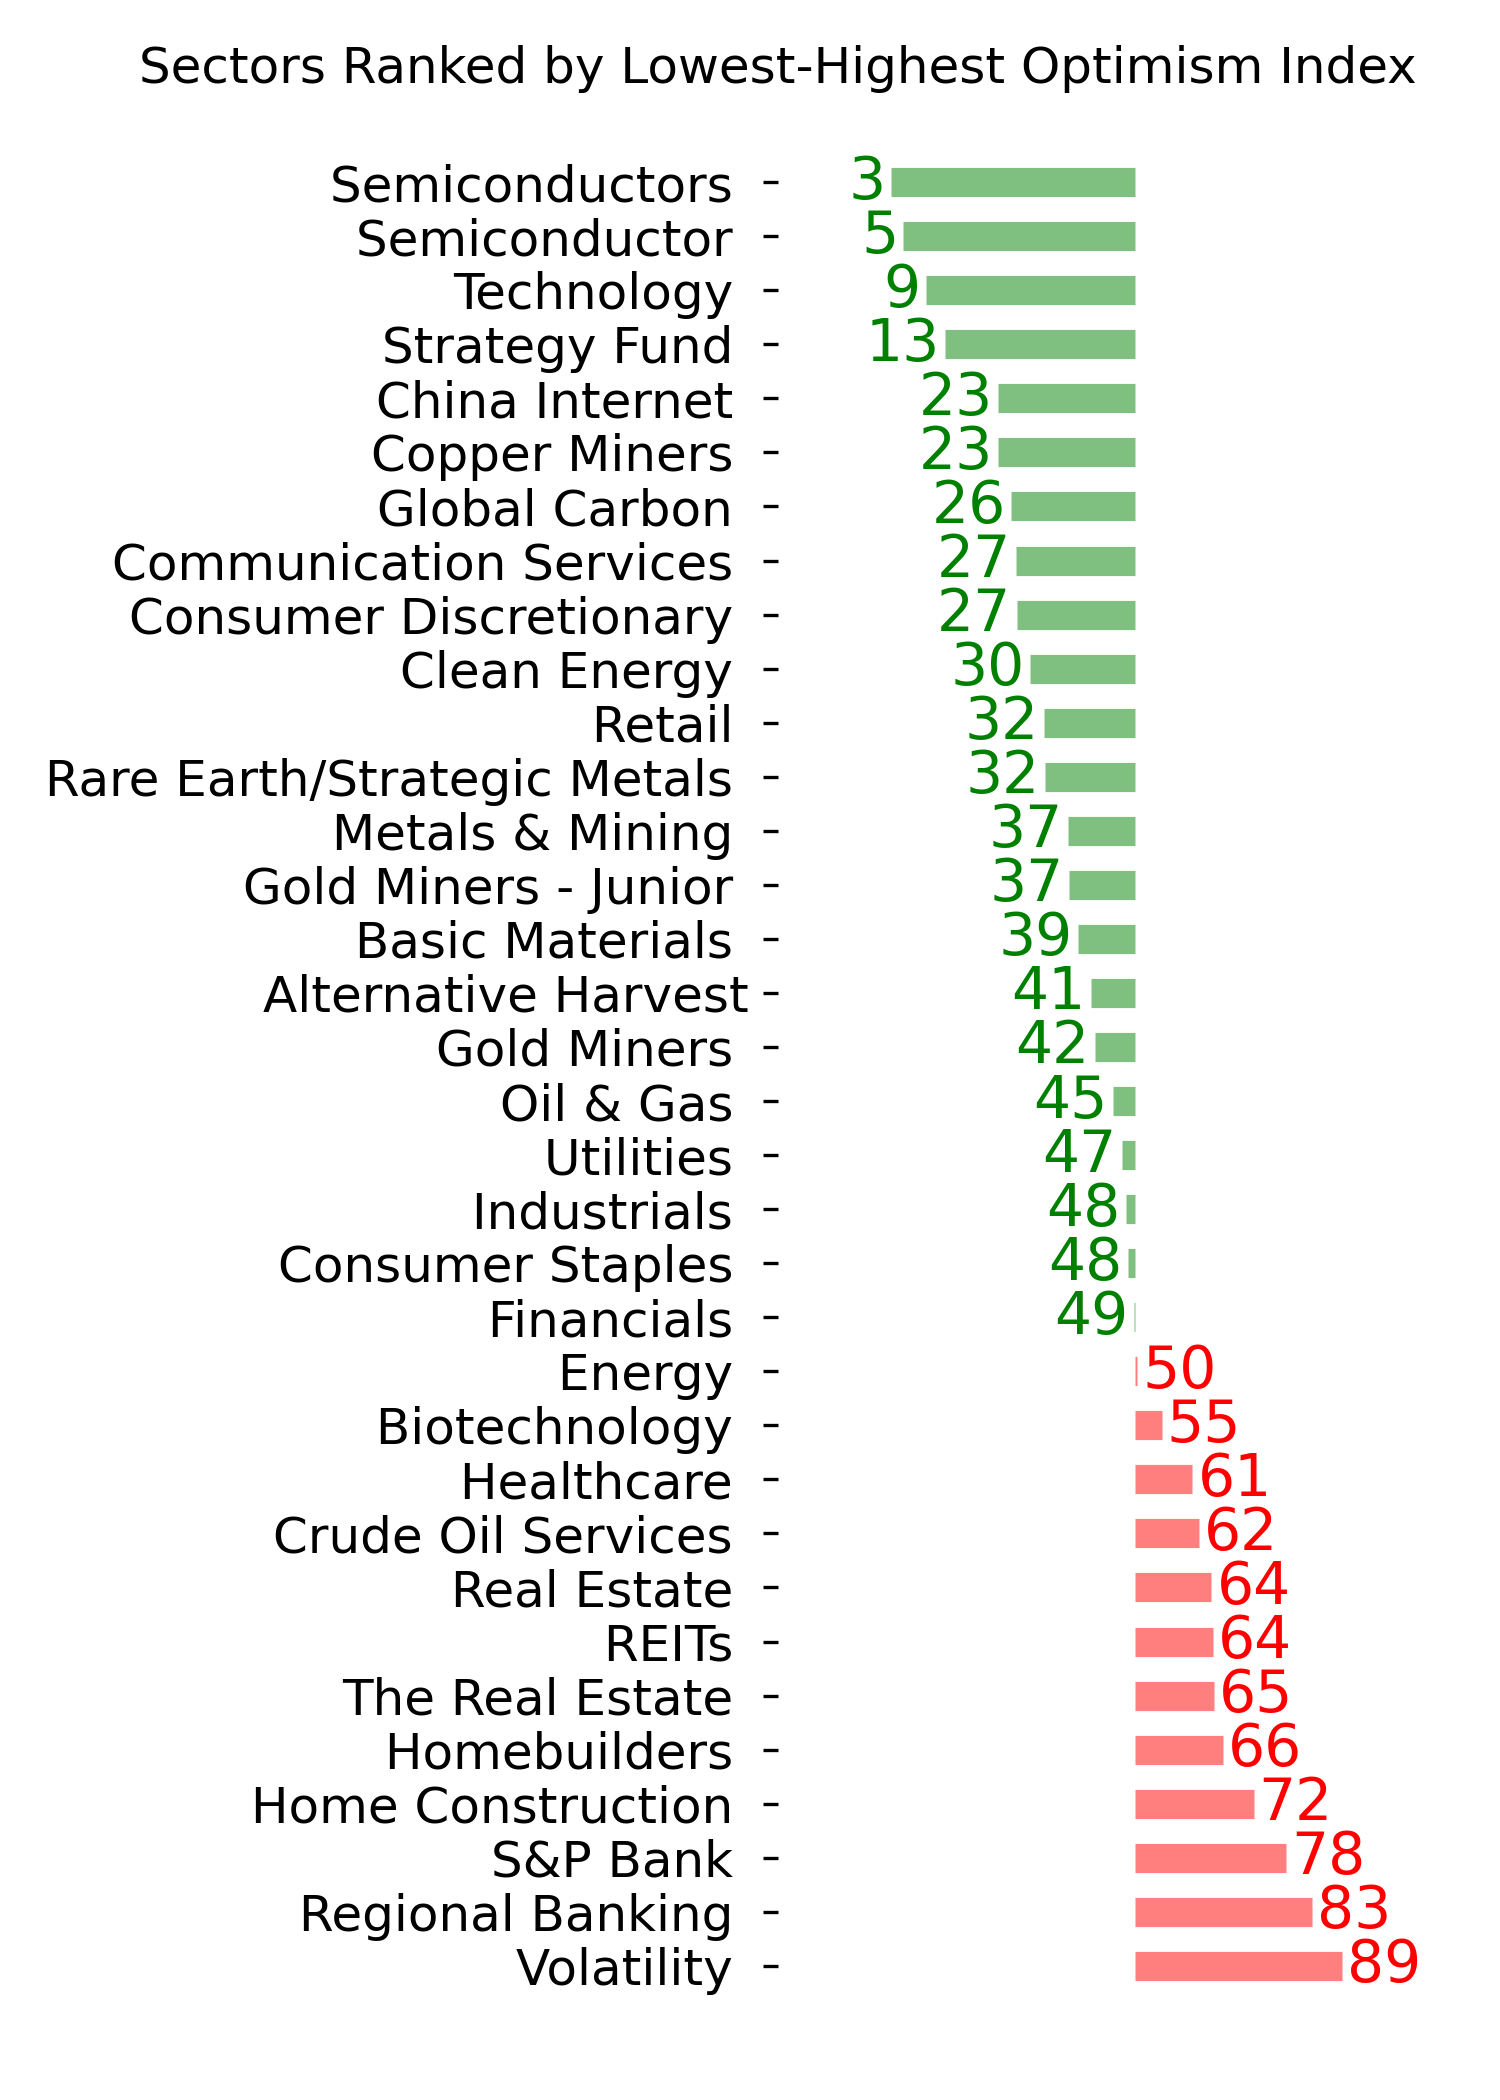
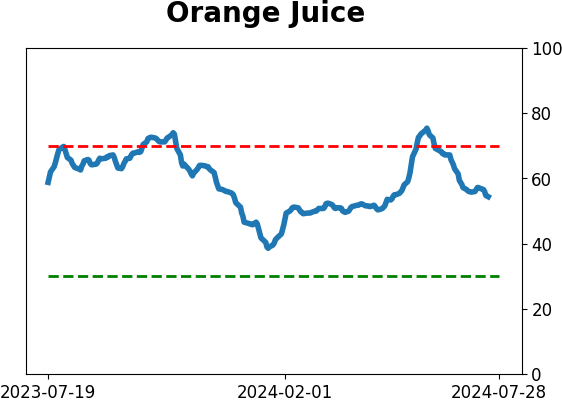
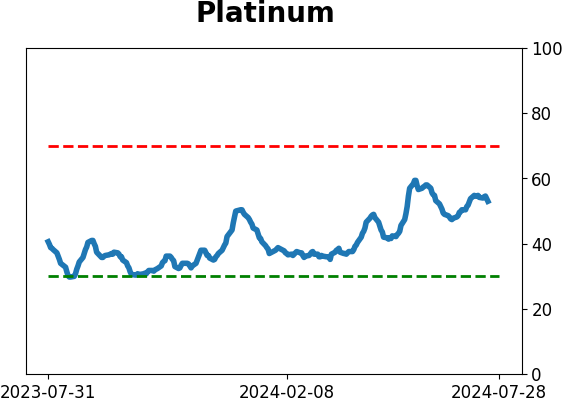
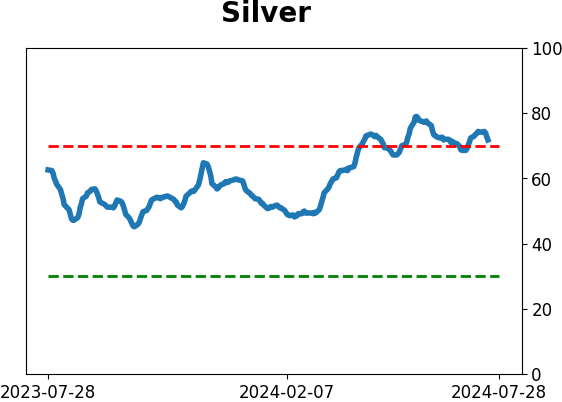
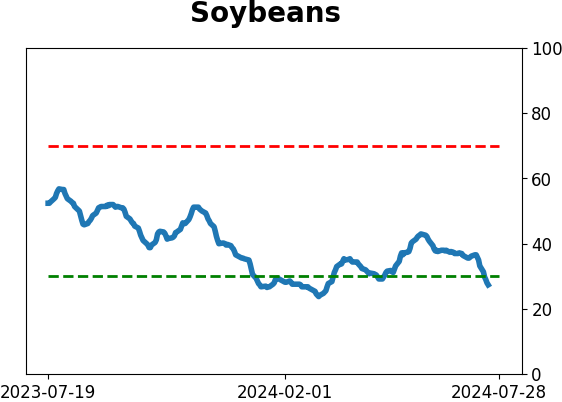
Optimism Index Thumbnails
|
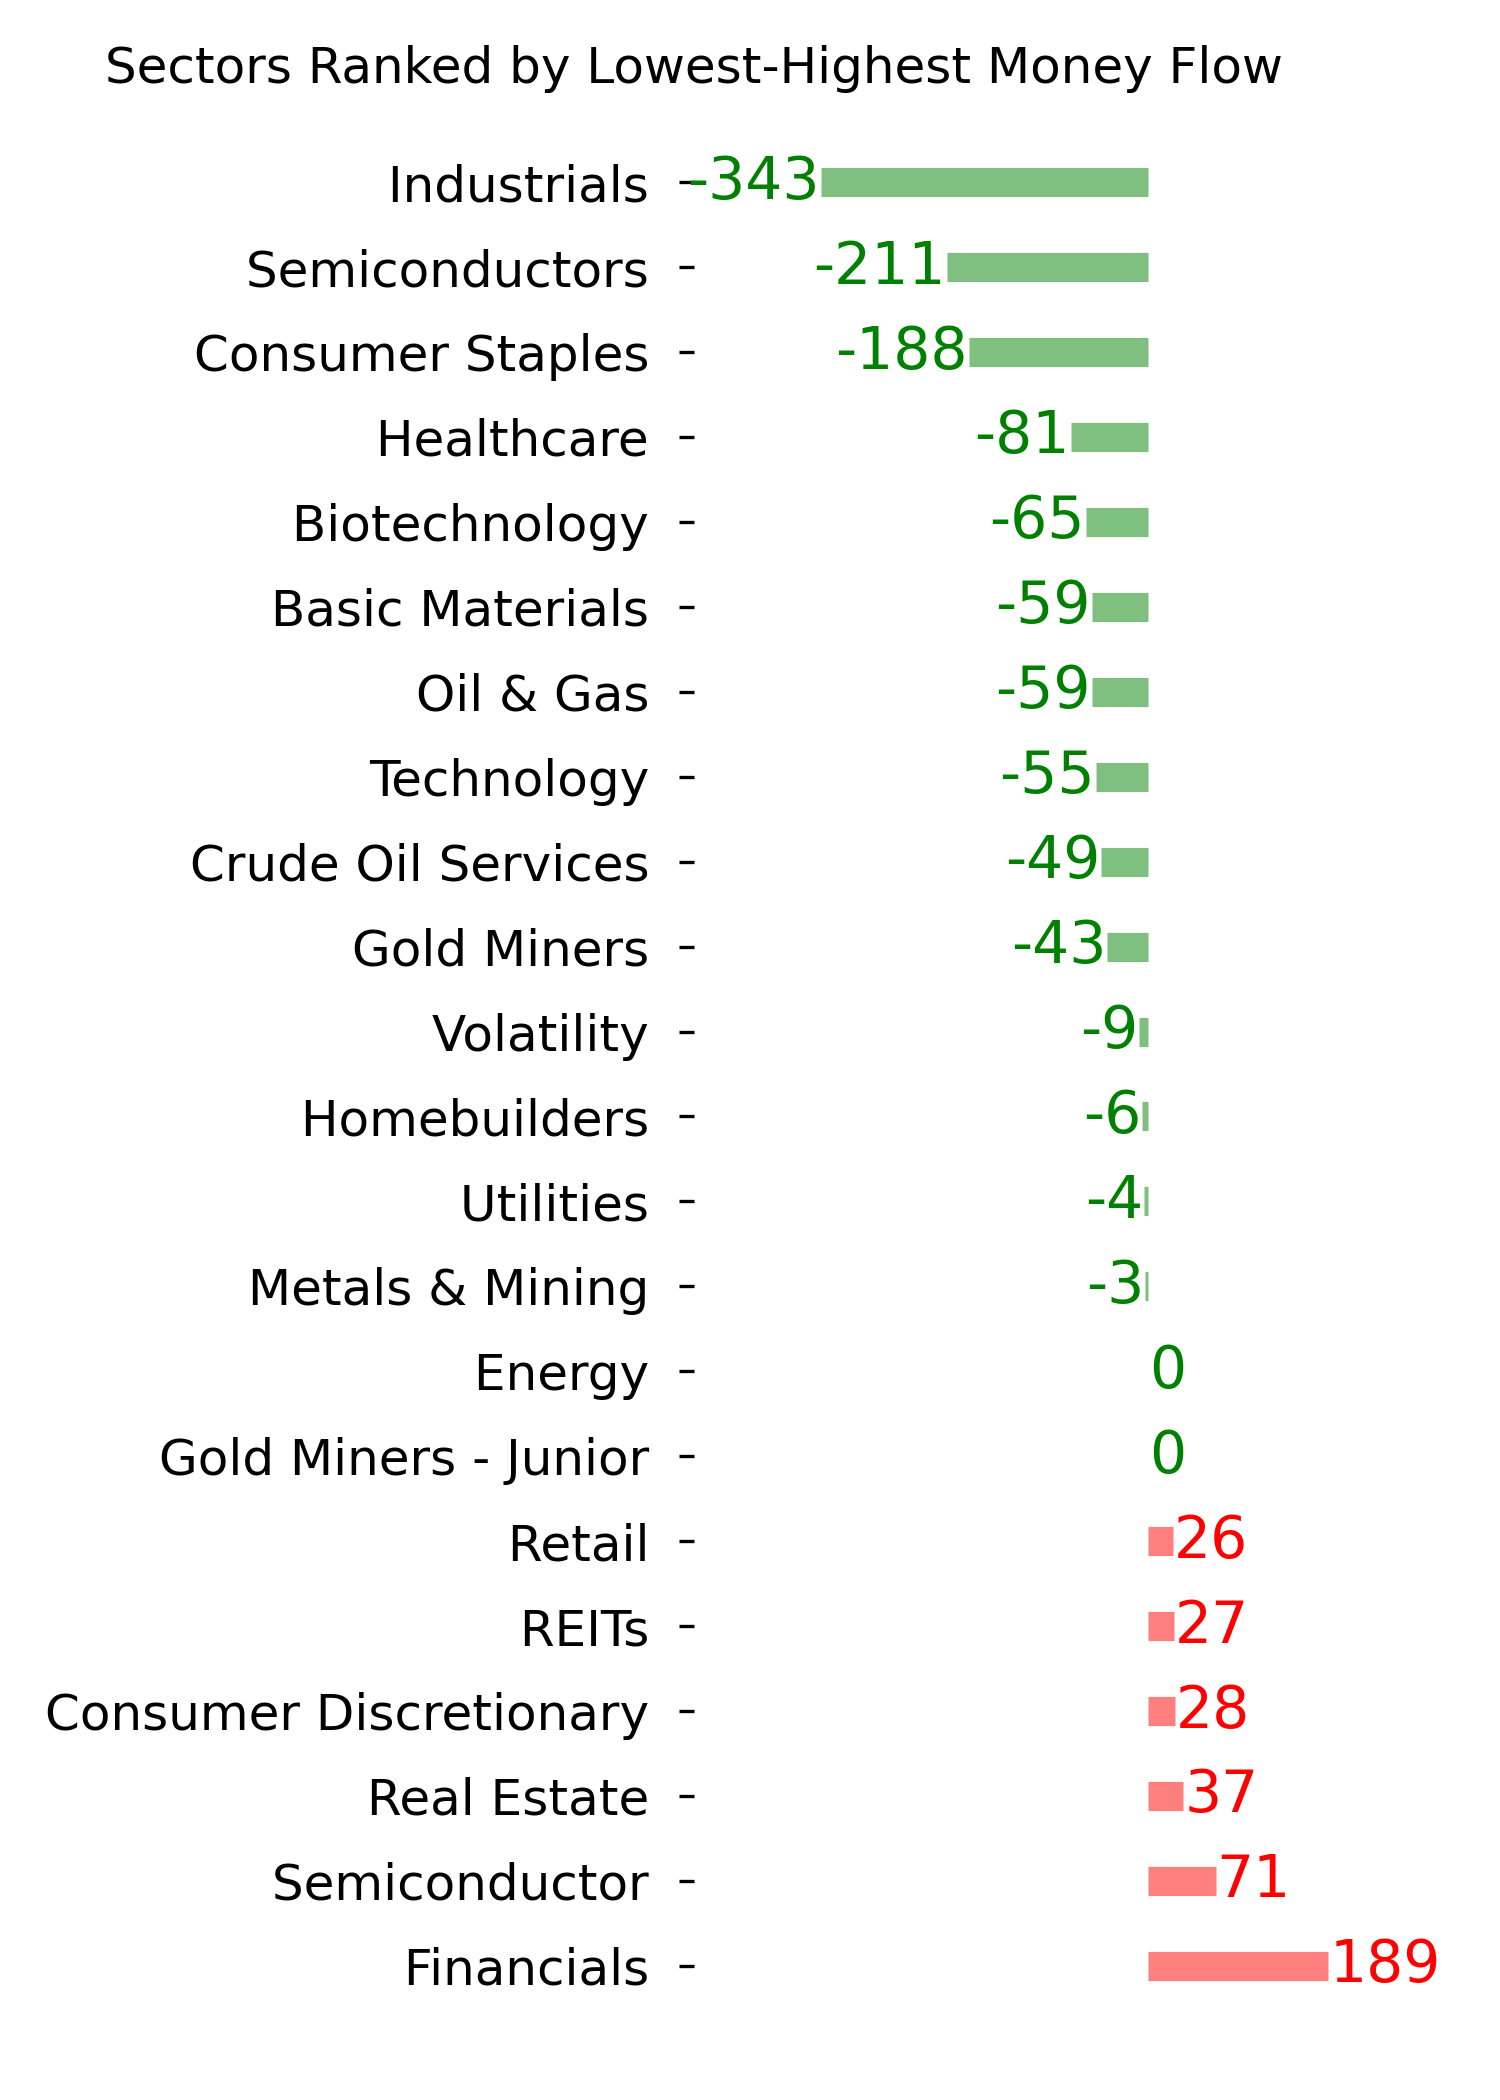
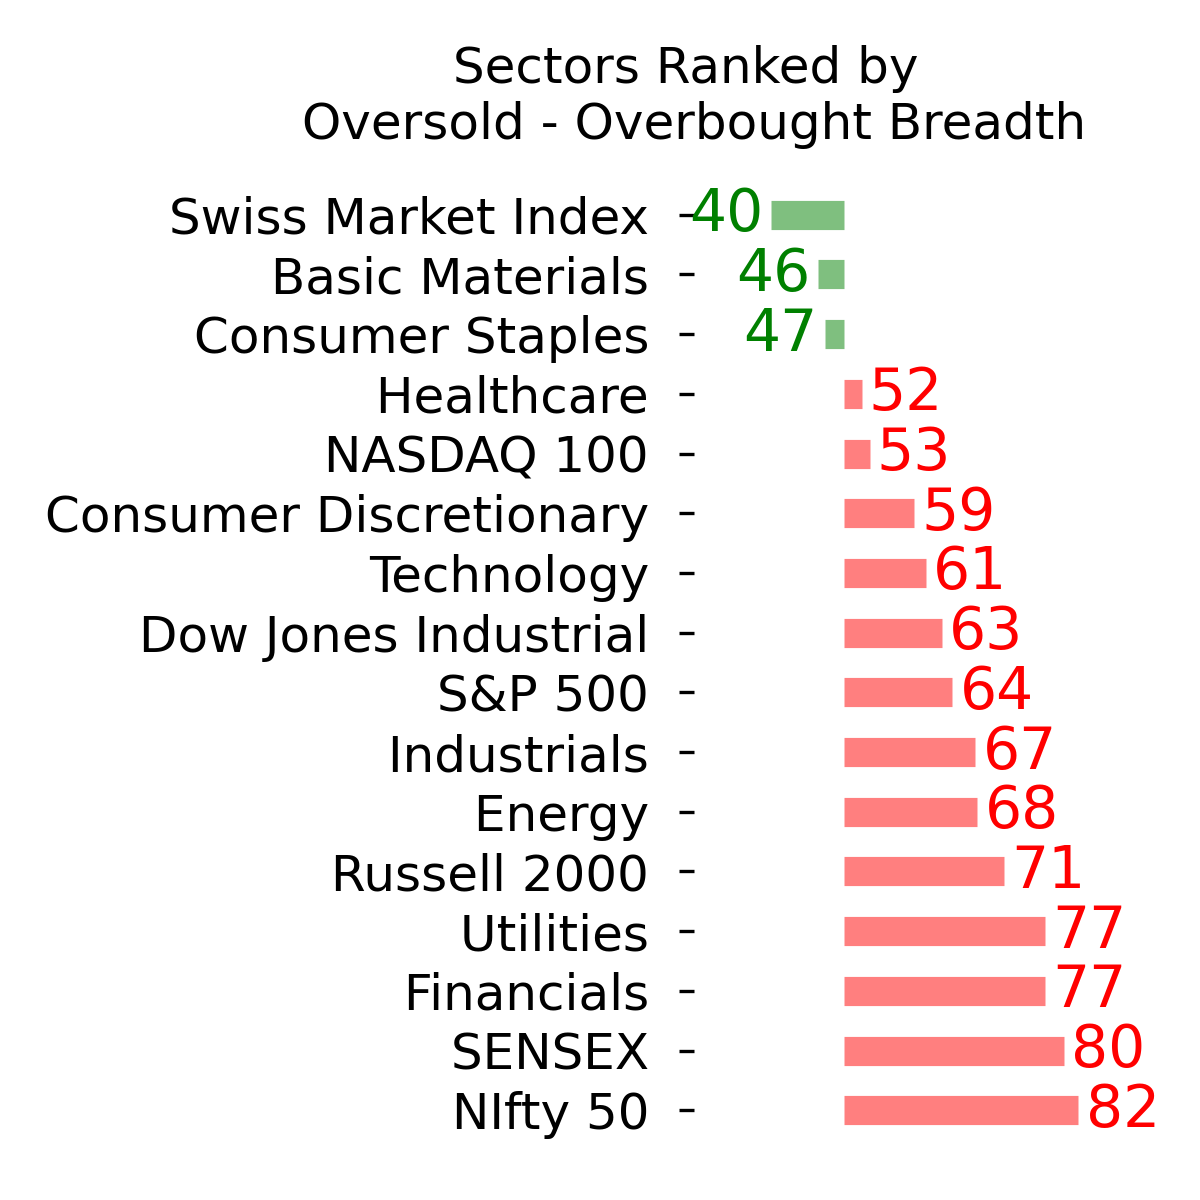
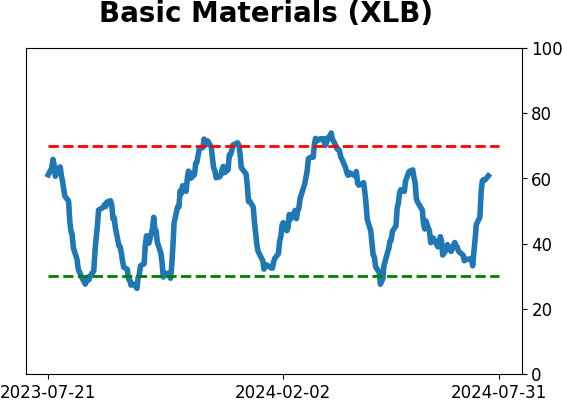
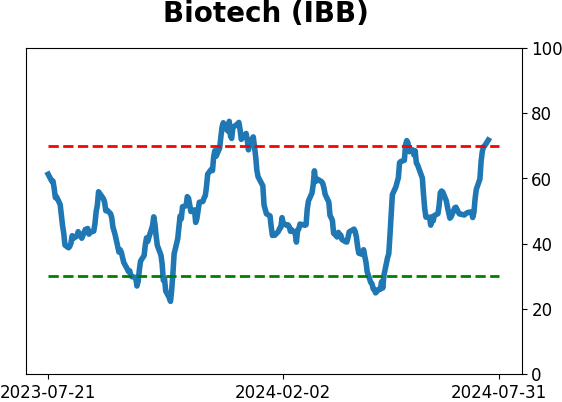
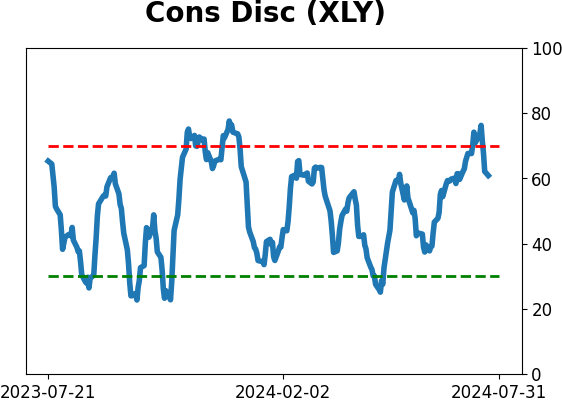
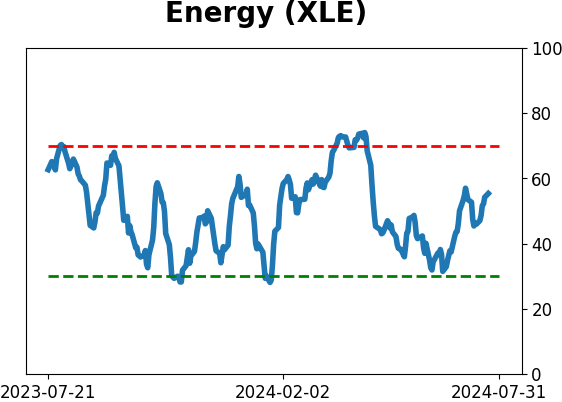
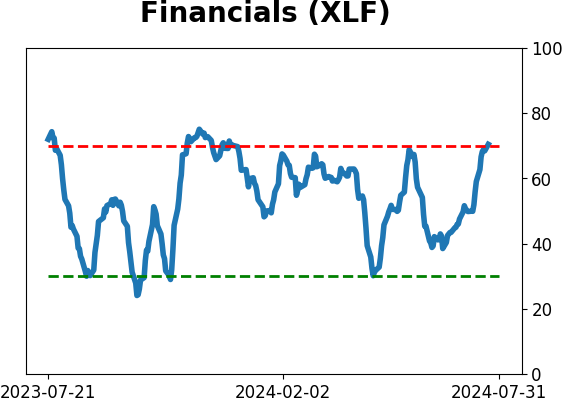
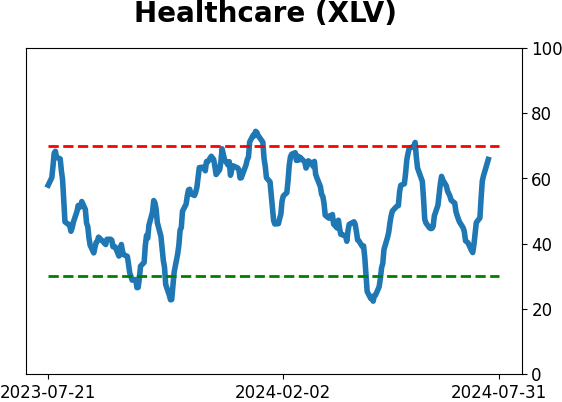
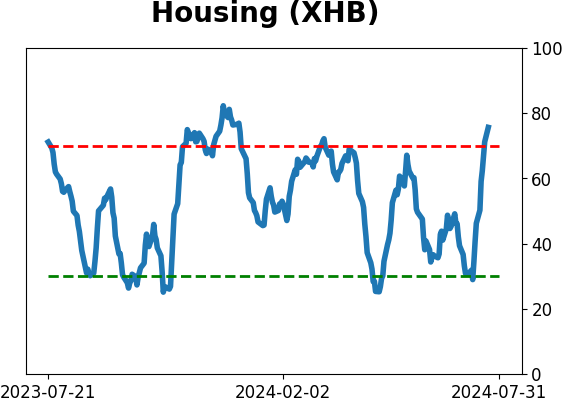
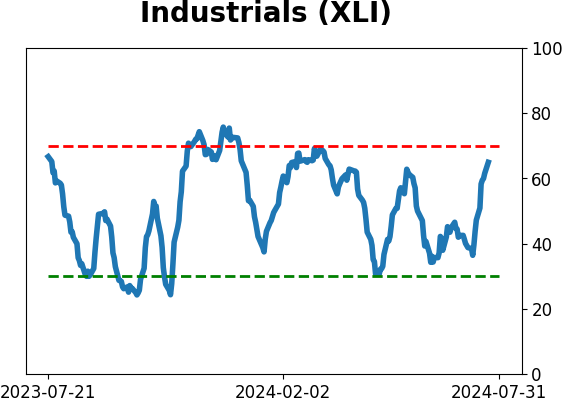
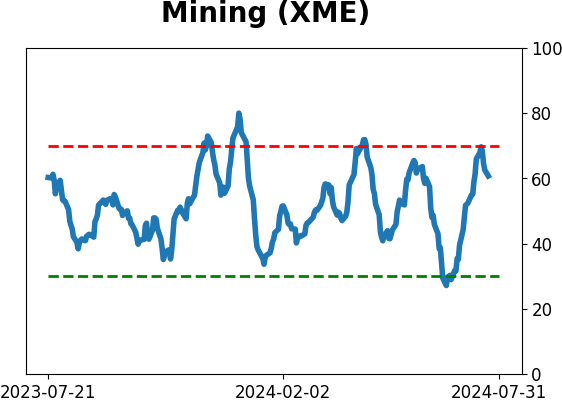
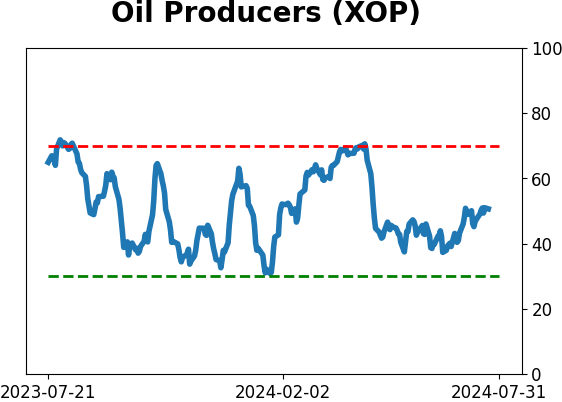
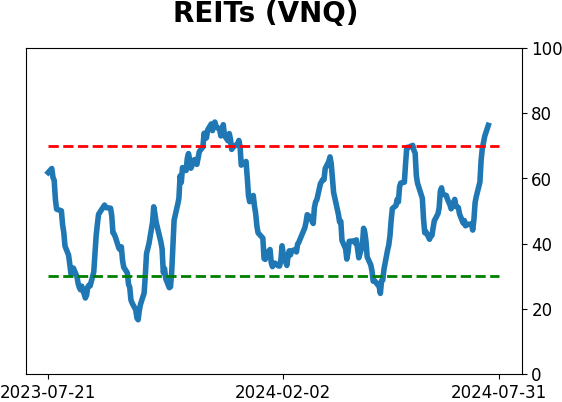
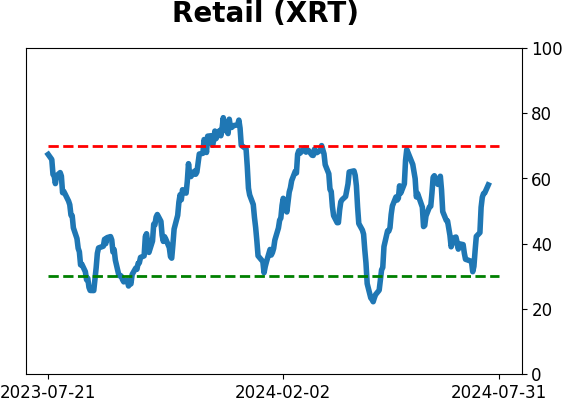
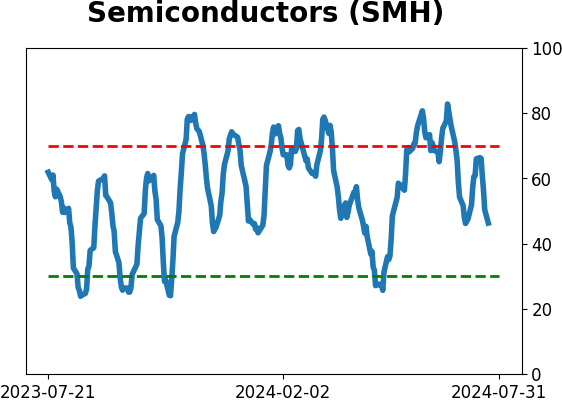
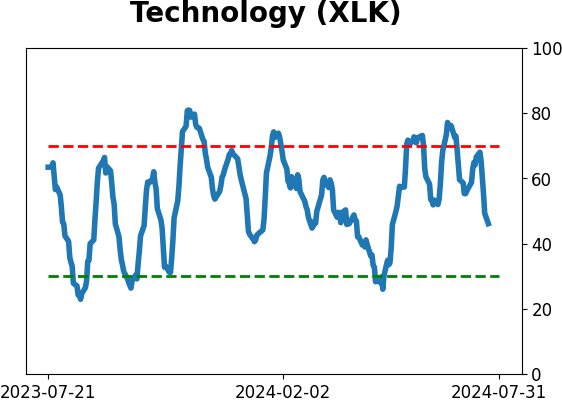
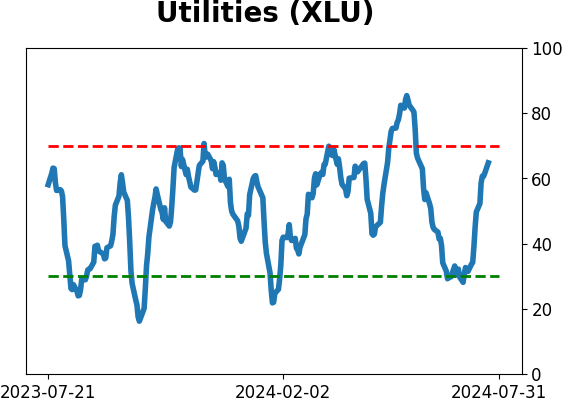
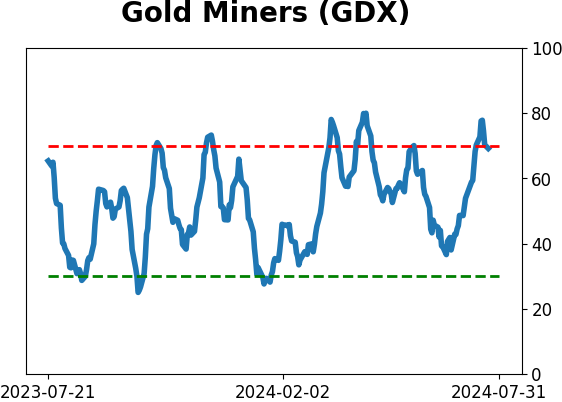
Sector ETF's - 10-Day Moving Average
|
|
|
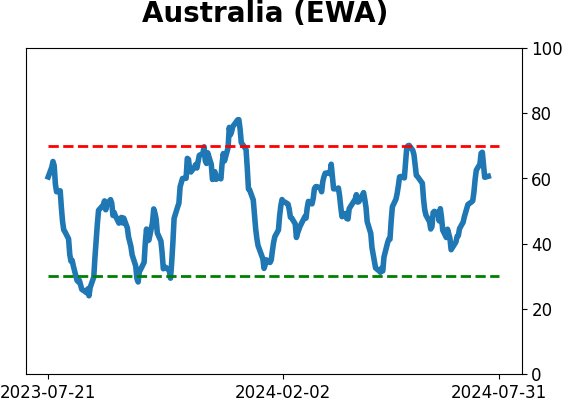
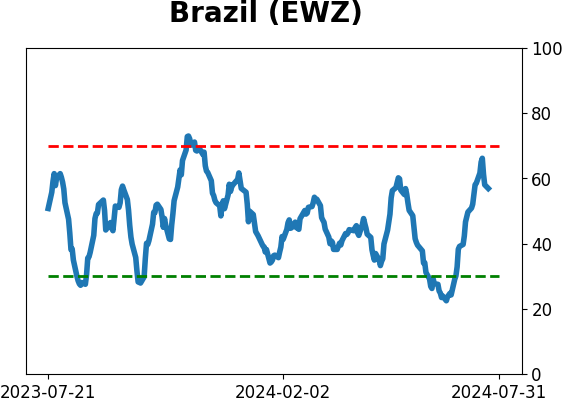
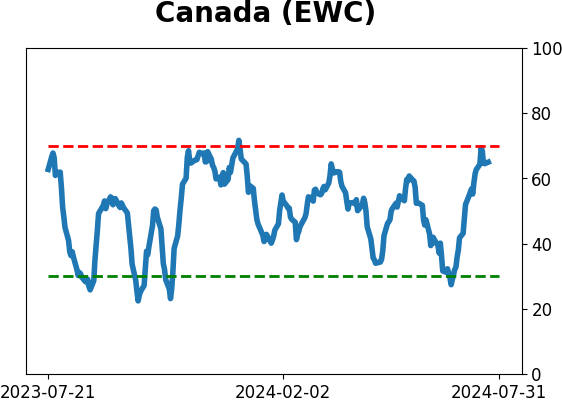
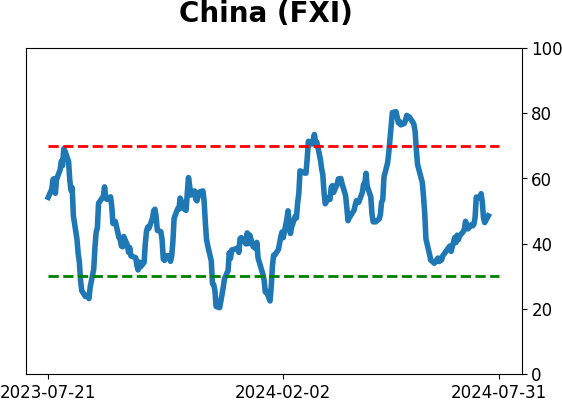
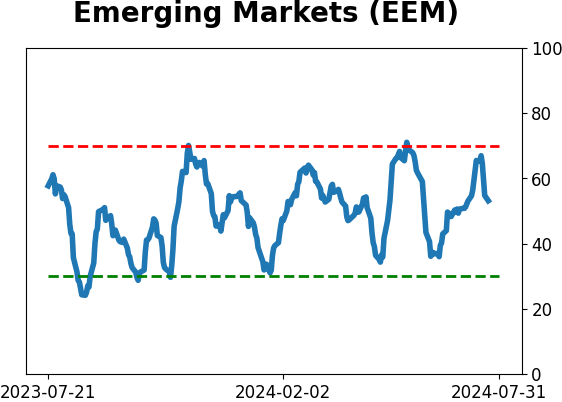
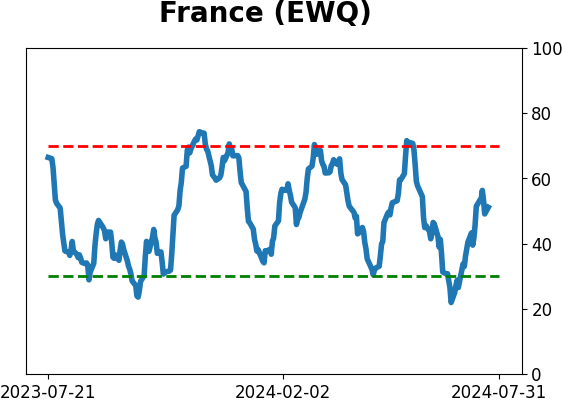
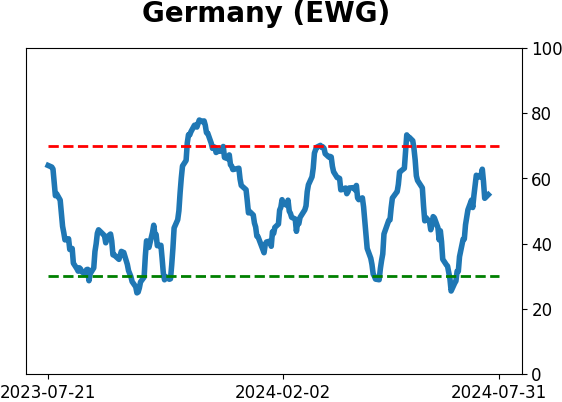
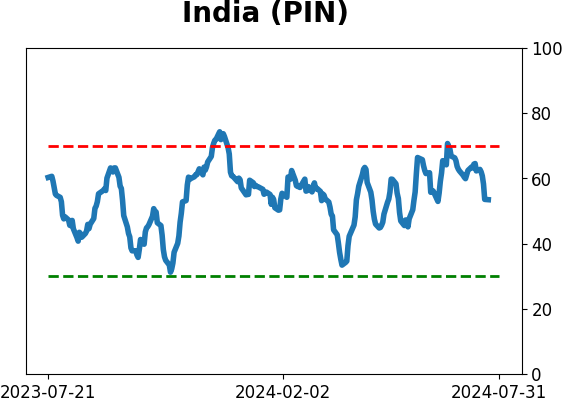
Country ETF's - 10-Day Moving Average
|
|
|
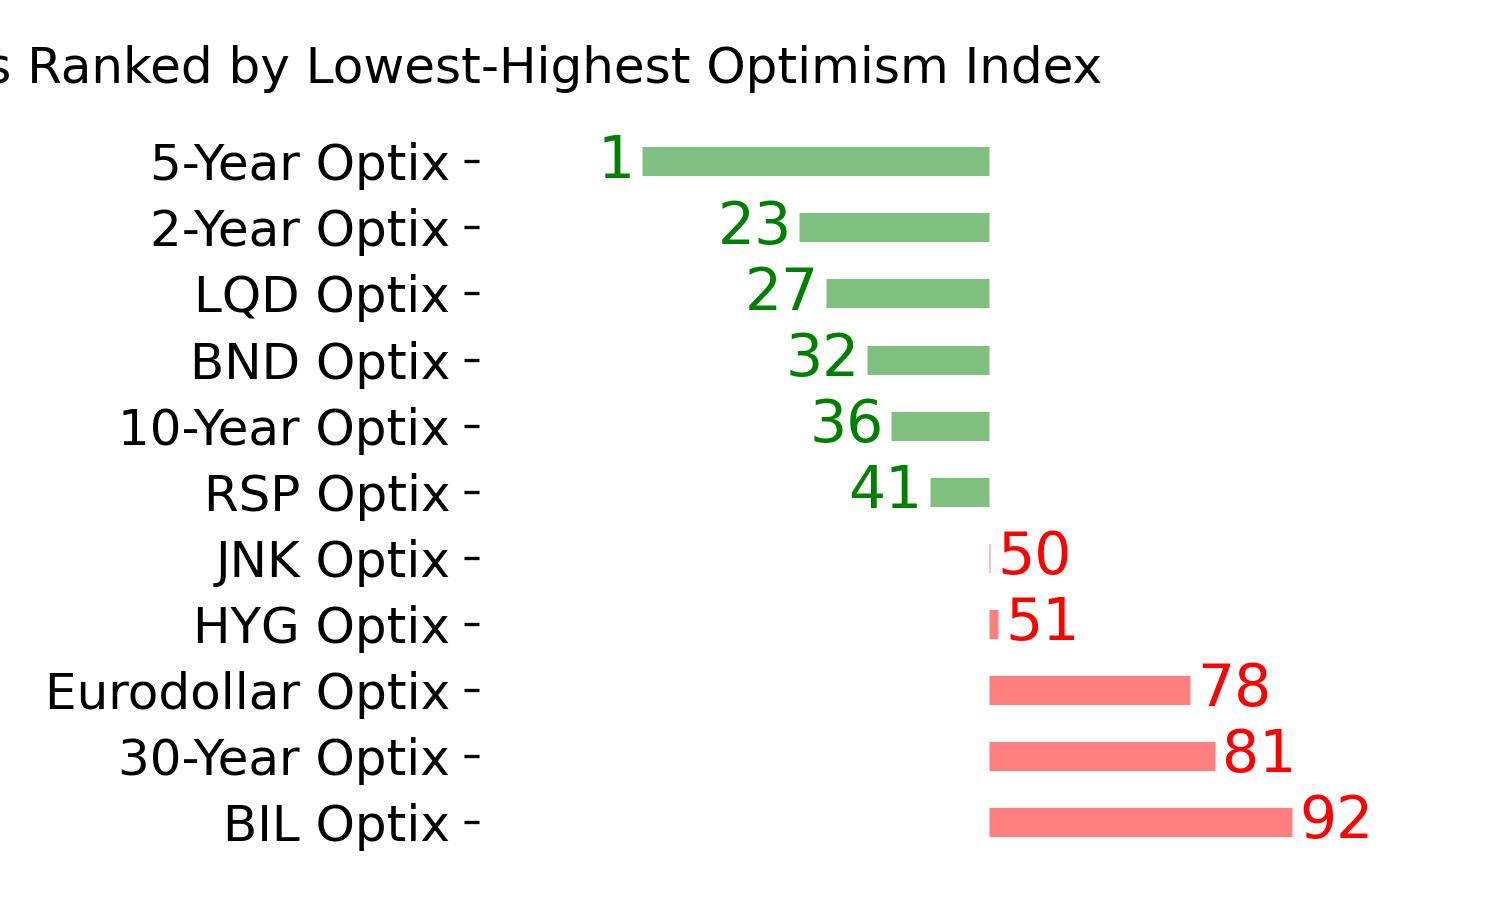
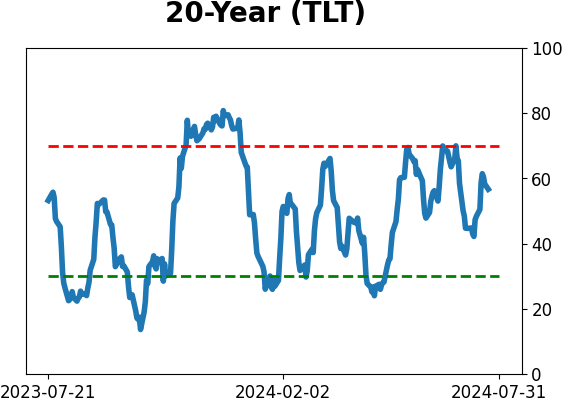
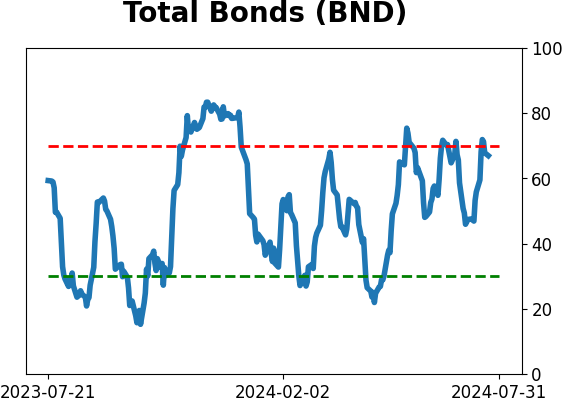
Bond ETF's - 10-Day Moving Average
|
|
|
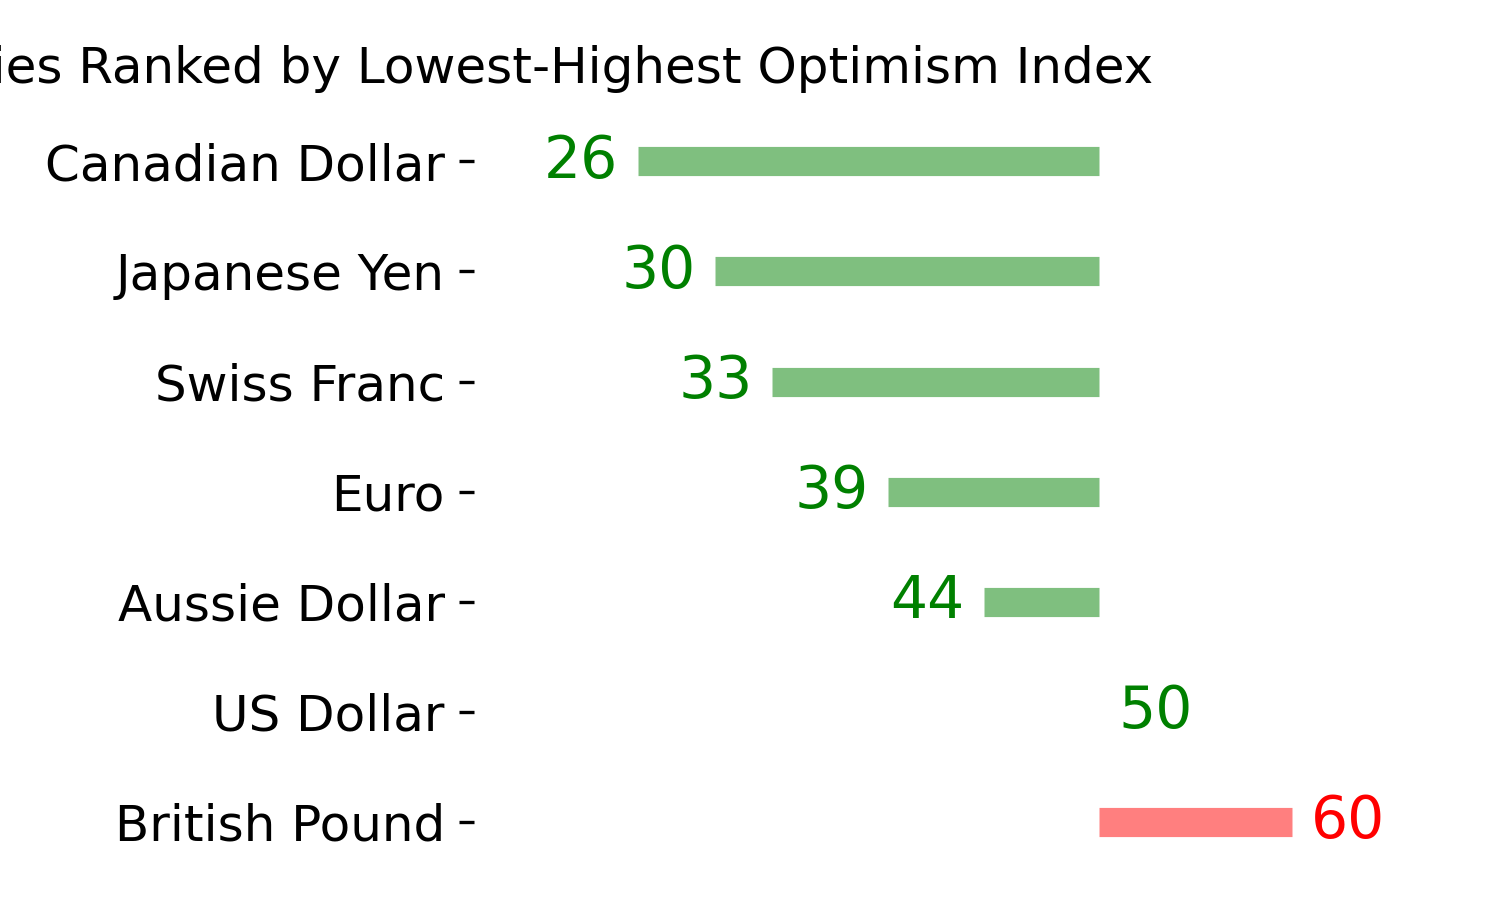
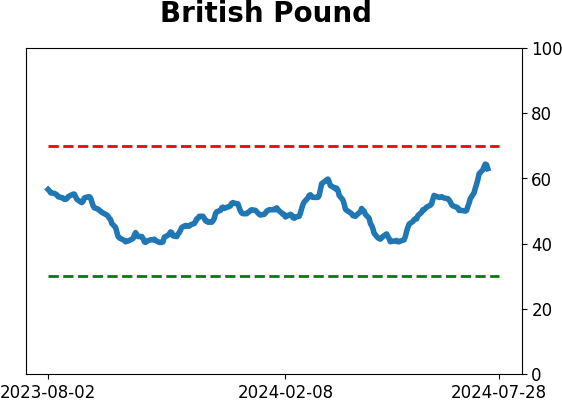
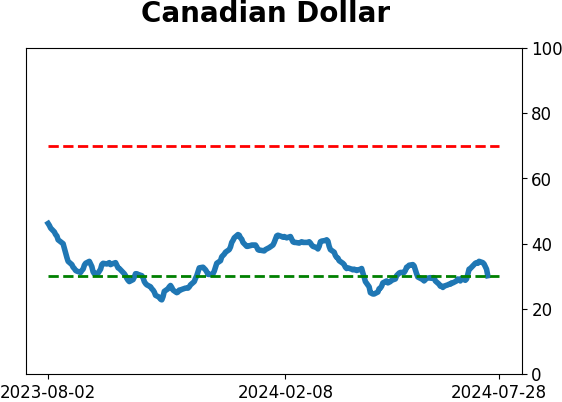
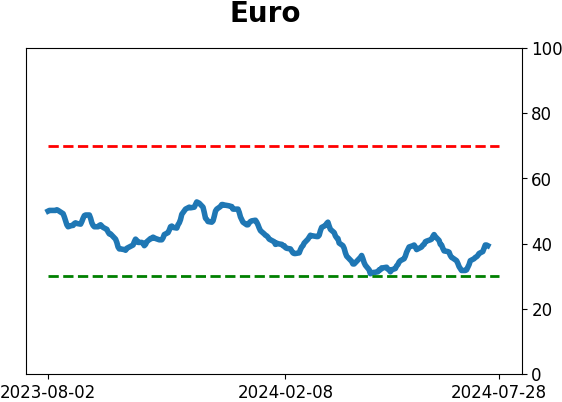
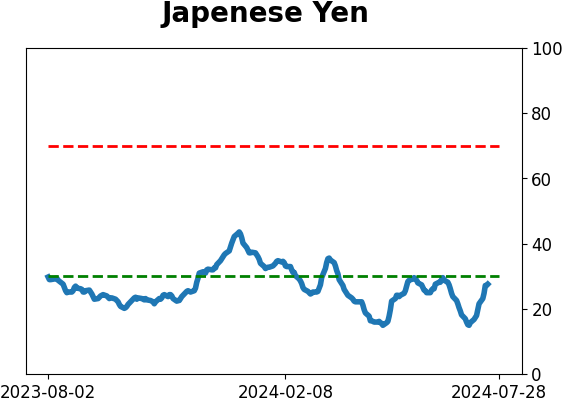
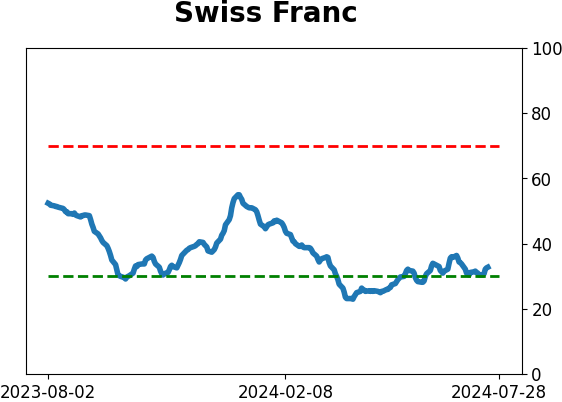
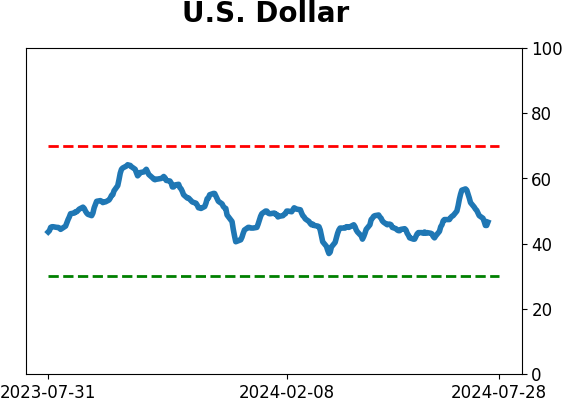
Currency ETF's - 5-Day Moving Average
|
|
|
Commodity ETF's - 5-Day Moving Average
|
|