Daily Report : TradingEdge Weekly for Jul 22 - More bets on a crash, historically whippy markets

| View/Print a PDF version of this Report |
Headlines
|
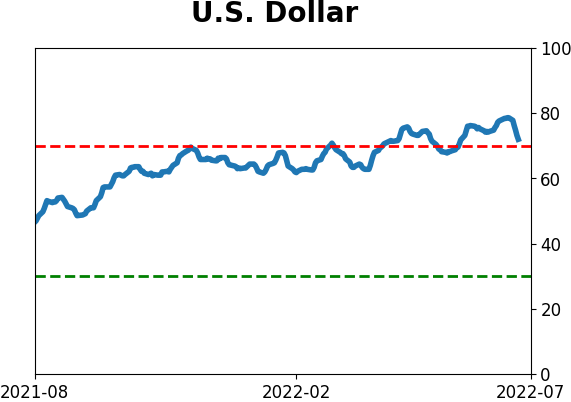
TradingEdge Weekly for Jul 22 - More bets on a crash, historically whippy markets: This week, we saw that small traders continue to bet heavily against stocks. They're closely aligned with Dumb Money, which has been very negative for a very long time. Recent thrusts will need to overcome what has been a very poor trend, especially among emerging markets. Using inflation to switch between Discrectionary and Staples has been a winning move. Traders have finally given up on gold. The latest Commitments of Traders report was released, covering positions through Tuesday: The 3-Year Min/Max Screen shows that "smart money" commercial hedgers continued a rather drastic amount of short-covering in metals, especially gold and even more so, silver. In silver, hedgers are now holding less than 6% of open interest net short, the least in three years. The Backtest Engine shows that silver showed gains during the next three months after 23 out of 30 weeks when commercials held this few shorts. The losses were all relatively small for such a volatile market. They've started to cover heavy bets against the U.S. dollar, typically what happens as the dollar is peaking, which would further support metals prices. Hedgers have more aggressively sold down their large net long position in 10-year Treasuries but continue to add or hold to large net longs in major equity index futures, especially the S&P 500 mini contract and Russell 2000. |
Smart / Dumb Money Confidence
|
|
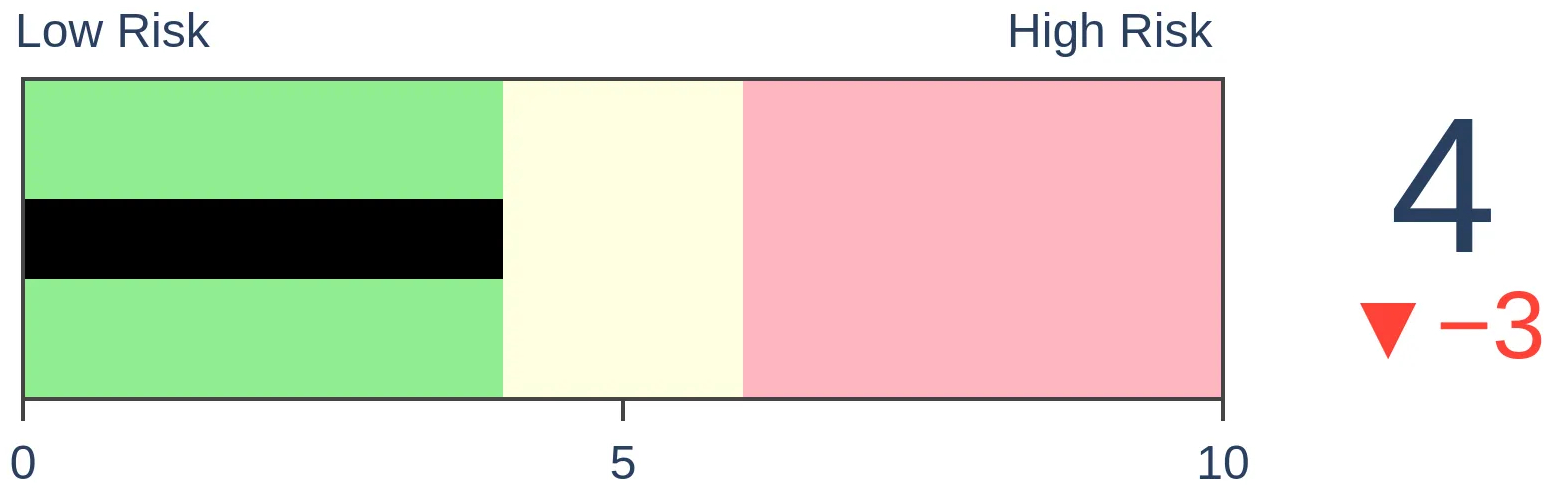
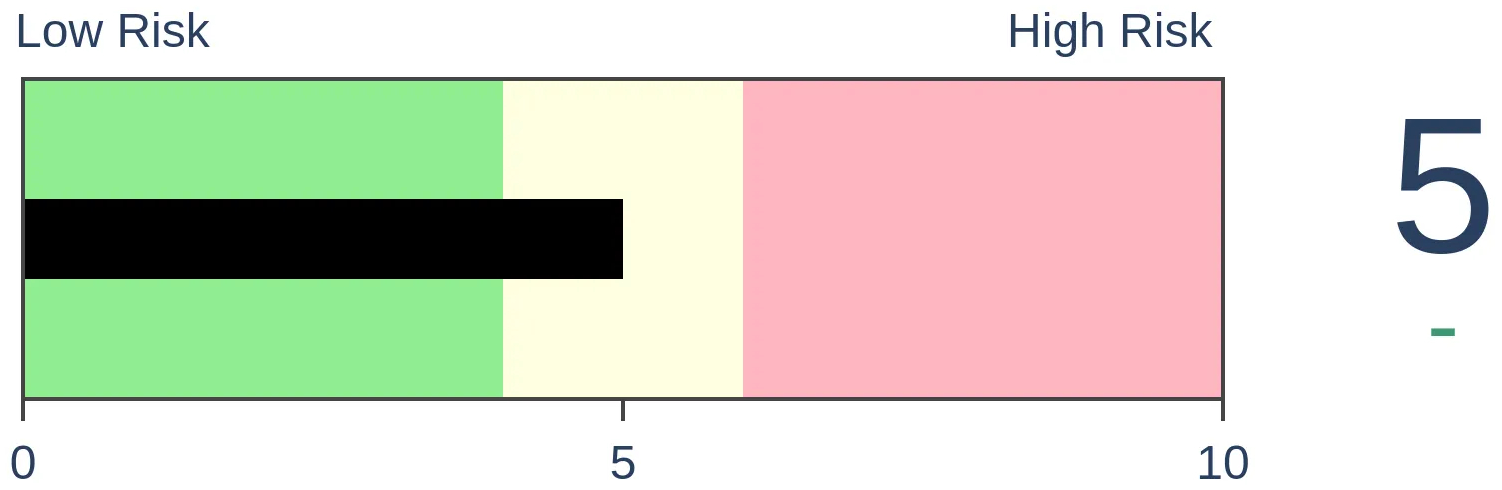
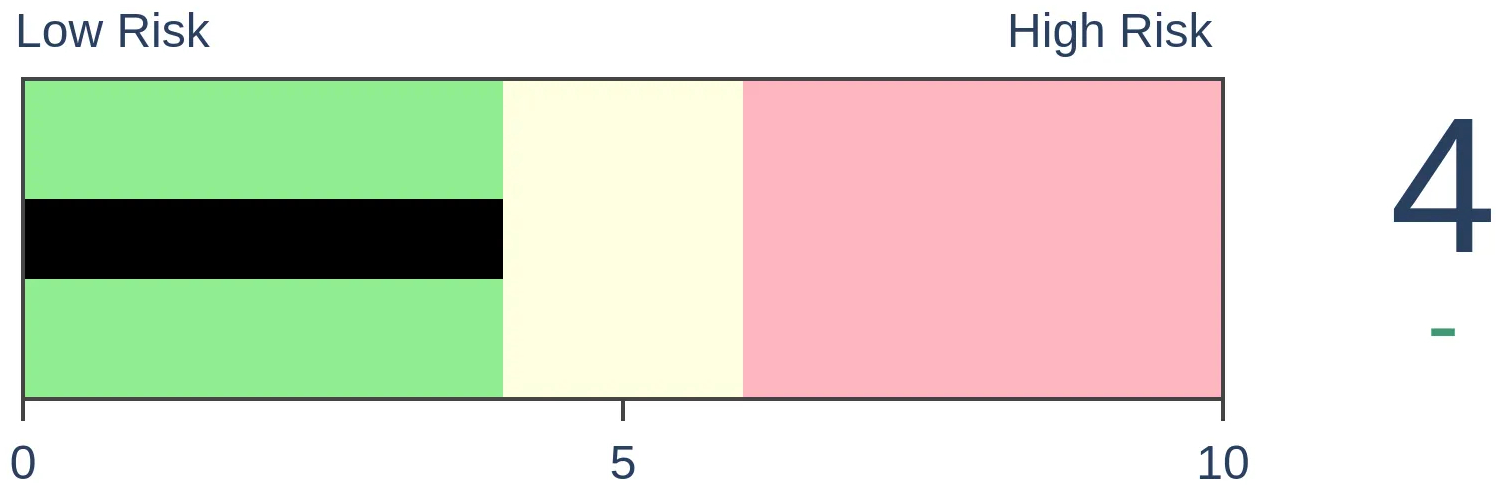
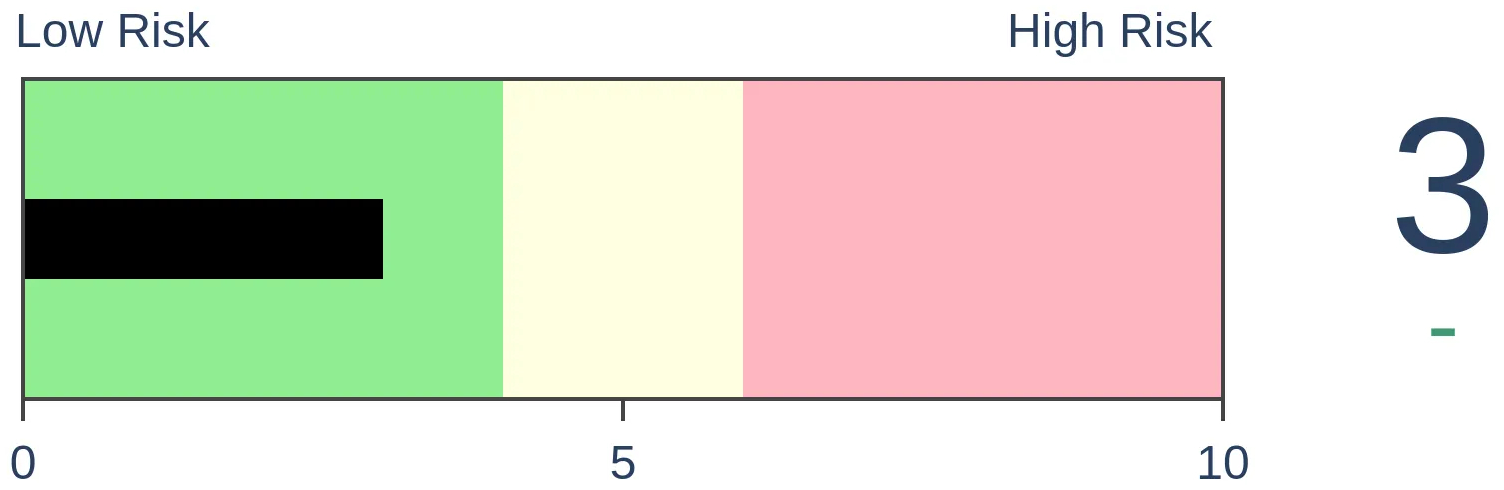
Risk Levels
|

|
|

Research
TradingEdge Weekly for Jul 22 - More bets on a crash, historically whippy marketsBy Jason GoepfertBOTTOM LINEThis week, we saw that small traders continue to bet heavily against stocks. They're closely aligned with Dumb Money, which has been very negative for a very long time. Recent thrusts will need to overcome what has been a very poor trend, especially among emerging markets. Using inflation to switch between Discrectionary and Staples has been a winning move. Traders have finally given up on gold. FORECAST / TIMEFRAME |
Key points:
- Small options traders keep paying up to protect against a crash
- Dumb Money has been very confident, and very bearish, for a long time
- The market environment just will not turn positive
- Sentiment is so poor partly because markets have been historically whippy
- A major challenge remains the negative trend in the most benchmarked index in the world
- Emerging markets face an even greater challenge, with all of them underperforming the S&P 500
- Small-cap stock breadth has been extremely bad but is getting better
- Using inflation to switch between Consumer Discretionary and Consumer Staples stocks, using indexes or ETFs
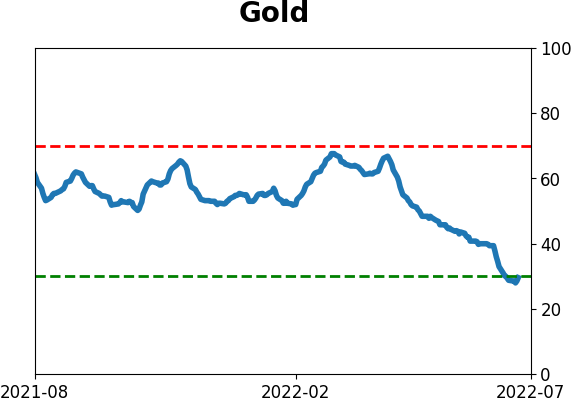
- Sentiment toward gold has plunged
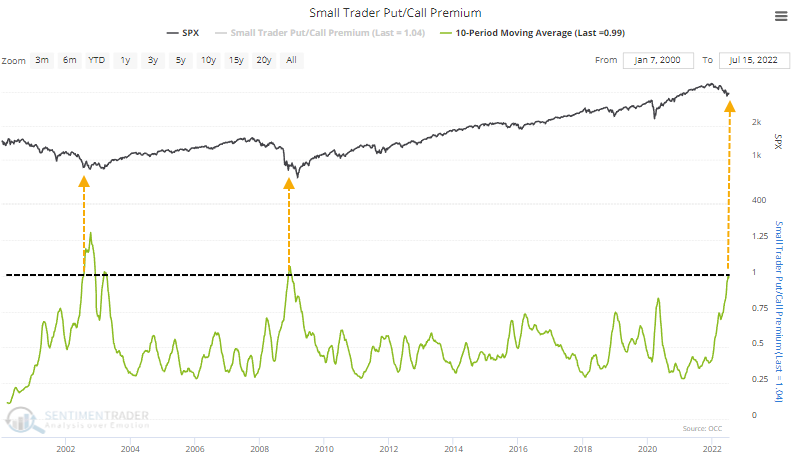
Small traders keep betting on a crash
Small options traders have been slowly giving up the ship. Now, they're actively betting it's going to sink.
They're still focusing heavily on put options, spending about 30% of their volume on bets that stocks will drop quickly. This is remarkable because there have been only two times in 22 years when they've spent so much of their volume on put options - during the fraud scare meltdown in July/August/September 2002 and during the pandemic.
Even though implied volatility has come down, small traders are still paying up for these puts. Over the past ten weeks, they've spent $39.7 billion on put options and $39.6 billion on call options.
It's extremely rare for them to spend more on leveraged, expiring bets that stocks will fall than they spend on bets that stocks will rise. It takes a devastating decline to change mass psychology this much, so the only two precedents were the two worst bear markets in recent memory.
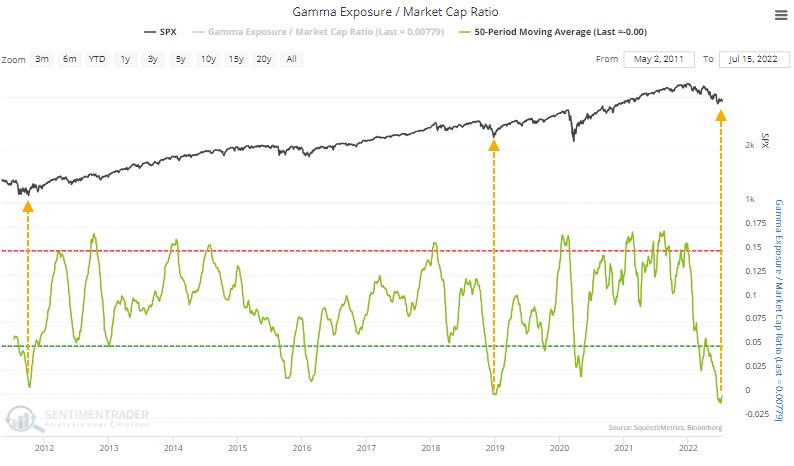
On the flip side of these trades are often dealers, who often have to hedge their book by buying or selling the underlying securities. That's the essence of Gamma Exposure. As a percentage of S&P 500 market capitalization, gamma exposure has been negative, suggesting that dealers would have to buy stocks to hedge their options positions on further declines. In fact, the 50-week average just turned negative for the first time; the only times it even got close were in October 2011 and December 2018.
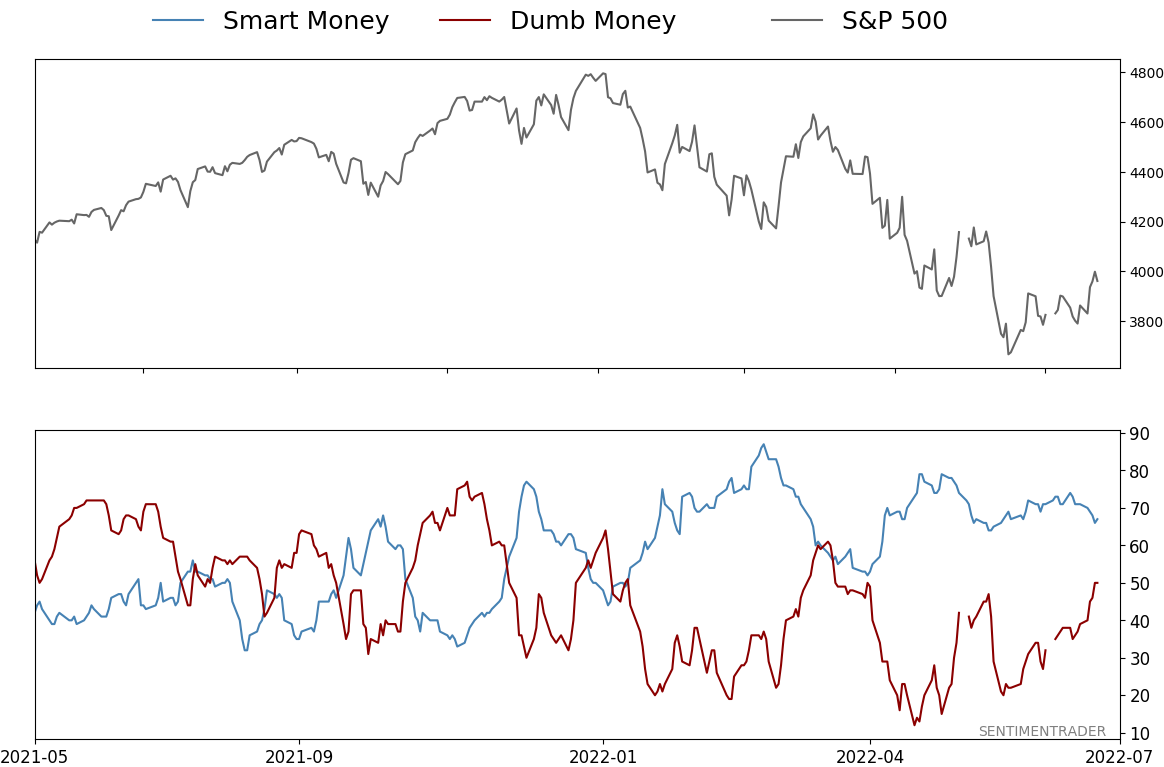
The Dumb Money has been negative, and confident, for a long time
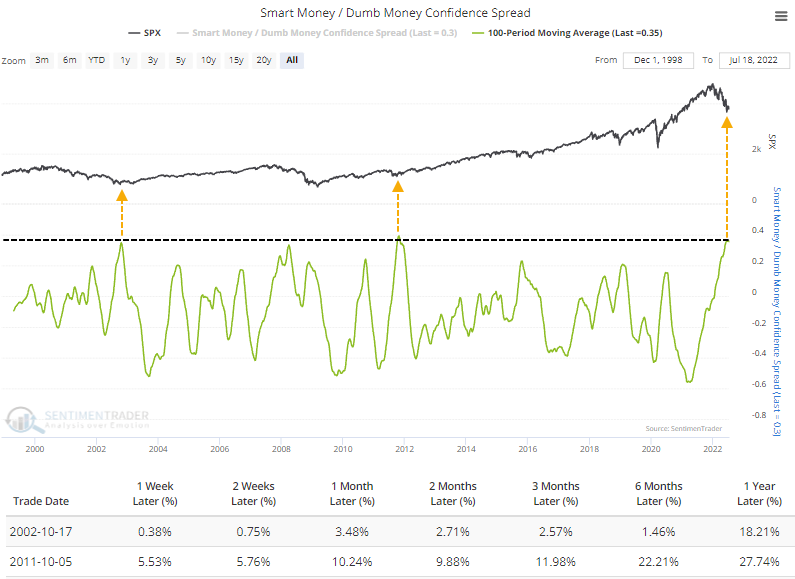
Sentiment toward stocks needs to be pervasively negative for an extended time to make options traders so confident in buying leveraged, expiring contracts on even more of a decline. And indeed, it has. The 100-day average of Dumb Money Confidence has dropped to the 2nd-lowest level since we began calculating this in 1998.
Since there are two sides to every coin, there are investors who tend to take the opposite positions of the pure trend-followers in the Dumb Money group. So, Smart Money Confidence is also nearing a record high over the past 100 days.
With both indicators at extremes, it stands to reason that the spread between them is also near record territory. The only times in almost 25 years when the 100-day average spread reached this level were October 2002 and October 2011. Long-term returns were excellent after both.
The pervasive negativity has spread from buyers of money-losing crap and frauds to late adopters of growth stocks to bullish trend-followers to pretty much everyone.
The latest survey of professional money managers by Bank of America showed a stunning drop in sentiment in July. The net percentage of managers who stated they were overweight equities plunged to -44%, the 2nd-lowest level in 20 years. The only time these managers felt more pessimistic about stocks was when the global financial system was on the verge of collapse.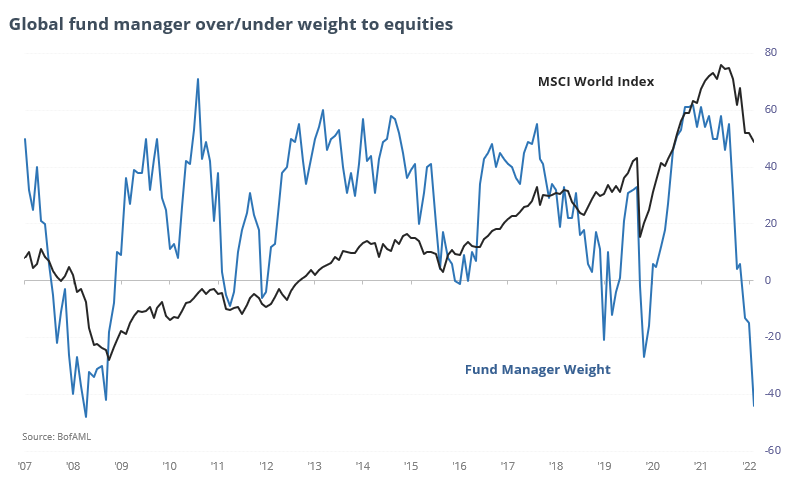
A persistently bad environment
As late as April, we've been waiting (and waiting and waiting) for the environment to turn more positive. It refuses.
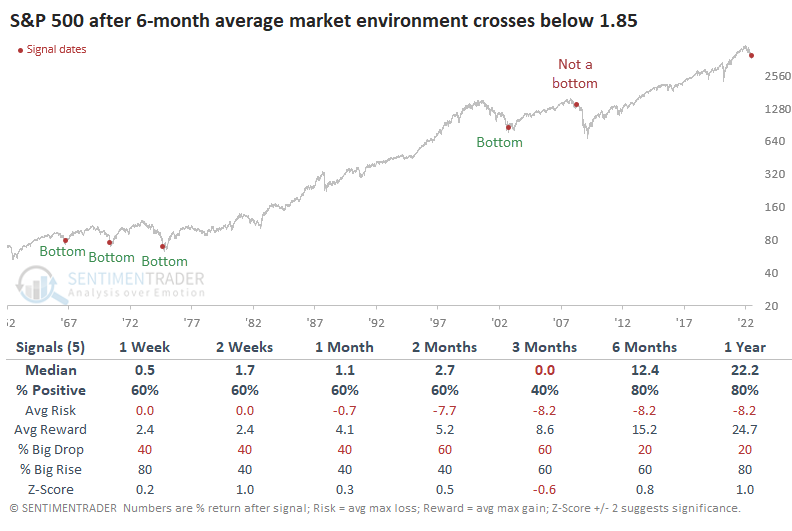
Like so many other factors we've discussed in recent weeks, about the only potential positive from the bad market environment is just how bad it has been and for how long. More notable is just how hostile the environment has been. It hasn't just been "not positive," it has been downright wretched. Many days had only 1 or 2 healthy factors. So, the average daily score of the market environment has dived below 2.0, again the worst since 2009. The current 6-month average ranks in the bottom 2% of all readings since 1962.
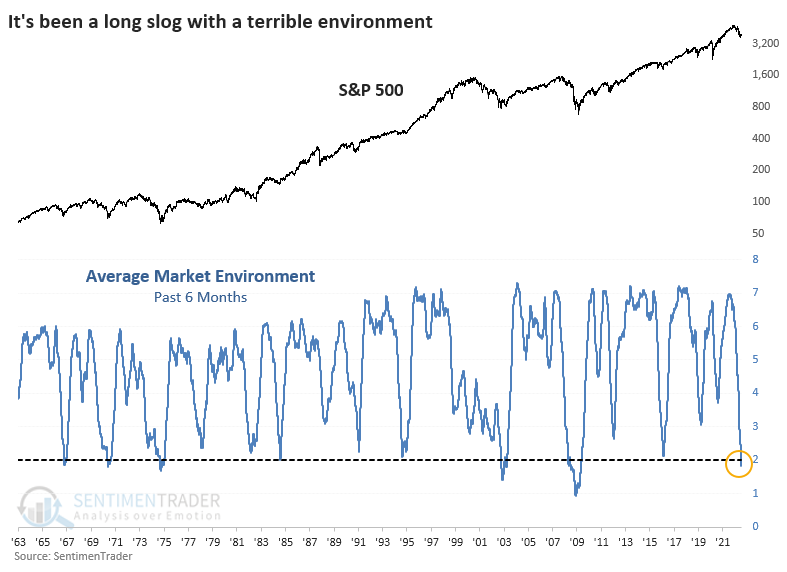
The handful of times it got this bad, for this long, it coincided with the end games of bear markets...except once. And that once was a doozy, again during the financial crisis. Buying stocks just because of the bad environment would have meant a world of hurt for investors.
Historically whippy markets are partly to blame
Stocks have been whipping back and forth based on the latest headlines, Fed rumors, and earnings reports. Sometimes those whips have occurred during the day, or even multiple times during a day. Bloomberg notes that this has been one of the whippiest years in decades.
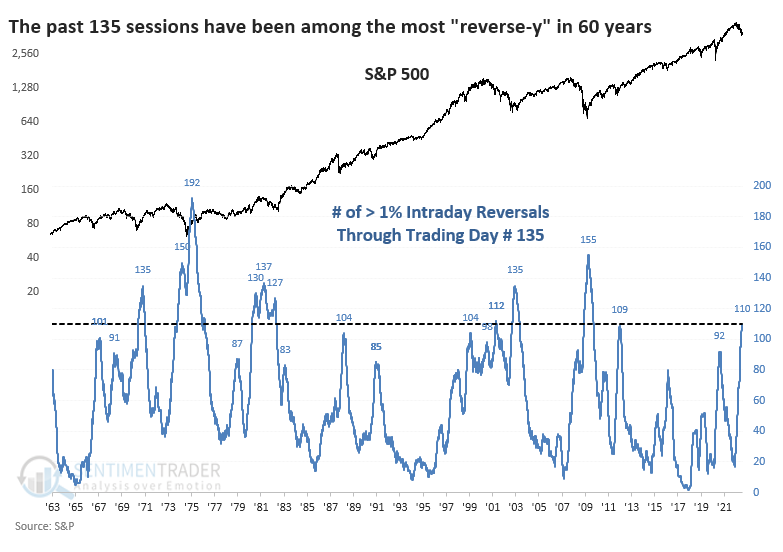
Since our intraday data begins in 1962, we can look for times when the S&P 500 closed 1% or more below its intraday high or 1% or more above its intraday low. Using that methodology, through 135 days in the year, 2022 has had the 2nd-most reversals in 40 years, next to 2008.
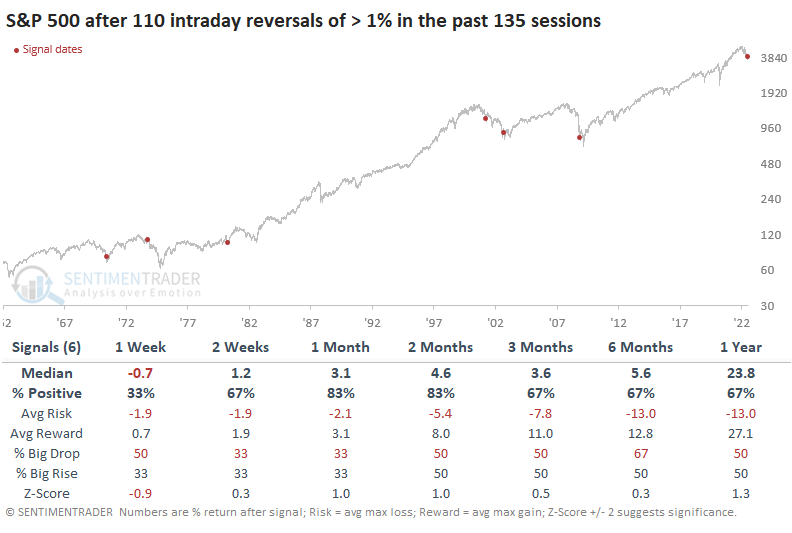
If we remove the calendar constraint and look at the most reversals in any rolling 135-day span, this latest stretch has been the most "reverse-y" since 2009 and ranks as one of the whippiest in at least 60 years.
After similar periods that were prone to reversals, the S&P's returns were mostly good. A few dates (1967, 1987, 2011) just barely missed the cutoff; including those would have boosted the S&P's forward returns even more. There was really only one failure that didn't lead to any meaningful or lasting upside, in 1973. That date is a bit of a bugger because it's shown up in several studies in recent weeks.
One very good sign is that buyers seem eager to return to riskier assets.
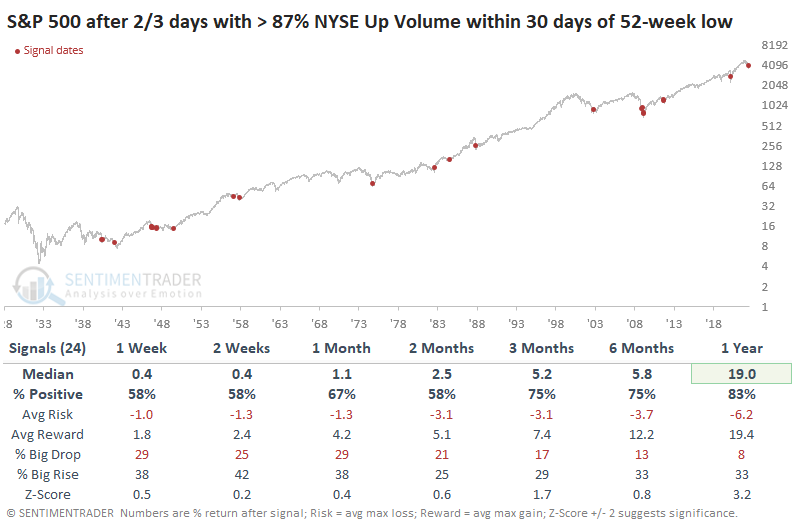
On the NYSE, two out of three sessions enjoyed more than 87% up volume. When the S&P 500 was coming out of a recent 52-week low, this kind of thrust saw double-digit gains over the next year every time since 1962. We have less confidence in the breadth data before then, but even so, returns were mostly good, though more muted.
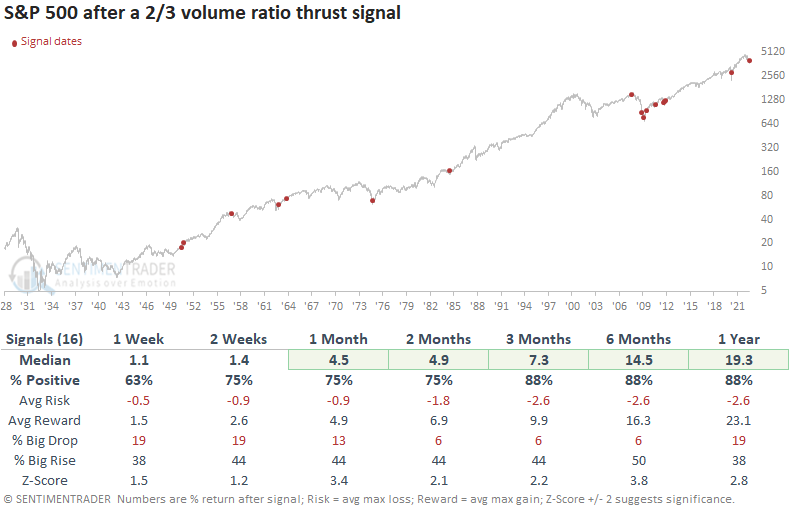
Dean showed a similar signal, showing that a new signal from a voting member in the TCTM Composite Thrust Model issued an alert at the close of trading on Tuesday. The algorithm identifies when the ratio between NYSE up and down volume exceeds 8/1 in 2 out of the last 3 sessions, with the pause coming in the middle. i.e., day 2.
This model generated a signal 16 other times over the past 70 years. After the others, S&P 500 future returns, win rates, and z-scores were excellent across all time frames. The signal shows a gain at some point in the first three months in 14 out of 16 instances.
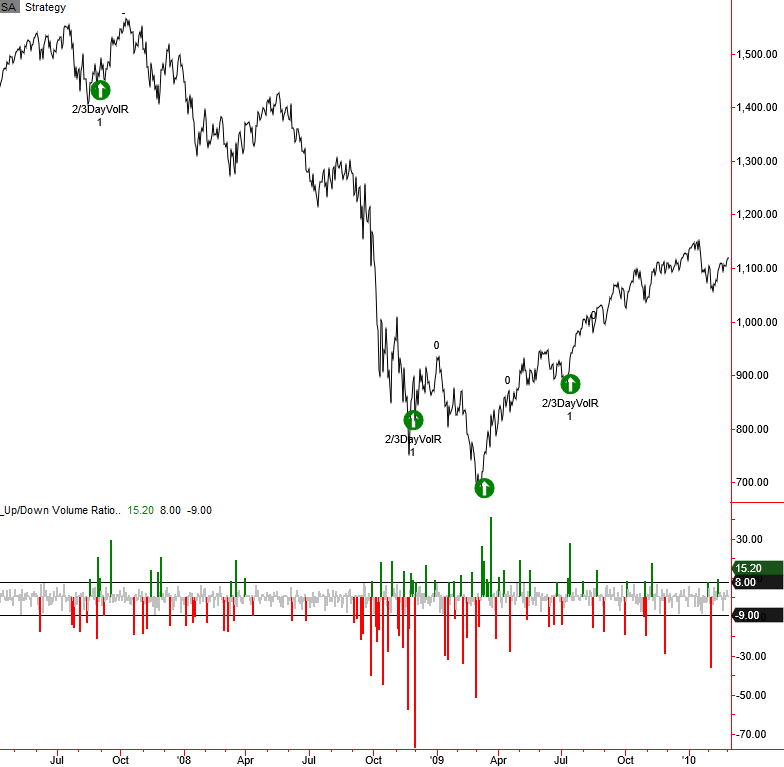
Even during the financial crisis, these signals preceded at least shorter-term gains.
These thrusts need to overcome the persistently negative trend
Dean noted that the S&P 500 closed above its 50-day moving average on Tuesday for the first time in more than 50 sessions. Before the medium-term trend change, the index had closed below the average for 60 sessions and it remains below its 200-day moving average.
For the first time since the global financial crisis, the S&P 500 traded below its 50-day average for 60 consecutive sessions.
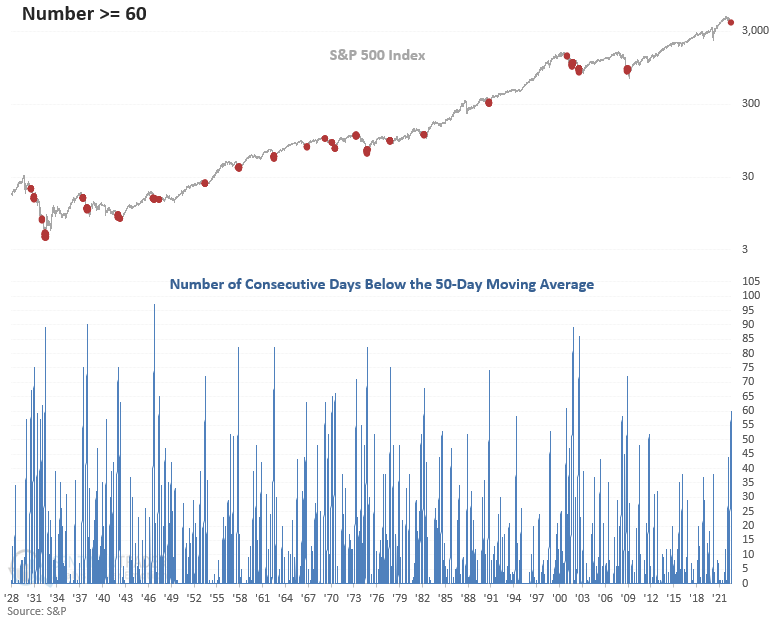
This study generated a signal 35 other times over the past 92 years. After the others, S&P 500 returns, win rates, and z-scores were unfavorable across most short and medium-term time frames, especially the 3 & 6-month windows. The signal had a negative return at some point in the first 2 months in 30 out of 35 instances.
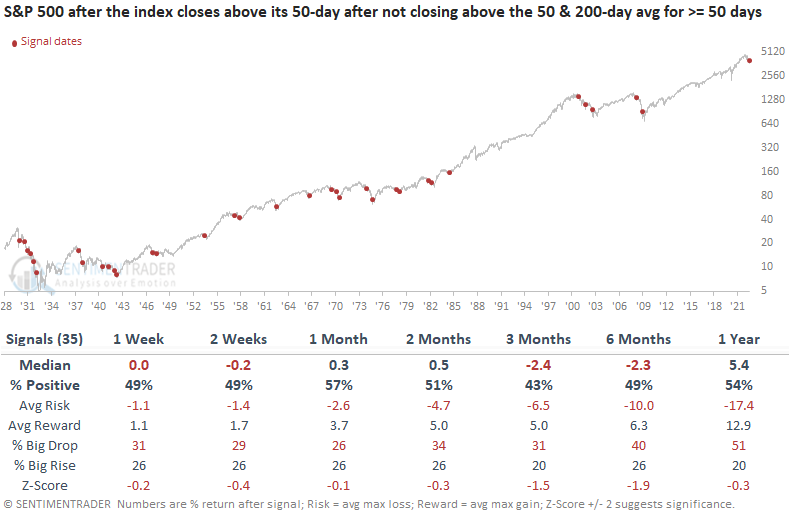
While there have been some positive developments lately, we need to remember that the trend is not our friend. Similar setups to what we're seeing now have preceded flat to negative stock returns across short and medium-term time frames.
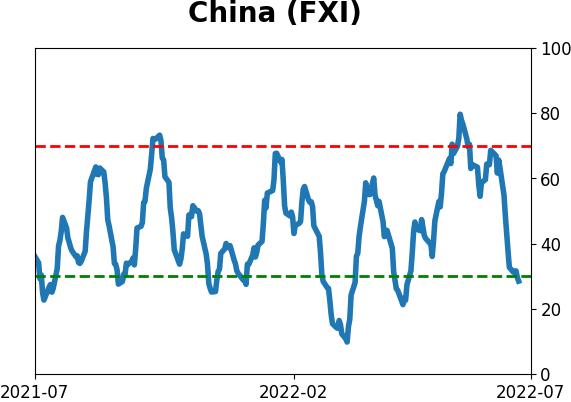
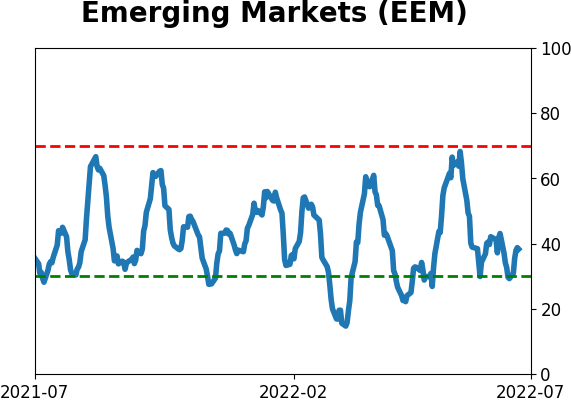
Emerging markets have been even worse
In April, Dean shared a study that suggested one should be mindful that emerging markets could struggle when the dollar index surges over a trailing 6-month period. Since the publish date, an EM index has fallen over 10% and underperformed the S&P 500.
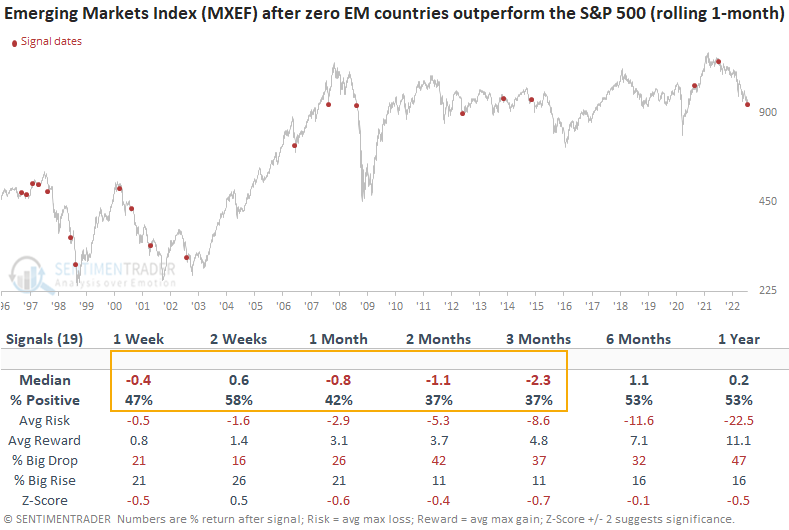
The environment for emerging markets remains challenging, so Dean assessed the outlook for an emerging market index after the percentage of EM country ETFs outperforming the S&P 500 over a rolling 21-day period falls to zero. This is the first time in a year and the 19th time since 1996 that it's happened.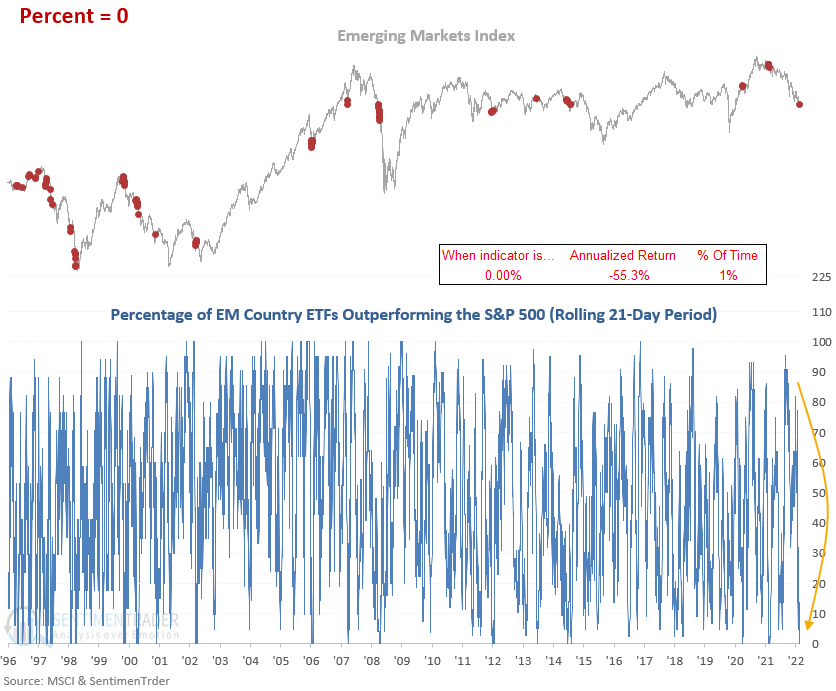
This study generated a signal 19 other times over the past 26 years. After the others, emerging market returns, win rates, and z-scores were unfavorable across short and medium-term time frames. The signal had a negative return at some point in the first 3 months in 17 out of 19 instances.
Small caps haven't been any great shakes, either
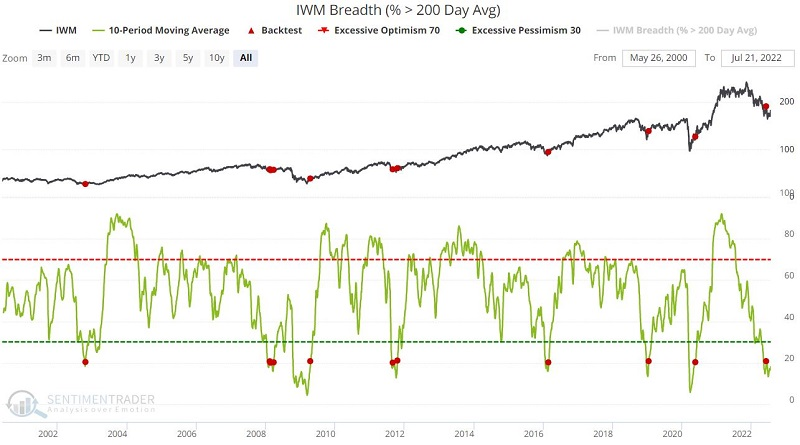
Jay noted that small caps have underperformed larger stocks for many years. The tide may be beginning to turn in favor of small caps and several breadth indicators suggest impending strength for small caps.
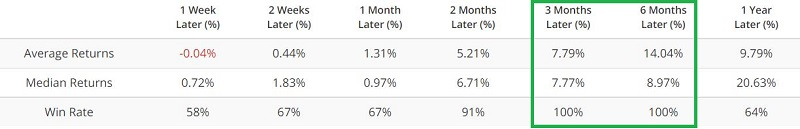
The 10-day average of IWM component stocks above their 200-day moving average has been stuck below 20% again. Simply waiting for the 10-day average of this indicator to rise back above 20 may be the best play for patient small cap investors. The chart and table below display those days when the 10-day average rose back above 20 and IWM performance results. Note that both 3-month and 6-month holding periods showed a gain 100% of the time.
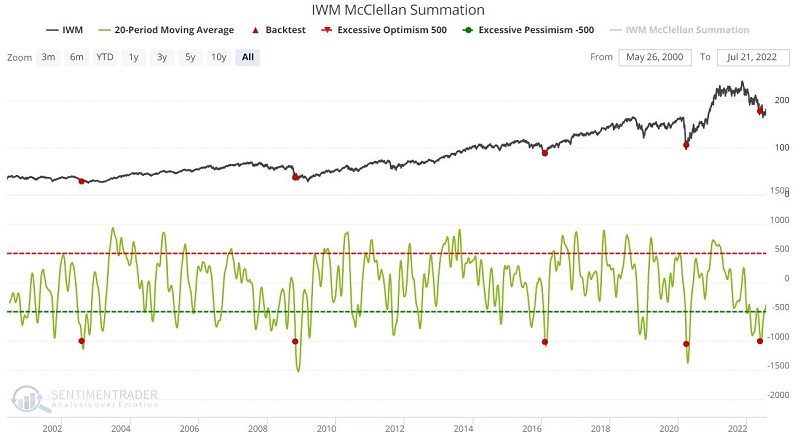
Another display of long-term breadth, the McClellan Summation Index, has seen its 20-day moving average cross below -1000 for the first time in six months. It has subsequently turned higher and has been rising. While the sample size is tiny, IWM showed longer-term gains after each of the other precedents.
One worry is seasonality. We have just entered a period of seasonal weakness, extending from Trading Day of the Year #137 through TDY # 155. For 2022 this period extends from the close on 7/20/2022 through the close on 8/15/2022.
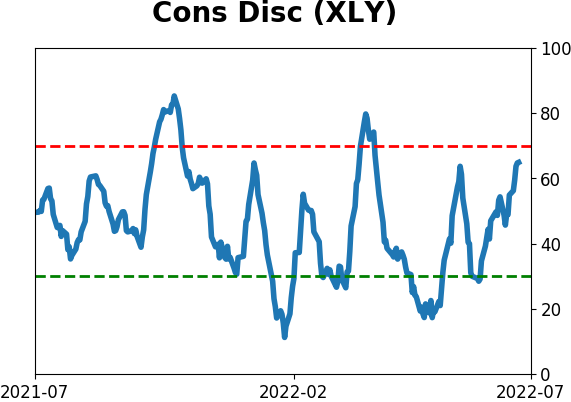
Using inflation to switch between consumer factors
It is well-established that extremes in inflation have a profound impact on how consumers spend their money. Jay noted that what is less well understood is exactly how the relationship between Consumer Staples and Consumer Discretionary are affected by changes in inflation.
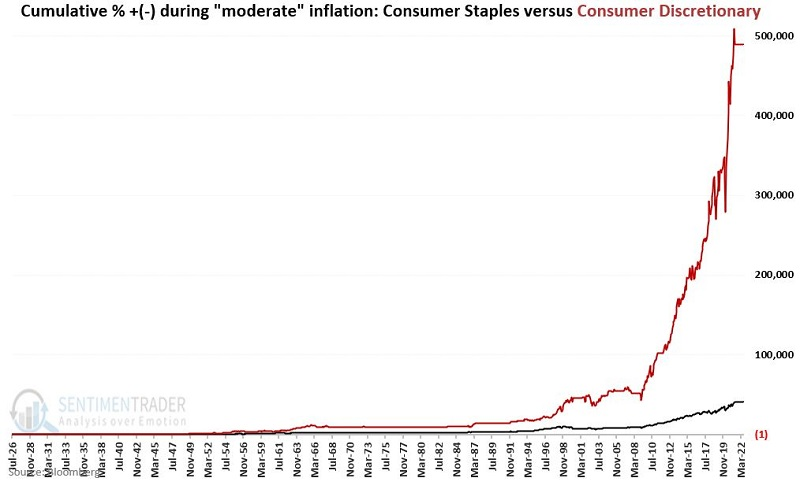
In the long run, Consumer Discretionary has significantly outperformed when inflation is moderate and vice-versa.
We will measure inflation using the 12-month rate of change in the Consumer Price Index. We define "moderate" inflation as any 12-month CPI % change between +3 and -3%.
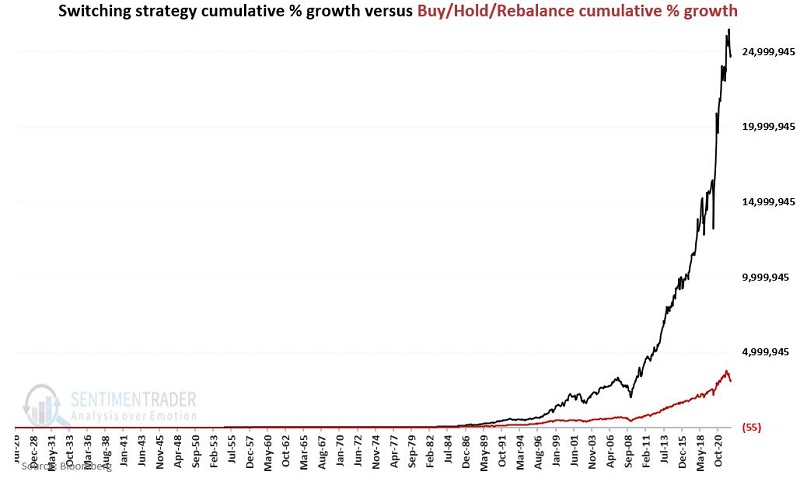
The 12-month CPI % change has been moderate 55% of the time. The chart below displays the cumulative % growth of an investment in Consumer Discretionary (red line) and Consumer Staples (black line) ONLY during periods of moderate inflation.
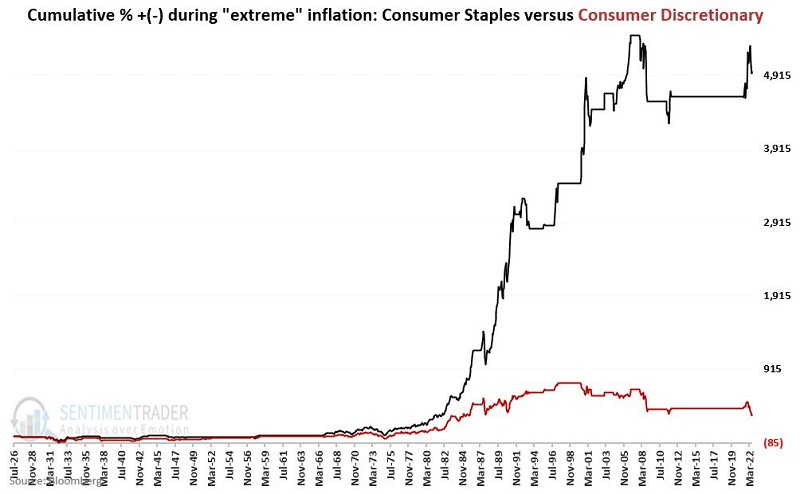
We define "extreme" inflation as any 12-month CPI % change above +3 or below -3%, which has occurred 45% of the time. The chart below displays the cumulative % growth of an investment in Discretionary (red line) and Staples (black line) ONLY during periods of extreme inflation.
Let's compare a simple switching methodology to a Buy/Hold/Rebalance approach to fully illustrate the effect of switching between staples and discretionary based on inflation.
If a month ends with CPI % <= +3% and >=-3% then hold Discretionary. If a month ends with CPI % > +3% or < -3% then hold Staples. We'll compare this to a yearly rebalanced 50/50 split between the two sectors. Clearly, the switching strategy provided more impressive growth.
Since it's not always practical to use an index, Jay also calculated the switching strategy using popular ETFs for Staples (XLP) and Discretionary (XLY).
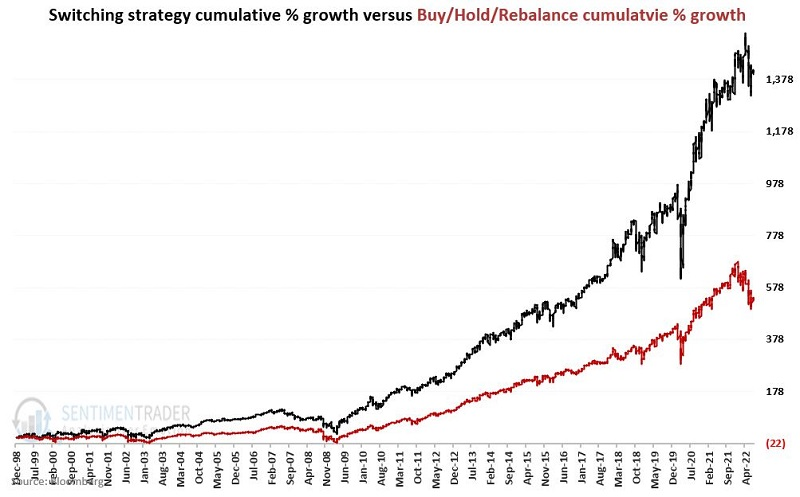
Since the funds' inception, the switching strategy would have returned +1,397% versus +534% for the 50/50 rebalancing strategy.
Gold sentiment has plunged
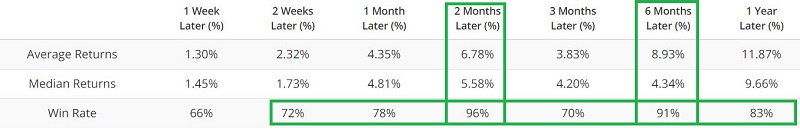
Jay showed that our Optimism Index on gold recently hit a level that has seen a high percentage of up moves in the past. Also, a relationship that may raise eyebrows is the one between bond volatility and gold stocks.
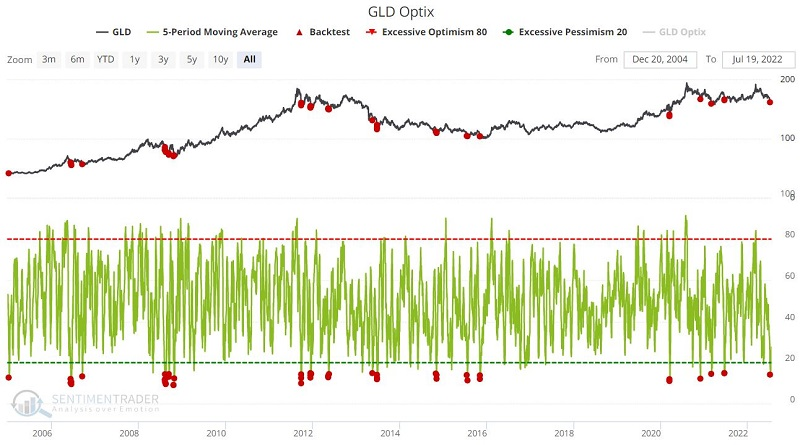
Few markets have disappointed investors more than gold so far in 2022. While gold has held up better than stocks and bonds, the performance in the face of soaring inflation was dismal. Traders finally threw in the towel on gold recently.
The chart below displays ticker GLD (SPDR Gold Shares) and the 5-day average for GLD Optix. The red dots represent those times when the indicator was below 15%.
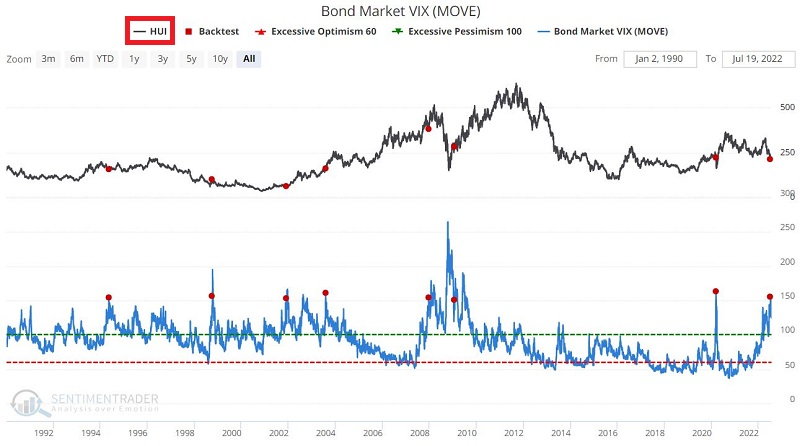
Ticker HUI is the ticker for the Gold Bugs Index, an index that tracks various gold mining stocks. The Bond MOVE Index is essentially the VIX Index for bonds and tracks the implied volatility of options on treasury bond futures.
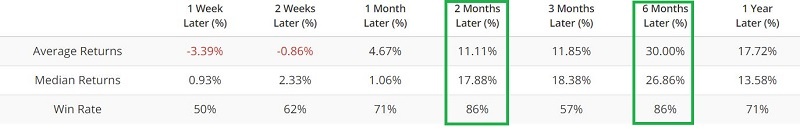
The chart below displays HUI and those times when the Bond MOVE Index has crossed above 150 for the first time in 12 months. The table below displays the performance for HUI following previous signals.
One additional factor to consider: gold has entered a seasonally favorable time of year.
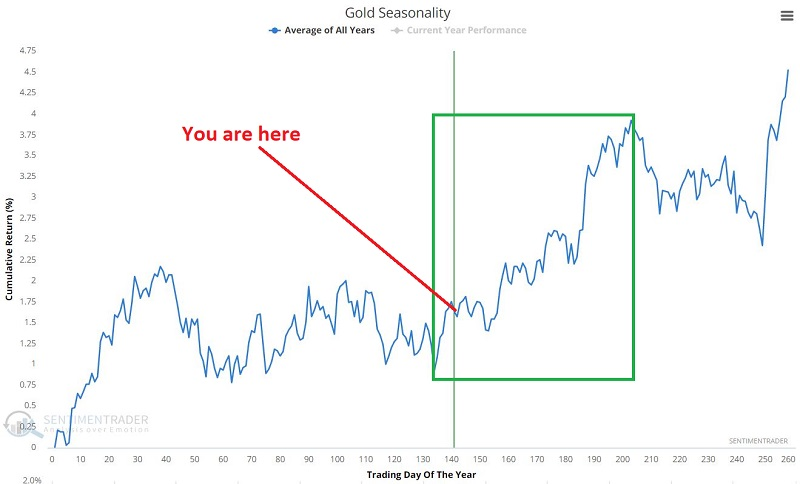
Seasonality should rarely be relied upon as a standalone indicator when deciding what to trade. But when it confirms other signals, it can be beneficial in spotting good opportunities.
About TradingEdge Weekly...
The goal of TradingEdge Weekly is to summarize the research published to SentimenTrader over the past week. Sometimes there is a lot to digest and this summary is meant to highlight the highest conviction or most compelling ideas we discussed. This is NOT the full research that's published, rather it pulls out some of the most relevant parts. It includes links to the published research for convenience; if you don't subscribe to those products it will present the options for access.
Indicators at Extremes
|
|
|
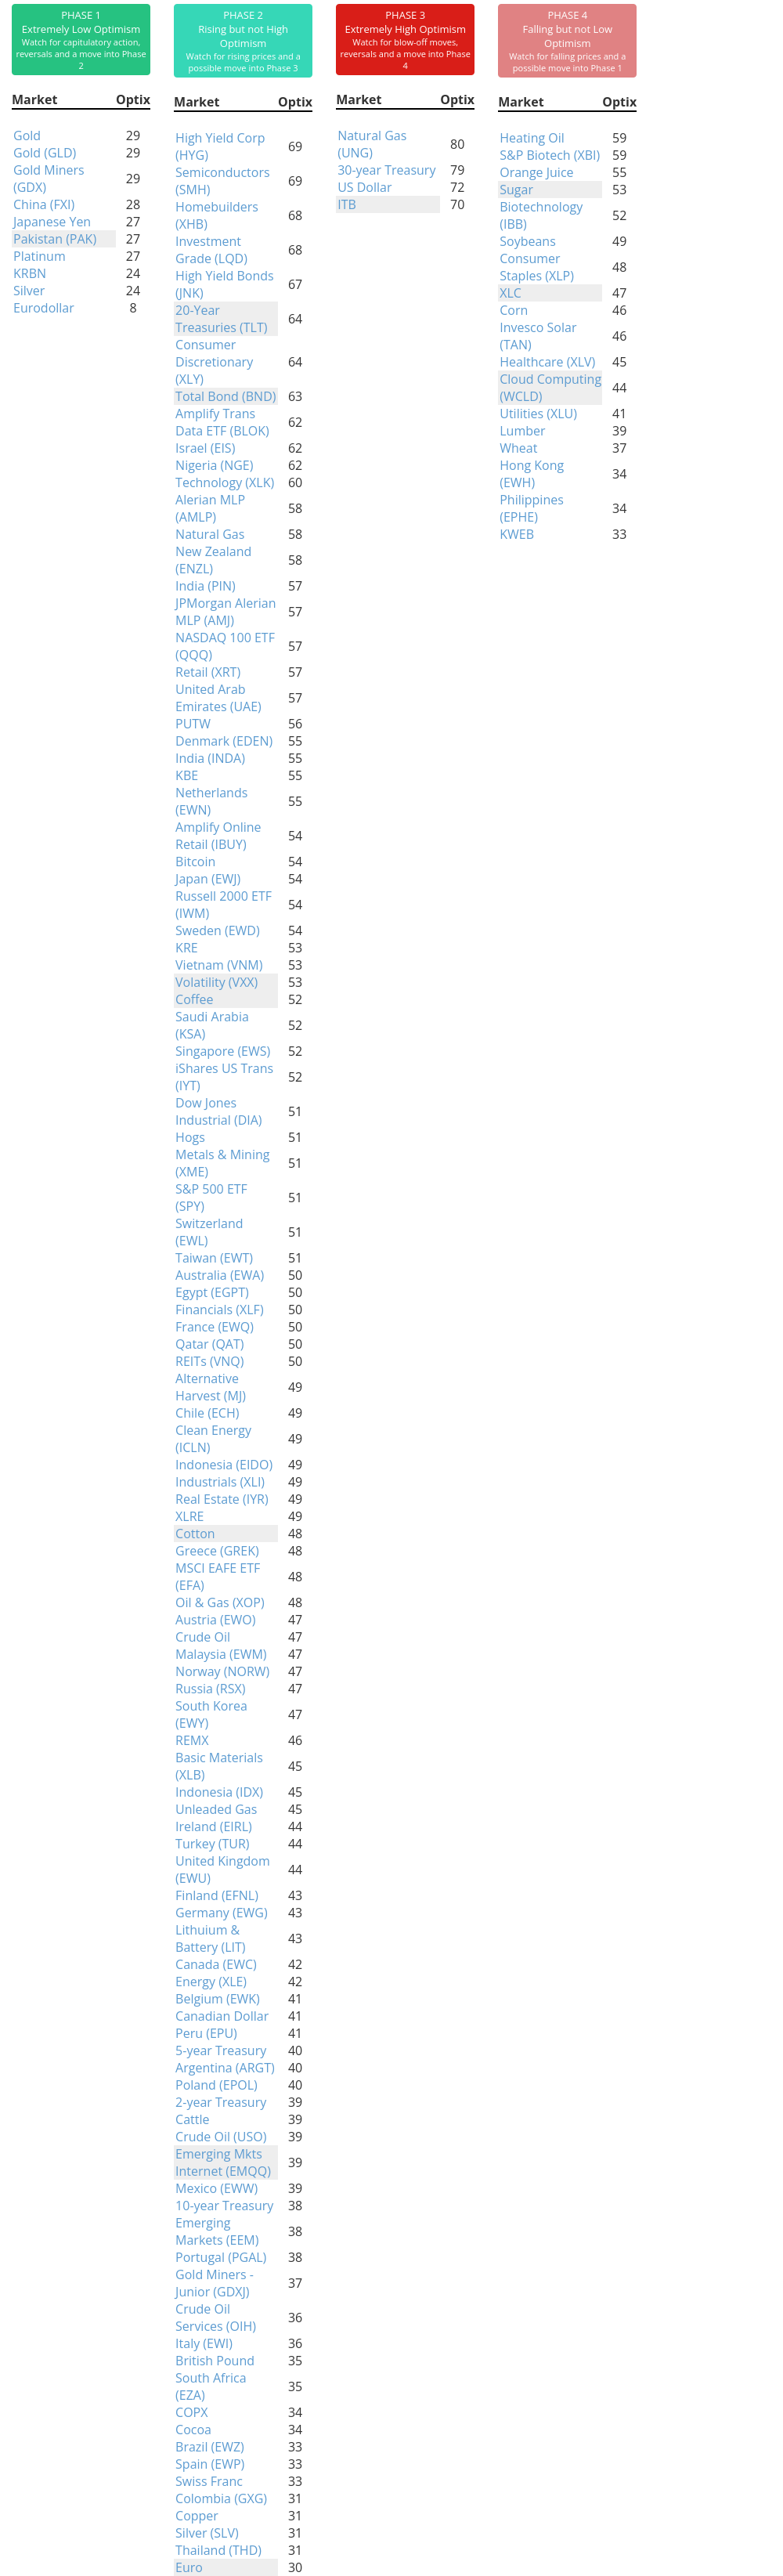
Phase Table
|
|
|
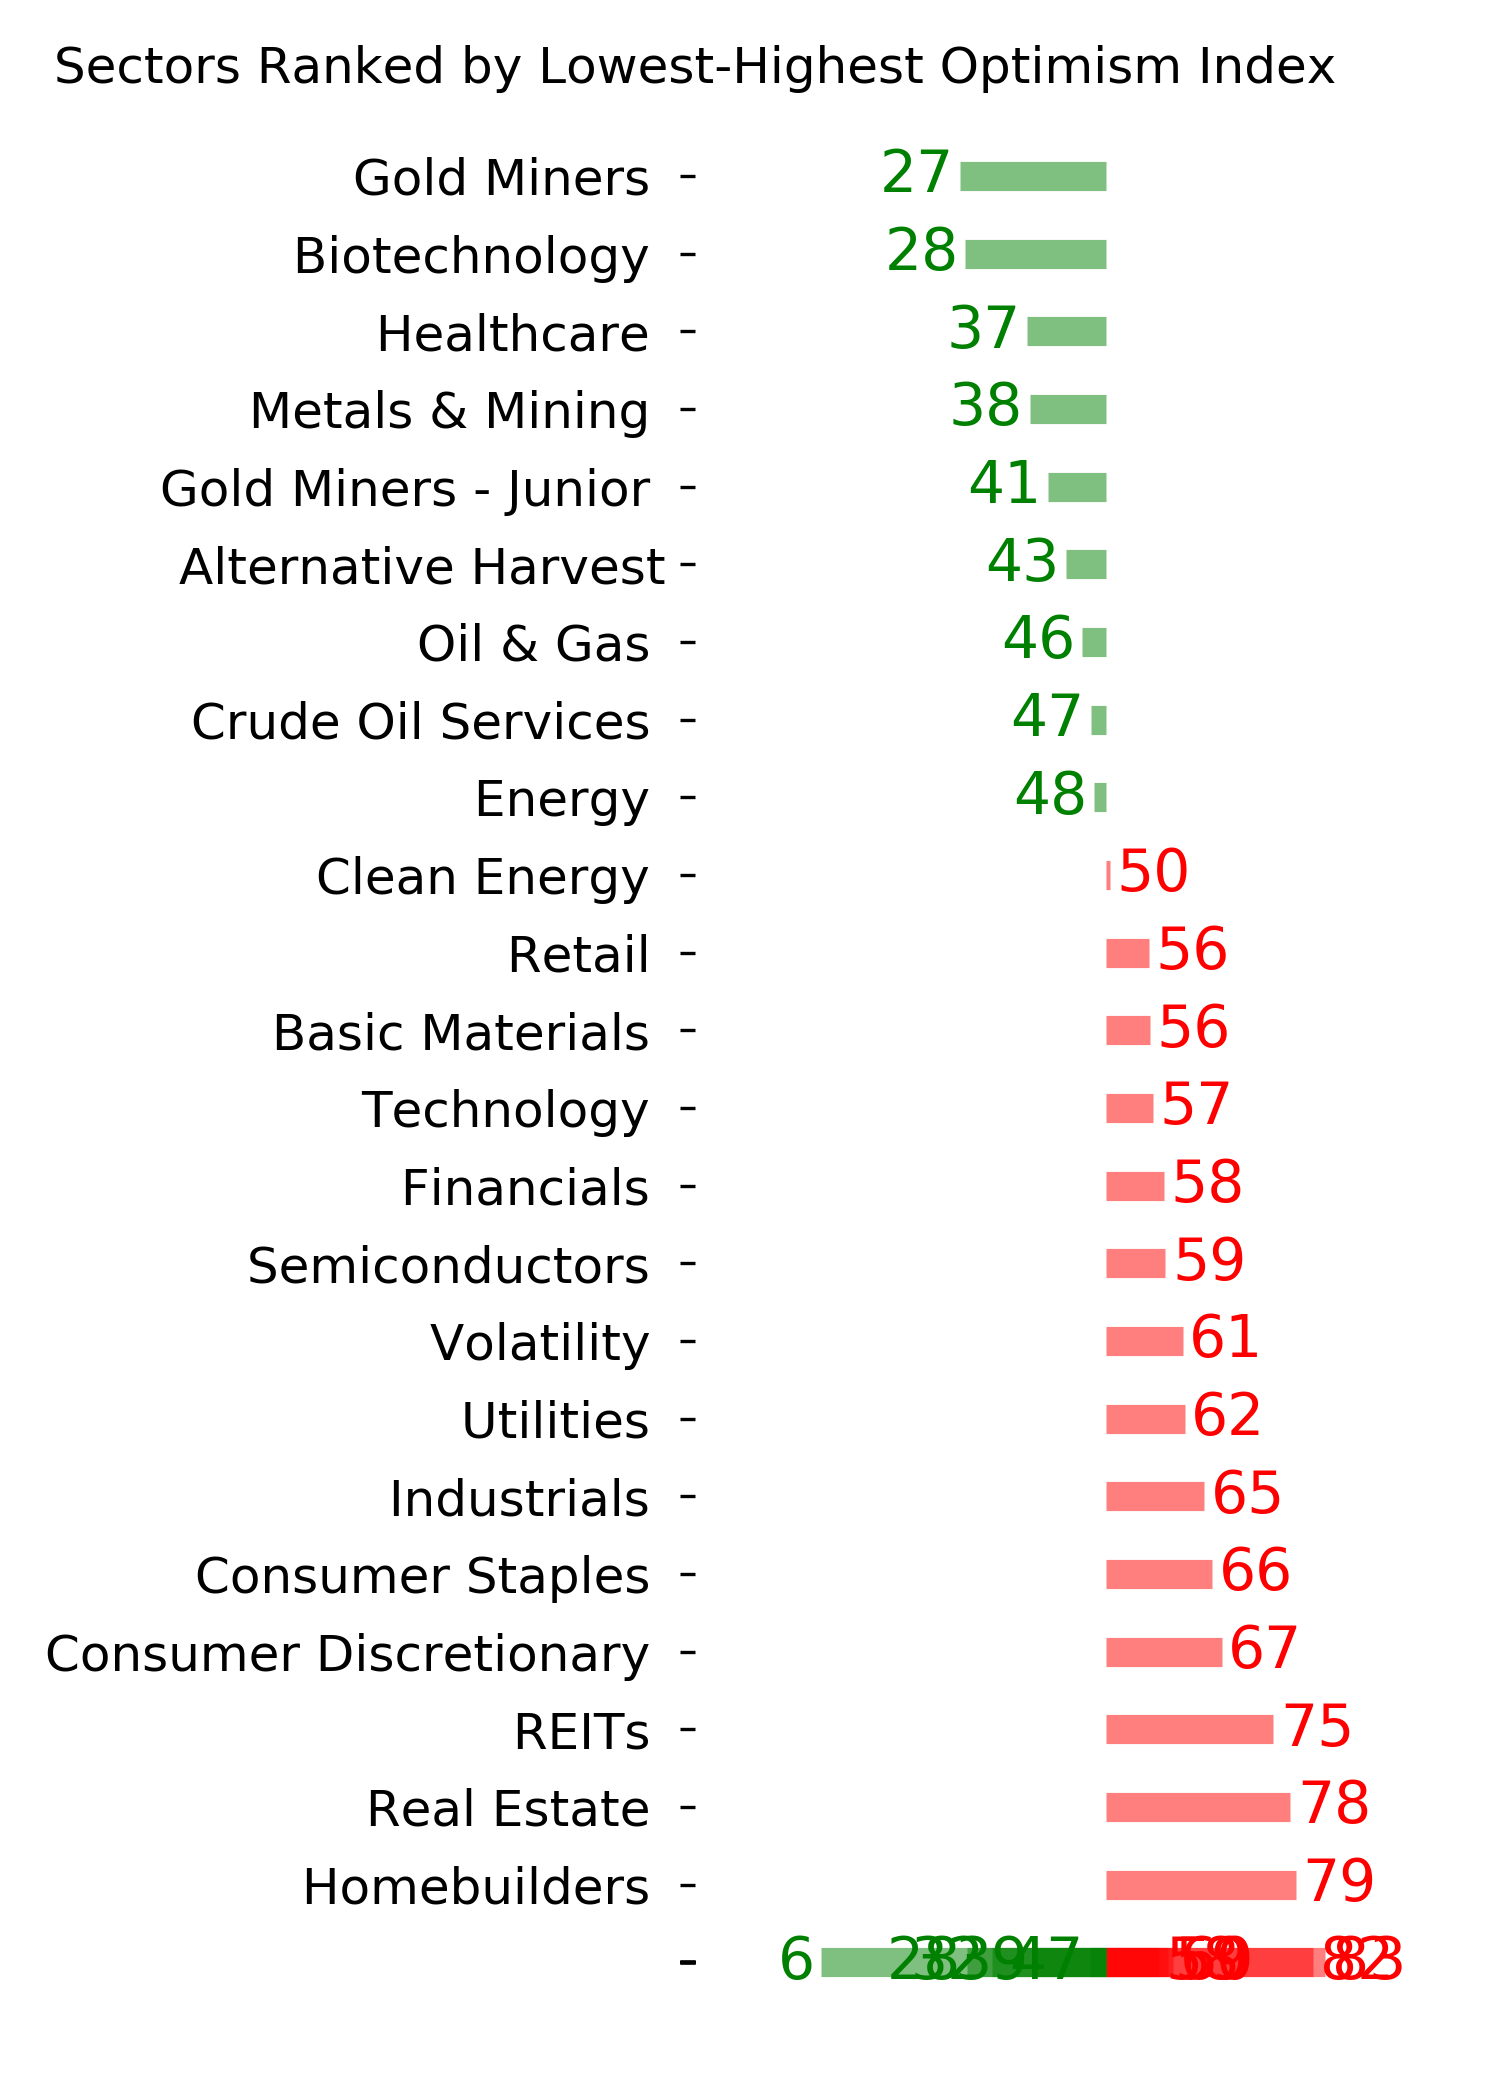
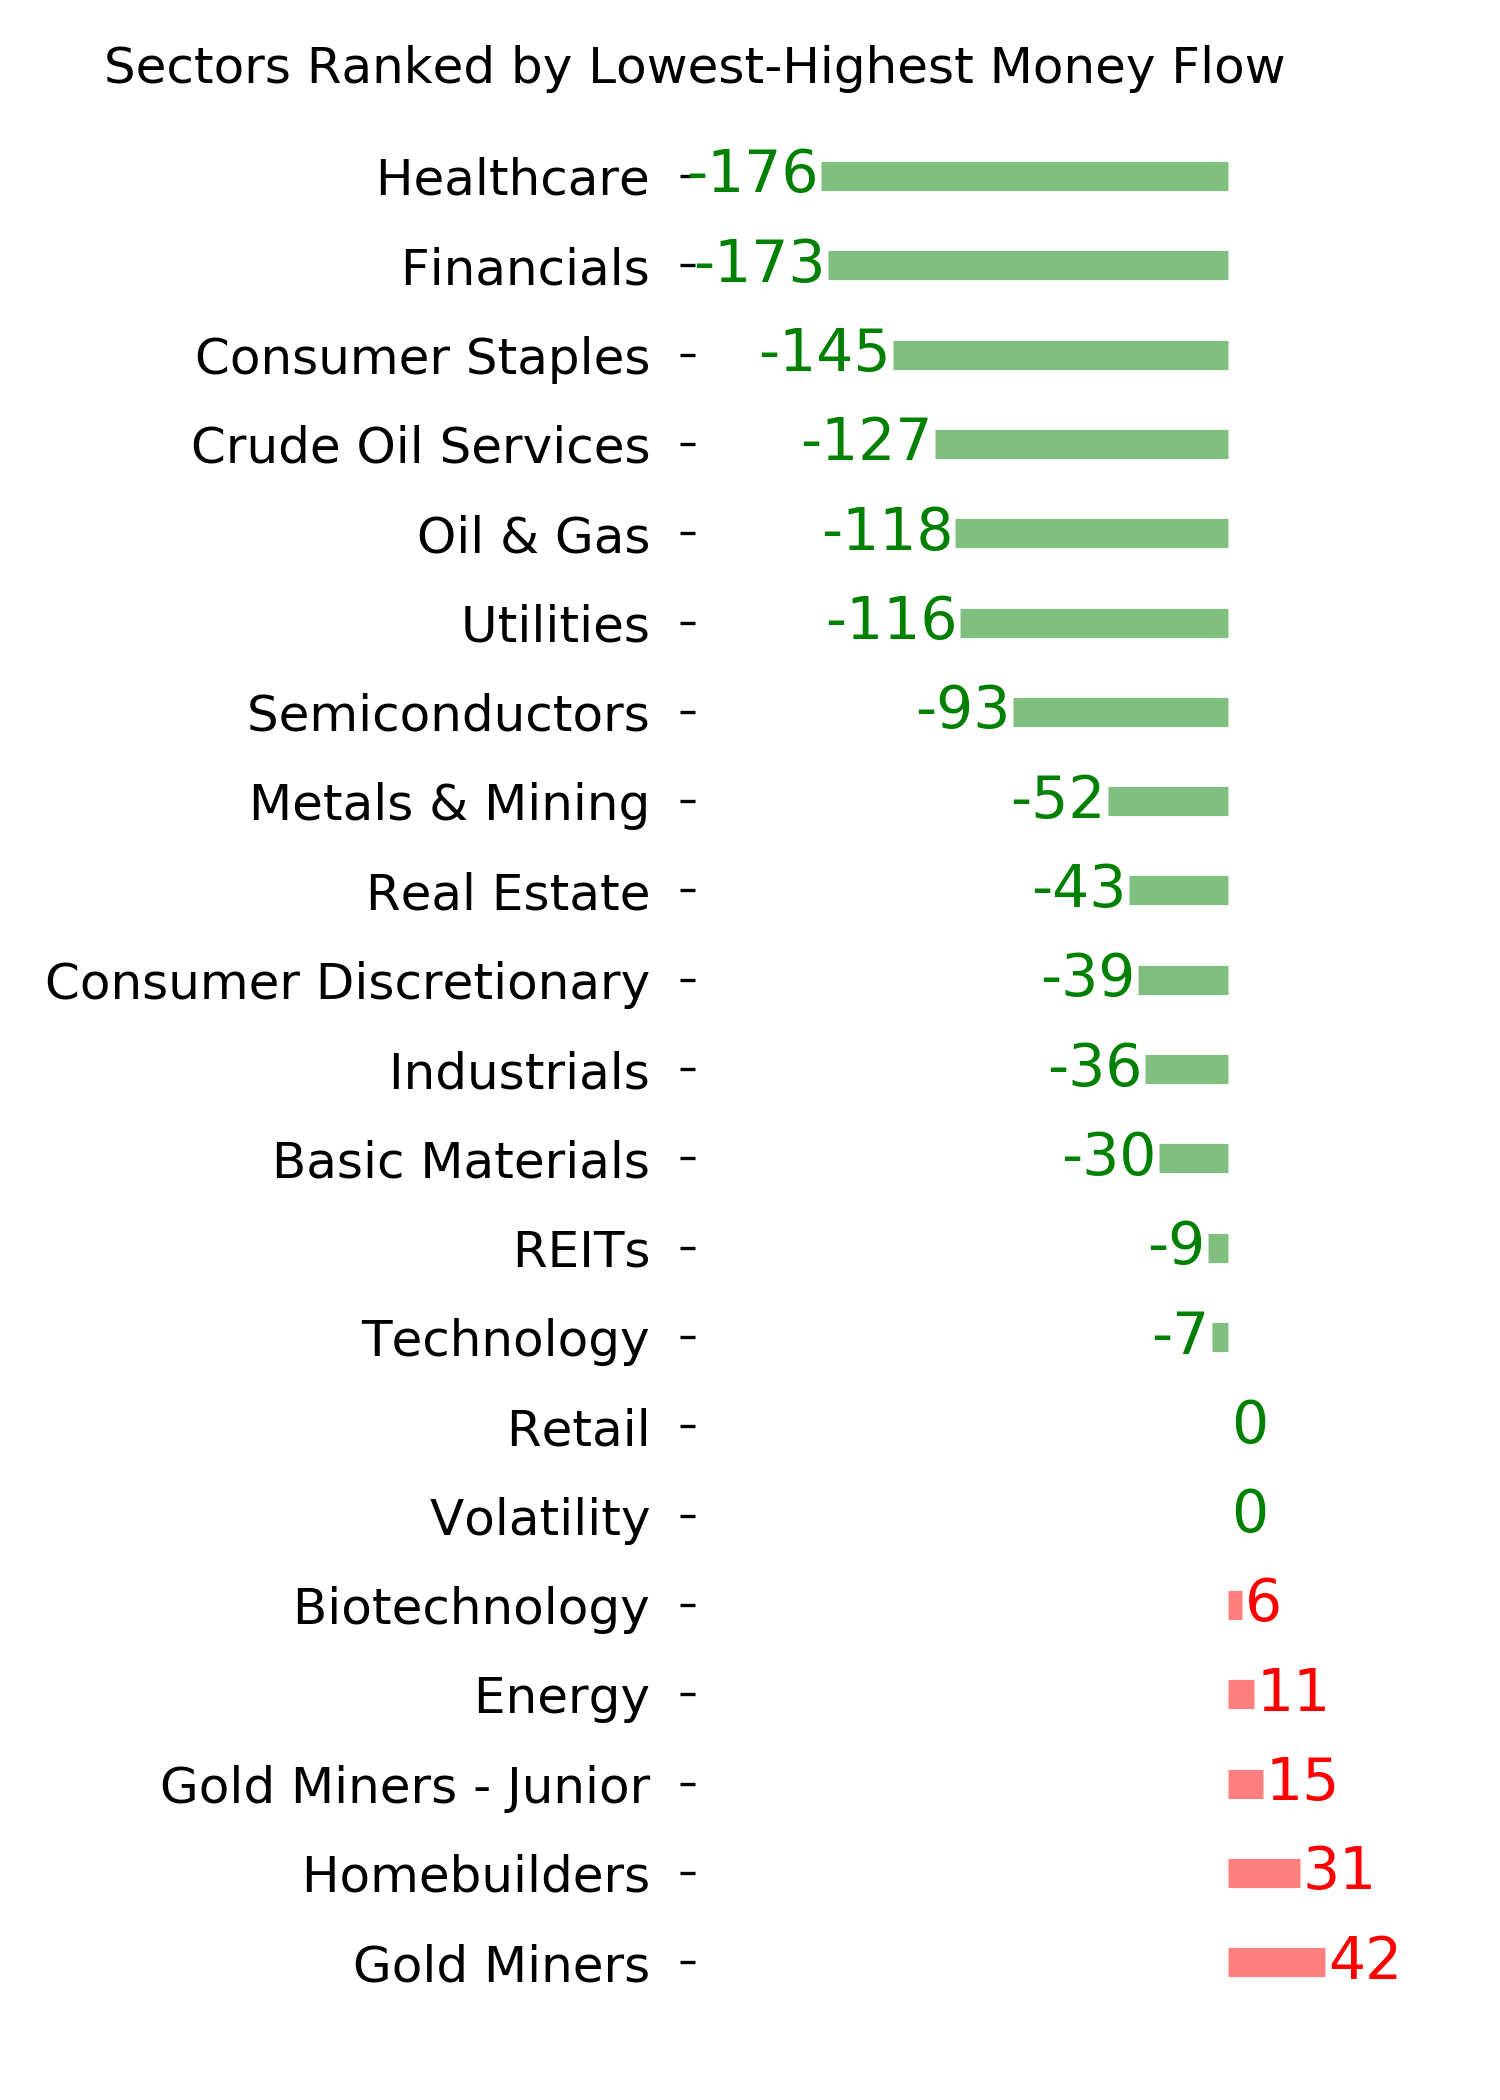
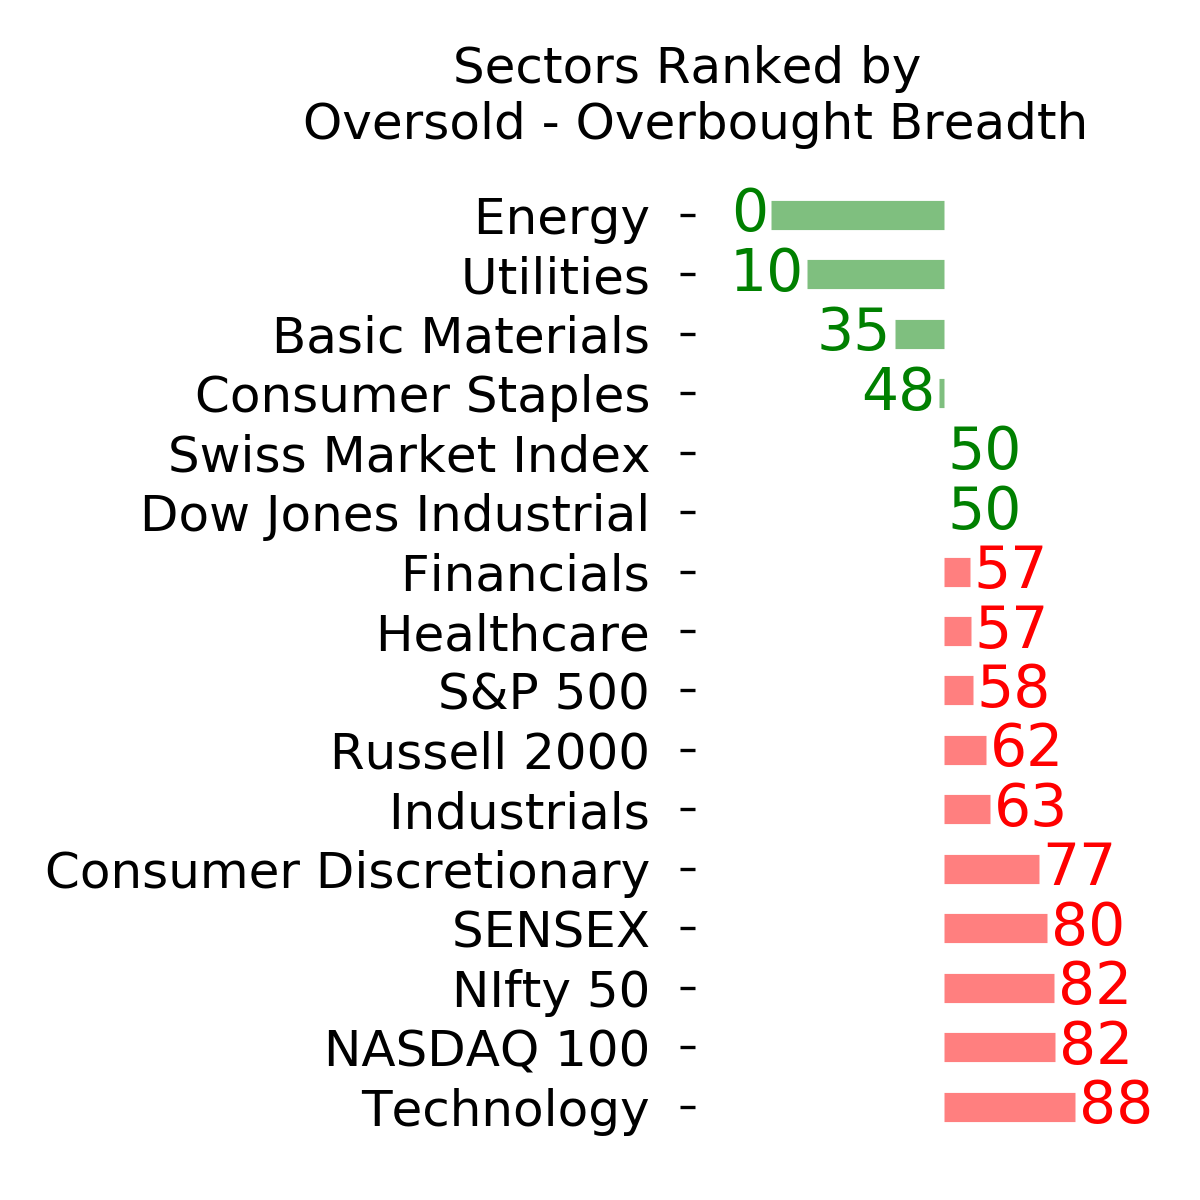
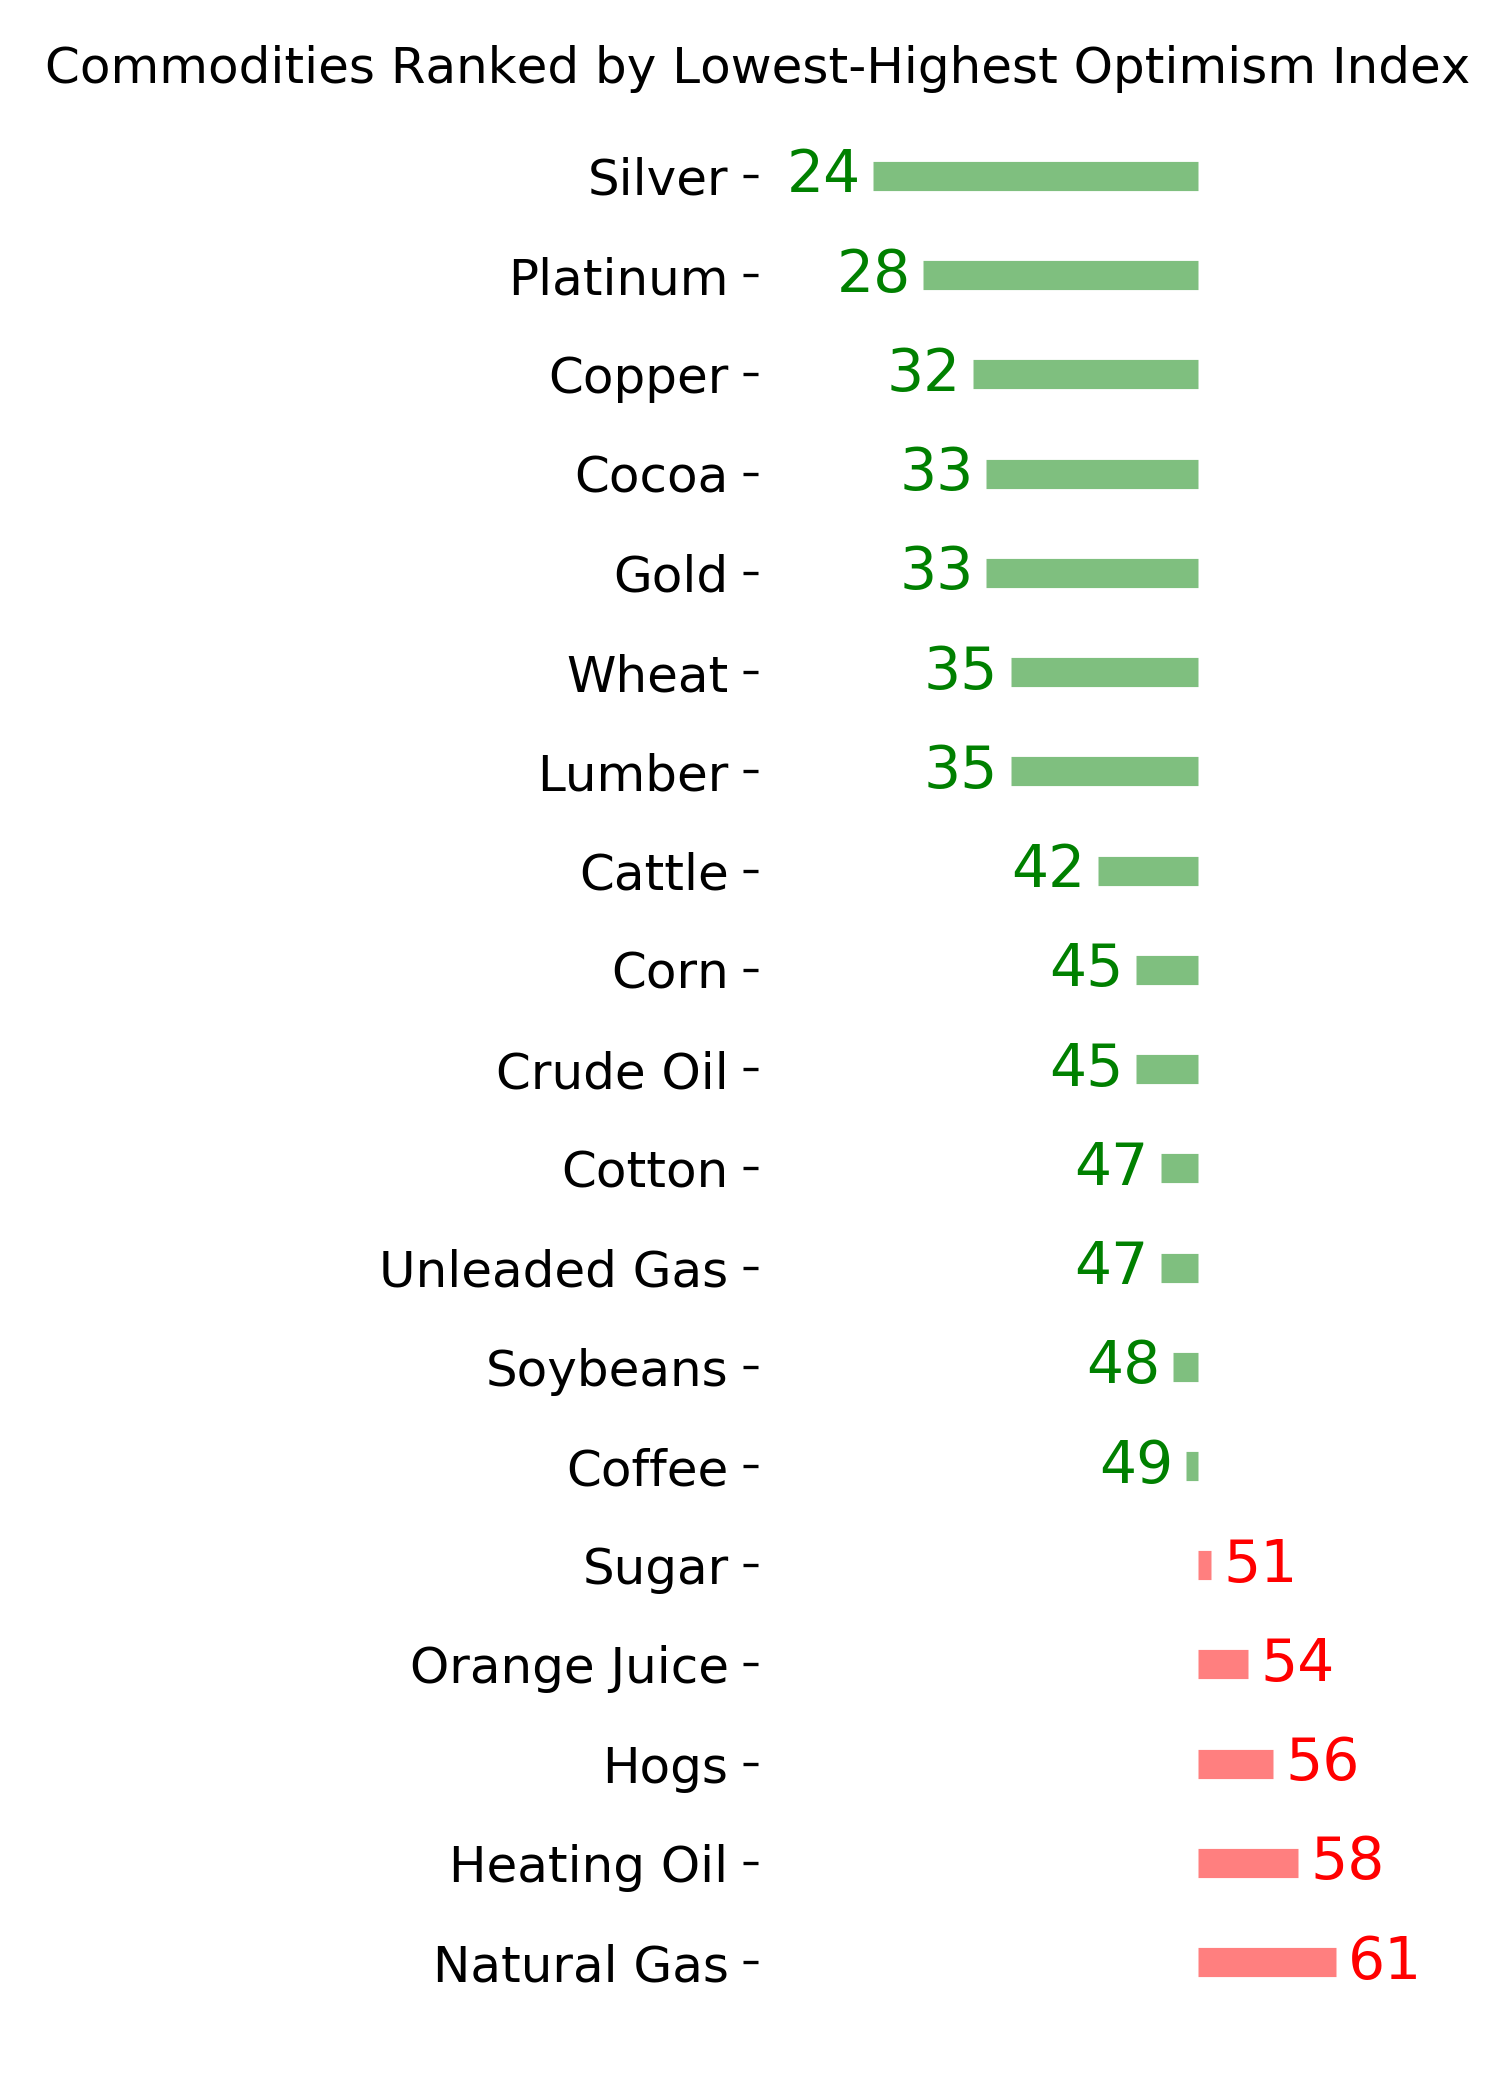
Ranks
|
|
|
|
|
|
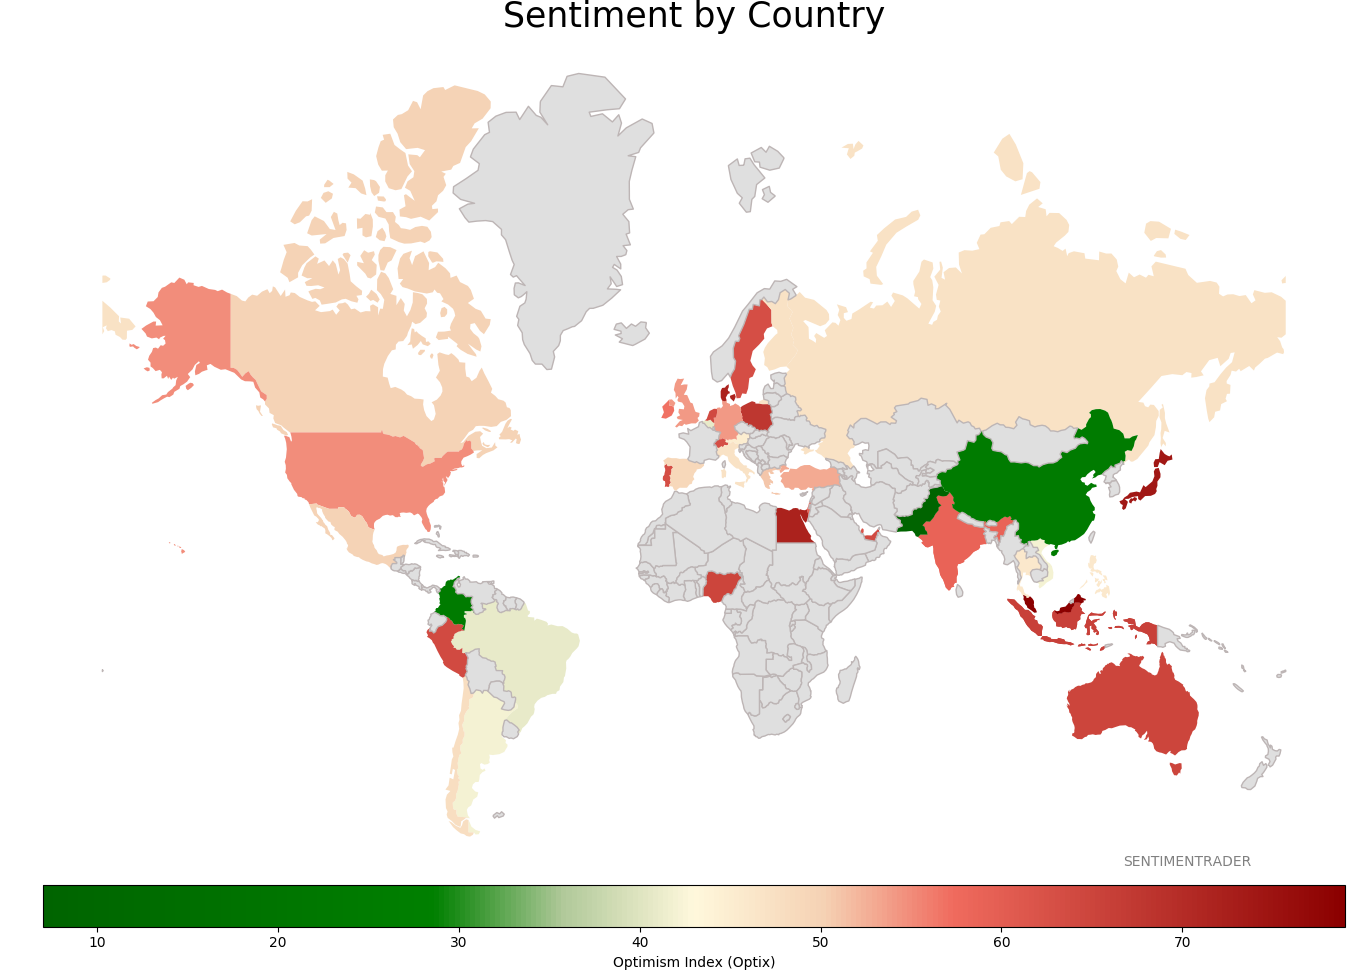
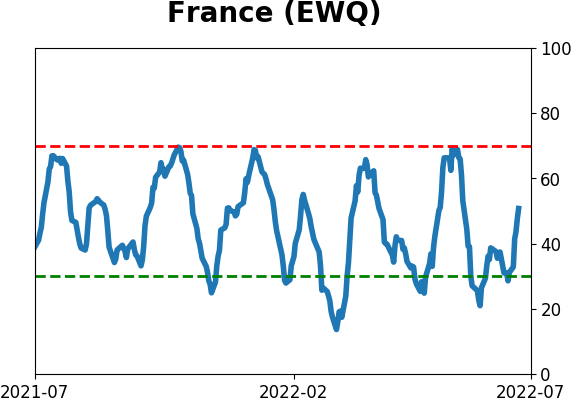
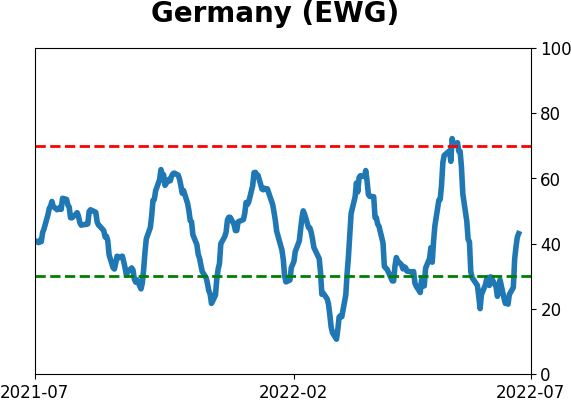
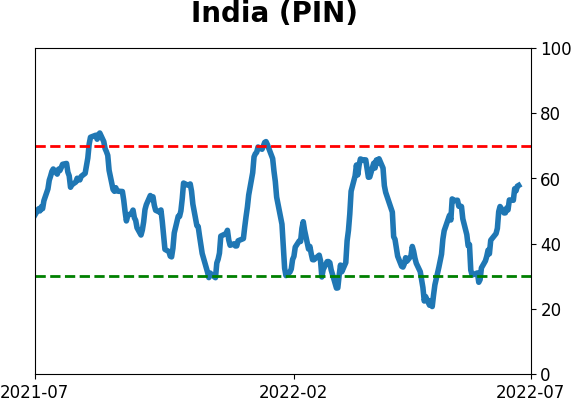
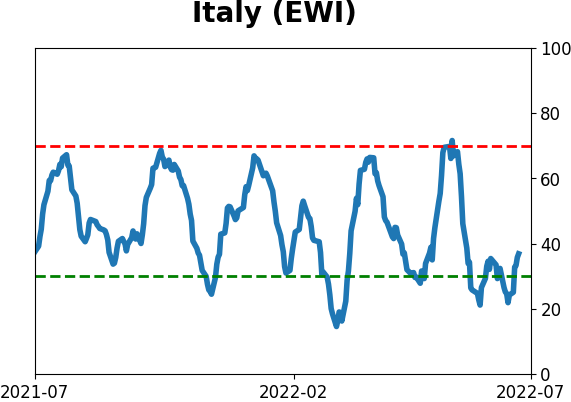
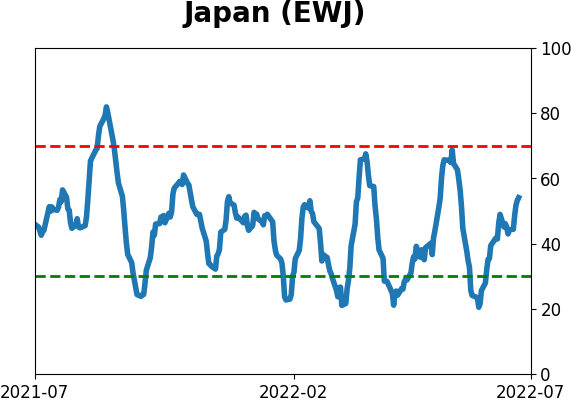
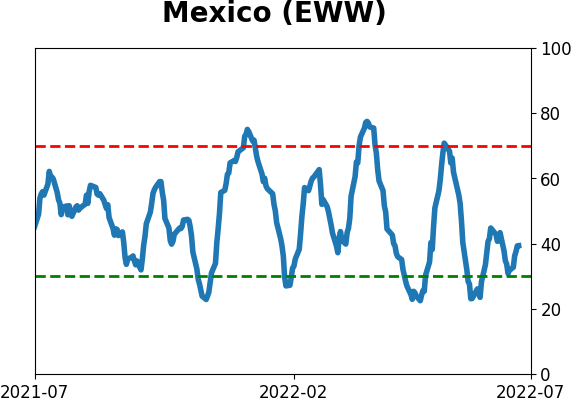
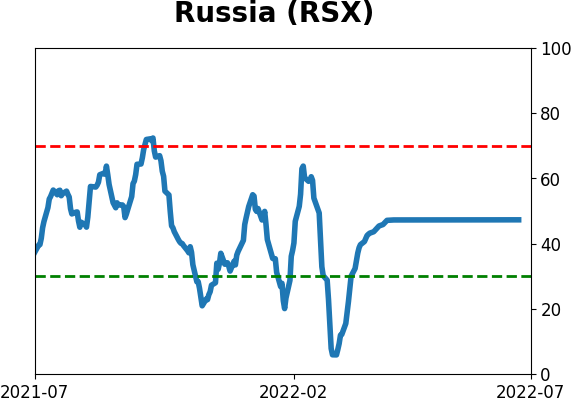
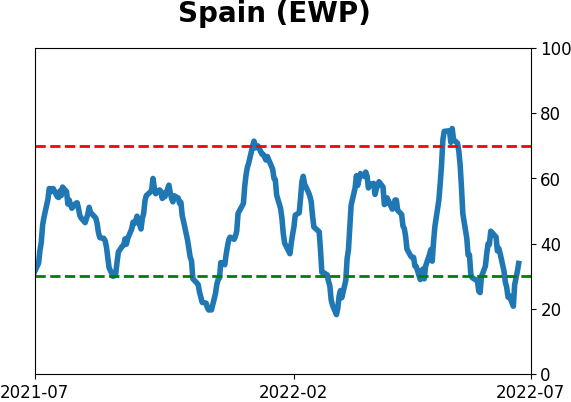
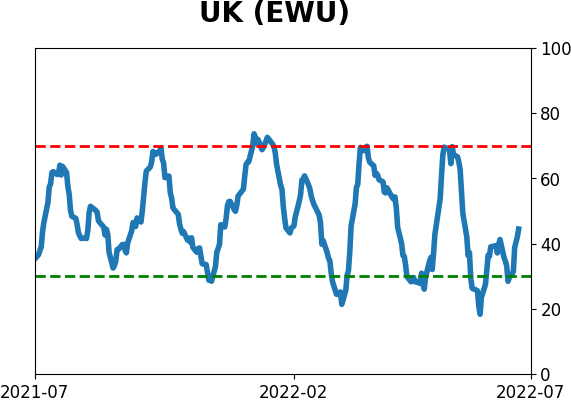
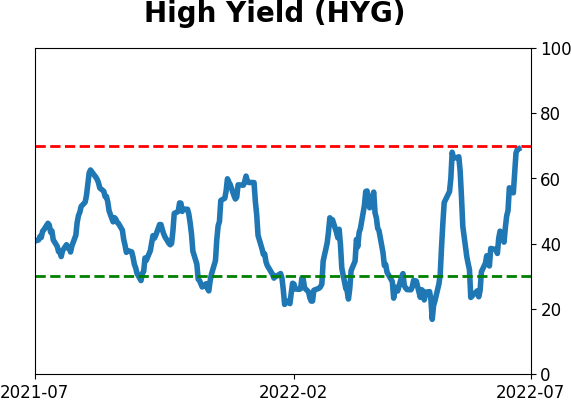
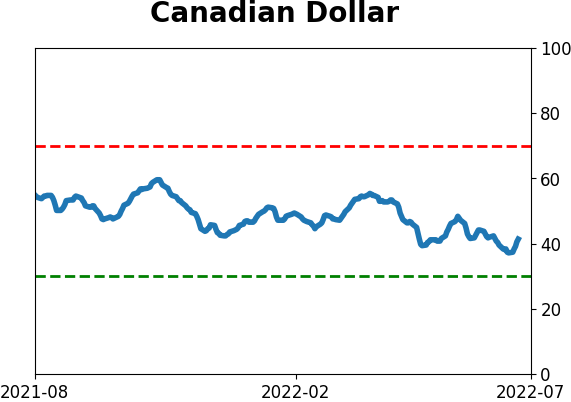
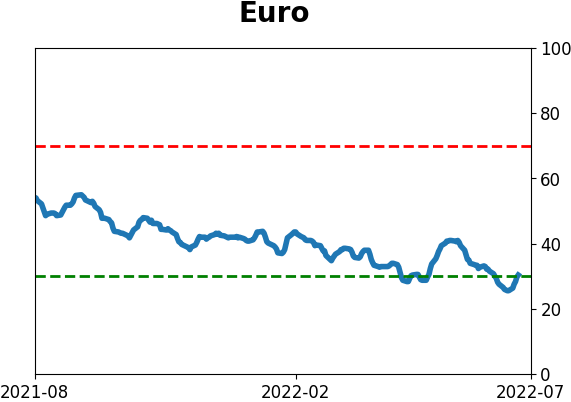
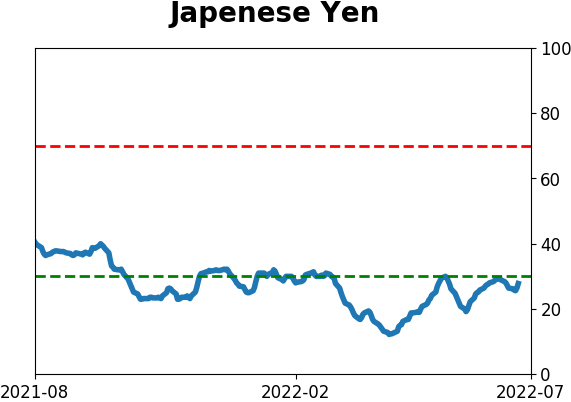
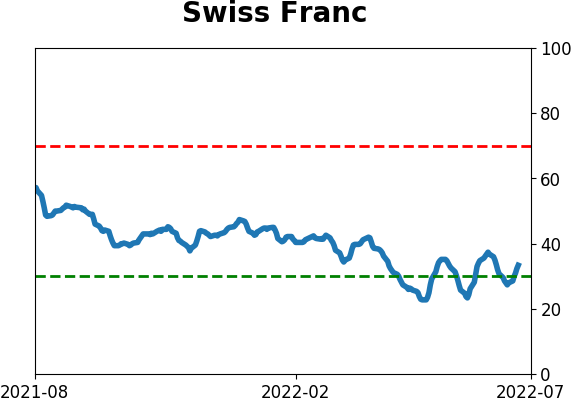
Sentiment Around The World
|
|
|
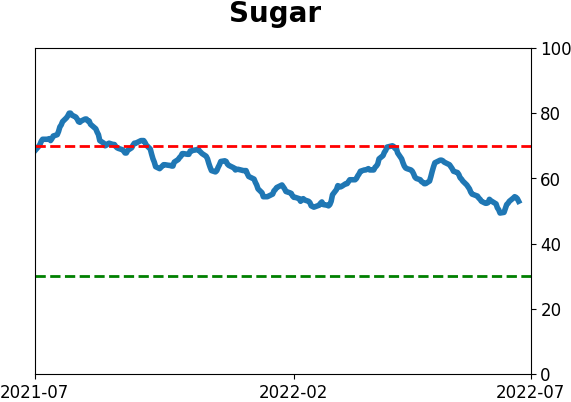
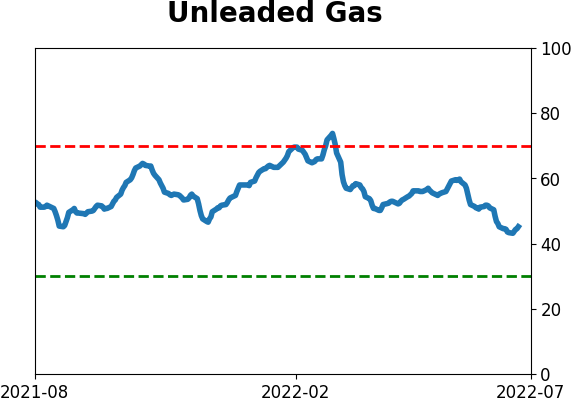
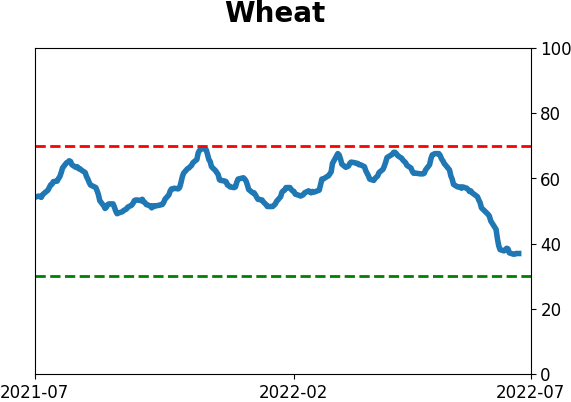
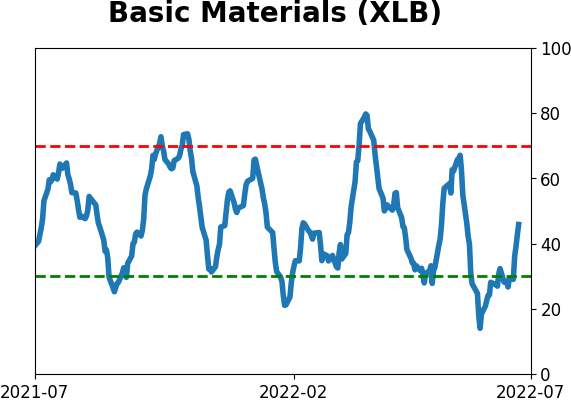
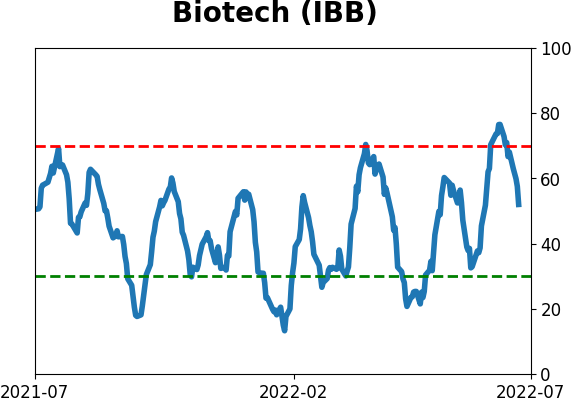
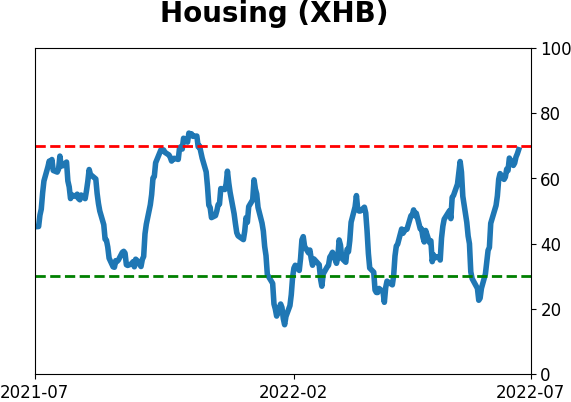
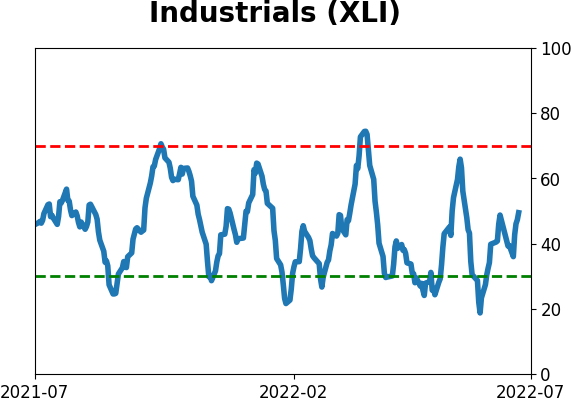
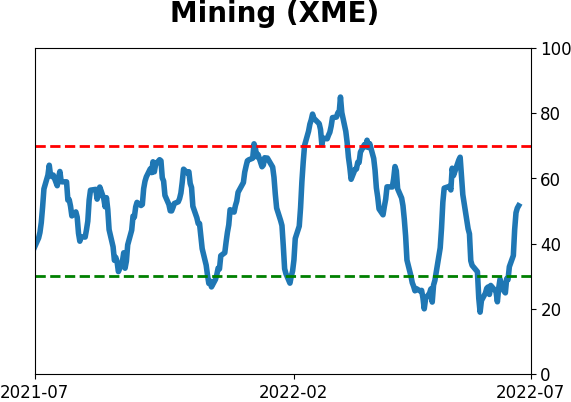
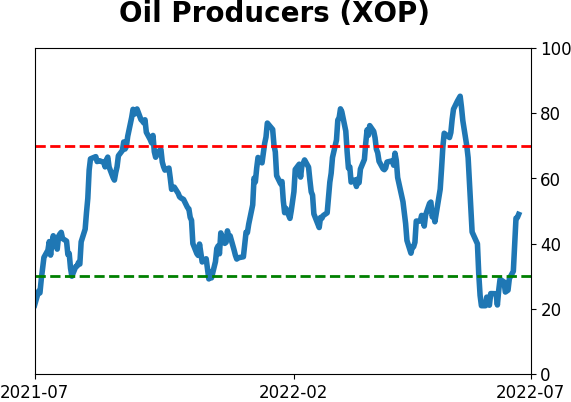
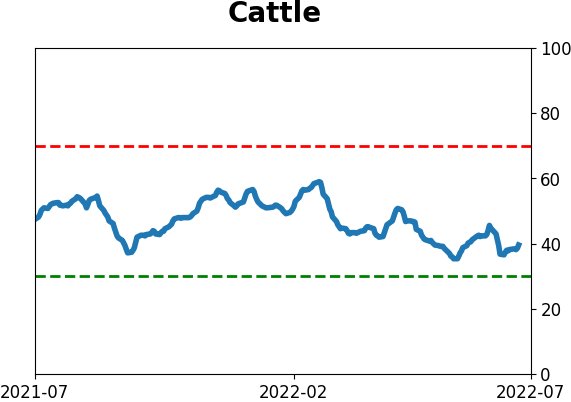
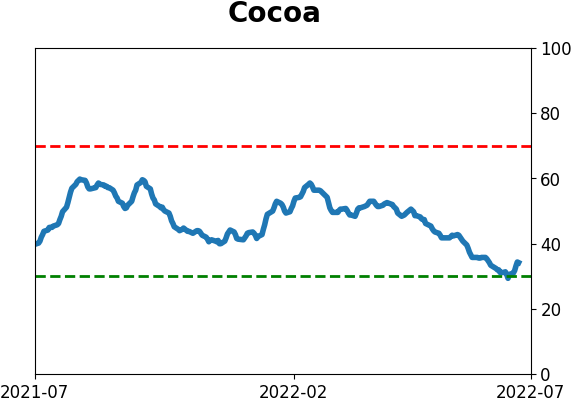
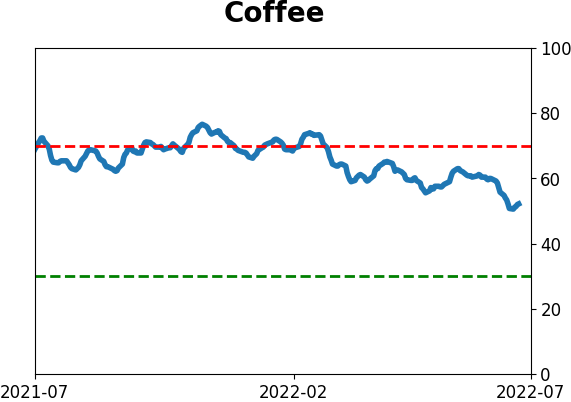
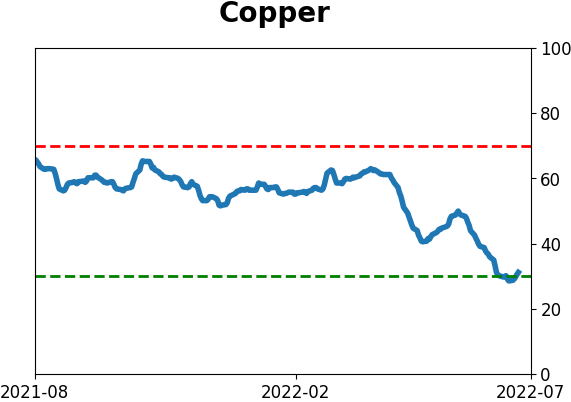
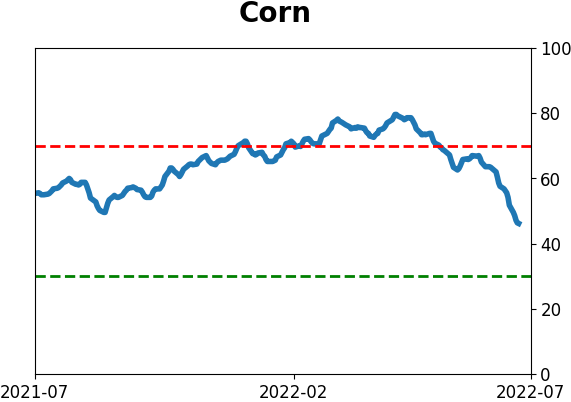
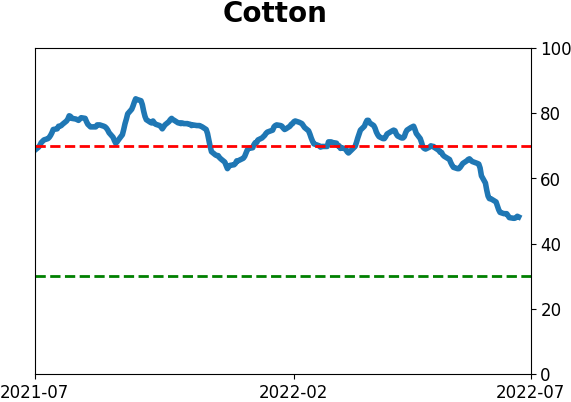
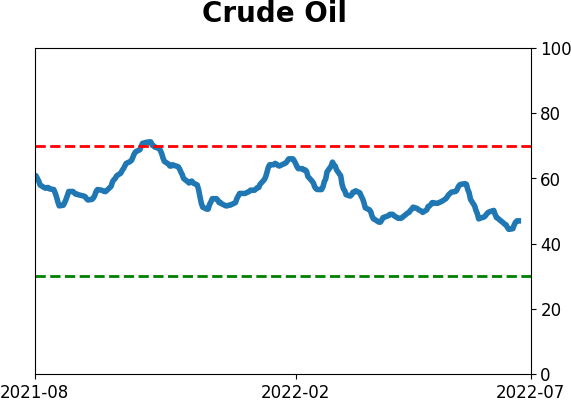
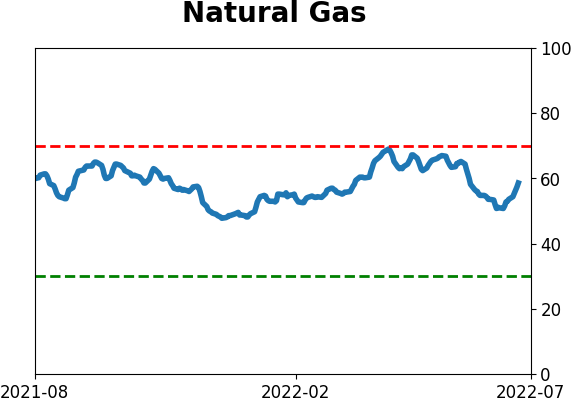
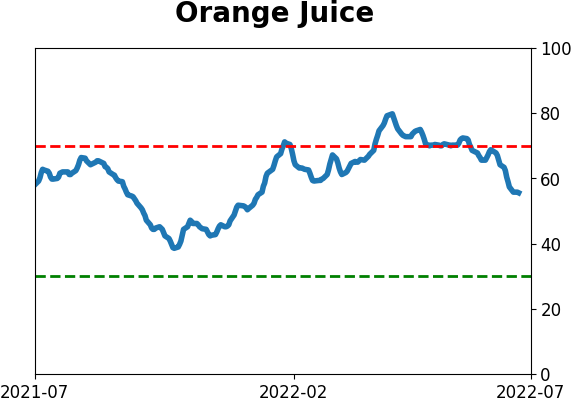
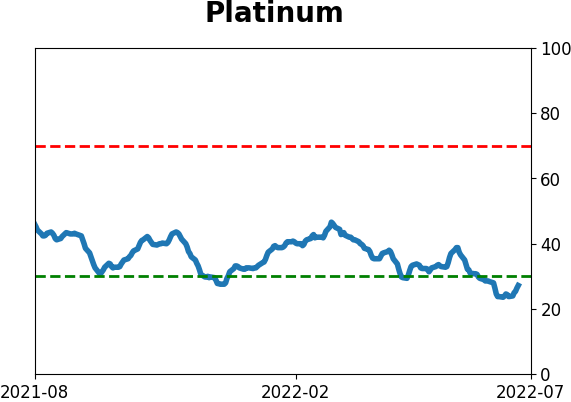
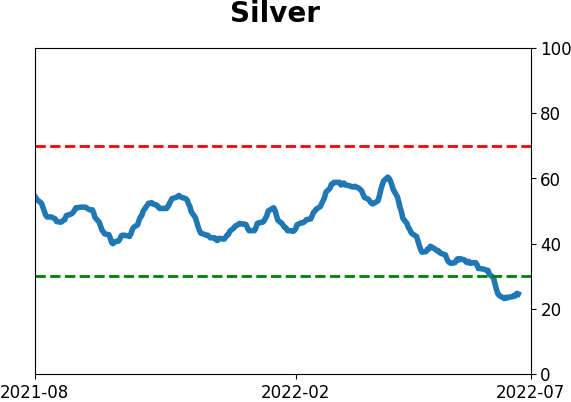
Optimism Index Thumbnails
|
|
|
|
|
|
|
|
|
|
|
|
|
|
|
|
|
|
|
|
|