Daily Report : TradingEdge Weekly for Jul 21 - Moderate inflation regimes, optimistic consumers, insiders buying staples

| View/Print a PDF version of this Report |
Headlines
|
TradingEdge Weekly for Jul 21 - Moderate inflation regimes, optimistic consumers, insiders buying staples: This week, we saw that U.S. consumers have become significantly more optimistic, as have investors in the stock market. Financial conditions are easing, as is inflation, both of which tend to precede higher stock prices. Insiders are buying Financials and Staples, and almost all Technology stocks are enjoying uptrends. |
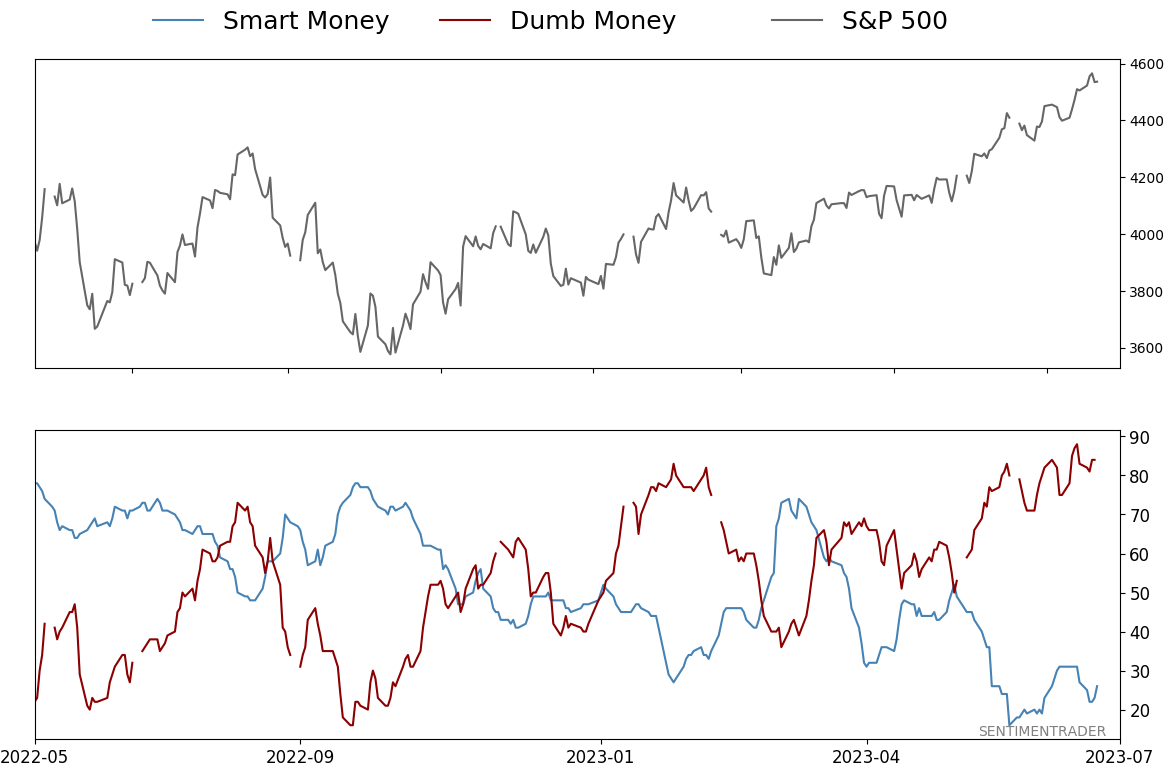
Smart / Dumb Money Confidence
|
|
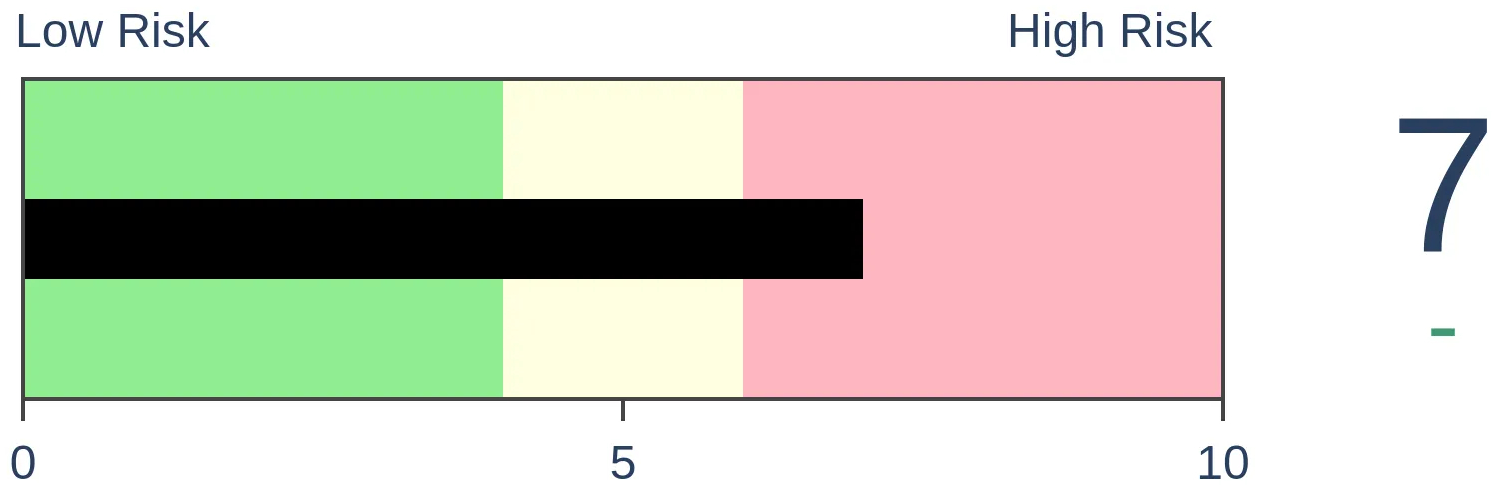
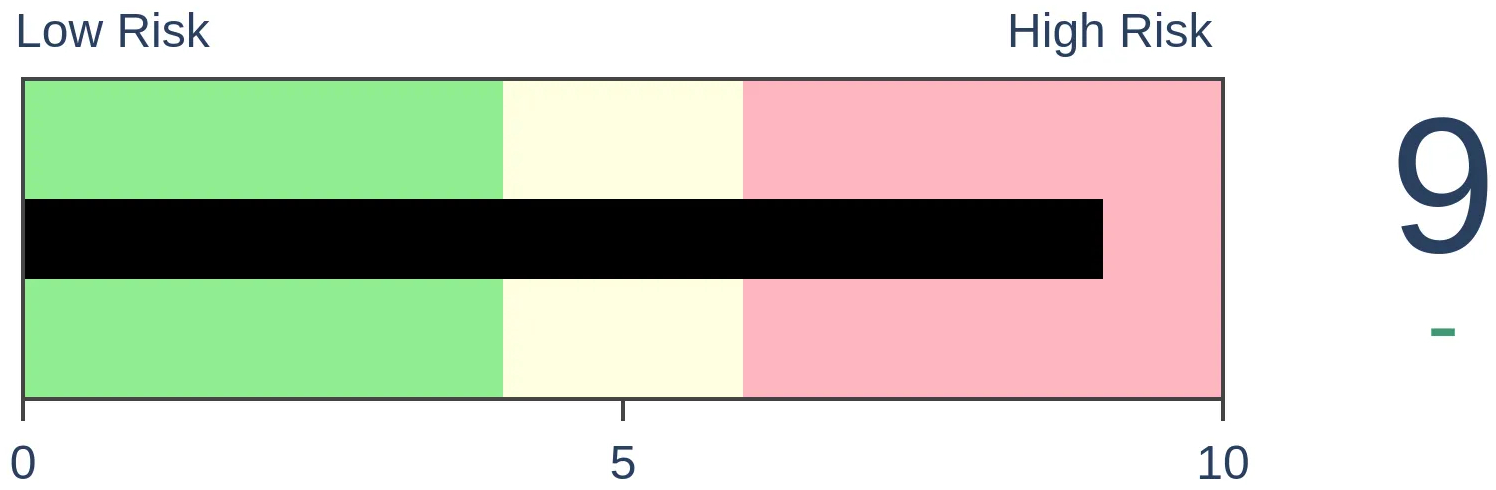
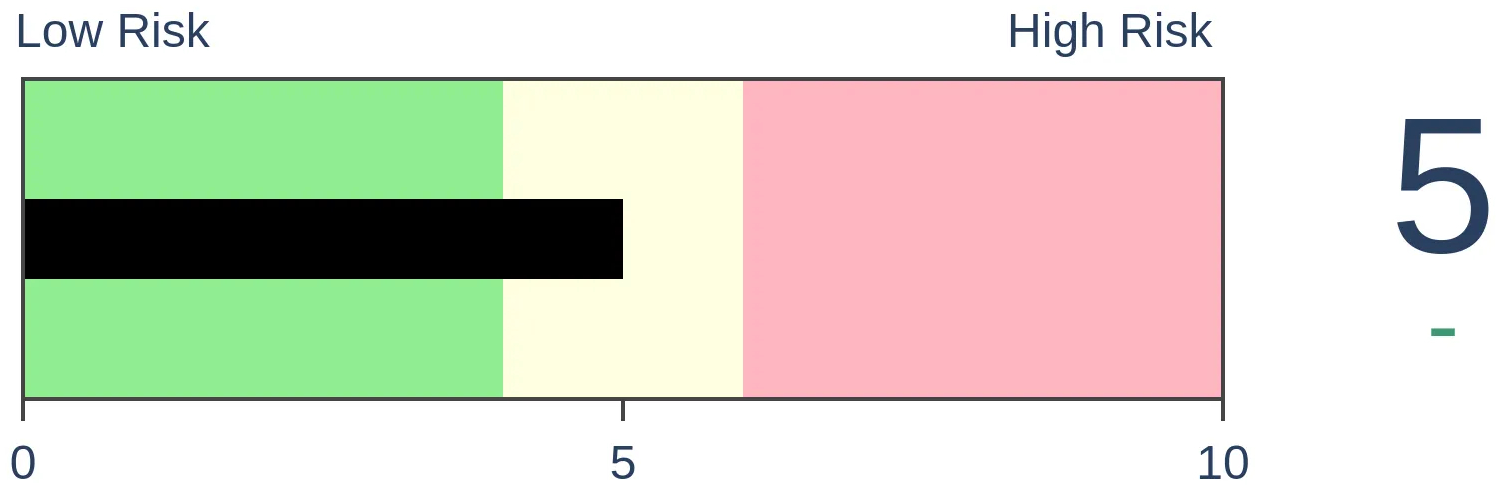
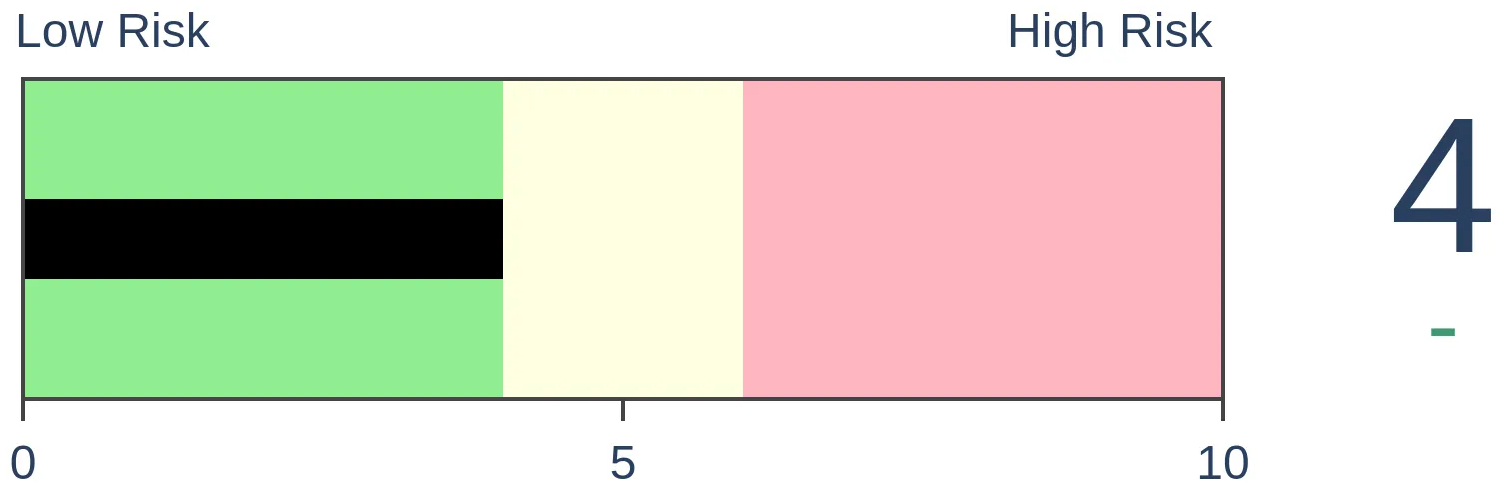
Risk Levels
|
|

|

Research
TradingEdge Weekly for Jul 21 - Moderate inflation regimes, optimistic consumers, insiders buying staplesBy Jason GoepfertBOTTOM LINEThis week, we saw that U.S. consumers have become significantly more optimistic, as have investors in the stock market. Financial conditions are easing, as is inflation, both of which tend to precede higher stock prices. Insiders are buying Financials and Staples, and almost all Technology stocks are enjoying uptrends. FORECAST / TIMEFRAME |
Key points:
- U.S. consumers are feeling better
- Economic reports are surprising to the upside
- That's helping trigger extreme optimism in stocks and pessimism in bonds
- Inflation is easing and that has been a very, very good thing for stocks over the decades
- Financial conditions are easing, too
- Insiders are buying Financials and Staples
- Almost all Technology stocks are in medium- and long-term uptrends
- The dollar suffered a historic one-week loss and fell to a 52-week low
Consumers are feeling better
The University of Michigan Consumer Sentiment Index increased by 13.4 points over the last two months. Dean showed that after similar two-month surges, the S&P 500 was higher 91% of the time over the next six months. Cyclical sectors and other risk assets tended to follow a similar upward trajectory.
Over the last two months, the increase in sentiment registered the 6th largest increase in history and the most significant surge since 2005.
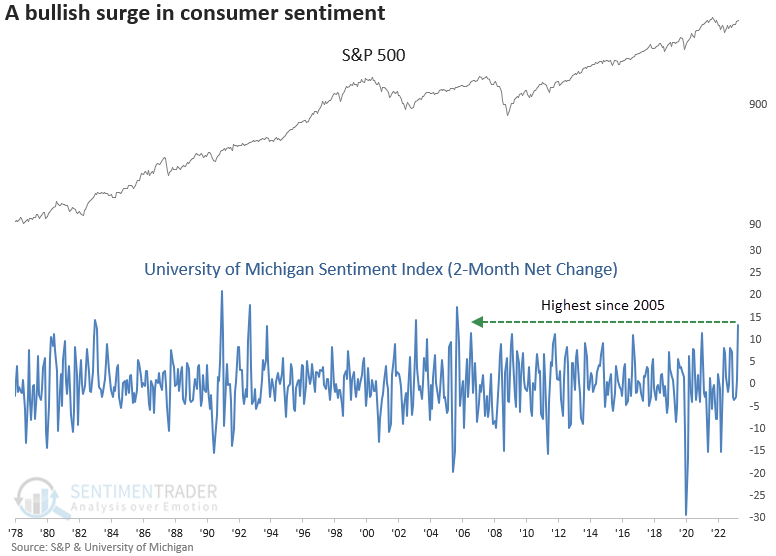
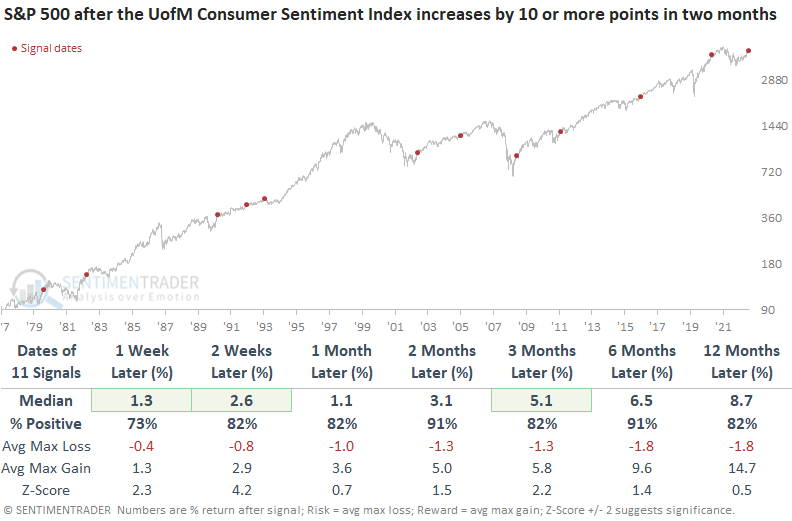
The increase in the sentiment index to 72.6 was a mid-month preliminary number. The final reading will hit the tape on the last trading day of July. When the University of Michigan Consumer Sentiment Index increases by 10 points or more over a 2-month period, S&P 500 returns, win rates, and z-scores were excellent across all time frames.
Over the next six months, the large-cap index was higher in all but one case. The maximum gains and losses table shows no previous occurrence resulted in a loss greater than -10.0% over the next year.
Given historical returns after a consumer sentiment signal, the current favorable relative strength trends in the Consumer Discretionary and Technology sectors will likely persist.
Dean also noted that a surge in consumer sentiment typically leads to a consistent upswing in the ISM manufacturing survey over the next year, as well as our Macro Index Model, a broader measure of economic trends.
Economic surprises are happening to the upside
After months of economic data threatening recession, things appear to be quietly turning around, as Jay noted the Economic Surprise Index recently crossed above a critical threshold.
The chart below displays the Economic Surprise Index versus the S&P 500 Index. This index recently surged to its highest level since March of 2021, and the 5-day moving average of Economic Surprises crossed above 70 while the S&P 500 Index was above its 150-day moving average.
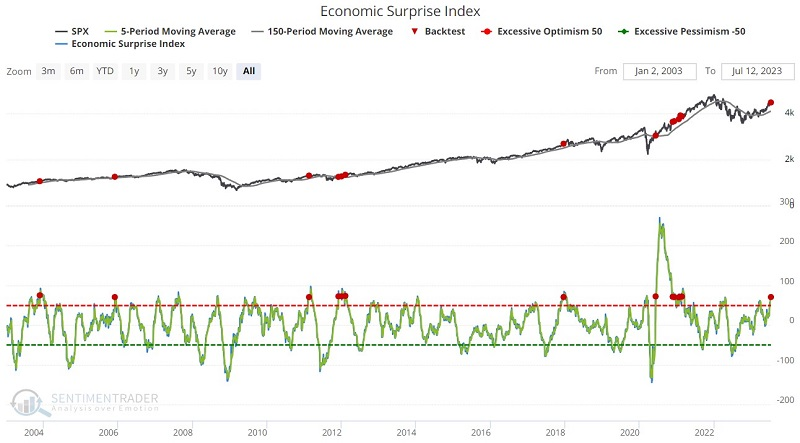
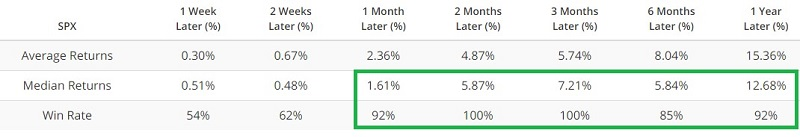
Over the next 2-3 months, the S&P 500 rose each time, with a very robust median and average return.
Maybe that's why investors love stocks and hate bonds
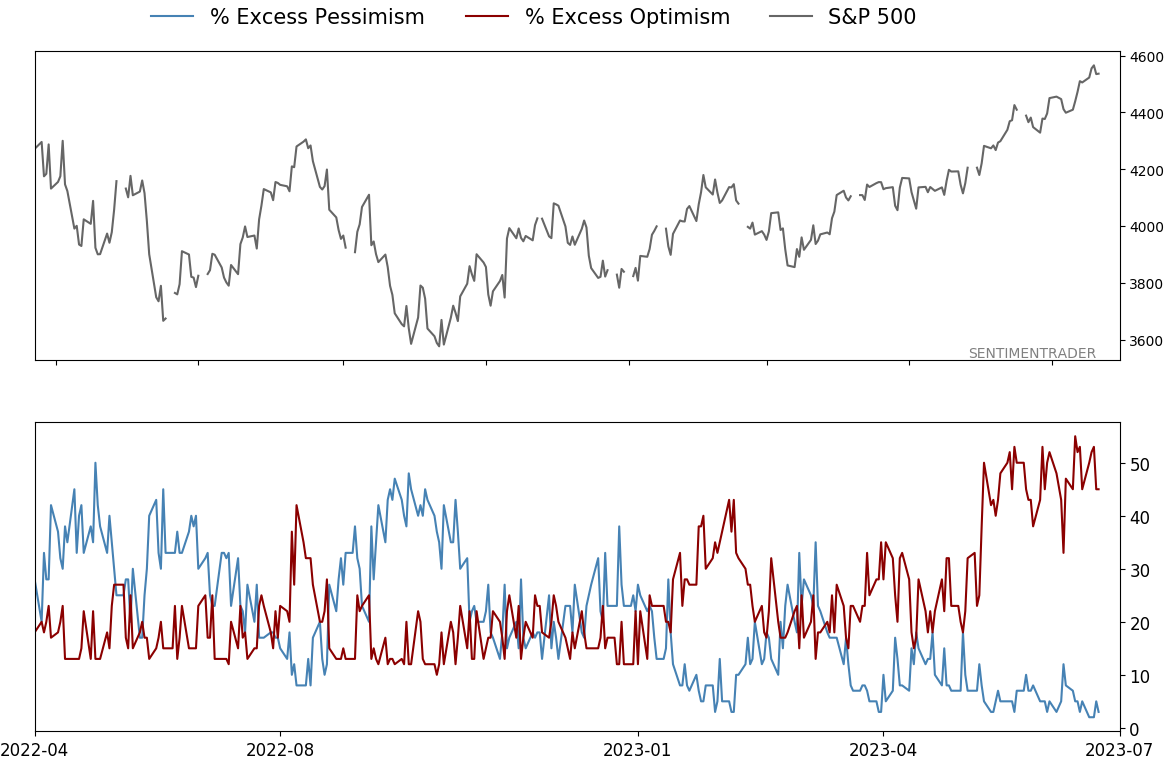
The difference in sentiment between the stock and bond markets is so stark it has never been wider in the 24 years we've been calculating the Optimism Index in the two markets.
The Intermediate-Term Optimism Index for stocks has approached 90 and is the 3rd-highest since we began computing it. At the same time, the Optimism Index for bonds has cratered to one of its lowest-ever levels. That means the spread between the two measures just rocketed above +60, a level we've never seen before.
We can see in the chart below that when the spread exceeded +40, the annualized return in the ratio between the S&P 500 and 10-year Treasury futures was abysmal. When the spread plunged below -40, then stocks soared versus Treasuries.
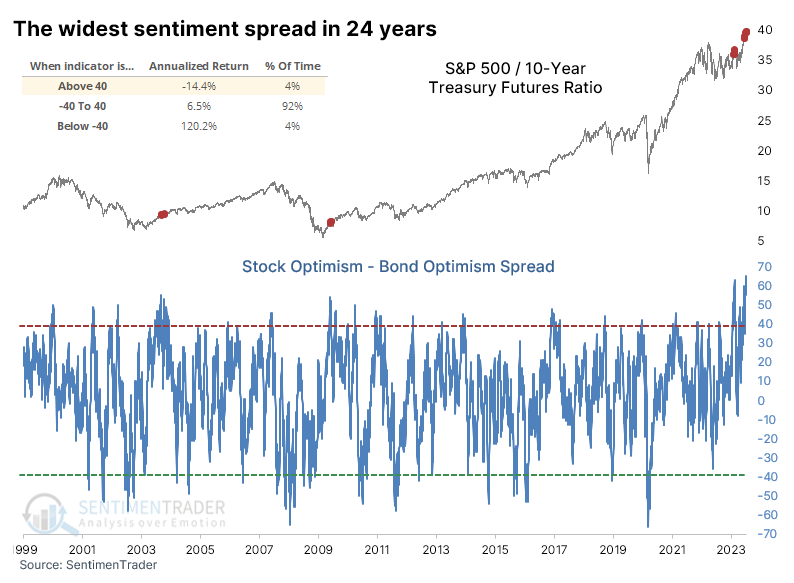
However, when the spread really blew out, above +50 or more, there were only a couple of precedents...and they both triggered at the ends of the last two protracted bear markets. This highlights something we've repeatedly noted in recent weeks and months - sentiment on stocks like we're seeing now doesn't happen during ongoing bear markets.
Since we are looking at the spread between stock and bond optimism, it makes sense to look at future returns between the two markets. The table below shows how the ratio between the S&P 500 and 10-year Treasury futures behaved after extreme wide spreads in sentiment.
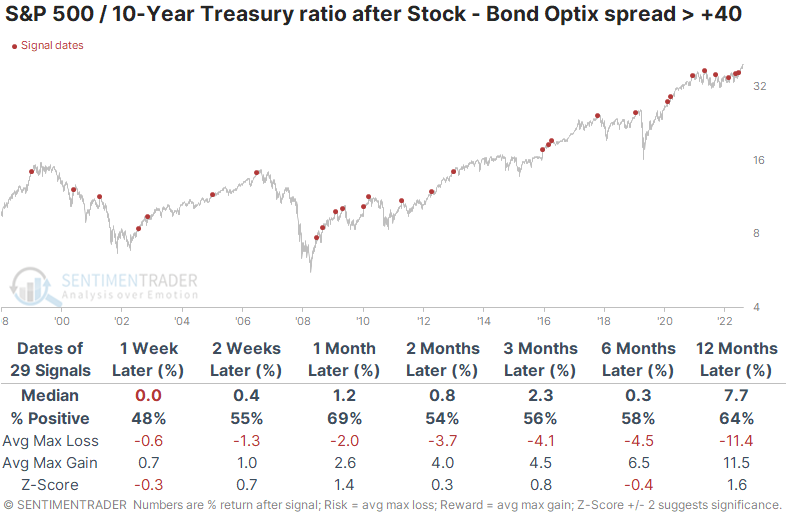
It's somewhat surprising that despite investors preferring stocks over bonds to an extreme degree, stocks still outperformed in the months ahead. There was no consistent contrary tone to the data, though the few signals triggered during ongoing bear markets preceded an almost immediate reversion from stocks to bonds.
Several times lately, we've looked at readings that simply haven't occurred in other ongoing bear markets. Evidence has piled up since October that we're likely in a new bull market environment, and the current level of sentiment among markets is further evidence of that. Granted, sentiment is so extreme that it likely means subdued forward returns, but it's not good evidence of an imminent and protracted retracement.
Easing inflation has been good for stocks, and continues to be
Jay noted the stock market hates uncertainty, and few things cause more uncertainty than soaring inflation. The U.S. Consumer Price Index 12-month rate-of-change has fallen back into the moderate inflation range. For the first time since April 2021, a simple inflation model has moved back to the bullish side of the ledger.
The chart below displays the 12-month change in the CPI since 1914. Note the "moderate Inflation range" between +4% and -3%. Note also that the inflation rate popped above the +4% level in May of 2021 and dropped below +4%, with the latest reading reported in July 2023.
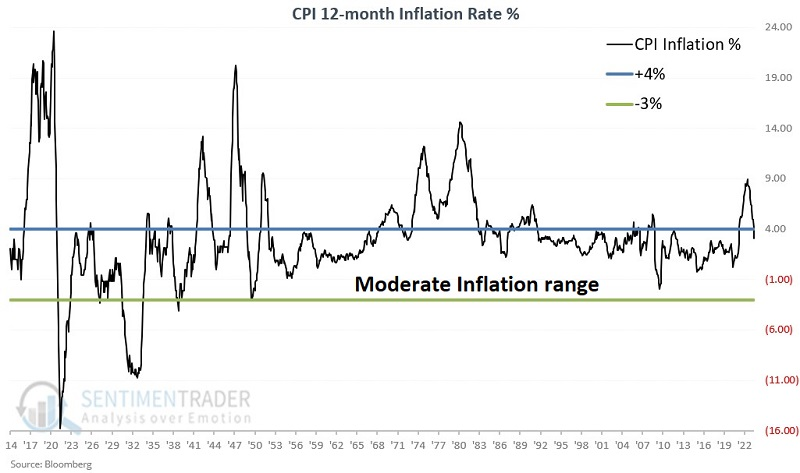
Both high inflation and severe deflation are bad for stocks.
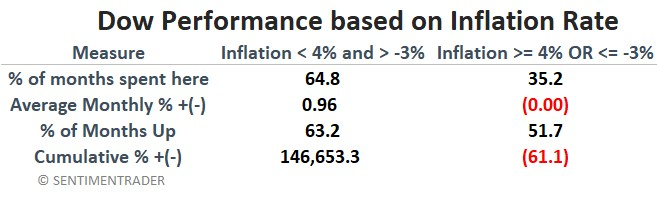
When inflation was >= +4%, the Dow showed a decline of -15.8%. In other words, despite the Dow gaining almost 57,000% during the test period, an investor who held the Dow only when inflation was greater than 4% would have lost money. During those times when inflation was <= -3%, i.e., during periods of severe deflation, the result is a decline of -53.8%.
Now, we're back in the Goldilocks zone. The chart below displays cumulative Dow price performance when inflation is not too hot and not too cold, between -3% and +4%. The result is a gain of +146,753% versus +56,999% for buy-and-hold.
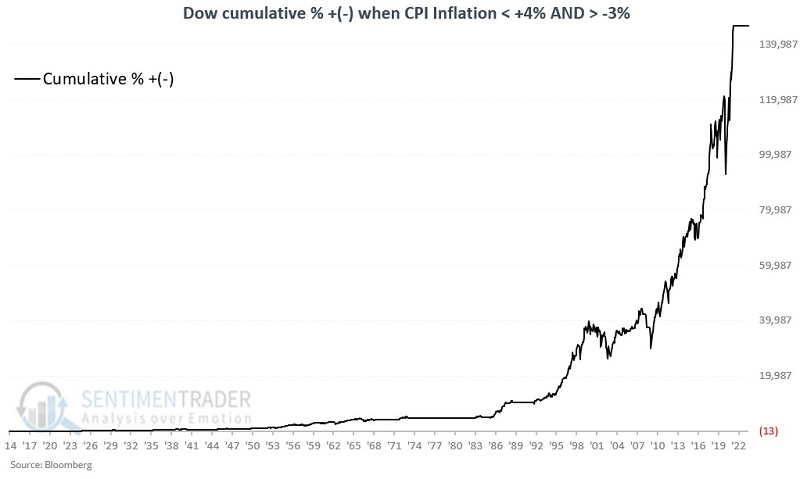
As you can see in the charts above, just because inflation is moderate does not mean you cannot have bear markets. Inflation is only one factor that can impact the stock market. But the market performs much better when inflation is under control.
To put this in perspective, the chart below displays the cumulative price performance for the Dow when the rate of change in inflation is either above +4% or below -3%.
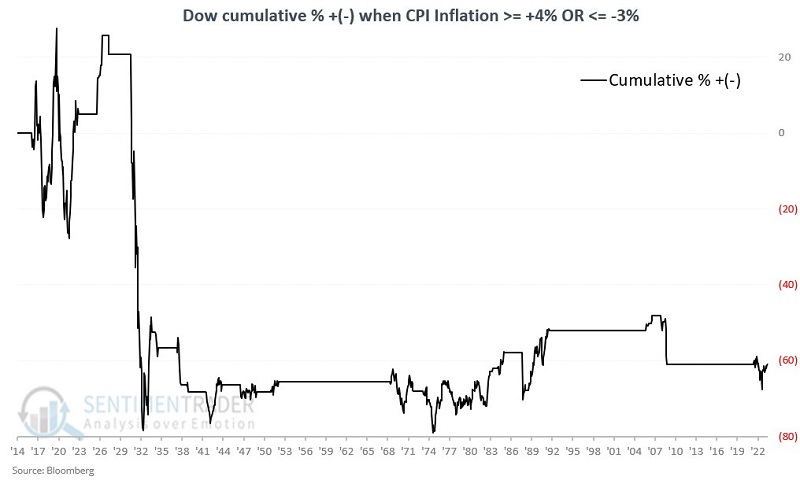
The table below highlights the differences in Dow performance between the two regimes. There is no doubt that investors have been much better served holding stocks when inflation is moderate.
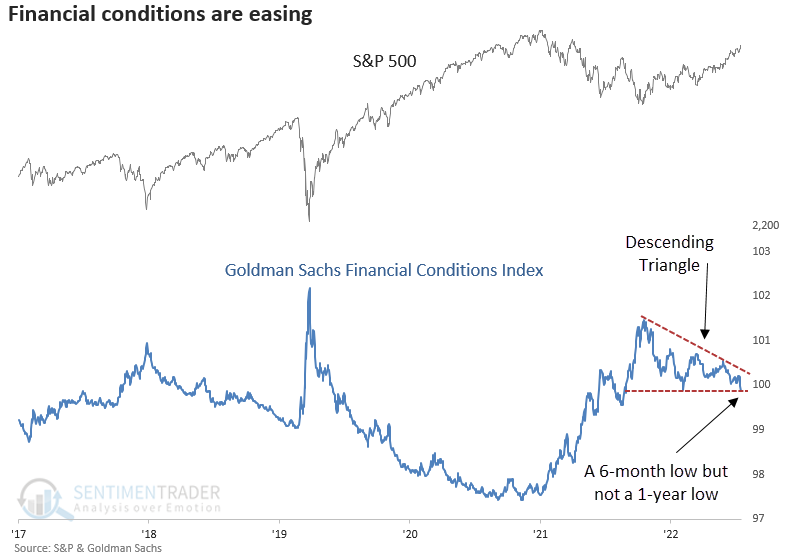
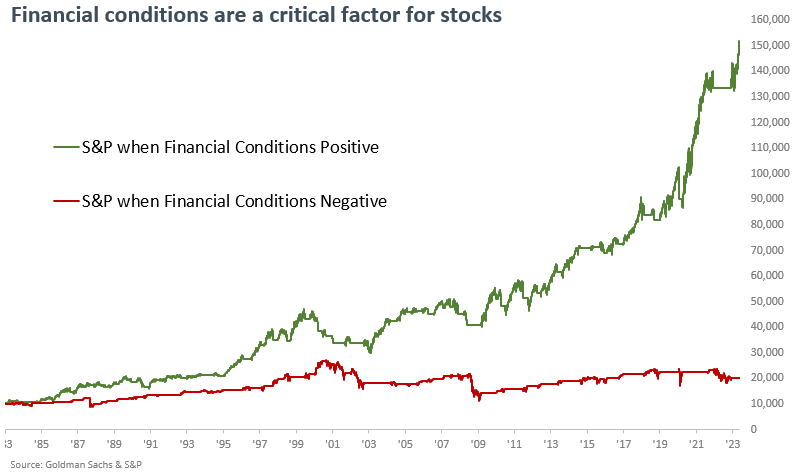
 Financial conditions are easing
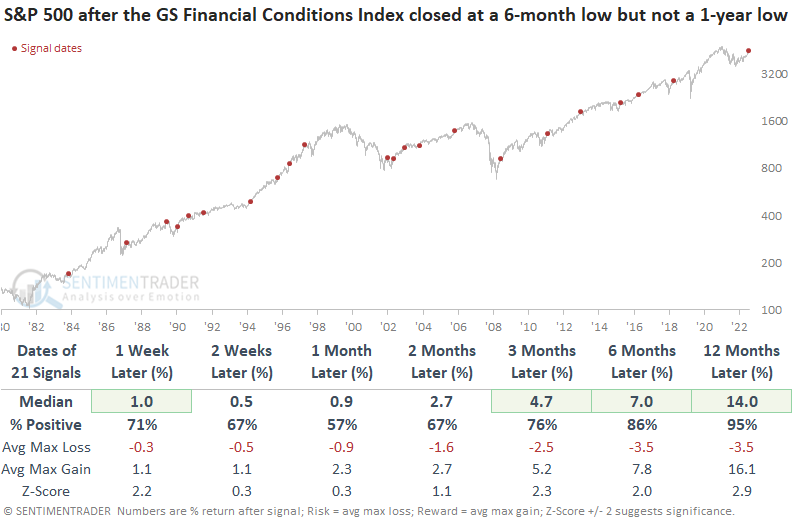
Dean showed that the Goldman Sachs Financial Conditions Index closed at a 6-month low but not a 1-year low. After similar breakdowns in financial conditions, the S&P 500 was higher a year later 95% of the time.
Financial conditions have consolidated in a bearish descending triangle pattern until a recent breakdown. Last week, the financial conditions index broke below a significant support level.
When the Goldman Sachs Financial Conditions Index closed at a 6-month low but not a 1-year low, the S&P 500 was higher a year later in all but one precedent. The one outlier was derailed by a government-imposed economic shutdown, causing stocks to plummet. Over the next year, the max gain exceeded the max loss in 19 of 21 precedents. And only four instances showed a max loss of greater than -10% over that same time frame.
When financial conditions ease, Technology, Financials, and Consumer Discretionary tend to outperform the most over the next year. Indexes with a higher risk profile, like the Russell 2000 and the Nasdaq Composite, exhibit solid performance trends similar to the S&P 500.
A model Dean created using financial conditions and S&P 500 momentum shows that under positive conditions (which we're still in), the system turns an initial capital outlay of $10,000 into a staggering $149,000. Conversely, during unfavorable financial conditions, that same $10,000 investment merely grows to a modest $20,000.
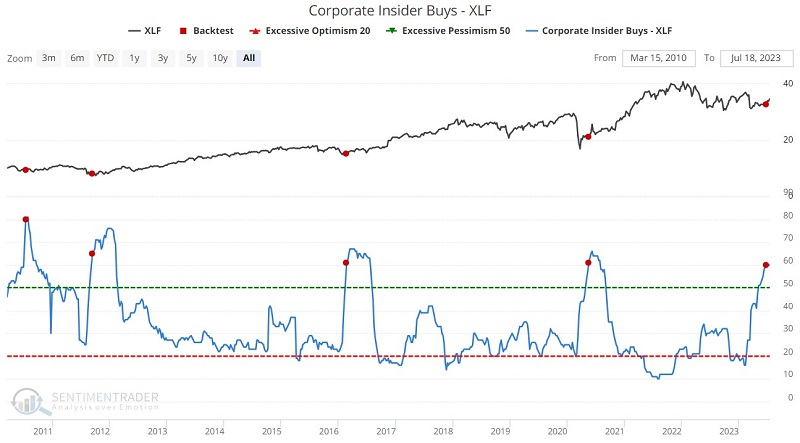
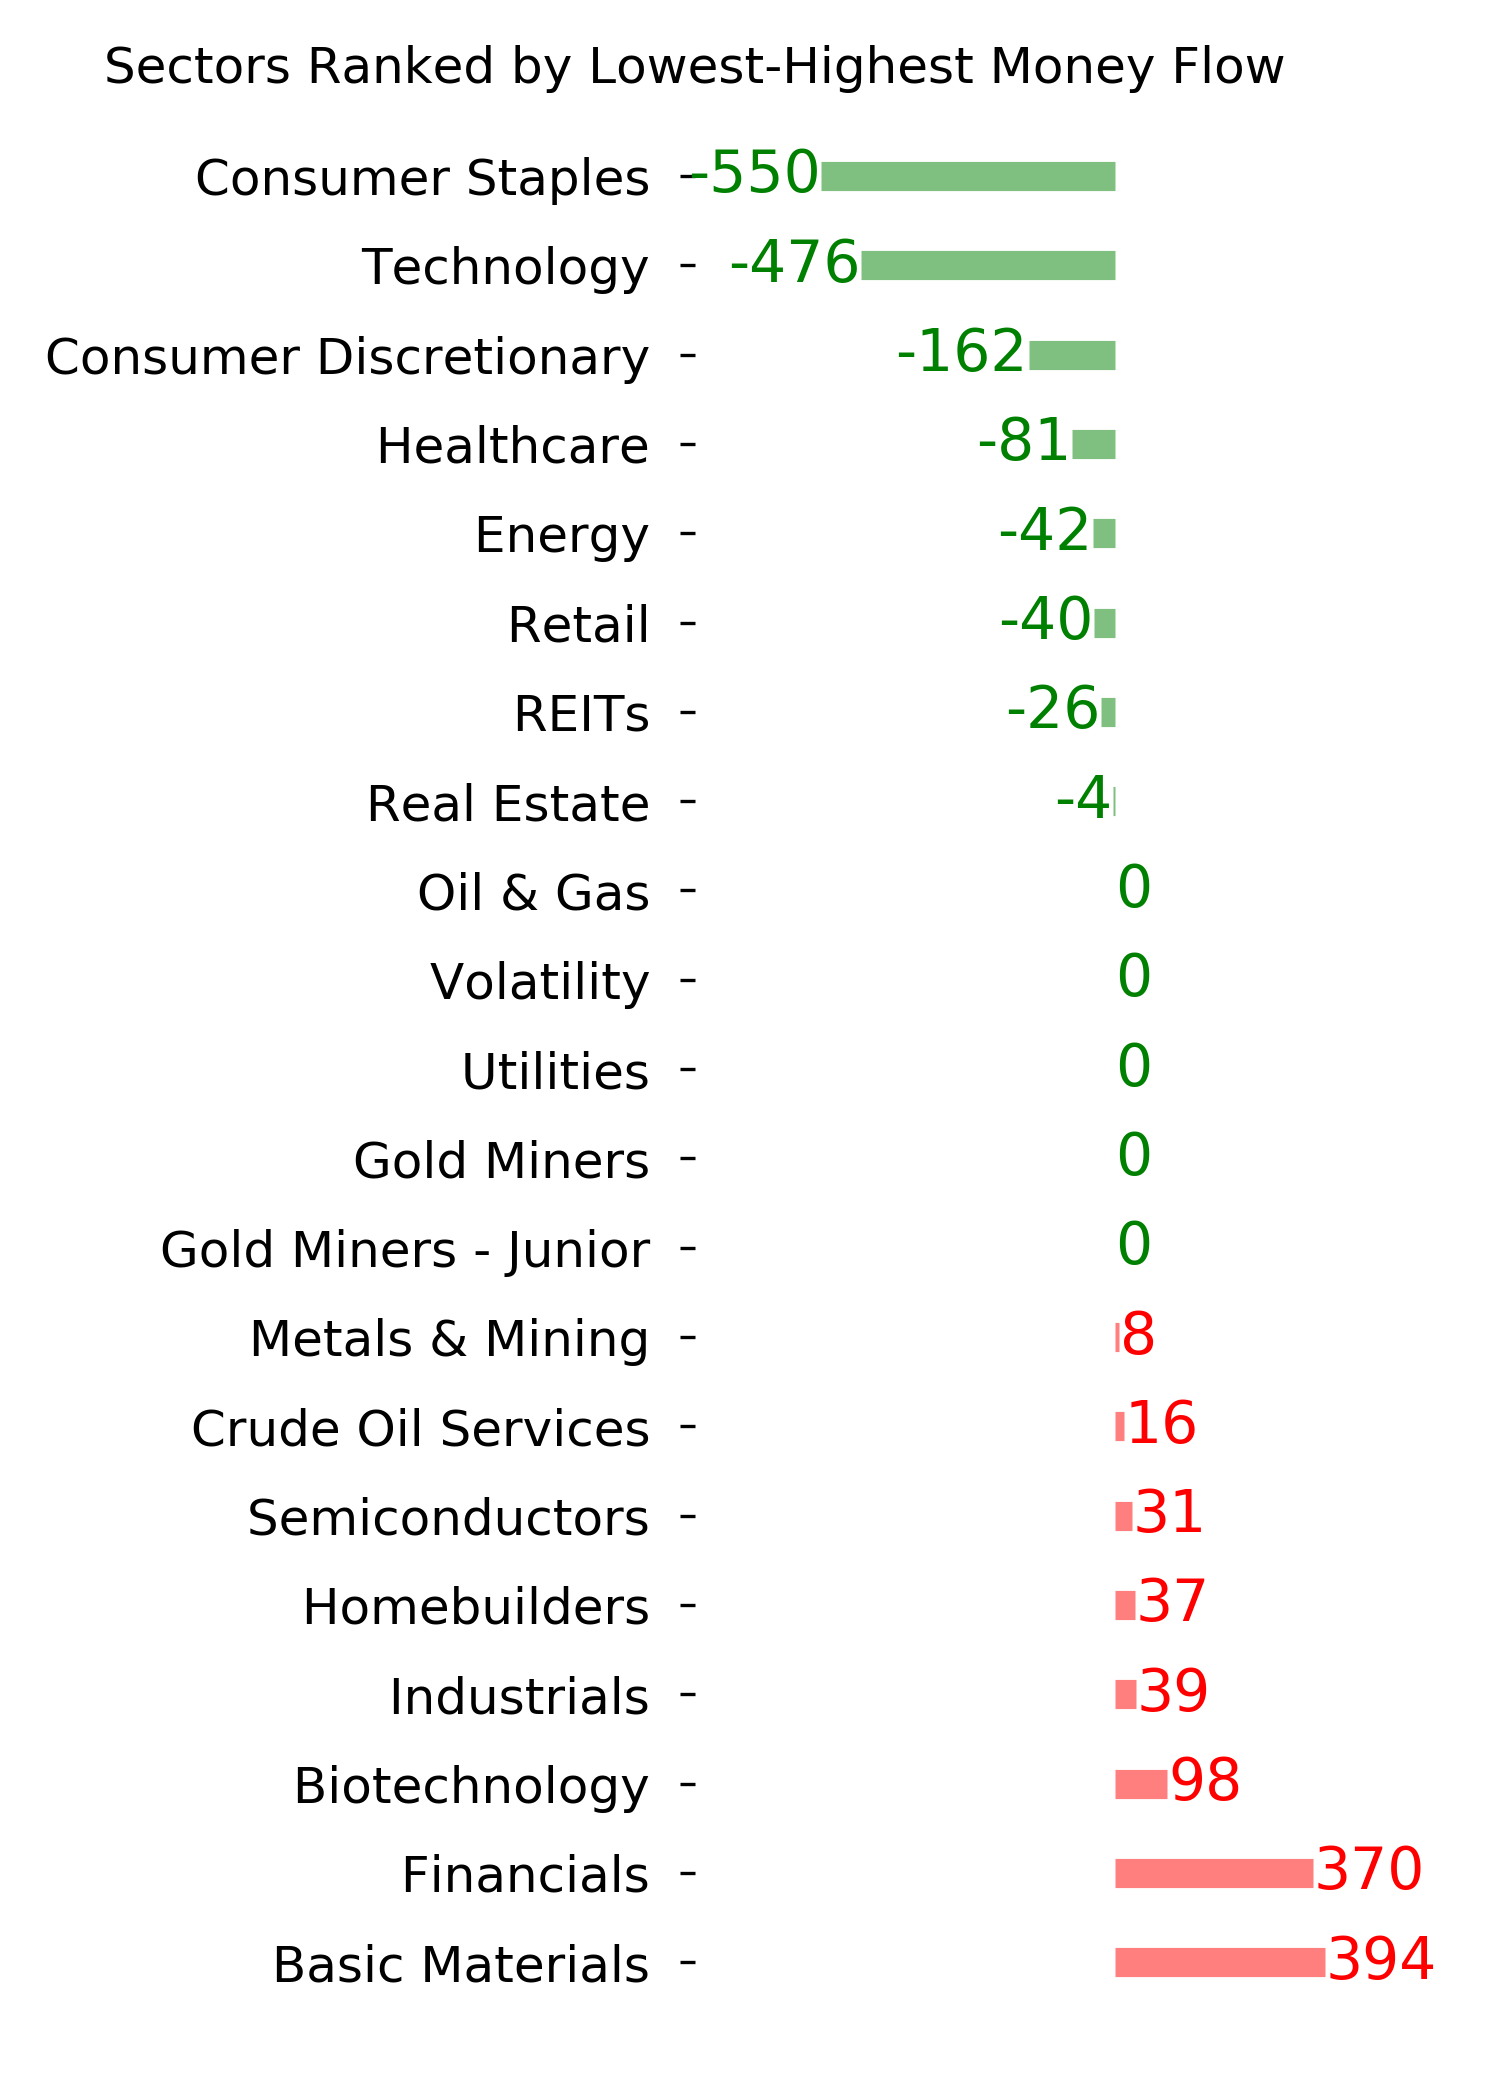
Insiders are (still) buying Financials and Staples
Jay noted that both the financial sector and the consumer staples sector have seen meaningful insider activity recently. While no indicator is ever infallible, insiders are rarely wrong over a 1 to 3-year time frame when they act decisively.
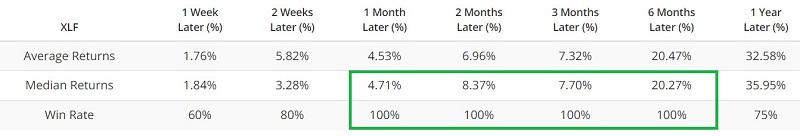
Heavy buying from corporate insiders tends to occur in clusters, and these clusters tend to occur after sharp selloffs in the sector. Not long after the SIVB panic-induced selloff in early 2023, sector insiders ramped up their buying significantly. The chart below shows those times when the insider indicator crossed above 60 for the first time in a year. From 1-6 months later, the XLF fund was higher every time, with exceptional average returns.
Consumer staples are considered a "defensive" sector and tend to outperform during market weakness and underperform during market strength. Given the current state of the market, many investors will ignore staples and focus on sectors more likely to outperform within the context of a bull market. Insiders aren't ignoring their own stocks.
Our Corporate Insider Buy/Sell Ratio - XLP indicator shows a ratio of the total number of corporate insiders that have bought shares on the open market during the past six months versus those that have sold shares. The chart below highlights all weeks when the indicator crossed above 0.12, and the table summarizes subsequent XLP performance.
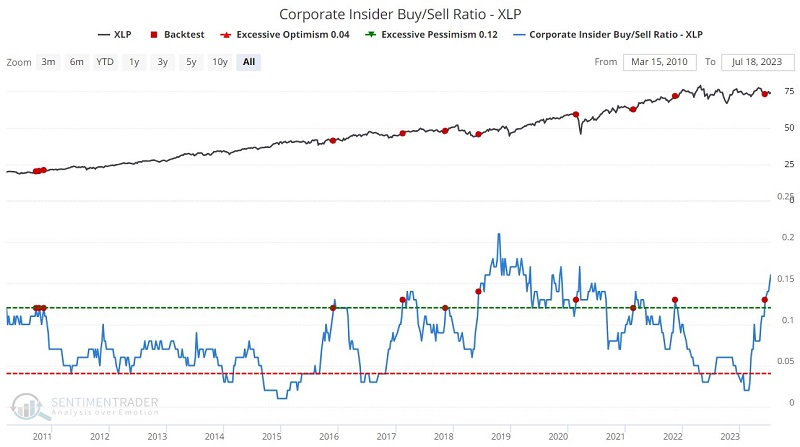
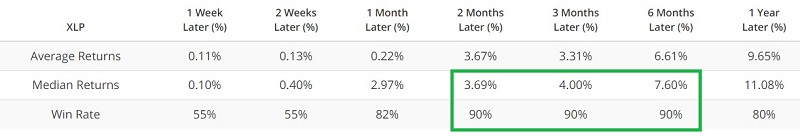
The critical thing to note here is the high Win Rates for two to six months after a signal. Note also that the indicator has continued to rise since first crossing 0.12 on 2023-06-12. This suggests that sector insiders are loading up on their own shares in anticipation of even better sector performance over the next one to three years.
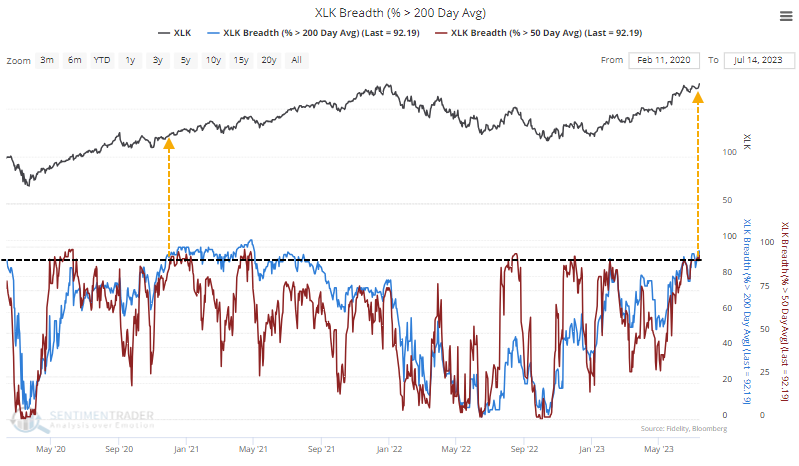
Almost all Technology stocks are in medium- and long-term uptrends
It's no secret that Technology stocks have roared higher this year, though many seem to attribute it solely to the Magnificent Seven. Those stocks have been a large part of the gains in major indexes, but they also mask good performance under the surface.
For the first time in years, more than 93% of these stocks have climbed above both their 50-day and 200-day moving averages. The last time it occurred after a long period without it was in late 2020 as we emerged from the pandemic panic.
When this many Technology stocks climbed above both moving averages for the first time in at least three months, it preceded mostly positive returns across time frames, but nothing too compelling. The last three signals were excellent signs that bear markets were over, even if those forward returns weren't too inspiring.
The current signal is more interesting simply because it had been so long since so many stocks were in medium- and long-term uptrends at the same time. If we look at even more significant signals, those that were at least two years between instances, the win rate improves even more. There was only one that was truly a false signal - in 1987, this triggered right before the Black Monday crash. But that was also one of the few signals that didn't occur after a prolonged bear market. The ones that did all led to excellent long-term gains.
A preferred way we have of looking at data like this is through cycles. More than 93% of Technology stocks are above their 50- and 200-day averages for the first time since fewer than 7% of the stocks were above those averages. Similar cycles preceded even better medium-term returns for the sector.
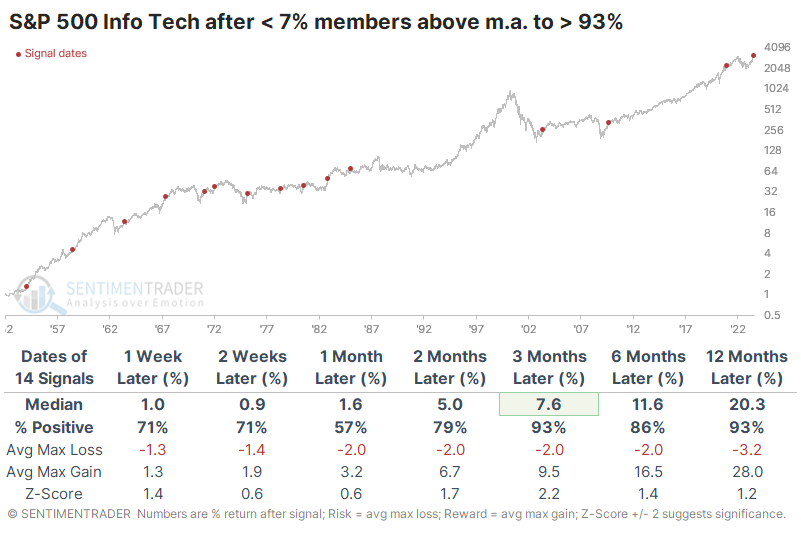
It was a fantastic sign for the broader S&P 500 index as well. Over the next three and twelve months, the index rose every time. The most impressive aspect of these signals was the minimal drawdown over the next year. At no point within the following year did the S&P decline more than -6.4% across any of the signals.
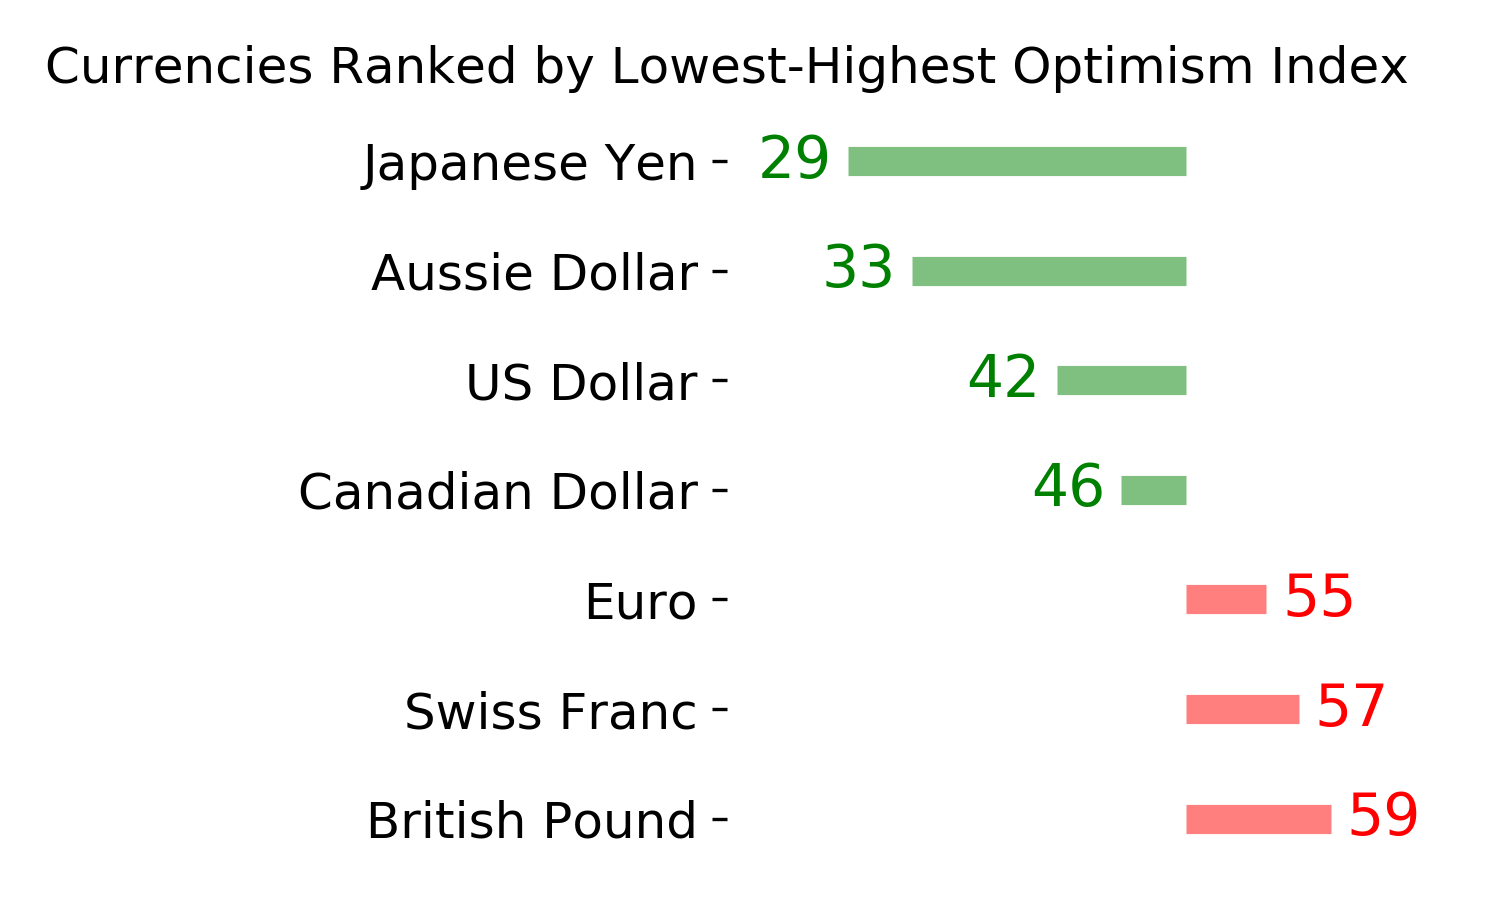
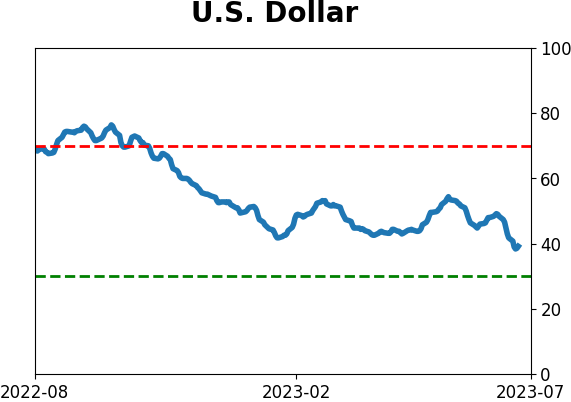
The buck is falling, and investors are giving up
The U.S. dollar is losing ground quickly, and traders are giving up. For the first time in two years, the dollar's Optimism Index has dropped below 40.
For the most part, when sentiment is poor on a currency, it tends to keep declining, and vice-versa. We can see that in the chart below - the buck's annualized return with an Optimism Index (Optix) below 40 was -0.3%.
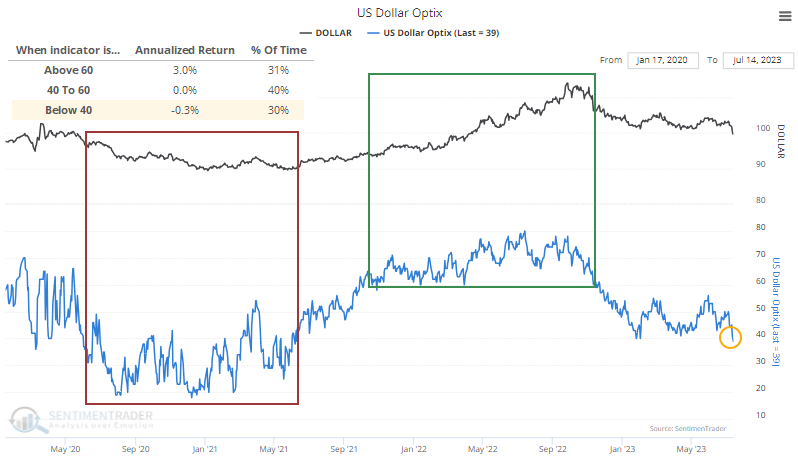
During strong uptrends, sentiment tends to get high and stay high. During downtrends, pessimism is rampant, and the currency tends to sink. At some point, sentiment becomes so extreme that the trend reverses, but we're far from that point now. That's the general pattern with how sentiment works, but it tends to be exacerbated for currencies, with sentiment getting stuck at mediocre extremes for longer.
It's hard to blame dollar bulls for losing faith after a 5-day stretch that was one of the worst in years. The table below shows returns in the dollar after it fell to a 52-week low and suffered a one-week loss that was the worst in at least six months.
Over the next 2-12 weeks, the buck rallied only 26% of the time, with risk about two to three times greater than reward. Out of 19 precedents, only 2 showed gains across most time frames. Only four signals managed more reward than risk over the next three months.
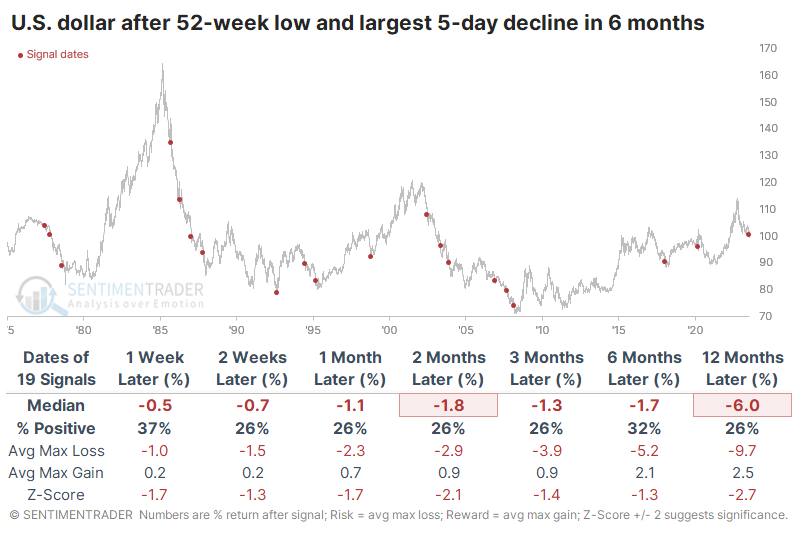
Among other assets, stocks tended to do quite well after the dollar suffered. All the major indexes rallied well, with the most consistent gains in the Nasdaq Composite and Russell 2000. Since 1990, the MSCI Emerging Markets Index showed a median return of +12.2% over the next three months with 9 winners out of 12 signals and only one loss larger than -4%.
About TradingEdge Weekly...
The goal of TradingEdge Weekly is to summarize some of the research published to SentimenTrader over the past week. Sometimes there is a lot to digest, and this summary highlights the highest conviction or most compelling ideas we discussed. This is NOT the published research; rather, it pulls out some of the most relevant parts. It includes links to the published research for convenience, and if you don't subscribe to those products, it will present the options for access.
Indicators at Extremes
|
|
|
Phase Table
|
|
|
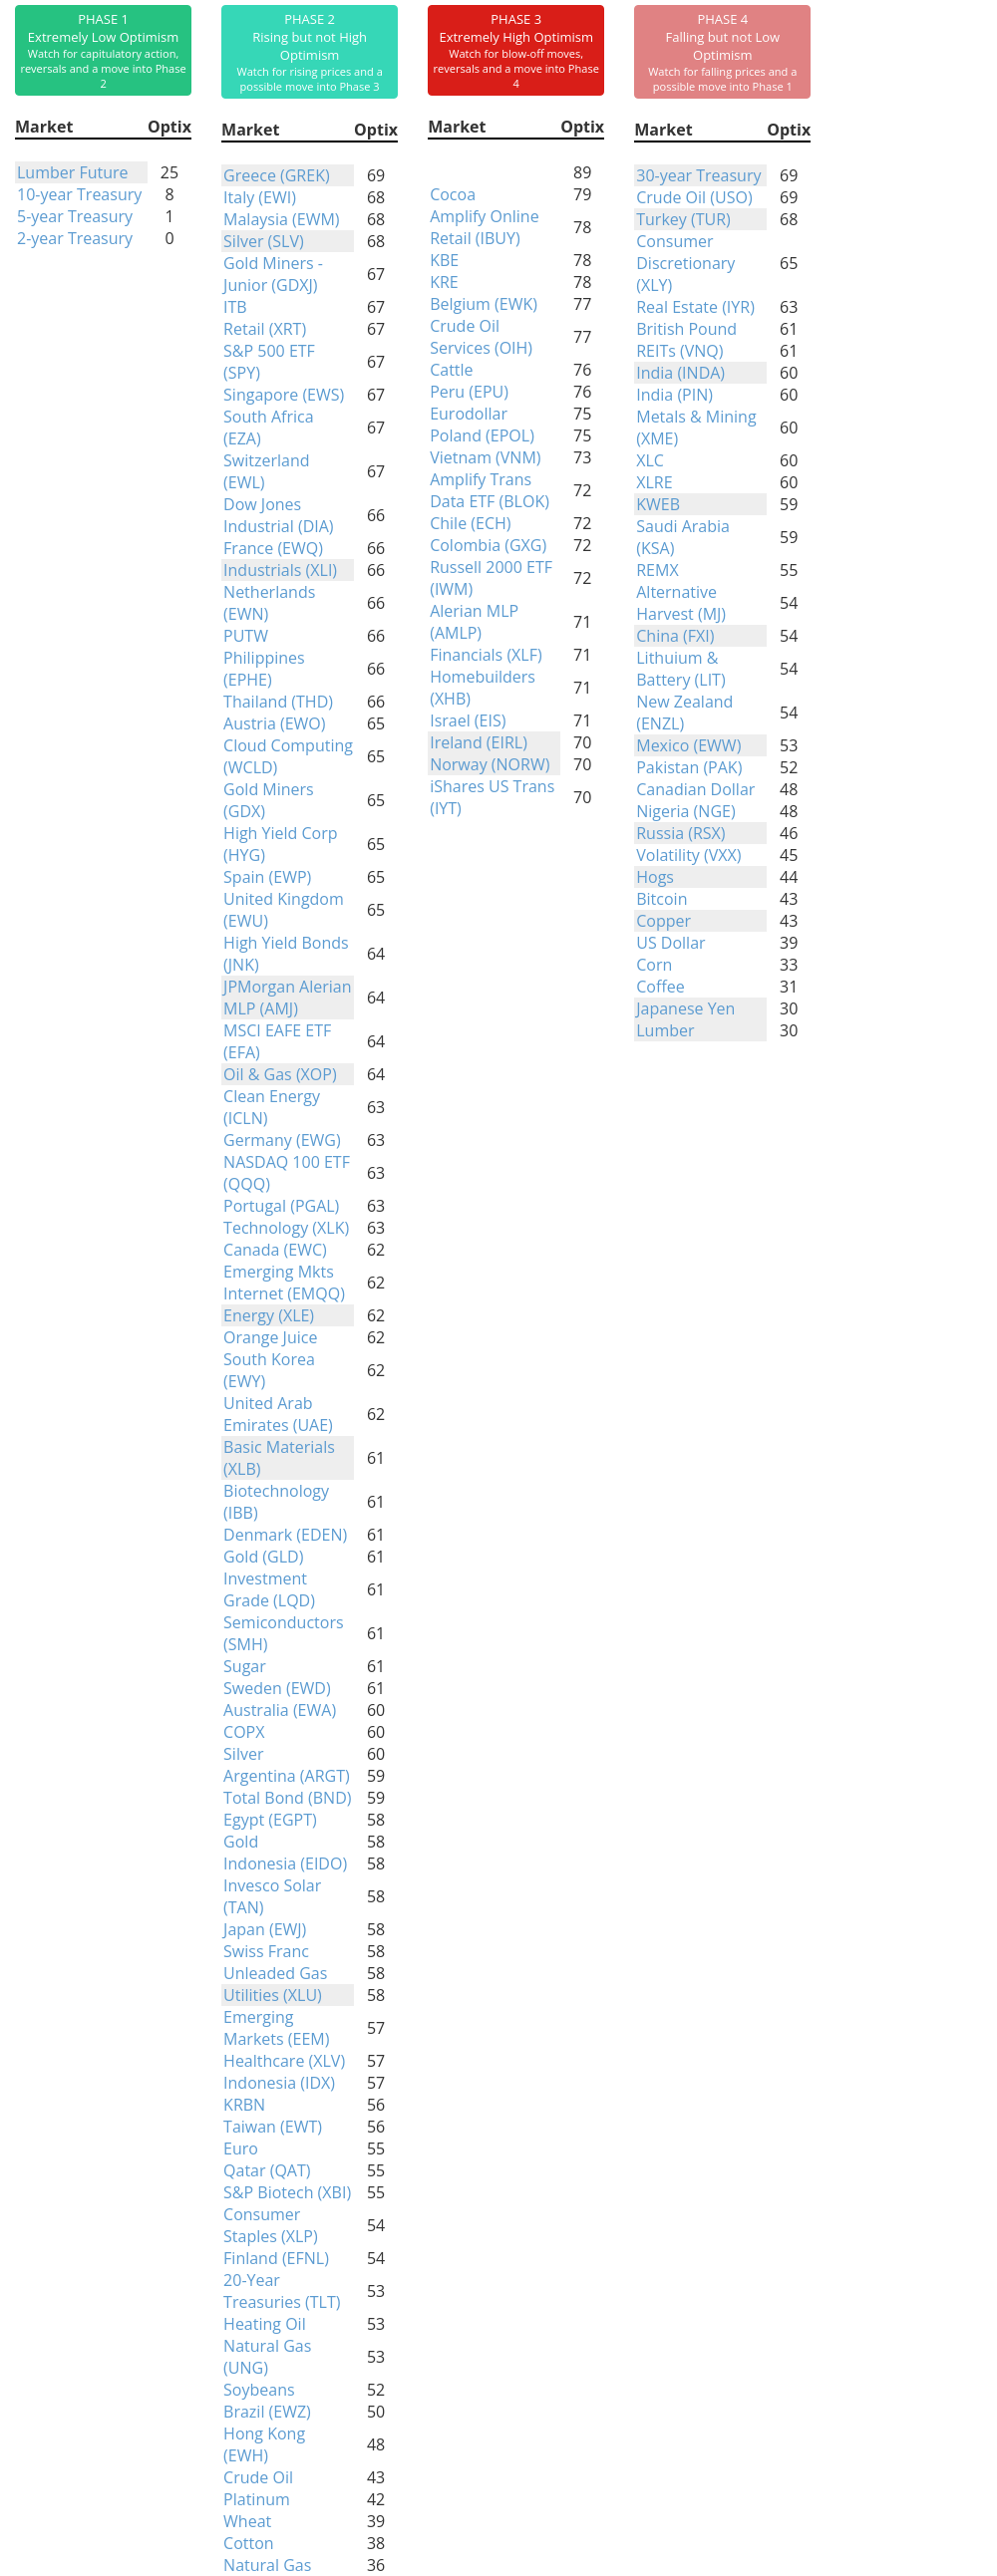
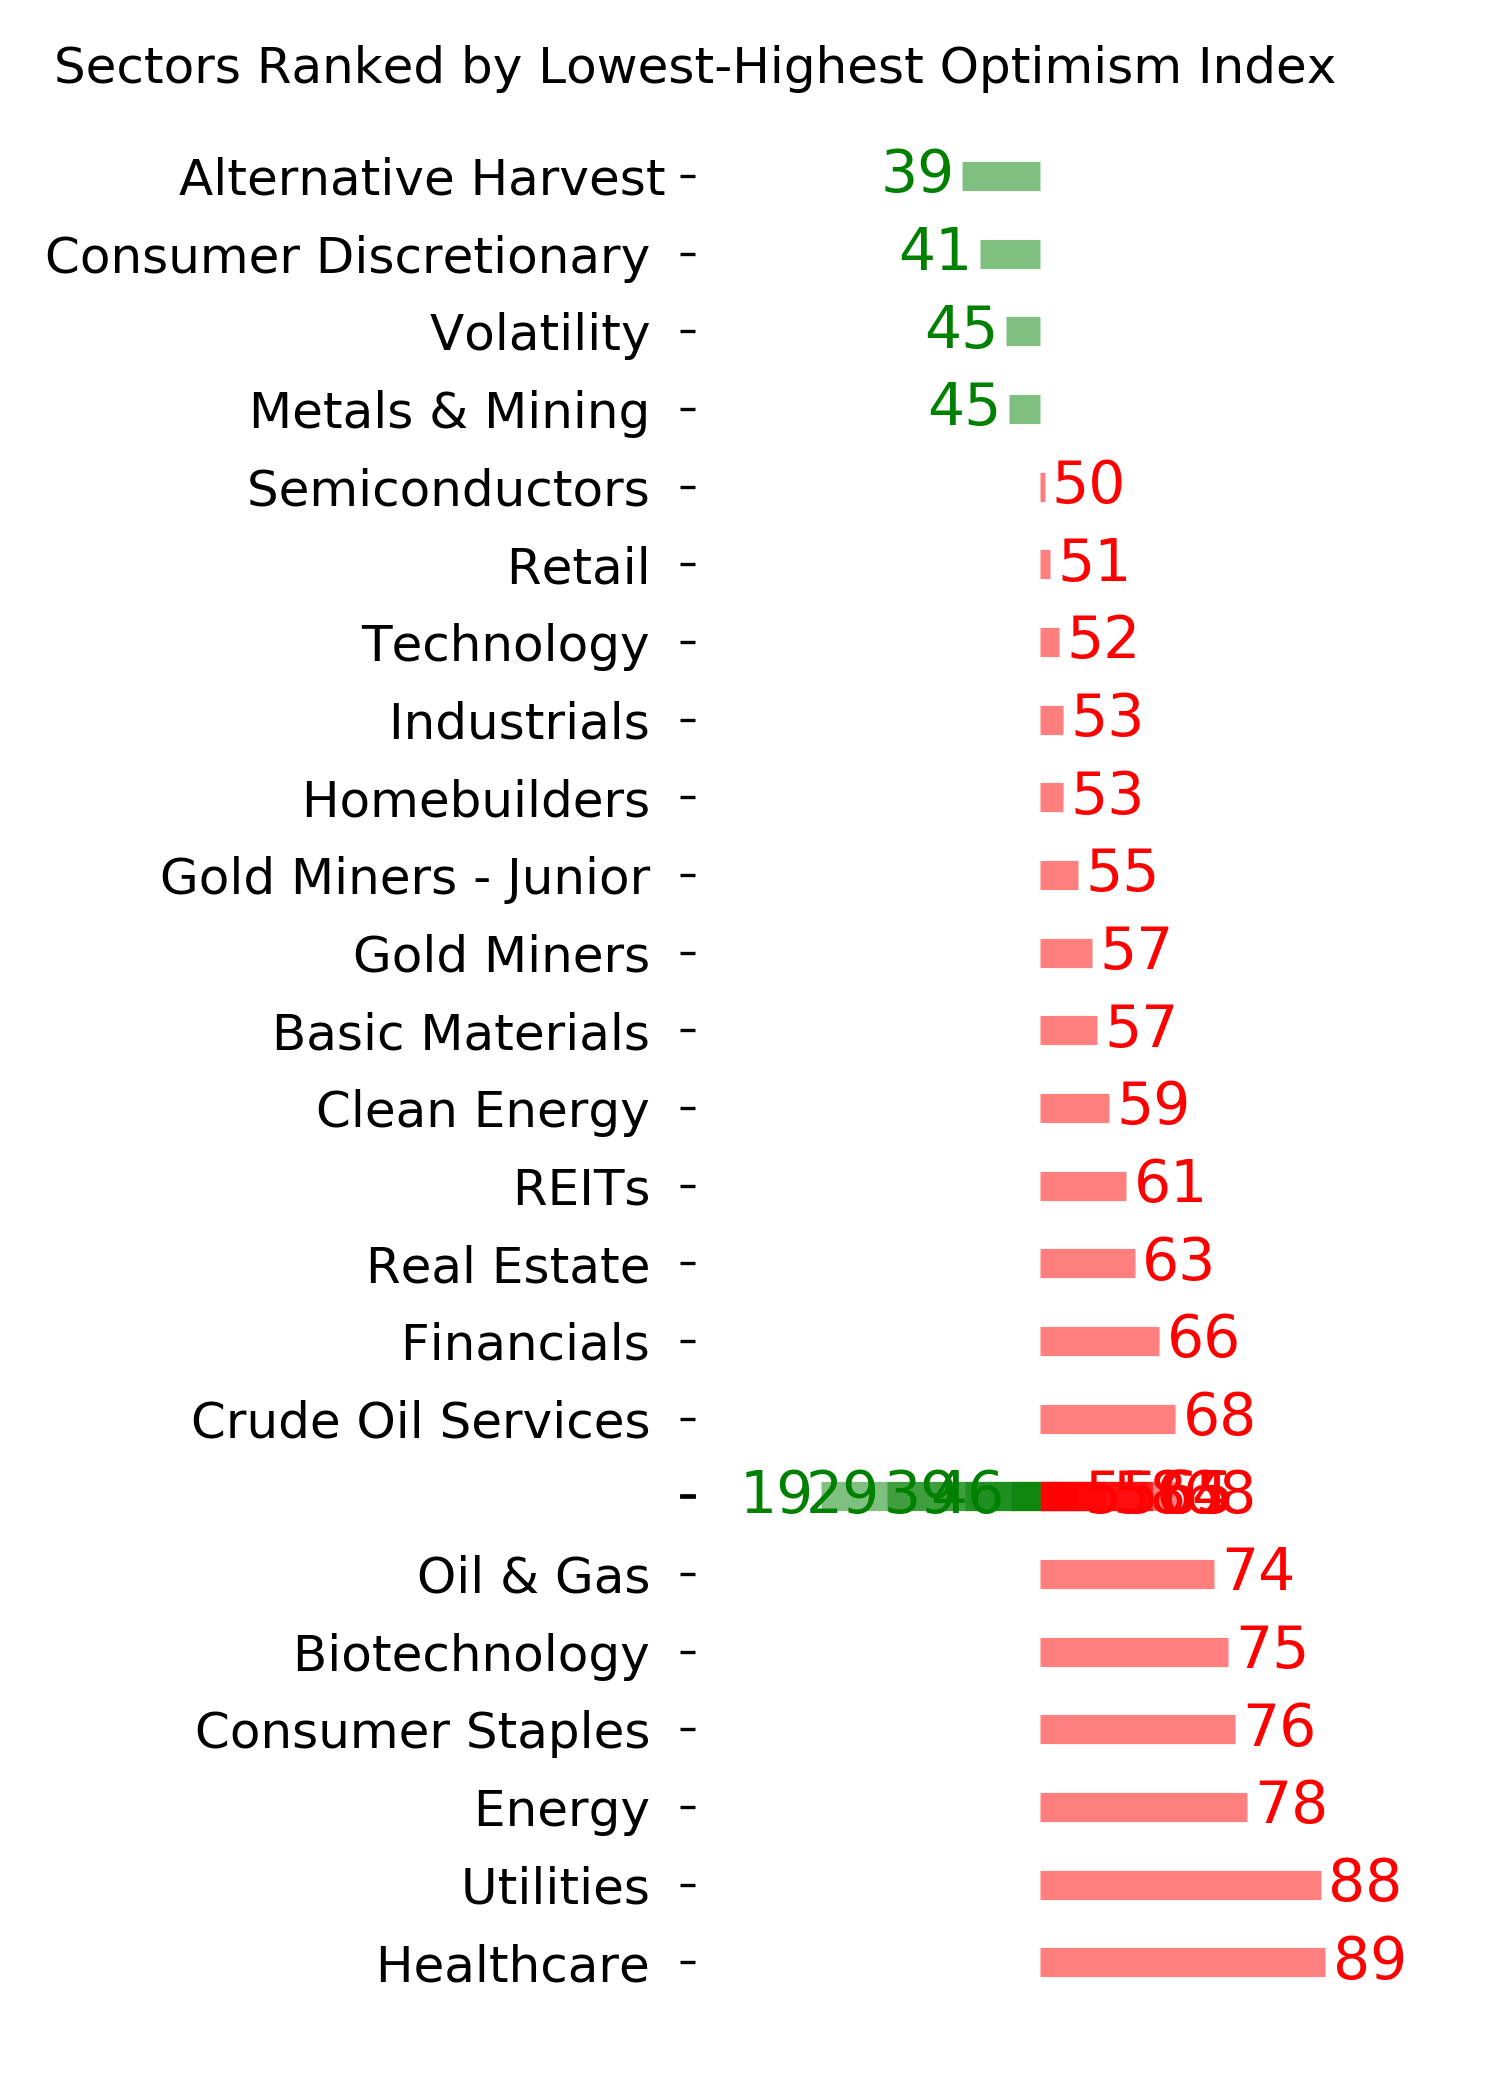
Ranks
|
|
|
|
|
|
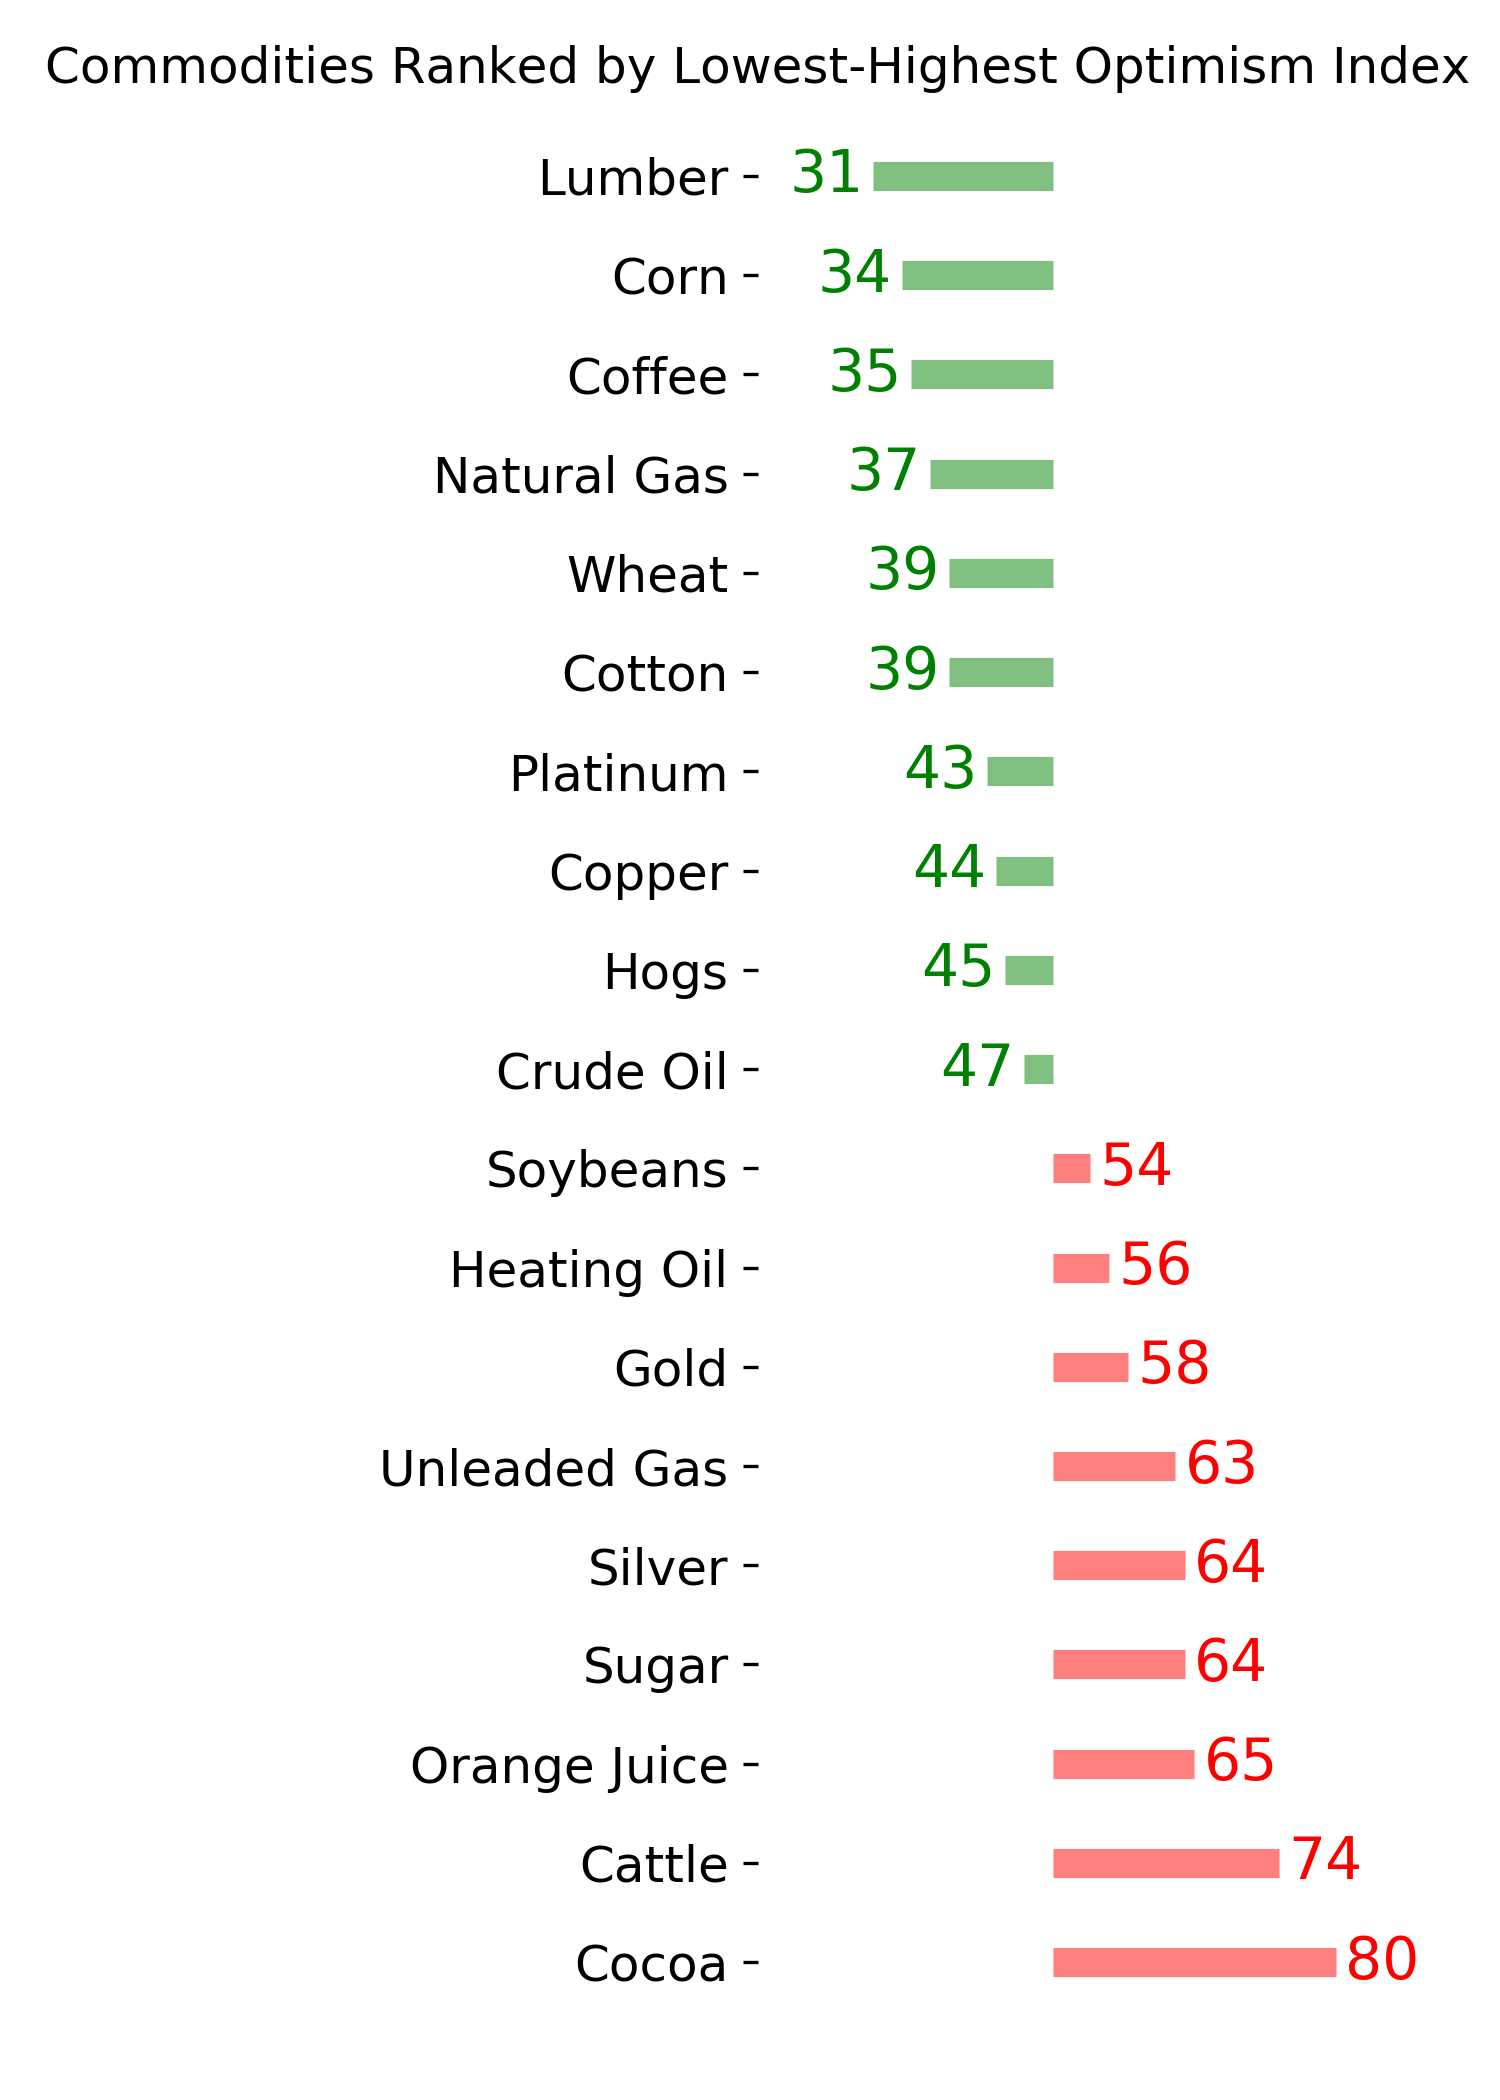
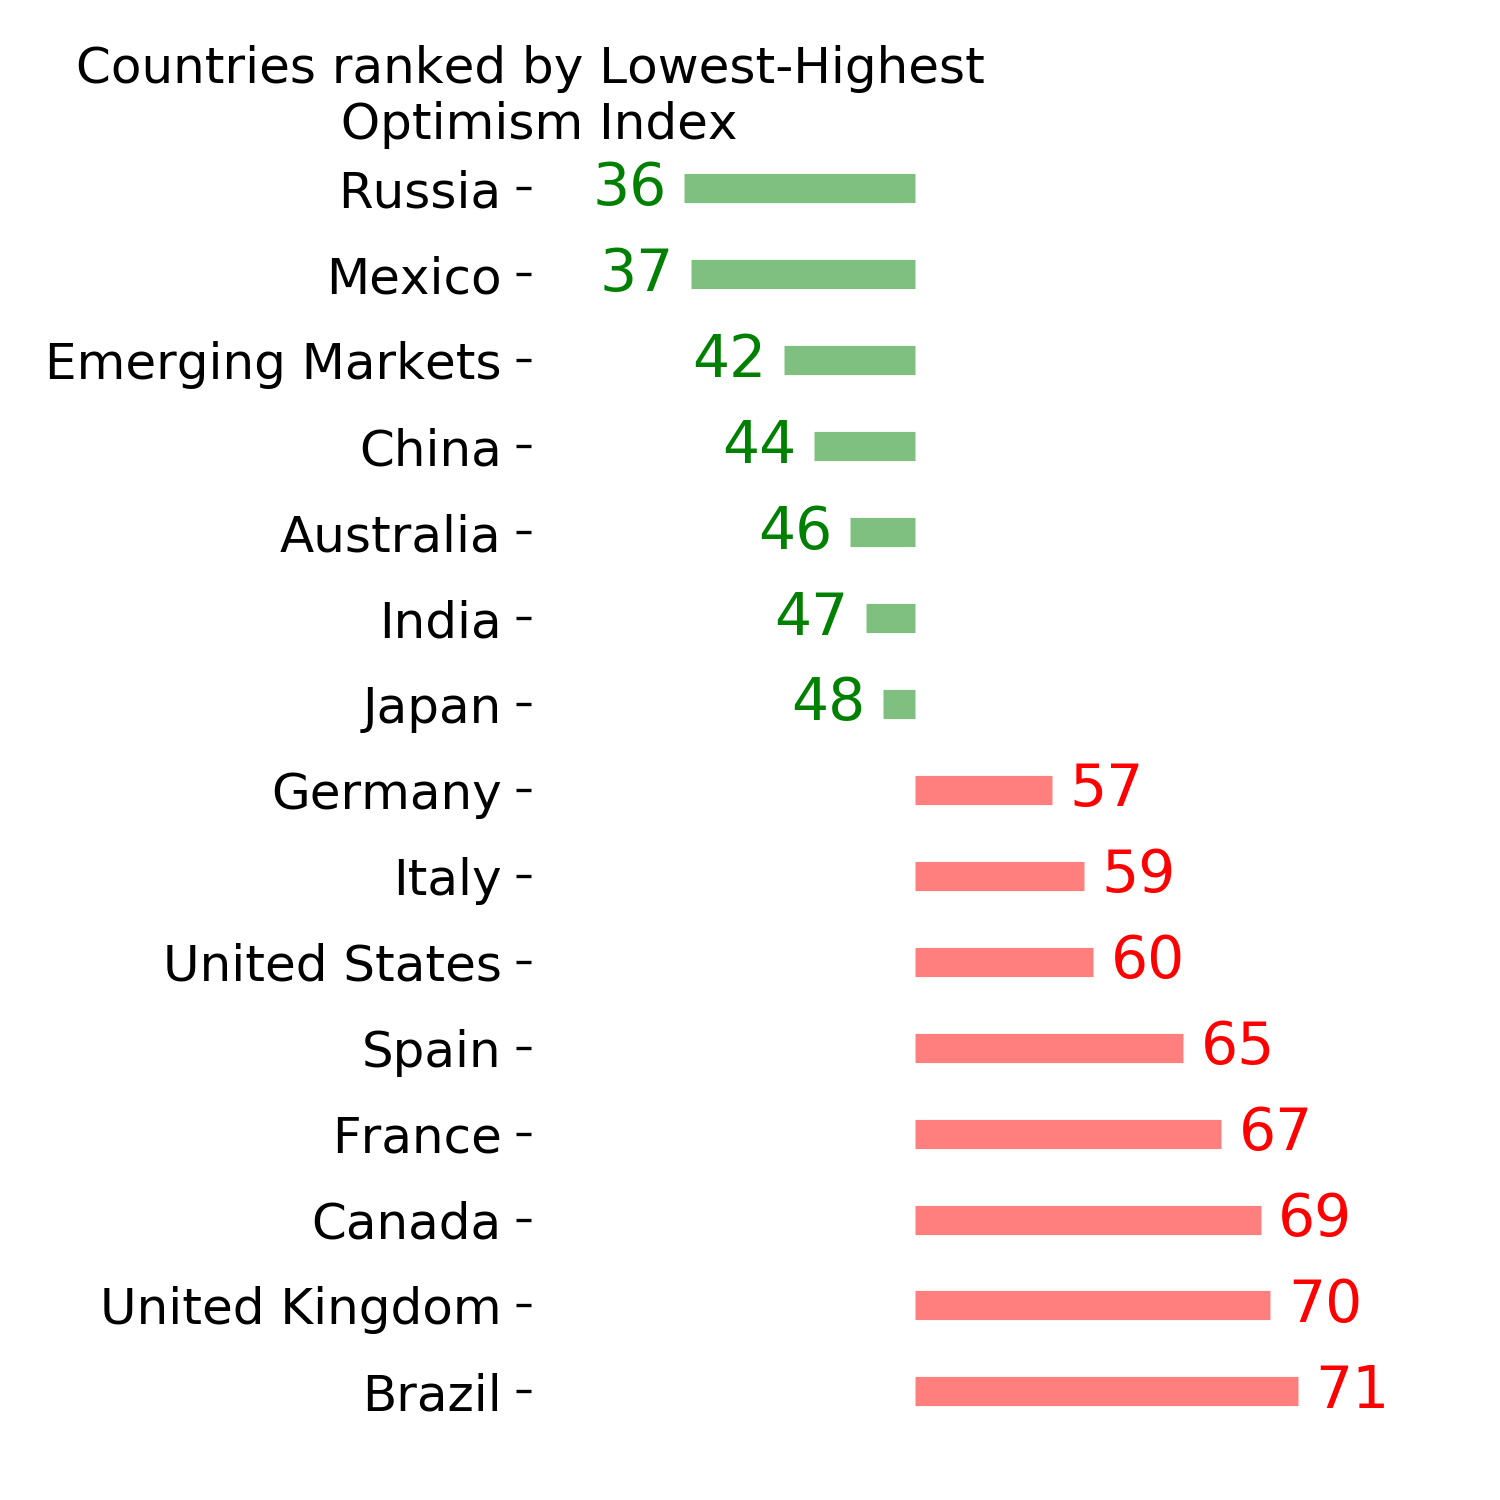
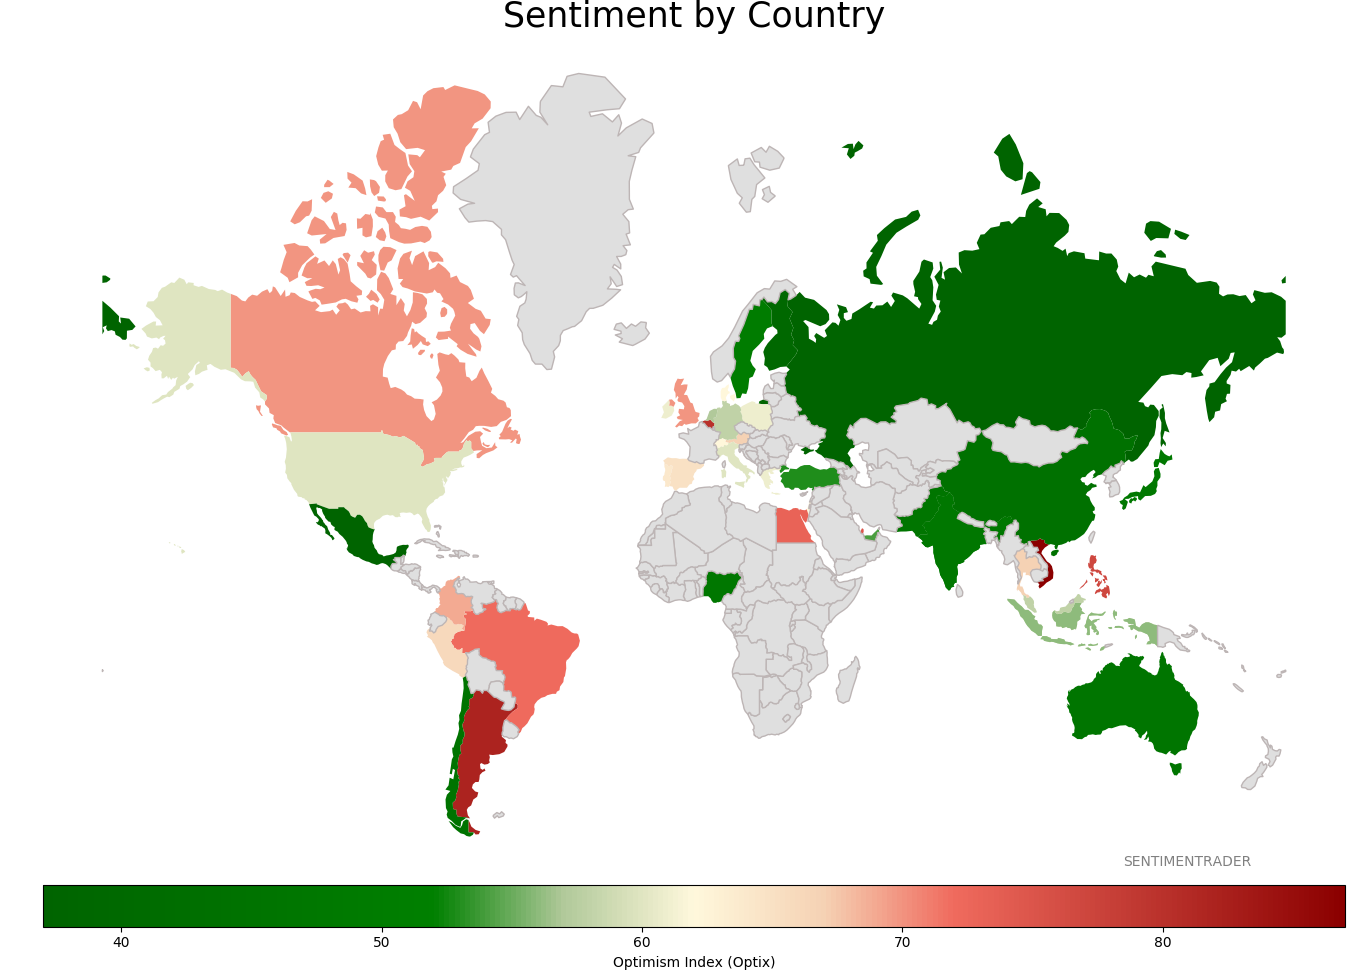
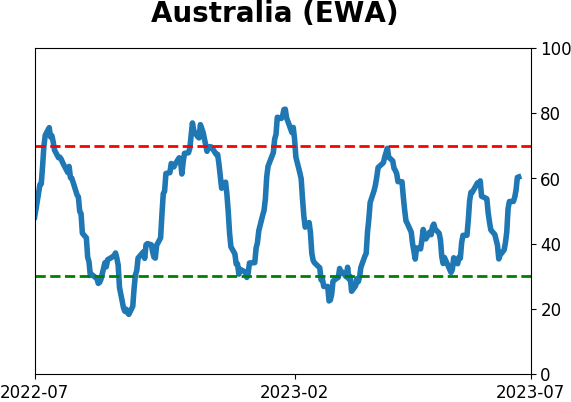
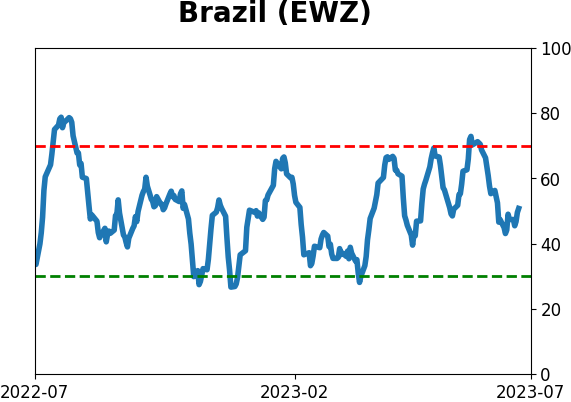
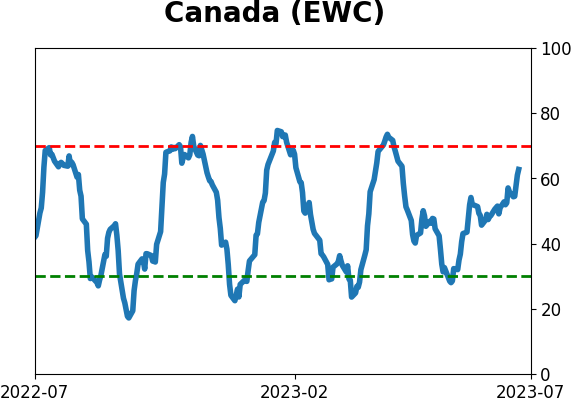
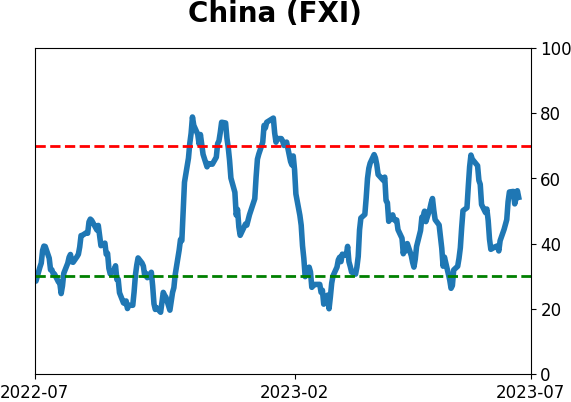
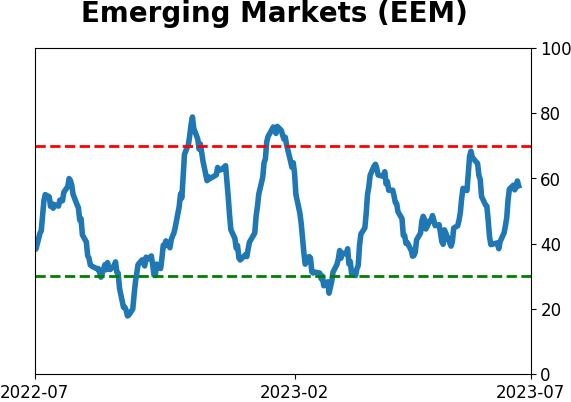
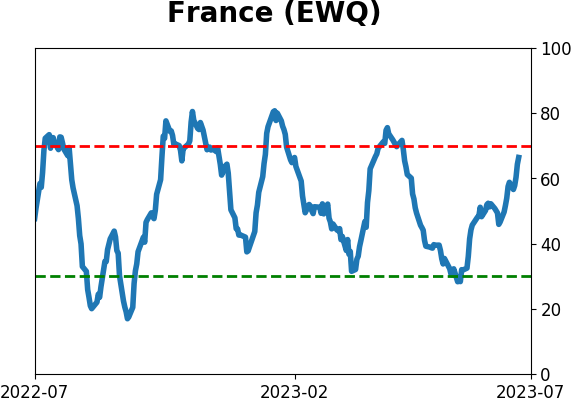
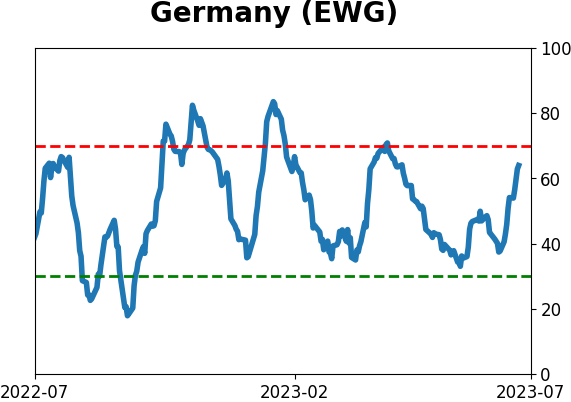
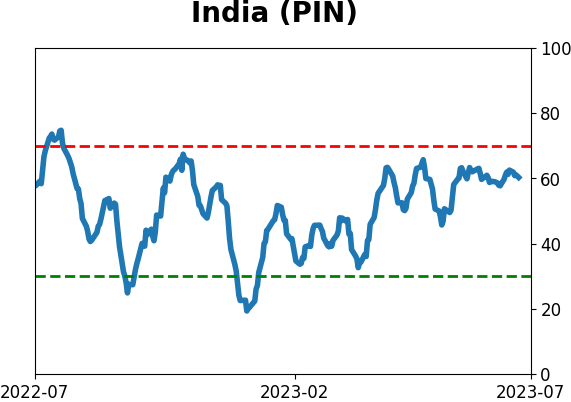
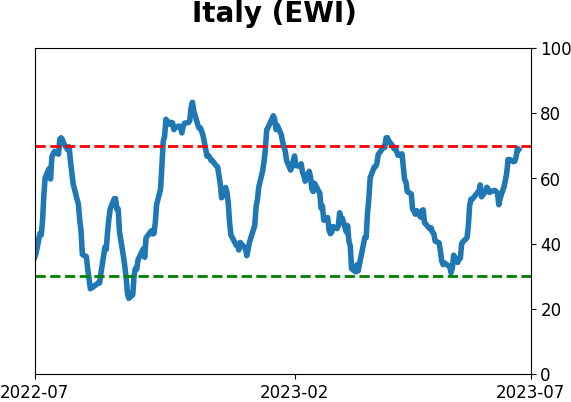
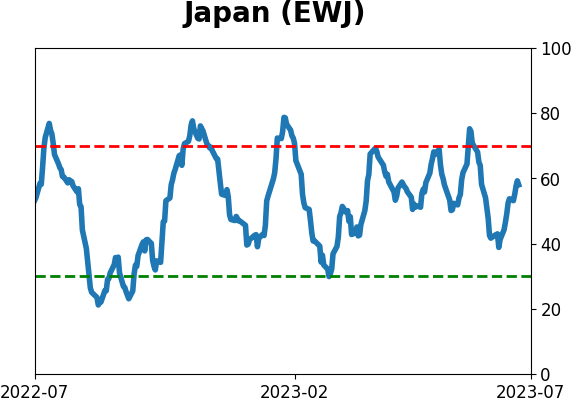
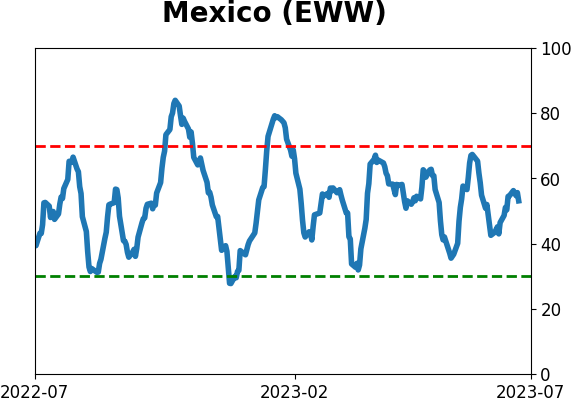
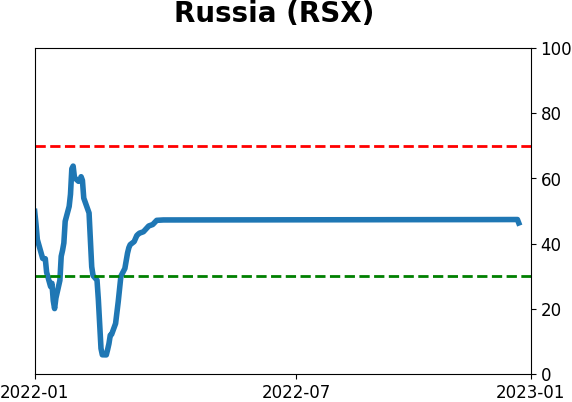
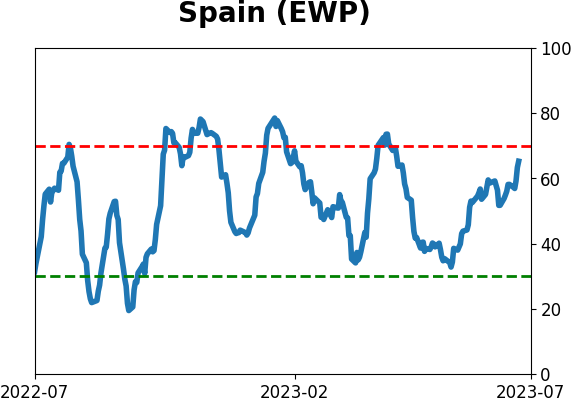
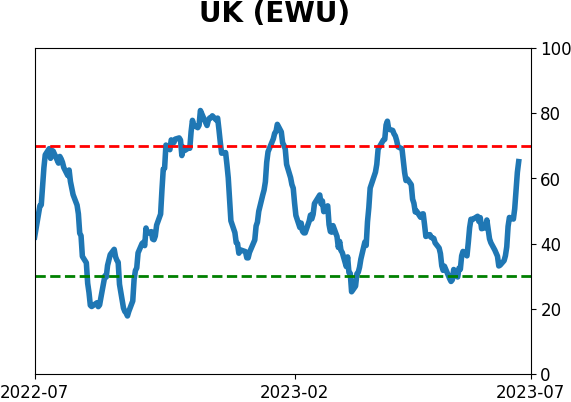
Sentiment Around The World
|
|
|
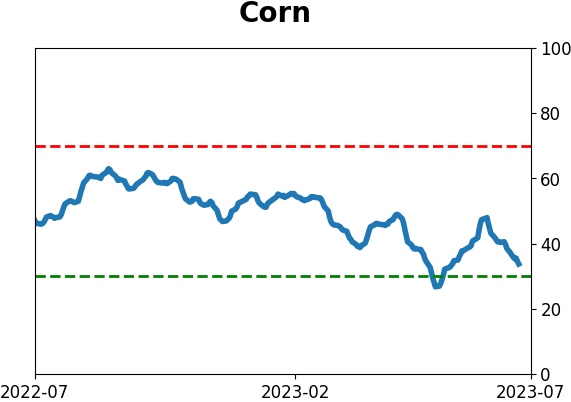
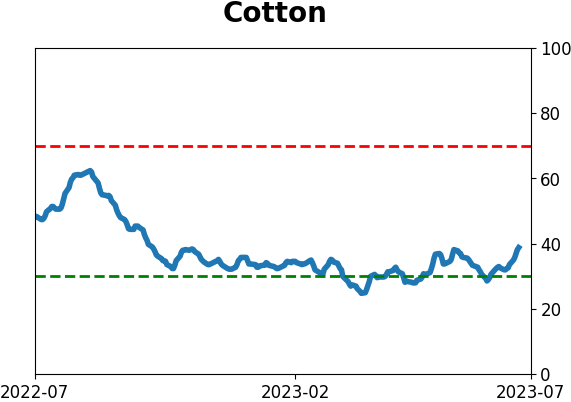
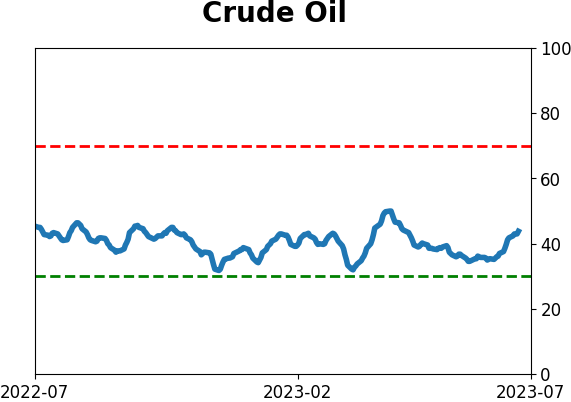
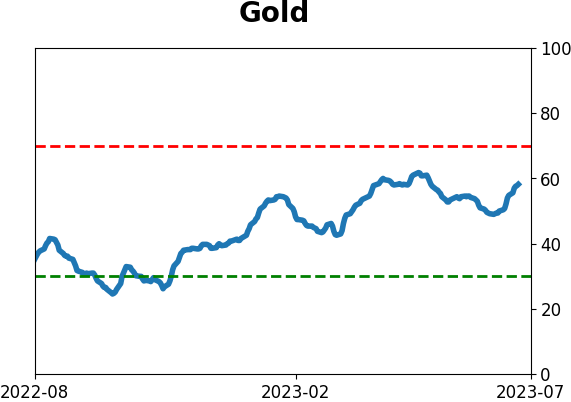
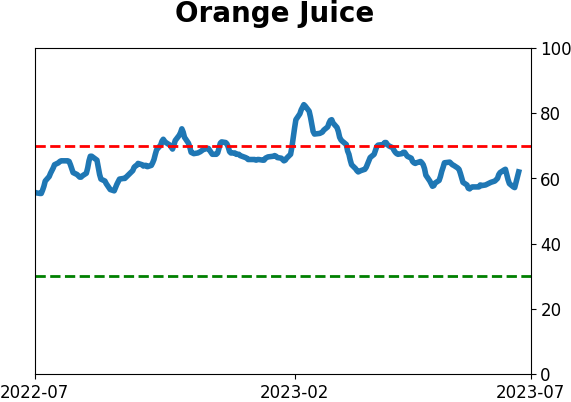
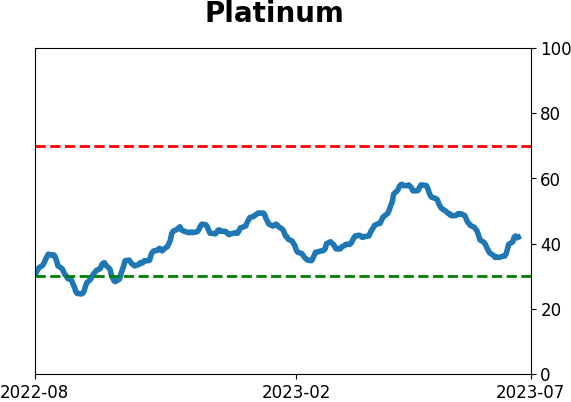
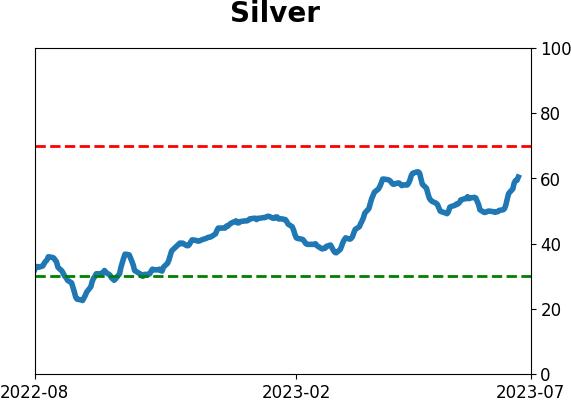
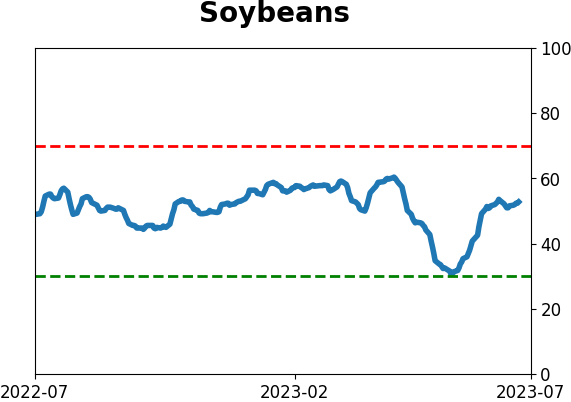
Optimism Index Thumbnails
|
|
|
|
|
|
|
|
|
|
|
|
|
|
|
|
|
|
|
|
|