Headlines
|
|
A market environment so bad it might be good:
The market environment still can't turn positive. Like we've seen with other factors, about the only way this can be a positive is that it's been so bad for so long. Over the past 6 months, almost every day has had a negative environment and the average day rivals the worst markets in 60 years.
|
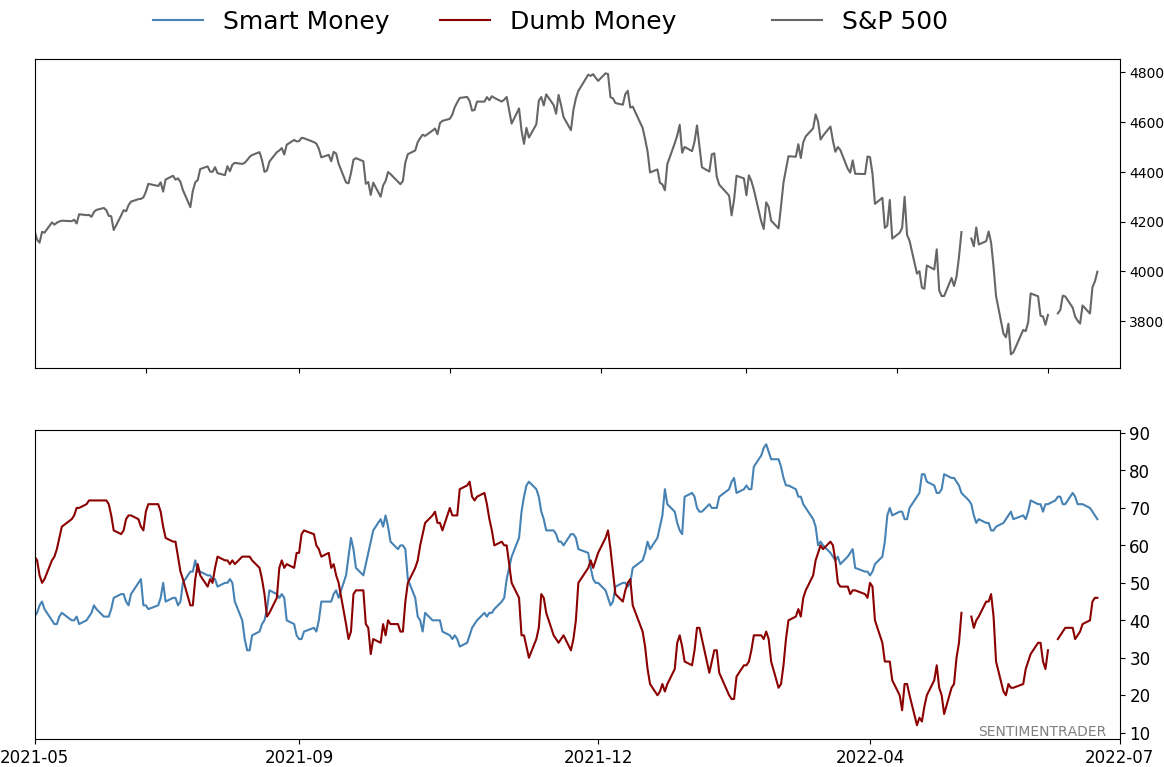
Smart / Dumb Money Confidence
|
Smart Money Confidence: 67%
Dumb Money Confidence: 46%
|
|
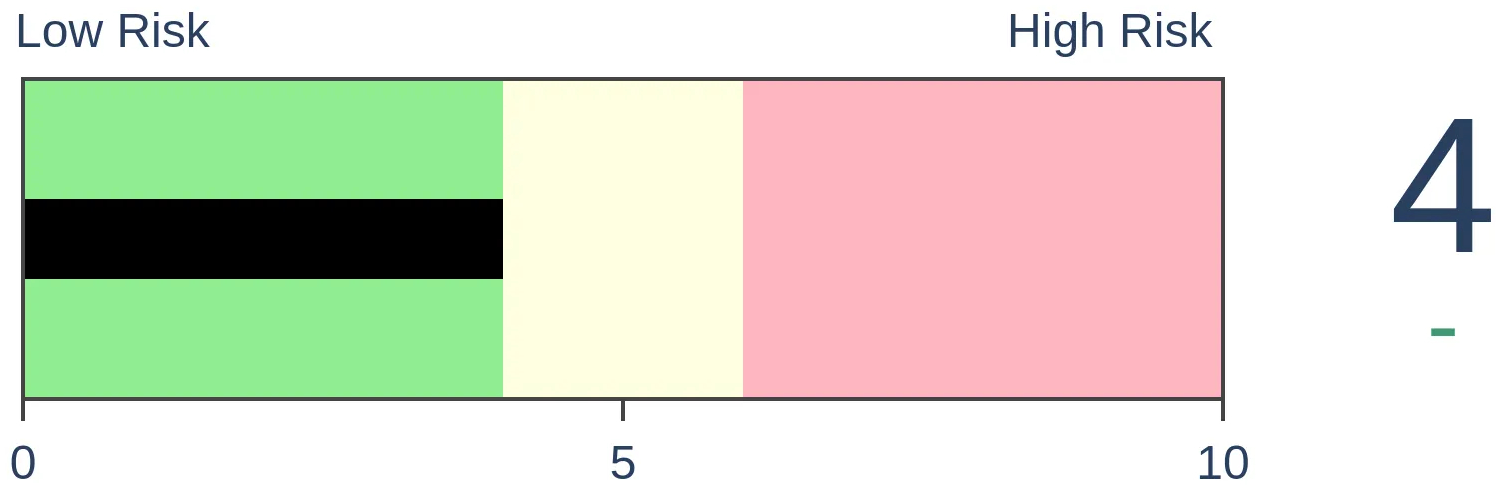
Risk Levels
Stocks Short-Term
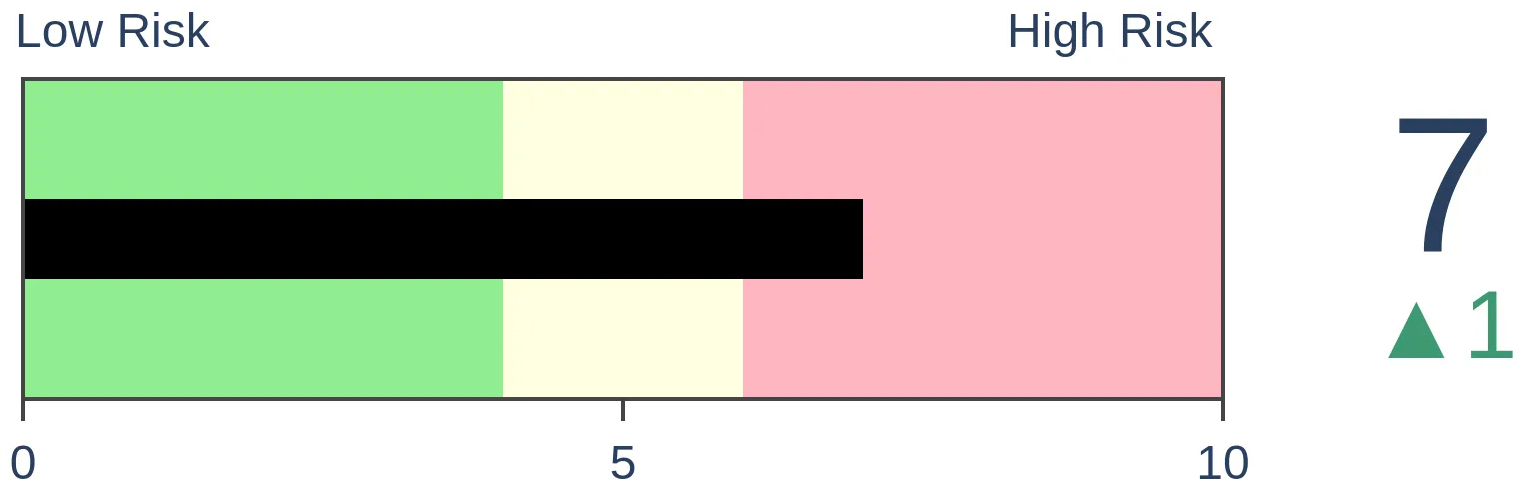
|
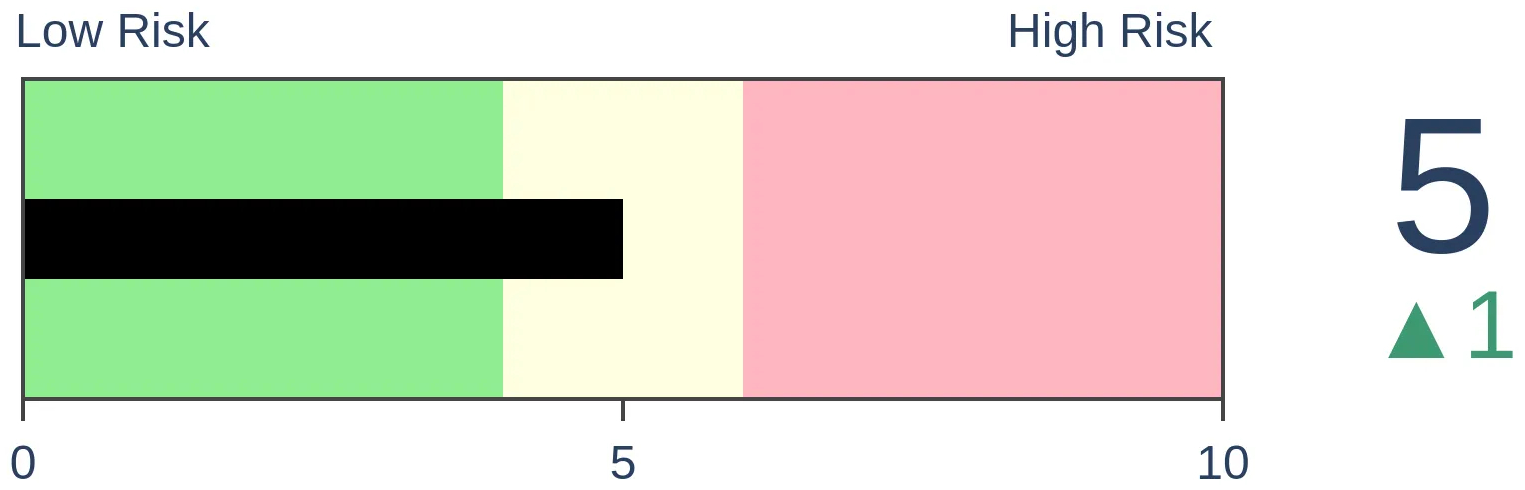
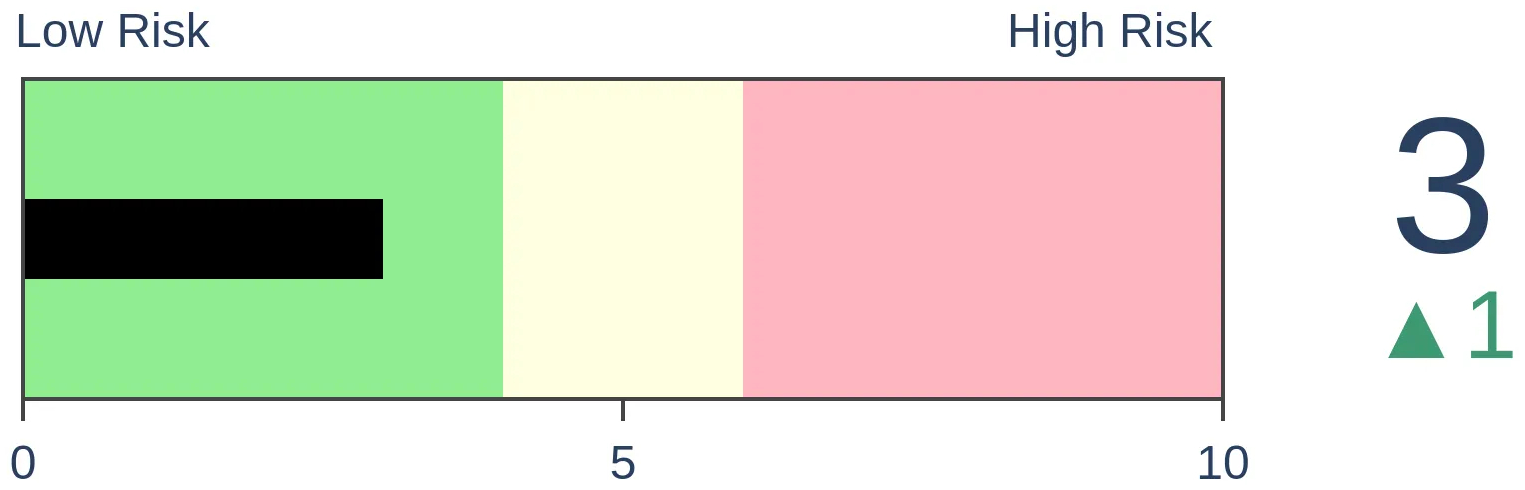
Stocks Medium-Term

|
|
Bonds
|
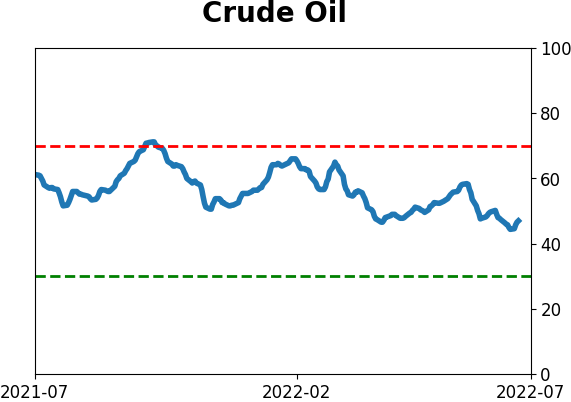
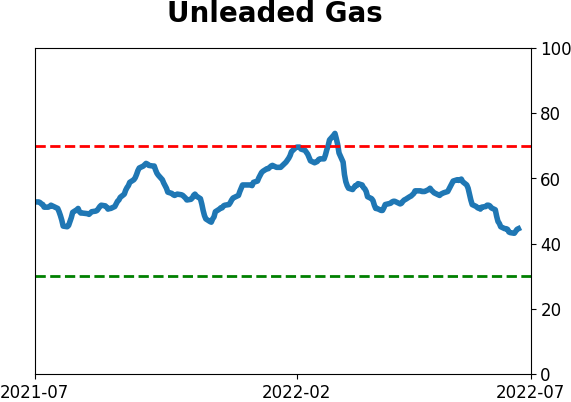
Crude Oil
|
|
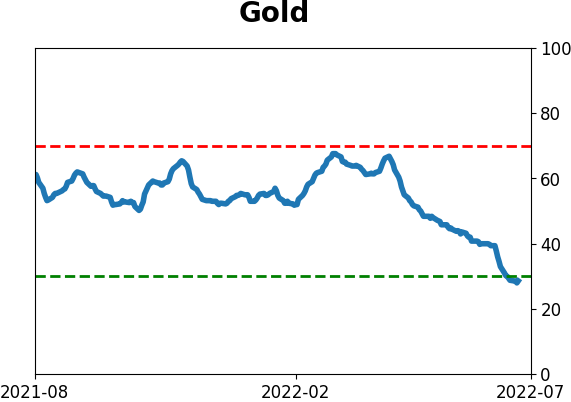
Gold
|
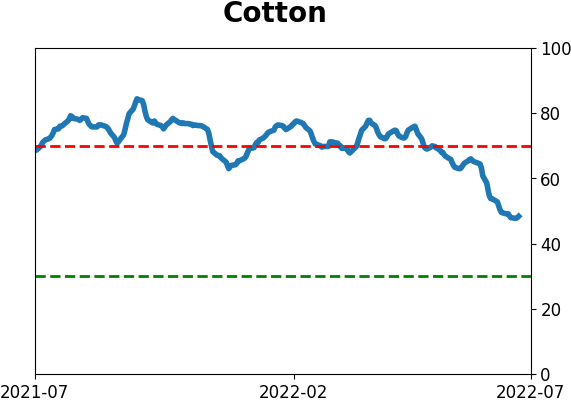
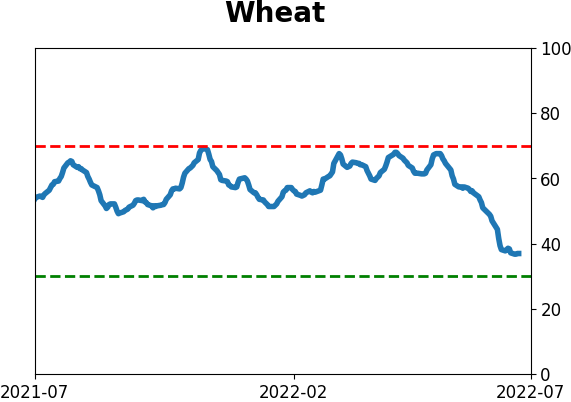
Agriculture
|
|
Research
By Jason Goepfert
BOTTOM LINE
The market environment still can't turn positive. Like we've seen with other factors, about the only way this can be a positive is that it's been so bad for so long. Over the past 6 months, almost every day has had a negative environment and the average day rivals the worst markets in 60 years.
FORECAST / TIMEFRAME
None
|
Key points:
- Over the past six months, the market environment has been positive for only four days
- An average day during this stretch has had a terrible environment, rivaling the worst in 60 years
- Forward returns tend to be positive after such bad (for so long) markets, with a major exception
The market environment rivals the worst ever
As late as April, we've been waiting (and waiting and waiting) for the environment to turn more positive. It refuses.
The conditions are ripe, following extended bouts of extreme pessimism, smart money buying, and nascent signs of eager buying pressure. Even so, the environment remains solidly negative, based on some basic measures that we've outlined before.
Since January, the environment has been doing what it always does in a bear market - remain unhealthy, with every brief foray into healthy territory immediately getting batted down. While there has been broad buying pressure over the past week, it's going to take a lot more than that to turn the tide in a sustainable way.
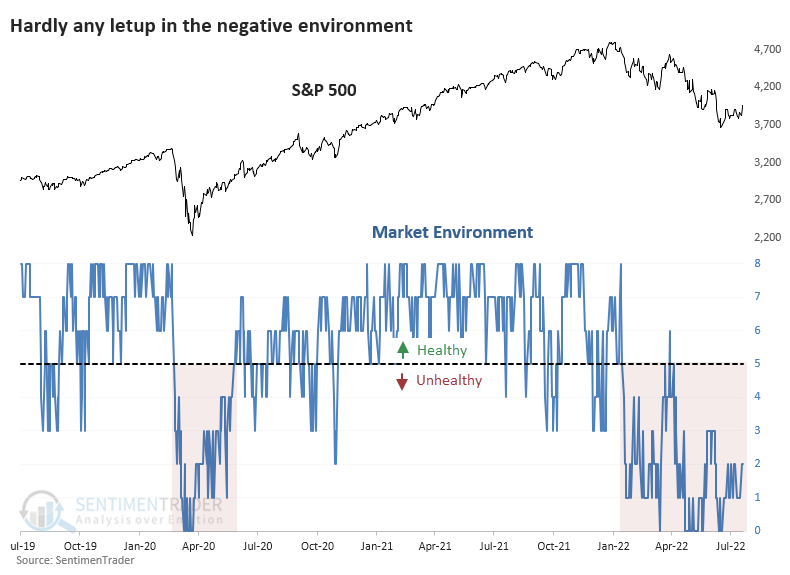
Like so many other factors we've discussed in recent weeks, about the only potential positive from the bad market environment is just how bad it has been and for how long. Over the past six months, only four days have managed to score 5 or above (each factor in the table above gets a score of "1" if it's healthy). This is the fewest days over a 6-month span since 2009.
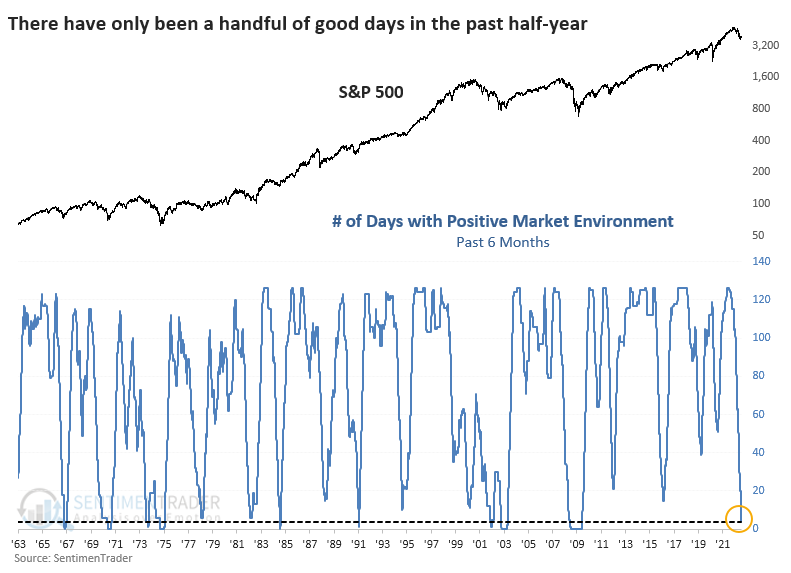
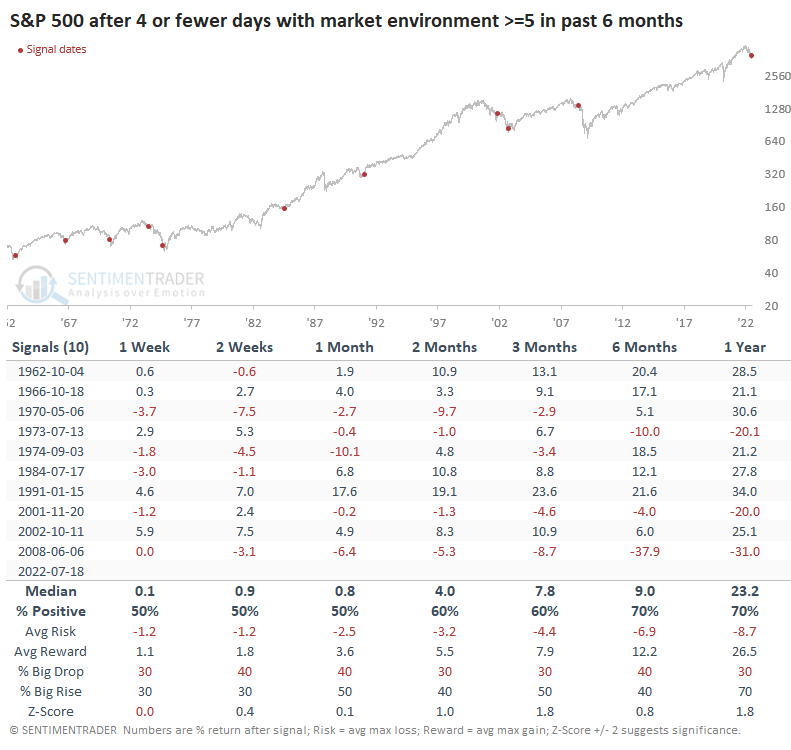
Such an extended period with so few healthy days occurred only during the worst markets, which is no surprise.
Forward returns were mostly positive, but that pesky 1973 instance pops up again. And the post-internet bubble, with its grinding bear market, ended up preceding some significant losses. But the biggest failure was during the financial crisis when this extended bout with a poor environment only hinted at scary things to come.
An environment not just "not good" but outright terrible
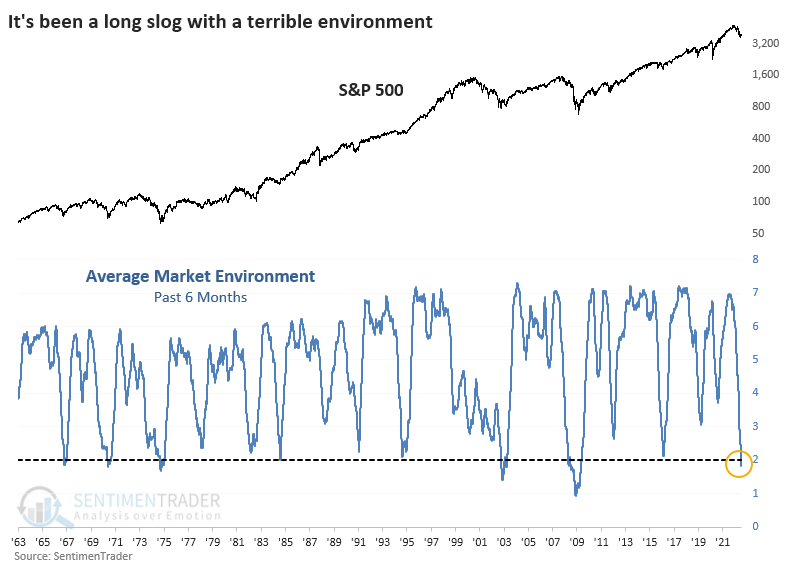
More notable is just how hostile the environment has been. It hasn't just been "not positive," it has been downright wretched. Many days had only 1 or 2 healthy factors. So, the average daily score of the market environment has dived below 2.0, again the worst since 2009. The current 6-month average ranks in the bottom 2% of all readings since 1962.
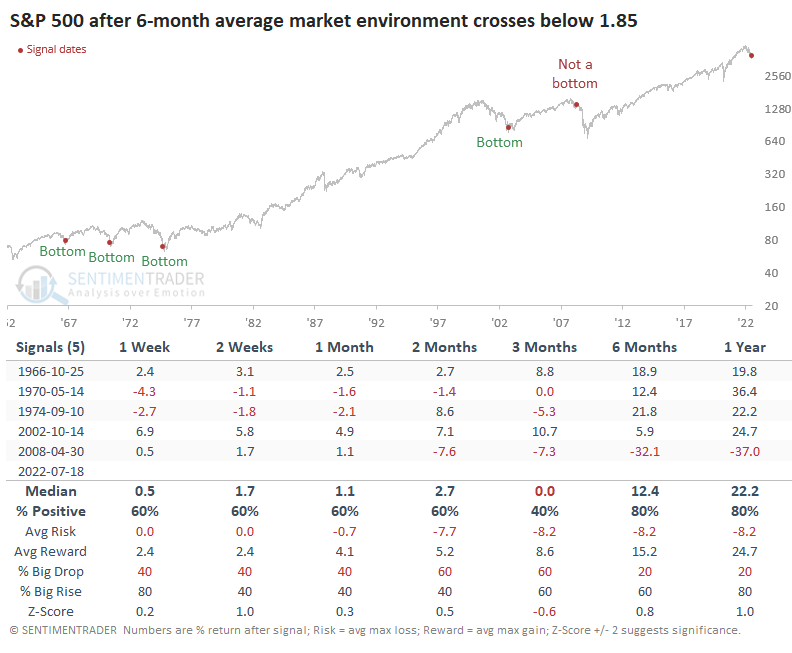
The handful of times it got this bad, for this long, it coincided with the end games of bear markets...except once. And that once was a doozy, again during the financial crisis. Buying stocks just because of the bad environment would have meant a world of hurt for investors.
What the research tells us...
Betting on a market just because things are bad isn't an easy strategy. When things are bad for a long time, they become more tenable but can still be subject to severe (though usually temporary) losses. We see that above, with a market environment so bad for so long that it tends to lead to positive forward returns...except when it doesn't, then those returns tend to be very bad. The last handful of days with eager buying interest is a good sign that perhaps we've endured the worst of the selling.
Indicators at Extremes
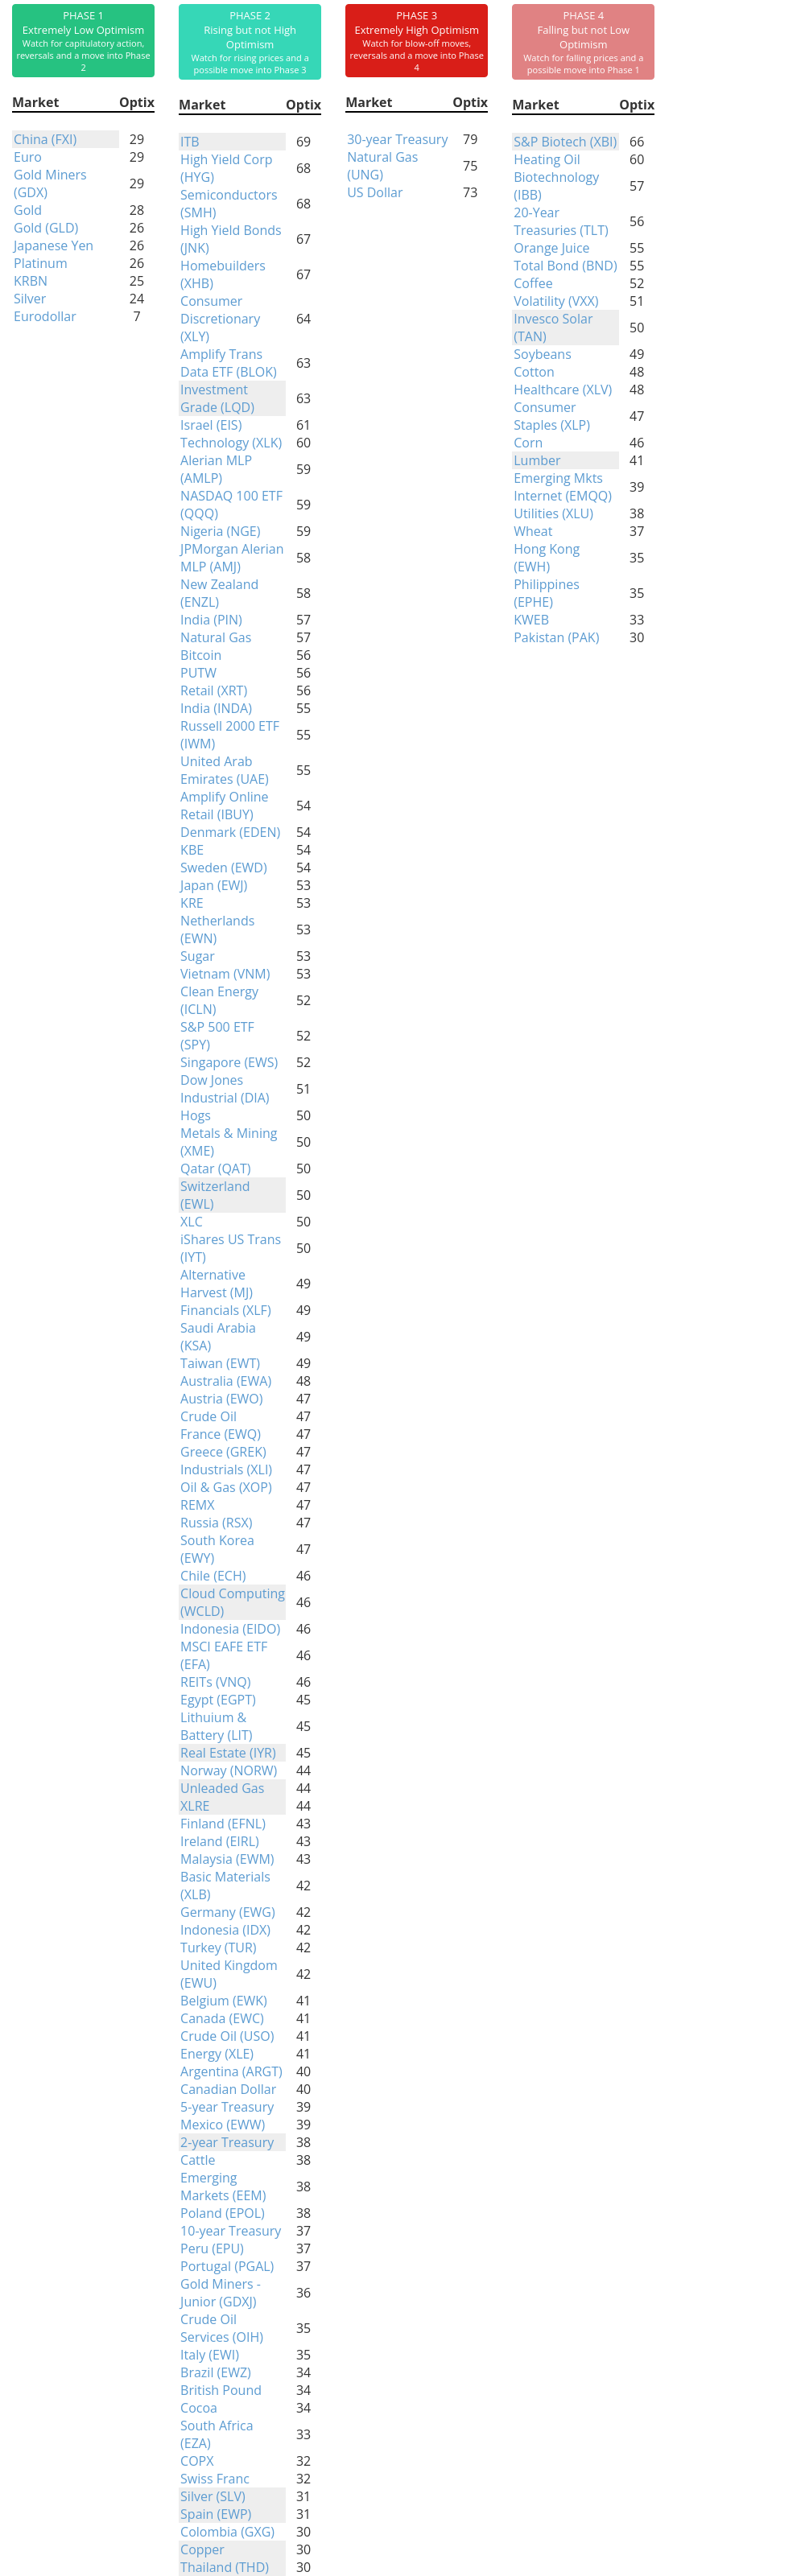
Phase Table
Ranks
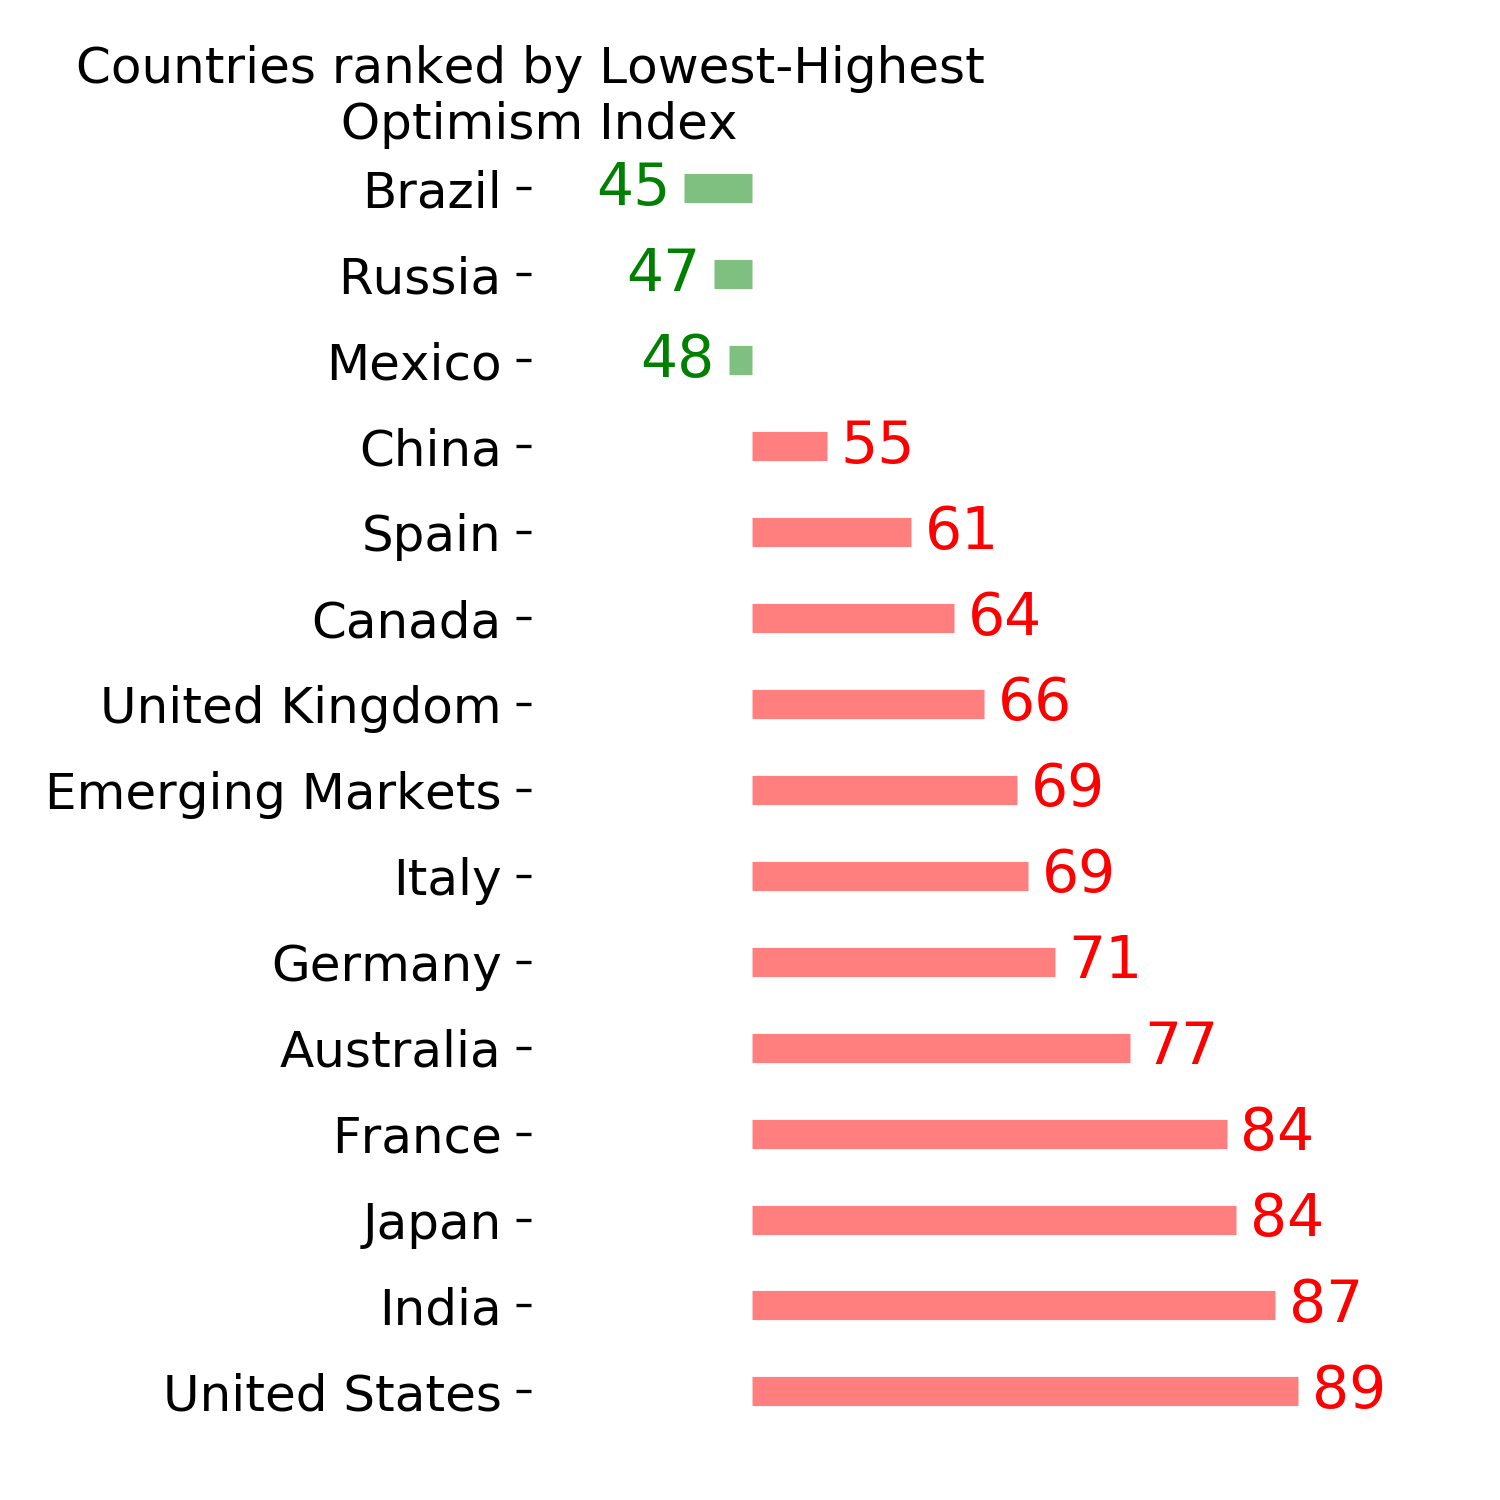
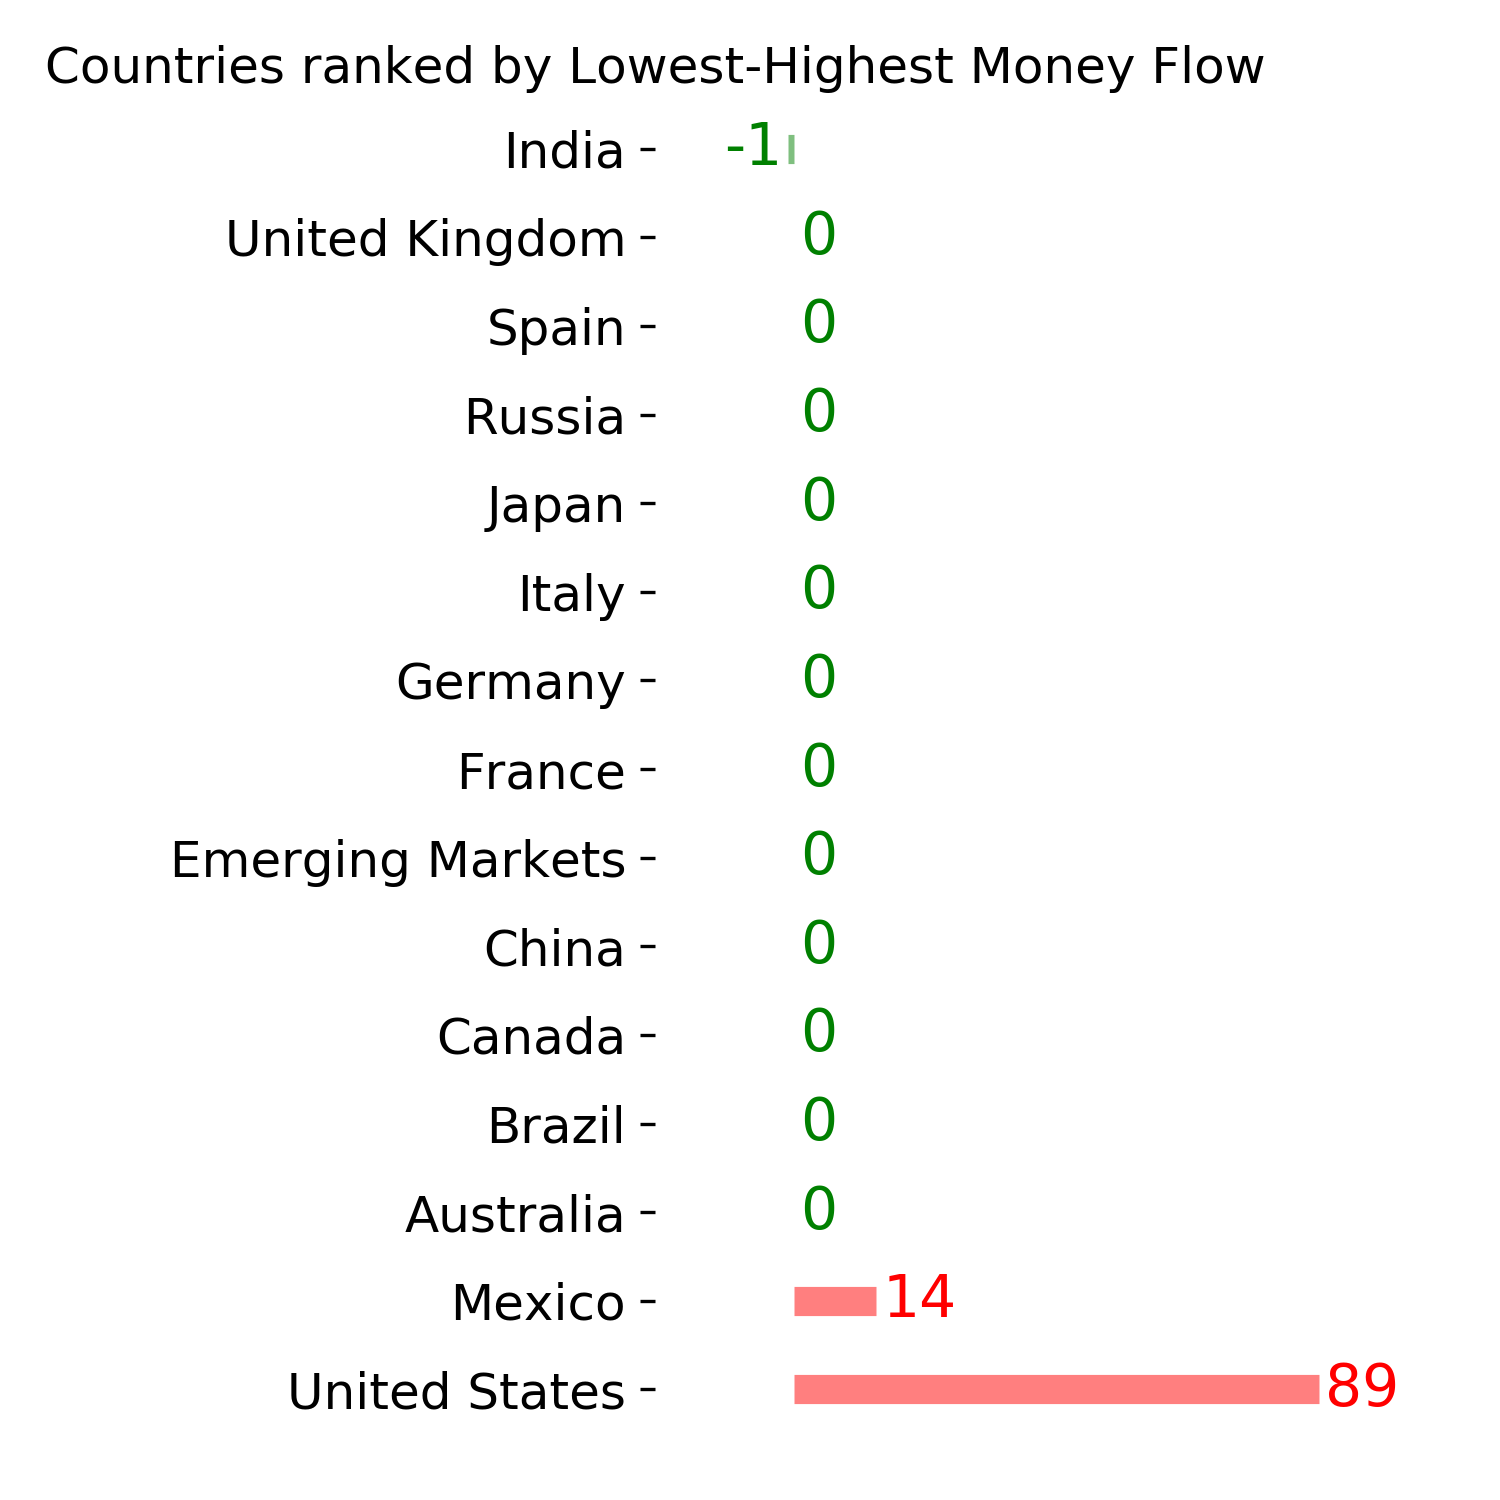
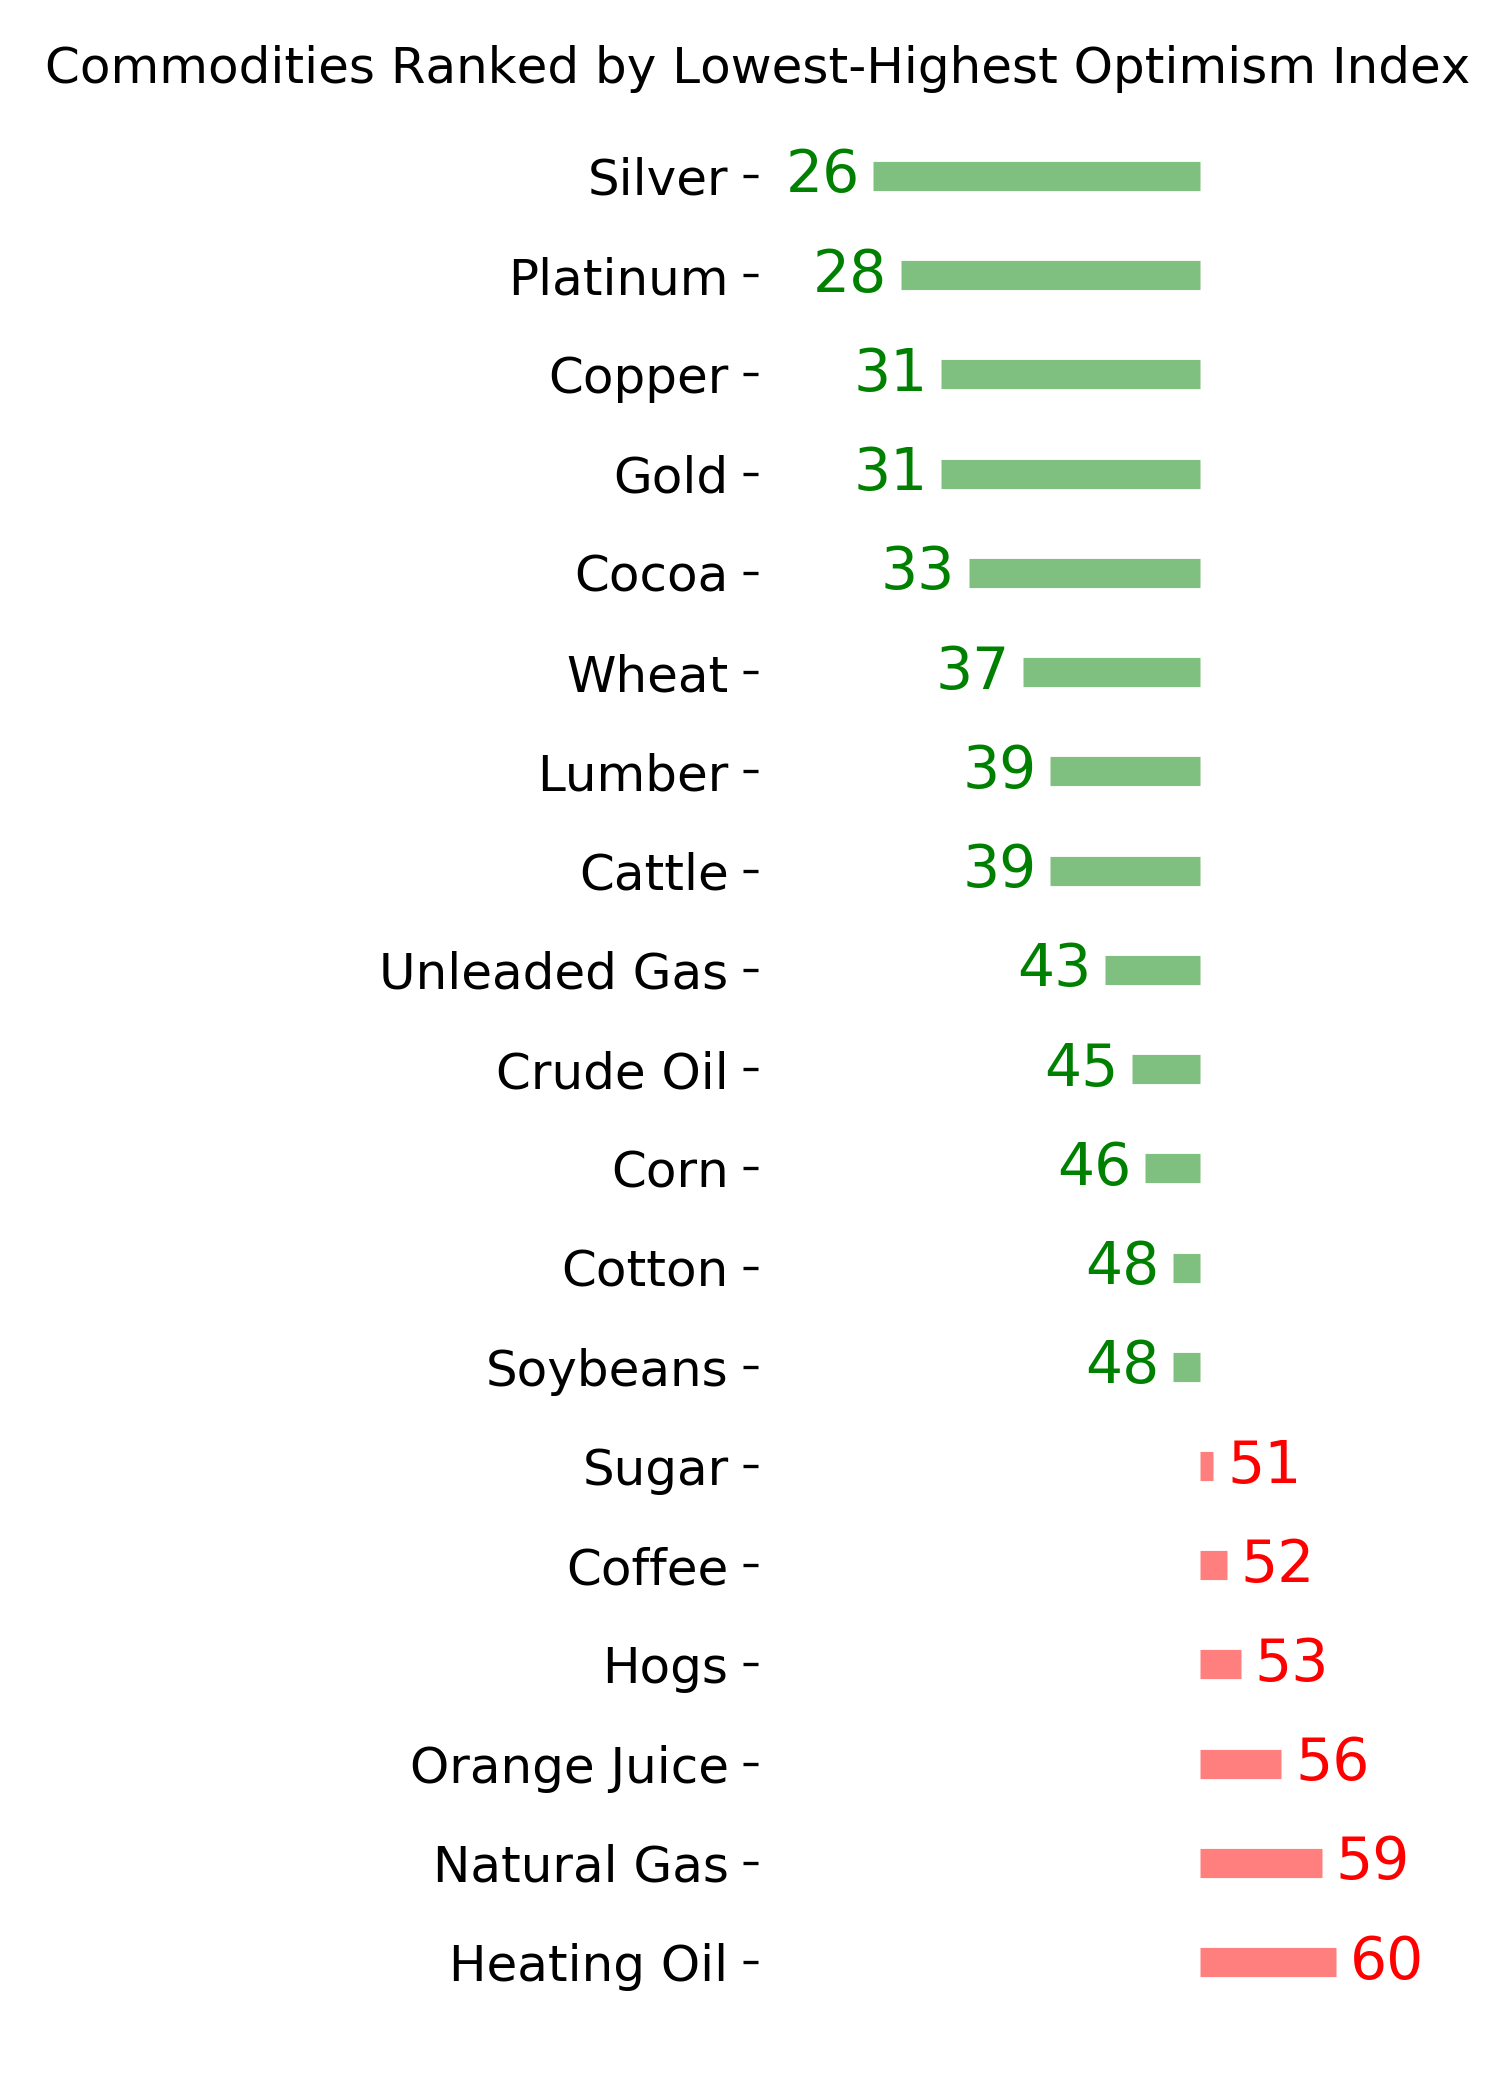
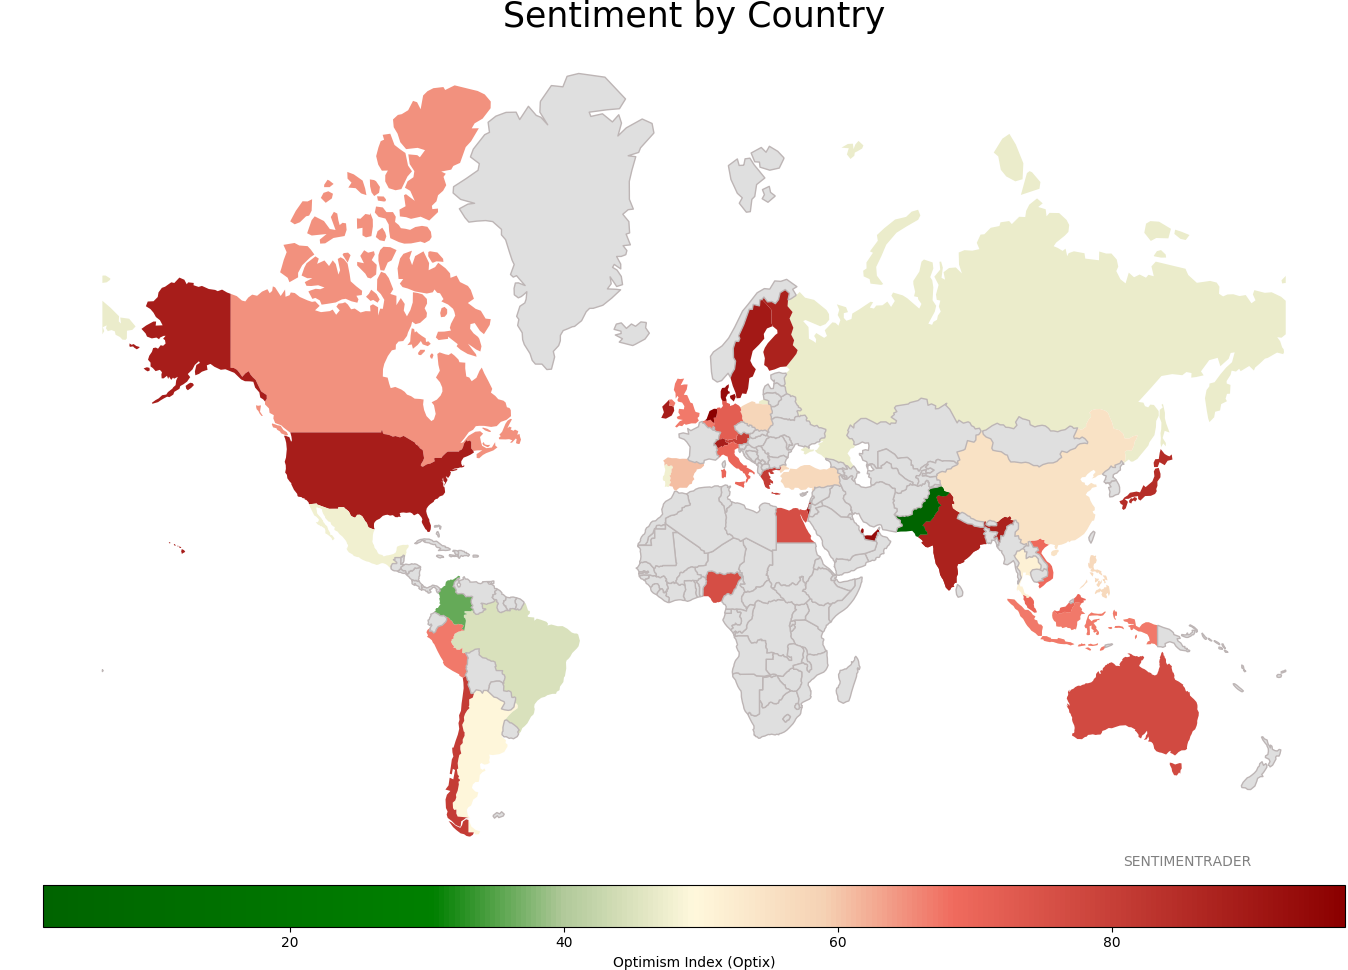
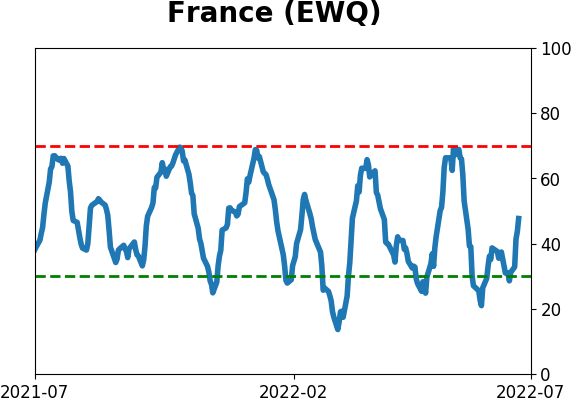
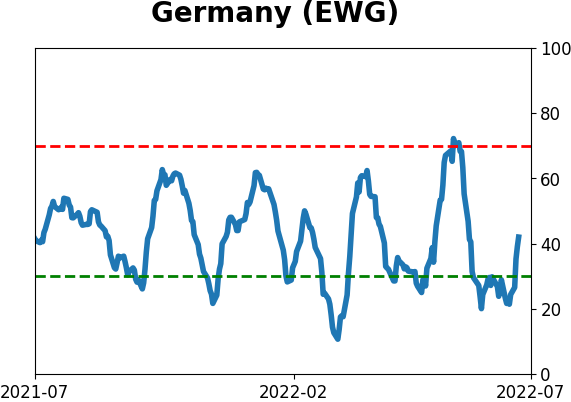
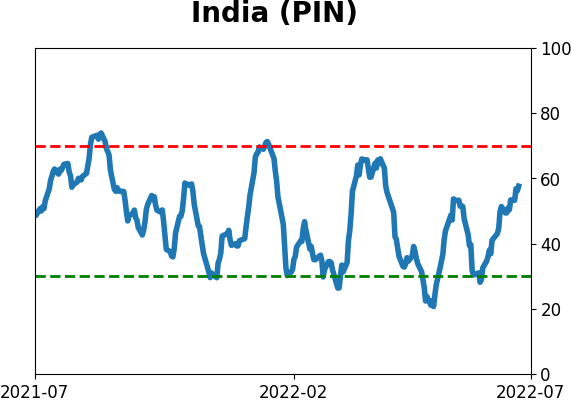
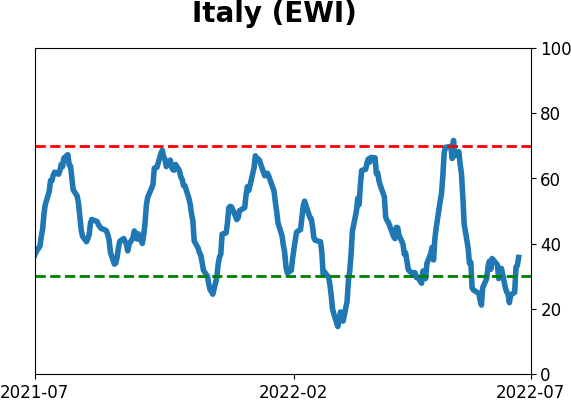
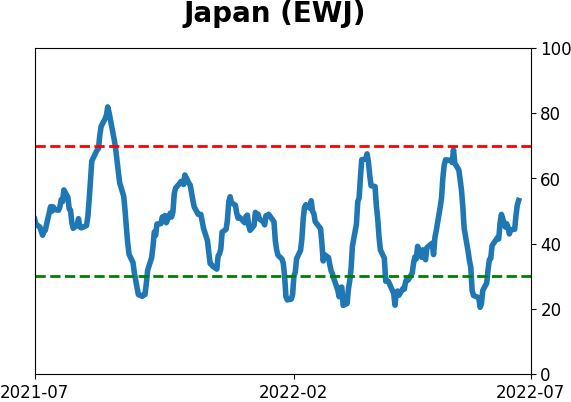
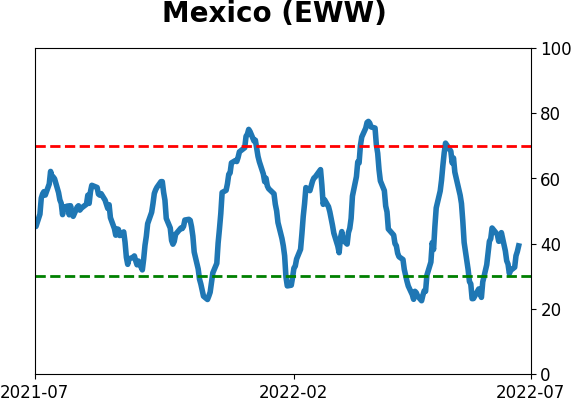
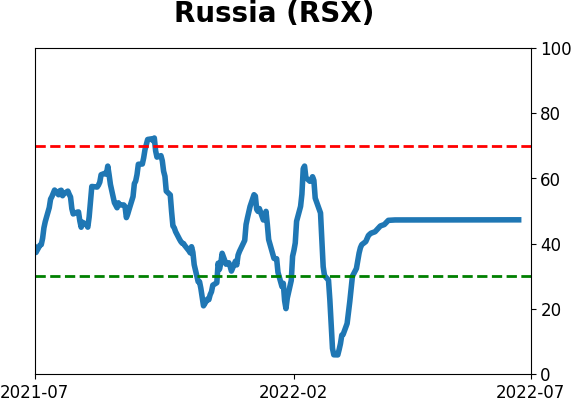
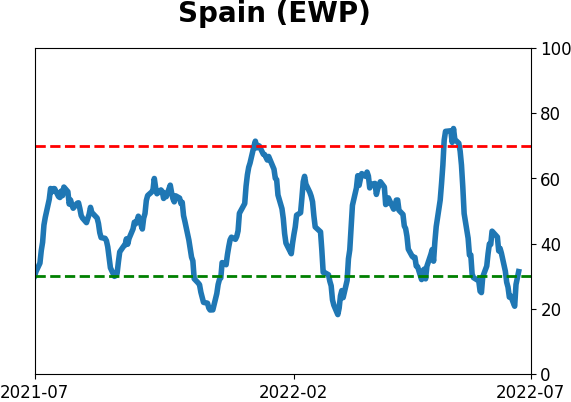
Sentiment Around The World
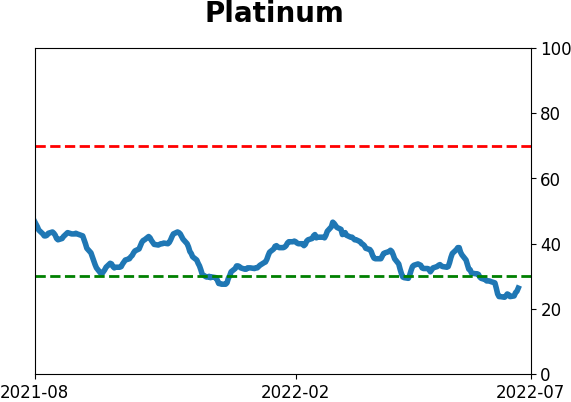
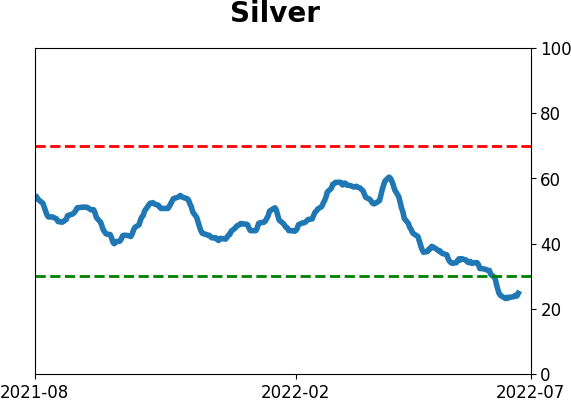
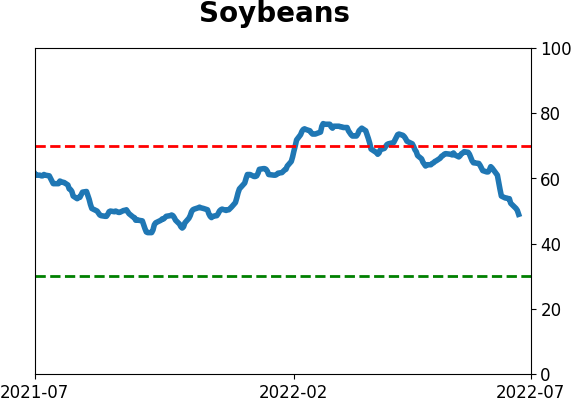
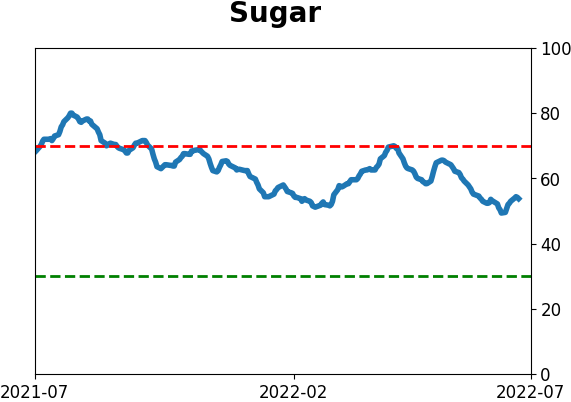
Optimism Index Thumbnails
|
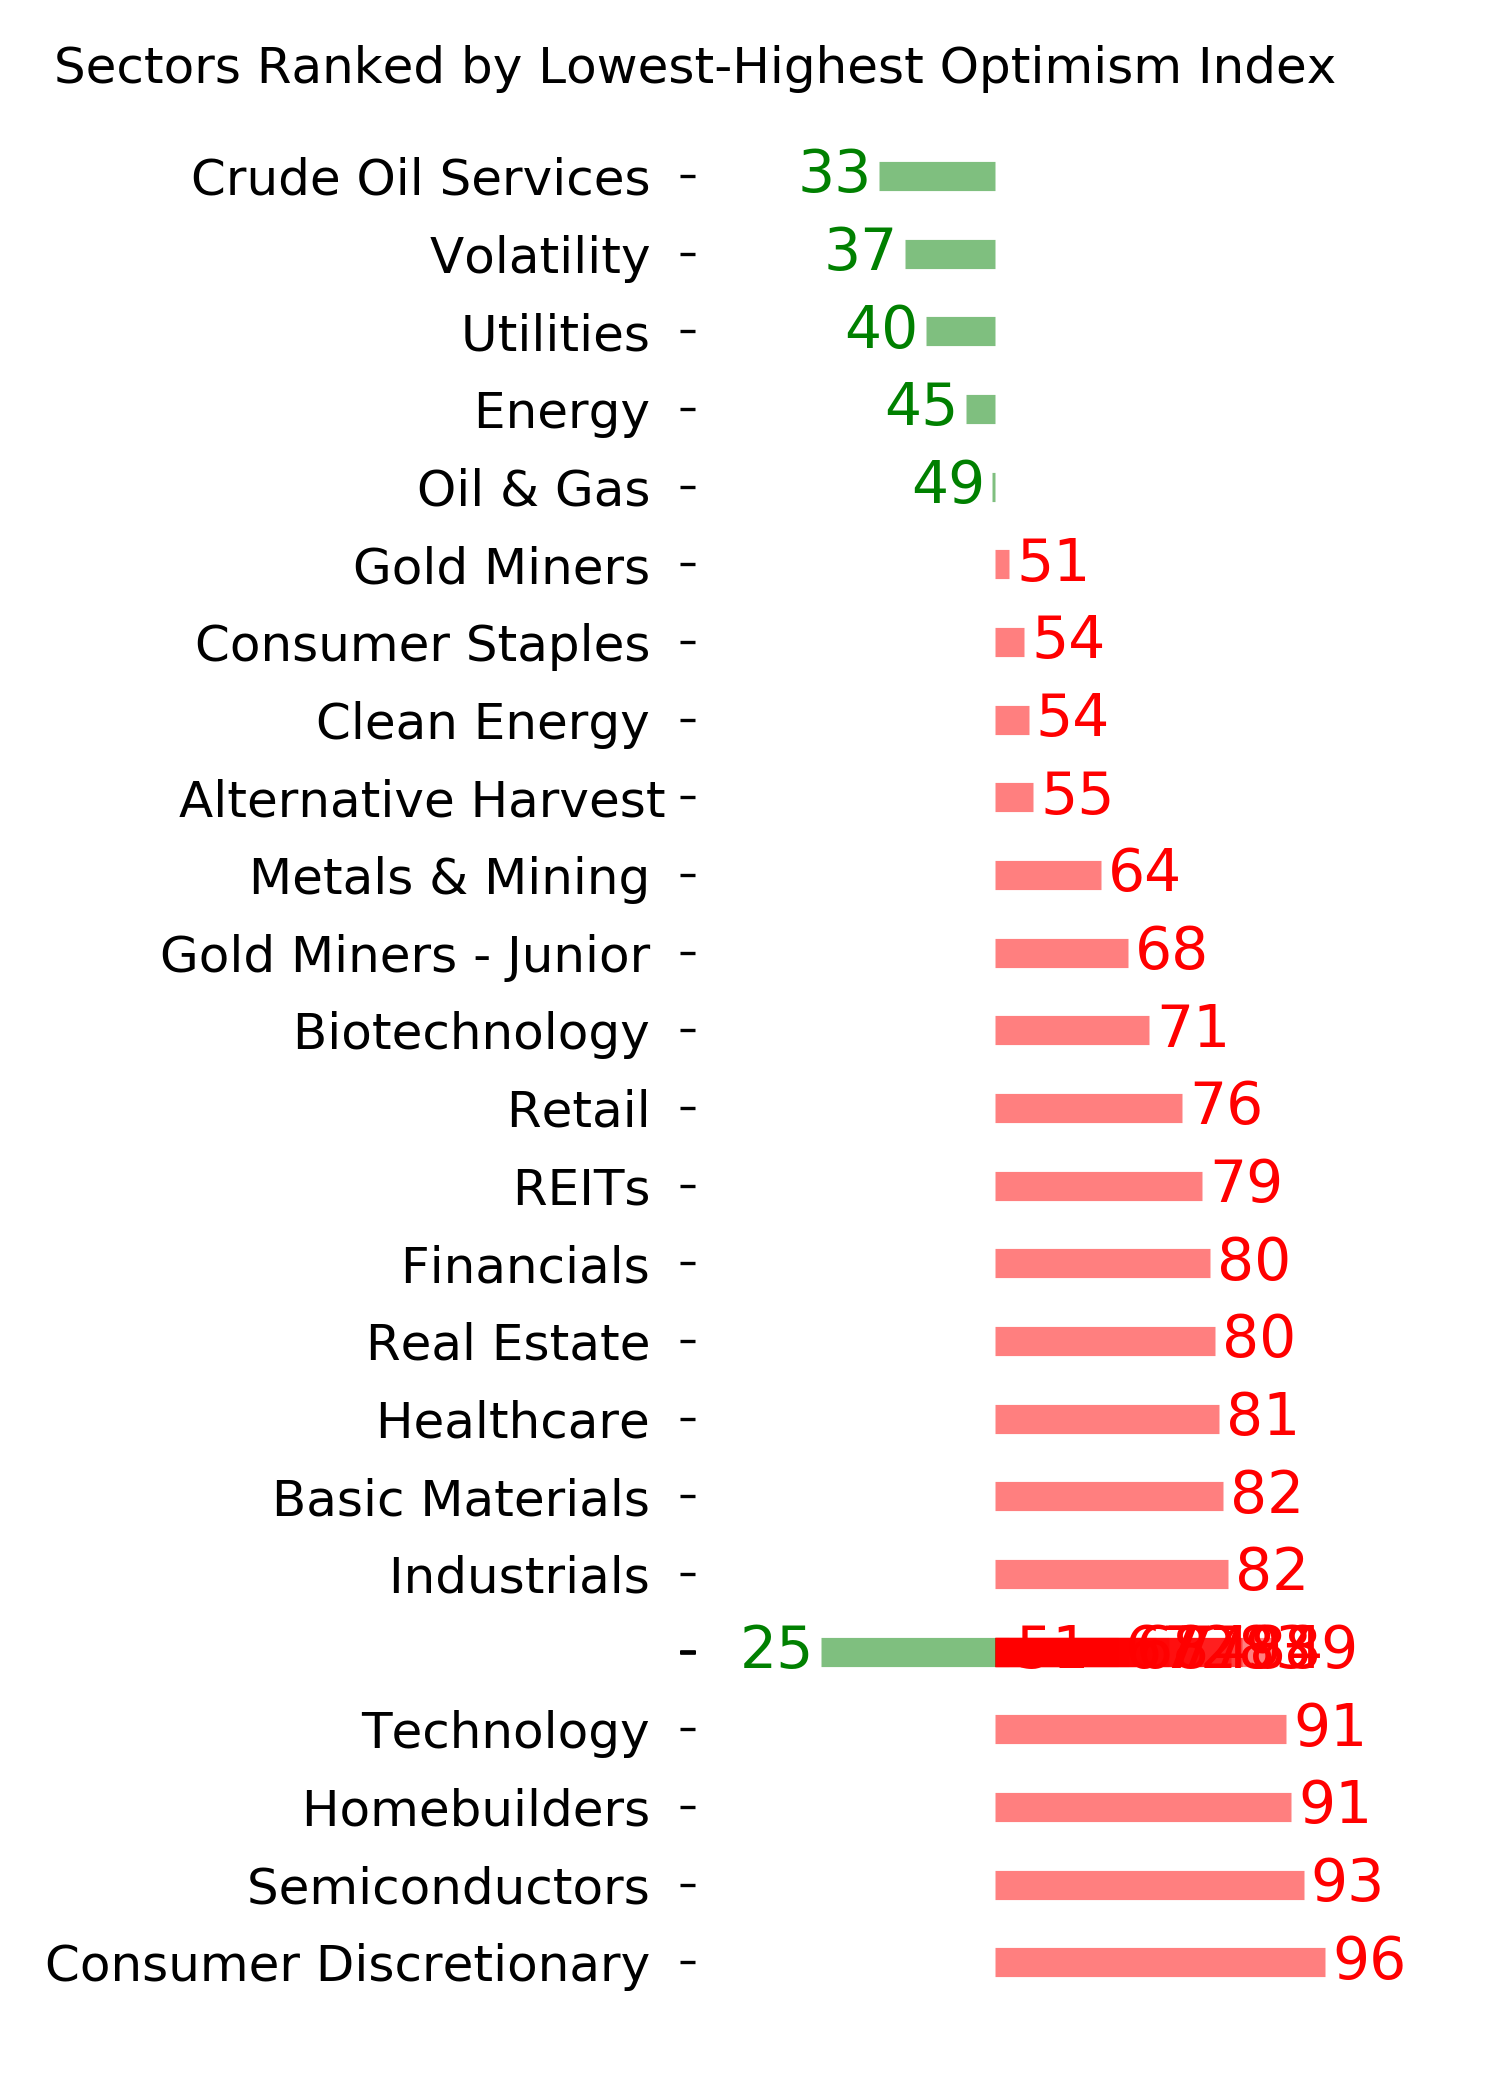
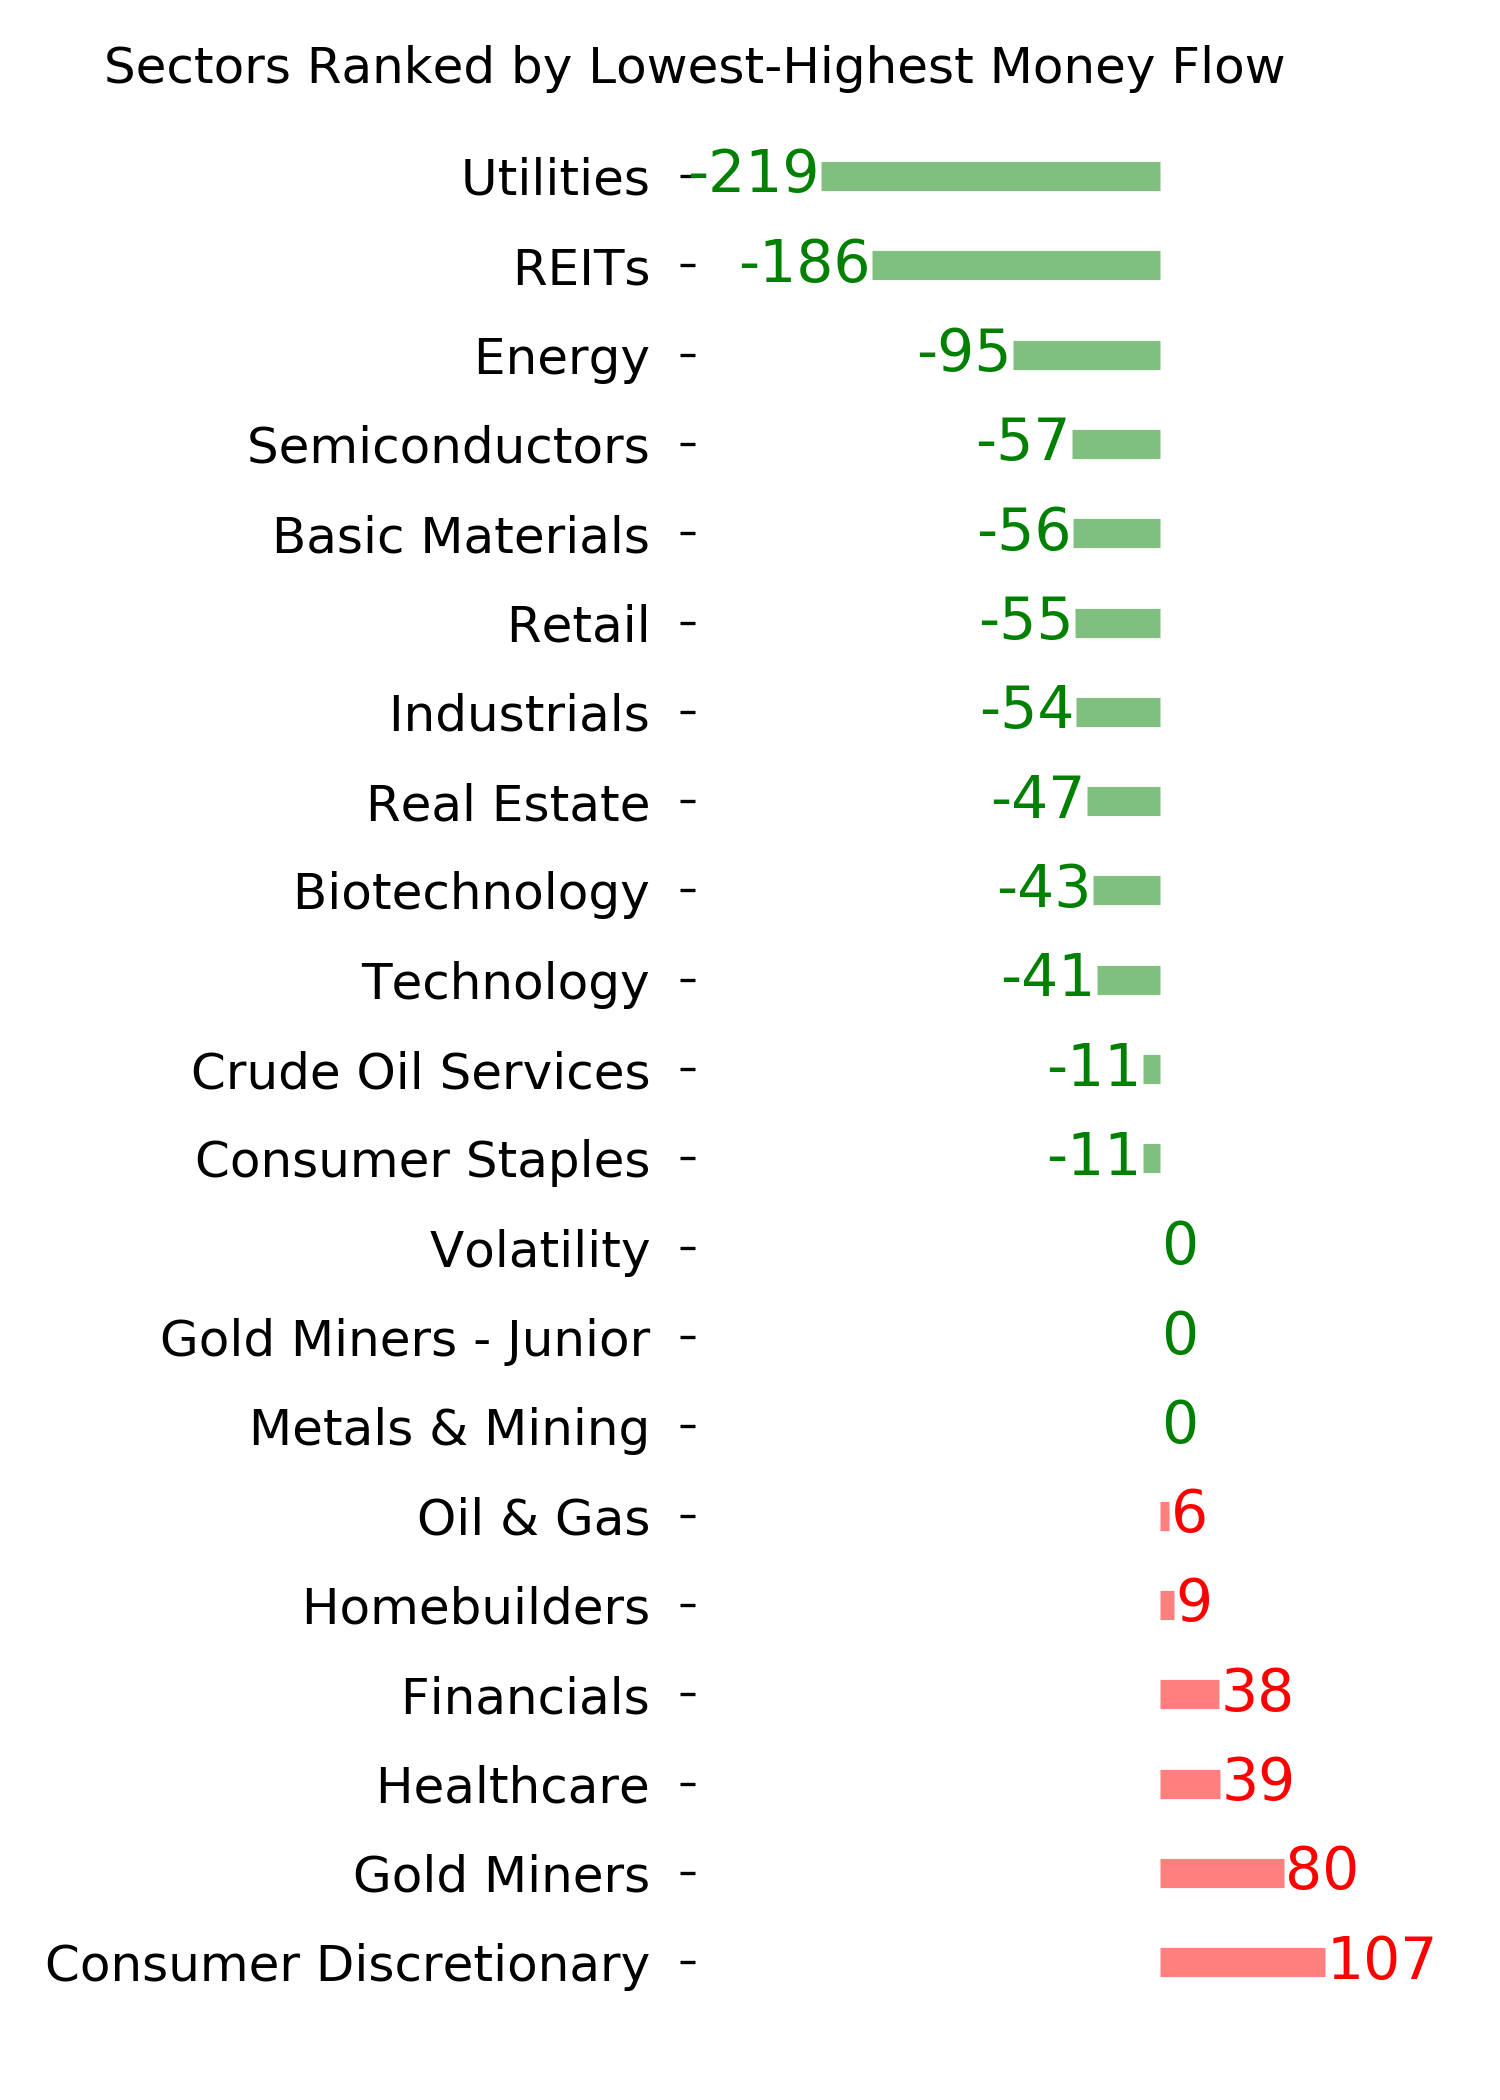
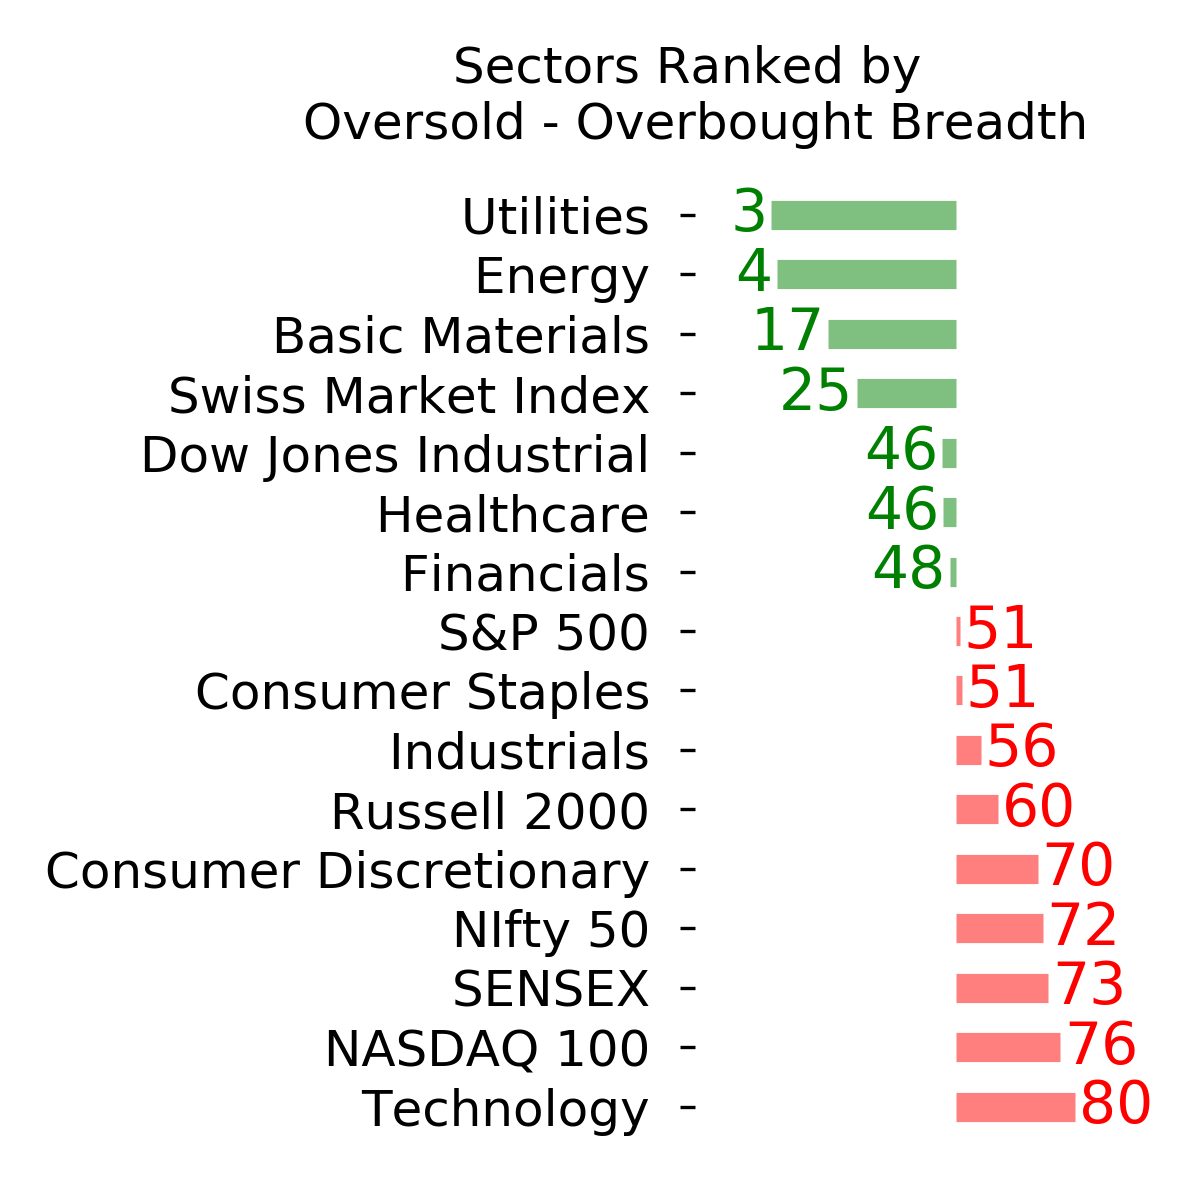
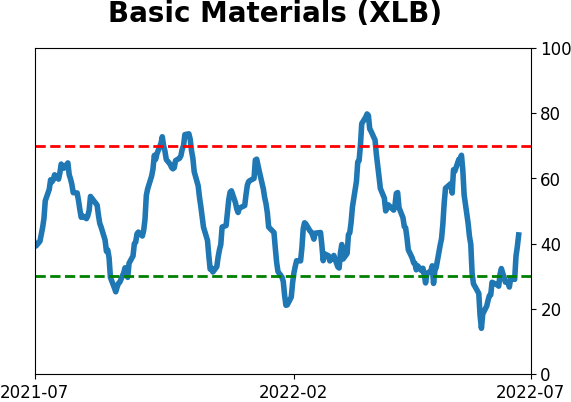
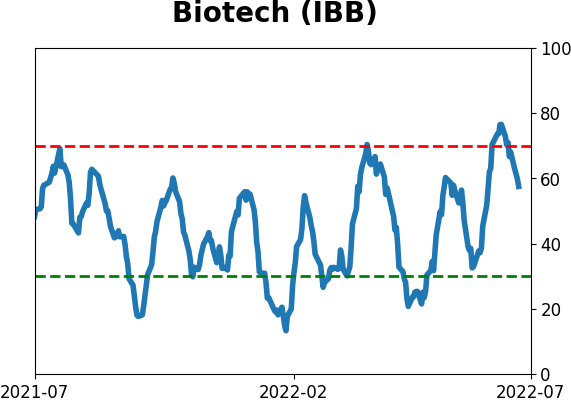
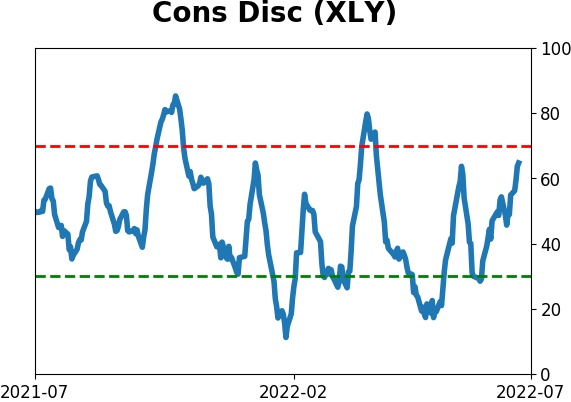
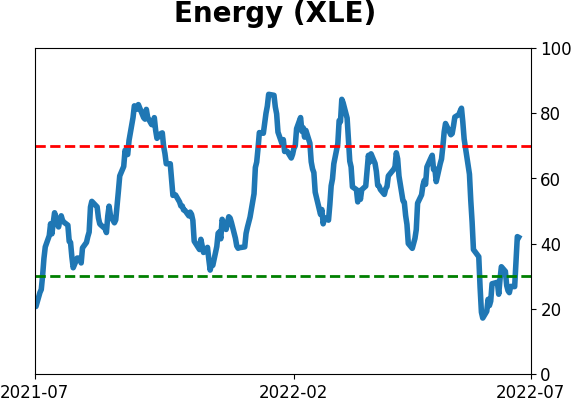
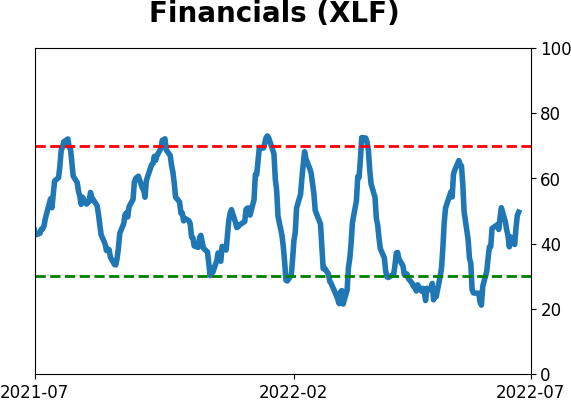
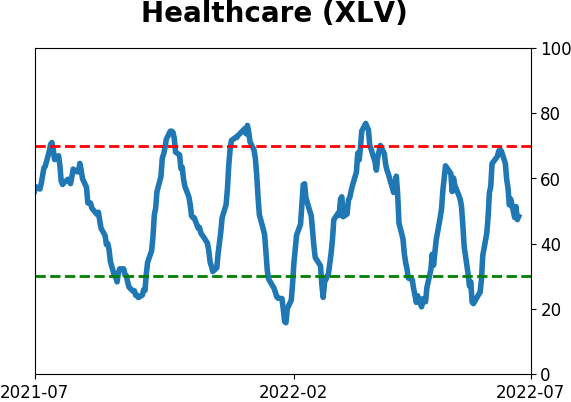
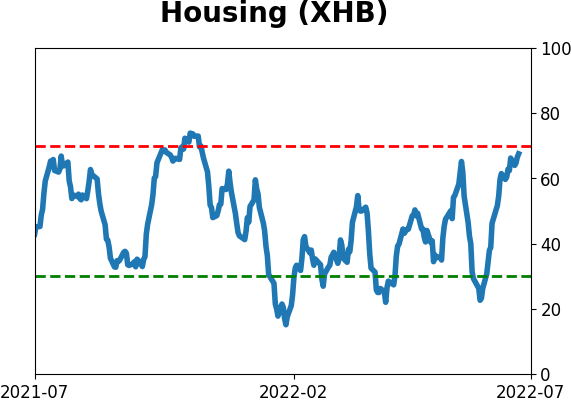
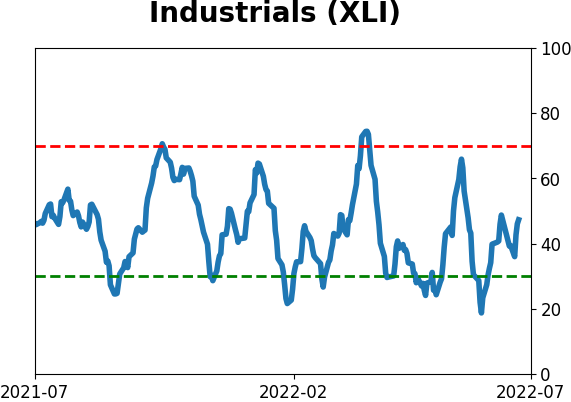
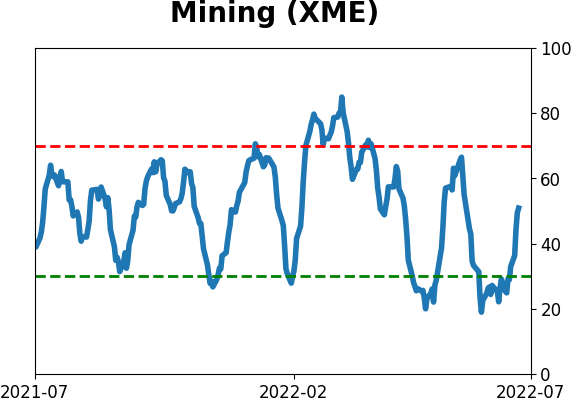
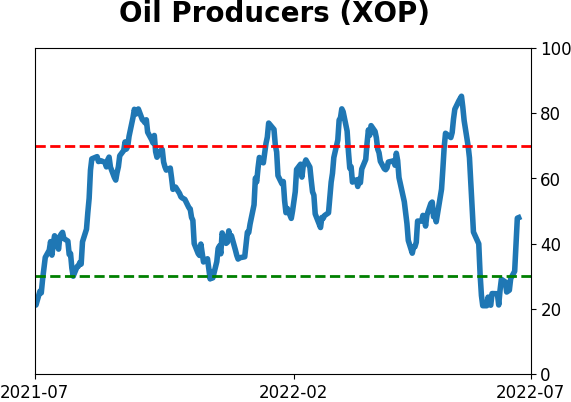
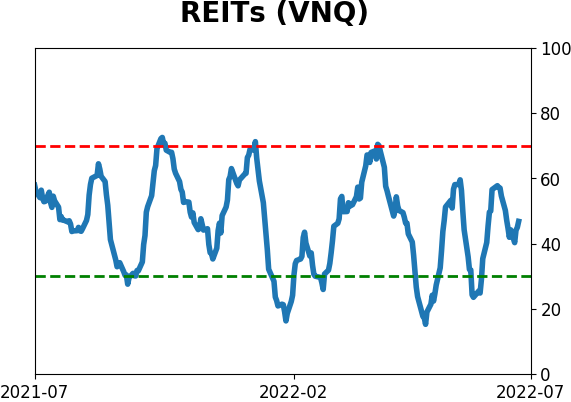
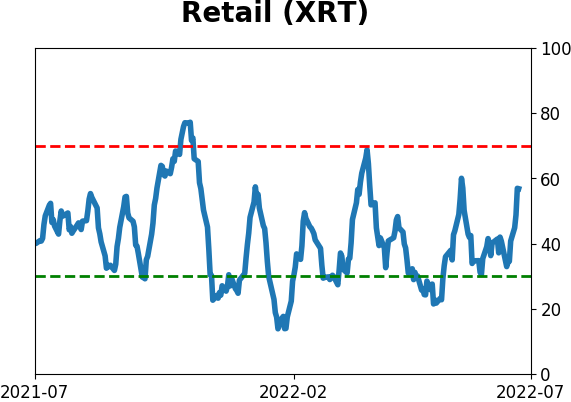
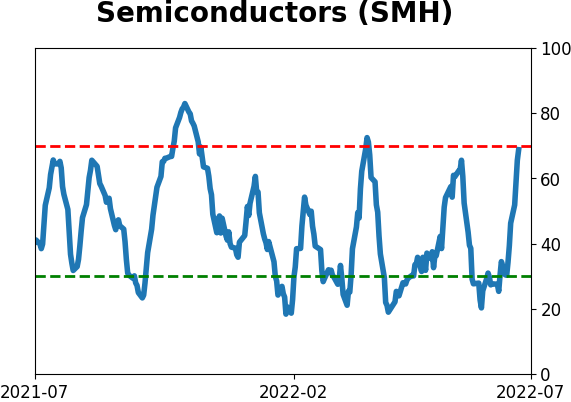
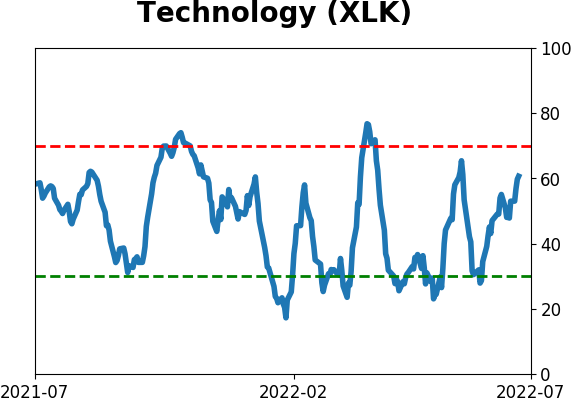
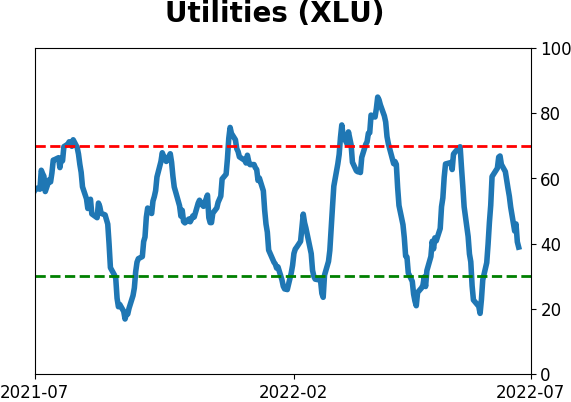
Sector ETF's - 10-Day Moving Average
|
|
|
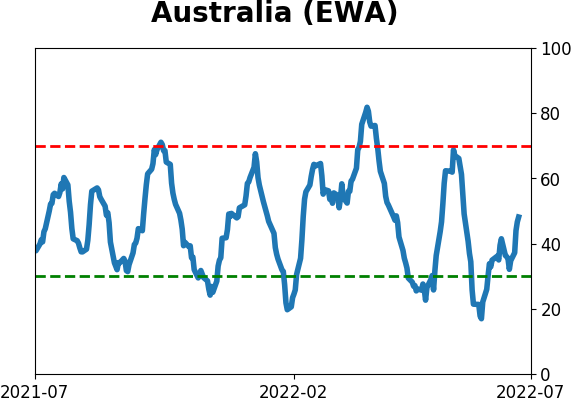
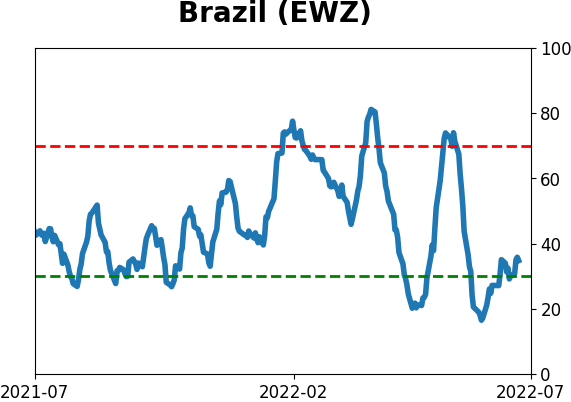
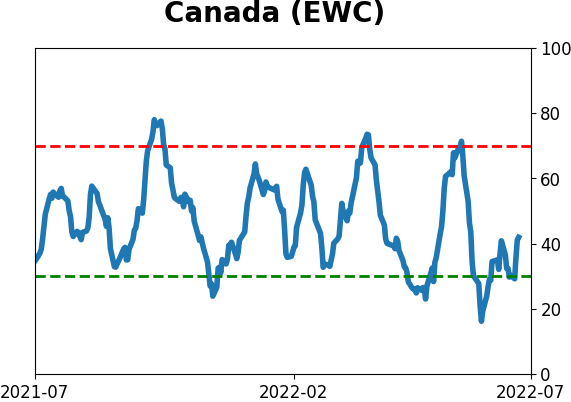
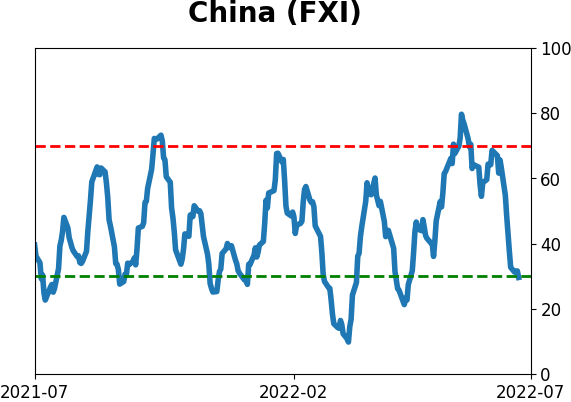
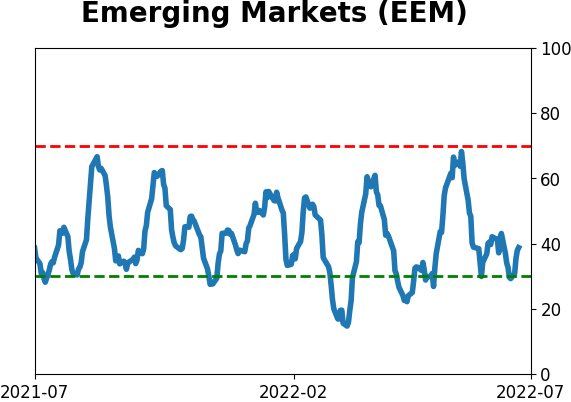
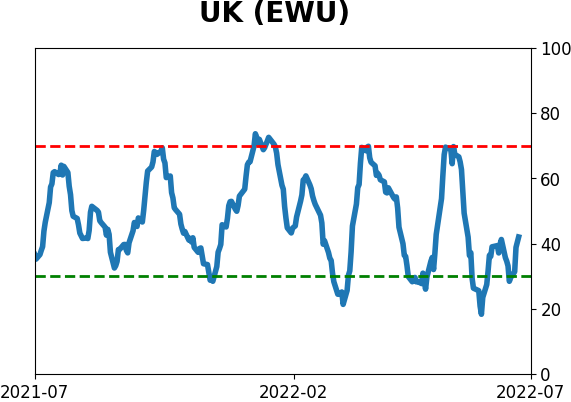
Country ETF's - 10-Day Moving Average
|
|
|
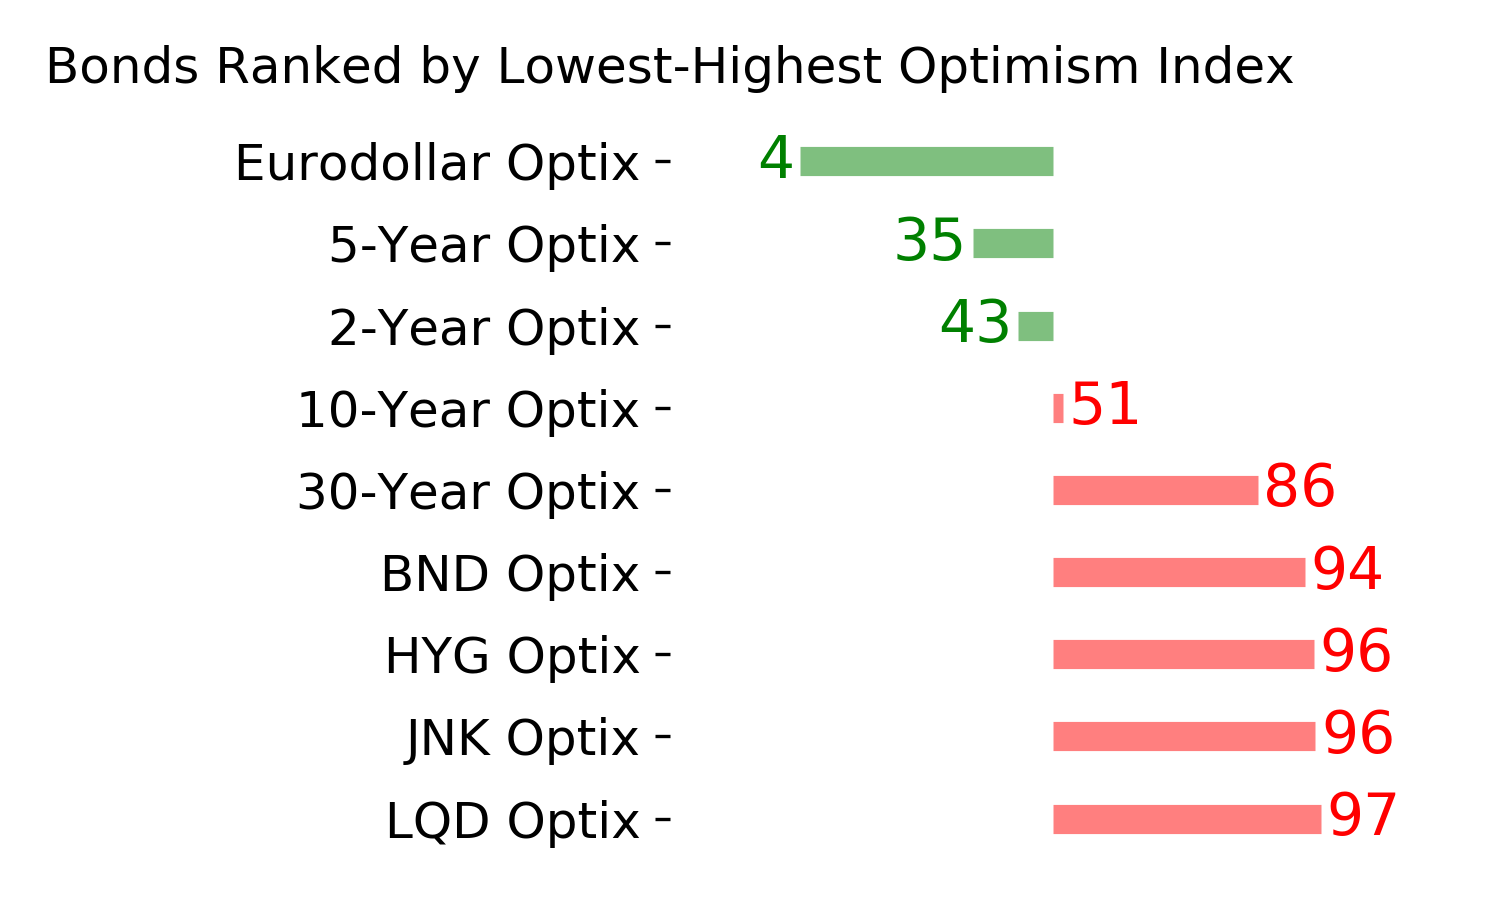
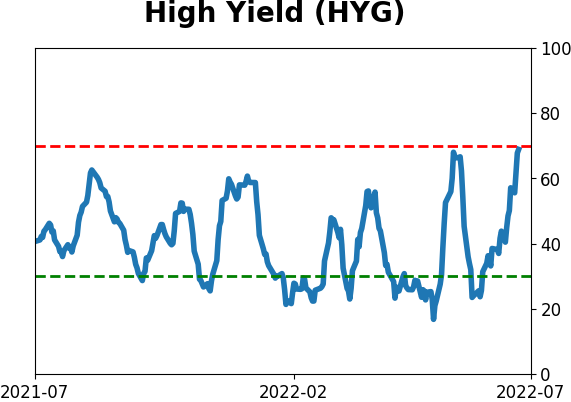
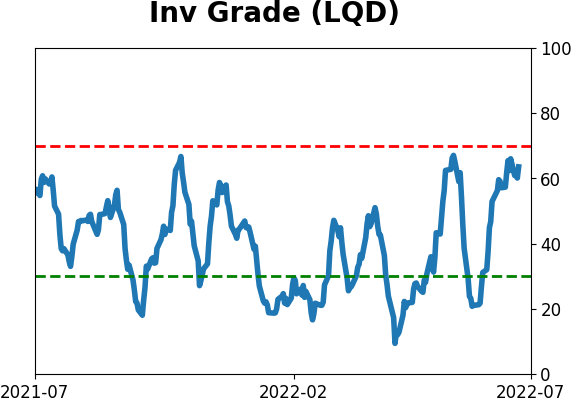
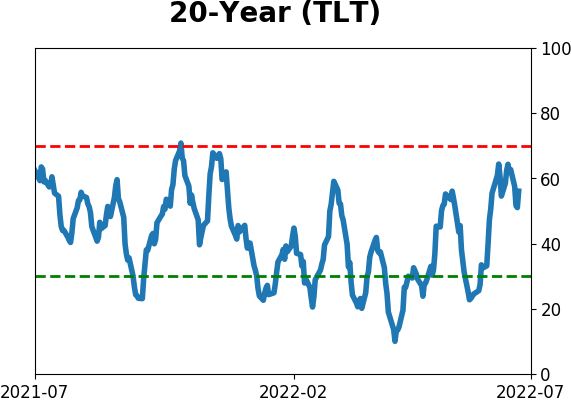
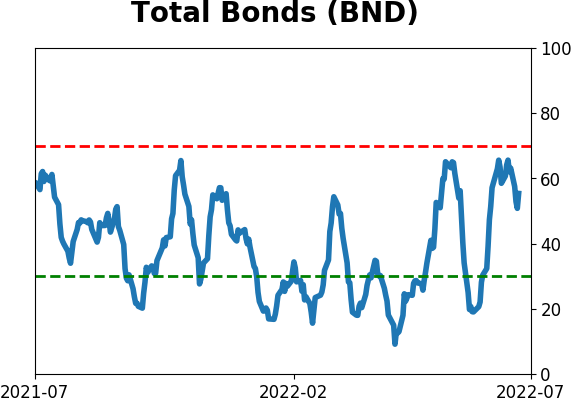
Bond ETF's - 10-Day Moving Average
|
|
|
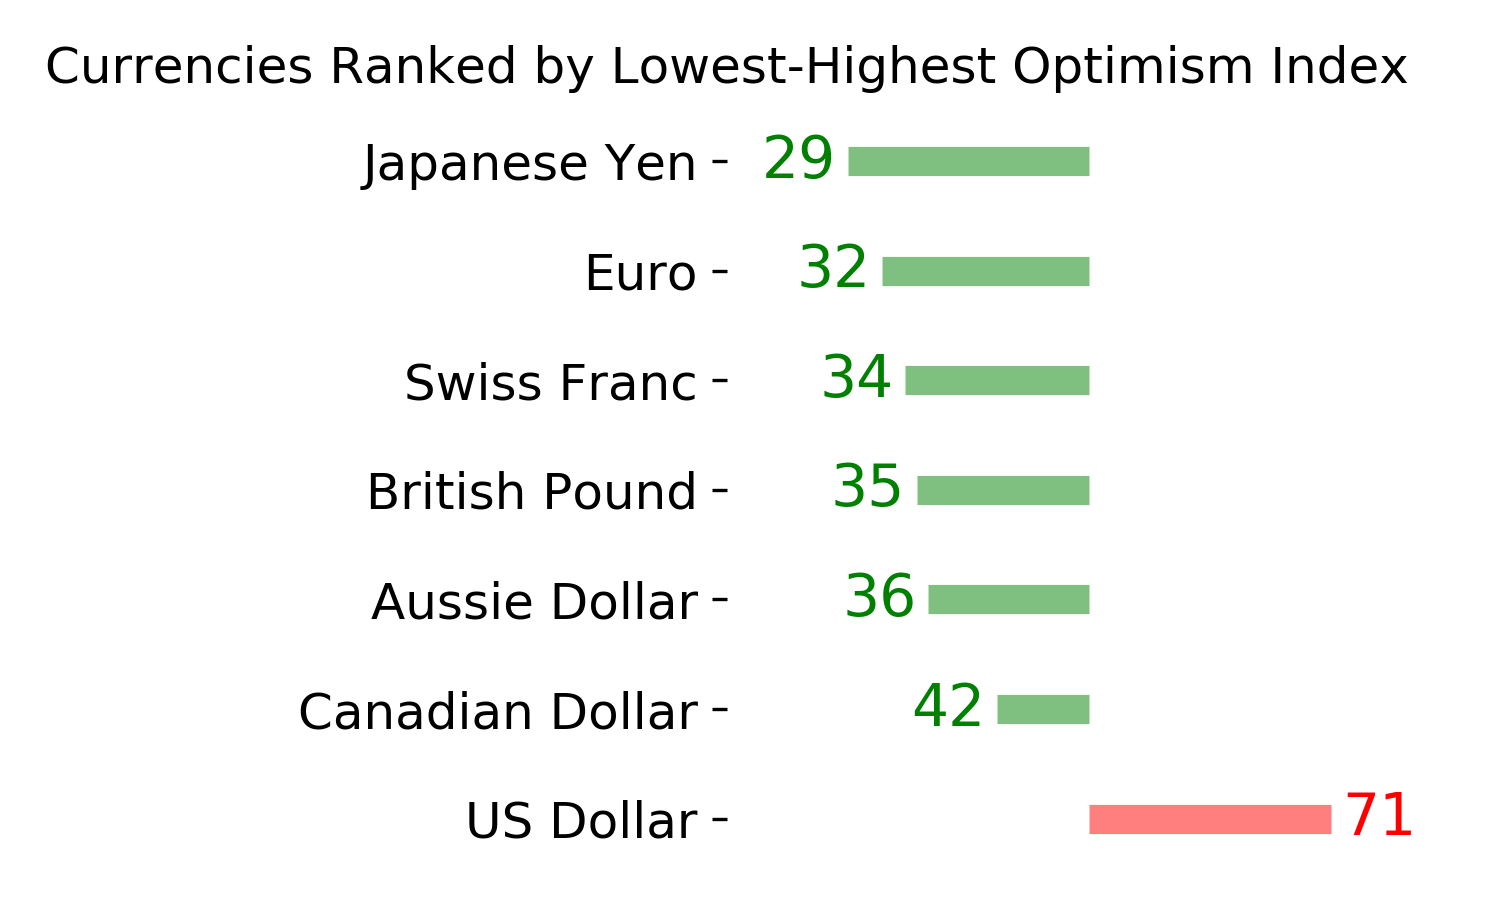
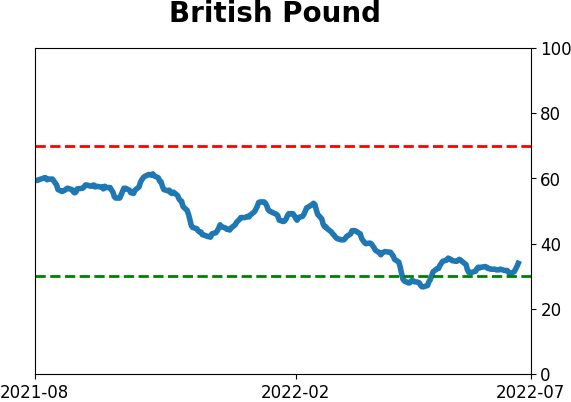
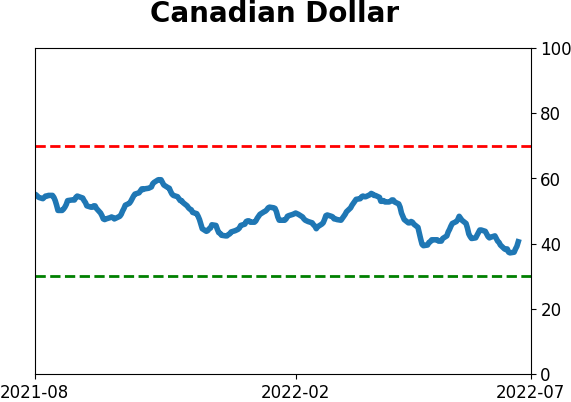
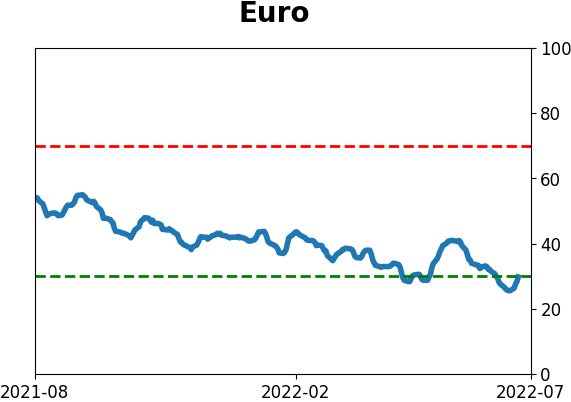
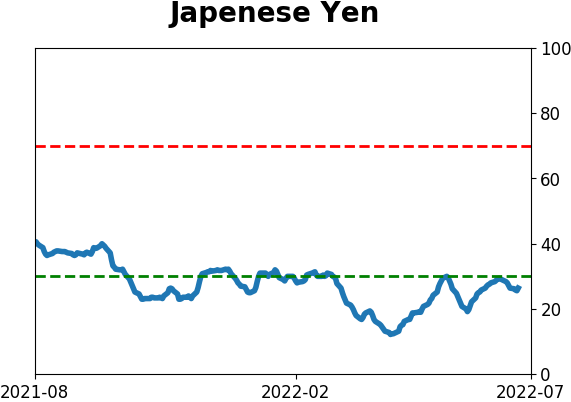
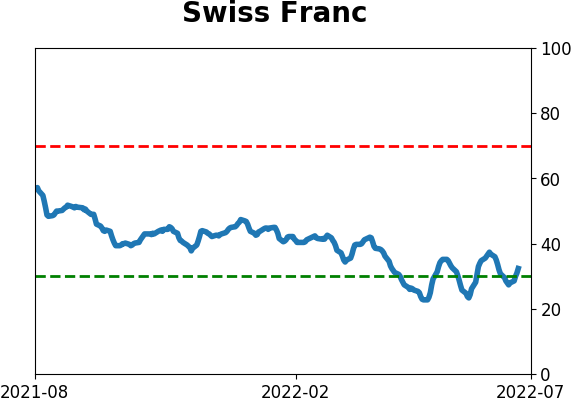
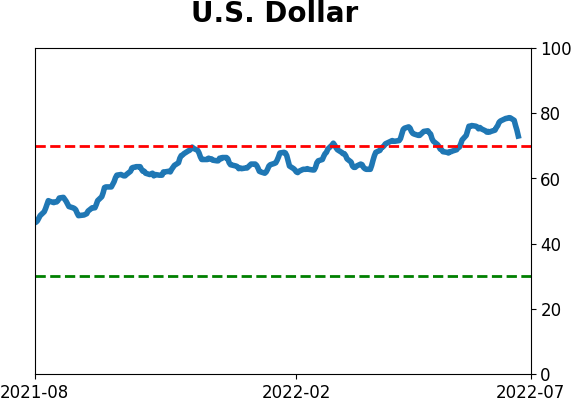
Currency ETF's - 5-Day Moving Average
|
|
|
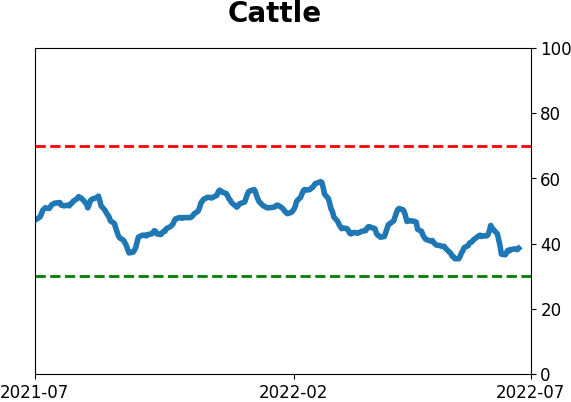
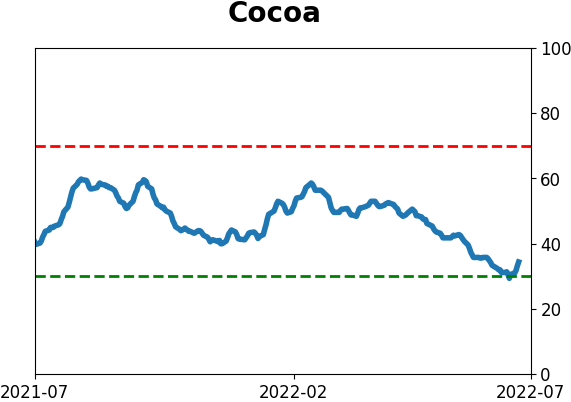
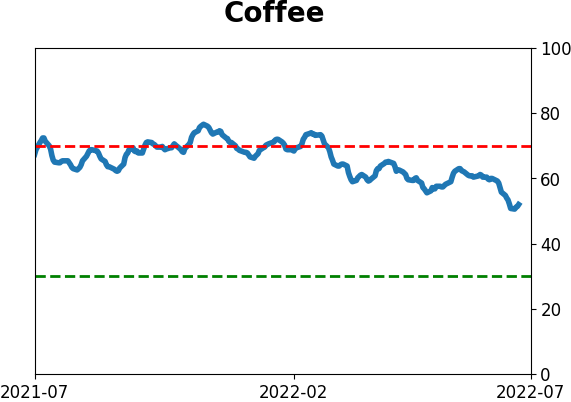
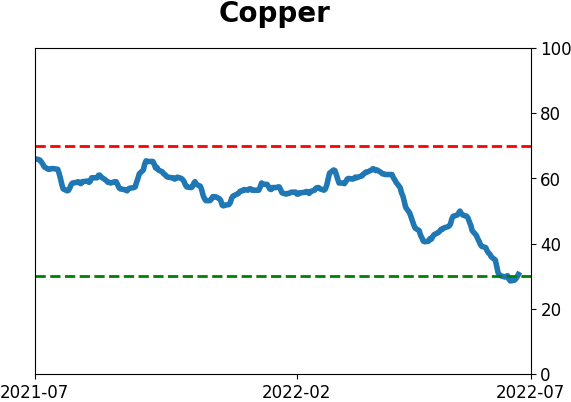
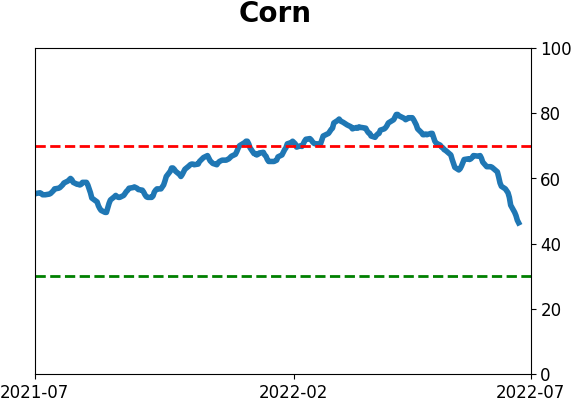
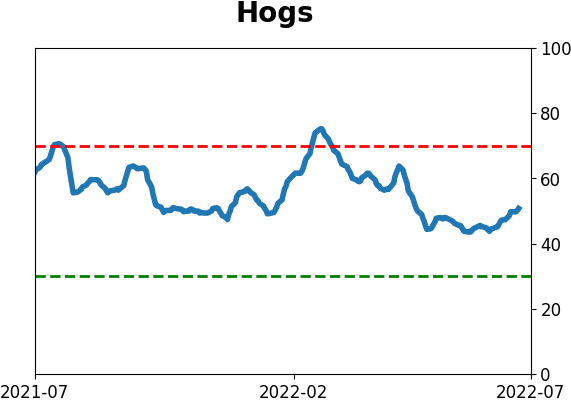
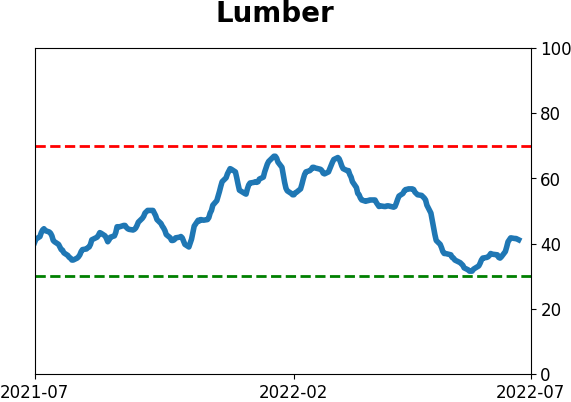
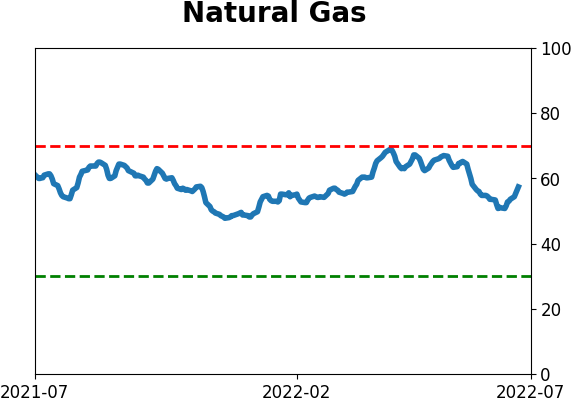
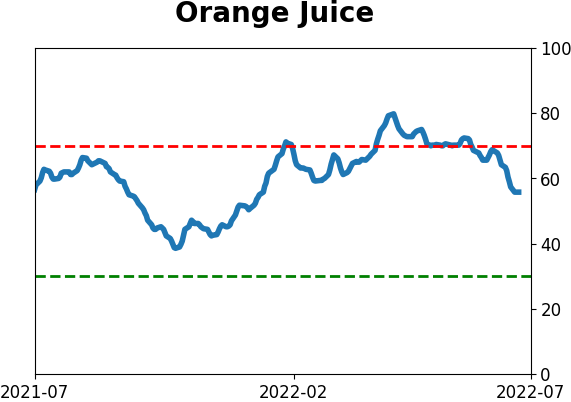
Commodity ETF's - 5-Day Moving Average
|
|