Headlines
|
|
Buyers return after a historic bout of intraday reversals:
This has been one of the whippiest years ever. Over the past 135 sessions, the S&P 500 has undergone 110 reversals, or 1% changes from its high or low to its close. In recent sessions, buyers have become eager to gain exposure, with overwhelming up volume.
|
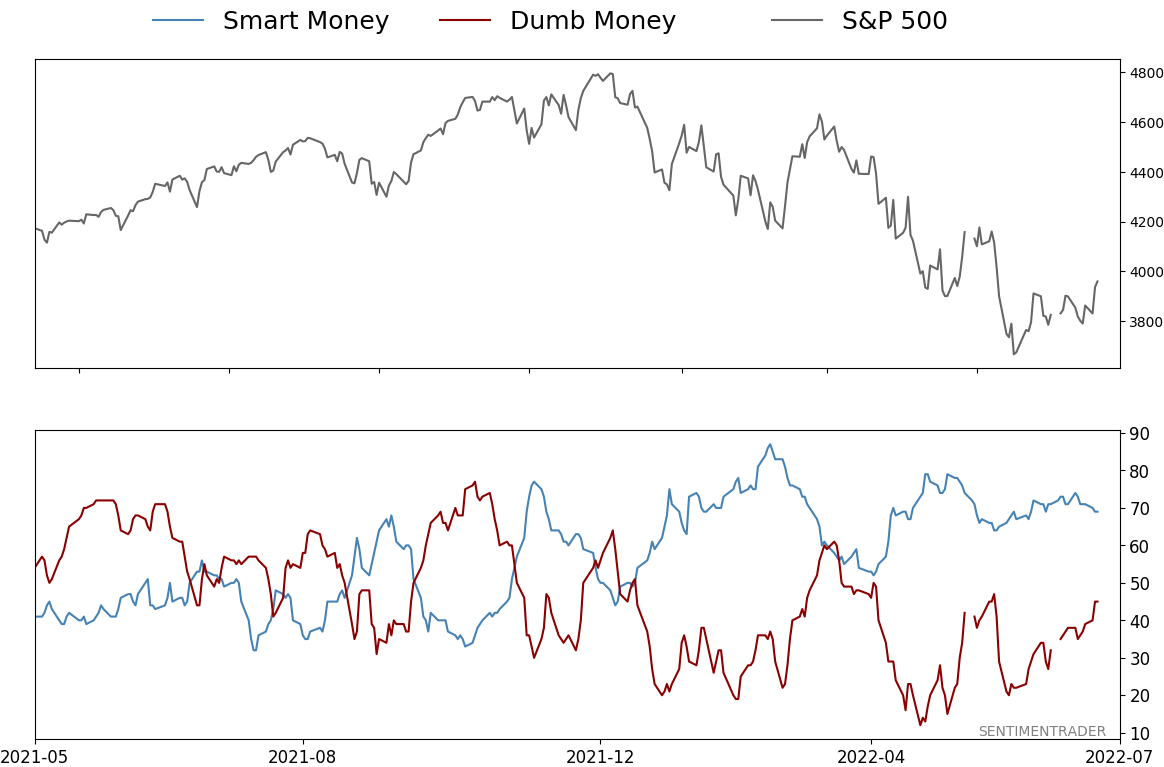
Smart / Dumb Money Confidence
|
Smart Money Confidence: 69%
Dumb Money Confidence: 45%
|
|
Risk Levels
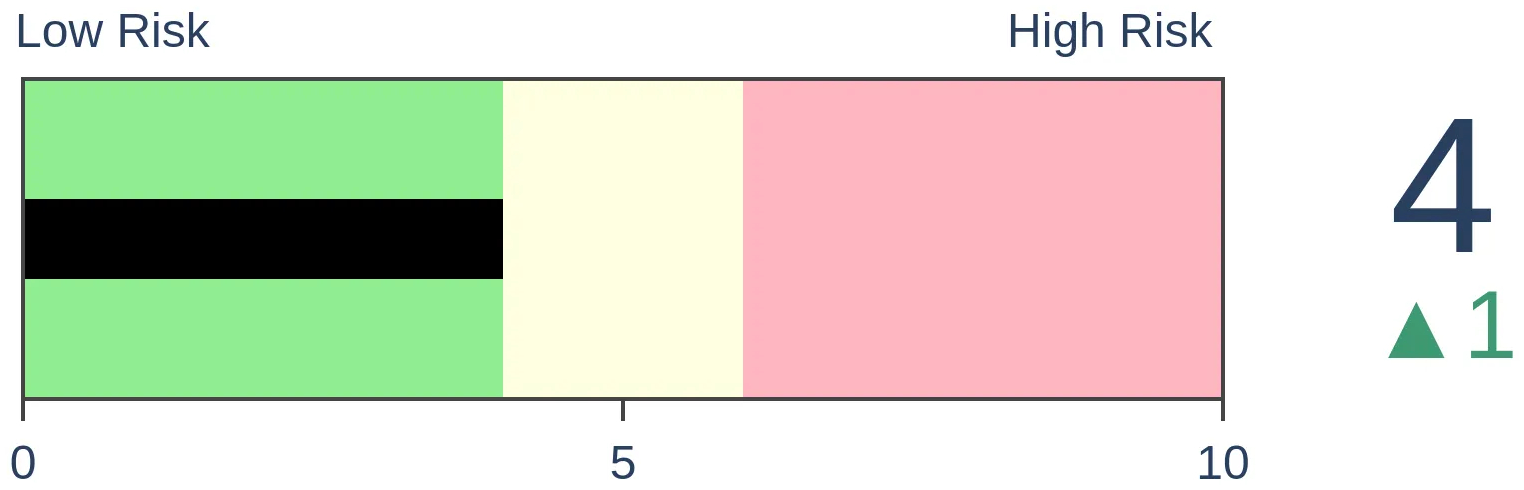
Stocks Short-Term
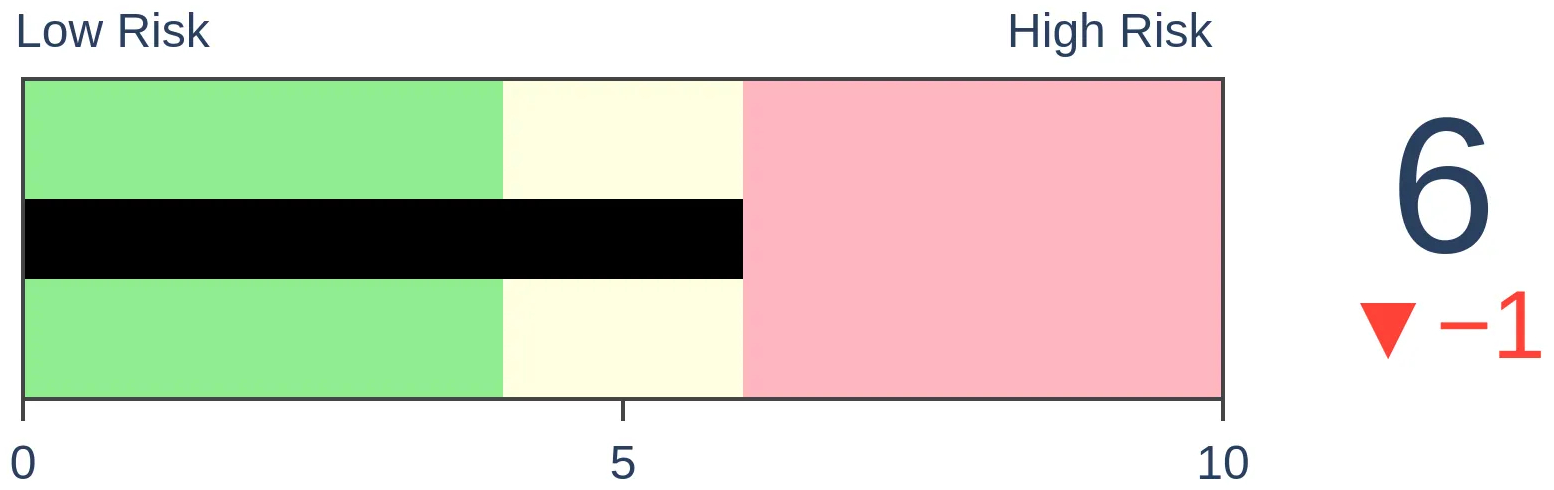
|
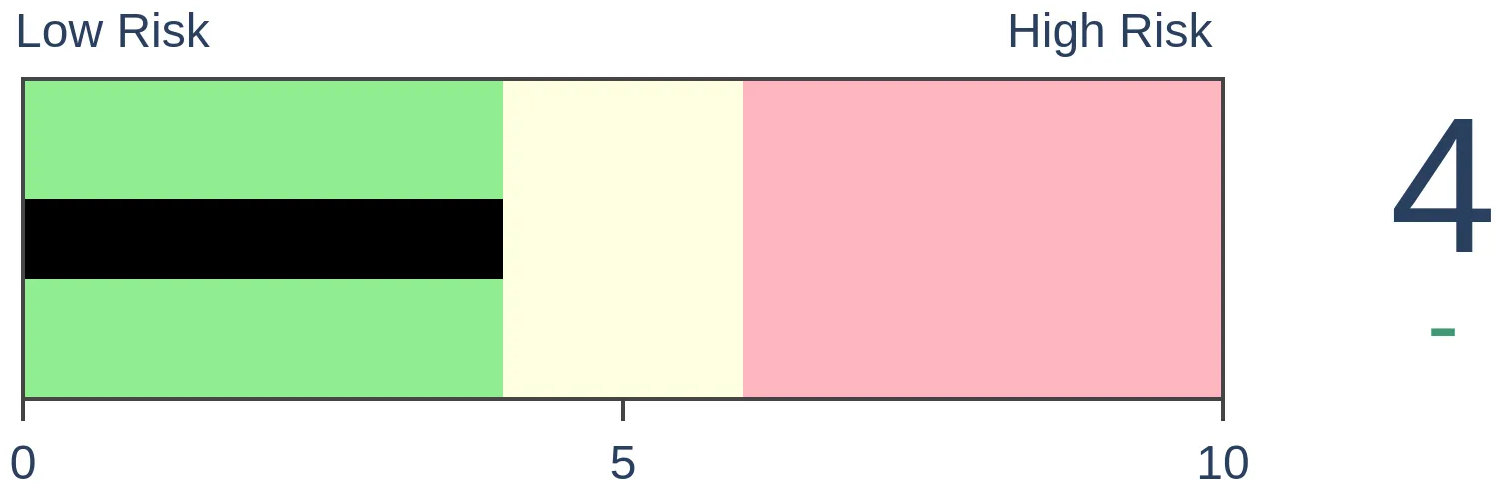
Stocks Medium-Term
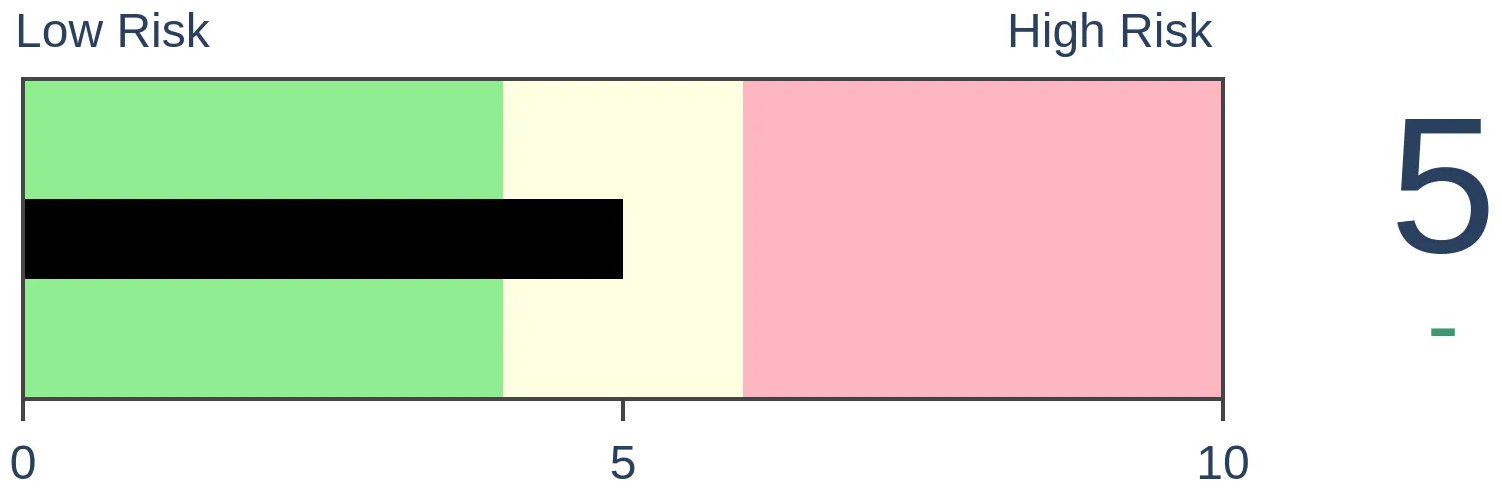
|
|
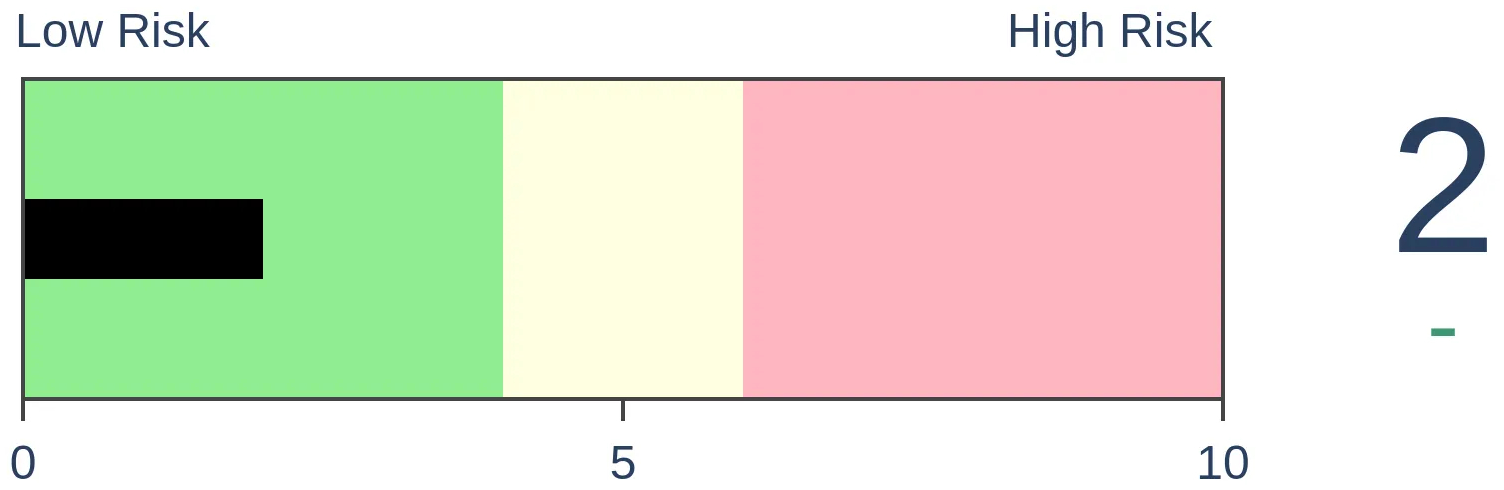
Bonds
|
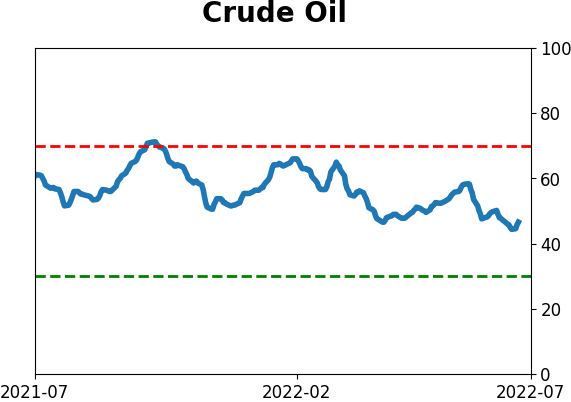
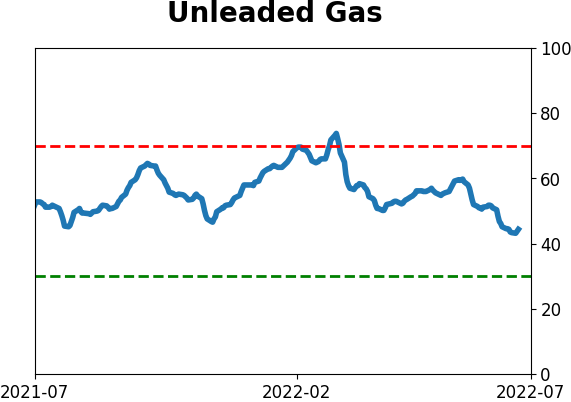
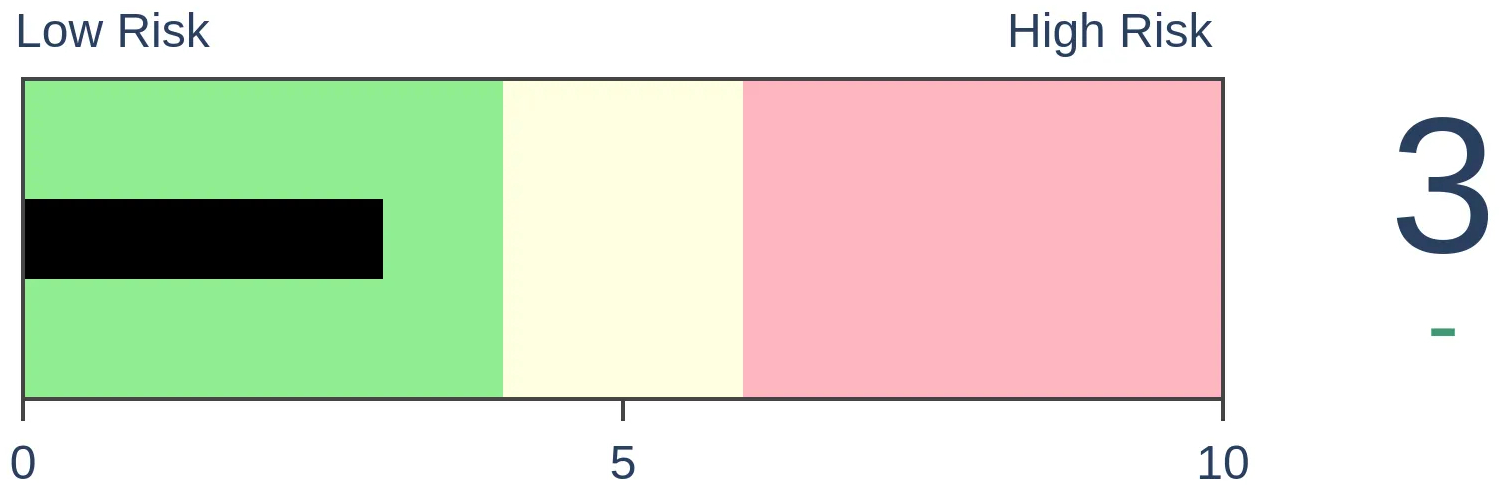
Crude Oil
|
|
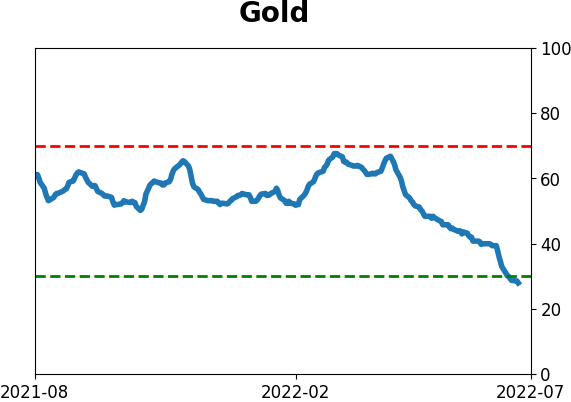
Gold
|
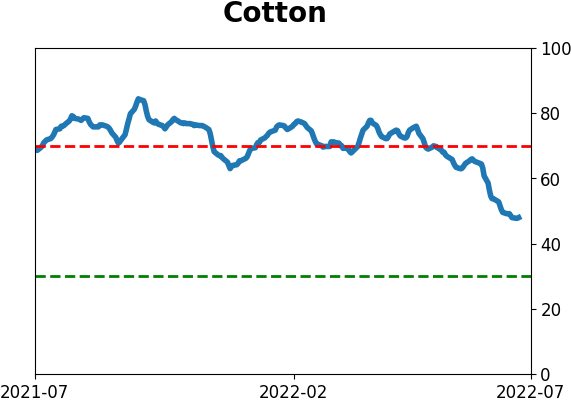
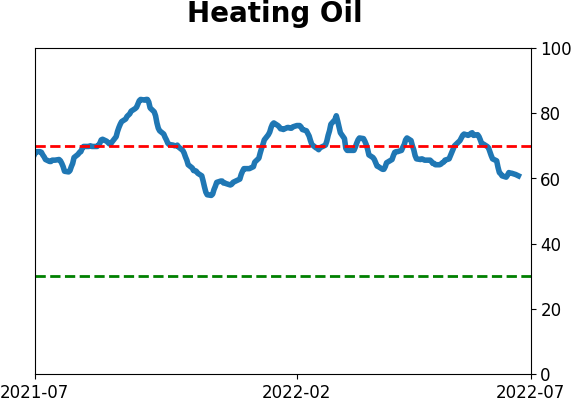
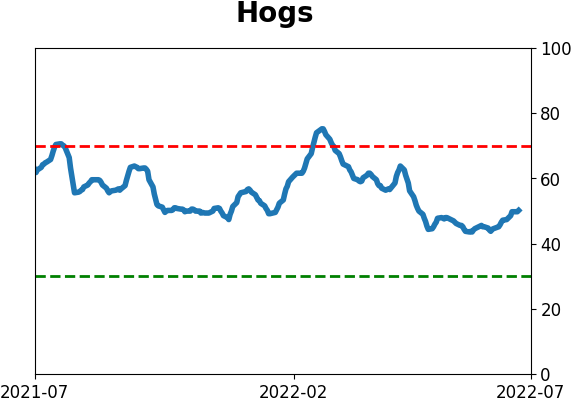
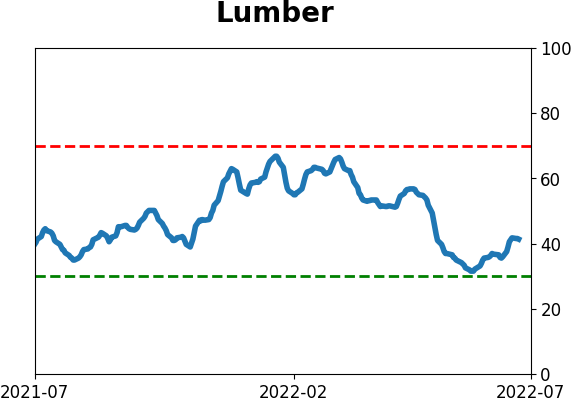
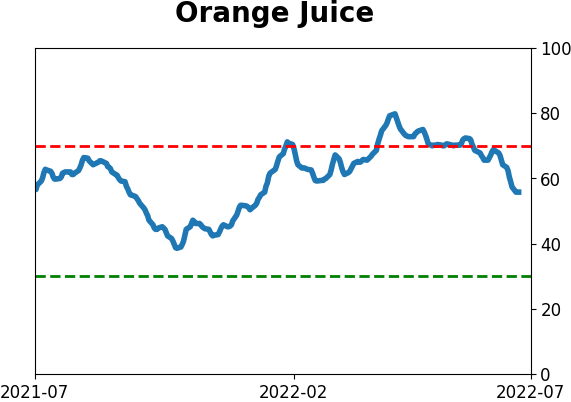
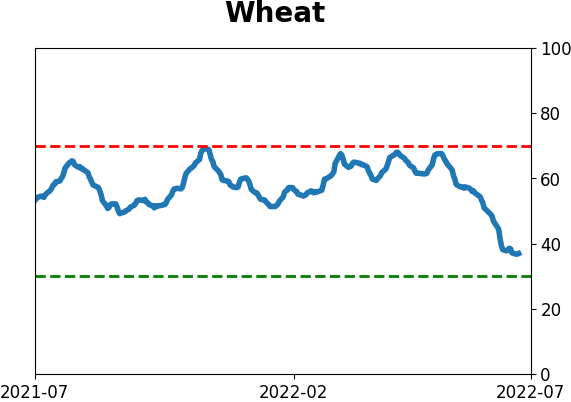
Agriculture
|
|
Research
By Jason Goepfert
BOTTOM LINE
This has been one of the whippiest years ever. Over the past 135 sessions, the S&P 500 has undergone 110 reversals, or 1% changes from its high or low to its close. In recent sessions, buyers have become eager to gain exposure, with overwhelming up volume.
FORECAST / TIMEFRAME
None
|
Key points:
- Through July, stocks have suffered a huge number of 1% intraday reversals
- This stretch has been among the whippiest since at least 1962
- One sign the volatility may be ebbing is the recent jump in eager buyers
This year has been marked by near-constant reversals
Stocks have been whipping back and forth based on the latest headlines, Fed rumors, and earnings reports. Sometimes those whips have occurred during the day, or even multiple times during a day. Bloomberg notes that this has been one of the whippiest years in decades.
"The S&P 500 wiped out a 1% gain Monday, roughly two weeks after the index erased a 2% drop. It's the 17th time since January that the benchmark reversed an intraday move of at least 1%, putting it on course for the most volatile year since the global financial crisis, by this measure."
This depends on how a reversal is measured, but since our intraday data begins in 1962, we can look for times when the S&P 500 closed 1% or more below its intraday high or 1% or more above its intraday low. Using that methodology, through 135 days in the year, 2022 has had the 2nd-most reversals in 40 years, next to 2008.
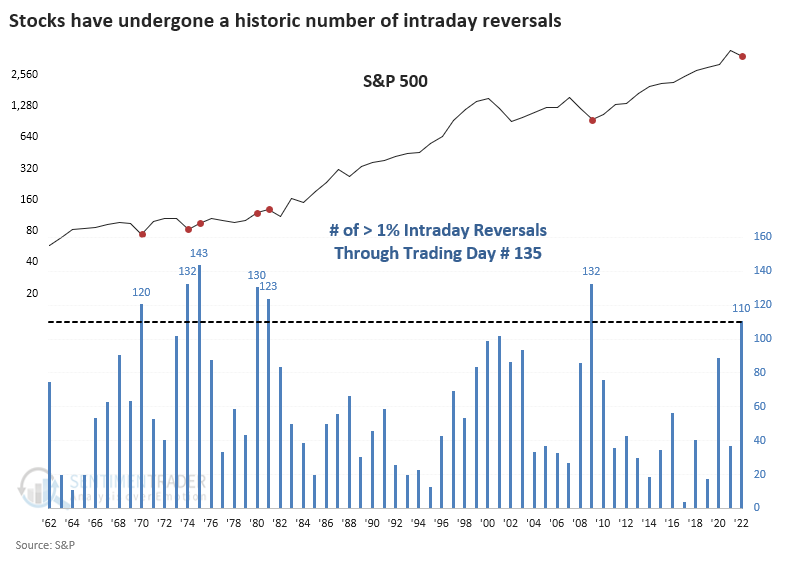
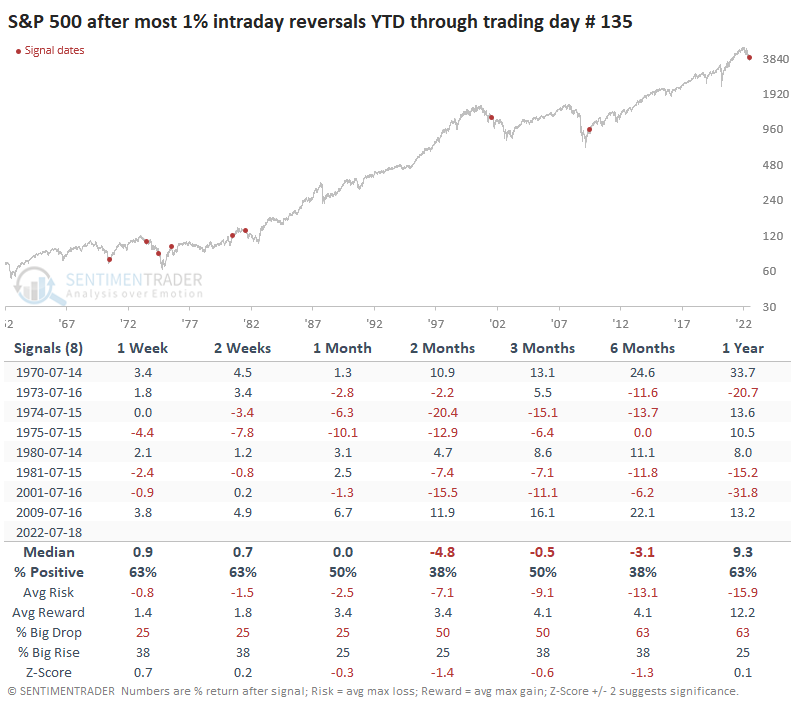
This was not necessarily a good thing. Volatility is high during unhealthy market environments, and stocks often struggle during the late summer months, so those two factors together preceded big swings and mostly negative returns over the coming months.
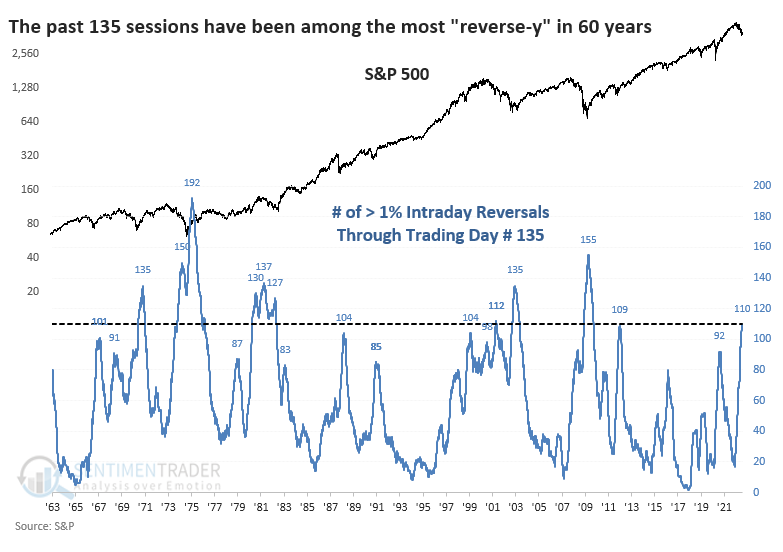
One of the whippiest stretches in 60 years
If we remove the calendar constraint and look at the most reversals in any rolling 135-day span, things change. With 110 reversals, this latest stretch has been the most "reverse-y" since 2009 and ranks as one of the whippiest in at least 60 years.
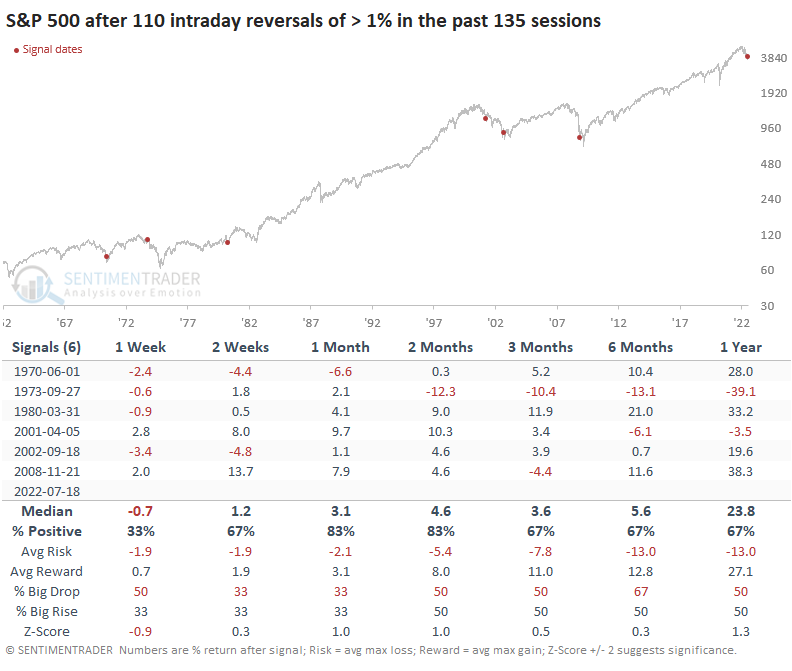
After similar periods that were prone to reversals, the S&P's returns were mostly good. A few dates (1967, 1987, 2011) just barely missed the cutoff; including those would have boosted the S&P's forward returns even more. There was really only one failure that didn't lead to any meaningful or lasting upside, in 1973. That date is a bit of a bugger because it's shown up in several studies in recent weeks.
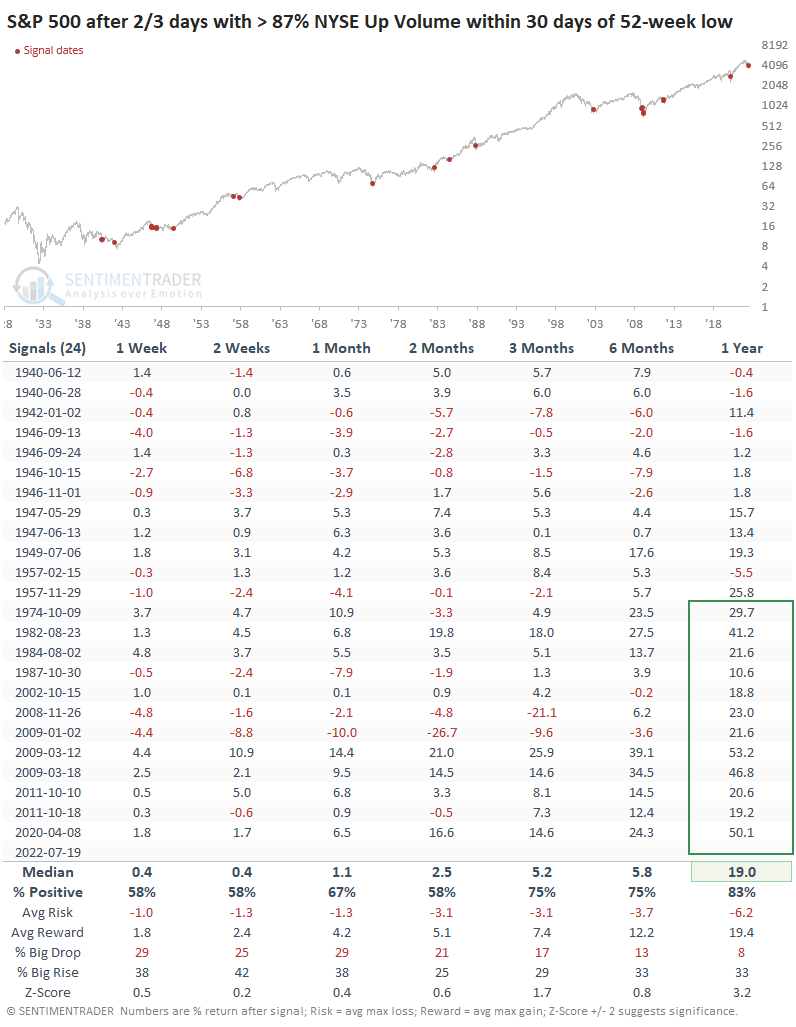
One very good sign is that buyers seem eager to return to riskier assets.
On the NYSE, two out of the last three sessions enjoyed more than 87% up volume. When the S&P 500 was coming out of a recent 52-week low, this kind of thrust saw double-digit gains over the next year every time since 1962. I have less confidence in the breadth data before then, but even so, returns were mostly good, though more muted.
What the research tells us...
We've seen in recent weeks that investors are supremely negative on stocks and have been for an extended time. The extreme volatility and whippy conditions do not help. Some of the worst market timers are some of the most confident in a continued decline, while typically good market timers are betting on a rebound. One thing we've been lacking is solid confirmation that buyers are eager to return. While there have been a couple of painful failures of breadth thrust follow-throughs, recent sessions have perhaps changed that timidity.
Indicators at Extremes
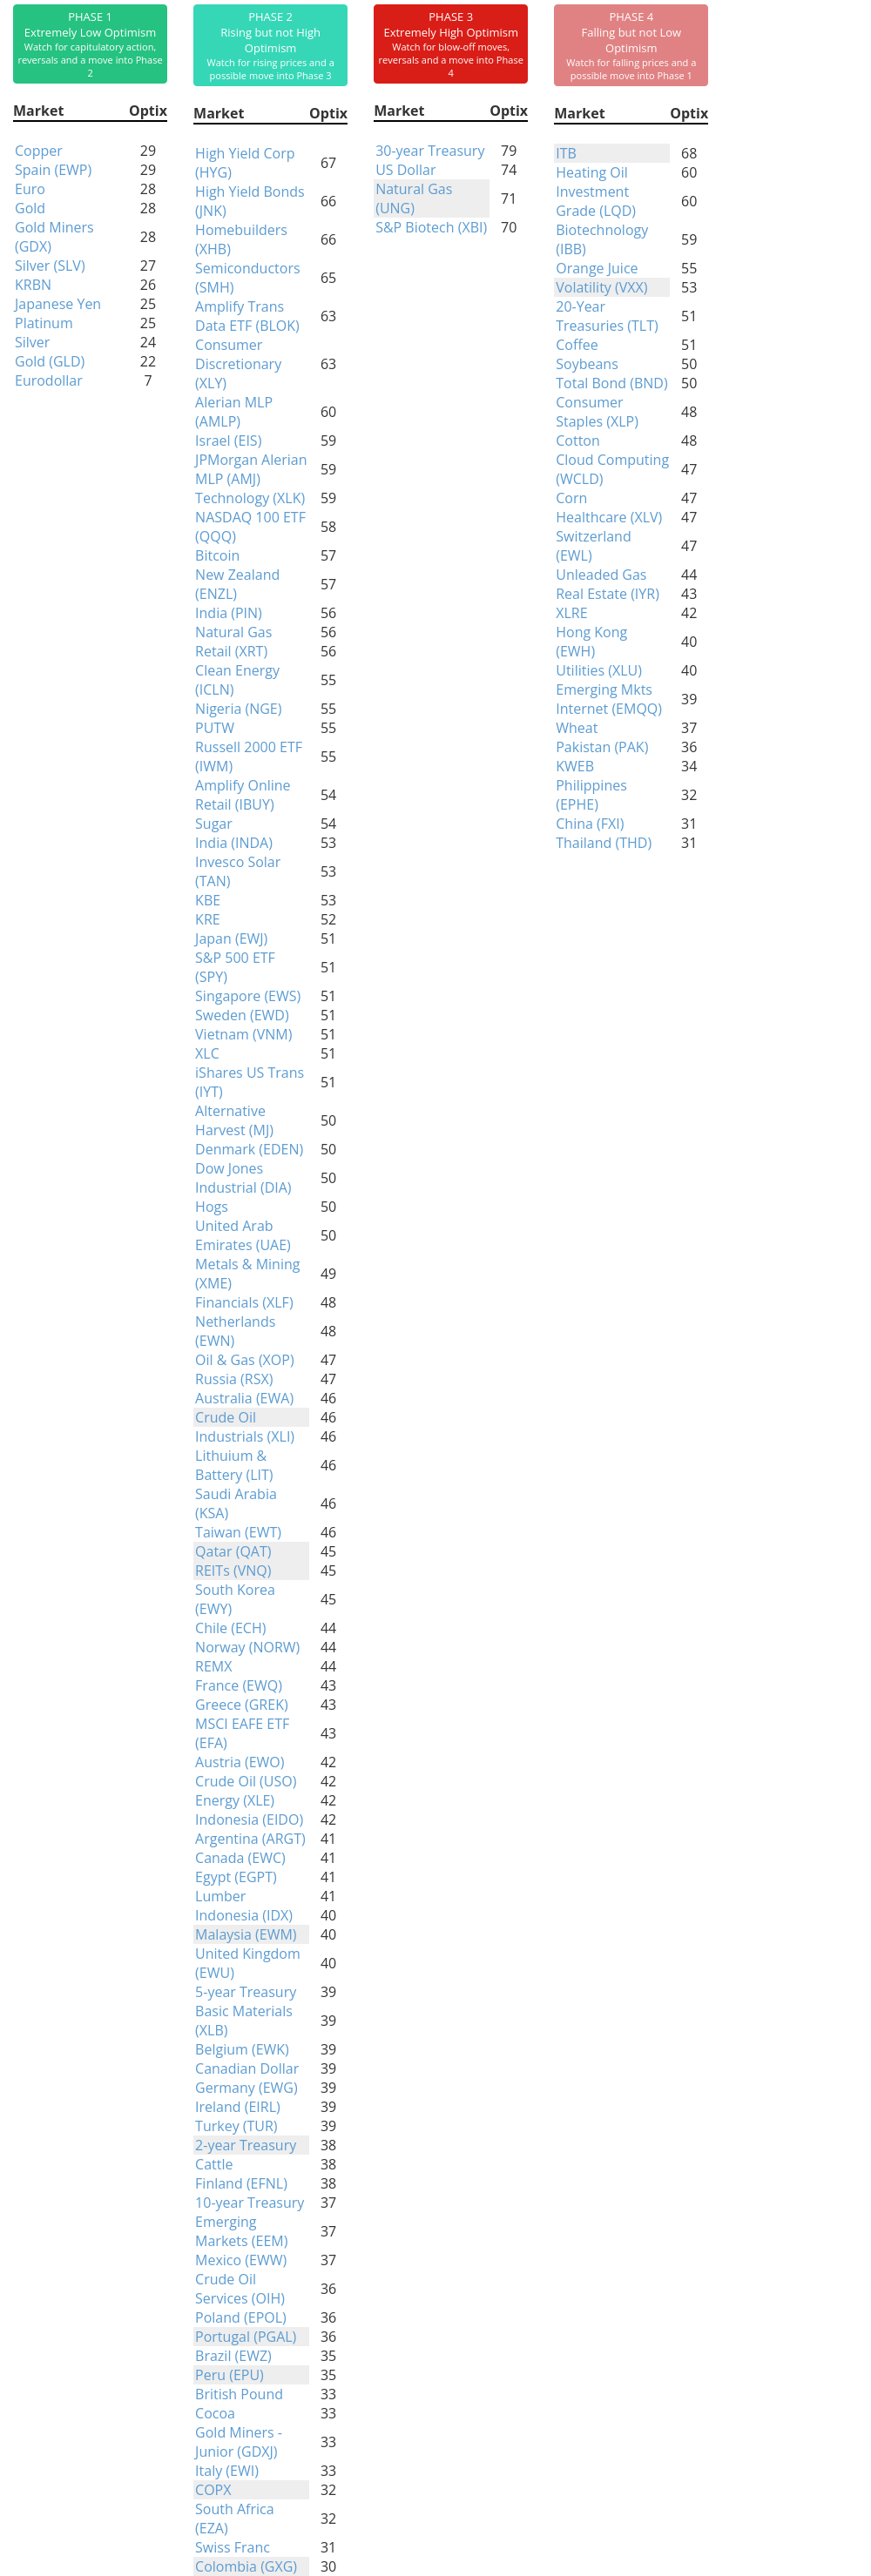
Phase Table
Ranks
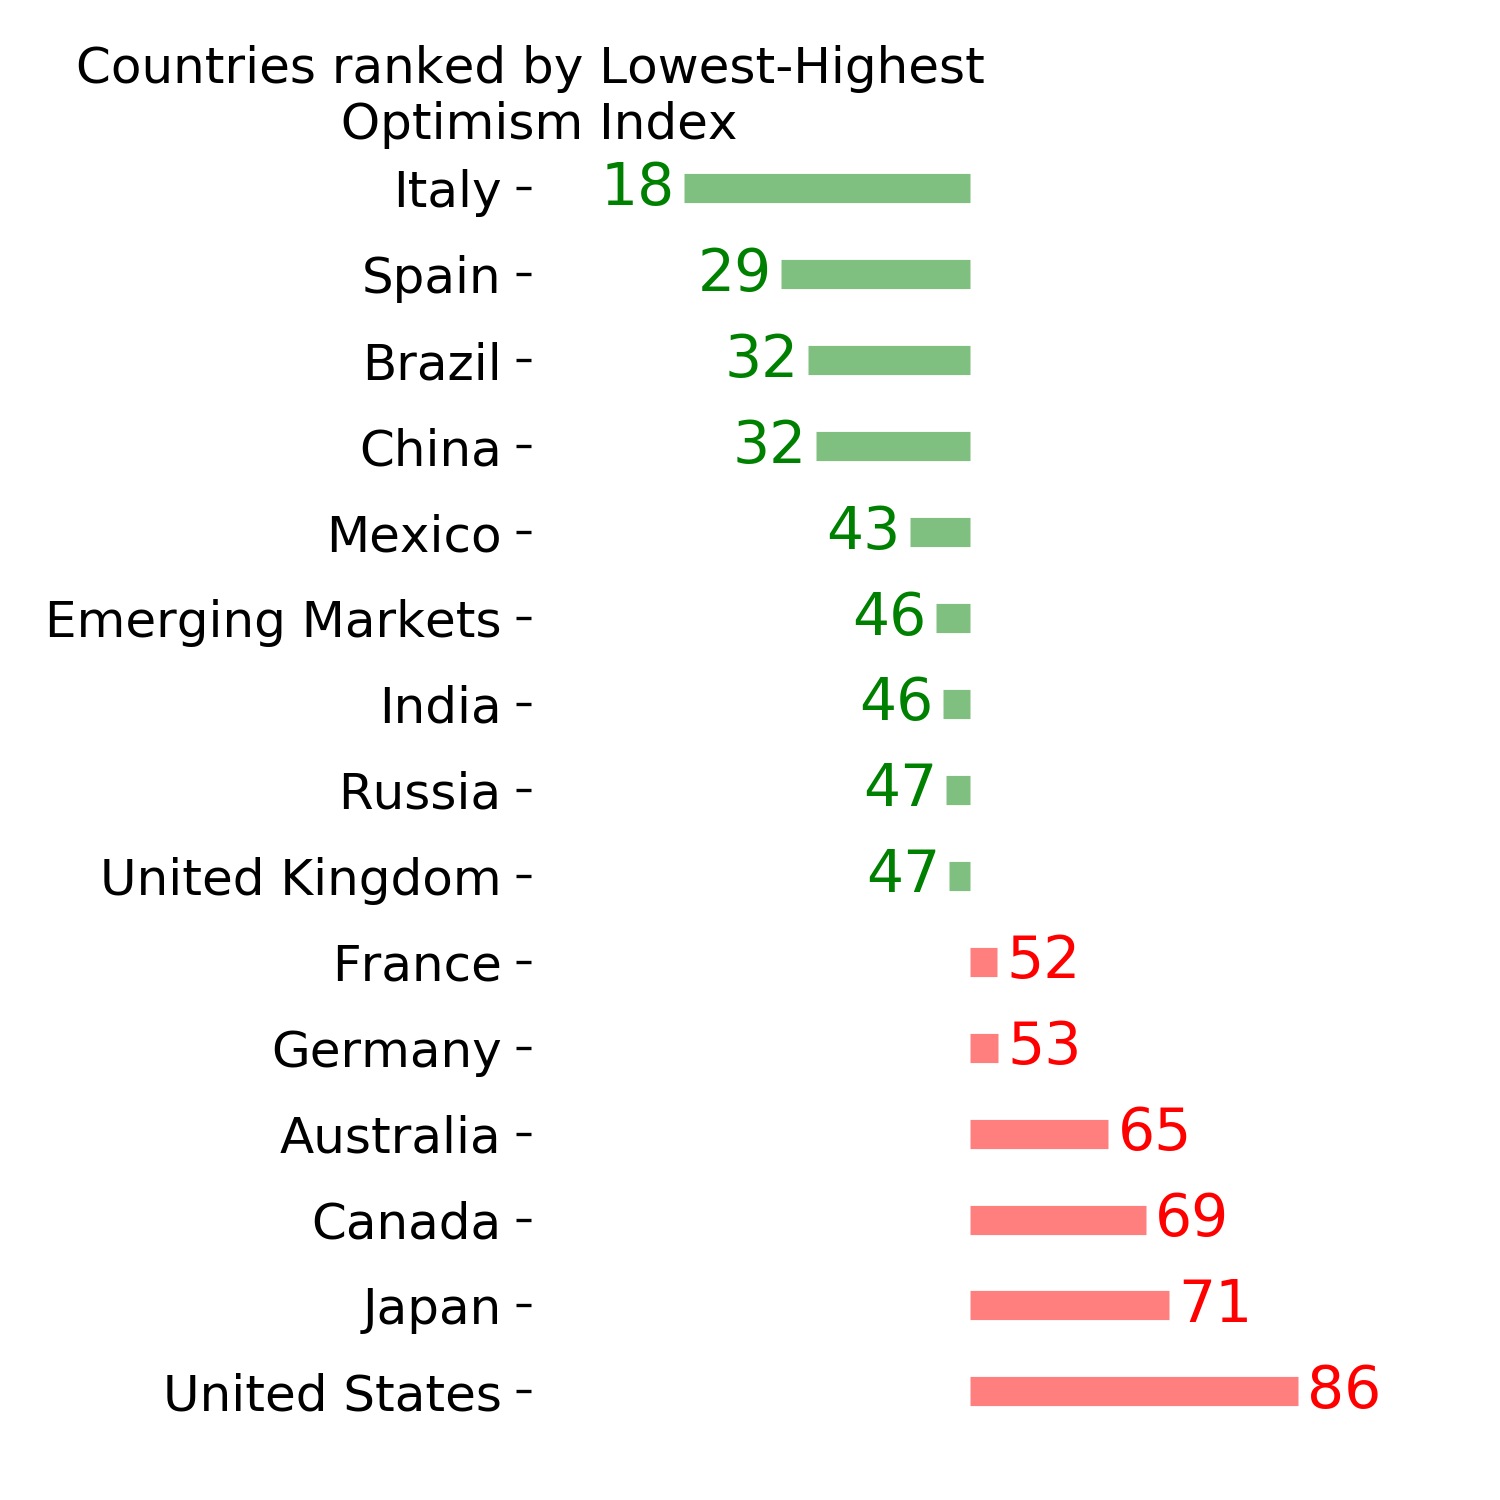
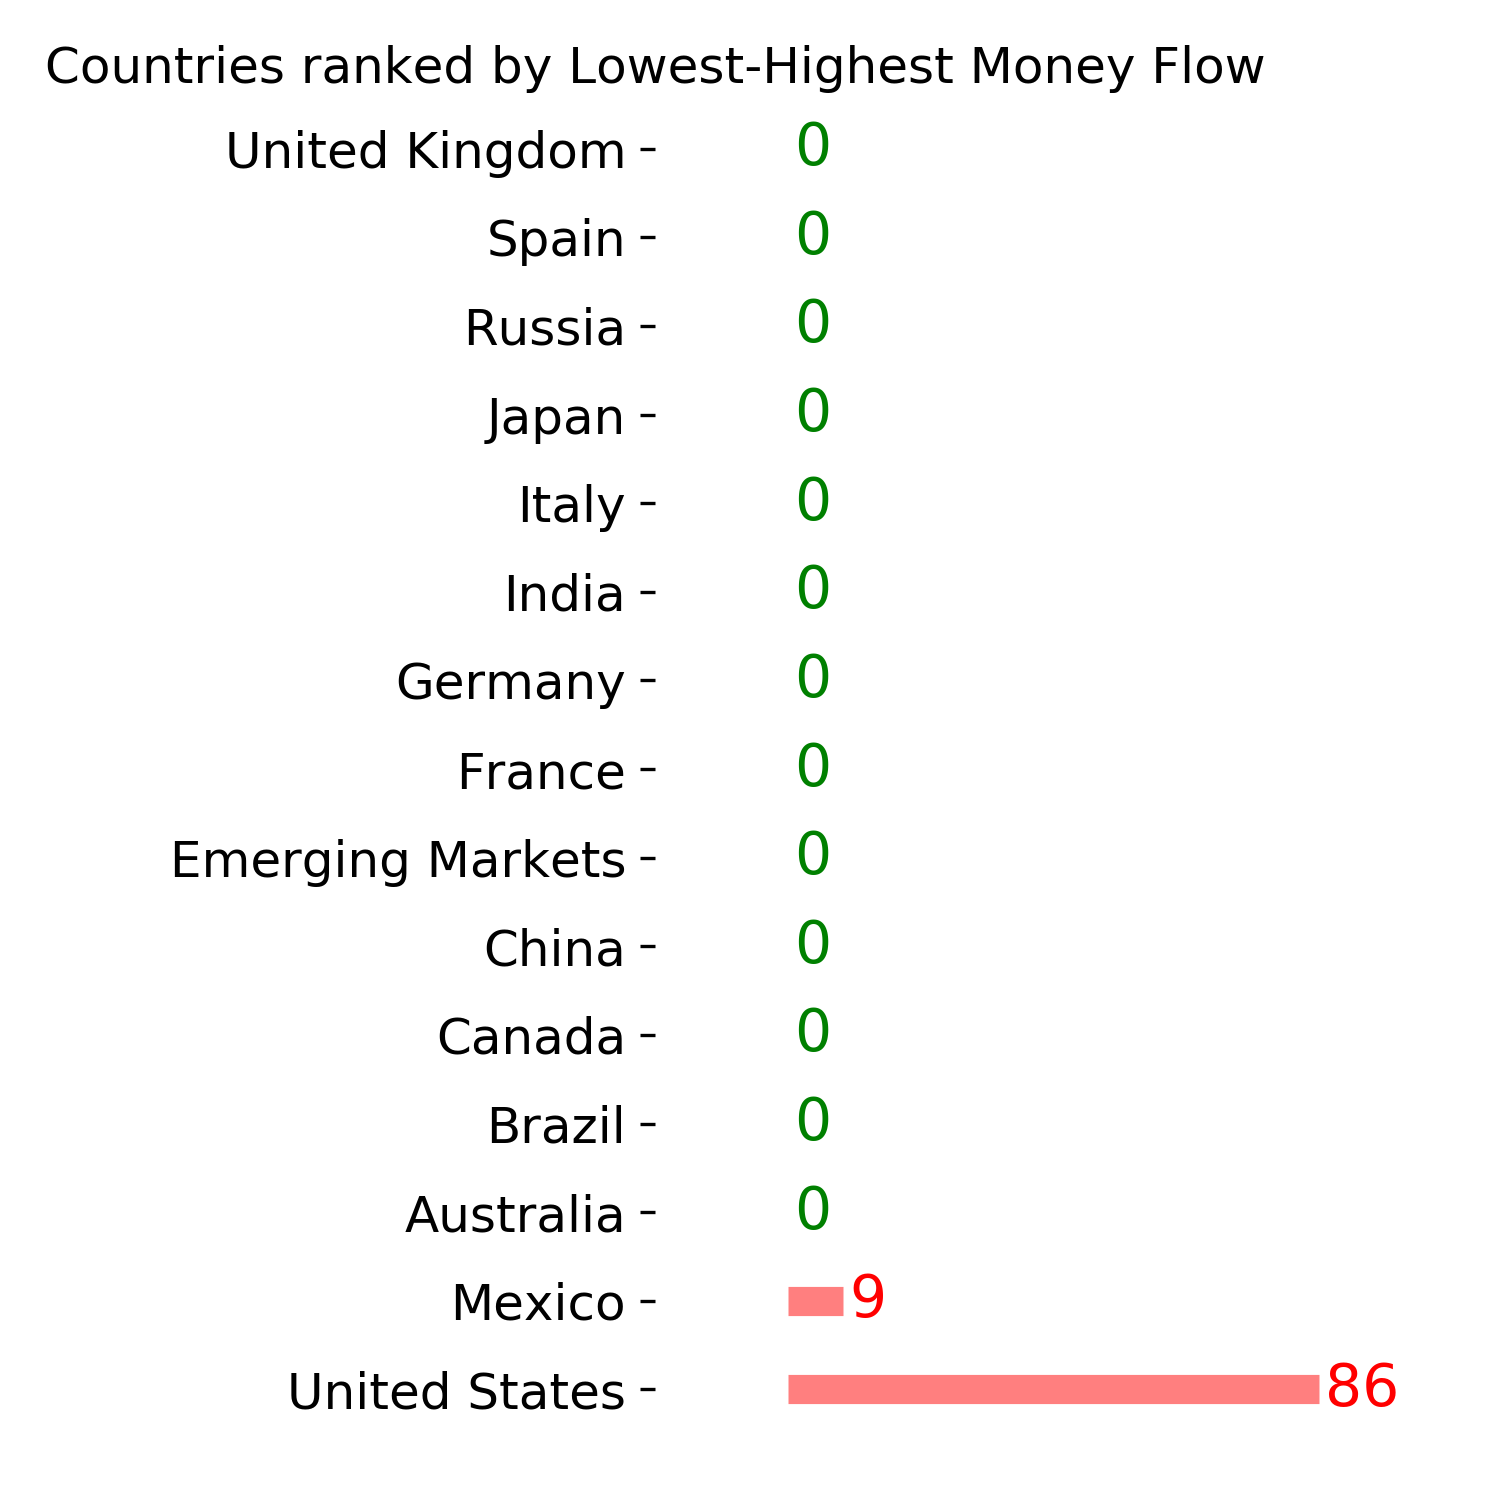
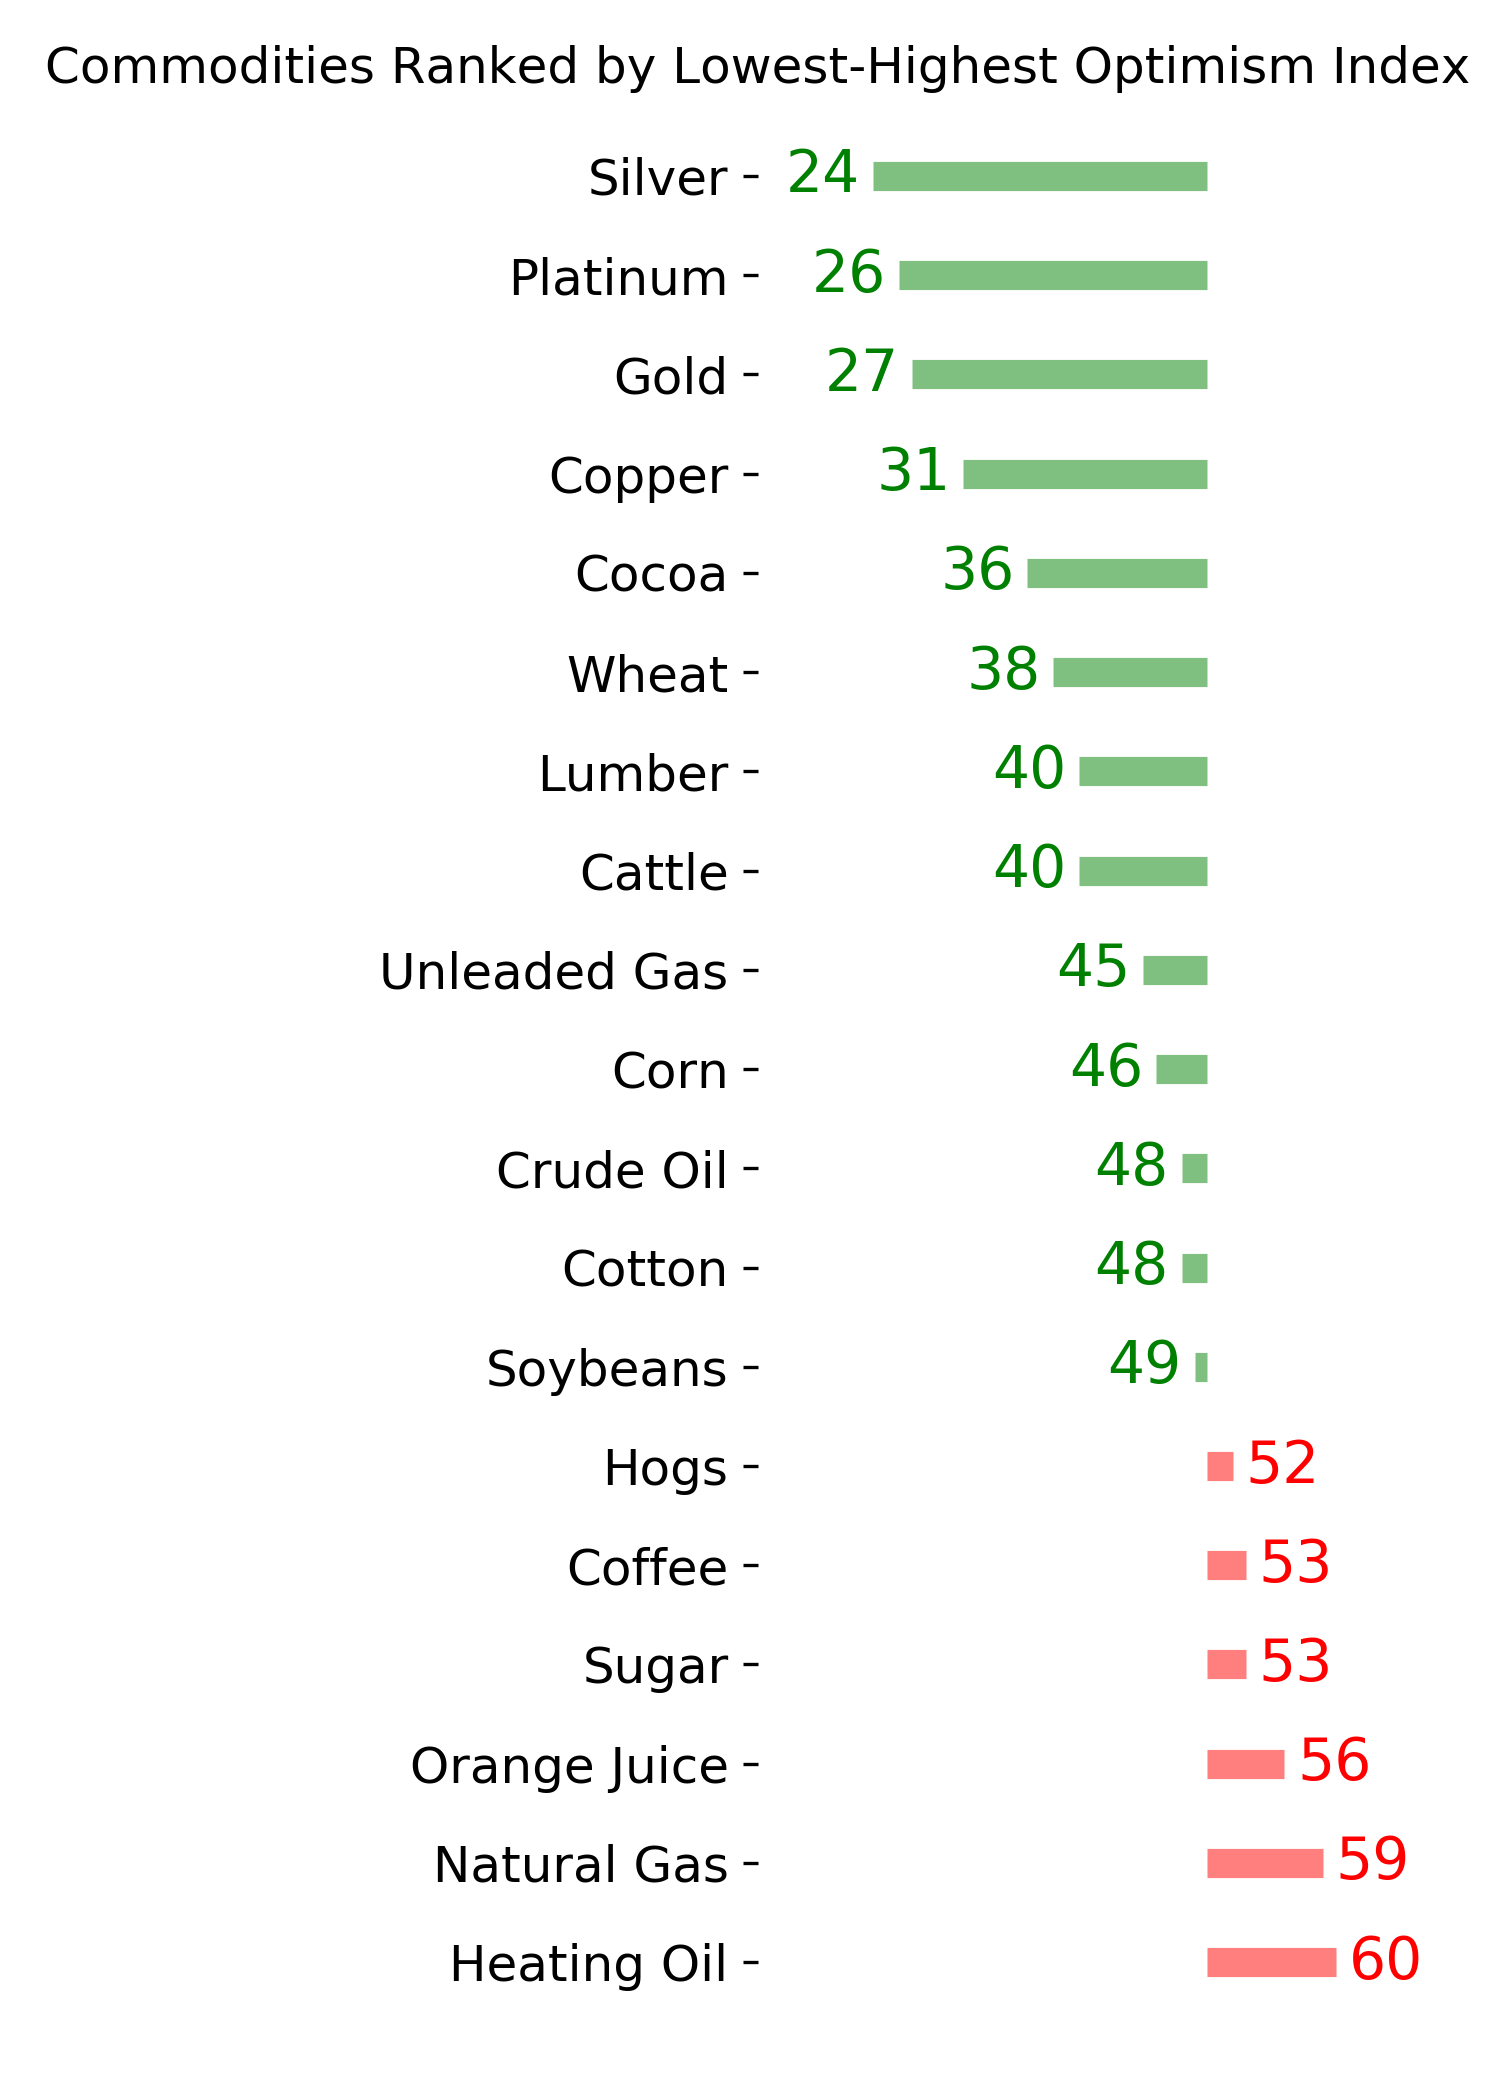
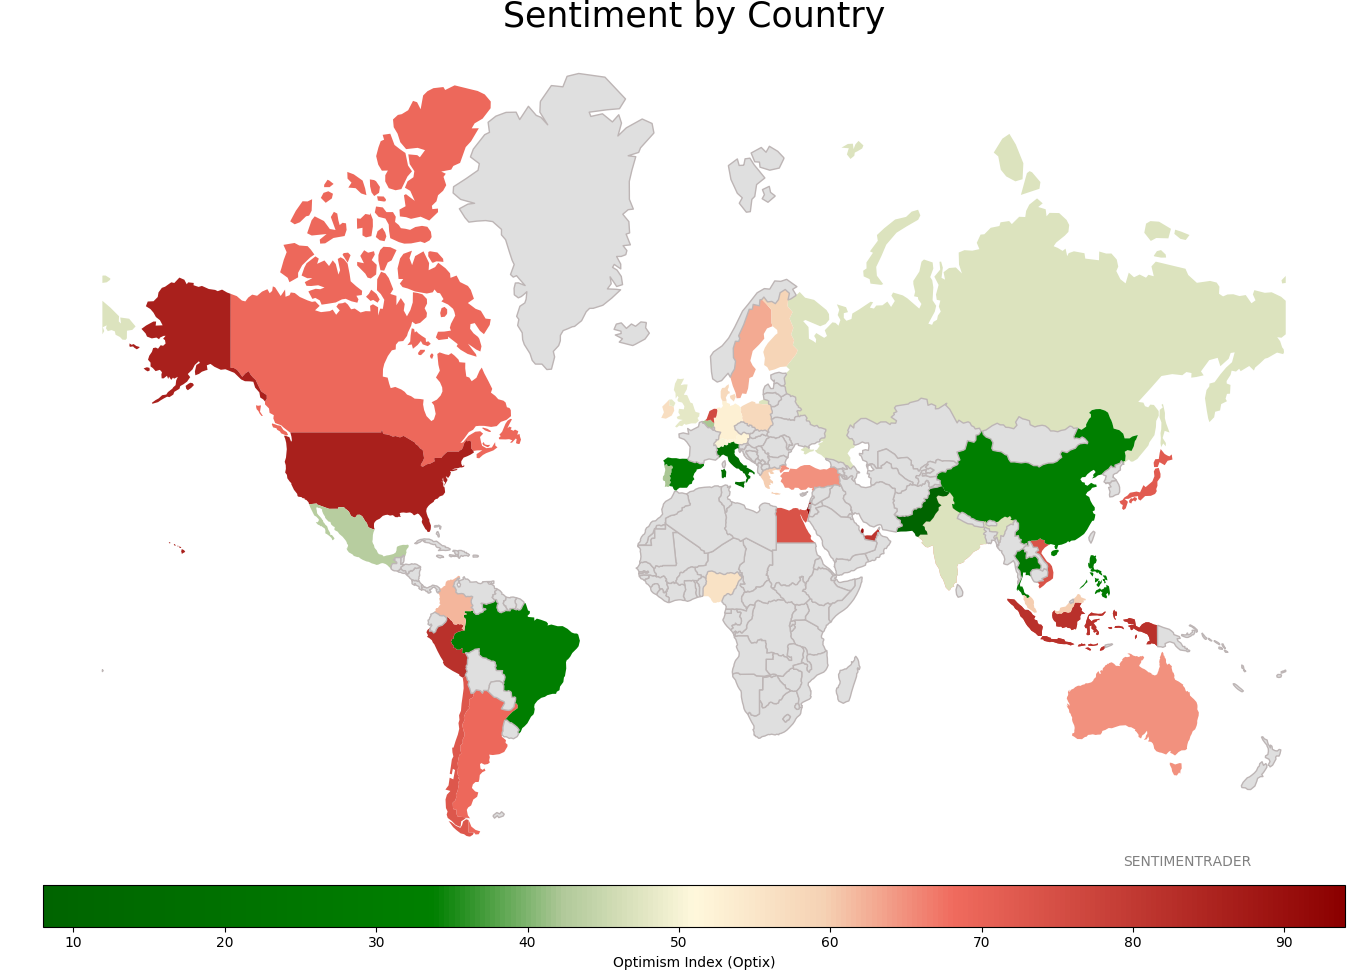
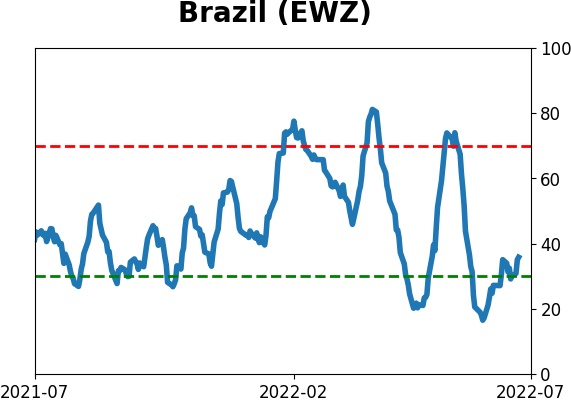
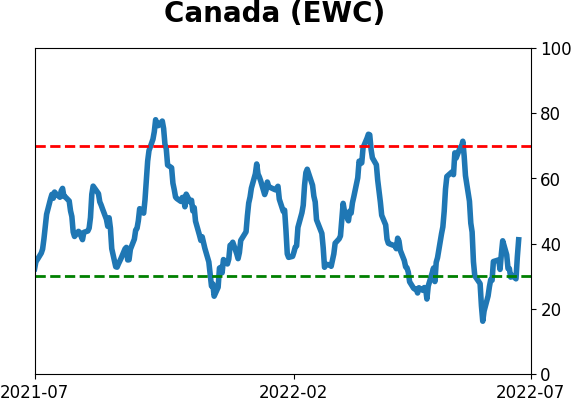
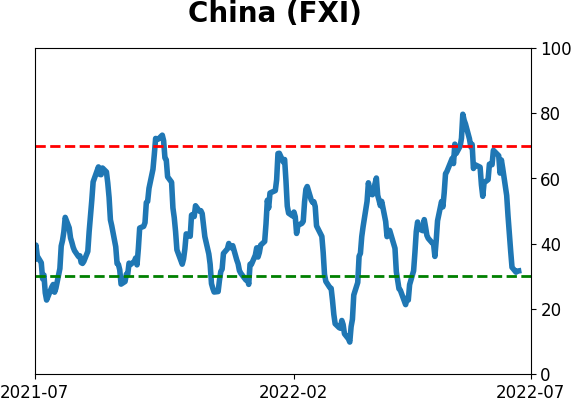
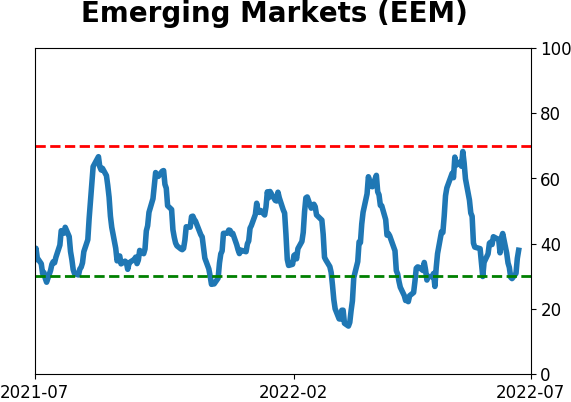
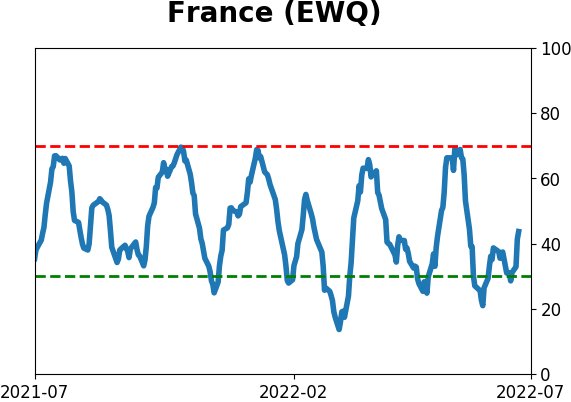
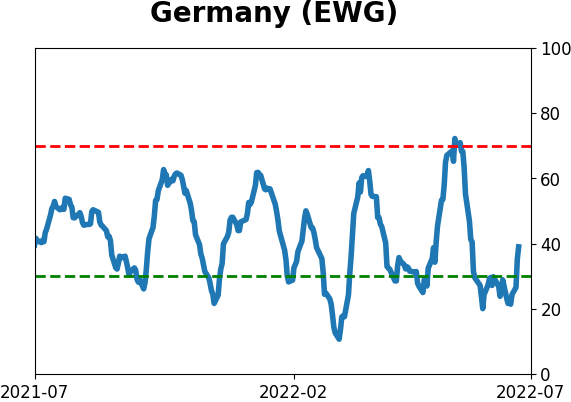
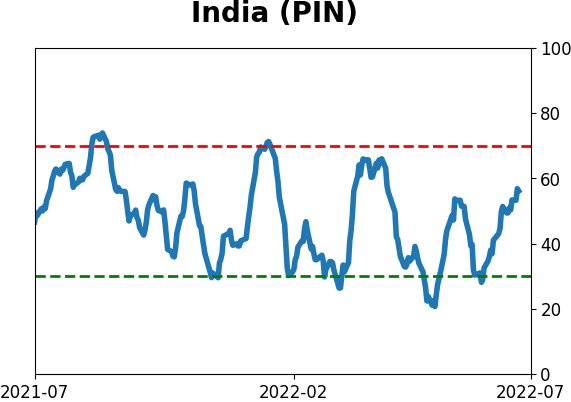
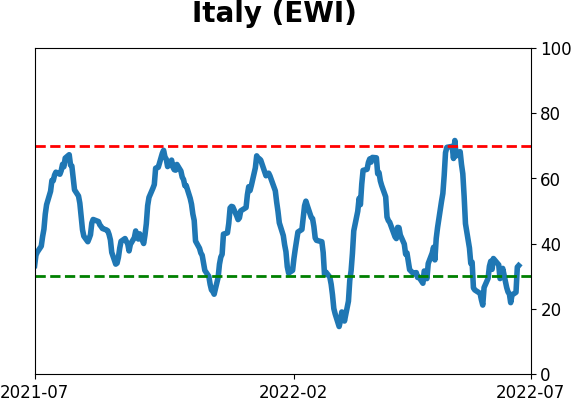
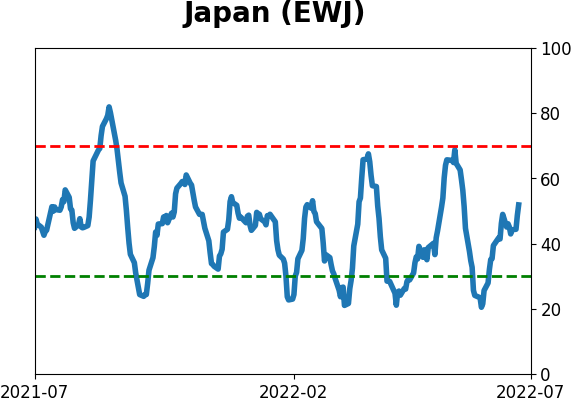
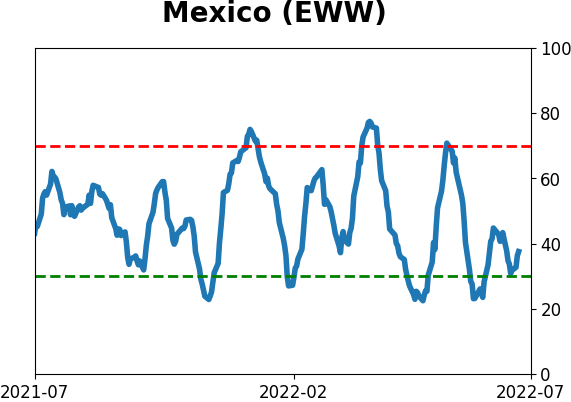
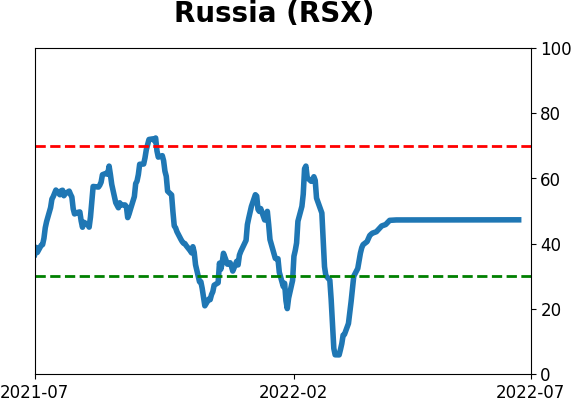
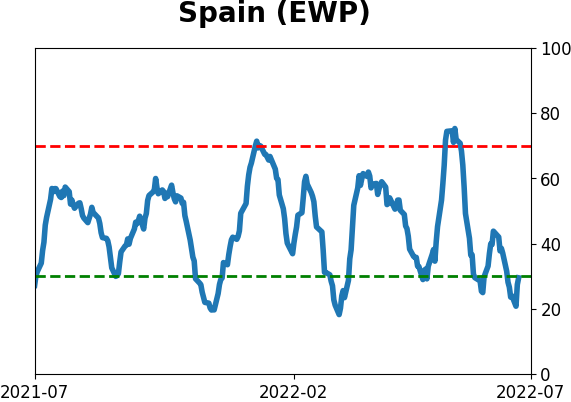
Sentiment Around The World
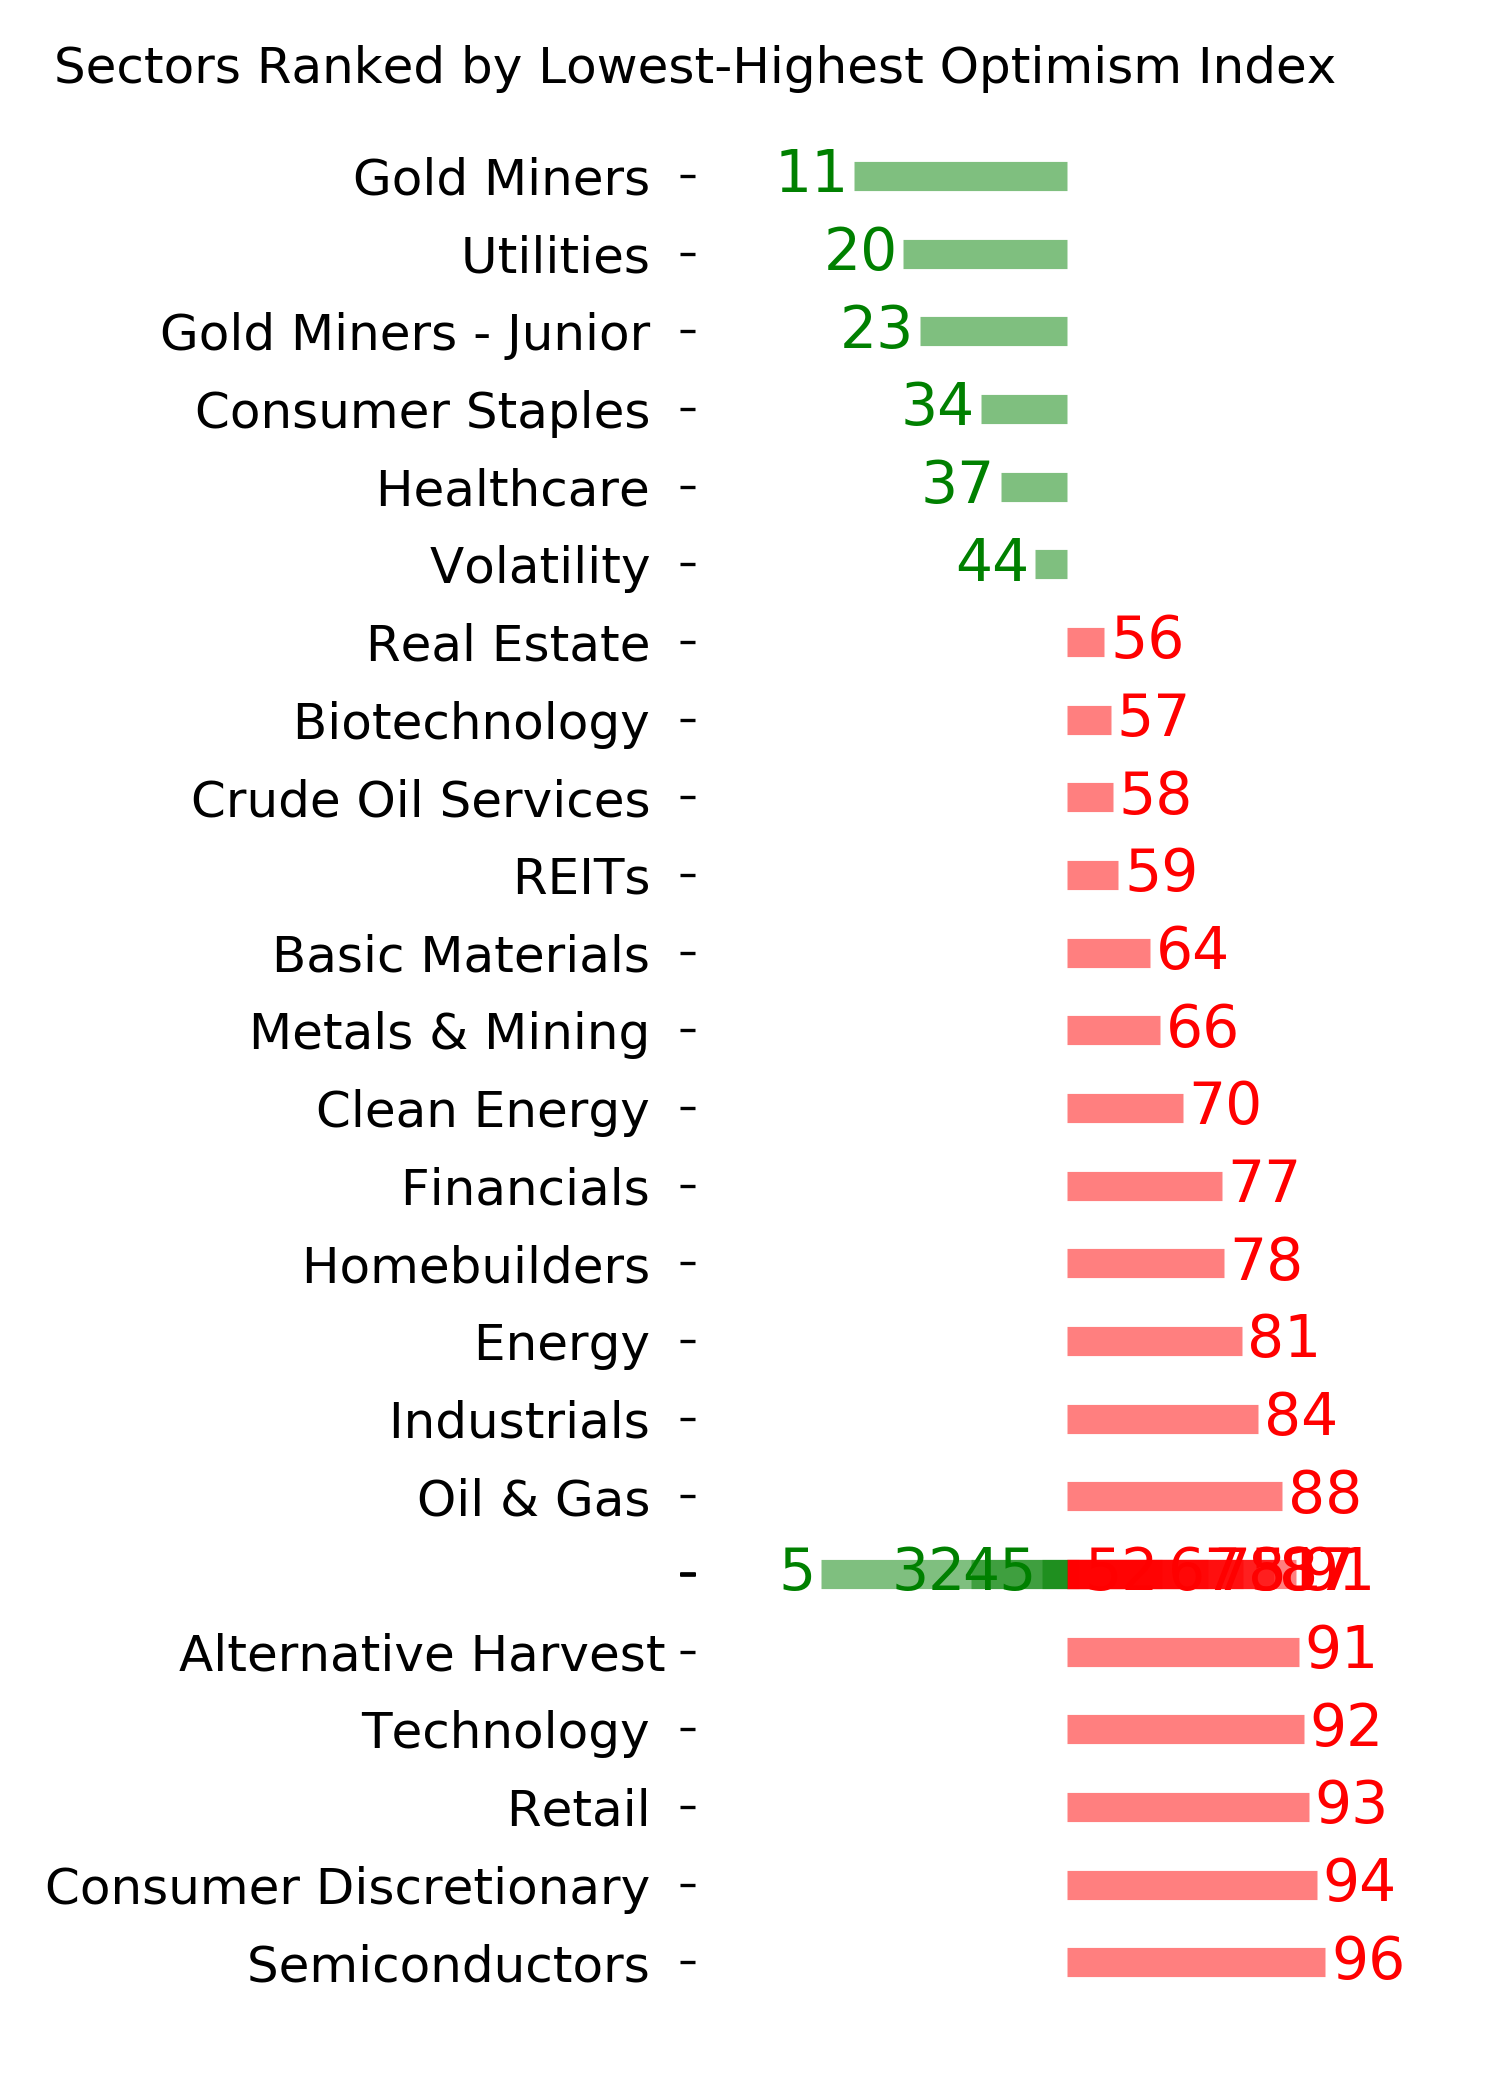
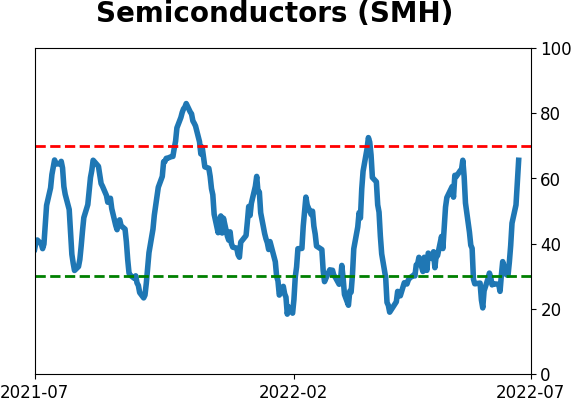
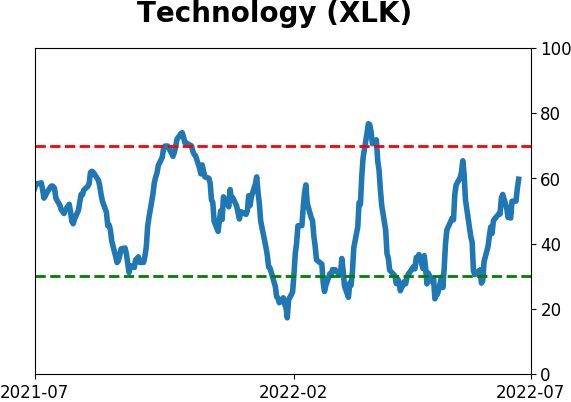
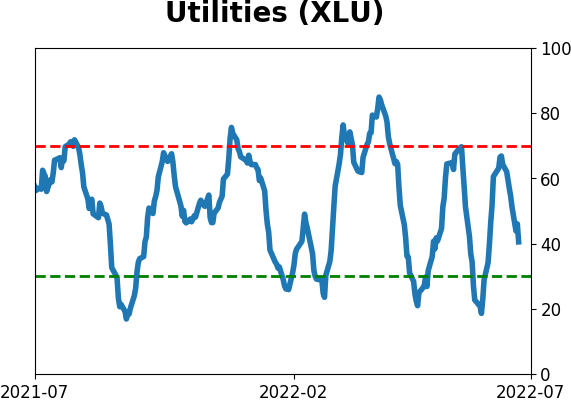
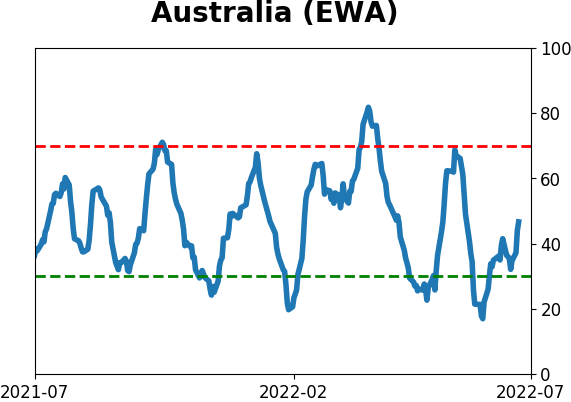
Optimism Index Thumbnails
|
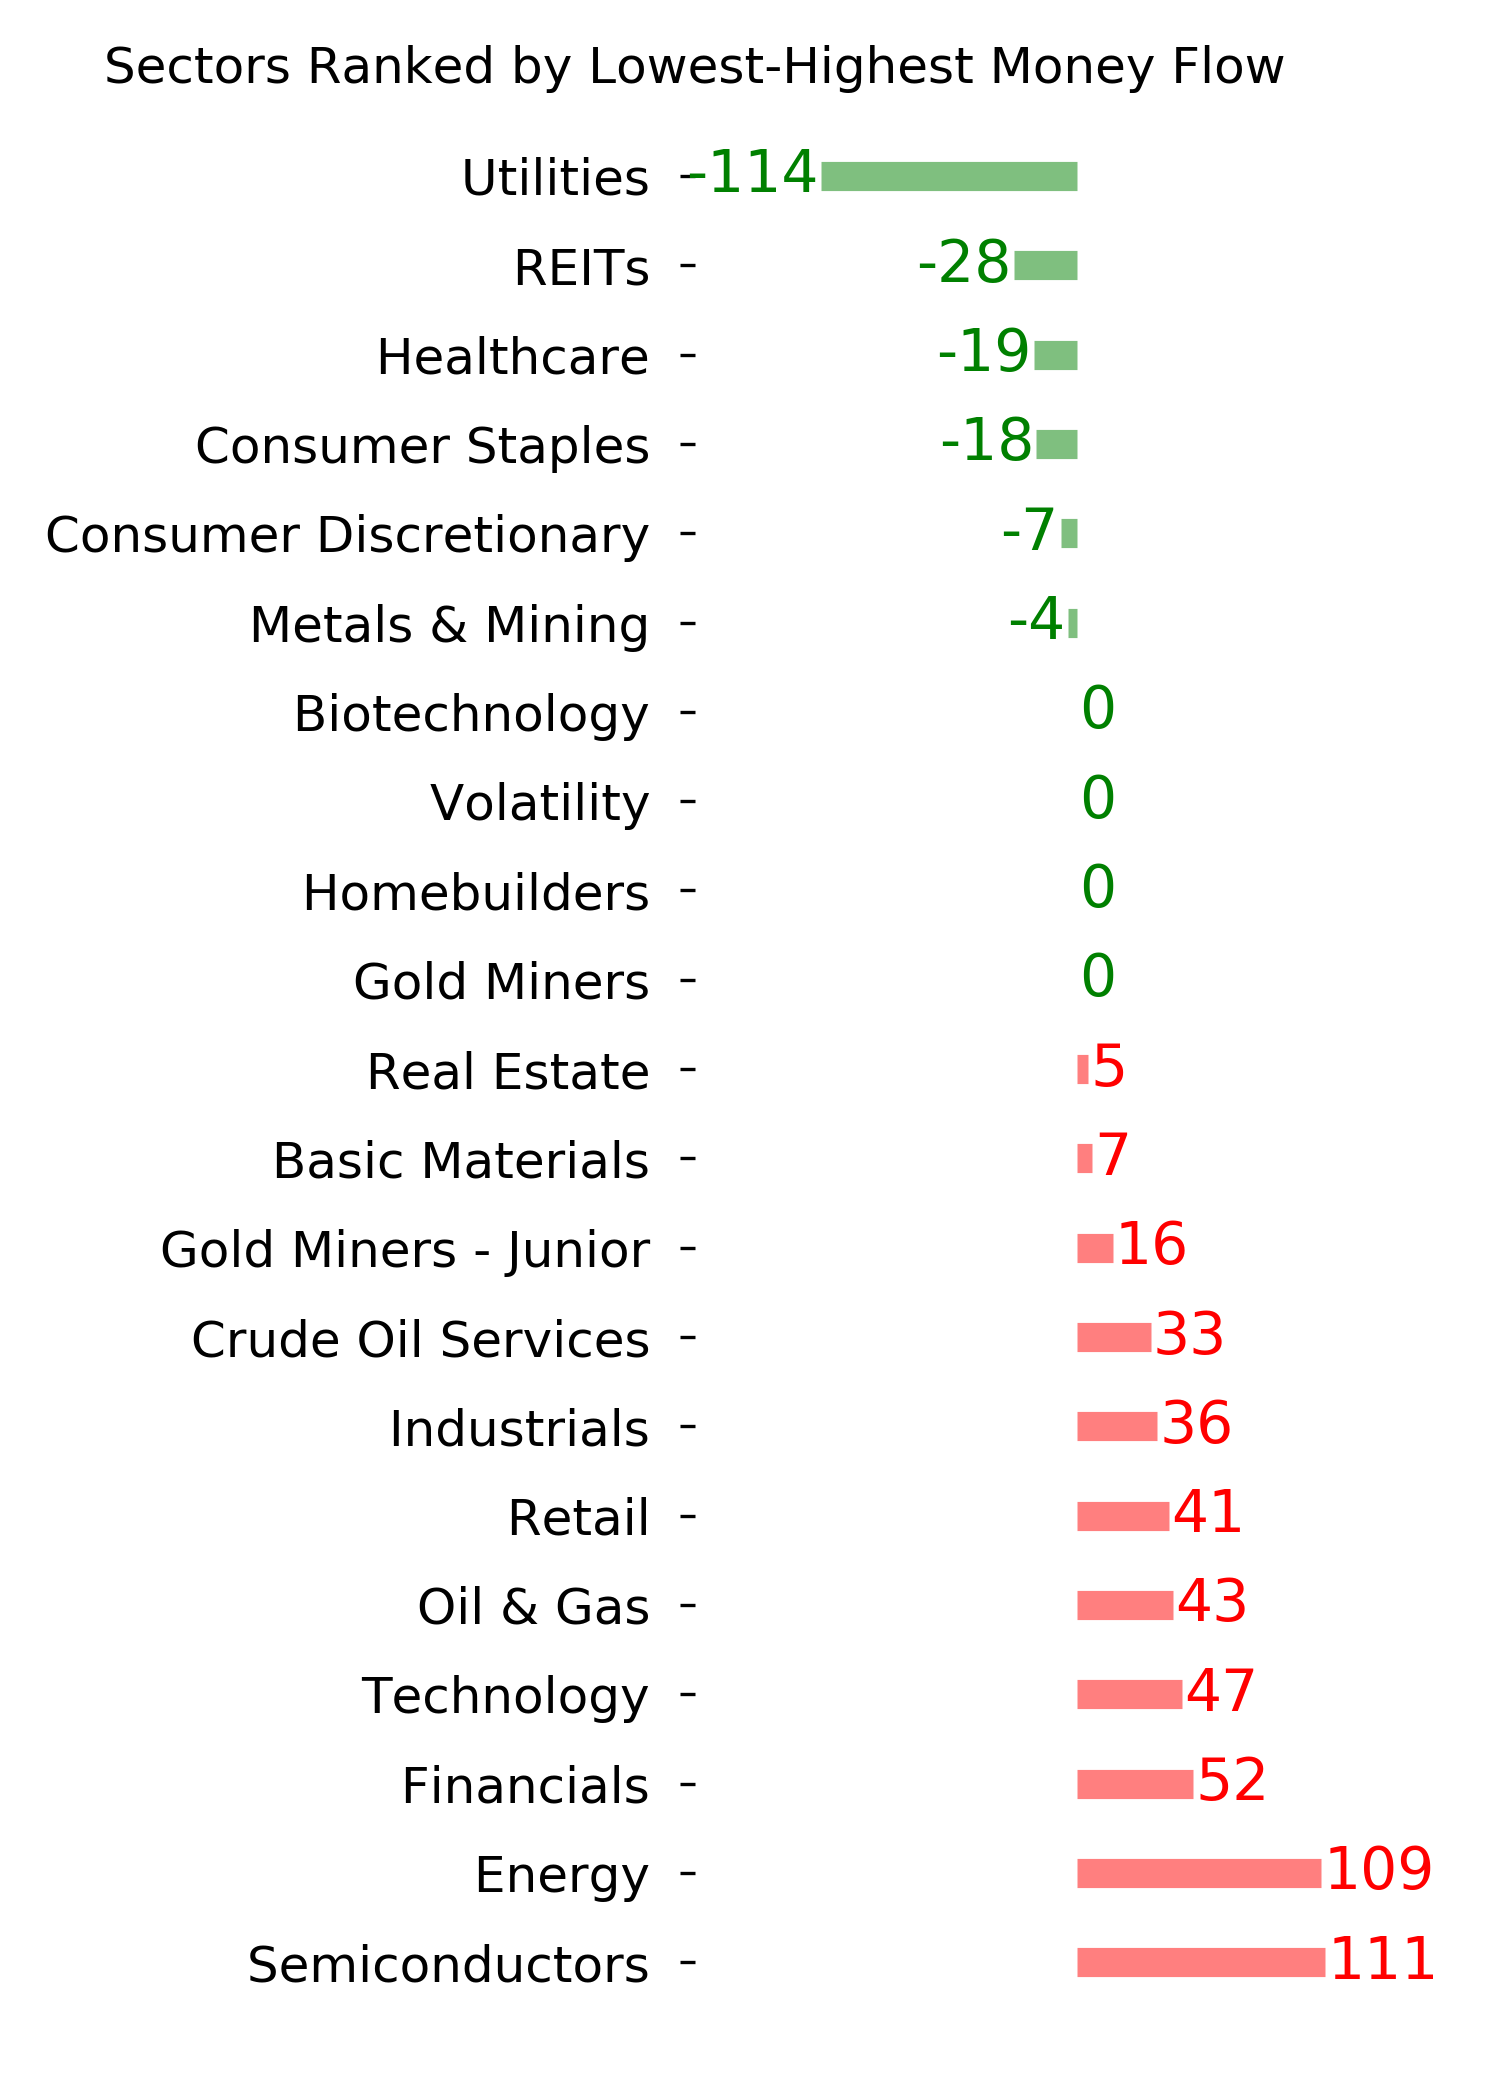
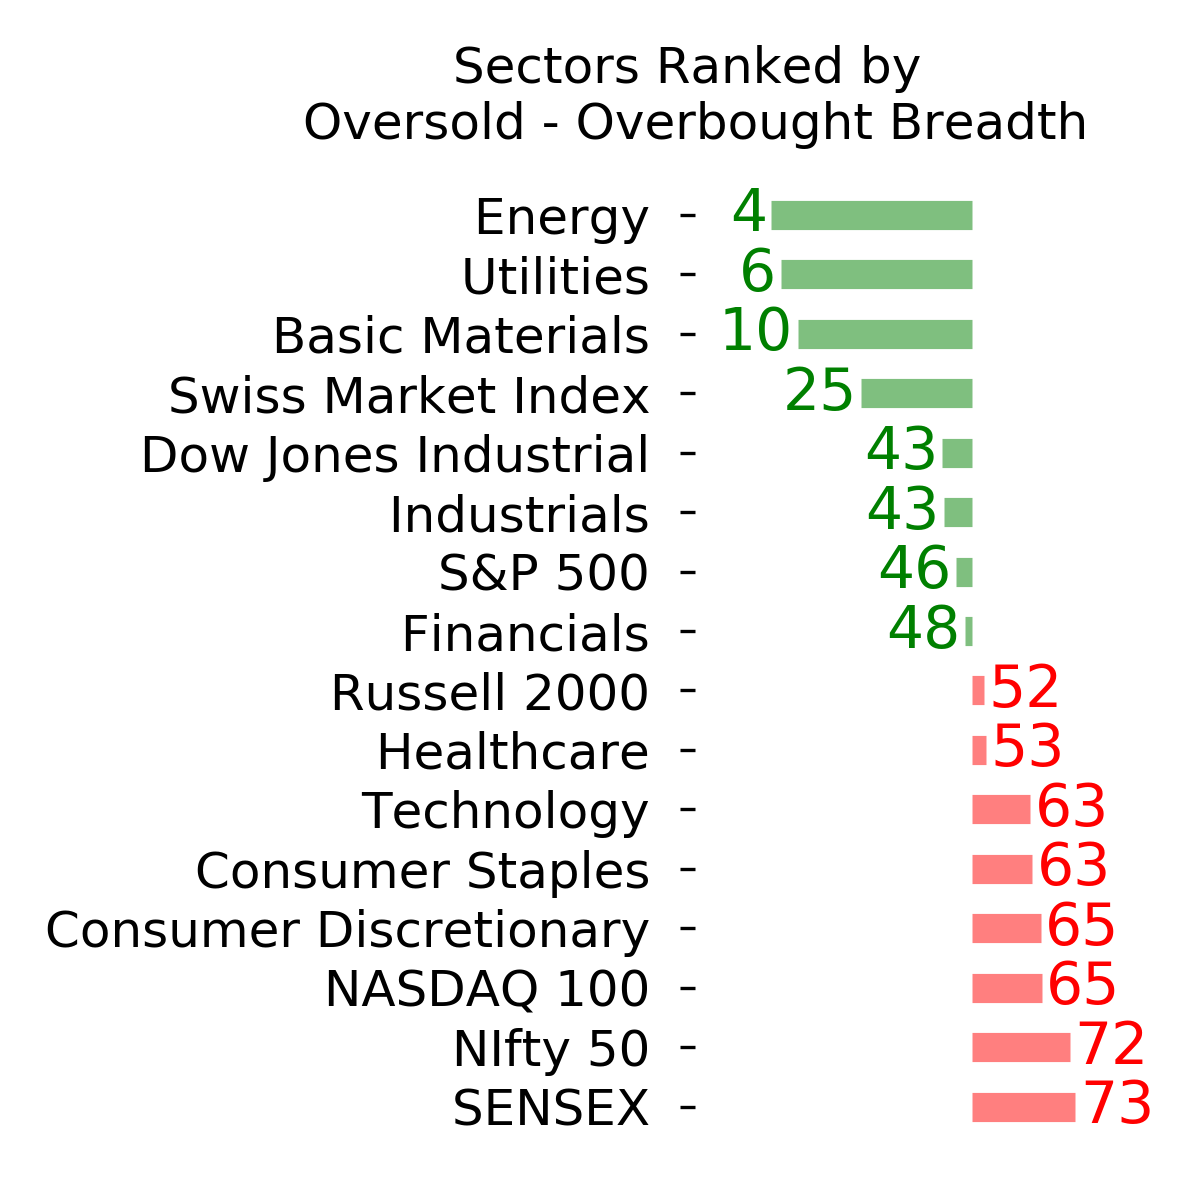
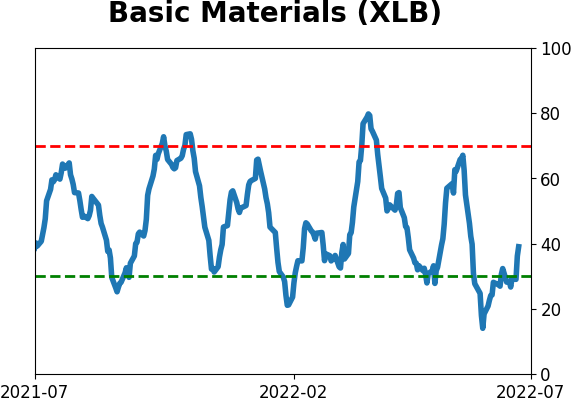
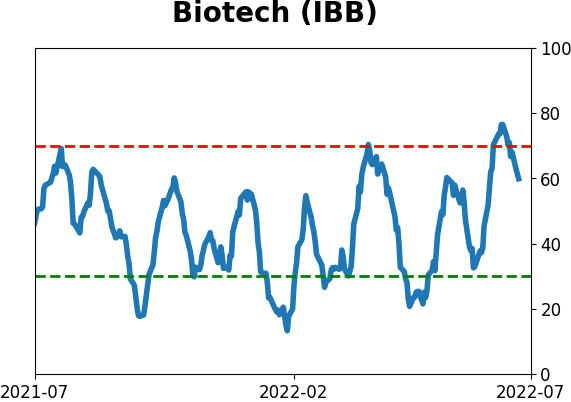
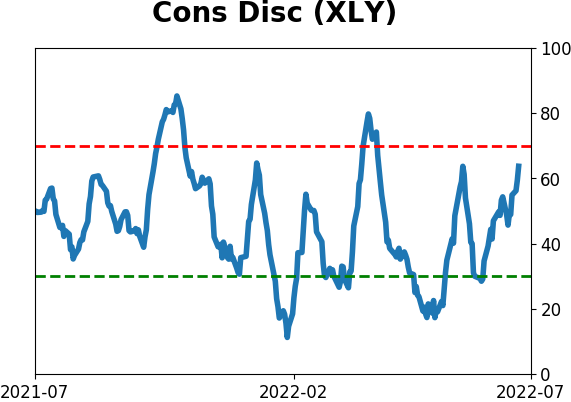
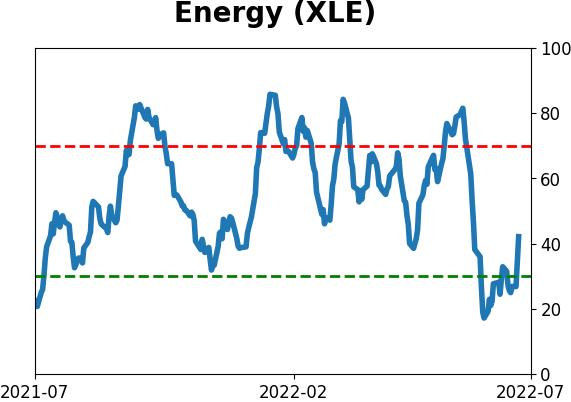
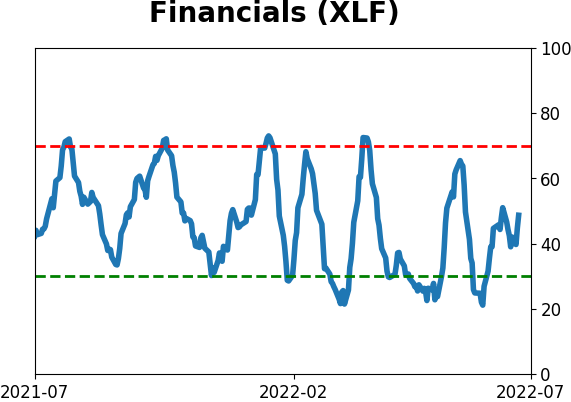
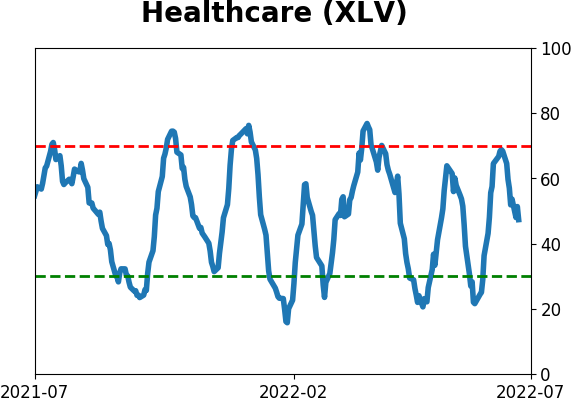
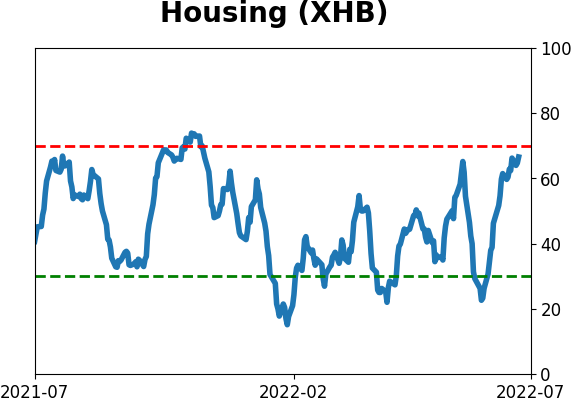
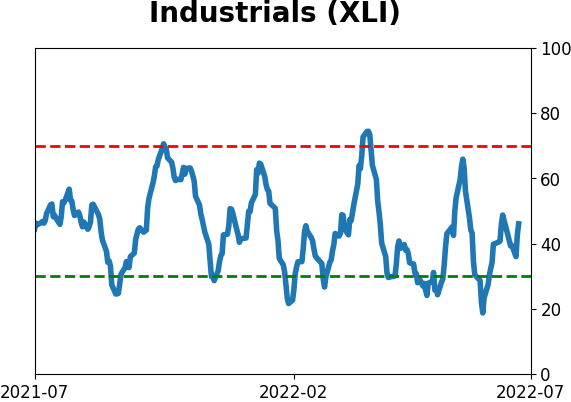
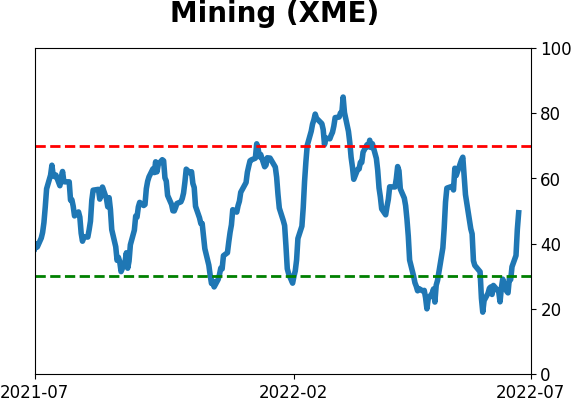
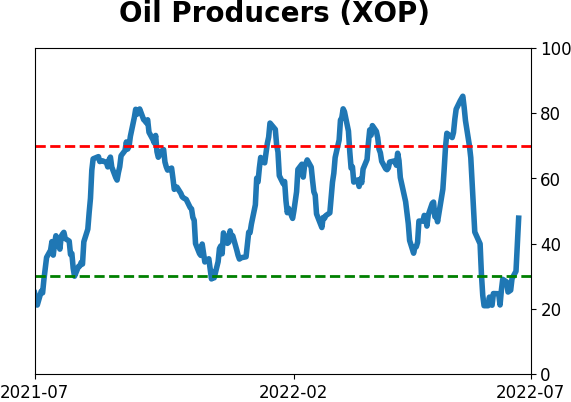
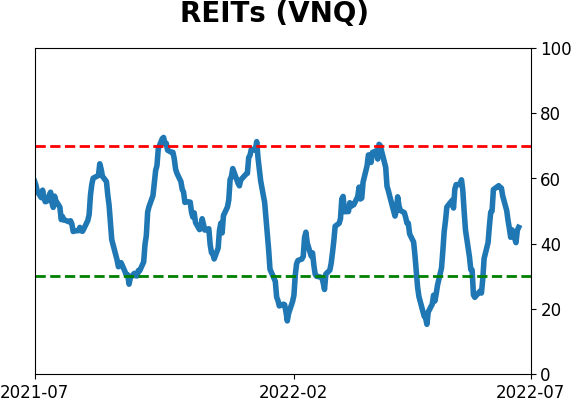
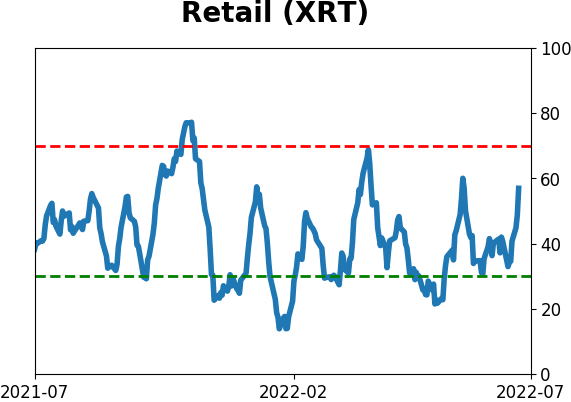
Sector ETF's - 10-Day Moving Average
|
|
|
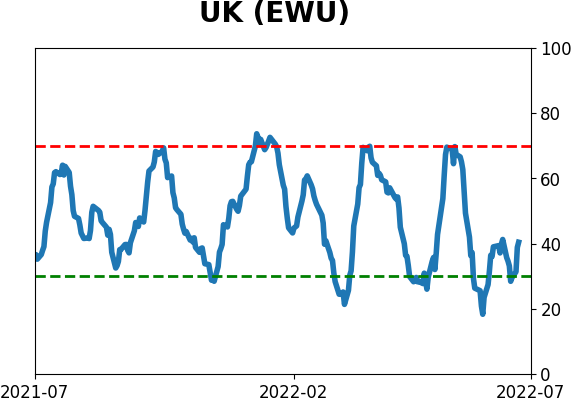
Country ETF's - 10-Day Moving Average
|
|
|
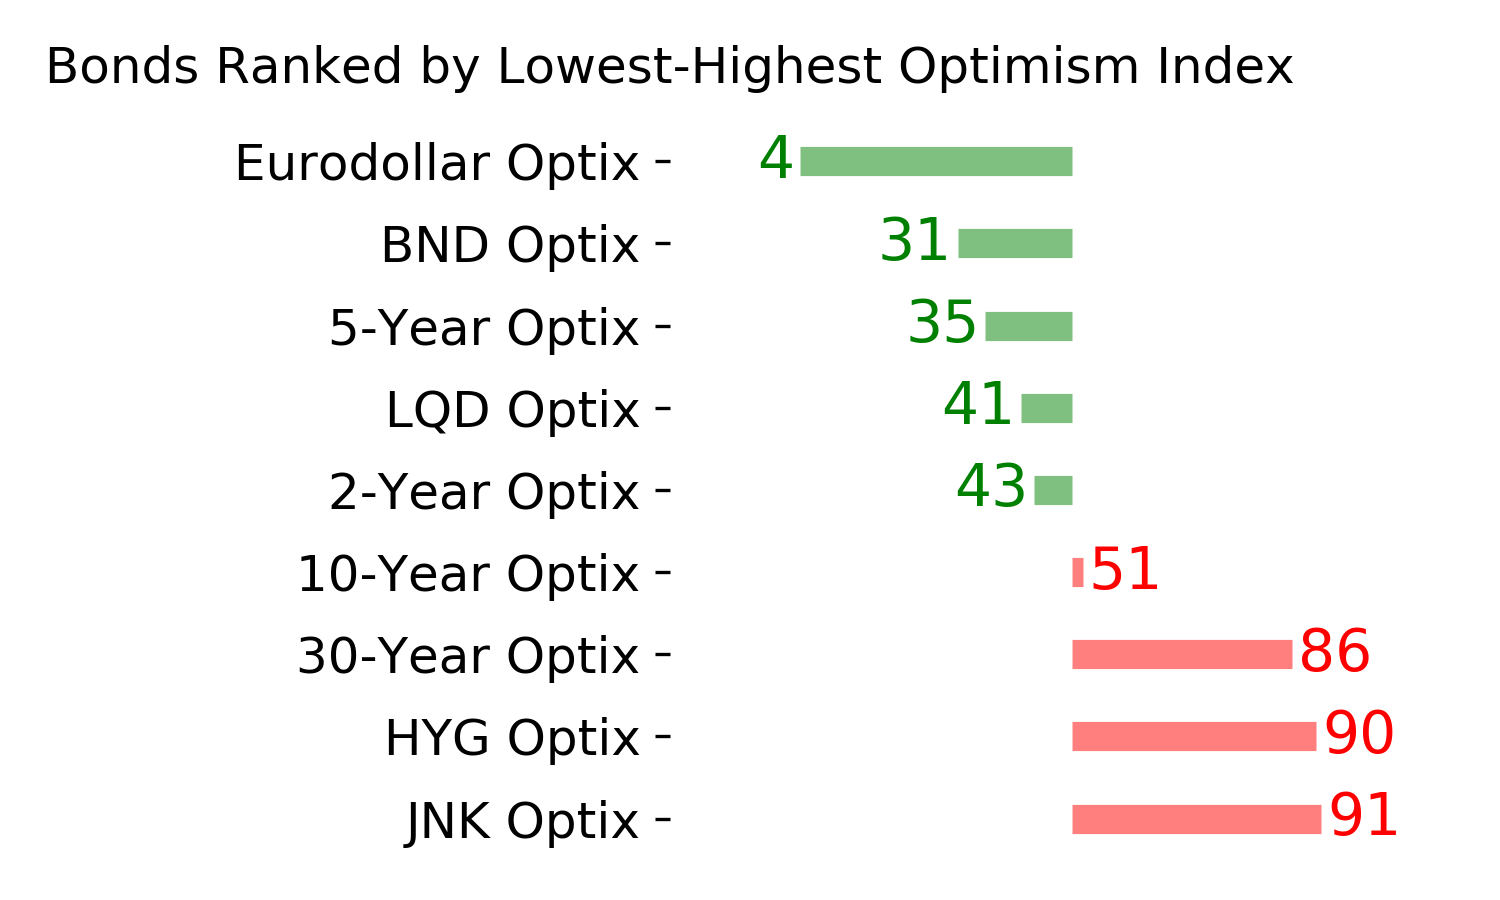
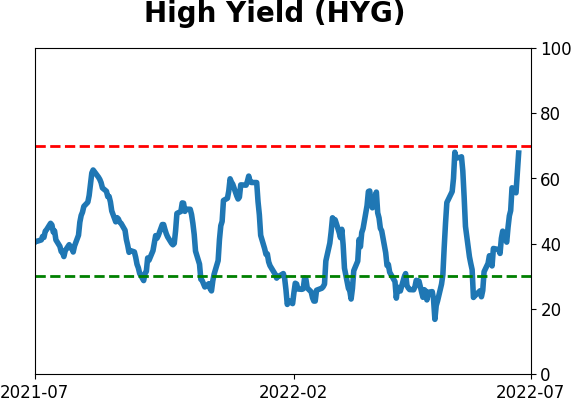
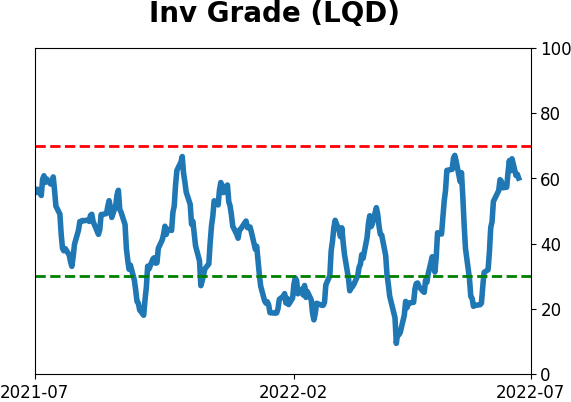
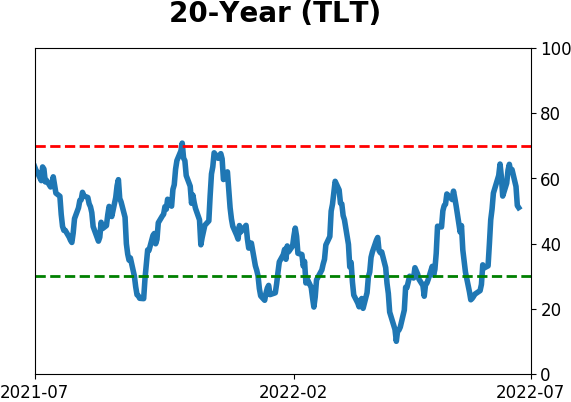
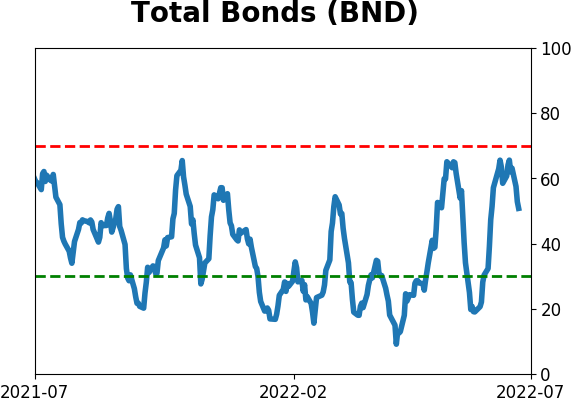
Bond ETF's - 10-Day Moving Average
|
|
|
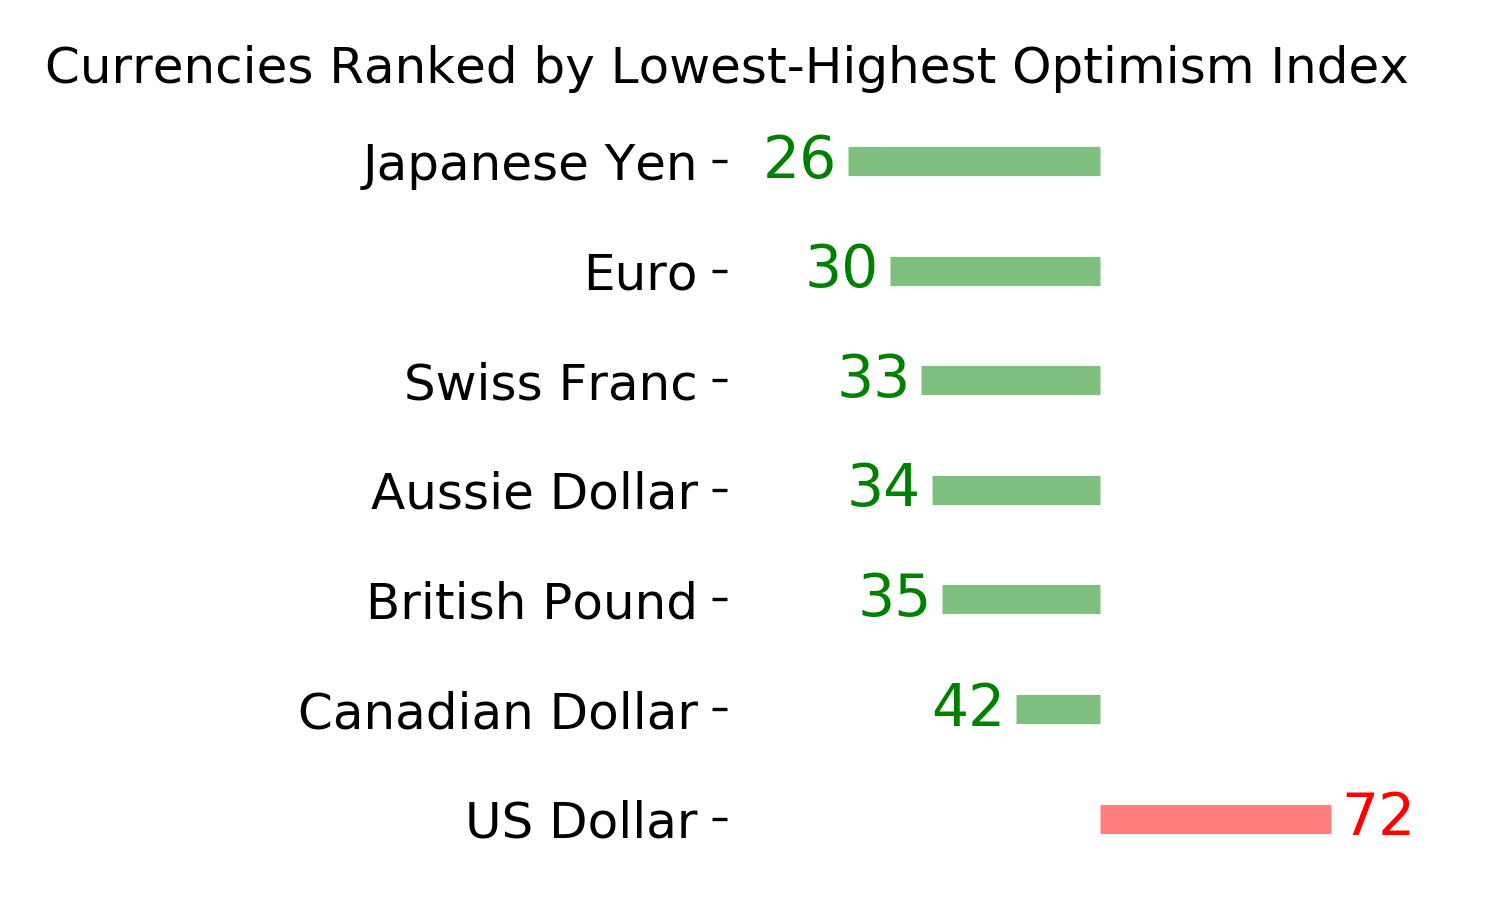
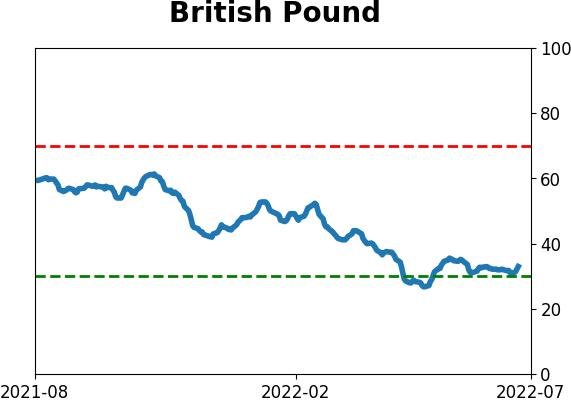
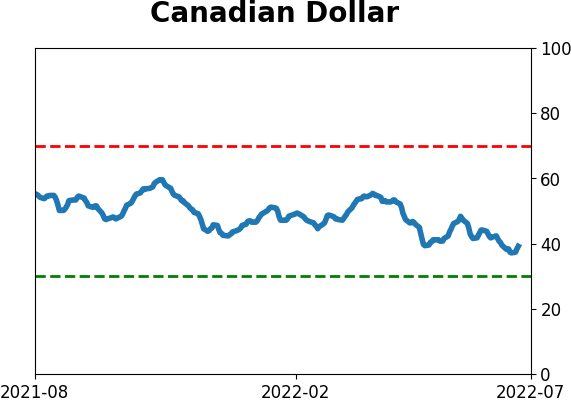
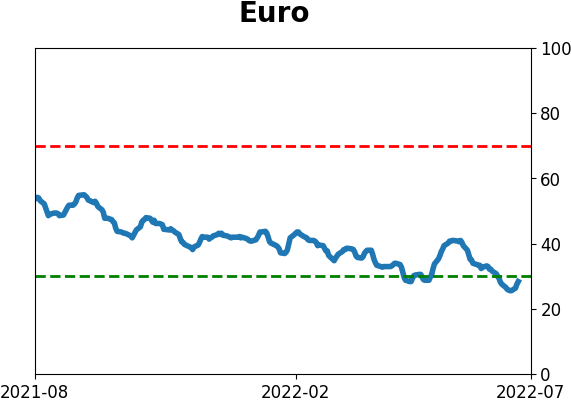
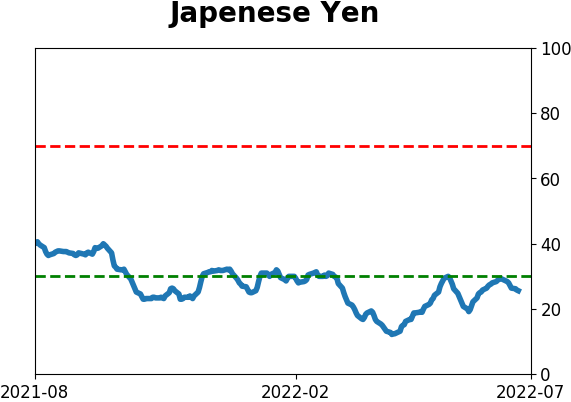
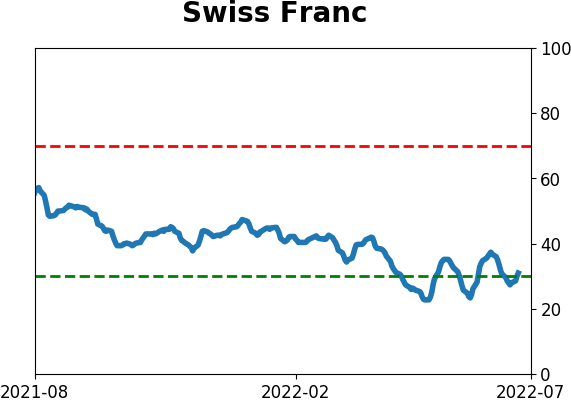
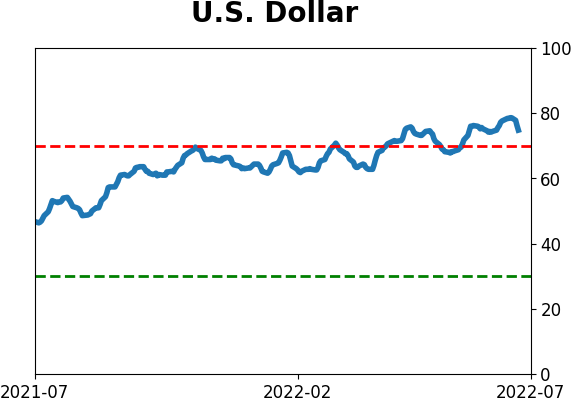
Currency ETF's - 5-Day Moving Average
|
|
|
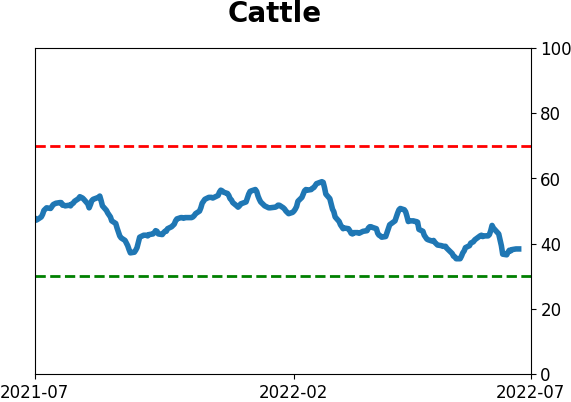
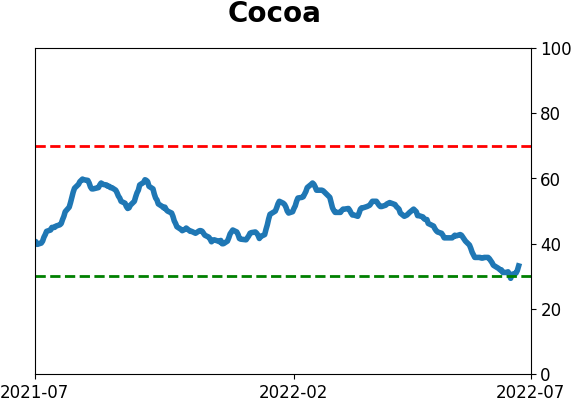
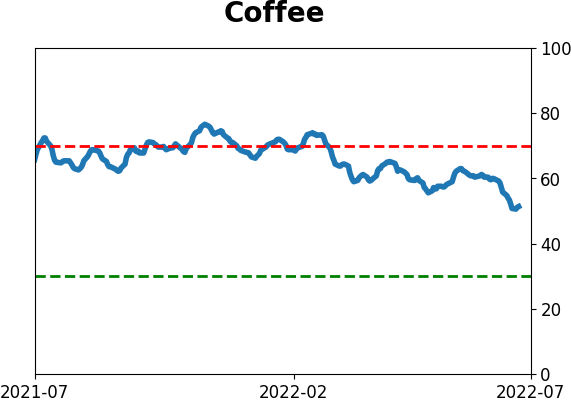
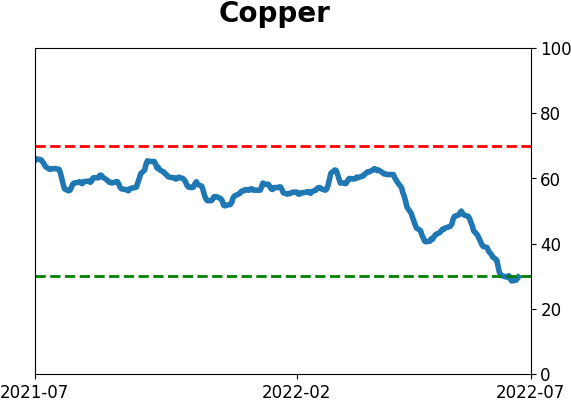
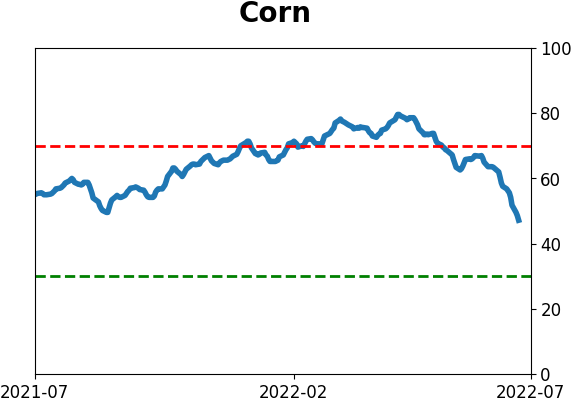
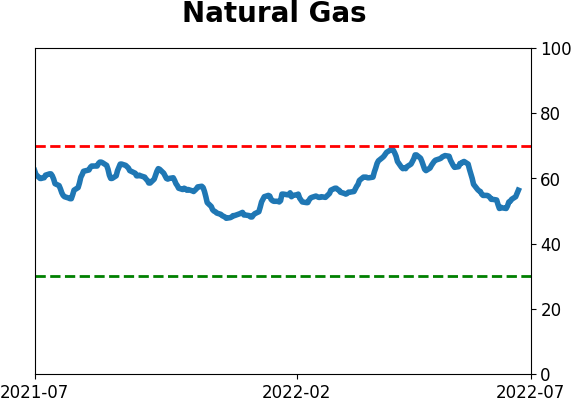
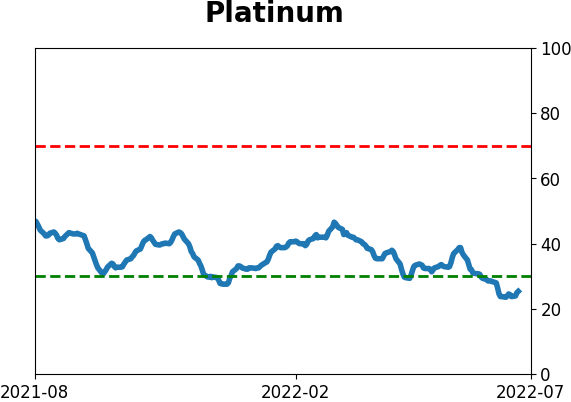
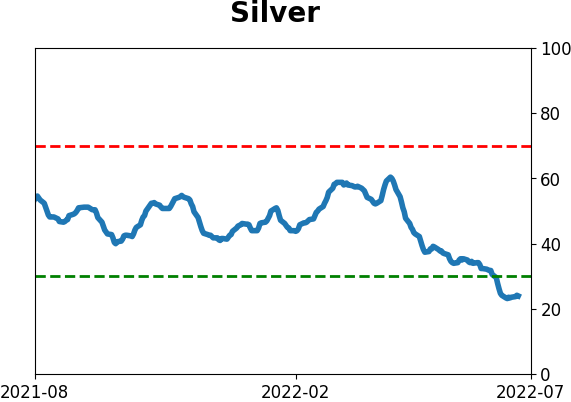
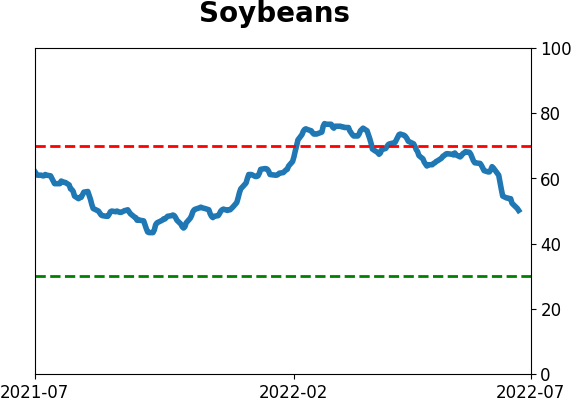
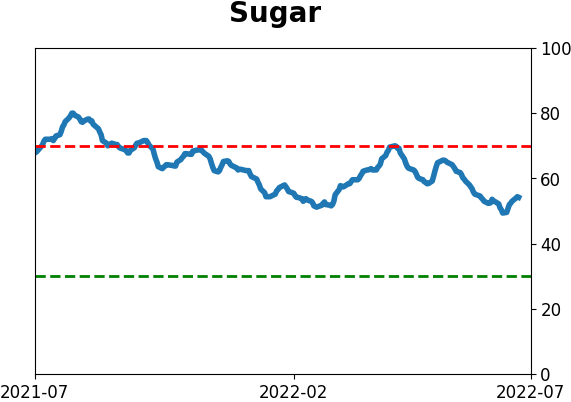
Commodity ETF's - 5-Day Moving Average
|
|