Headlines
|
|
Sentiment is the opposite of sour:
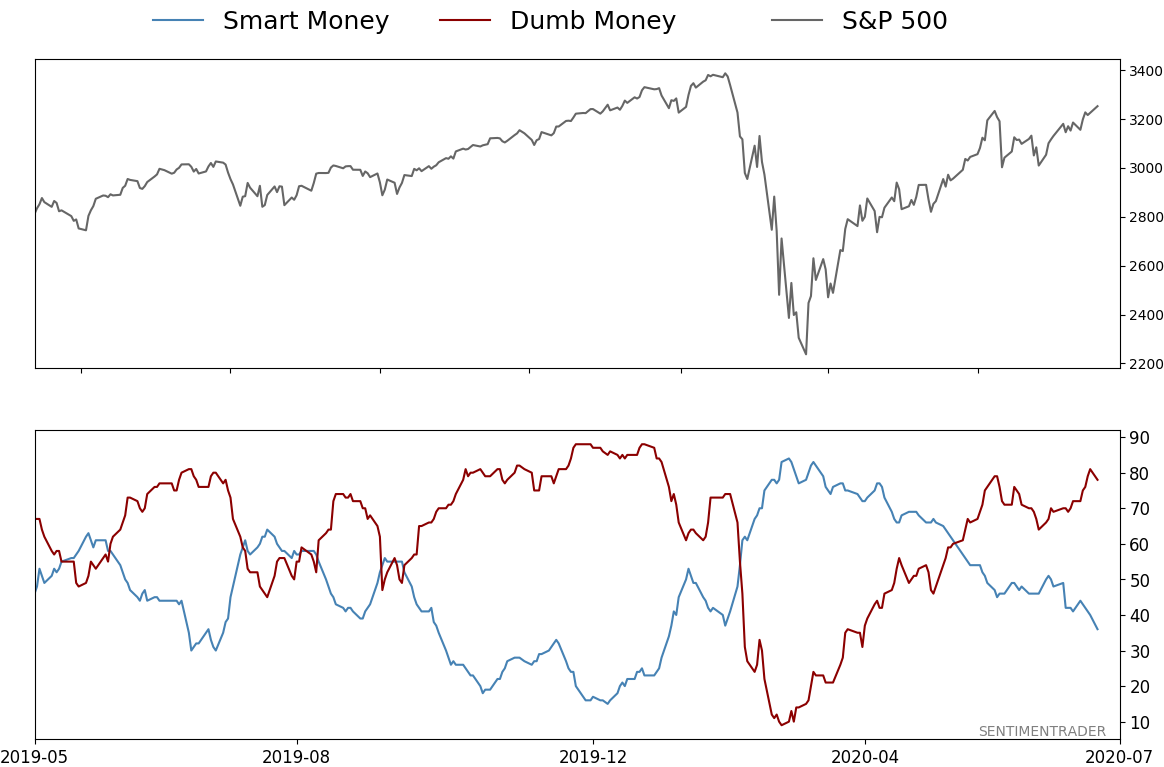
Dumb Money Confidence has spiked and is above 80% for the first time since January. Most of the time when optimism gets this high, any further short-term gains get erased during subsequent pullbacks. This is one of worst spreads ever at this point of the year, which has a poor seasonal window.
Seasonality has soured:
Stocks are now entering one of their worst seasonal stretches, with seasonal peaks in the S&P 500 and Nasdaq 100 occurring now. This is one of the few times of the year when the S&P 500's rolling two-month forward return has averaged worse than -1% since 1999.
Bottom Line:
|
Smart / Dumb Money Confidence
|
Smart Money Confidence: 36%
Dumb Money Confidence: 78%
|
|
Risk Levels
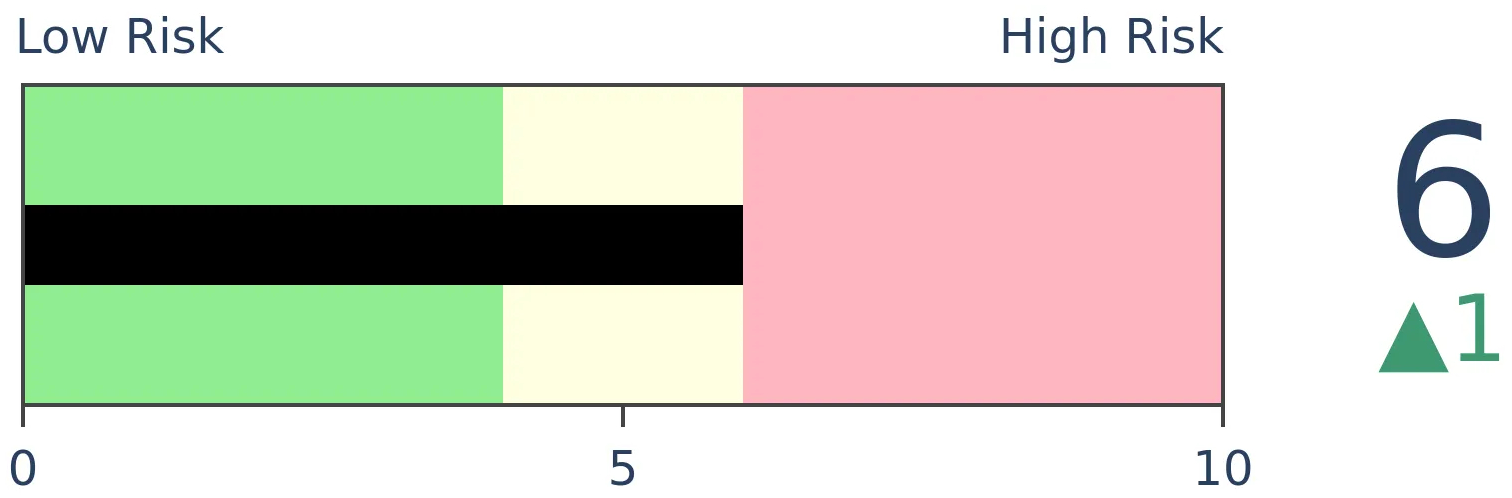
Stocks Short-Term
|
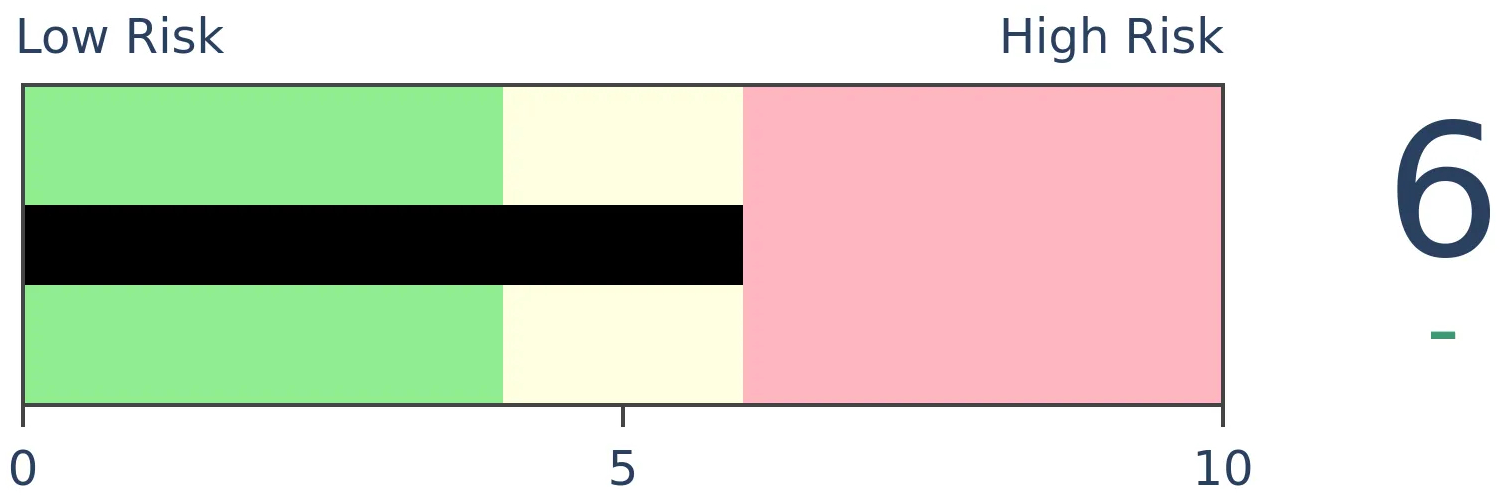
Stocks Medium-Term
|
|
Bonds
|
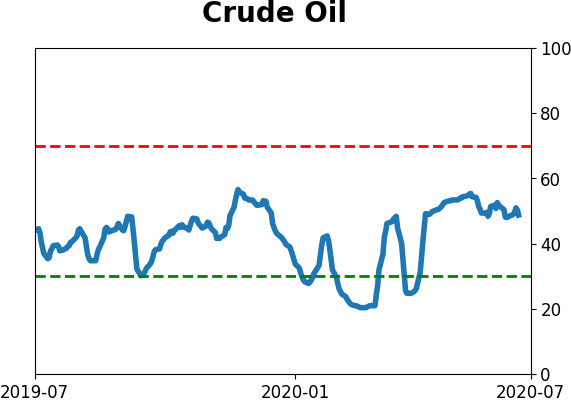
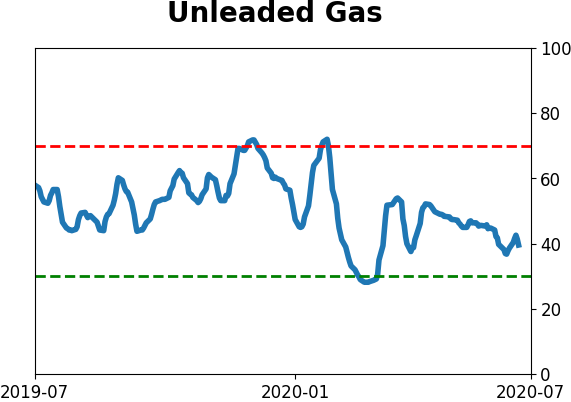
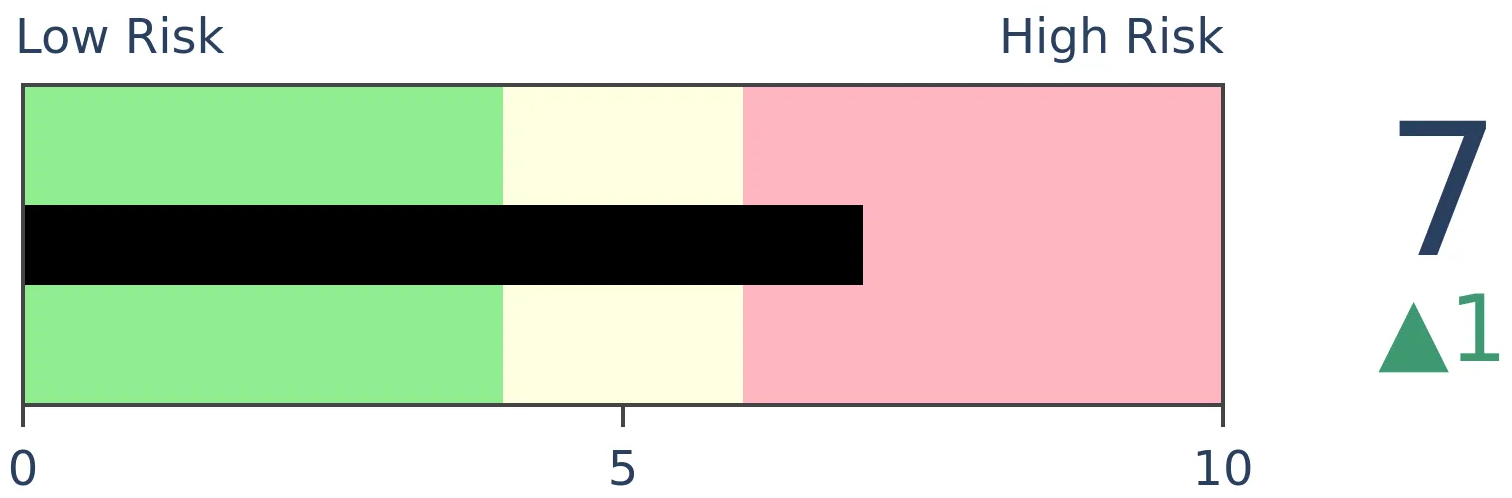
Crude Oil

|
|
Gold
|
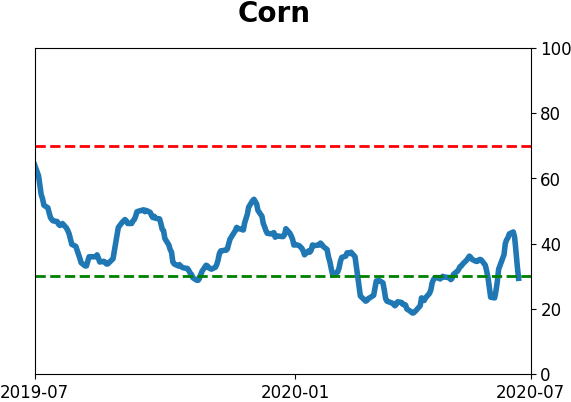
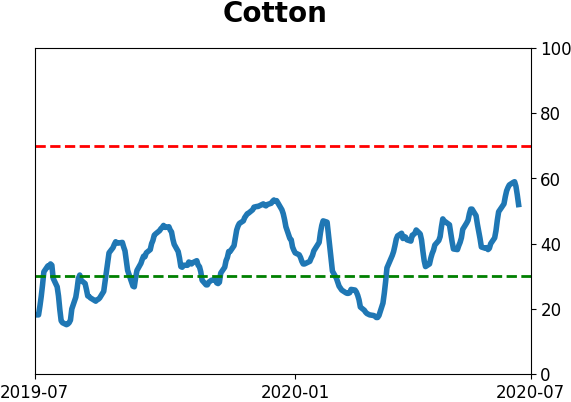
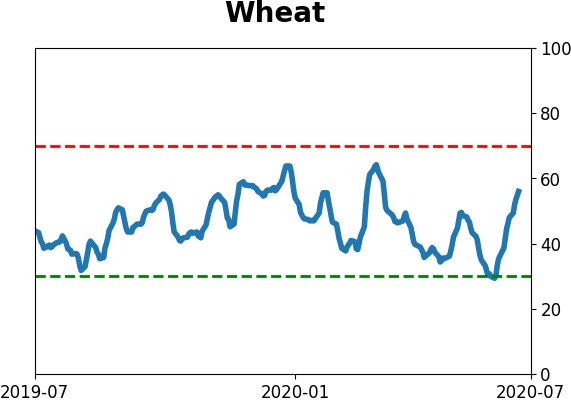
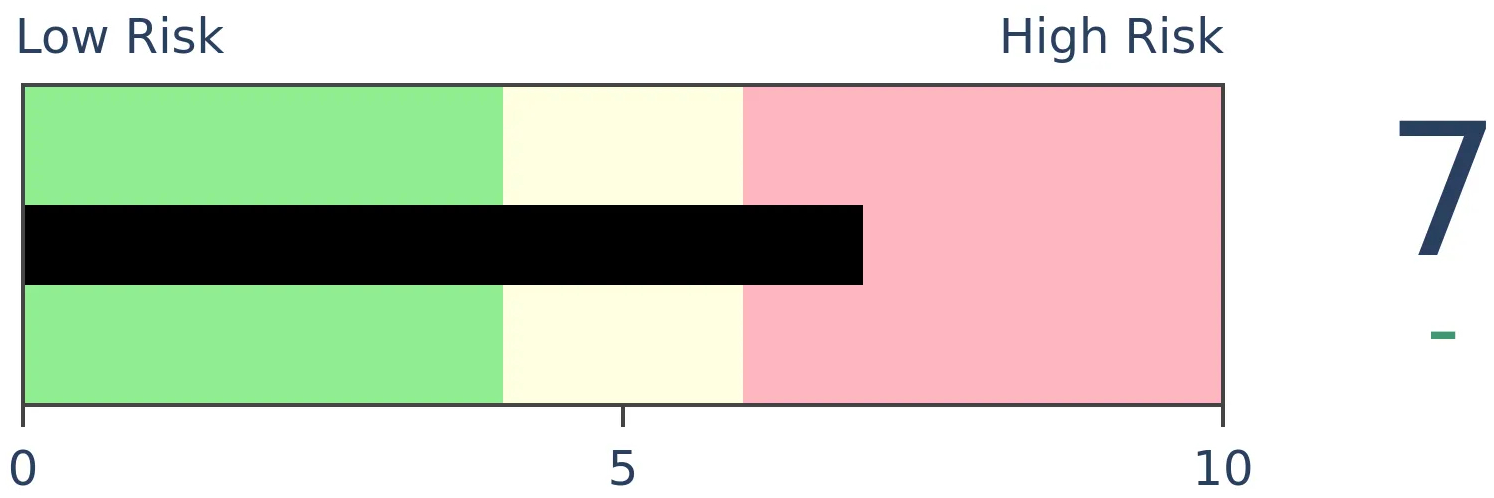
Agriculture

|
|
Research
BOTTOM LINE
Dumb Money Confidence has spiked and is above 80% for the first time since January. Most of the time when optimism gets this high, any further short-term gains get erased during subsequent pullbacks. This is one of worst spreads ever at this point of the year, which has a poor seasonal window.
FORECAST / TIMEFRAME
SPY -- Down, Medium-Term
|
Earlier, we saw that since 1999, two-month forward returns in the S&P 500 have been poor beginning in mid- to late July.
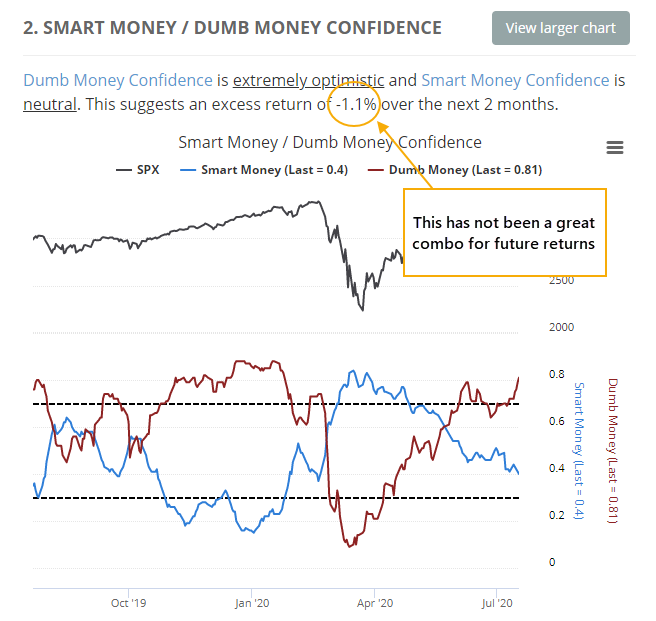
The reason we're using two-month returns since 1999 is because we can see from the Dashboard that Dumb Money Confidence is very high, and when we've seen this kind of sentiment since the models' inception in 1999, forward returns were well below average.
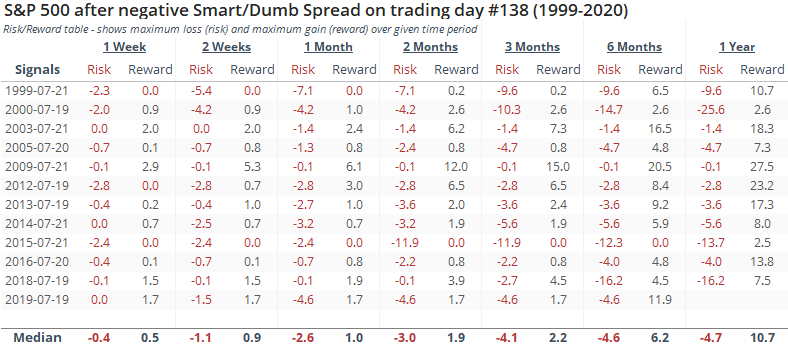
The table below shows us the years with the worst spread between Smart Money and Dumb Money Confidence on trading day #138.
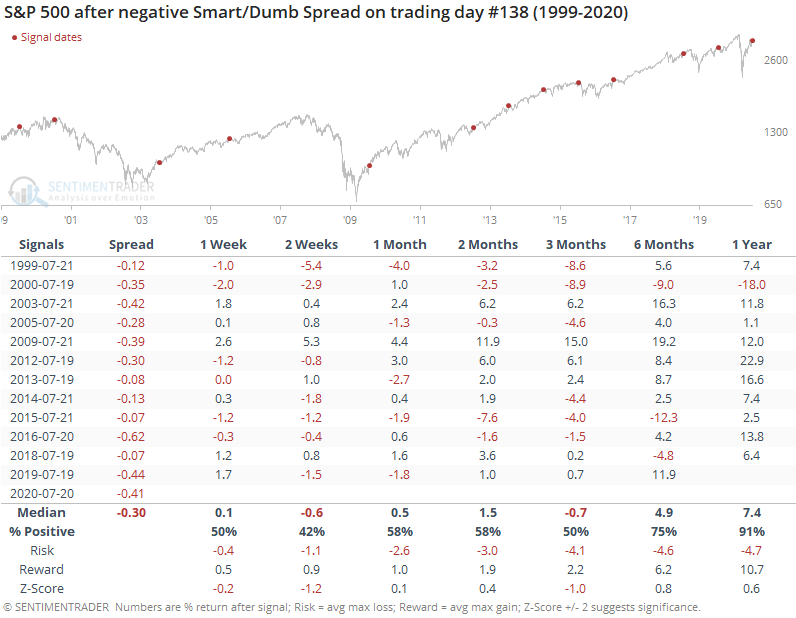
Returns weren't terrible, mostly due to 2003 and 2009 when sentiment initially rebounded following protracted bear markets. Given the severity of the pandemic decline this year, perhaps those two dates are appropriate precedents, especially given the breadth thrusts, recoveries, and trend changes we spent so much time covering during the spring.
Other dates showed the impact of high optimism combined with poor seasonality. Even including 2003 and 2009, the risk/reward ratio was poor up to three months later.
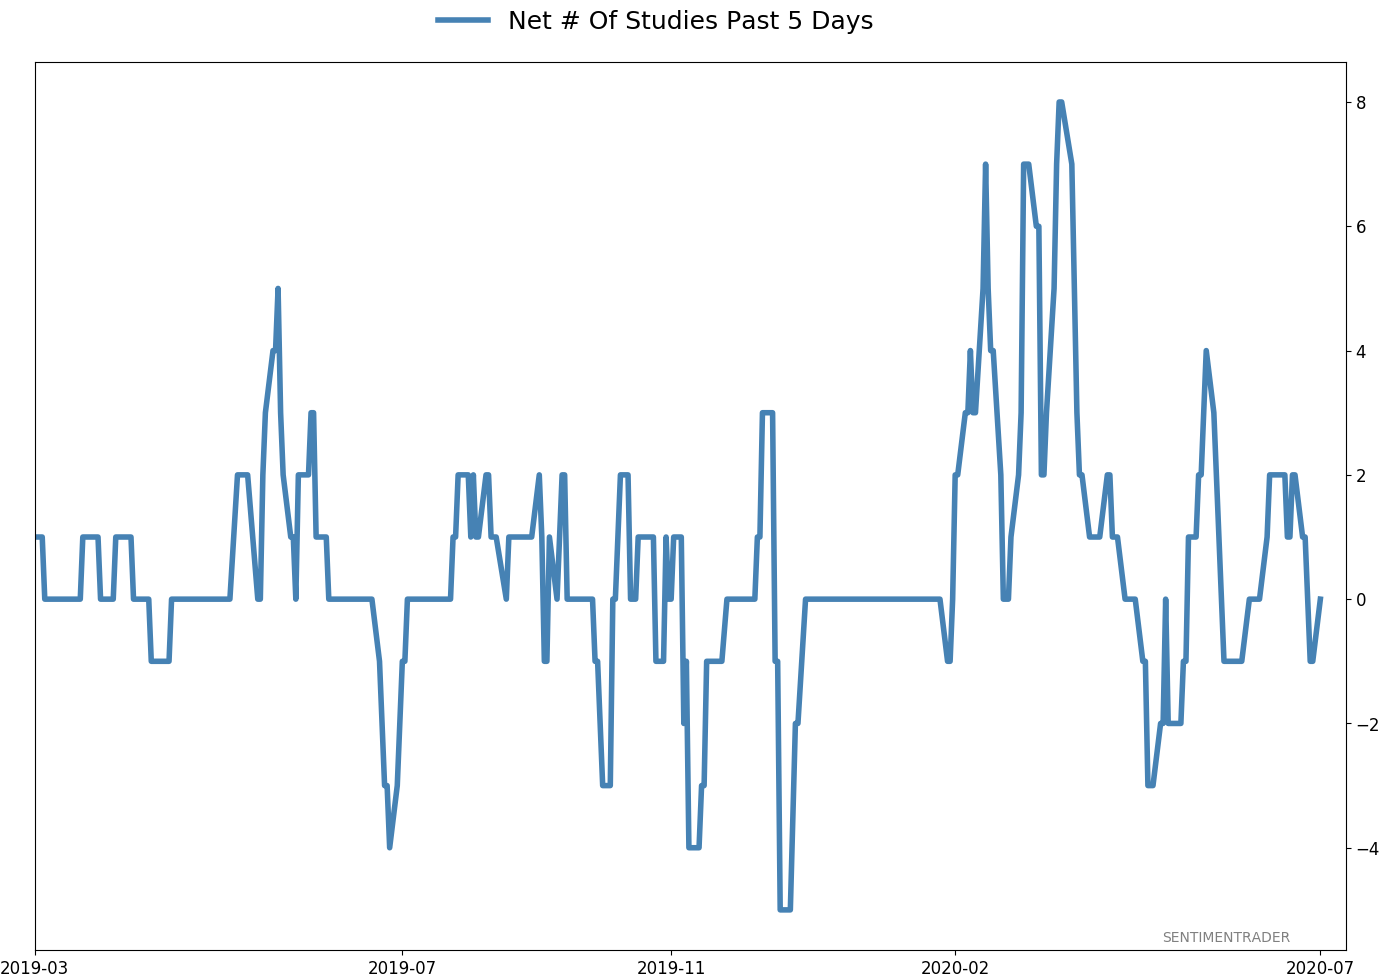
According to the Backtest Engine, over the past five years when Dumb Money Confidence alone rose above 80%, which it did on Friday, shorter-term gains were mostly unsustainable.
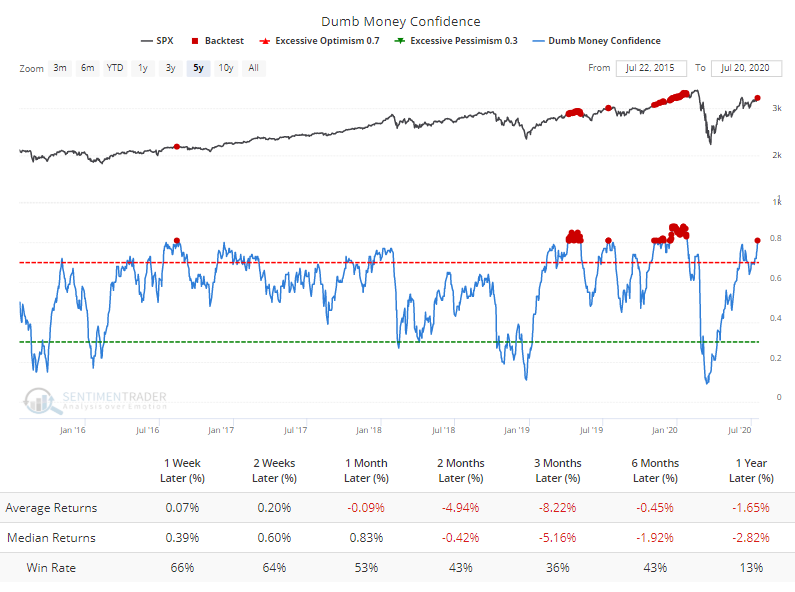
This highlights what has been the case since late May / early June. The types of behavior we've seen among investors on shorter time frames have consistently led to a poor risk/reward in stocks over short- to medium-term time frames, while the longer-term has been neutral to positive. The fact that we're seeing these readings now, as we head into a consistently poor seasonal window, adds to the headwinds.
BOTTOM LINE
Stocks are now entering one of their worst seasonal stretches, with seasonal peaks in the S&P 500 and Nasdaq 100 occurring now. This is one of the few times of the year when the S&P 500's rolling two-month forward return has averaged worse than -1% since 1999.
FORECAST / TIMEFRAME
SPY -- Down, Medium-Term
|
According to Morgan Stanley (via the WSJ), stocks are about to enter a seasonally rough stretch.
Indeed we are, based on seasonal calendar returns for the S&P 500. Seasonality in stocks is a tertiary factor even at its best and carries very little weight. It's still a headwind, though.
It's even worse for indexes like the Nasdaq 100, whose component stocks have helped to drive this rally. The NDX's seasonal peak is right now.
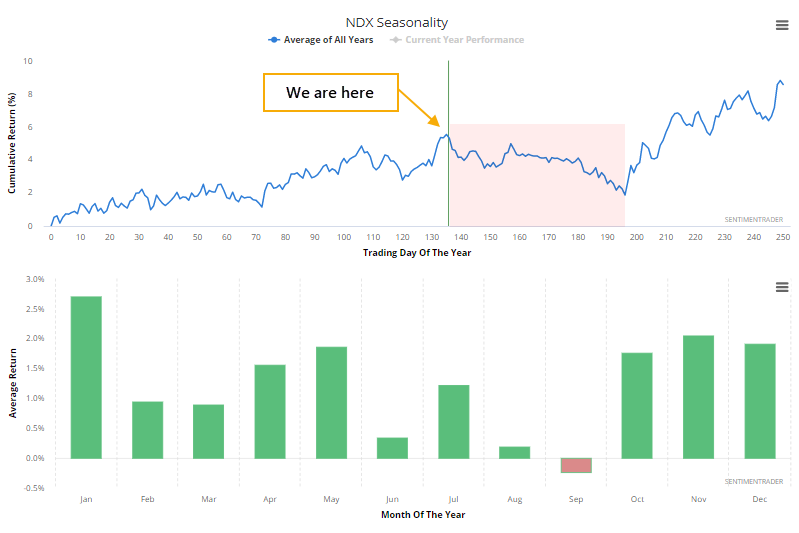
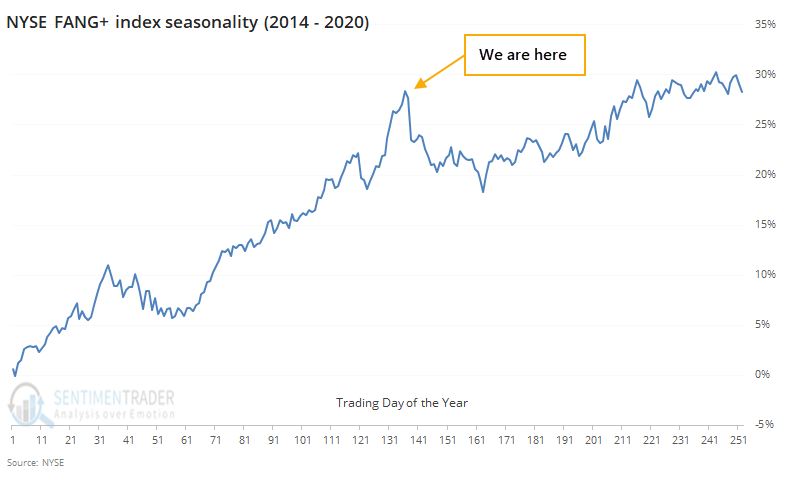
When focusing on just the main drivers, which are primarily the FANG stocks, we can see from the abbreviated history of the NYSE FANG+ index that even during the powerful trend over the past five or so years, those stocks have tended to take a breather right about now.
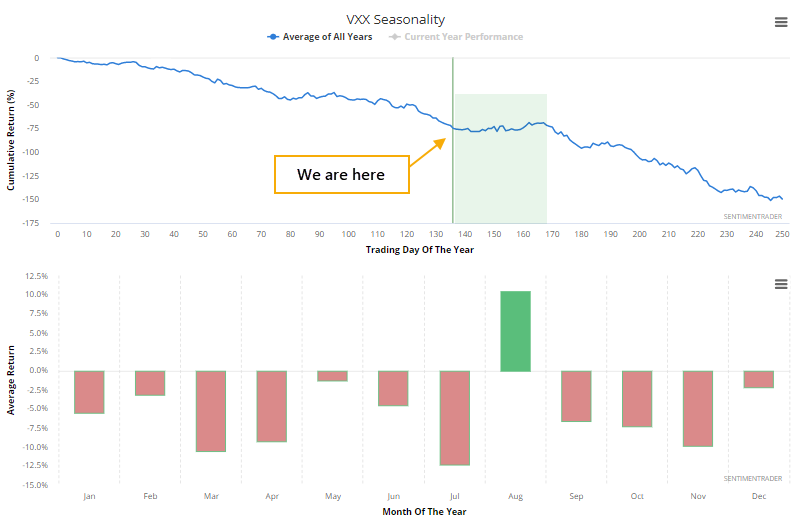
It's the same pattern if we look at ETFs for other indexes like DIA and IWM. Because riskier assets like stocks have stumbled right about now, funds like VXX have rallied, even though its long-term trend is almost relentlessly negative.
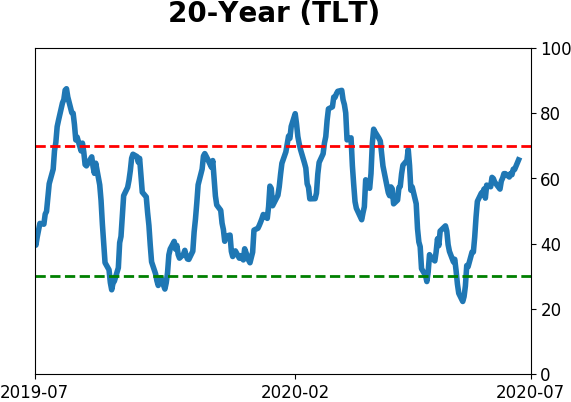
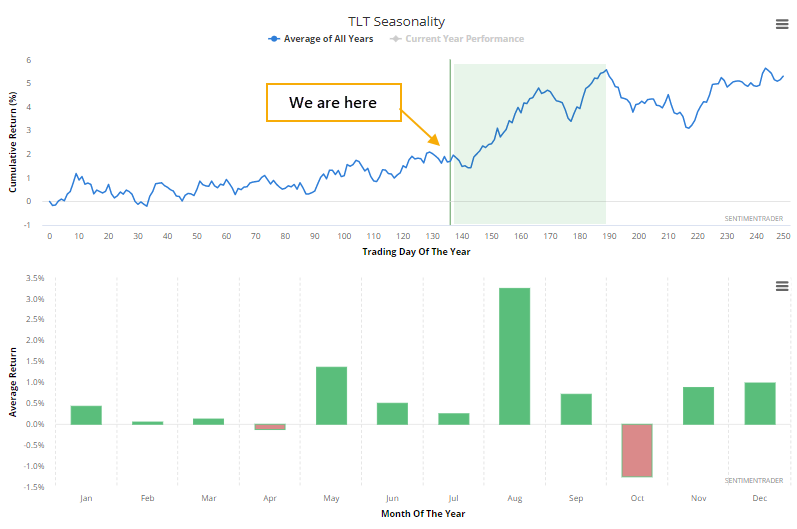
While there are some negatives right now for bonds, the summer seasonal swoon in stocks proved to usually be a tailwind for TLT.
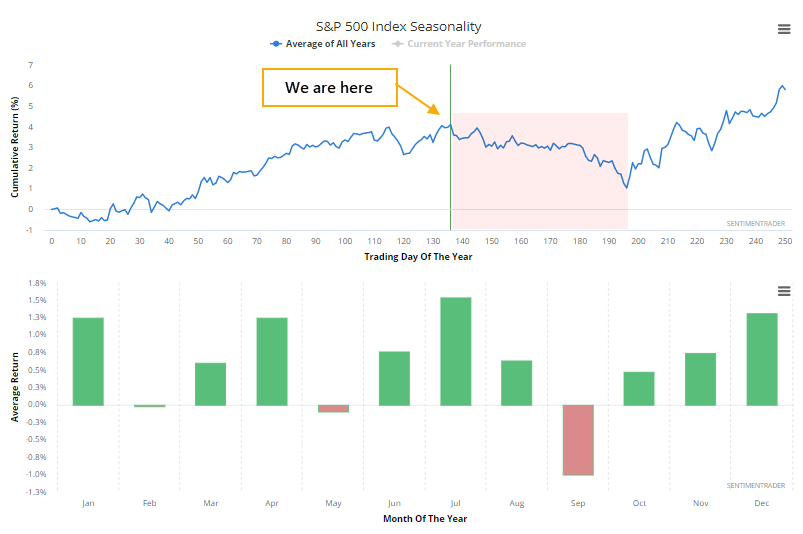
If we use the Morgan Stanley methodology to look at the S&P 500's forward rolling 2-month returns since 1999, then we can see a similar pattern, with the biggest dip occurring right about now.
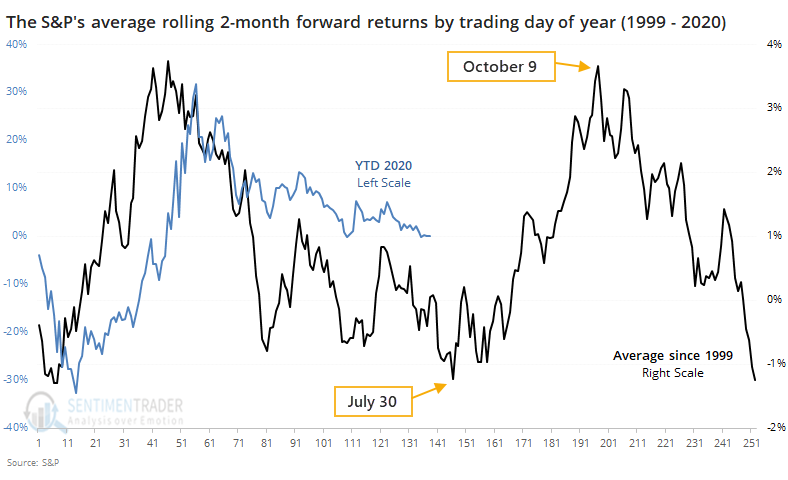
What the black line on the chart shows us is the S&P's average two-month return over the next two months for every trading day of the year. We're at trading day #138 as of Monday, with late July being one of the very few windows where the S&P's average forward return is more than -1%. Contrast that to early October, when its average two-month return has been more than +3.5%.
Seasonality in stocks is a tertiary consideration at best, so we wouldn't weight this heavily. Still, it's a minor headwind as we head into the late summer.
Active Studies
| Time Frame | Bullish | Bearish | | Short-Term | 0 | 0 | | Medium-Term | 8 | 9 | | Long-Term | 44 | 1 |
|
Indicators at Extremes
Portfolio
| Position | Weight % | Added / Reduced | Date | | Stocks | 29.8 | Reduced 9.1% | 2020-06-11 | | Bonds | 0.0 | Reduced 6.7% | 2020-02-28 | | Commodities | 5.2 | Added 2.4%
| 2020-02-28 | | Precious Metals | 0.0 | Reduced 3.6% | 2020-02-28 | | Special Situations | 0.0 | Reduced 31.9% | 2020-03-17 | | Cash | 65.0 | | |
|
Updates (Changes made today are underlined)
In the first months of the year, we saw manic trading activity. From big jumps in specific stocks to historic highs in retail trading activity to record highs in household confidence to almost unbelievable confidence among options traders. All of that came amid a market where the average stock couldn't keep up with their indexes. There were signs of waning momentum in stocks underlying the major averages, which started triggering technical warning signs in late January. After stocks bottomed on the 23rd, they enjoyed a historic buying thrust and retraced a larger amount of the decline than "just a bear market rally" tends to. Those thrusts are the most encouraging sign we've seen in years. Through early June, we were still seeing thrusts that have led to recoveries in longer-term breadth metrics. The longer-term prospects for stocks (6-12 months) still look decent given the above. On a short- to medium-term basis, it was getting harder to make that case. Dumb Money Confidence spiked and there were multiple signs of a historic level of speculation. This is likely the lowest I will go given what I still consider to be compelling positives over a longer time frame. There is not a slam-dunk case to be made for either direction, so it will seem like a mistake whether stocks keep dropping (why didn't I sell more?) or if they turn and head higher (why did I let short-term concerns prevail?). After nearly three decades of trading, I've learned to let go of the idea of perfection.
RETURN YTD: -4.2% 2019: 12.6%, 2018: 0.6%, 2017: 3.8%, 2016: 17.1%, 2015: 9.2%, 2014: 14.5%, 2013: 2.2%, 2012: 10.8%, 2011: 16.5%, 2010: 15.3%, 2009: 23.9%, 2008: 16.2%, 2007: 7.8%
|
|
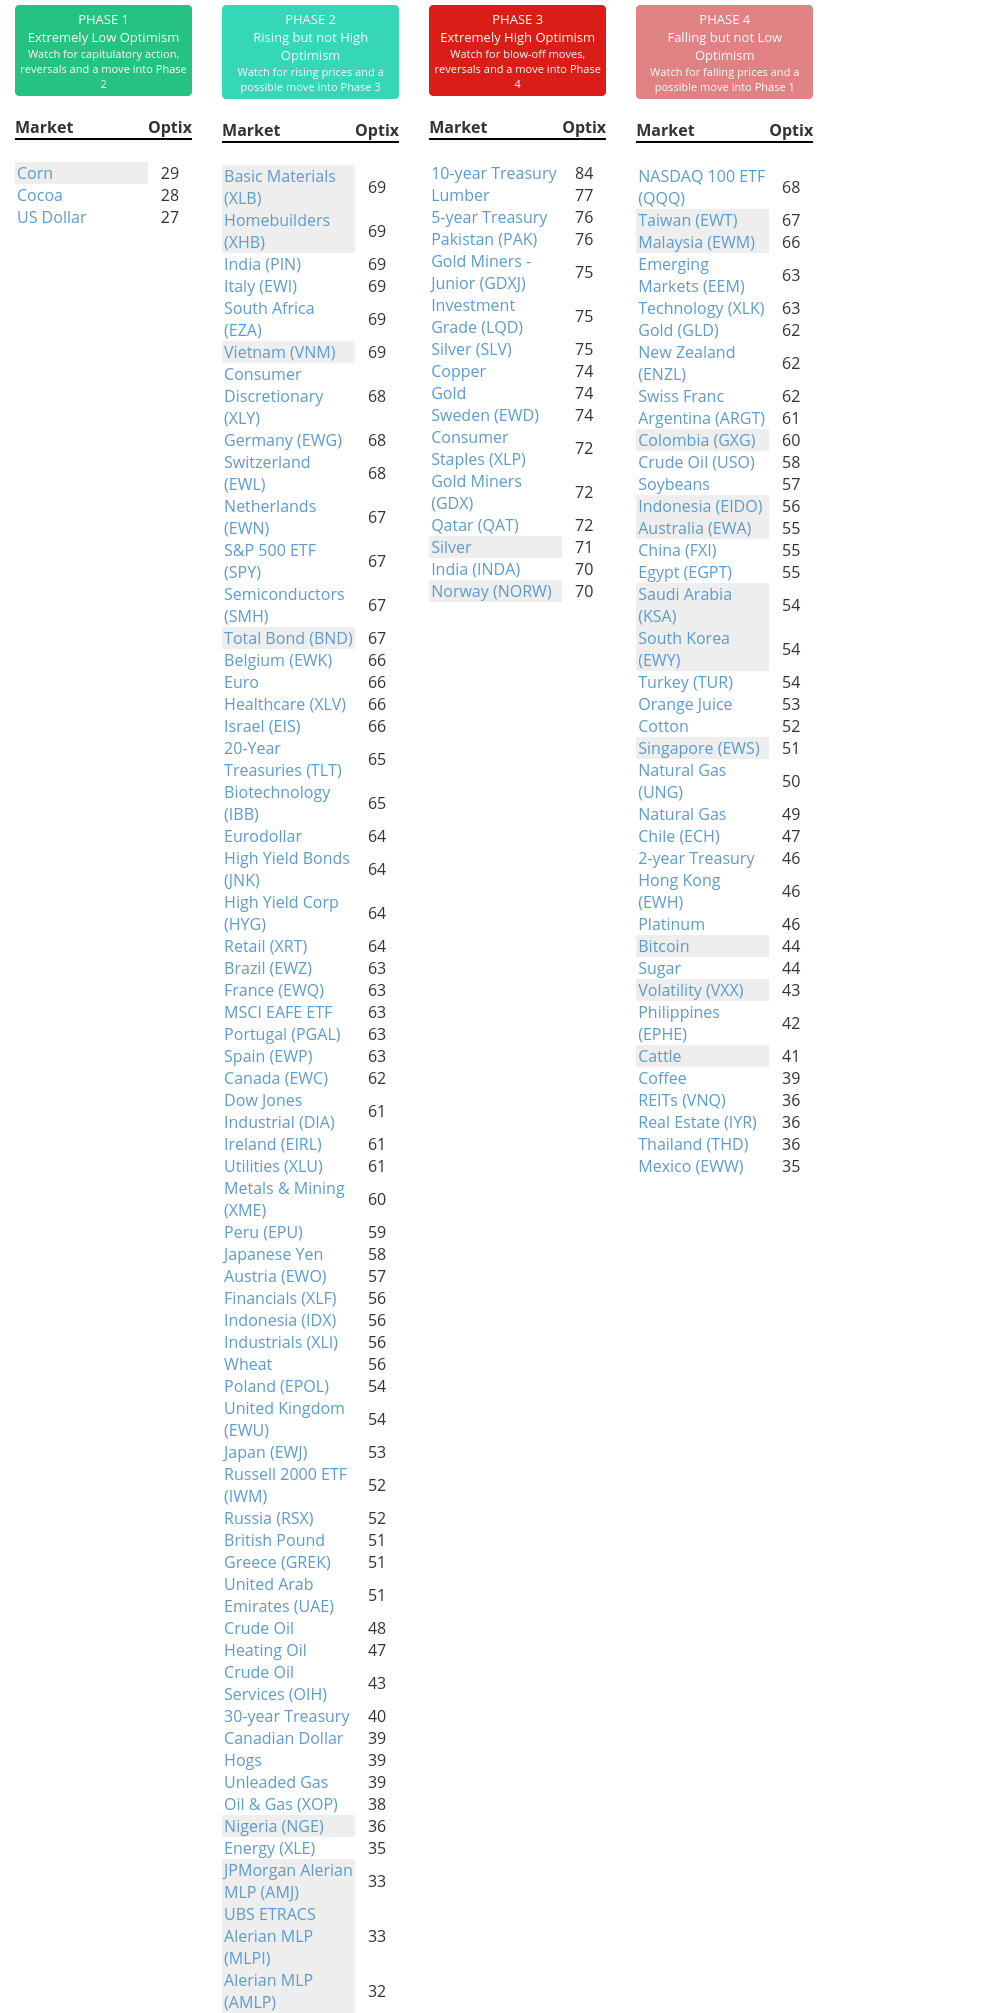
Phase Table
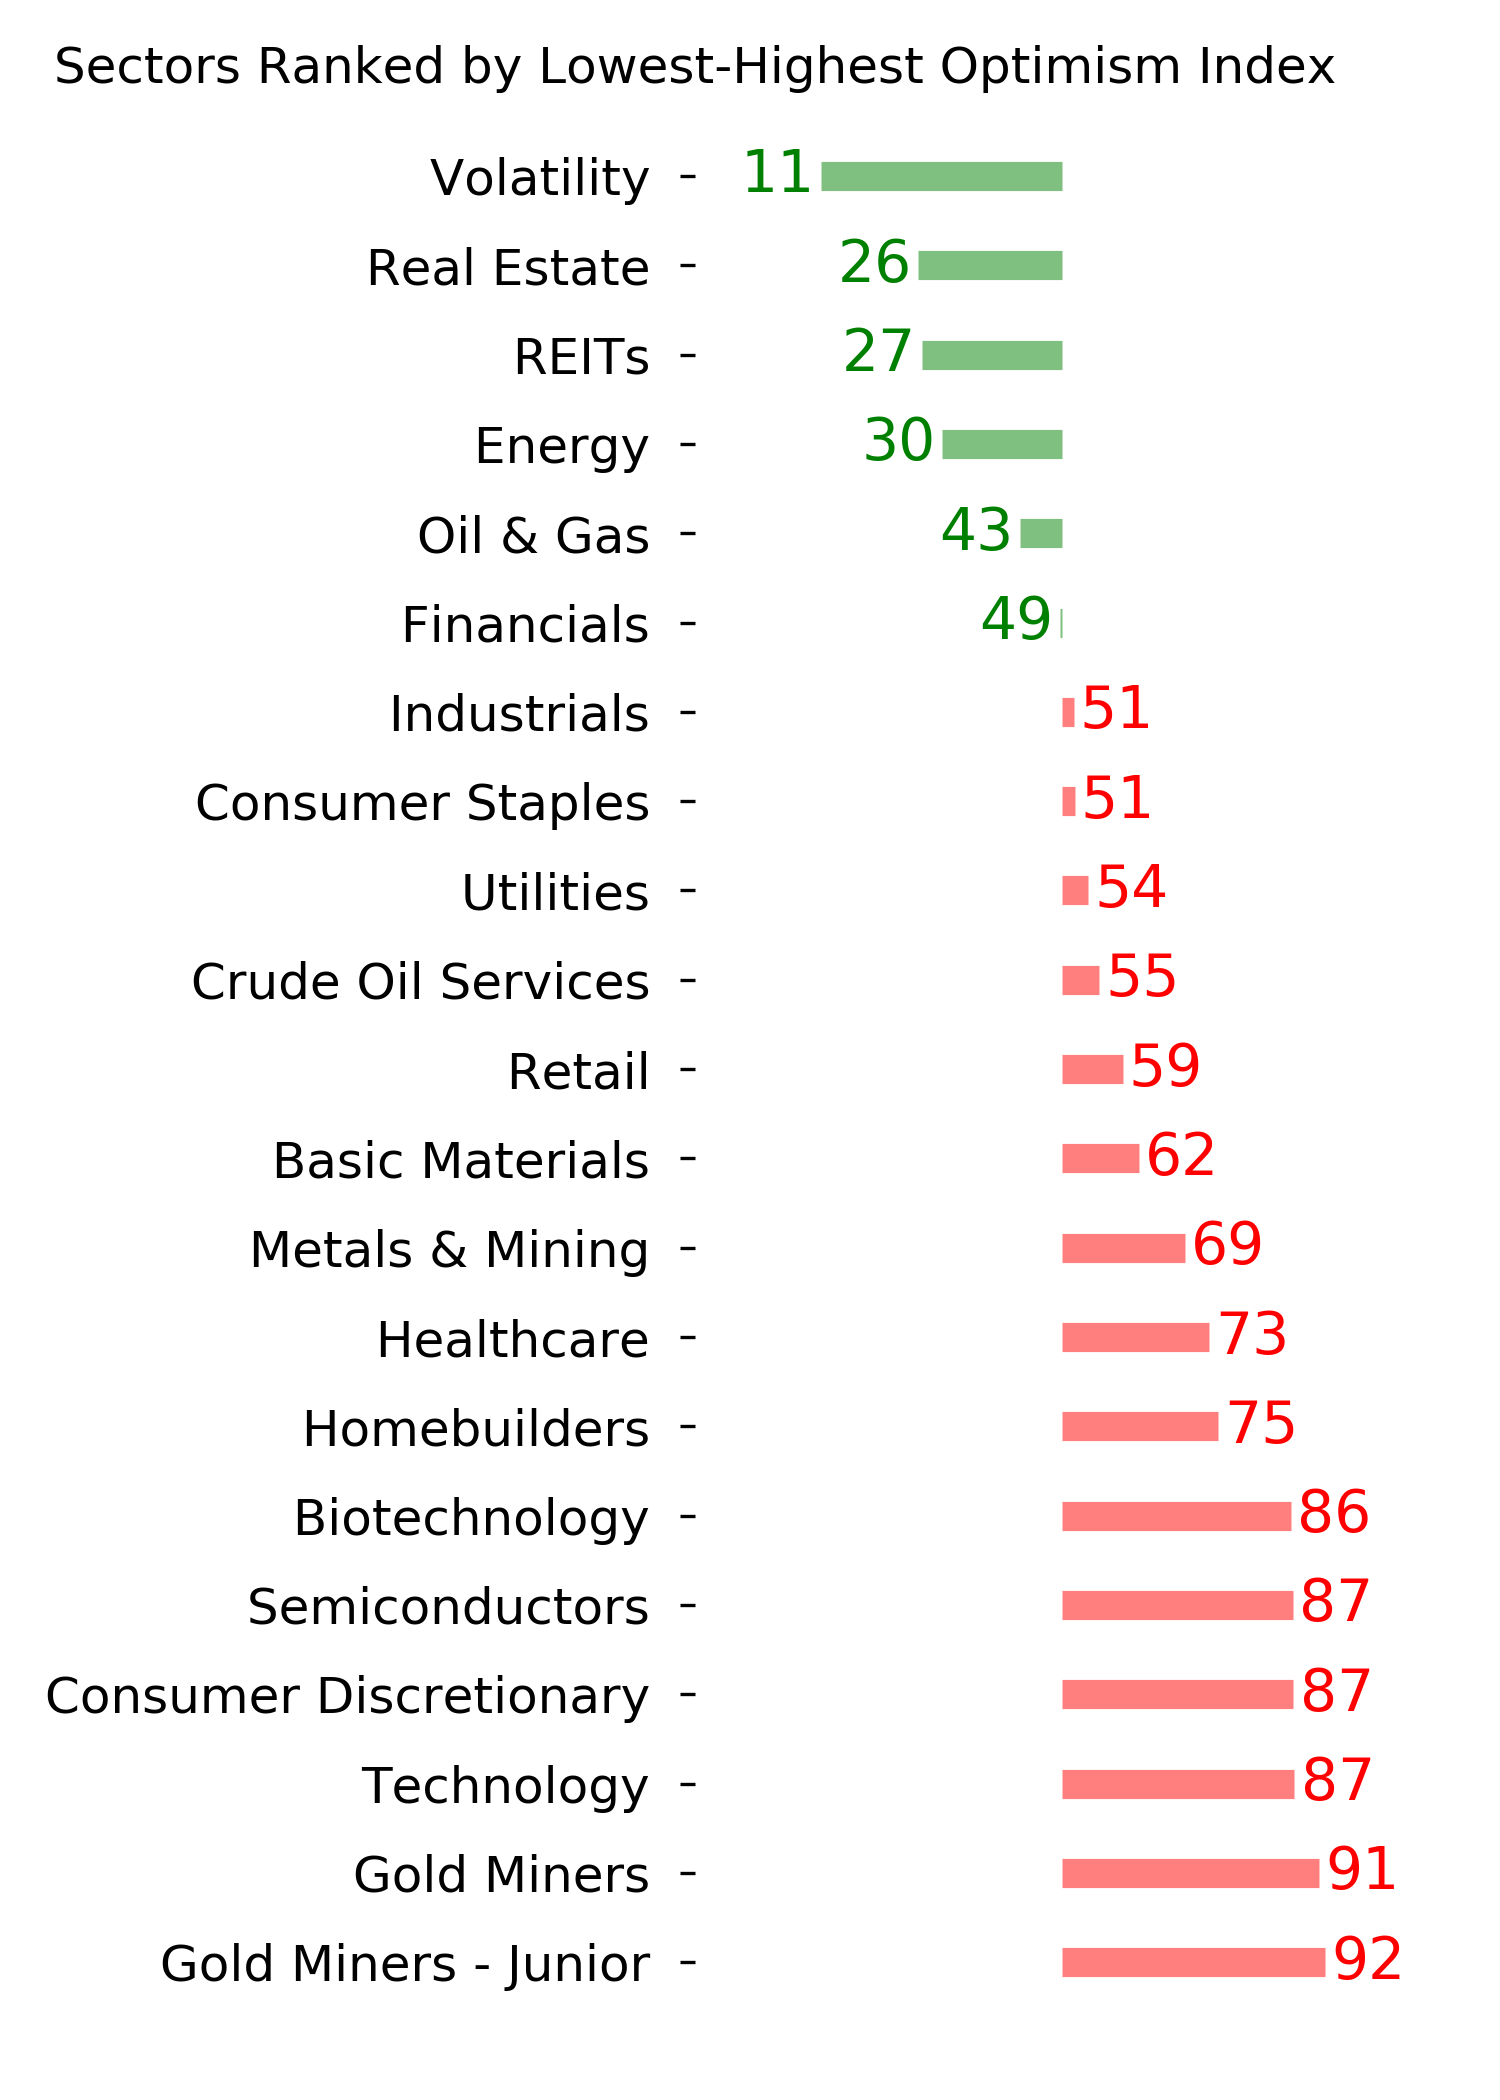
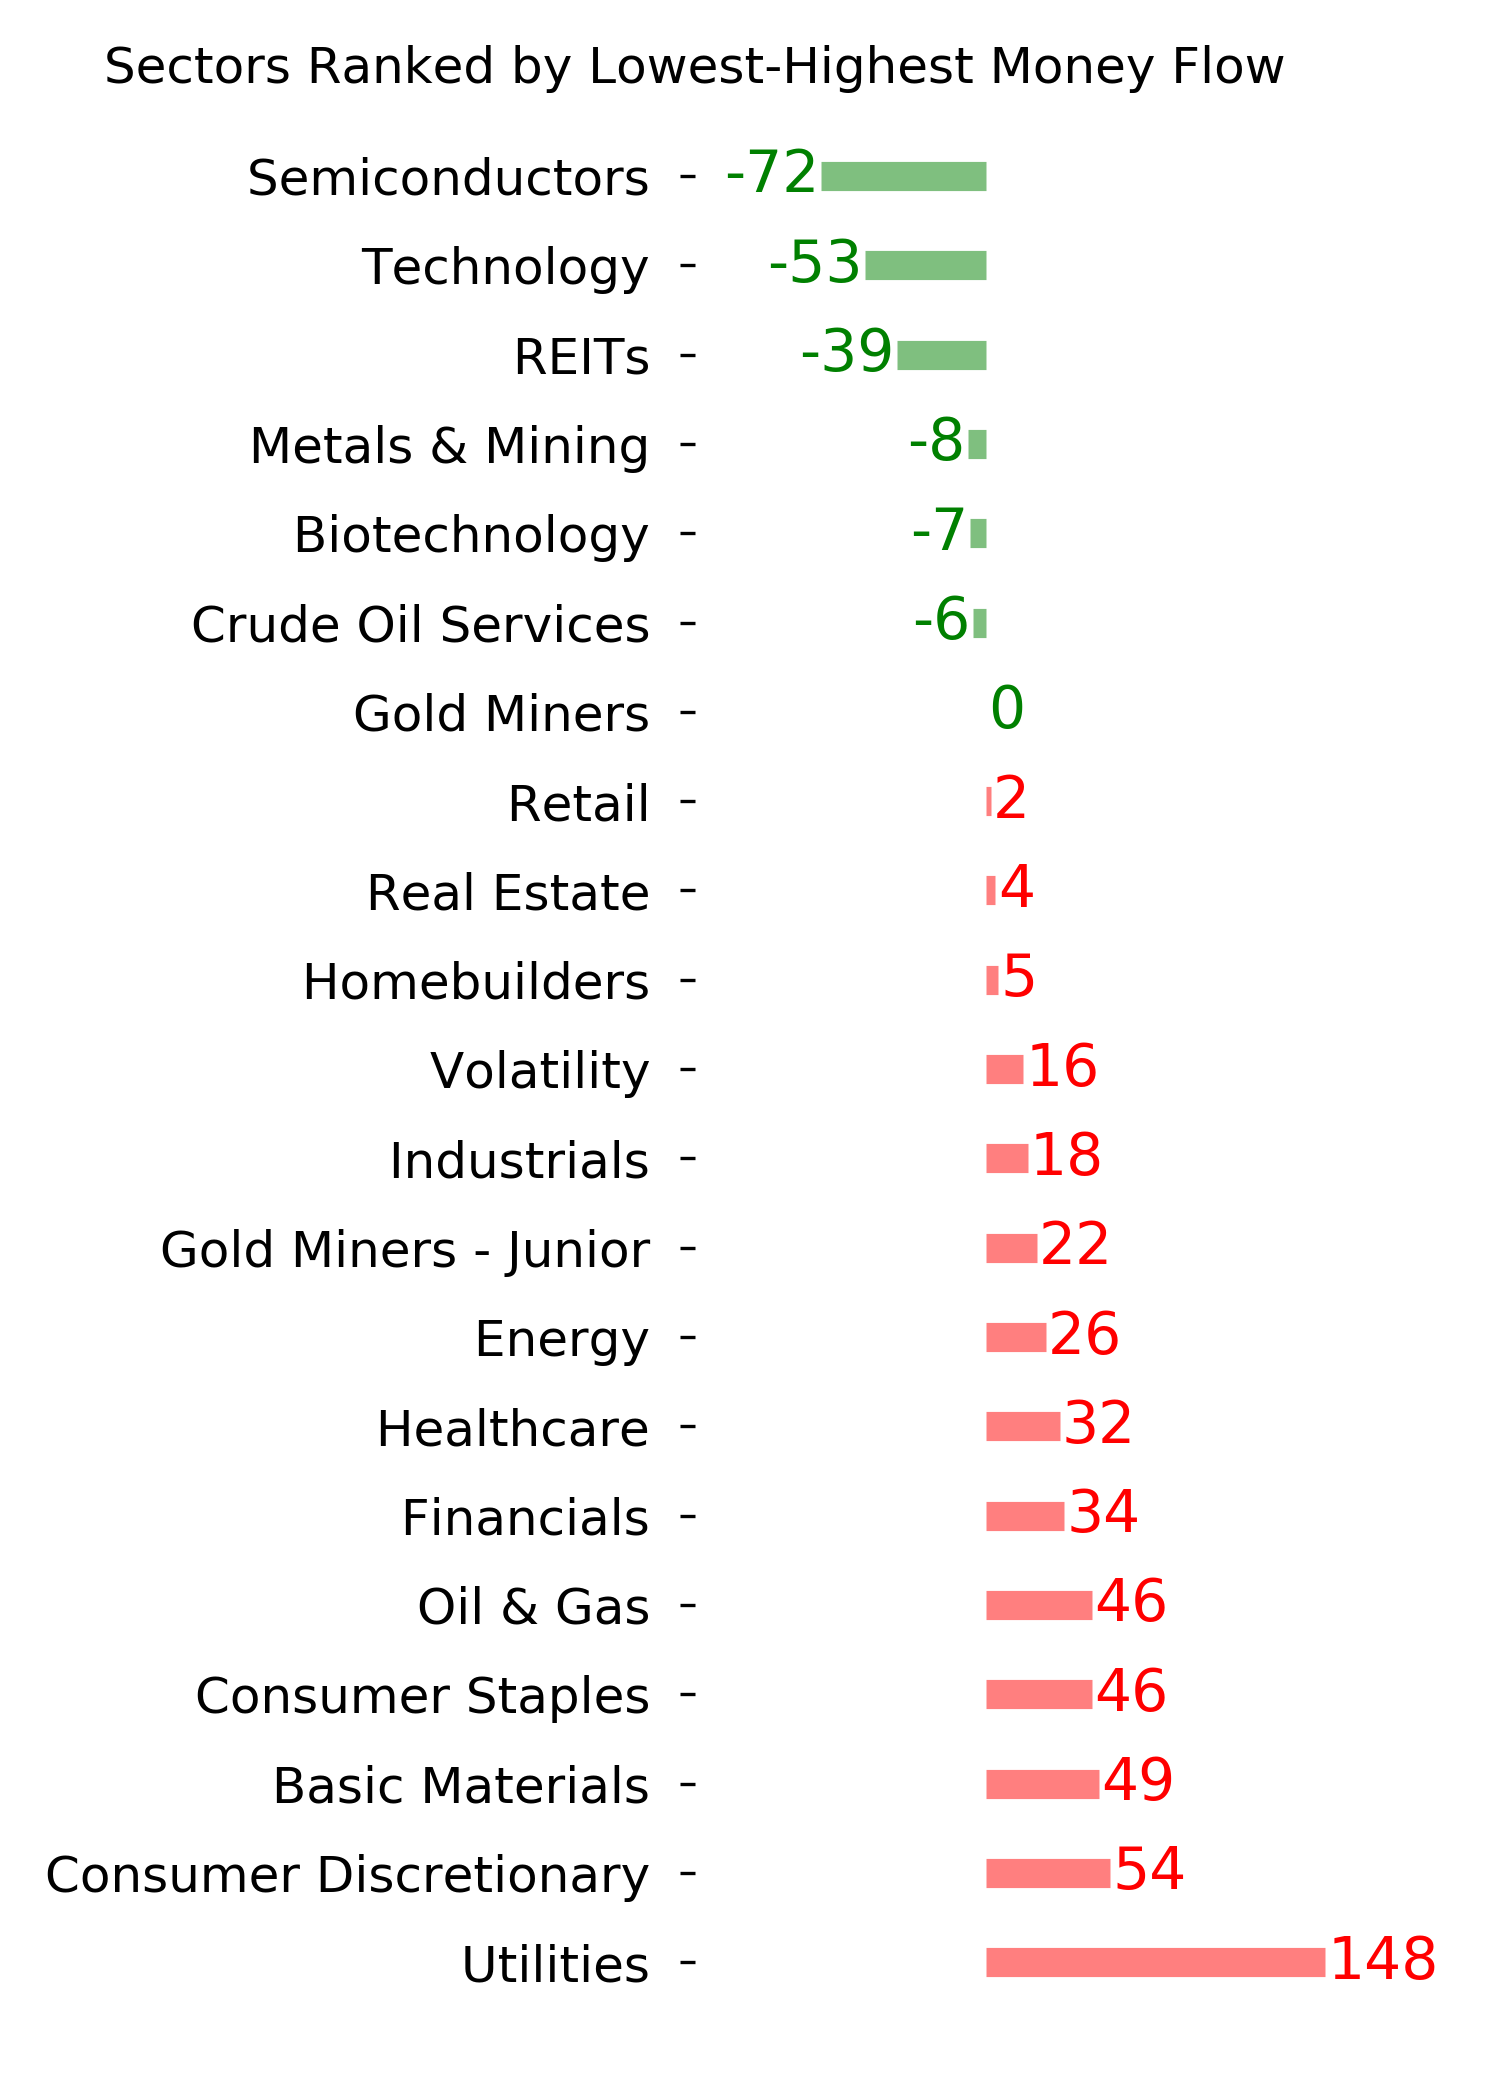
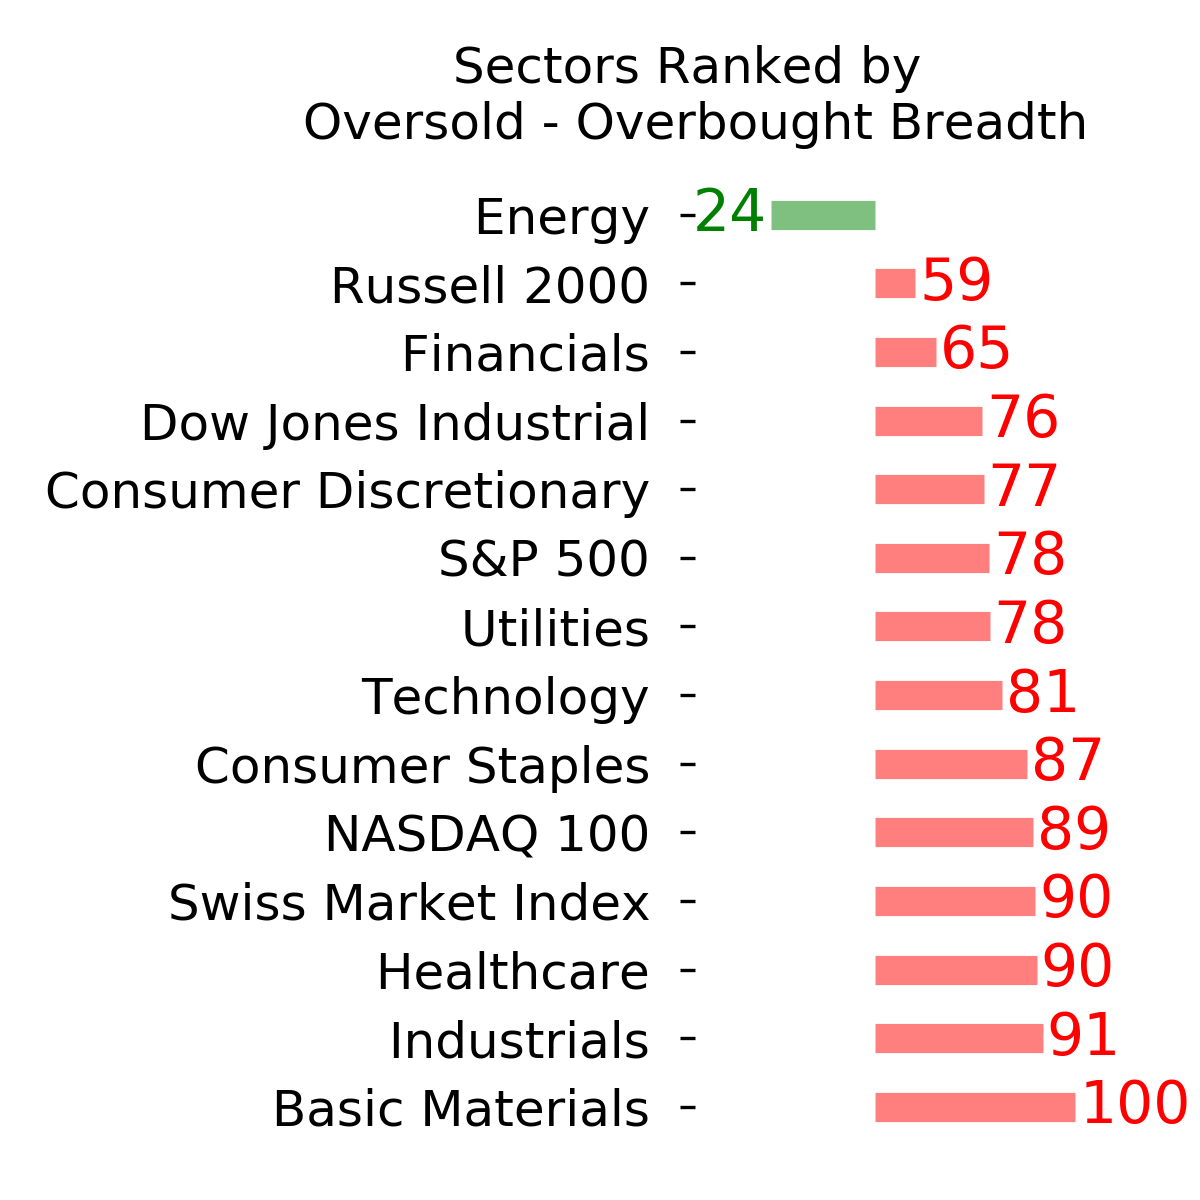
Ranks
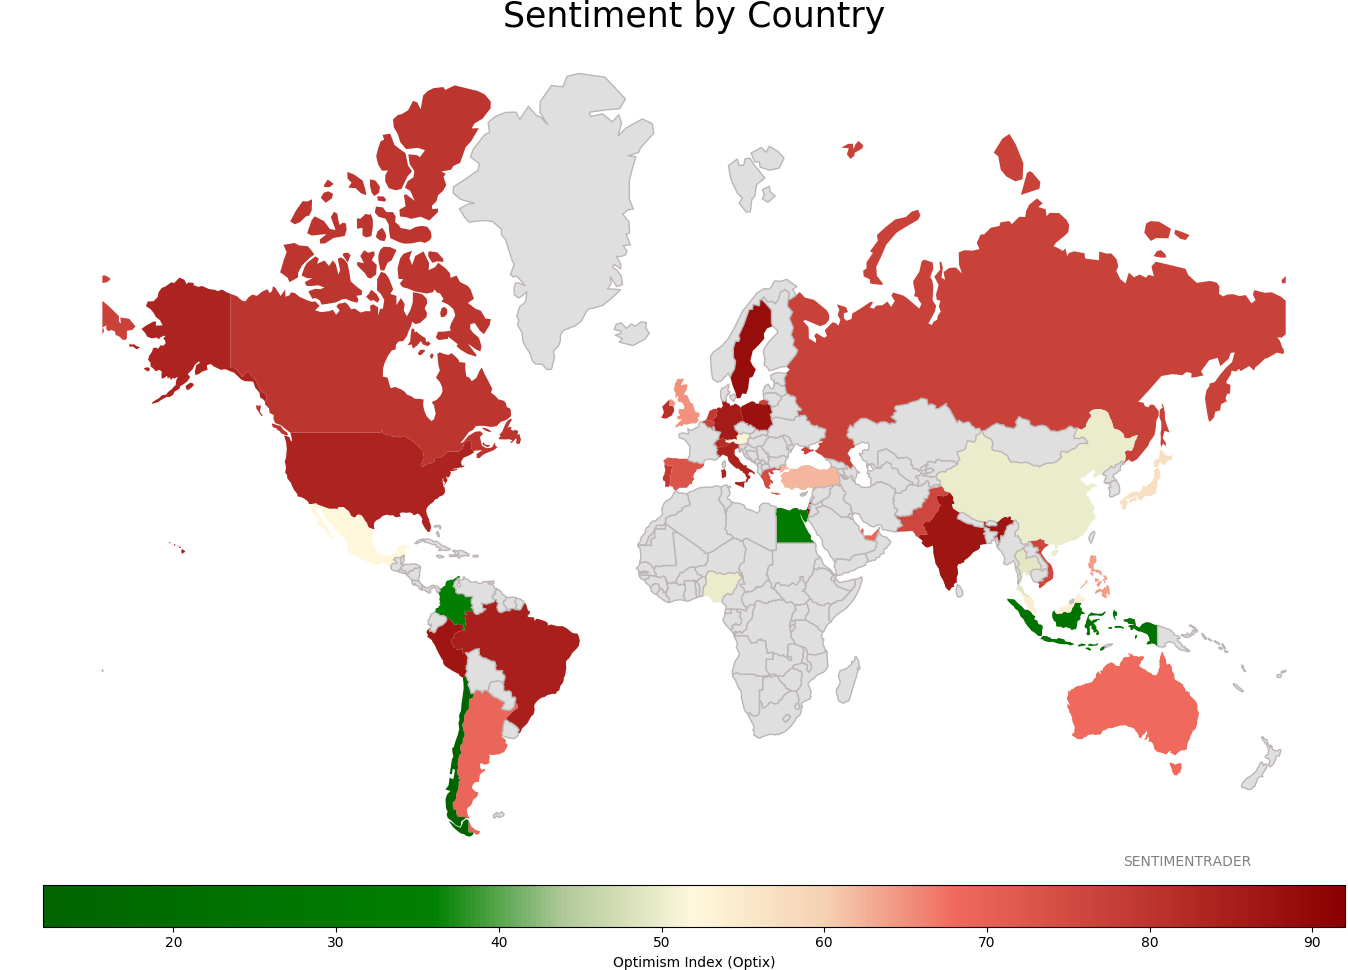
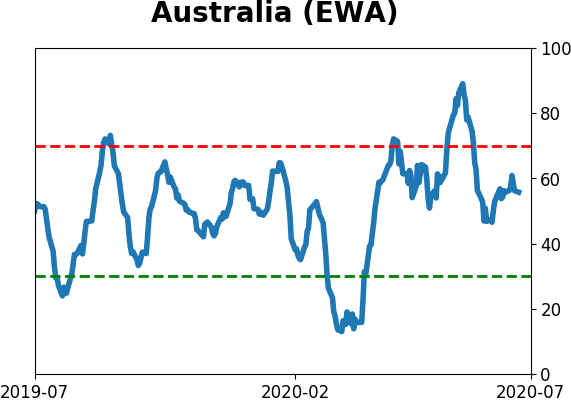
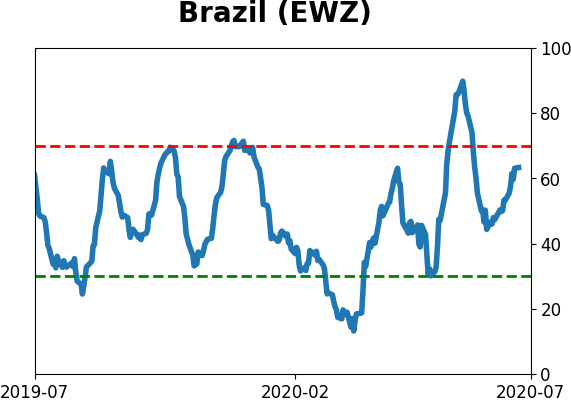
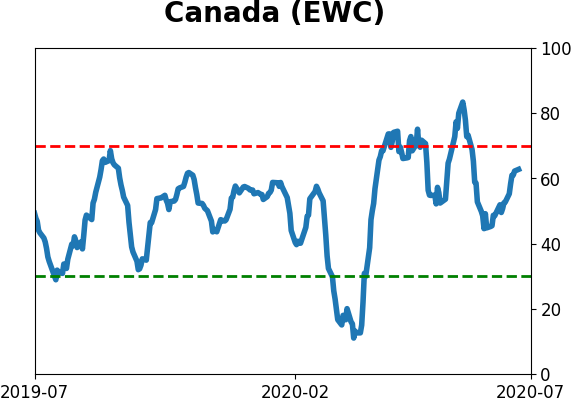
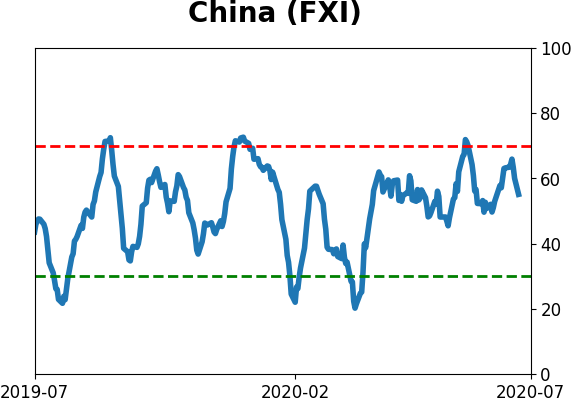
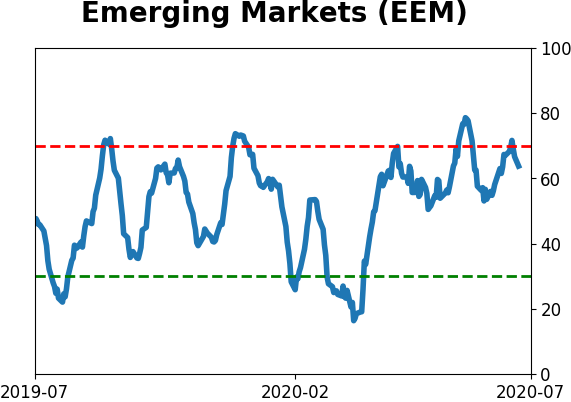
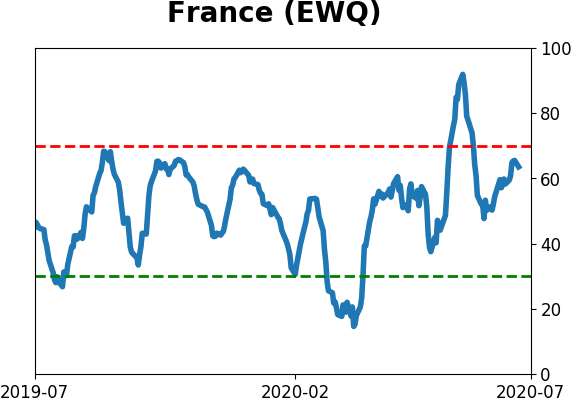
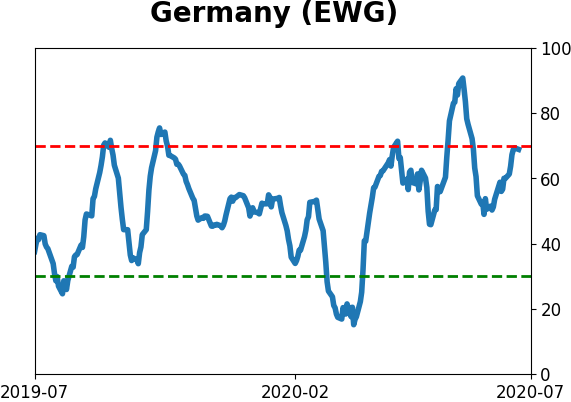
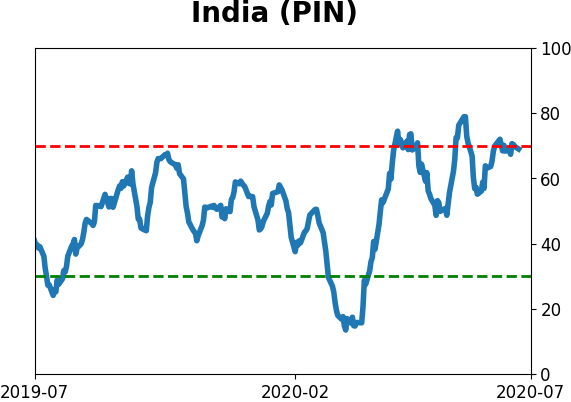
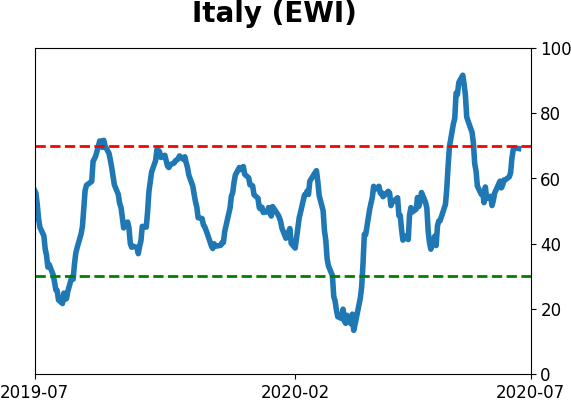
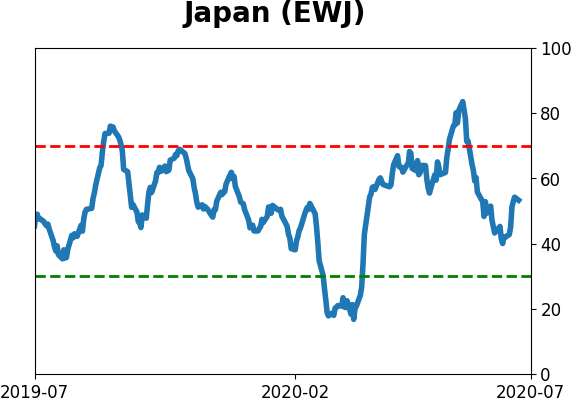
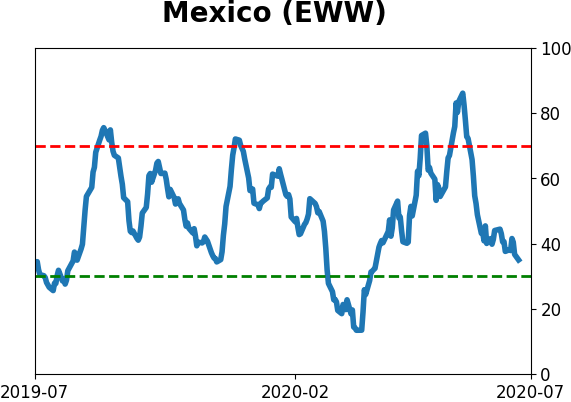
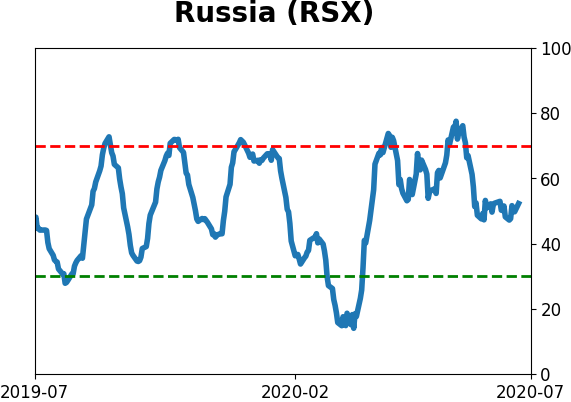
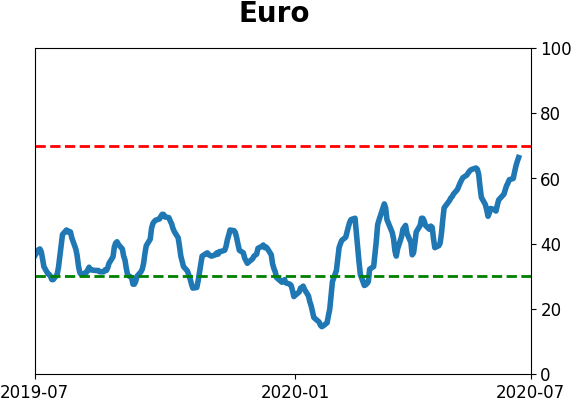
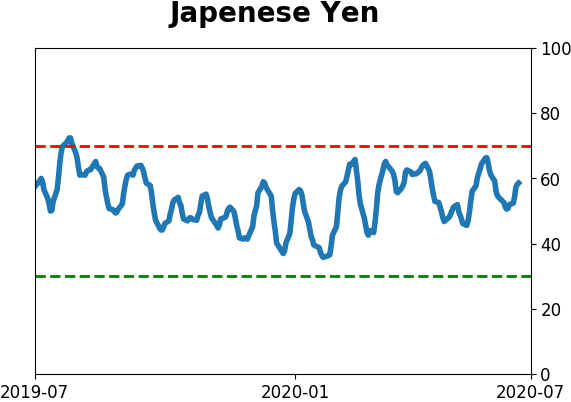
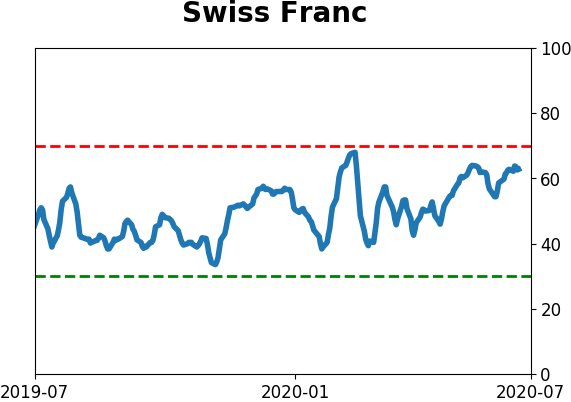
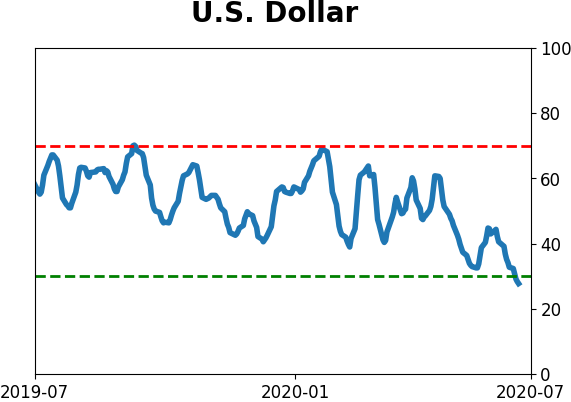
Sentiment Around The World
Optimism Index Thumbnails
|
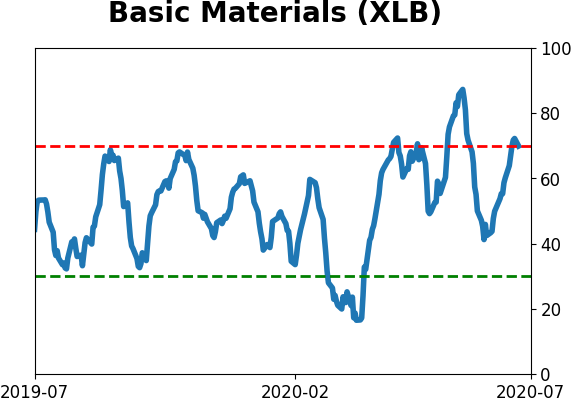
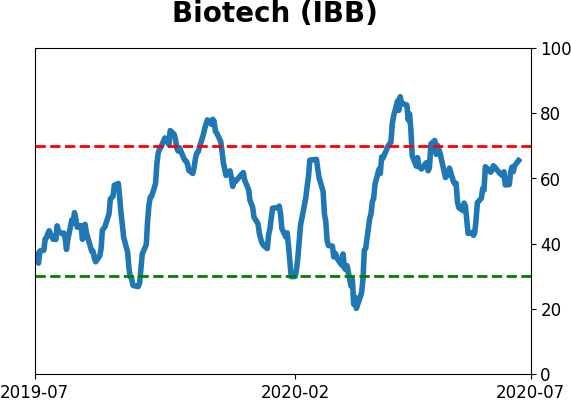
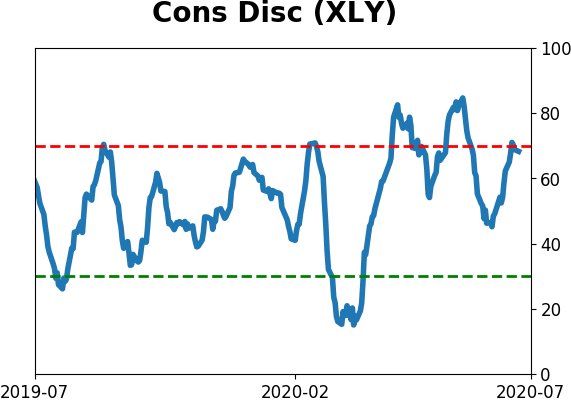
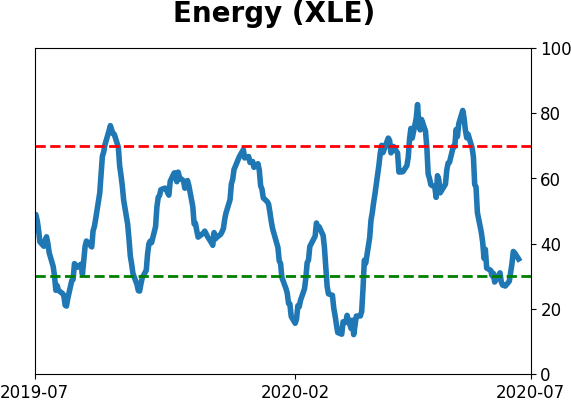
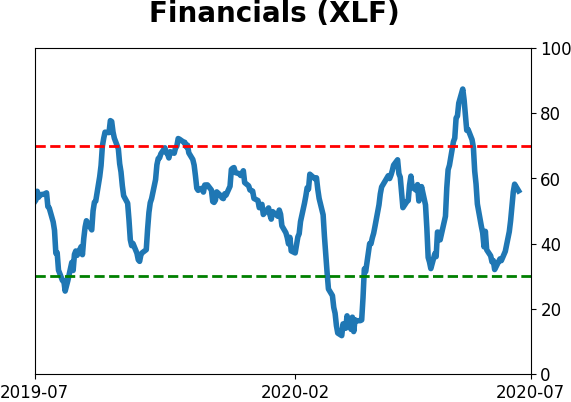
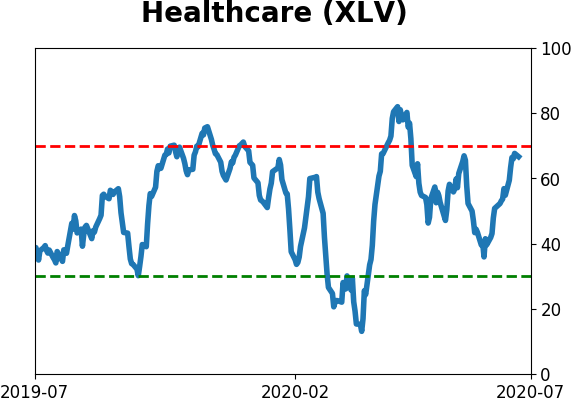
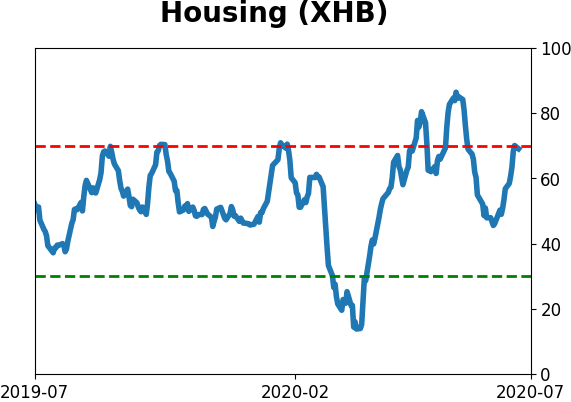
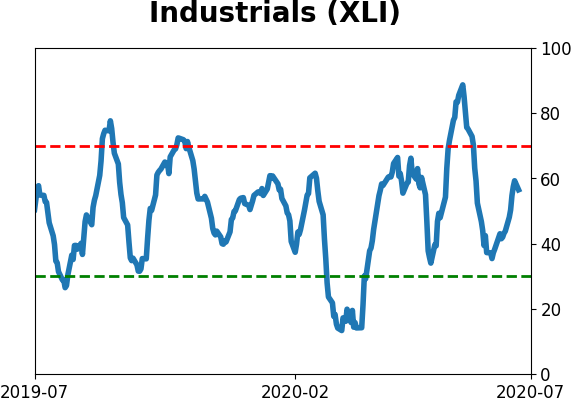
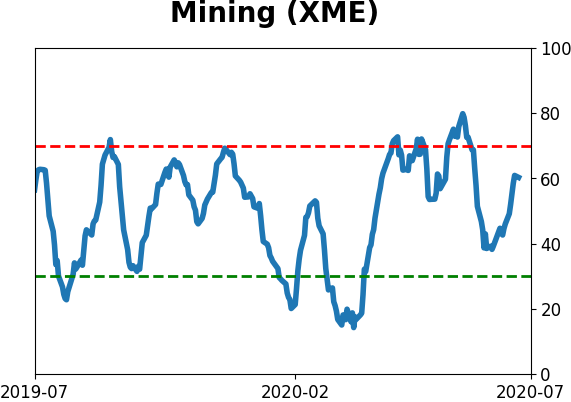
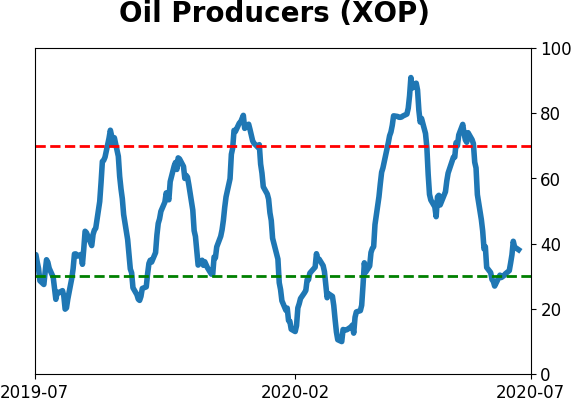
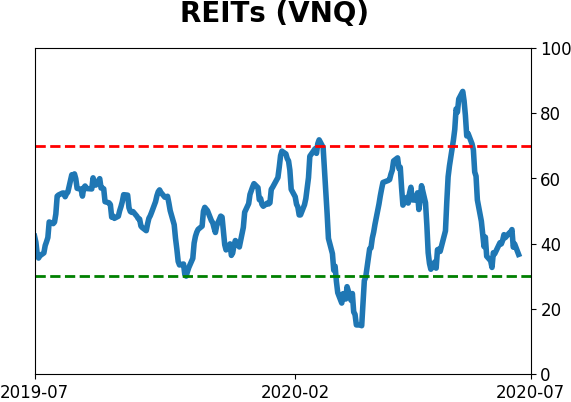
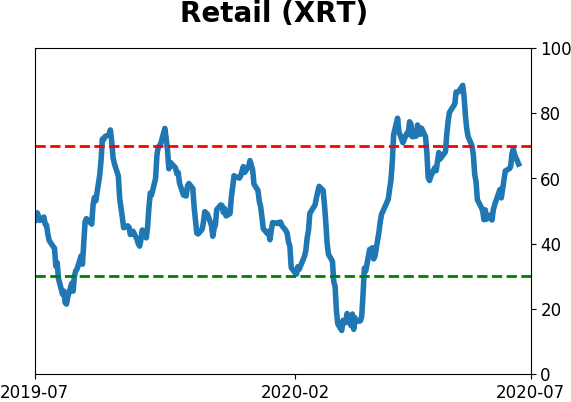
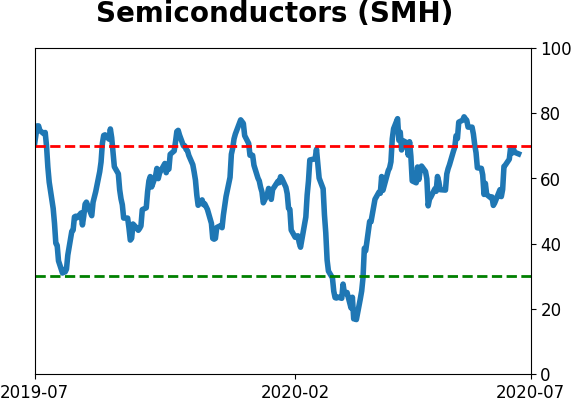
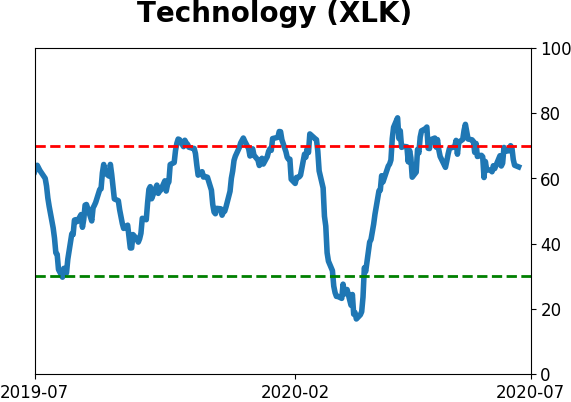
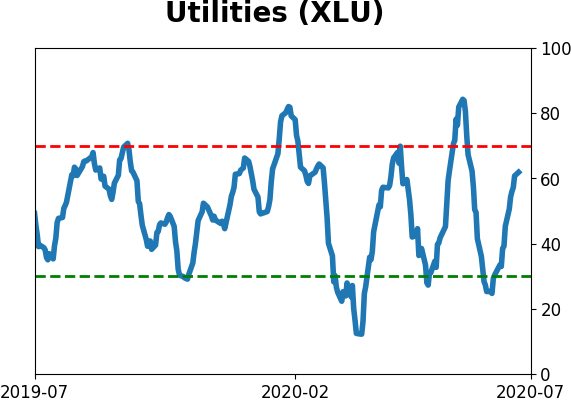
Sector ETF's - 10-Day Moving Average
|
|
|
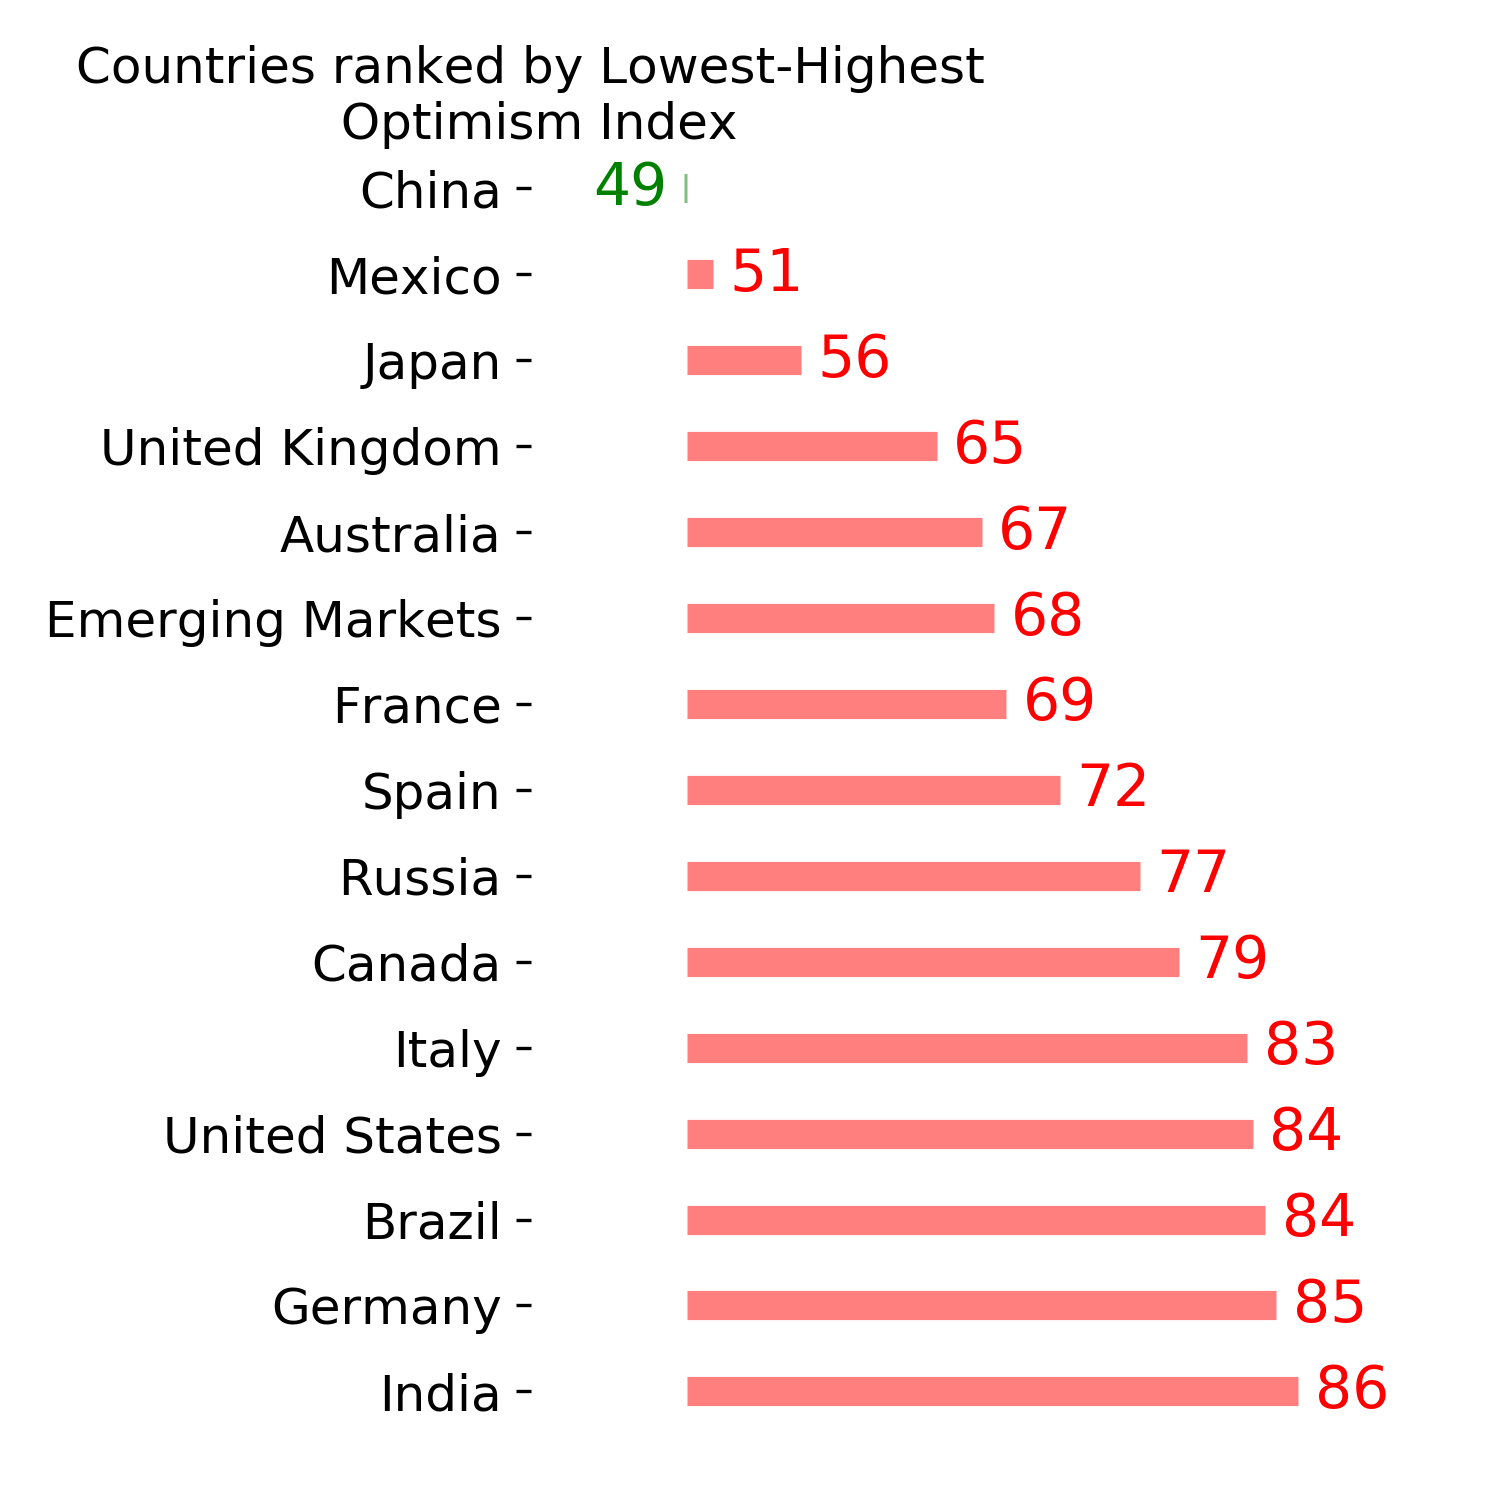
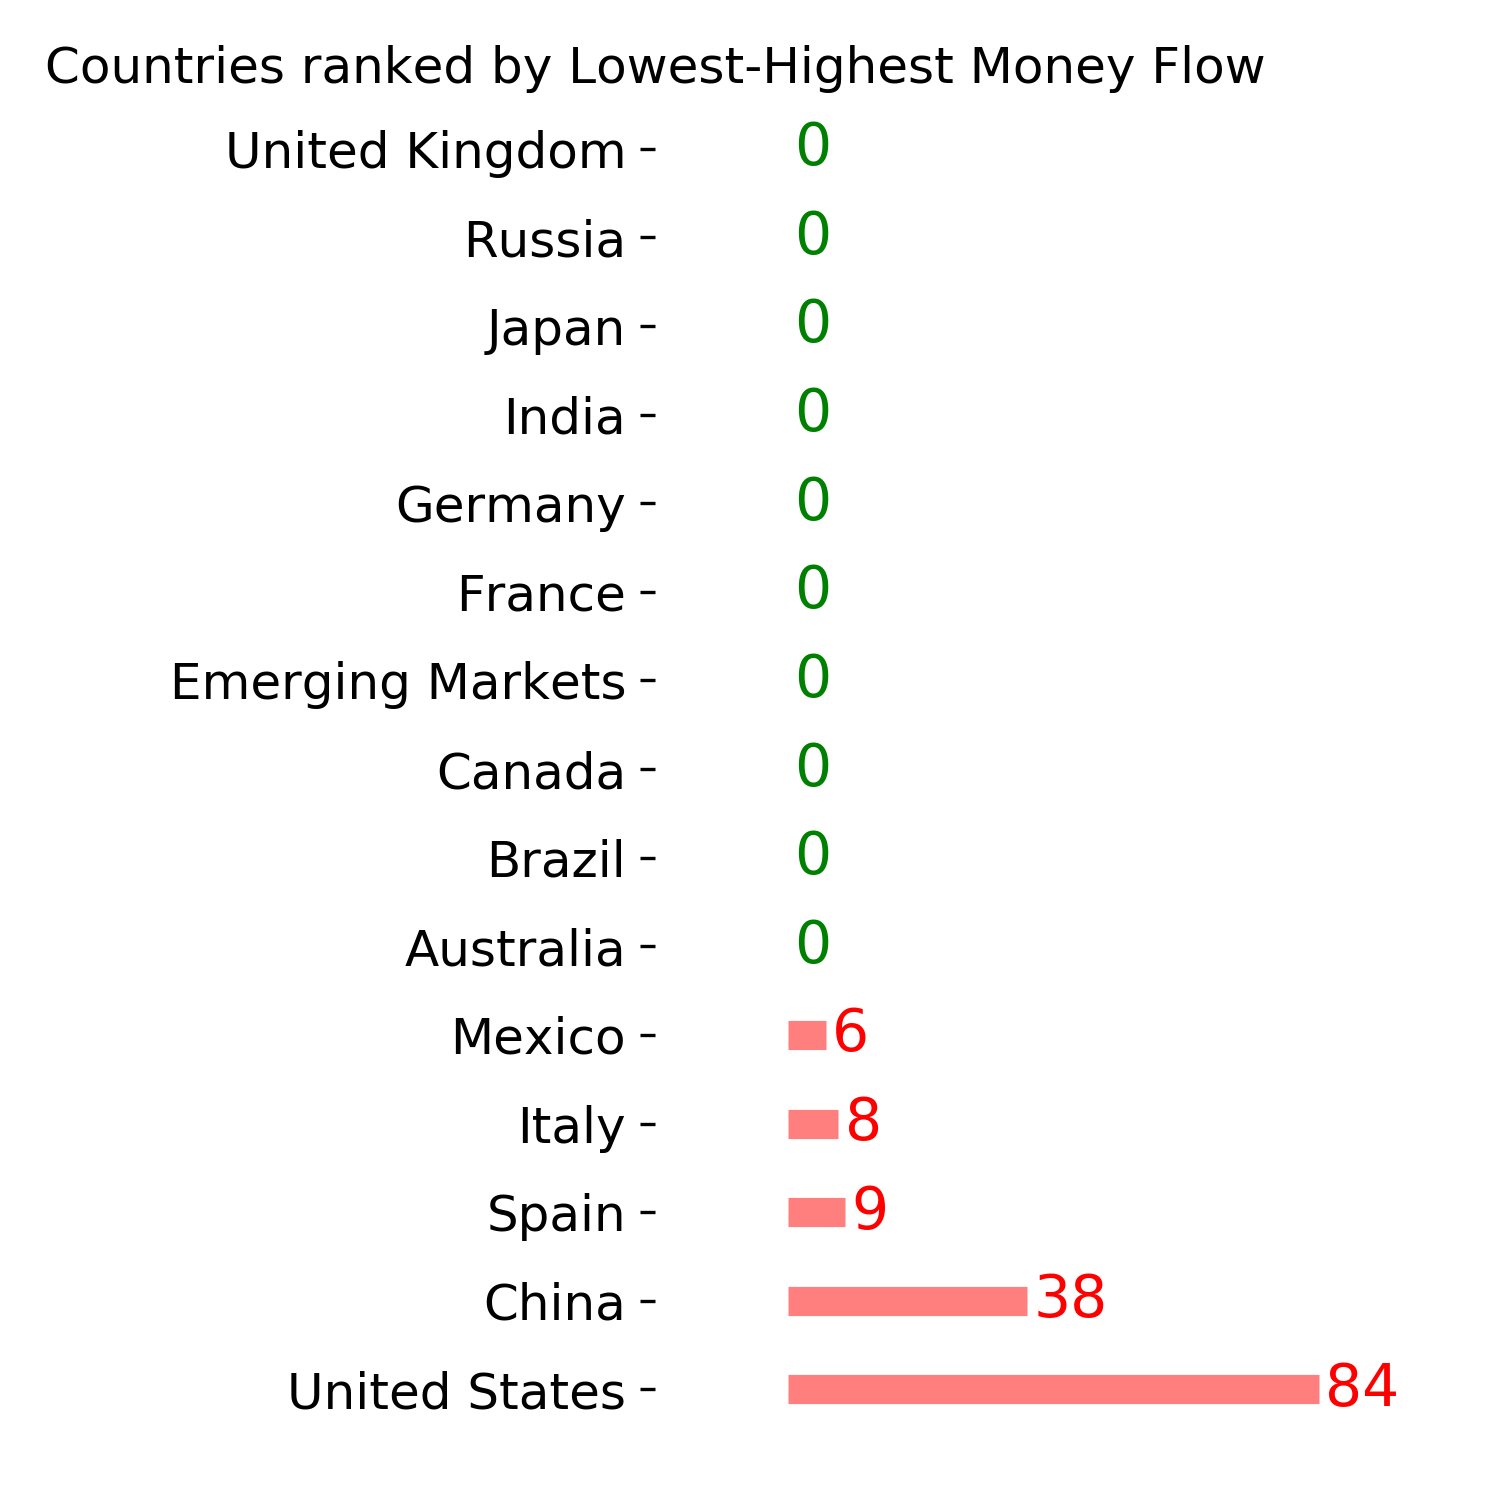
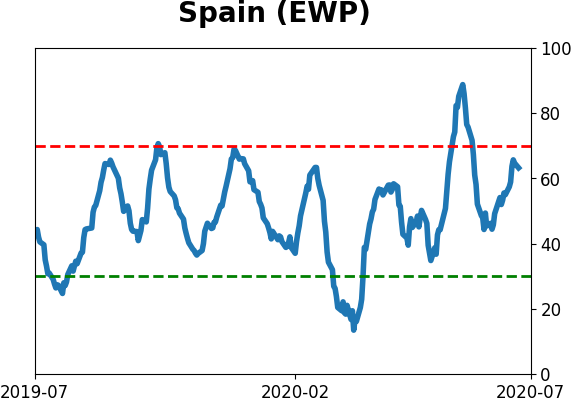
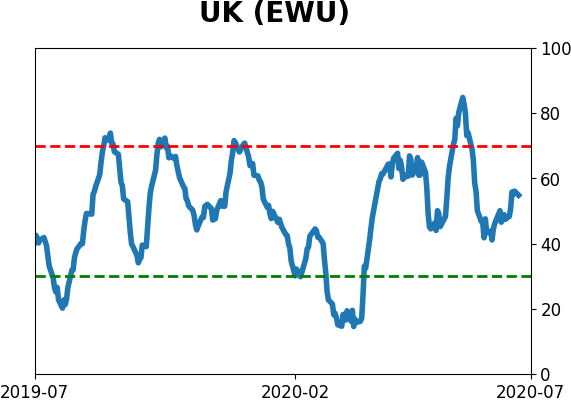
Country ETF's - 10-Day Moving Average
|
|
|
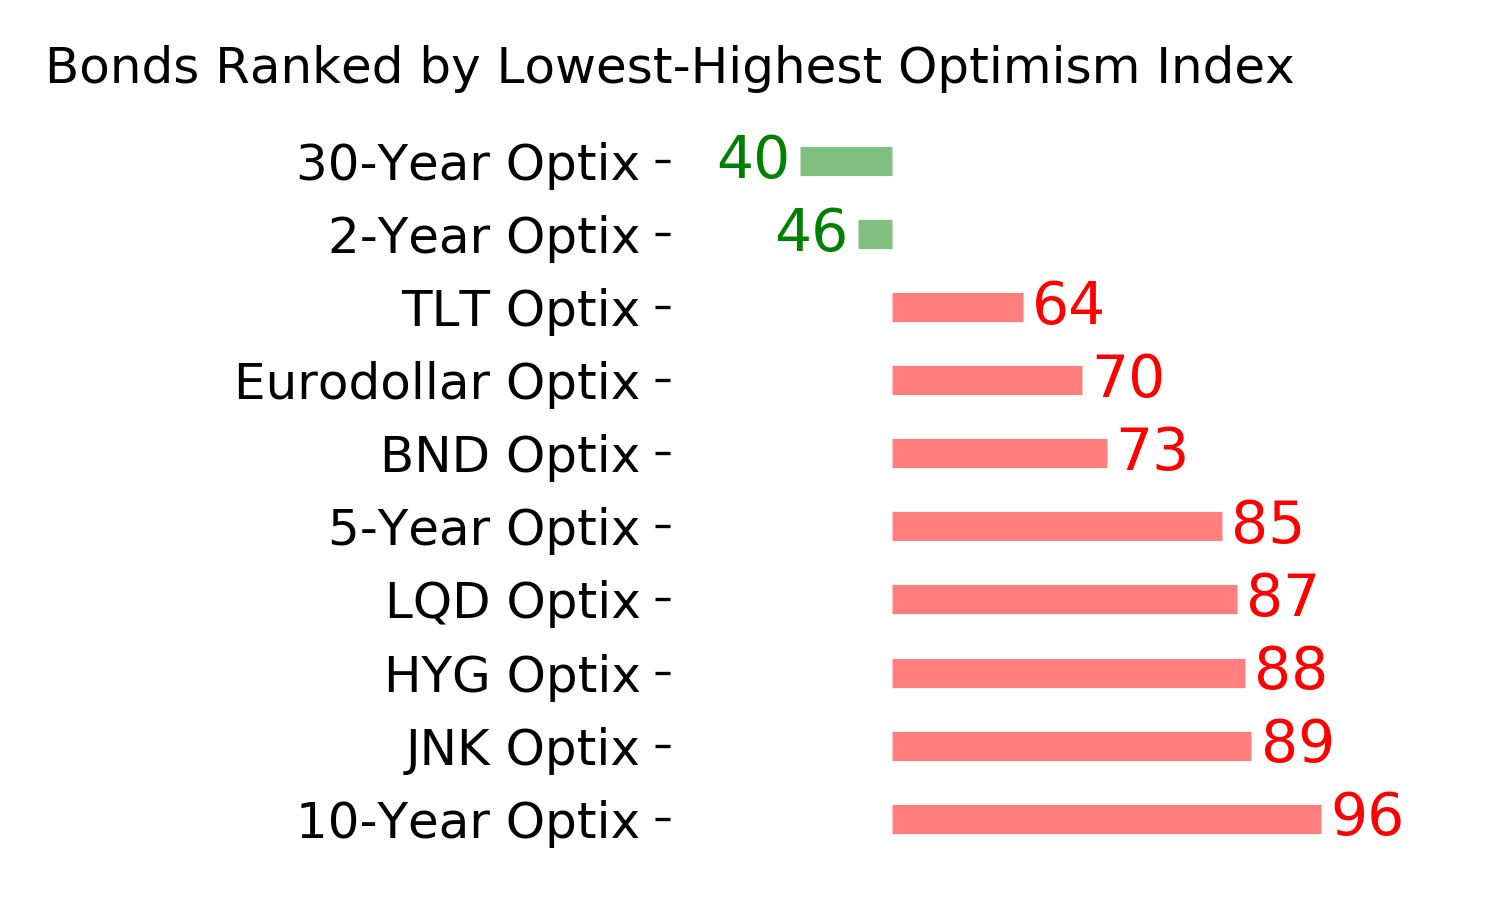
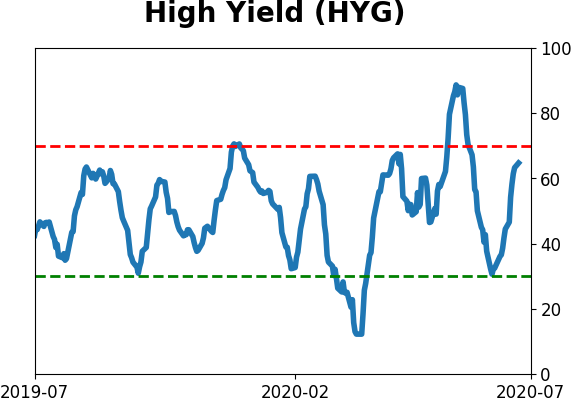
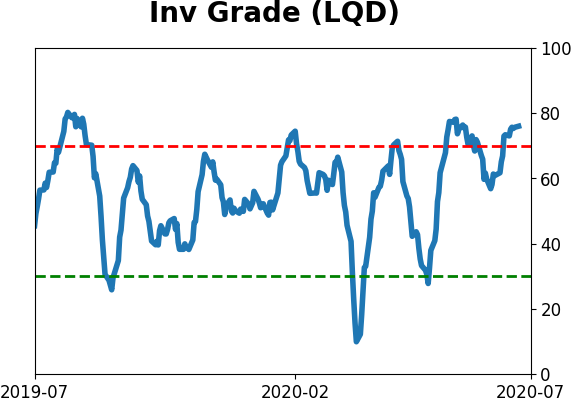
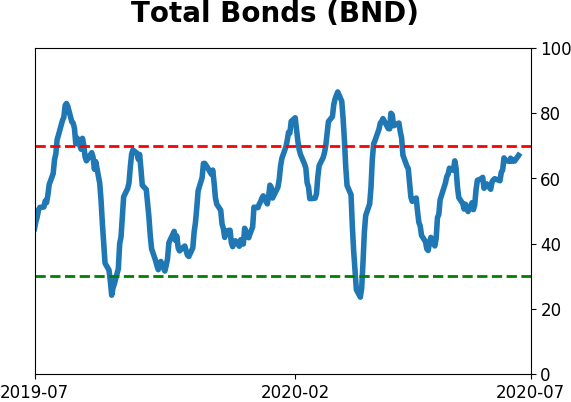
Bond ETF's - 10-Day Moving Average
|
|
|
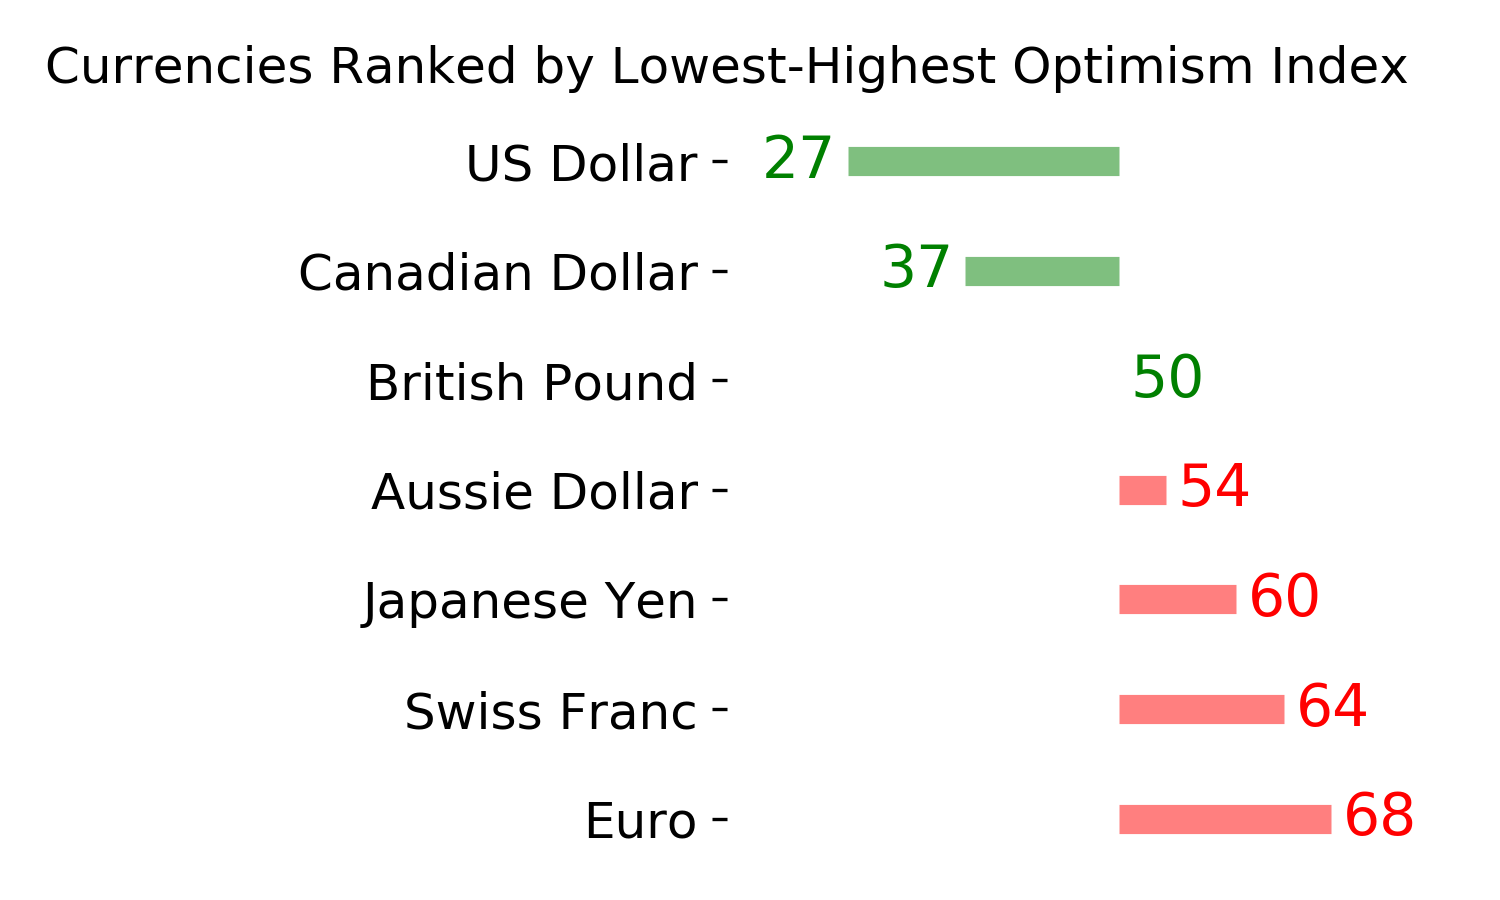
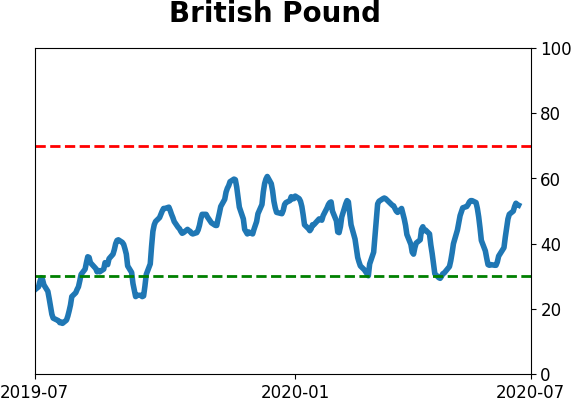
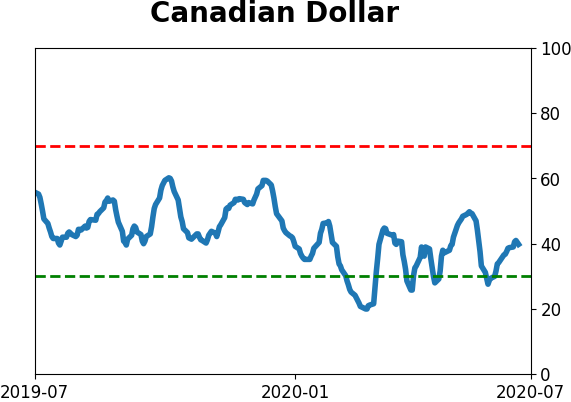
Currency ETF's - 5-Day Moving Average
|
|
|
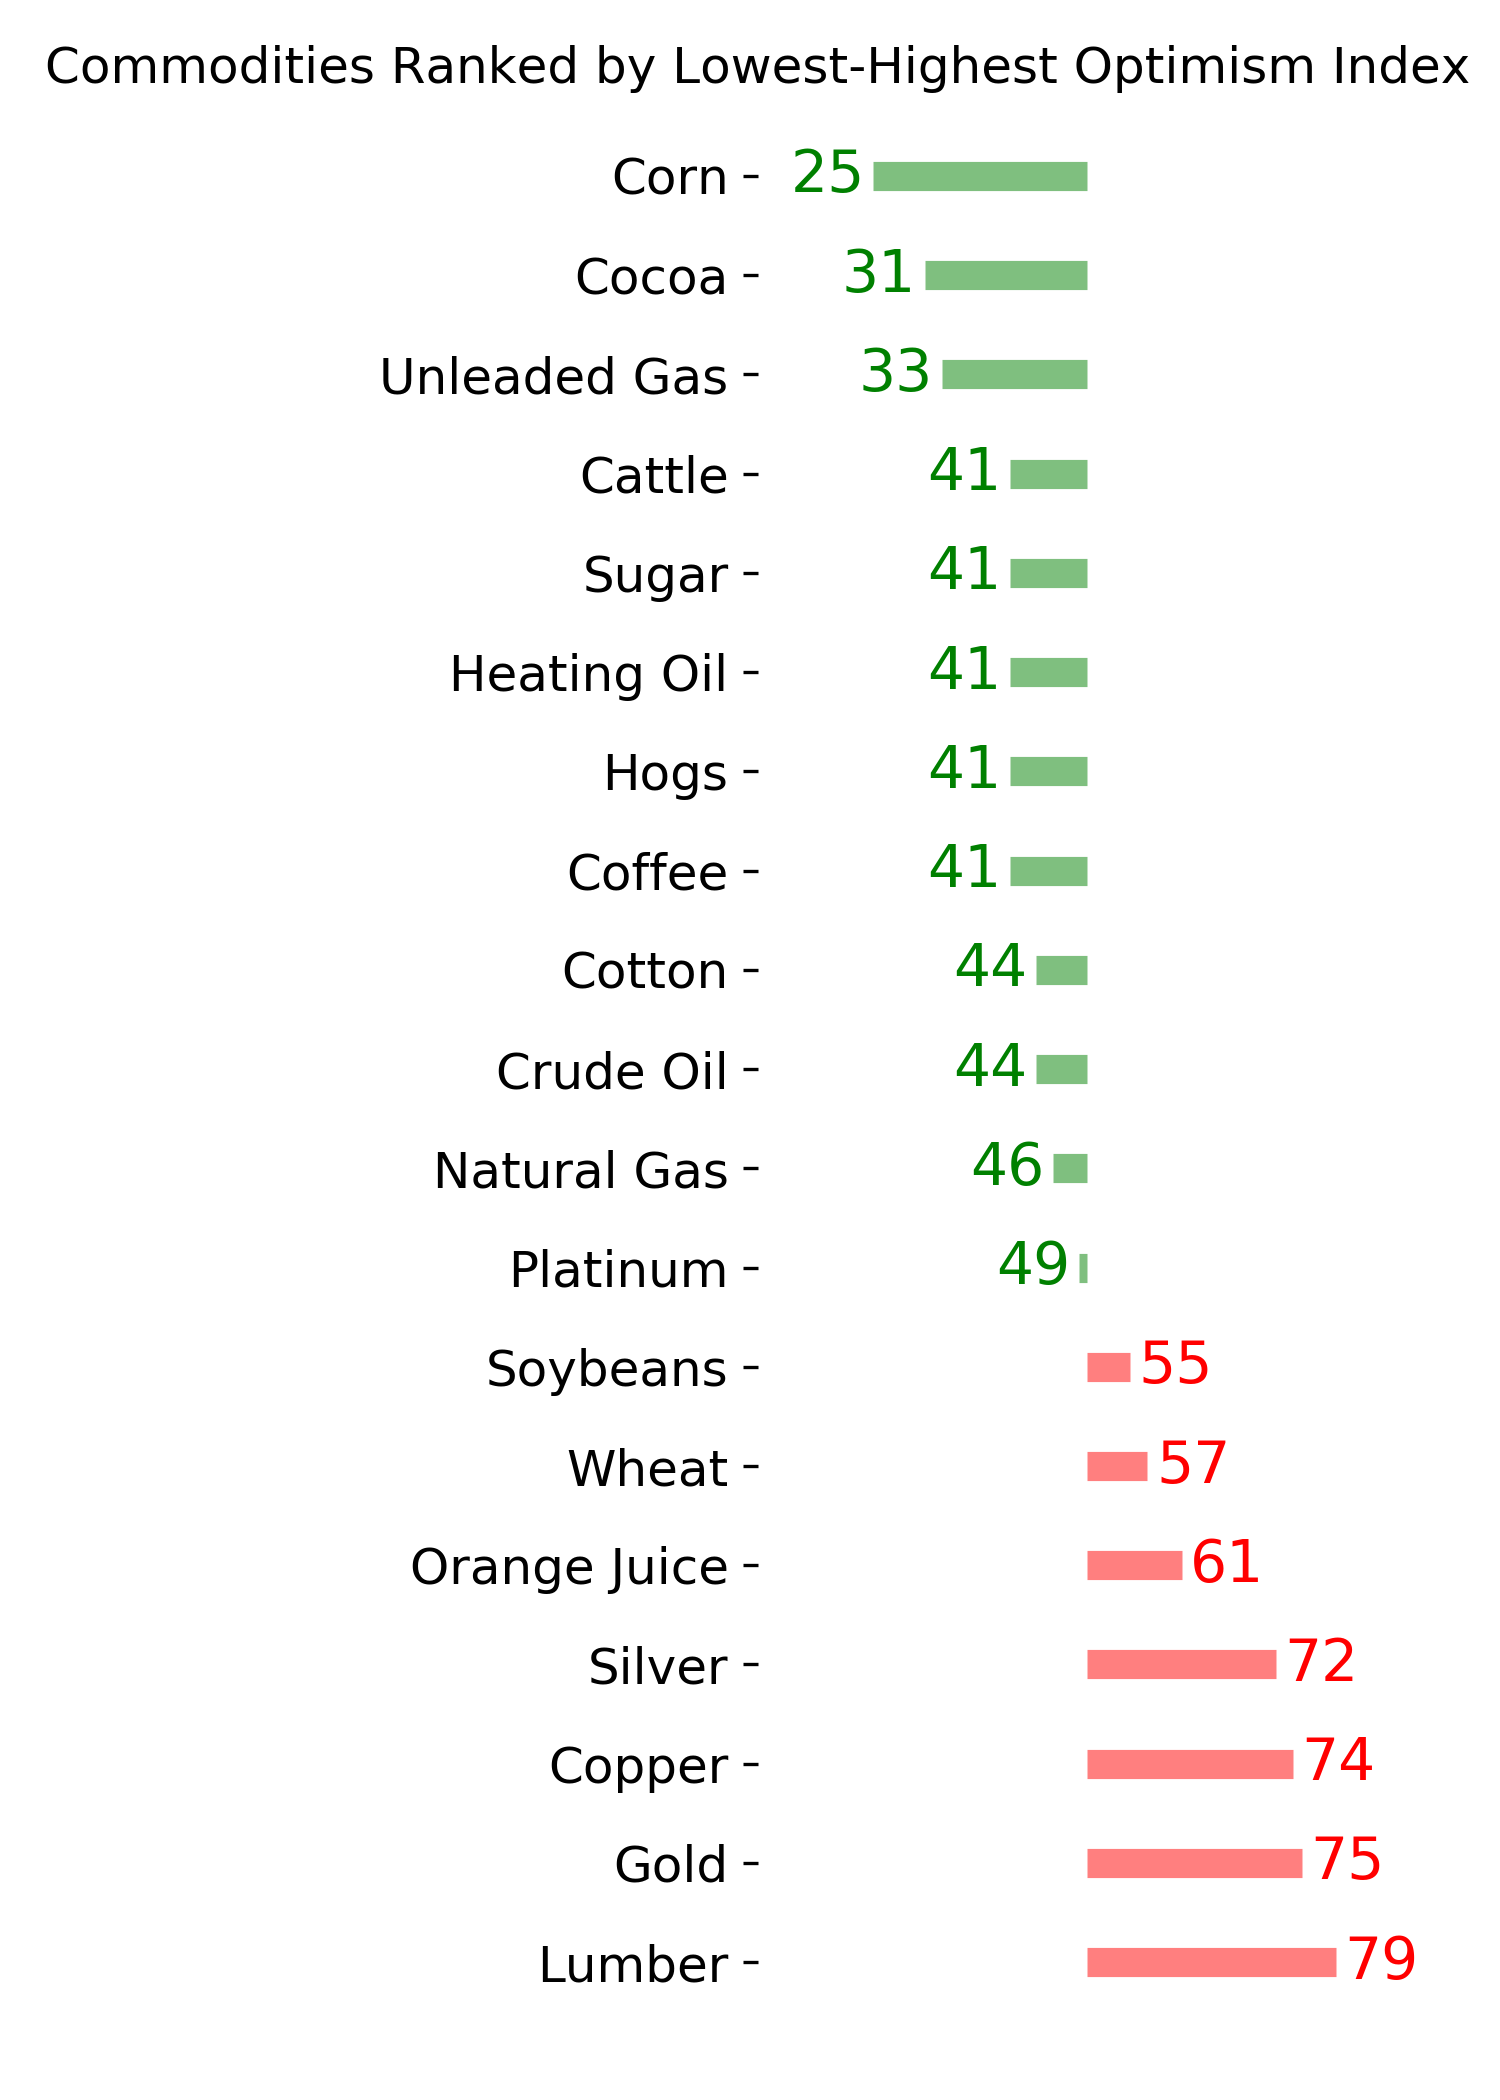
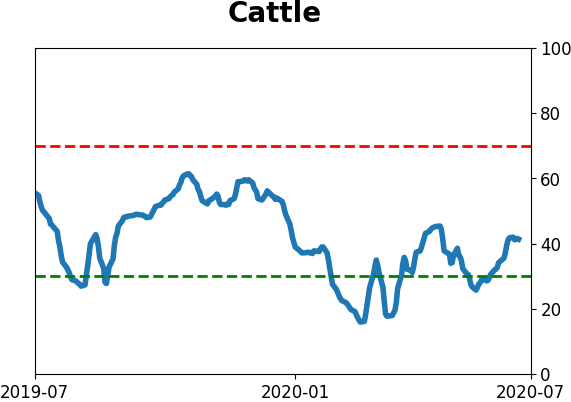
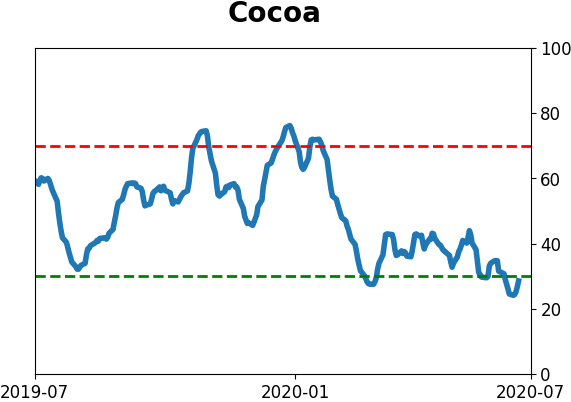
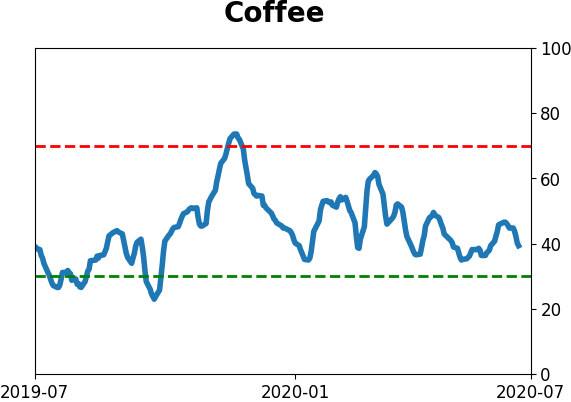
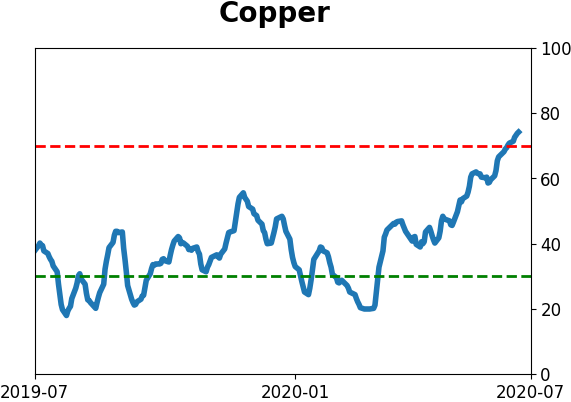
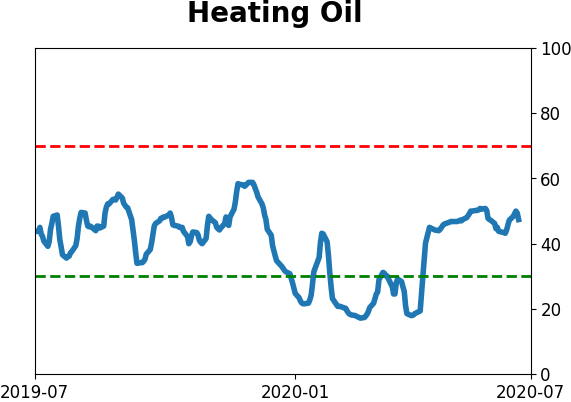
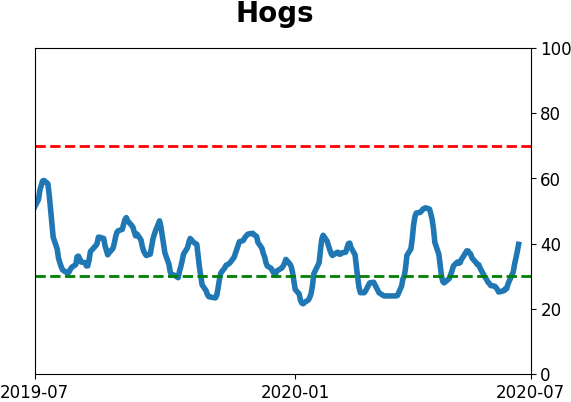
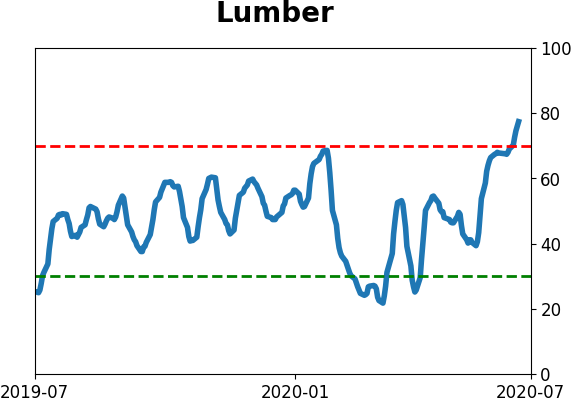
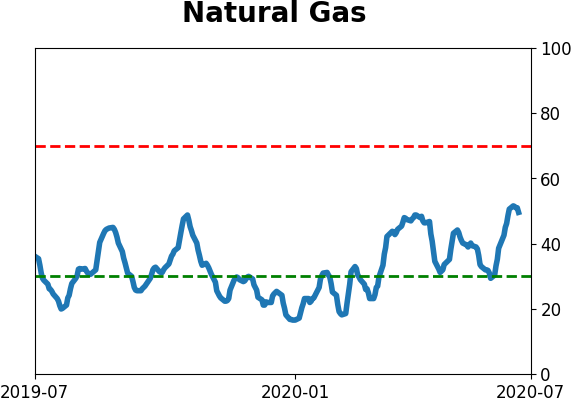
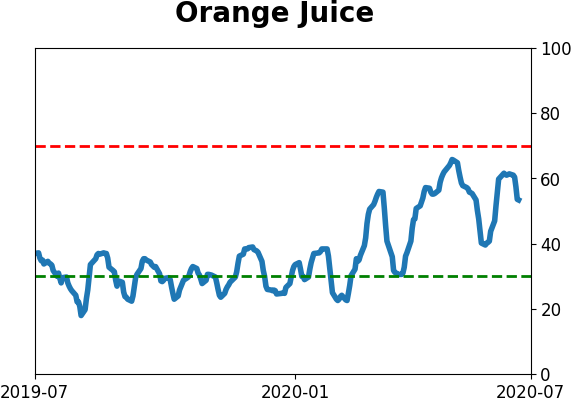
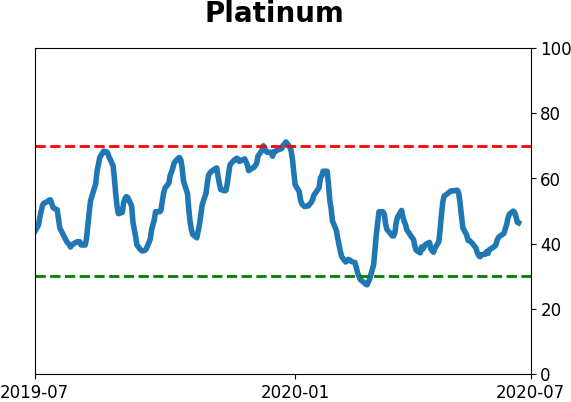
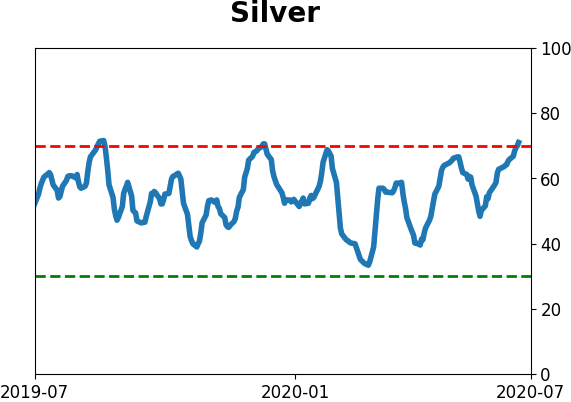
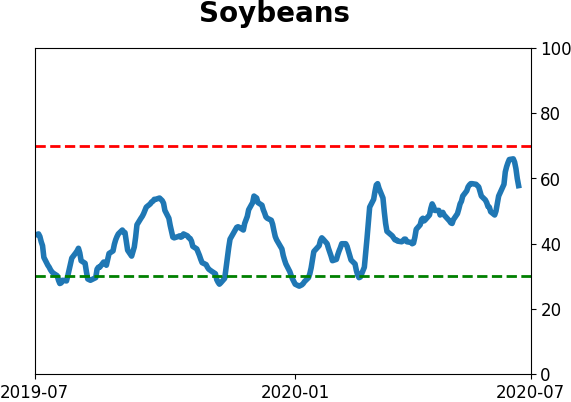
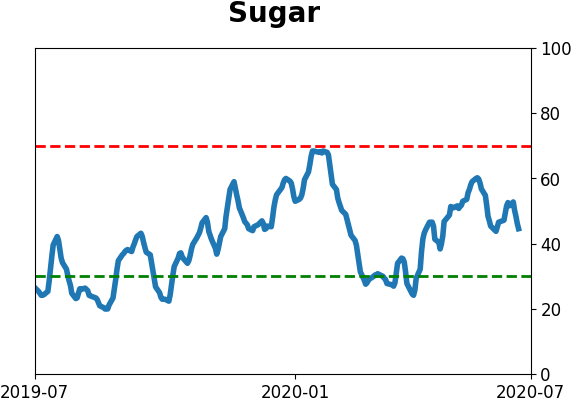
Commodity ETF's - 5-Day Moving Average
|
|