Headlines
|
|
Seismic shift to small stocks:
In just a week, the ratio of small caps to large caps rallied by nearly 10%. That's one of the largest shifts in nearly 100 years, with few precedents outside of the 1930s. Since then, massive one-week moves into smaller stocks and out of larger ones coincided with several multi-month moves into smaller stocks.
|
Smart / Dumb Money Confidence
|
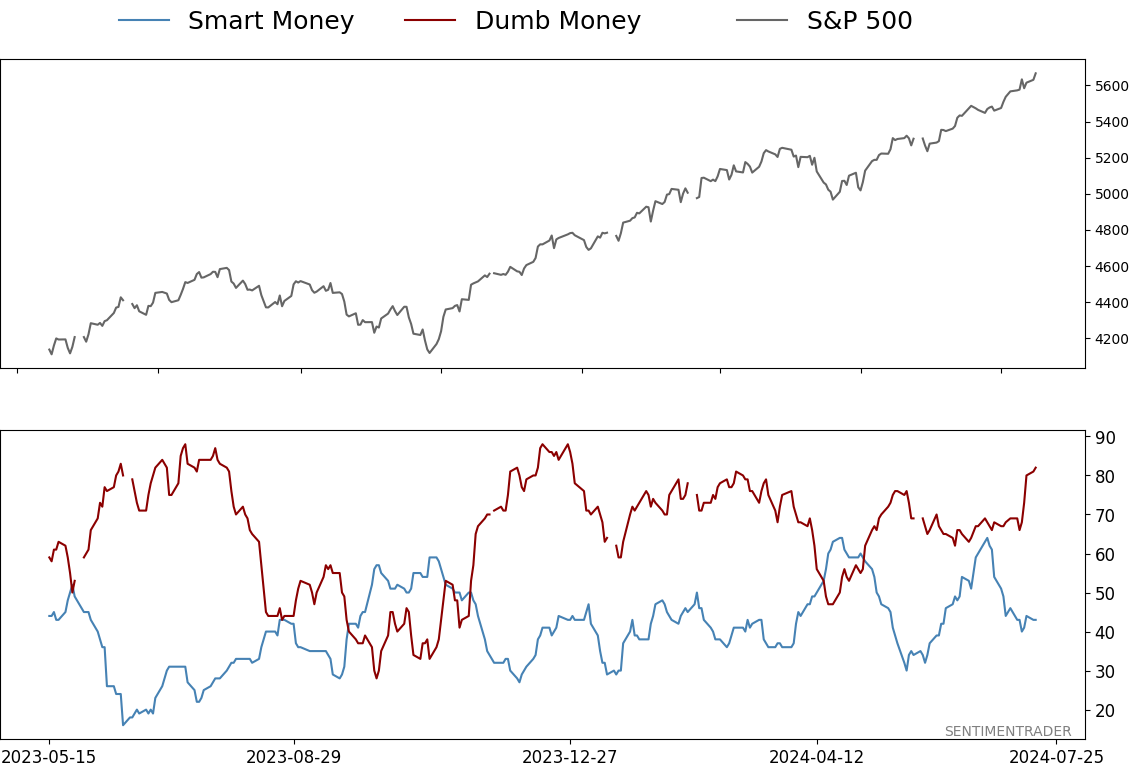
Smart Money Confidence: 43%
Dumb Money Confidence: 82%
|
|
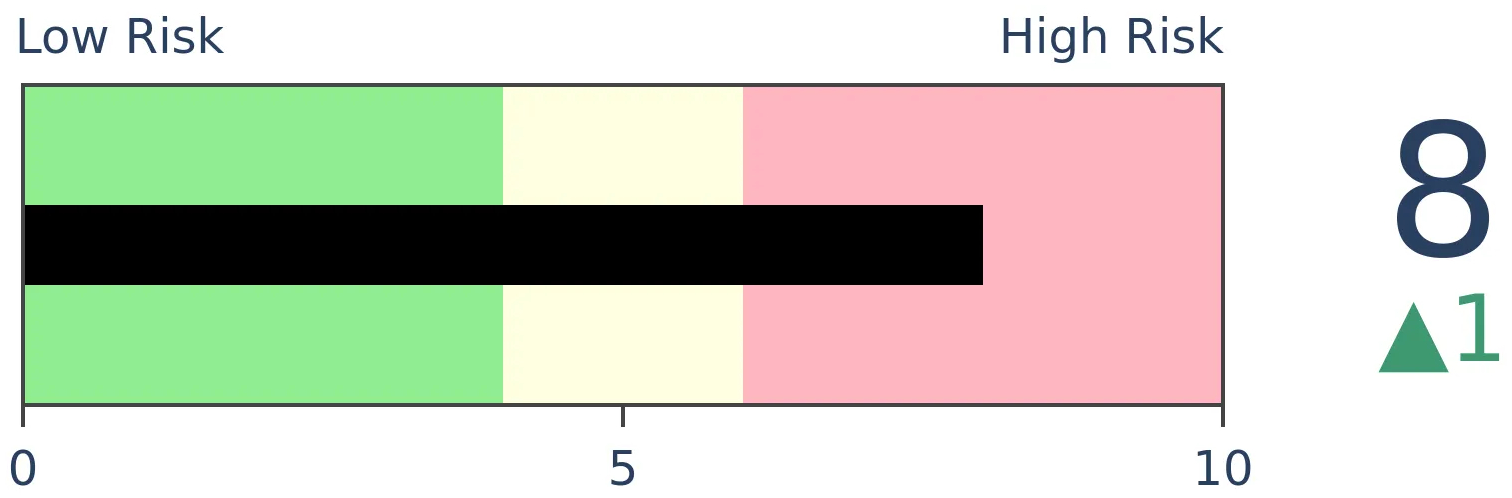
Risk Levels
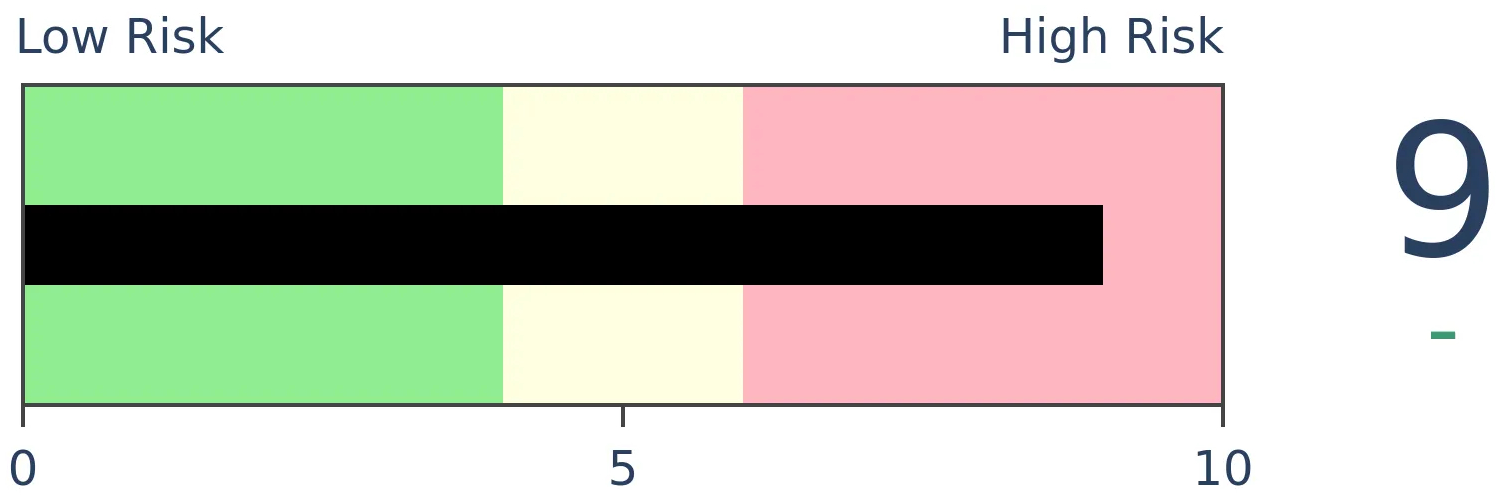
Stocks Short-Term
|
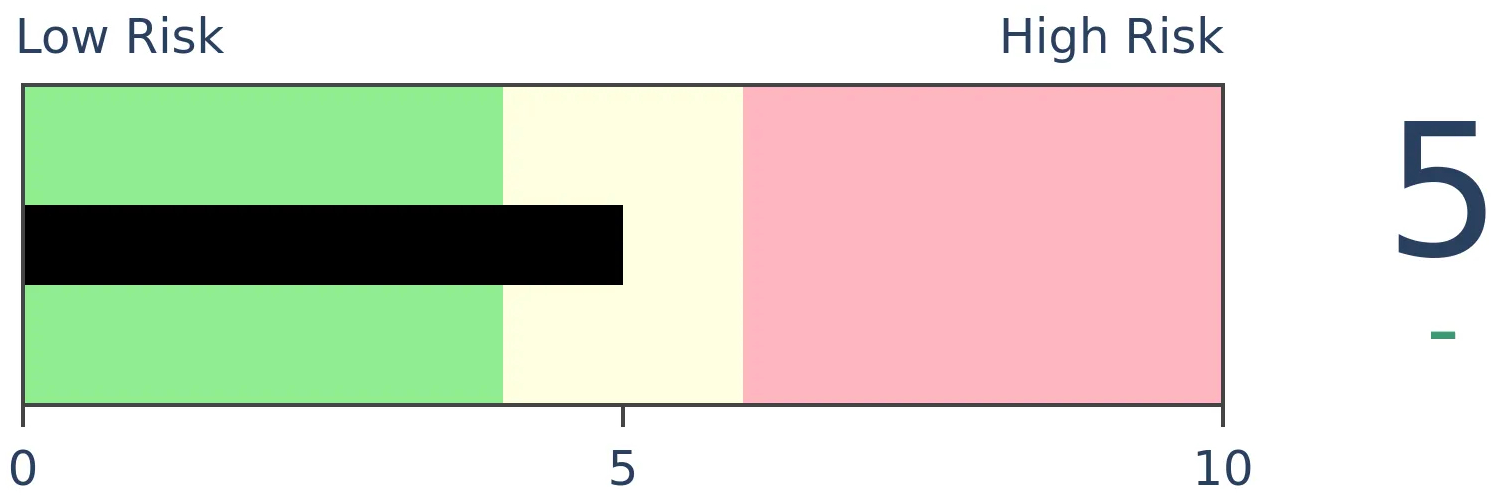
Stocks Medium-Term
|
|
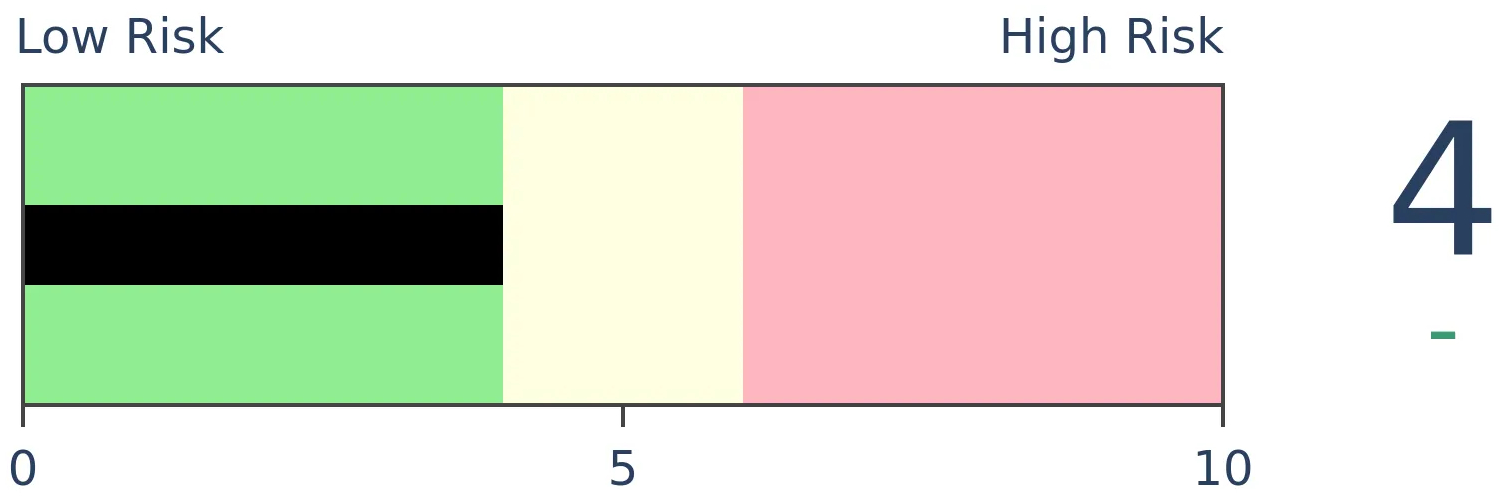
Bonds
|
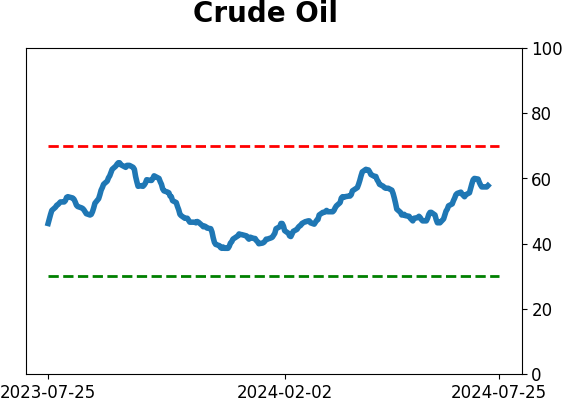
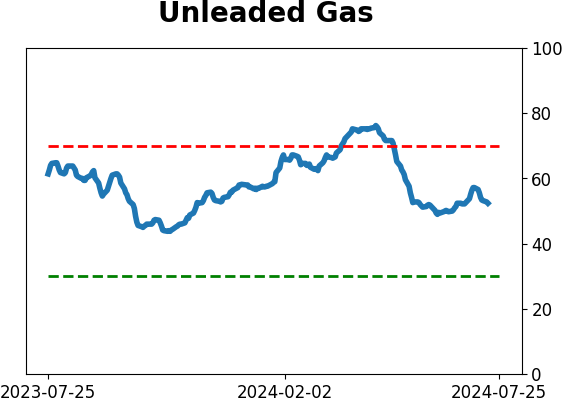
Crude Oil
|
|
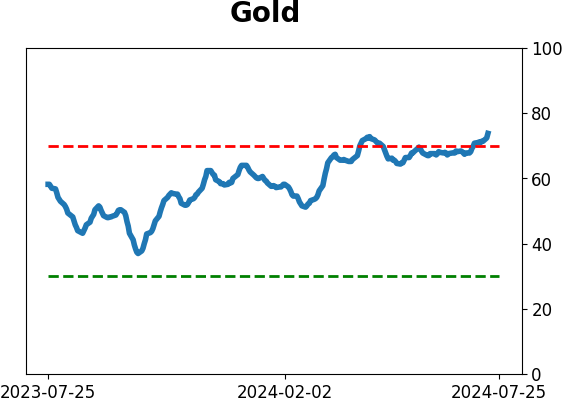
Gold

|
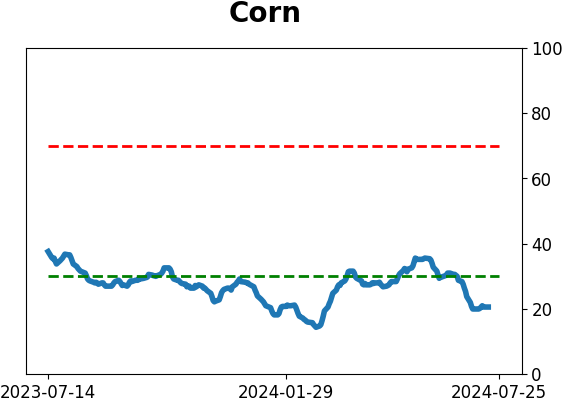
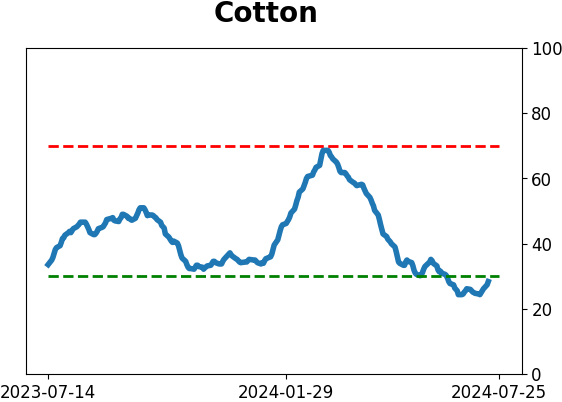
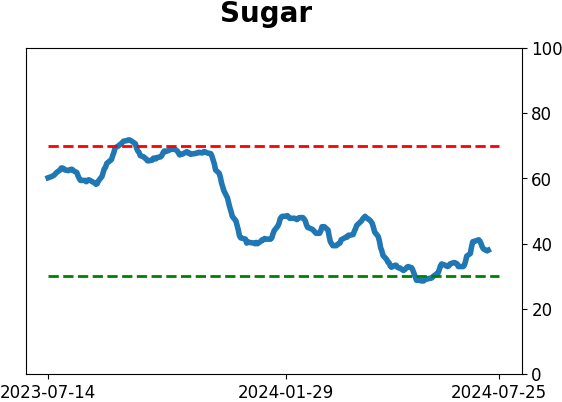
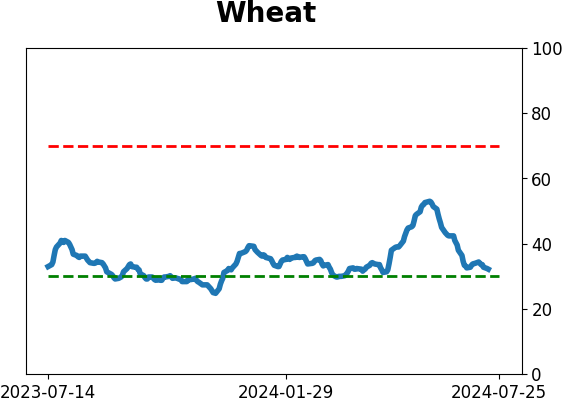
Agriculture

|
|
Research
By Jason Goepfert
BOTTOM LINE
In just a week, the ratio of small caps to large caps rallied by nearly 10%. That's one of the largest shifts in nearly 100 years, with few precedents outside of the 1930s. Since then, massive one-week moves into smaller stocks and out of larger ones coincided with several multi-month moves into smaller stocks.
FORECAST / TIMEFRAME
None
|
Key points:
- Investors seemingly moved whole-hog from large stocks to small ones in anticipation of the next easing cycle
- This is typical behavior, though exaggerated, with one of the most significant shifts in nearly 100 years
- In recent decades, one-week shifts into small caps, as we've seen lately, have coincided with sustained moves
A massive change in preferences
A benign inflation reading drastically changed investors' outlooks. When combined with offsides positioning, the report triggered a massive shift out of large stocks and into smaller ones.
The relationship has been one-sided for years, and many were expecting the rubber band to snap back at some point - just not all in one week.
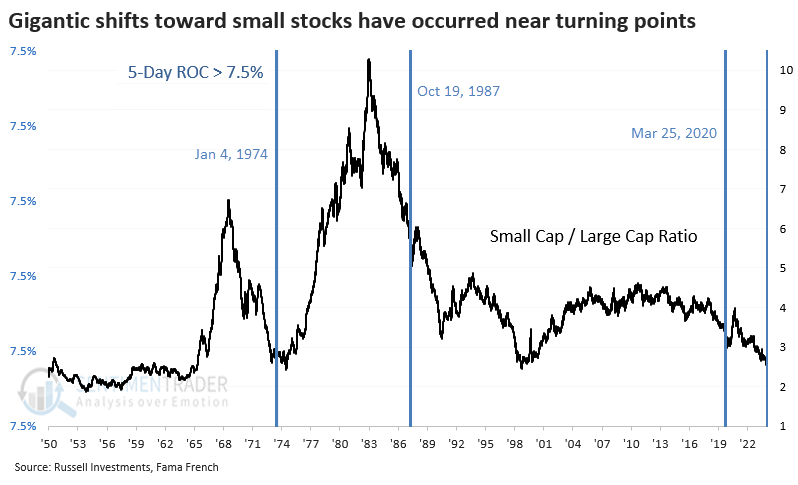
Over five days, the ratio of small-cap total return to large-cap total return jumped by nearly 10%. That's one of the largest shifts in nearly 100 years, especially considering more recent history, as the ratio was very volatile in the 1930s.
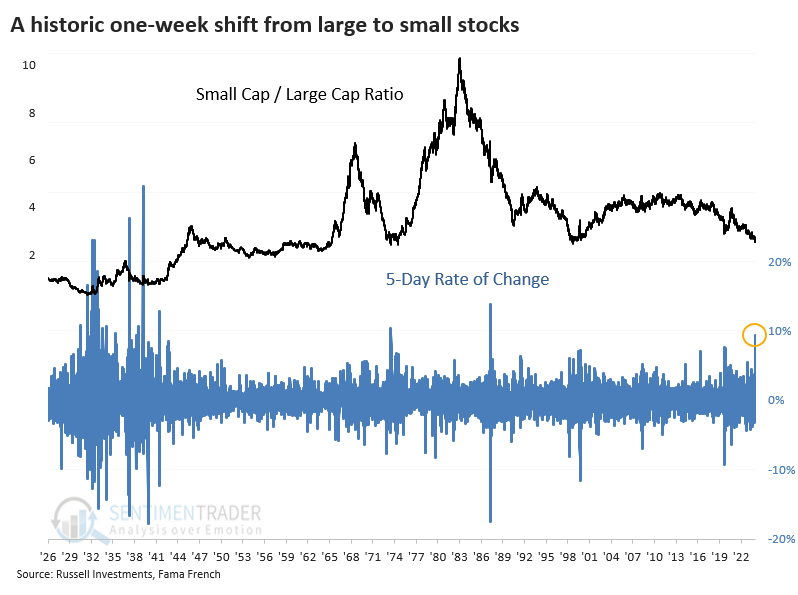
The chart below starts in 1950 and highlights the dates when the ratio shifted toward small caps by at least 7.5% over a week. It's pretty apparent from the chart that these were notable dates.
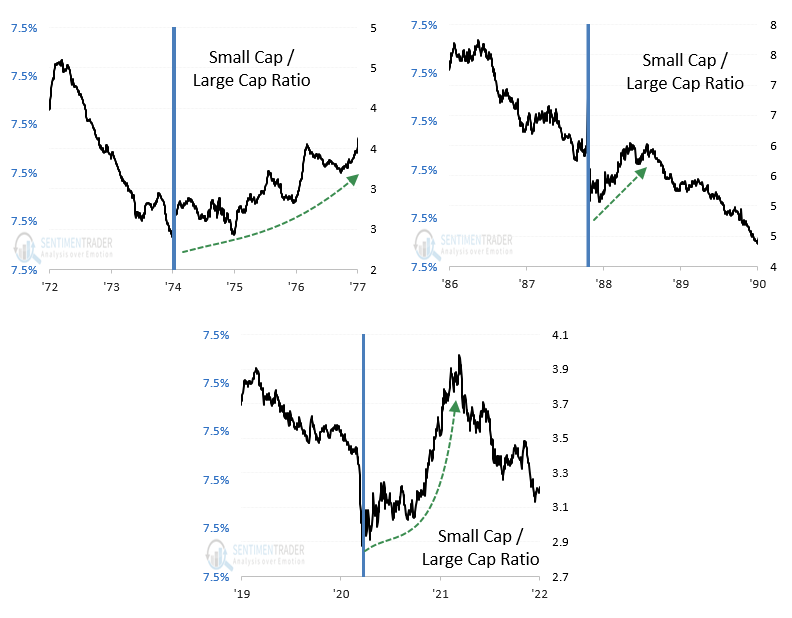
The thumbnails below zoom in on the three dates. We can see that the ratio suffered some volatility in the weeks after the dramatic shift. However, all three preceded months (at least) of investors finding a renewed preference for smaller stocks.
Smaller shifts tended to be fake-outs
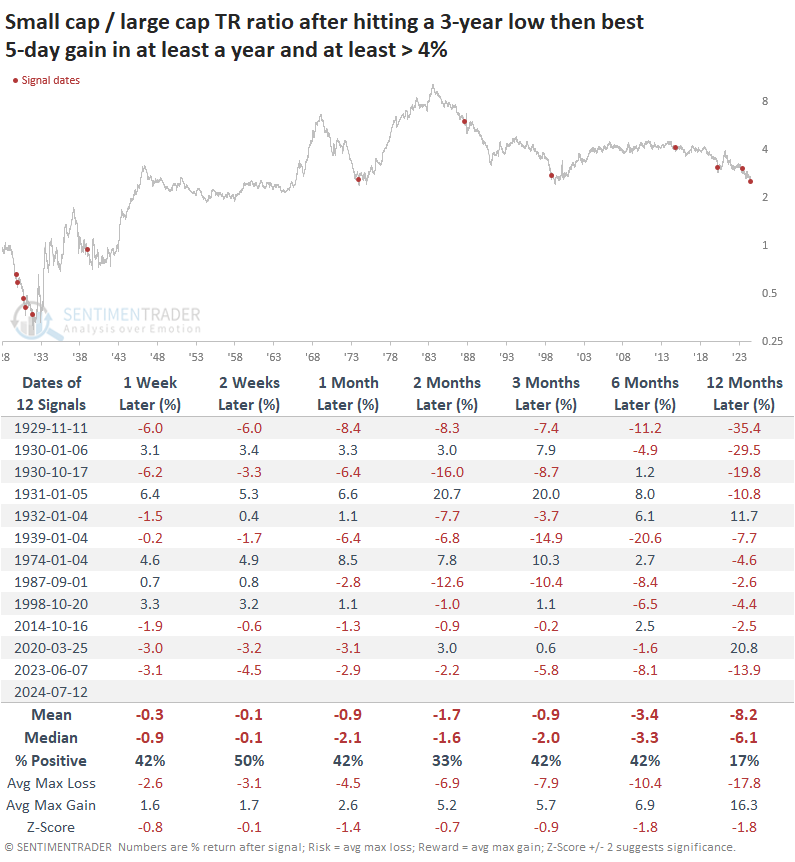
It's hard to have much confidence in a sample size of three, so the table below expands the sample by relaxing the parameters. It shows how the small cap / large cap ratio fared after it fell to a multi-year low. Then, there was a 5-day shift of at least 4%, which was the largest in at least a year.
These were mostly fake-outs. In the weeks and months ahead, a sustained shift toward smaller stocks was rare.
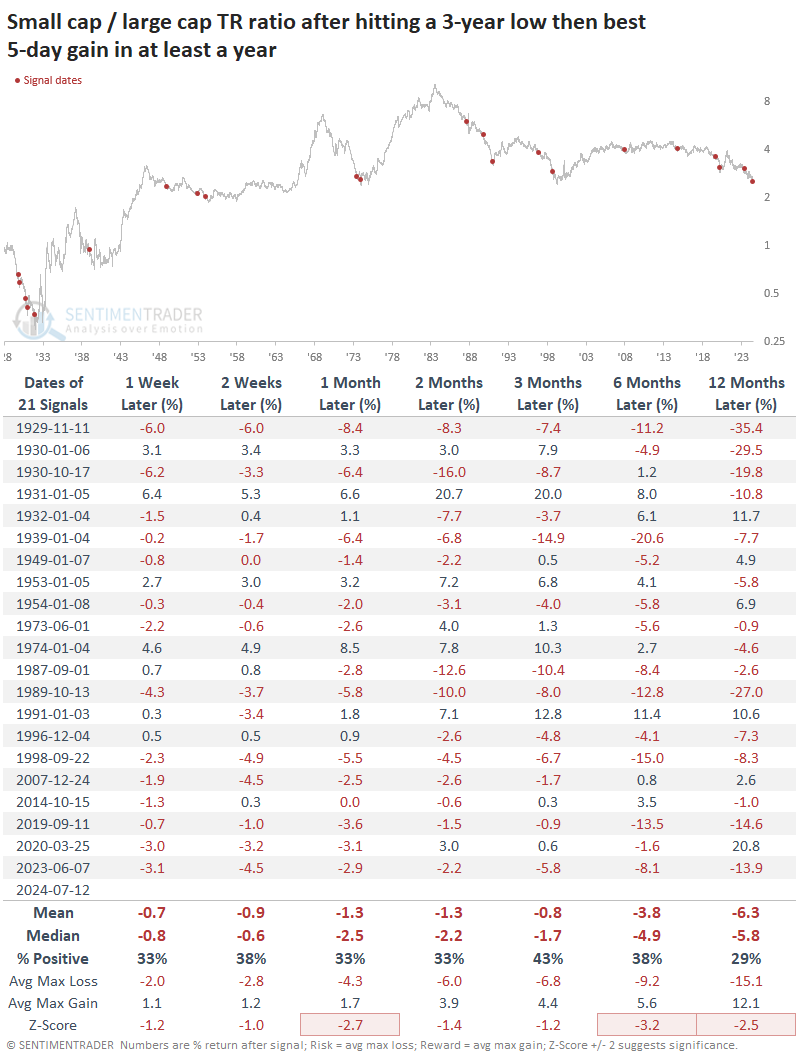
The following table relaxes the parameters further by looking at the most significant shift toward smaller stocks in at least a year (not requiring a gain of at least 4%). Again, the same conclusion holds - moderate shifts in the ratio were much more likely to be a fake-out than a change in trend.
What the research tells us...
For those looking for smaller stocks to finally have their time in the spotlight, there have been multiple false starts in recent years. While the post-pandemic rally showed the greatest promise, it, too, rolled over and frustrated those holding anything other than stocks with hefty market caps.
Federal Reserve easing cycles have generally helped smaller stocks over larger ones, with peaks in the Fed Funds Rate roughly coinciding with some crucial bottoms in the ratio of small caps to large caps. As investors anticipate the next easing cycle, they have kick-started this shift dramatically. The adjustment was so substantial that there are few precedents, but from what we can draw from them, there seems to be a good chance that it can last for several months at least.
Indicators at Extremes
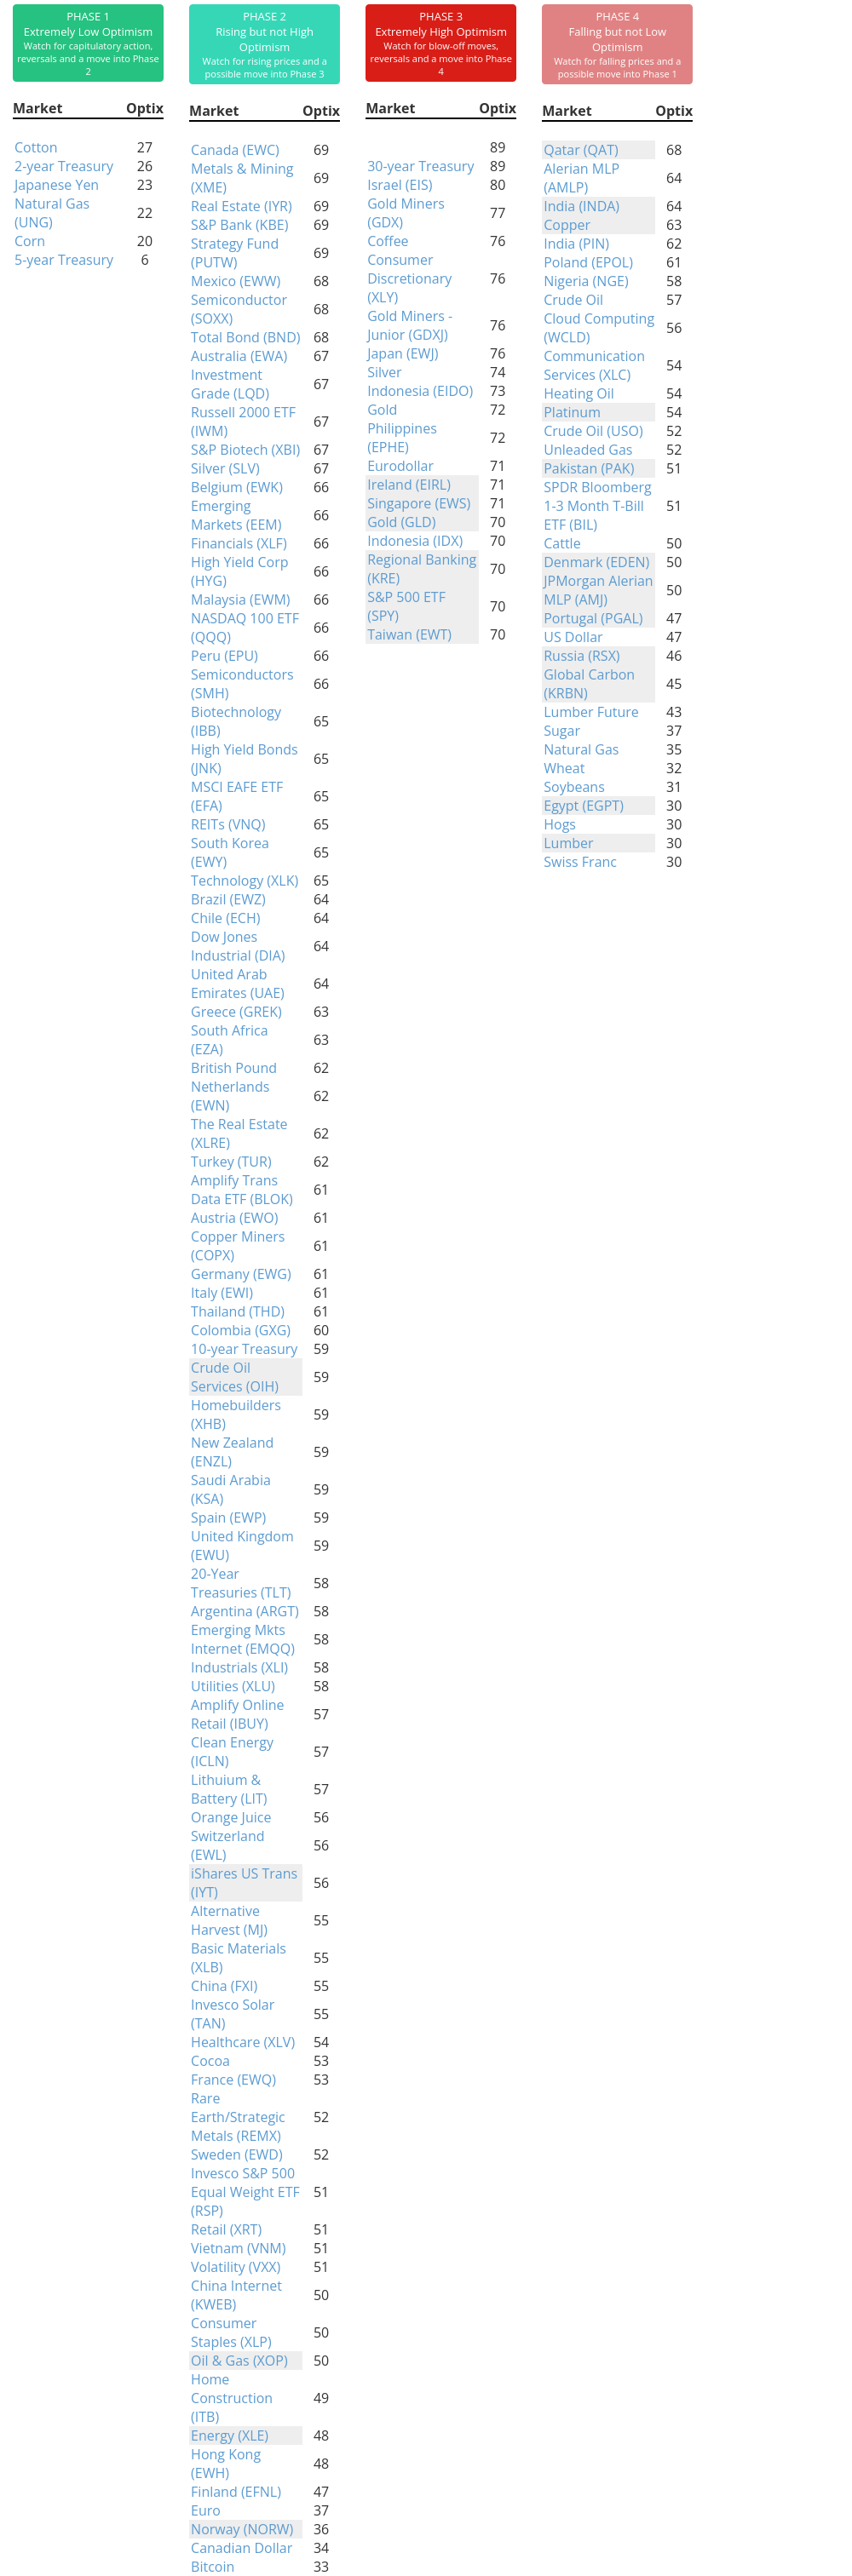
Phase Table
Ranks
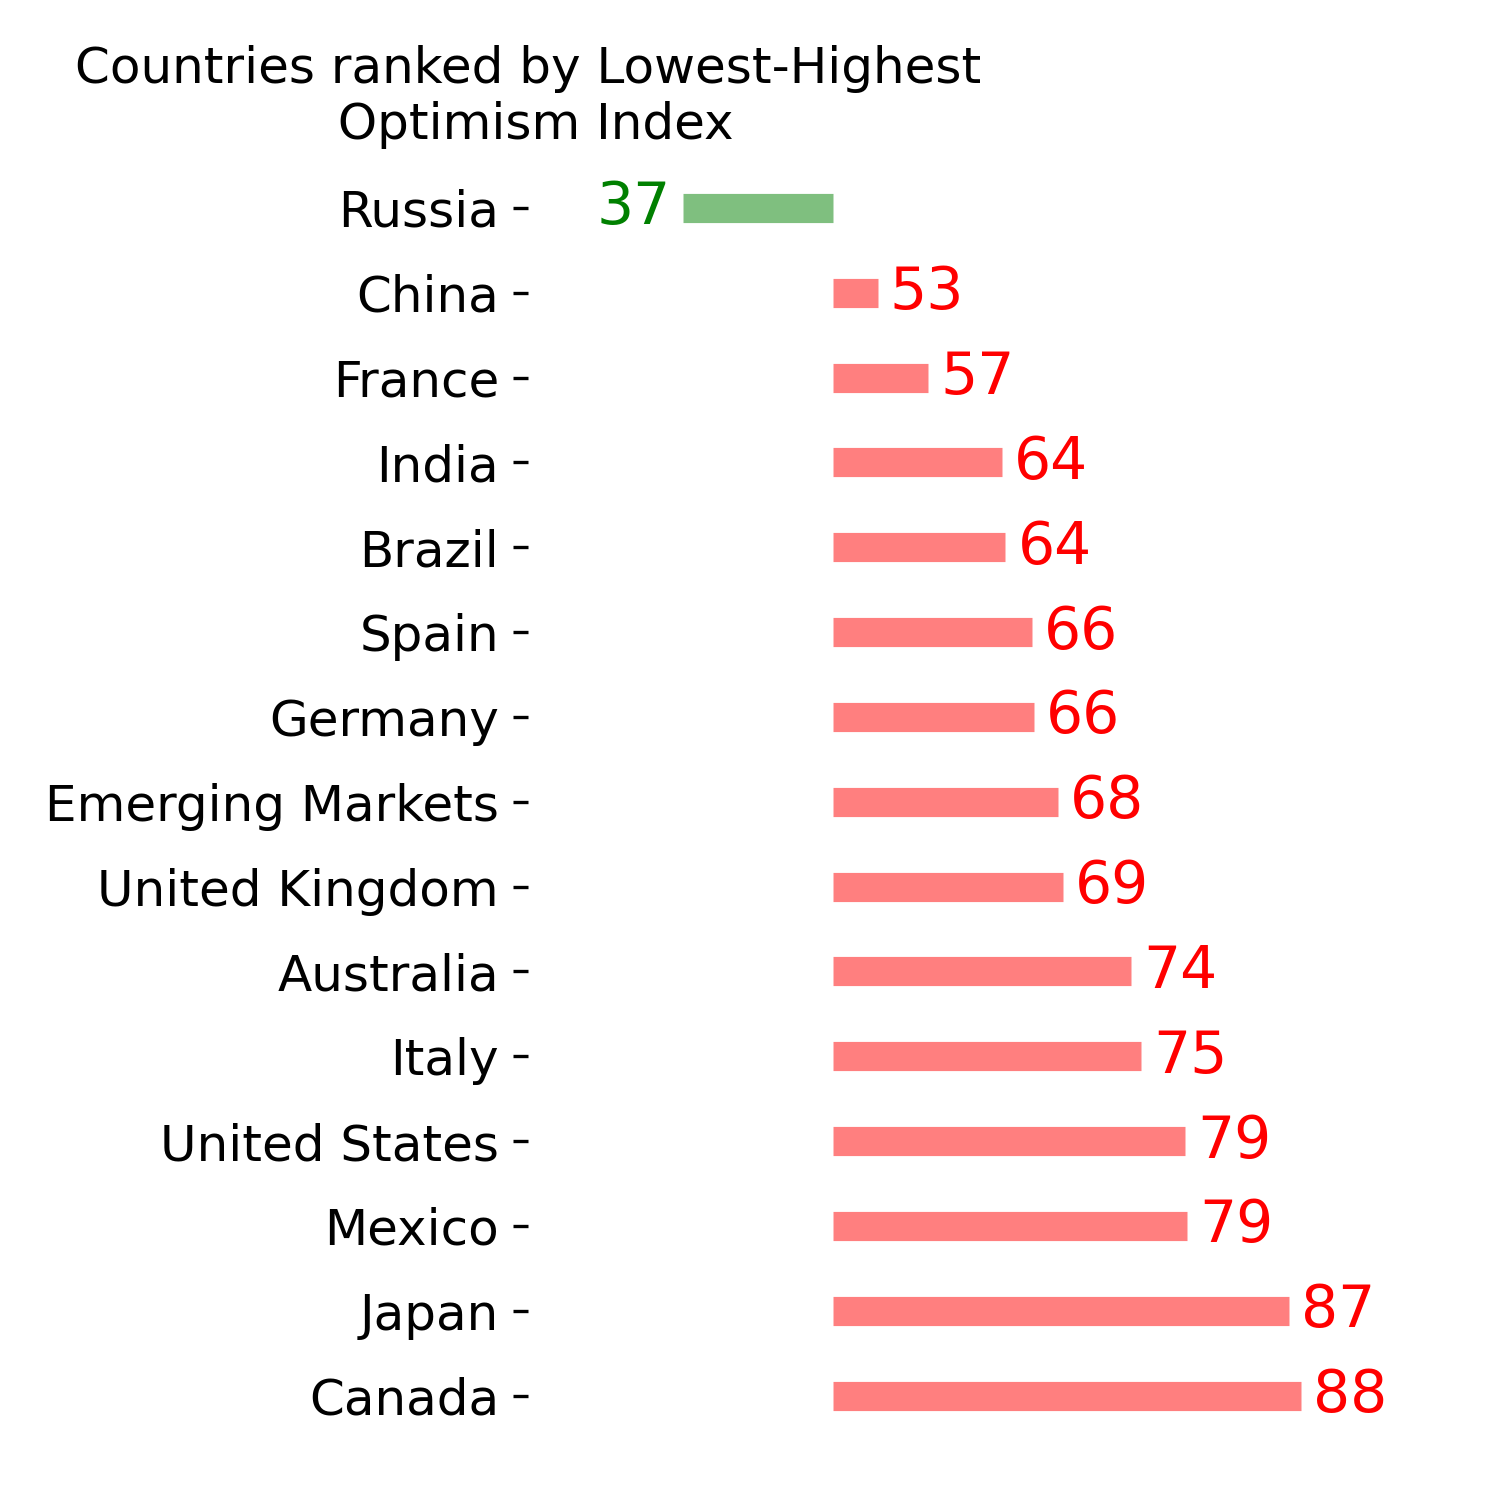
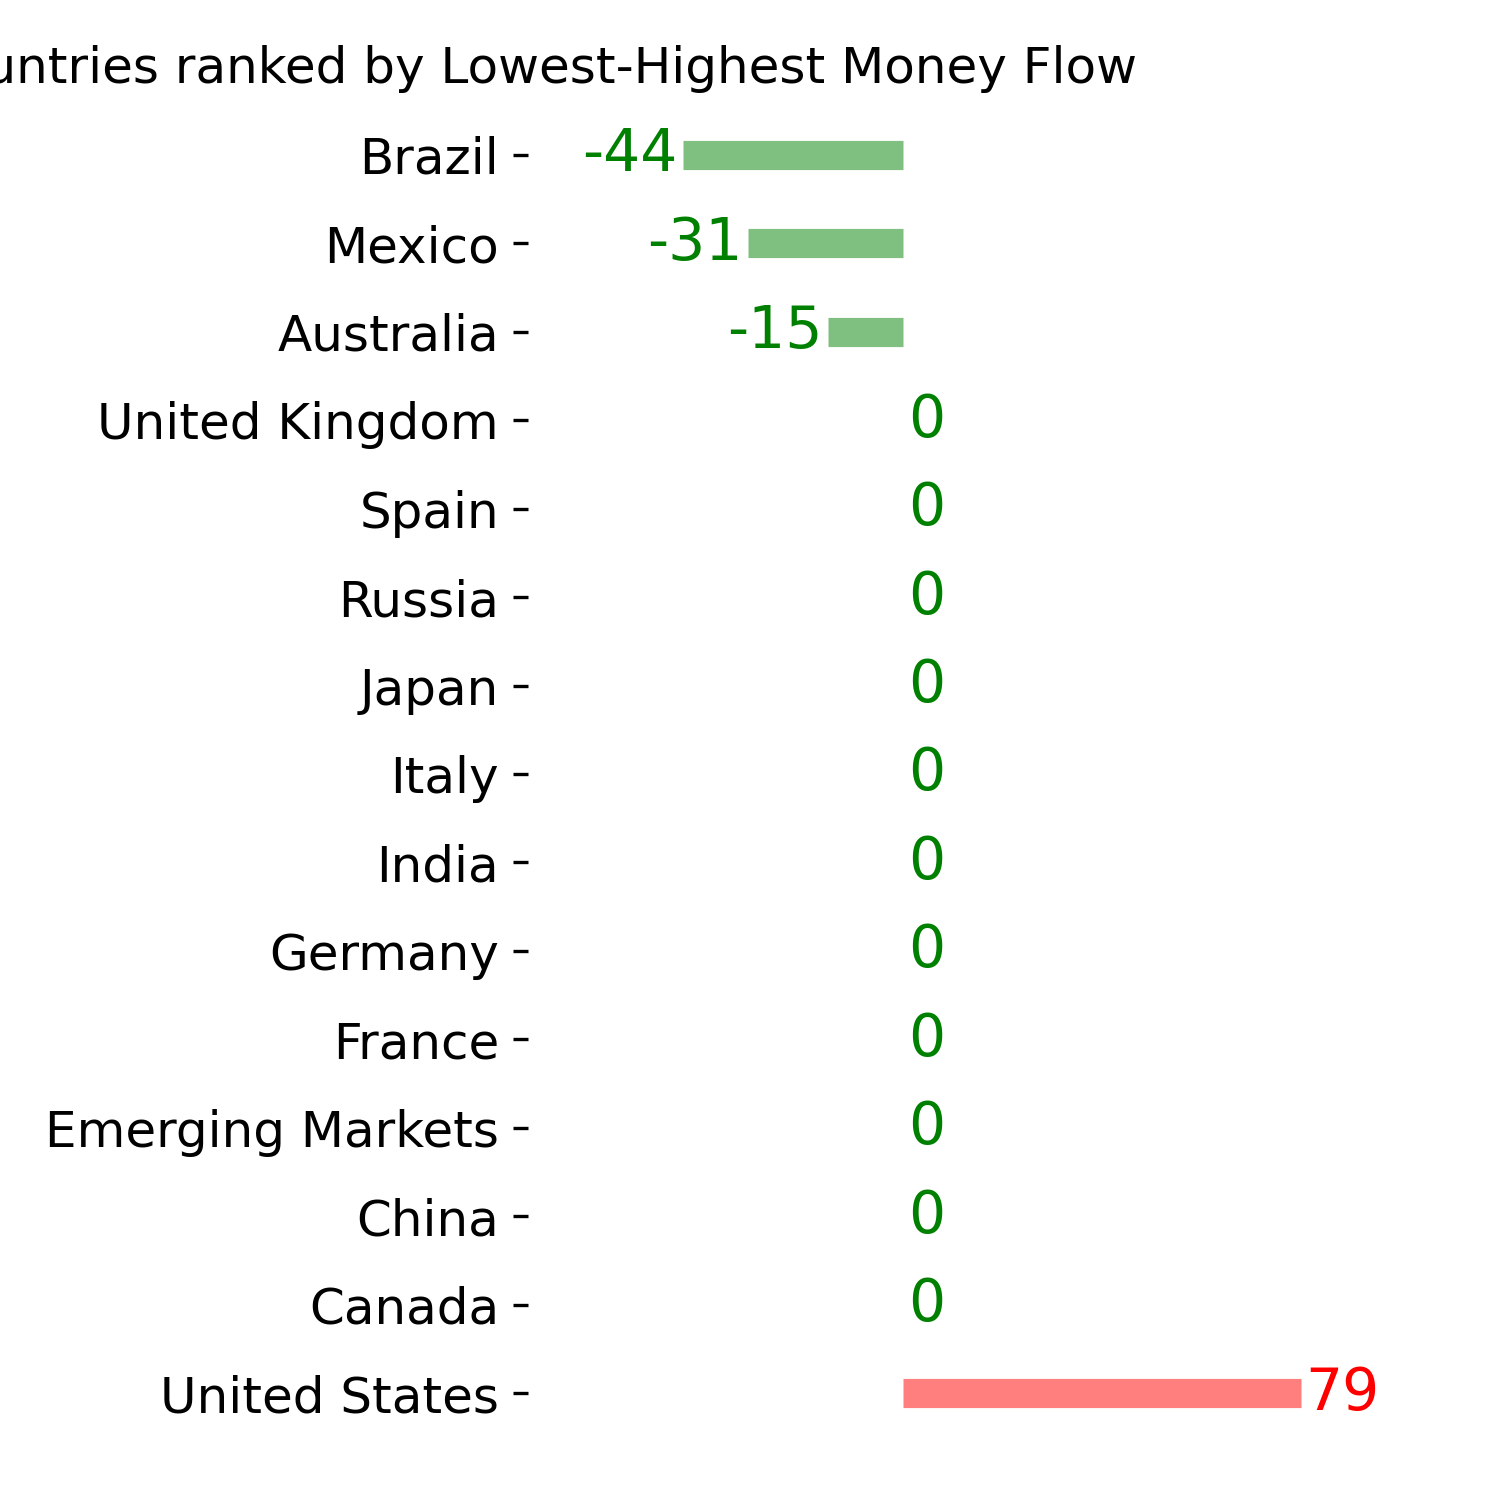
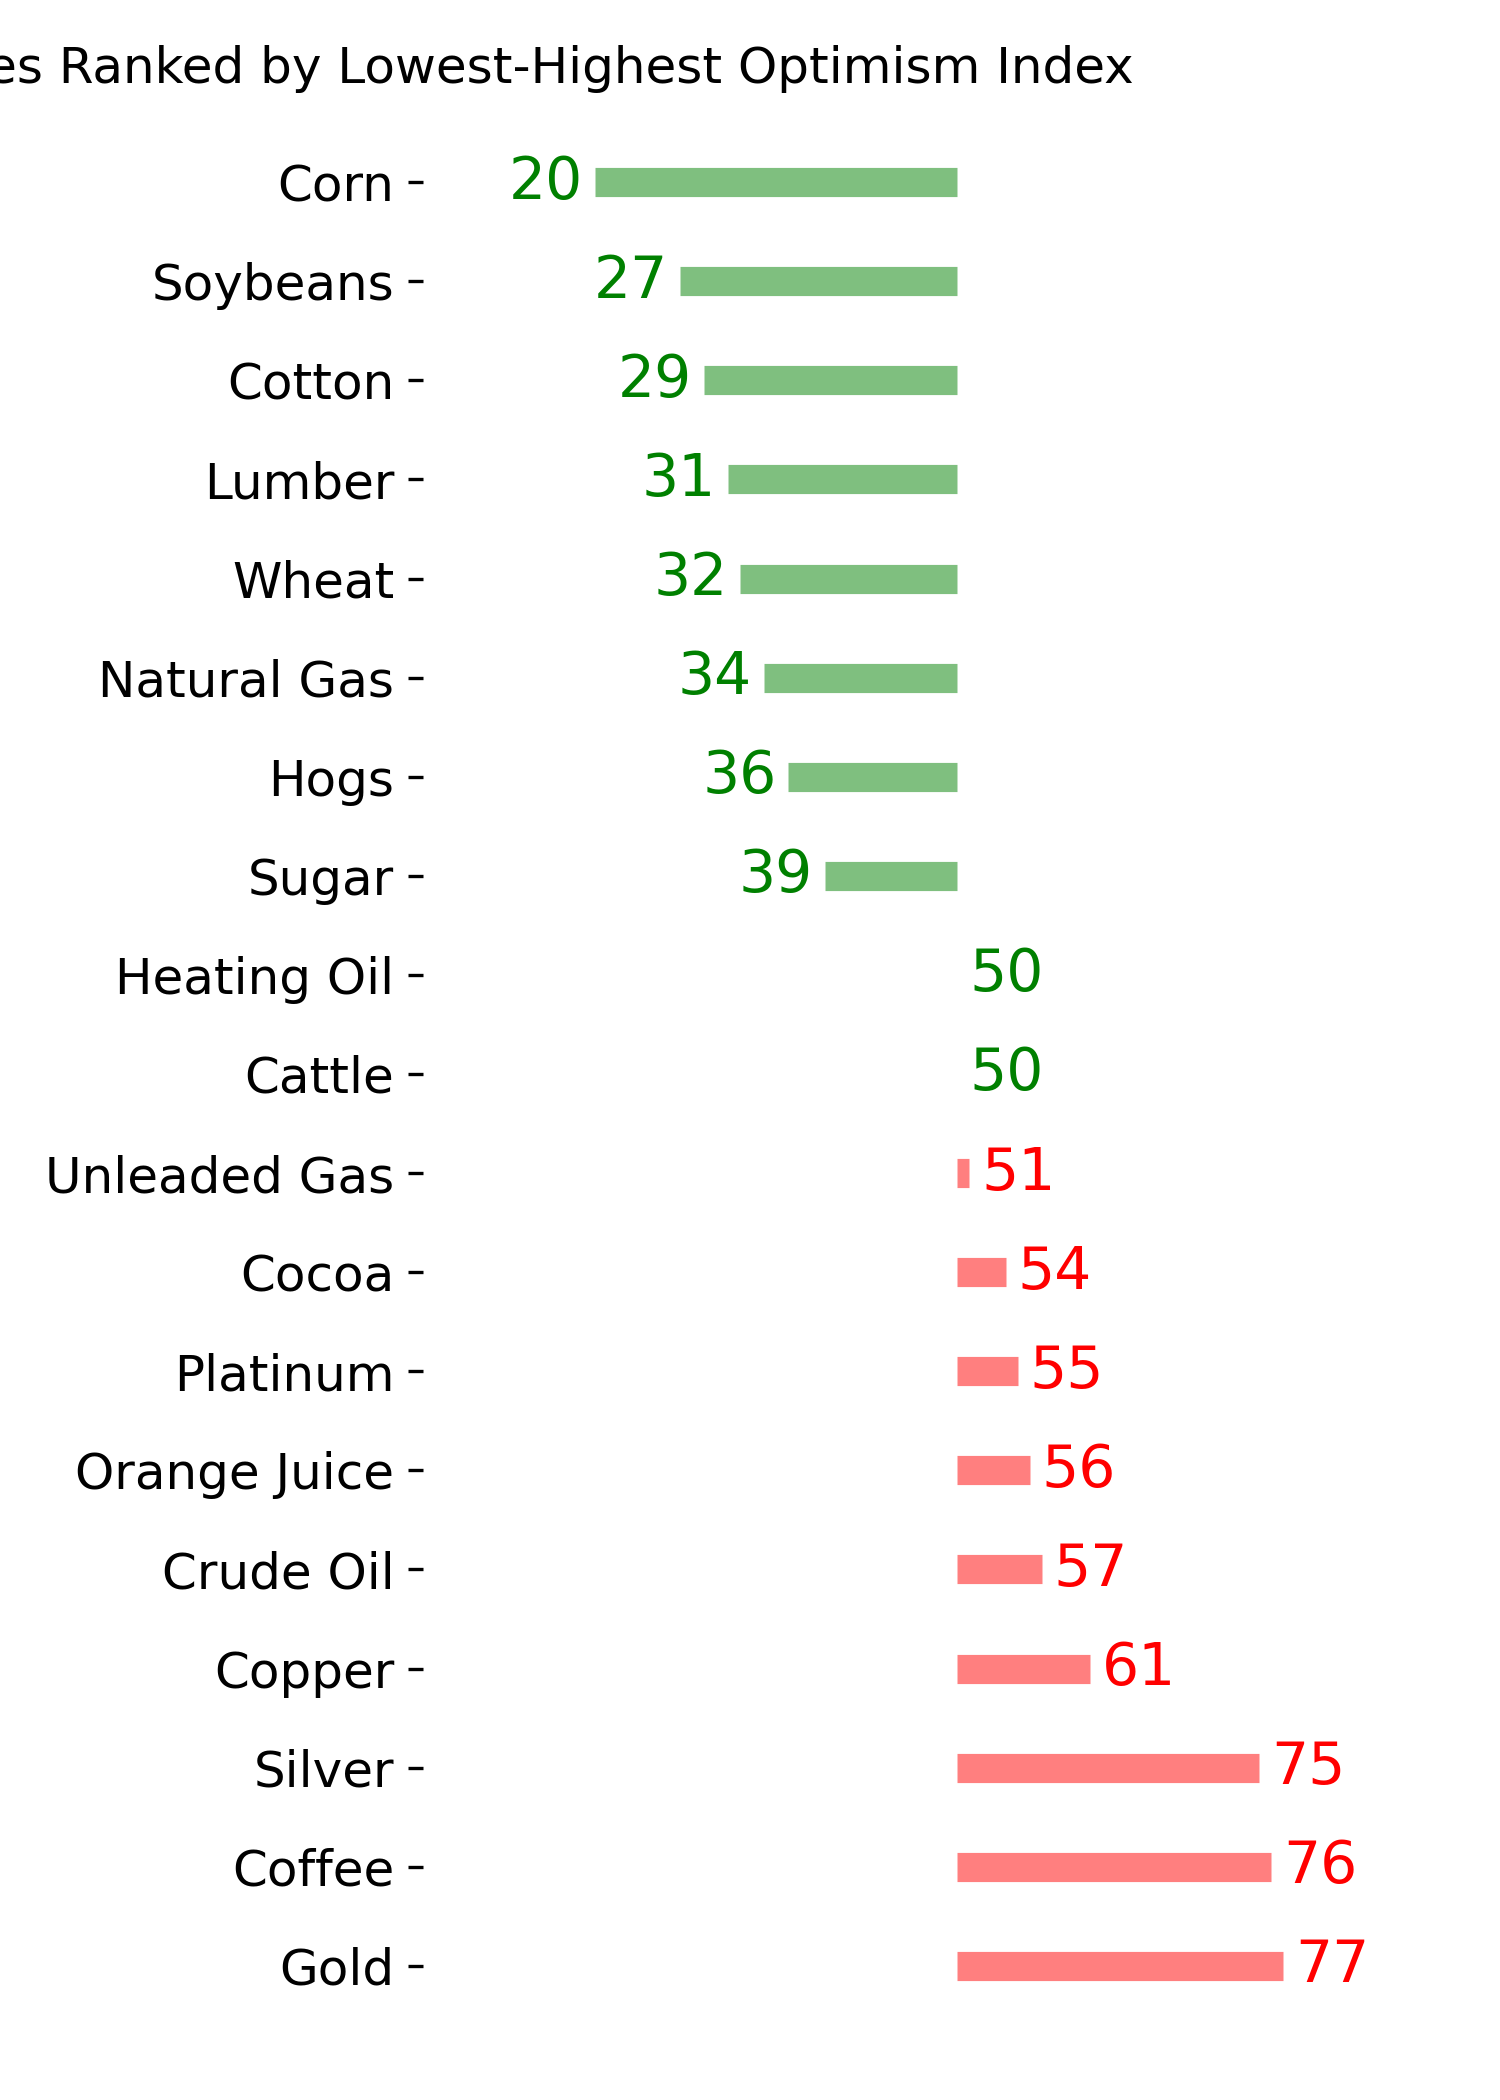
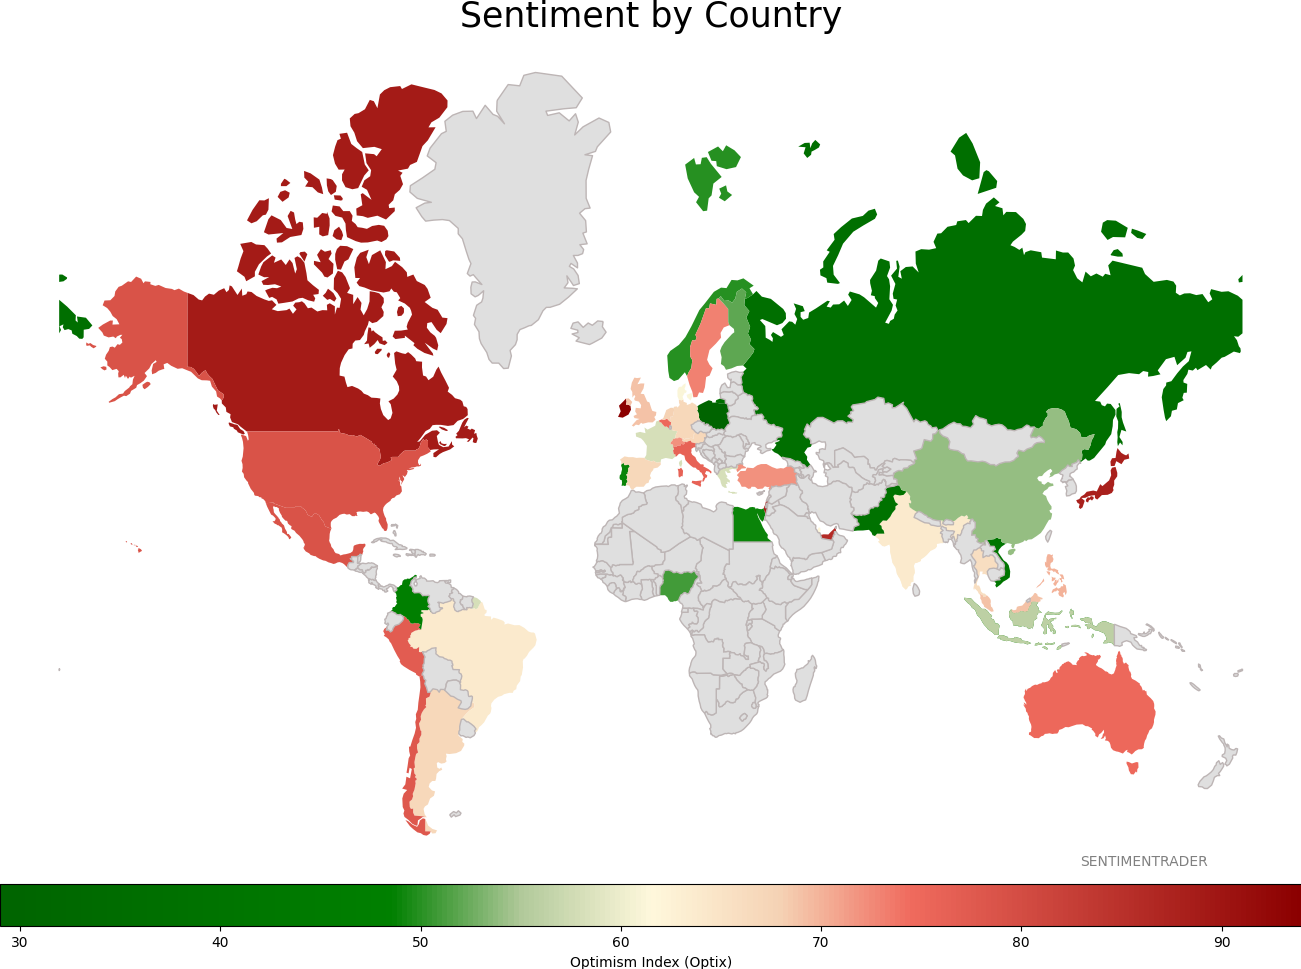
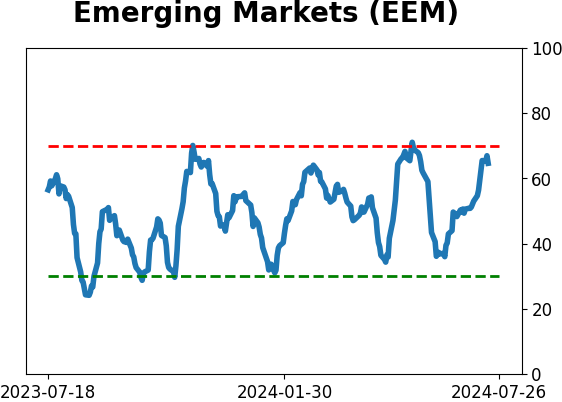
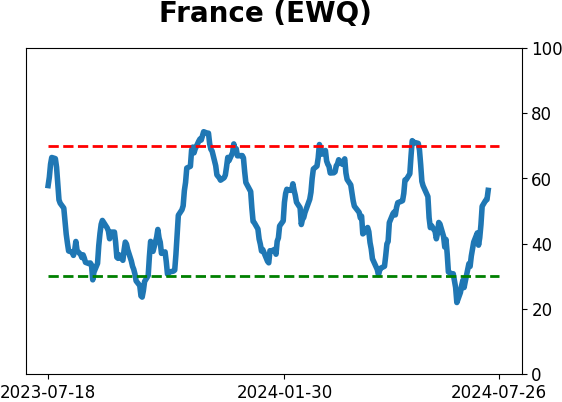
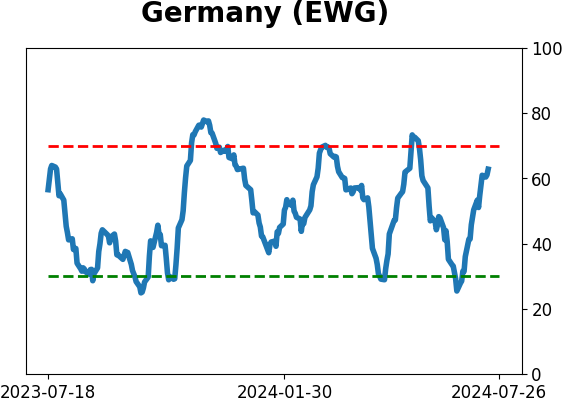
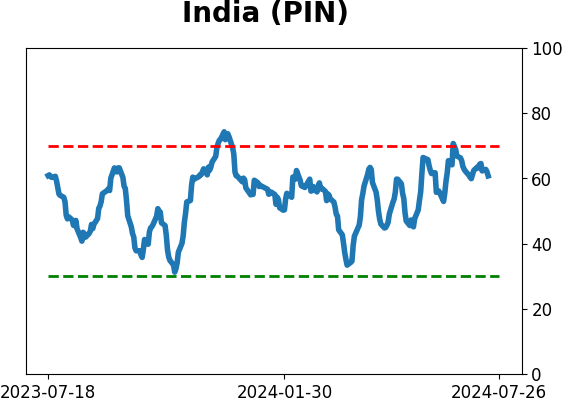
Sentiment Around The World
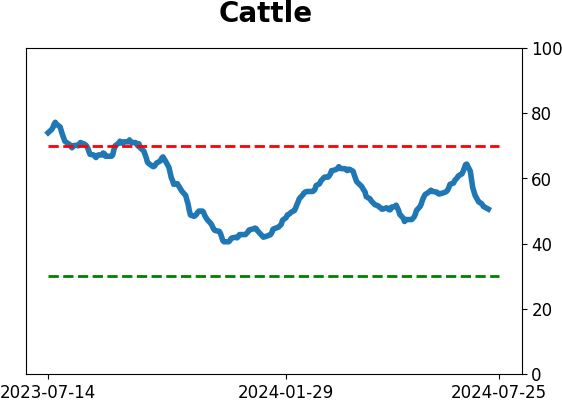
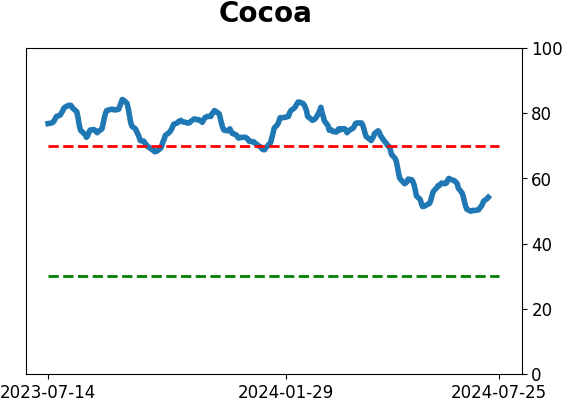
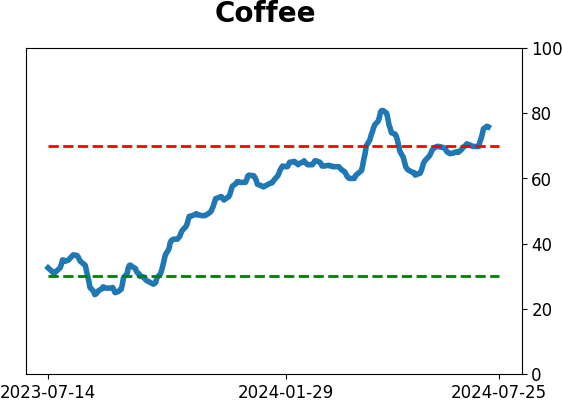
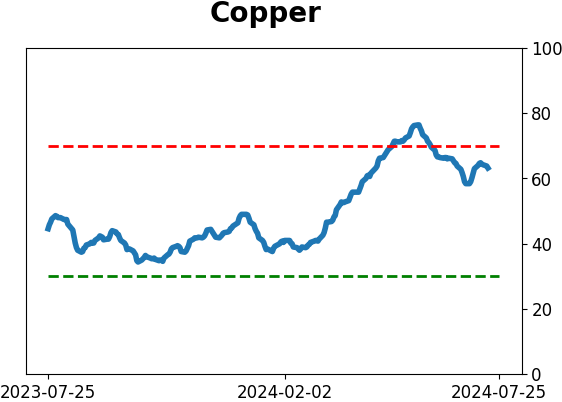
Optimism Index Thumbnails
|
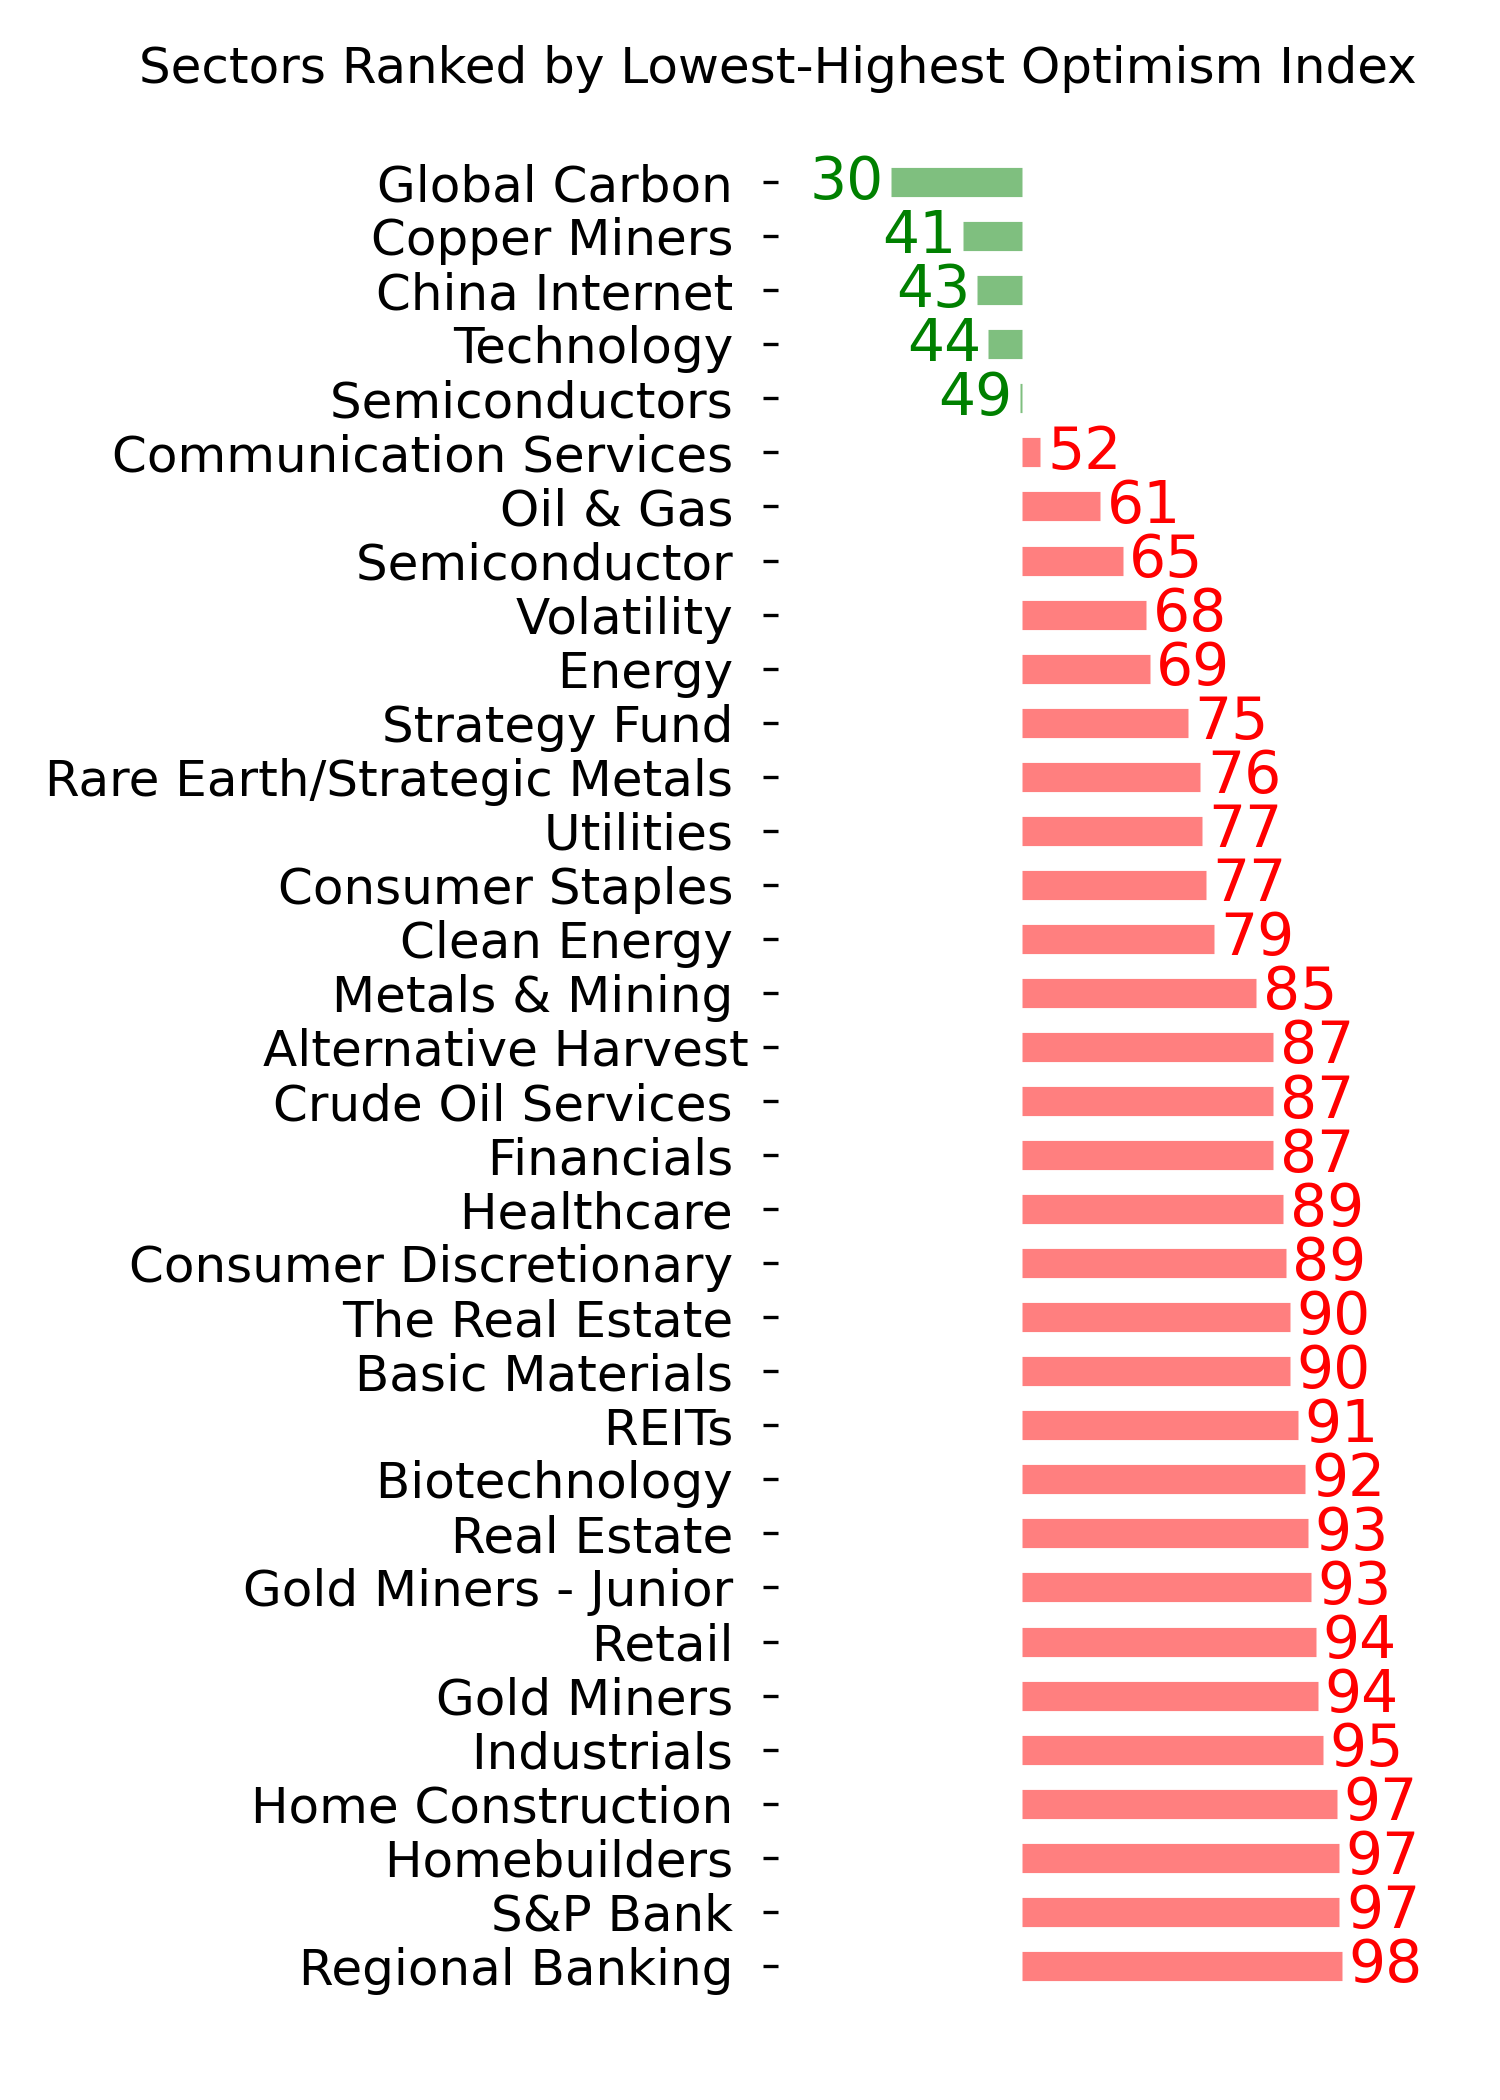
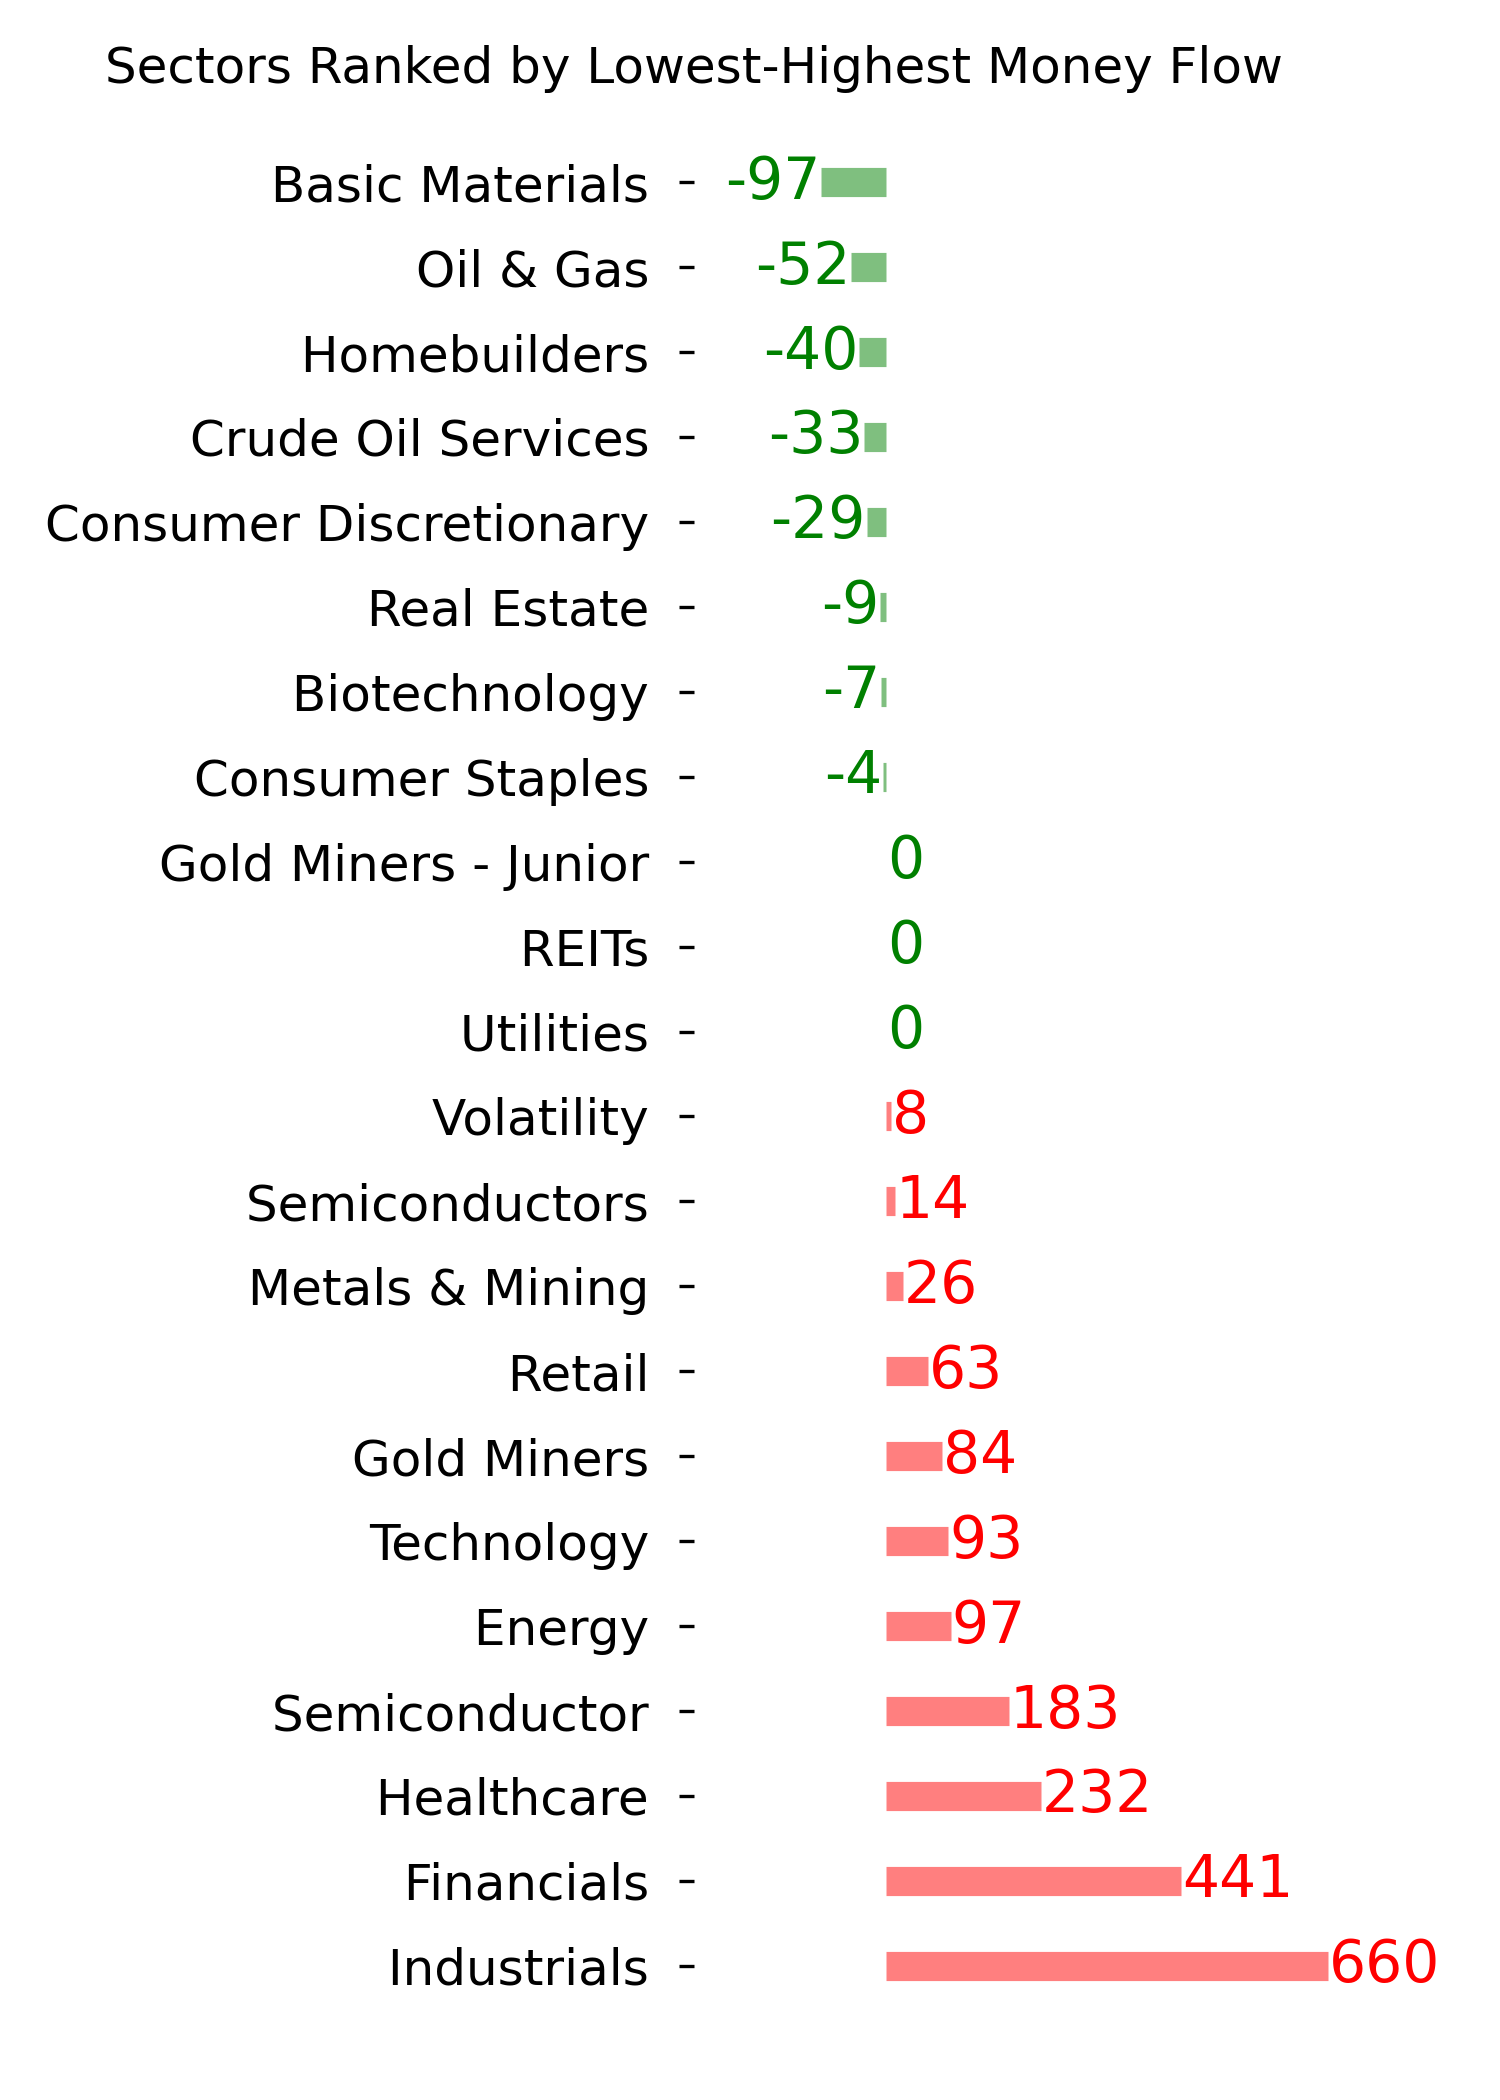
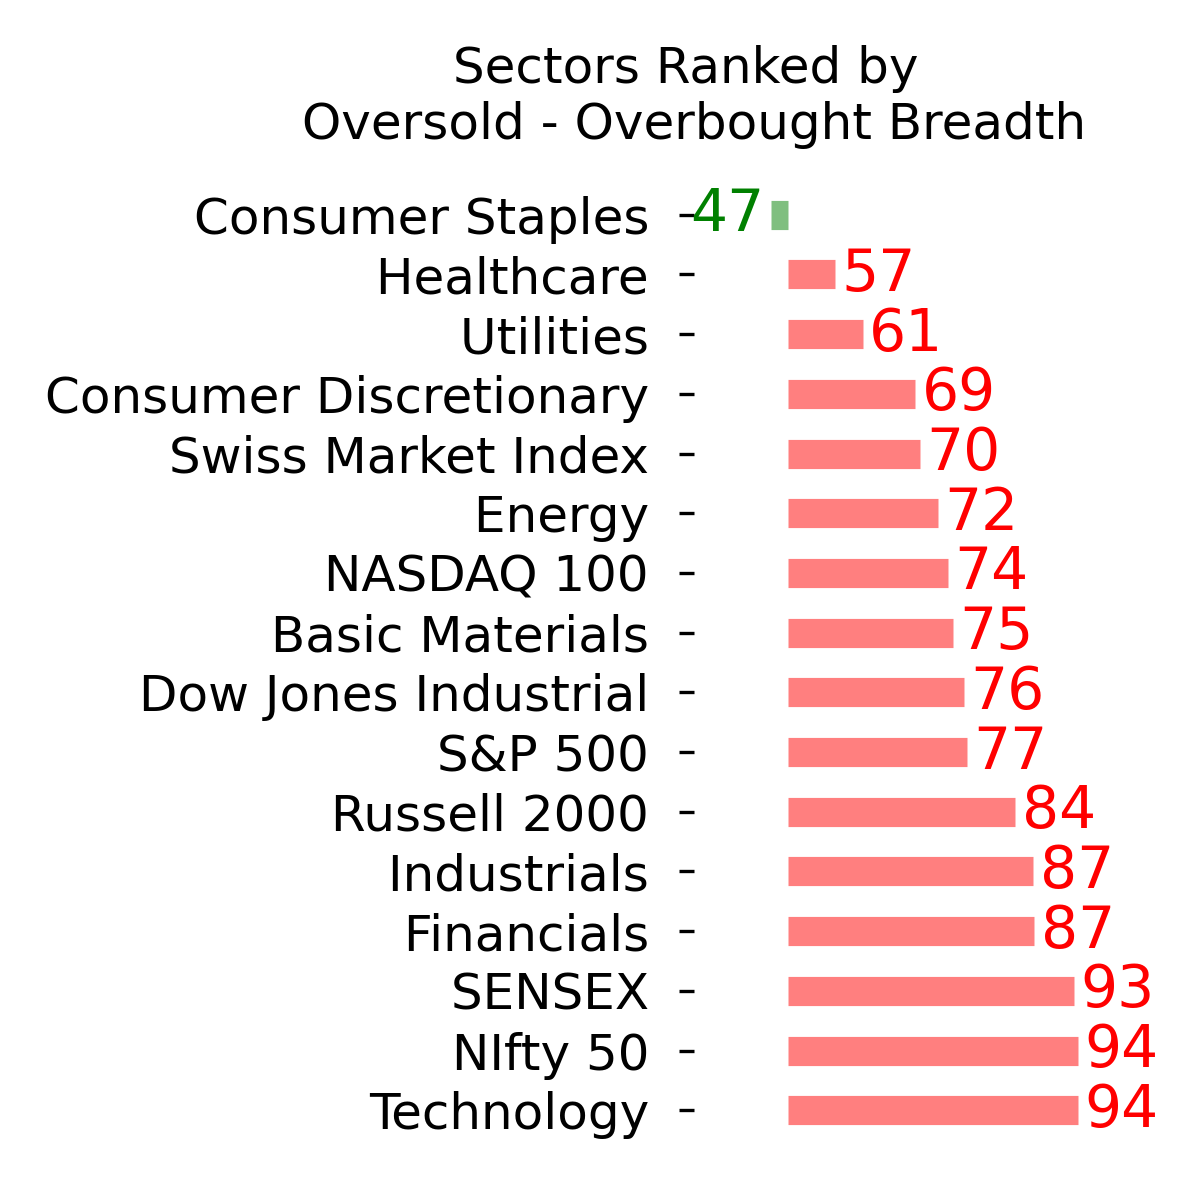
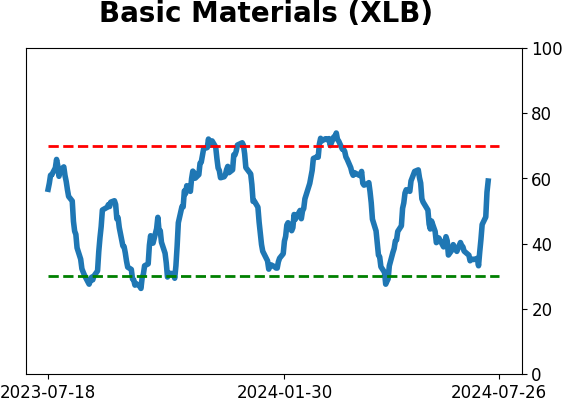
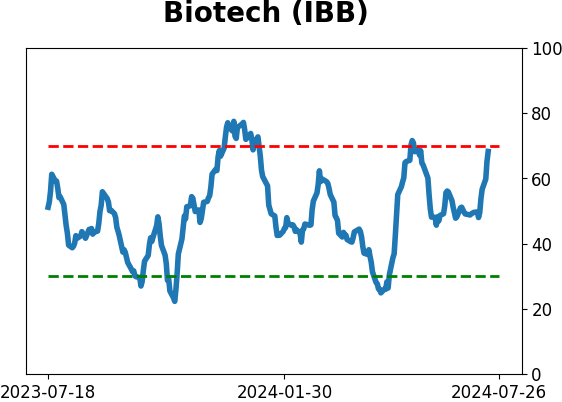
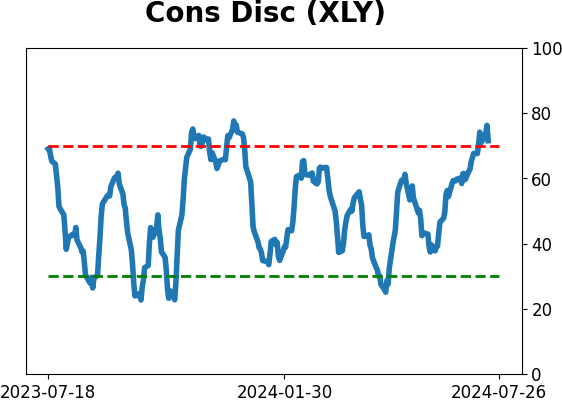
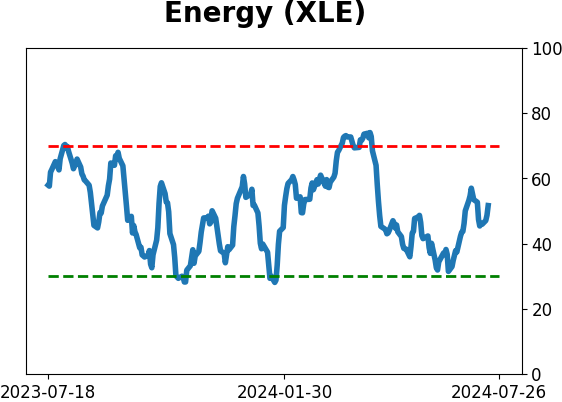
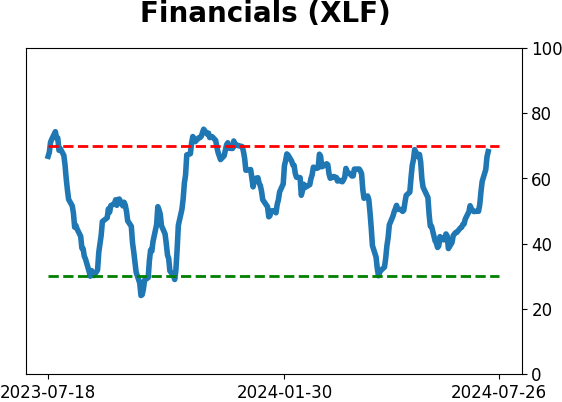
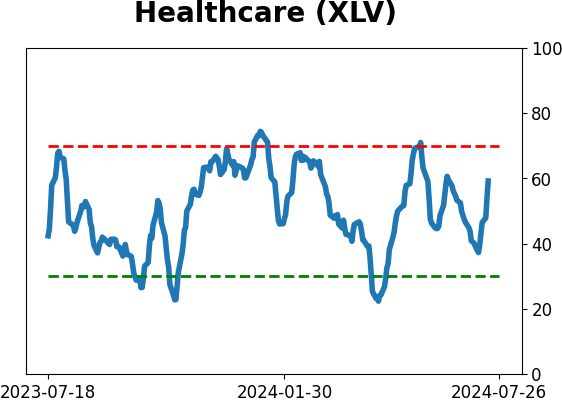
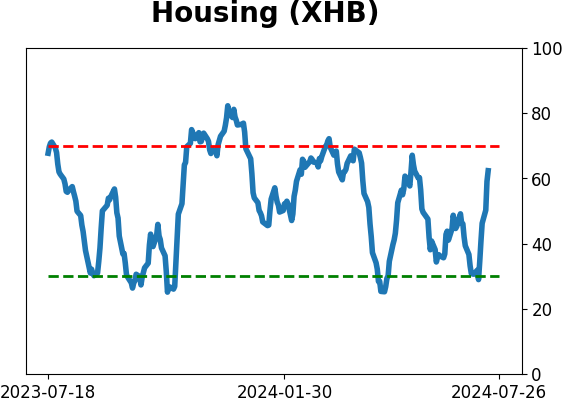
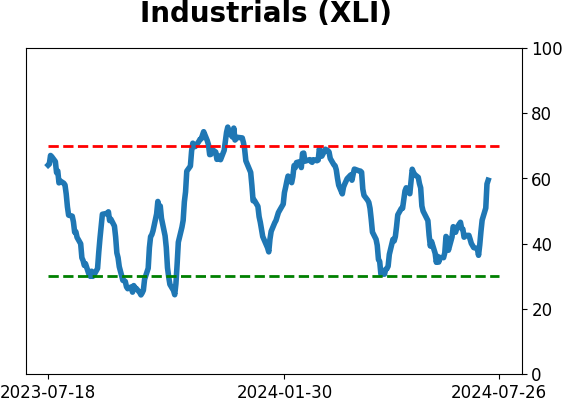
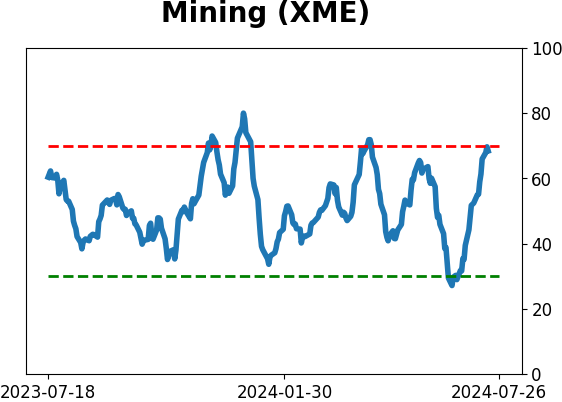
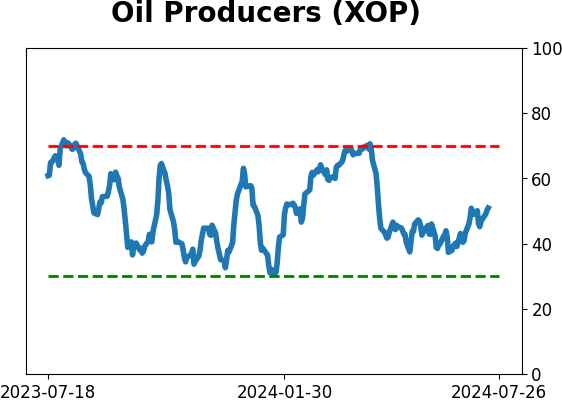
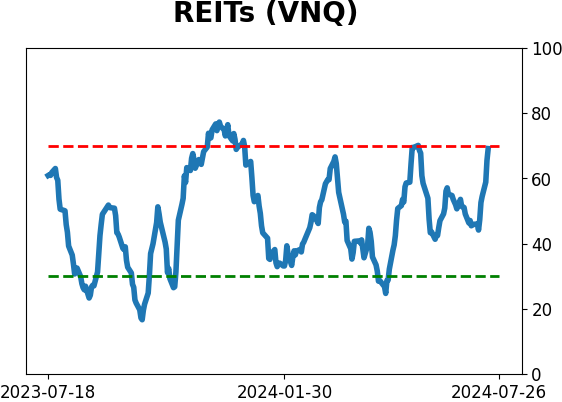
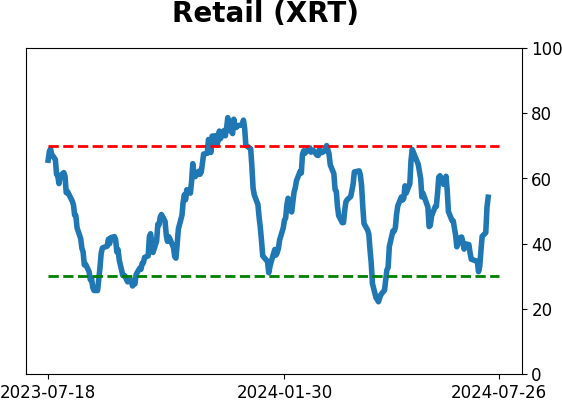
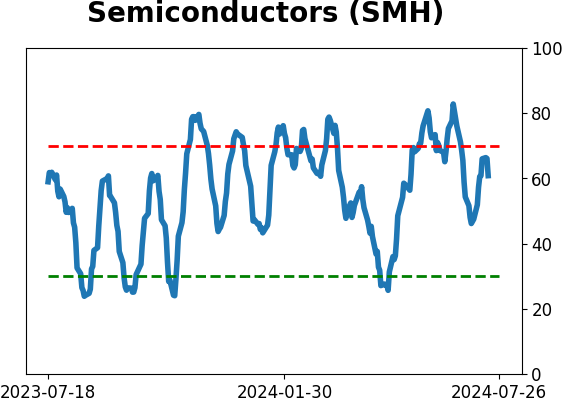
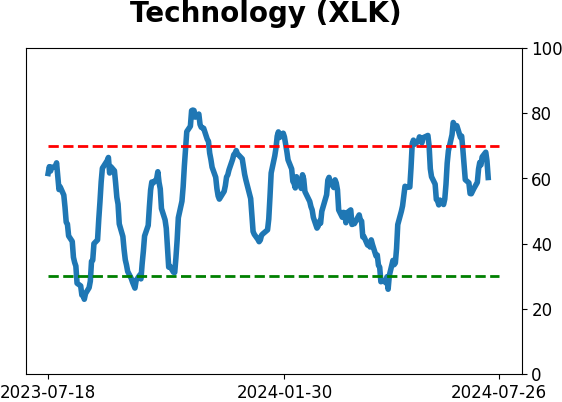
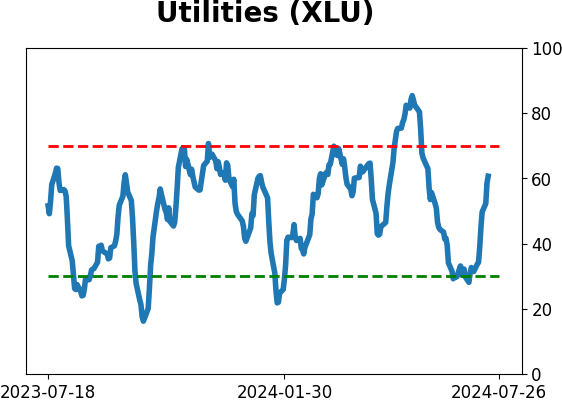
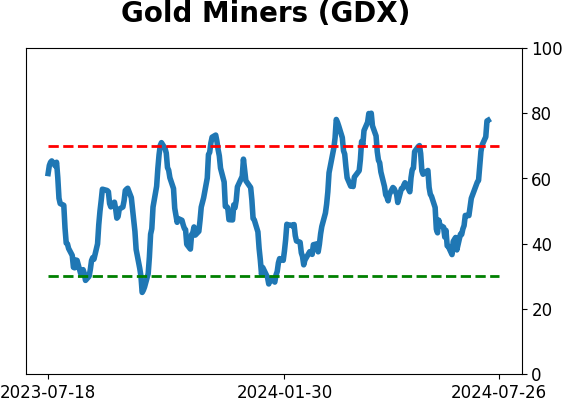
Sector ETF's - 10-Day Moving Average
|
|
|
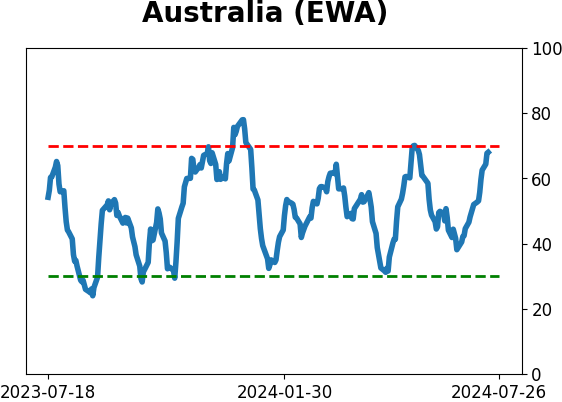
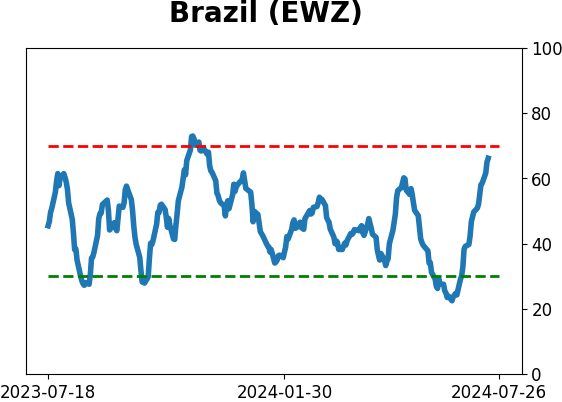
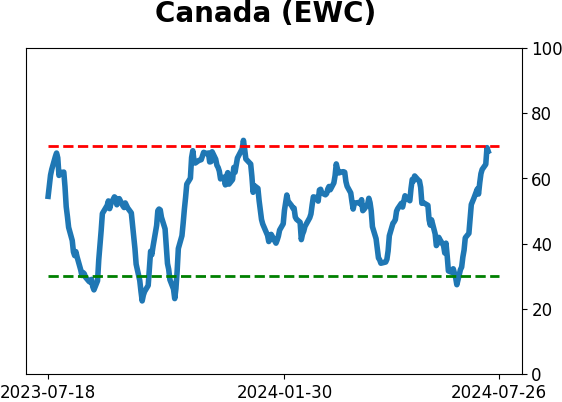
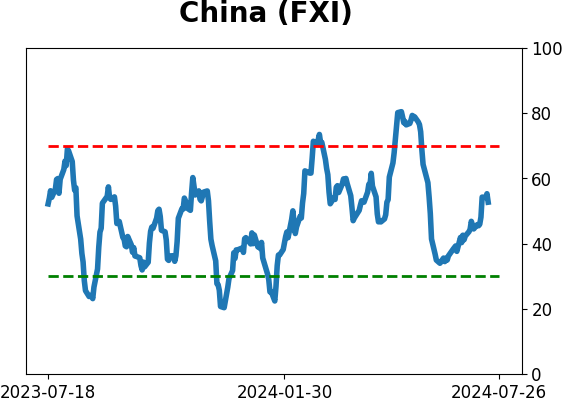
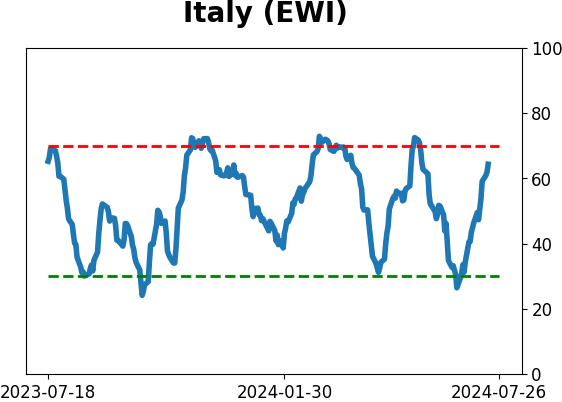
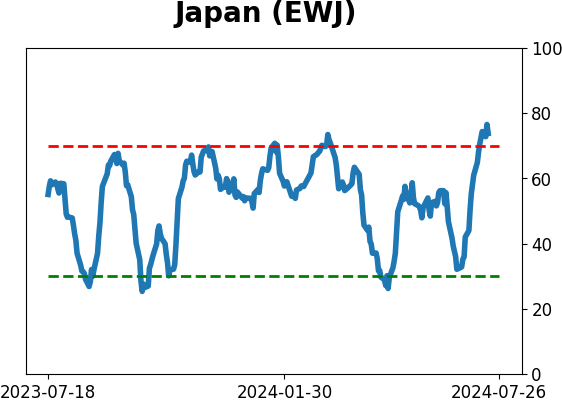
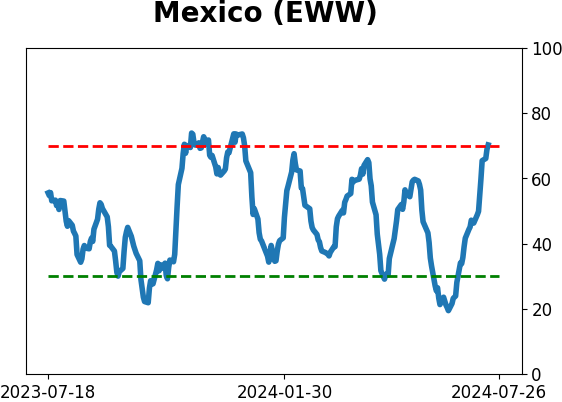
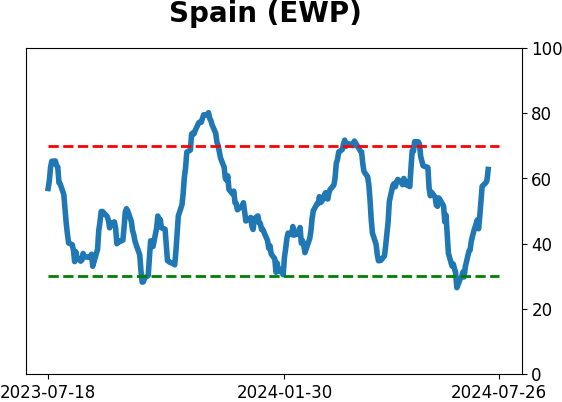
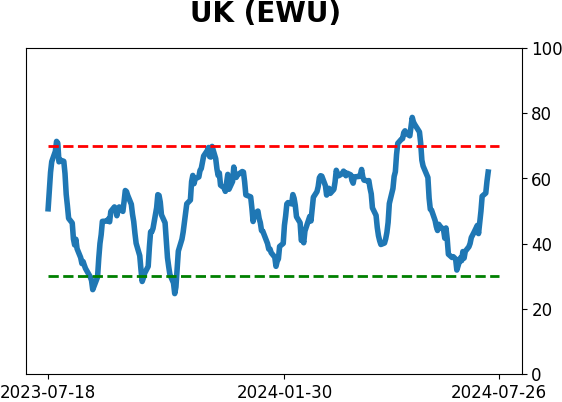
Country ETF's - 10-Day Moving Average
|
|
|
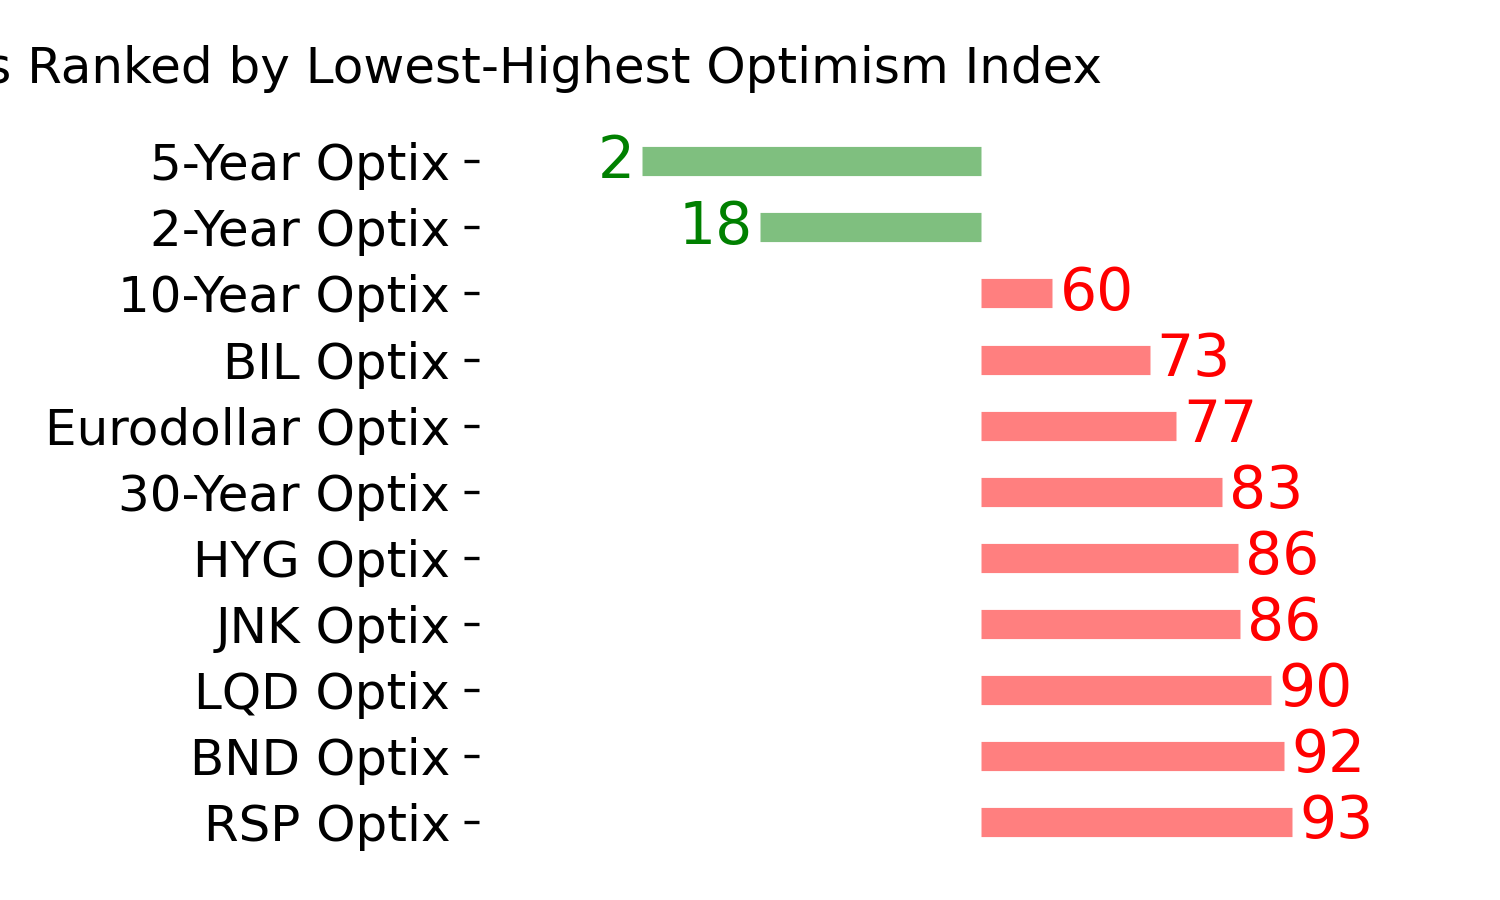
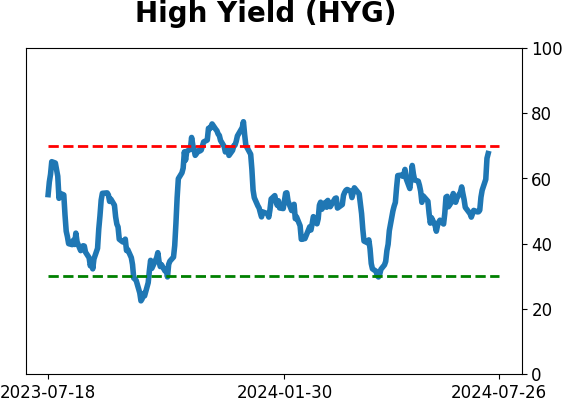
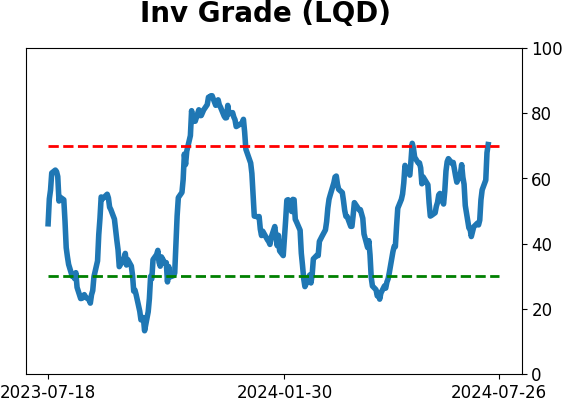
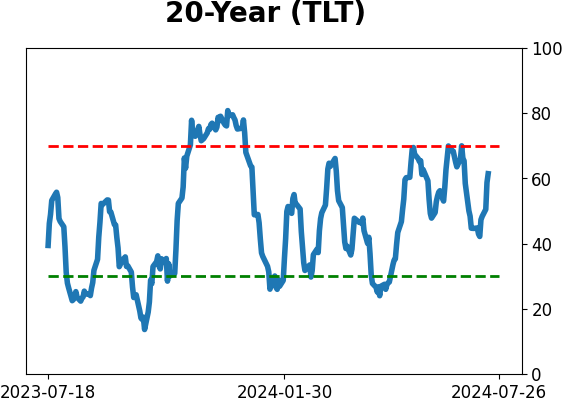
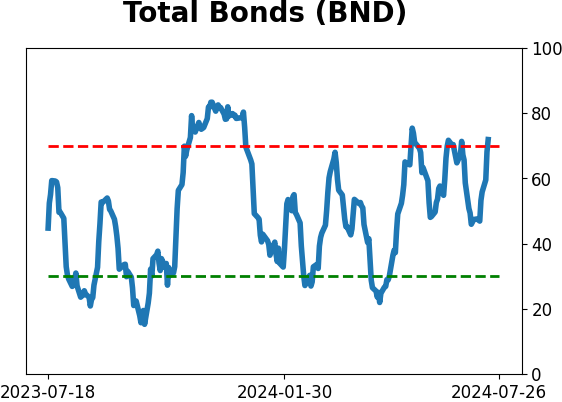
Bond ETF's - 10-Day Moving Average
|
|
|
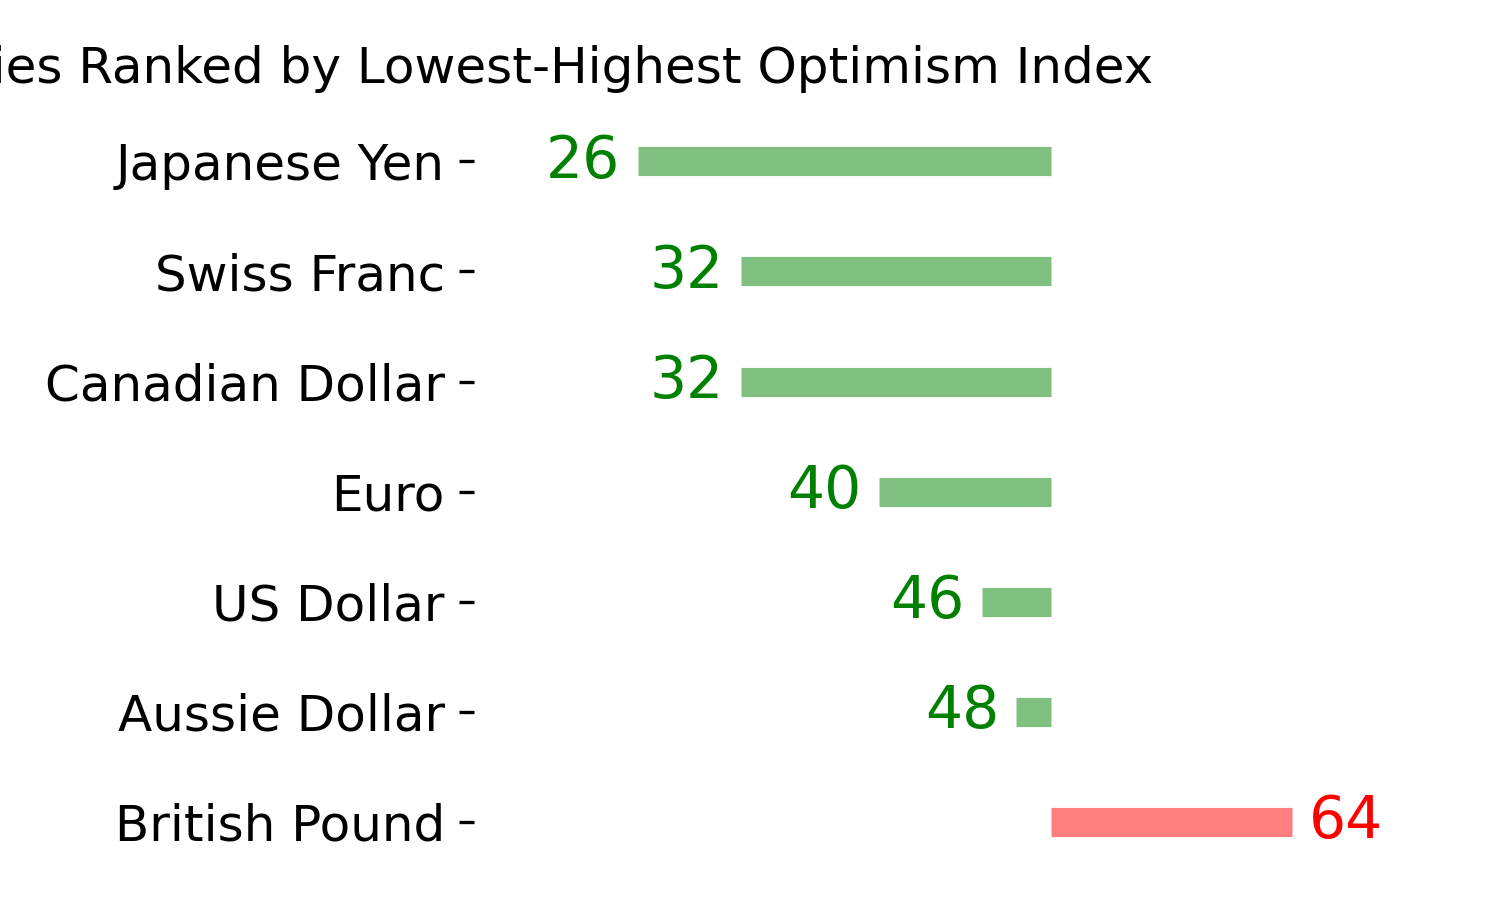
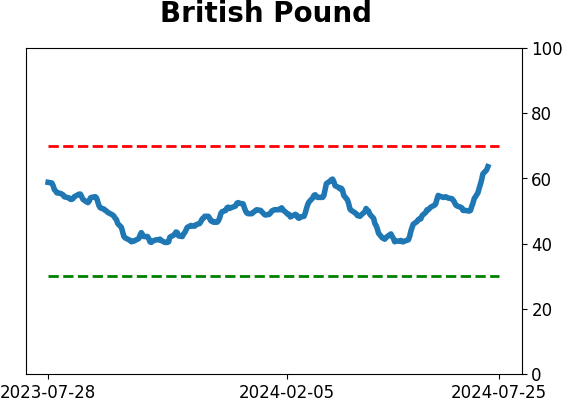
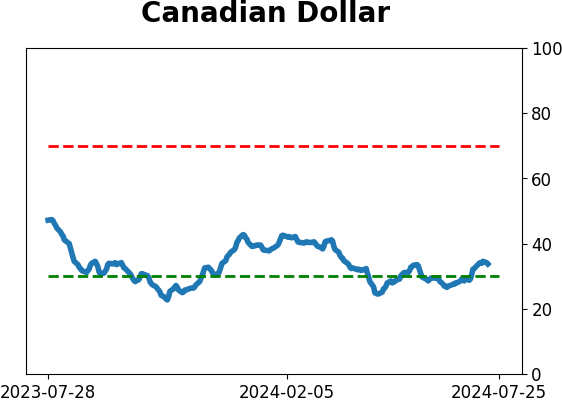
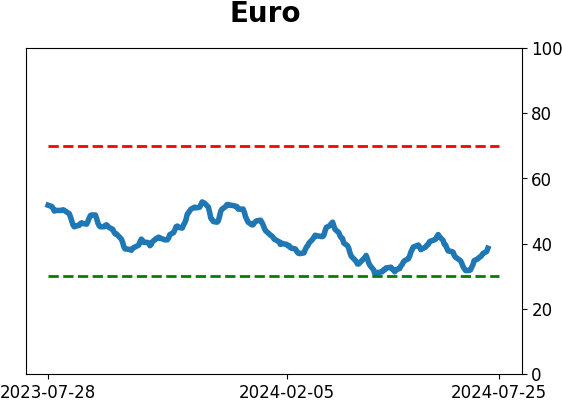
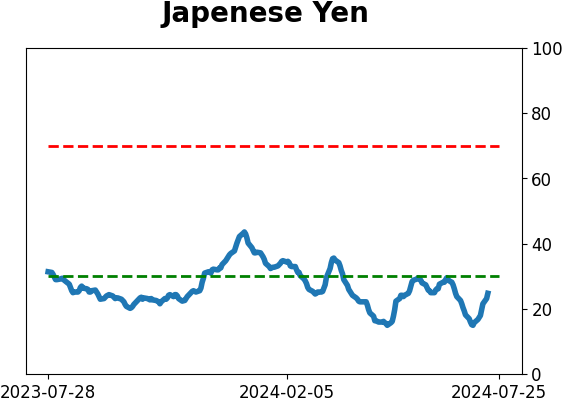
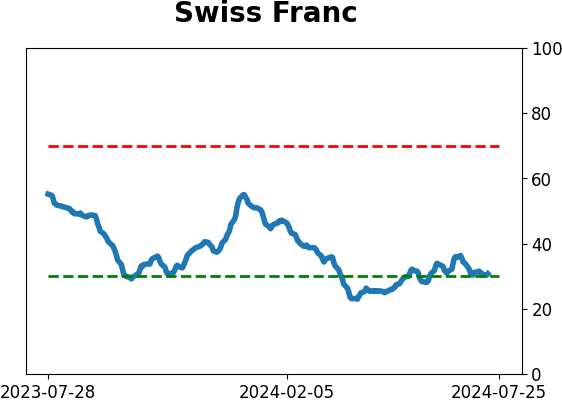
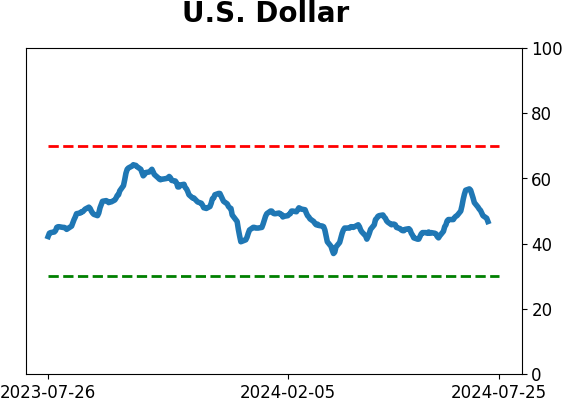
Currency ETF's - 5-Day Moving Average
|
|
|
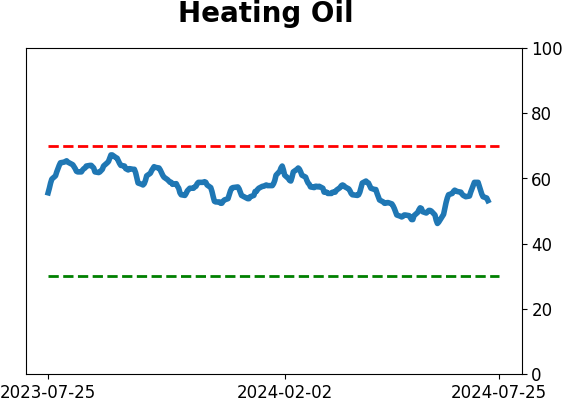
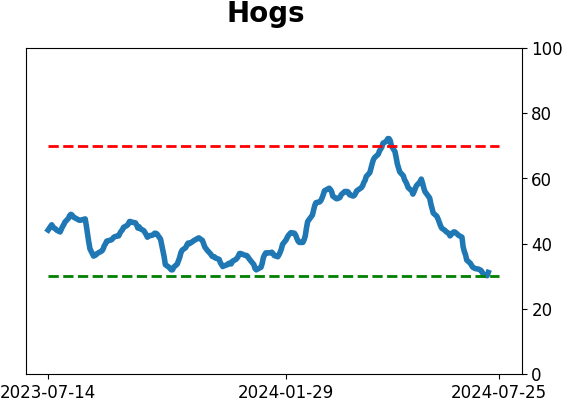
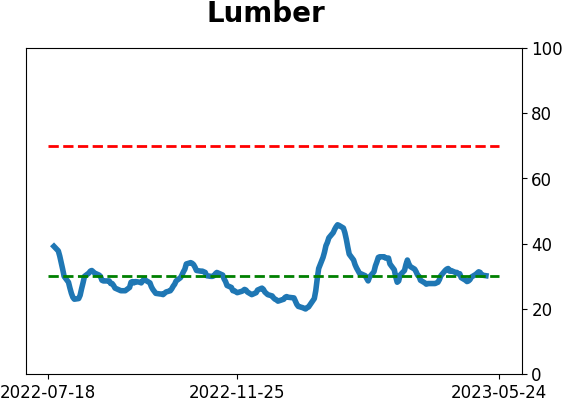
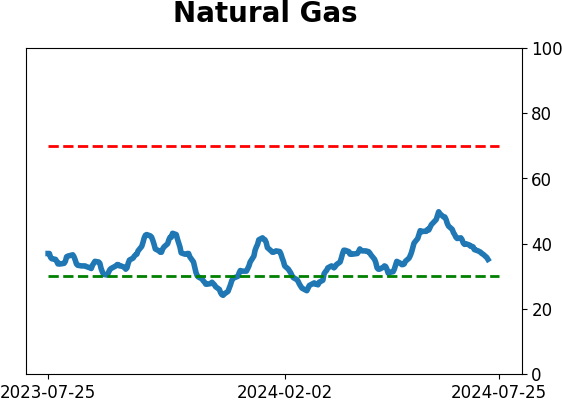
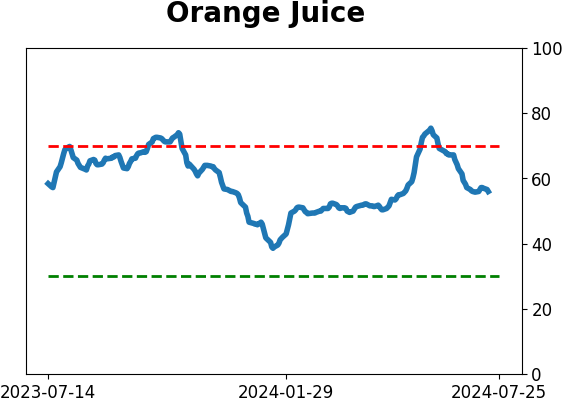
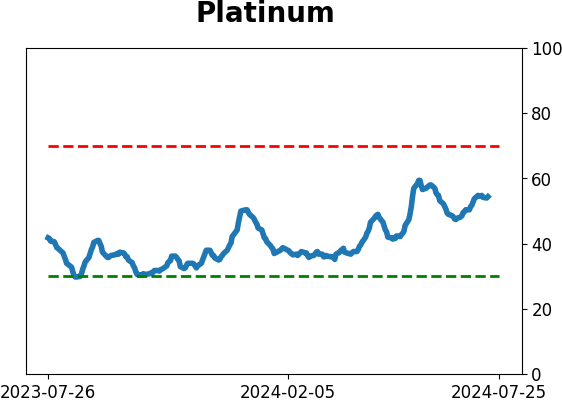
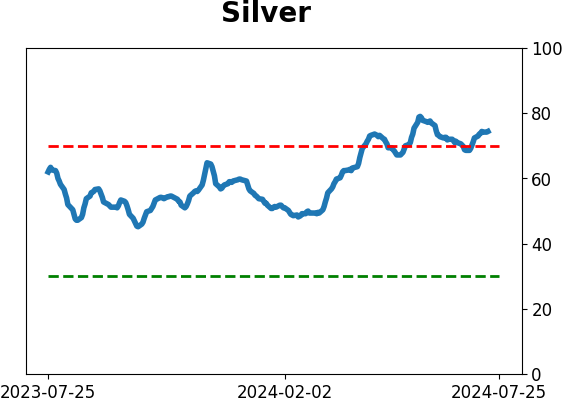
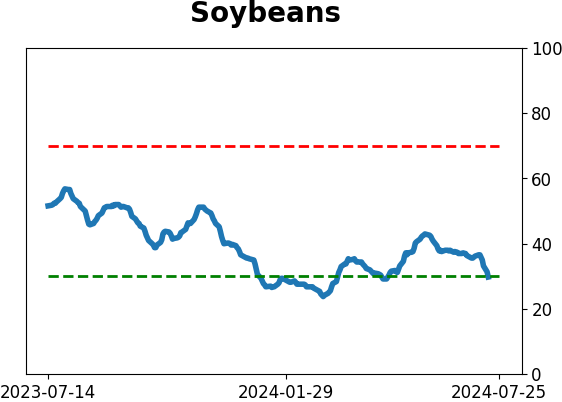
Commodity ETF's - 5-Day Moving Average
|
|