Headlines
|
|
Investors love stocks and hate bonds:
For the first time since the models began 24 years ago, sentiment on the stock market is nearly 70 points higher than on the bond market. Extreme levels of the spread preceded inconsistent results, with the biggest takeaway being that readings like this do not occur during ongoing bear markets.
|
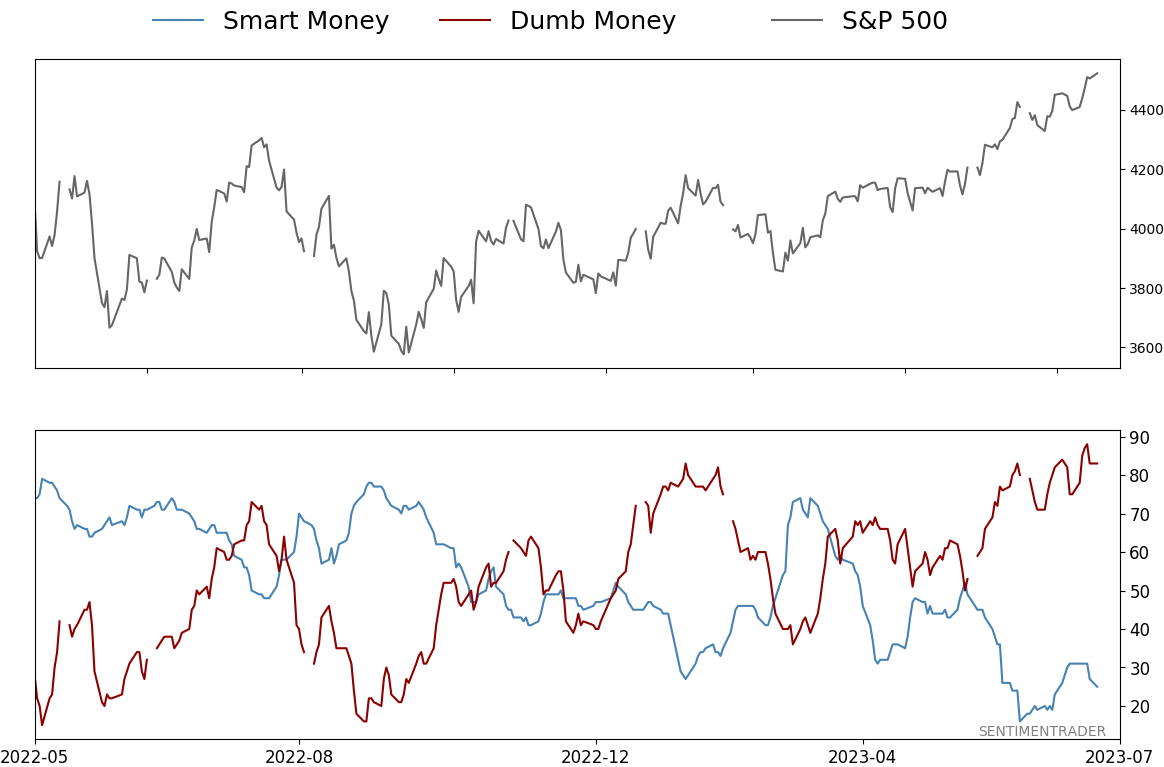
Smart / Dumb Money Confidence
|
Smart Money Confidence: 25%
Dumb Money Confidence: 83%
|
|
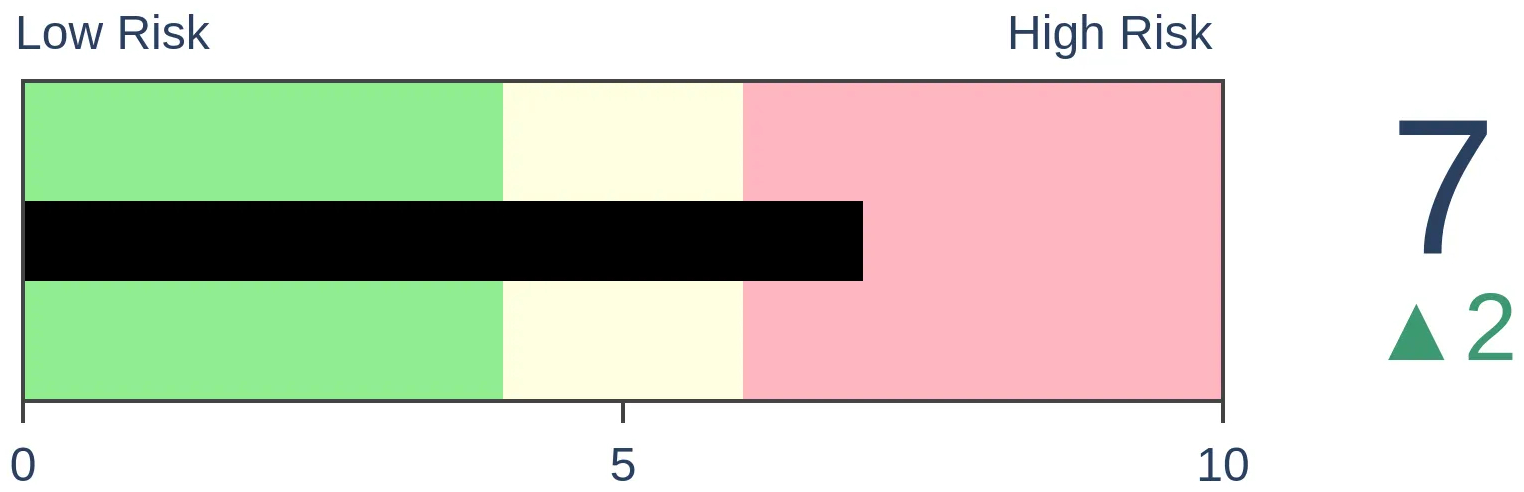
Risk Levels
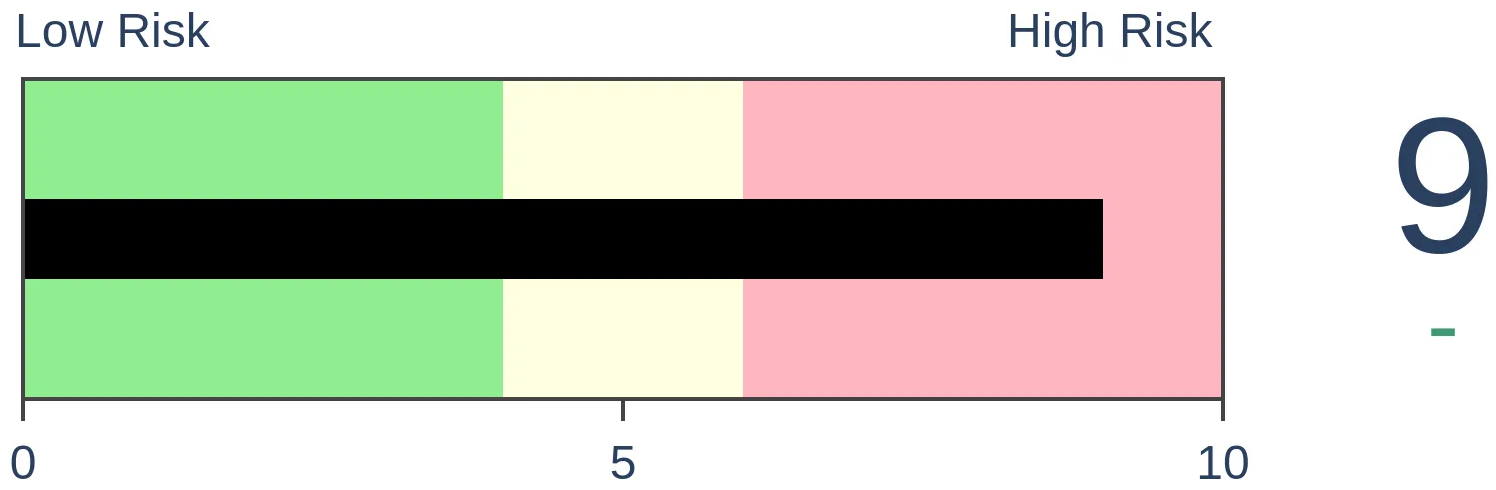
Stocks Short-Term
|
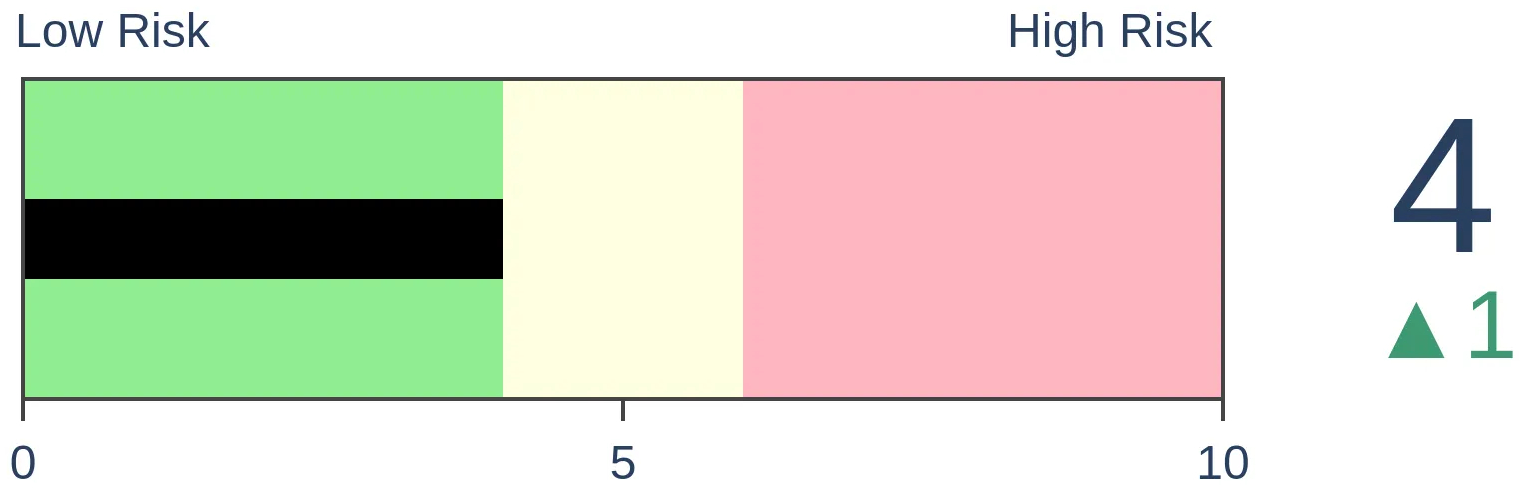
Stocks Medium-Term
|
|
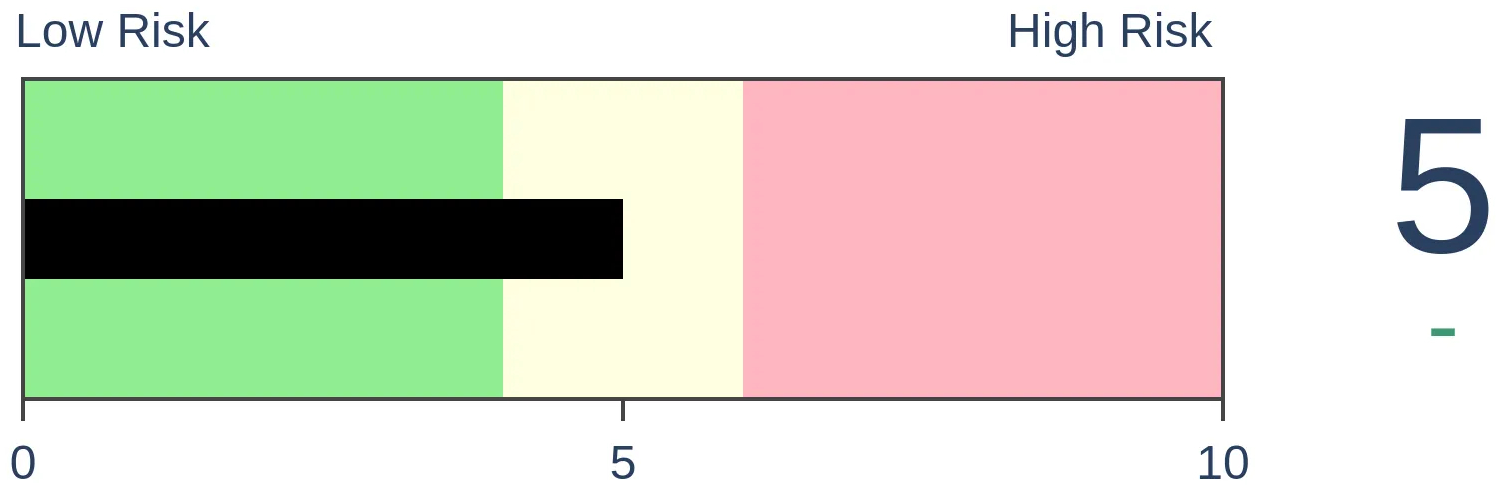
Bonds
|
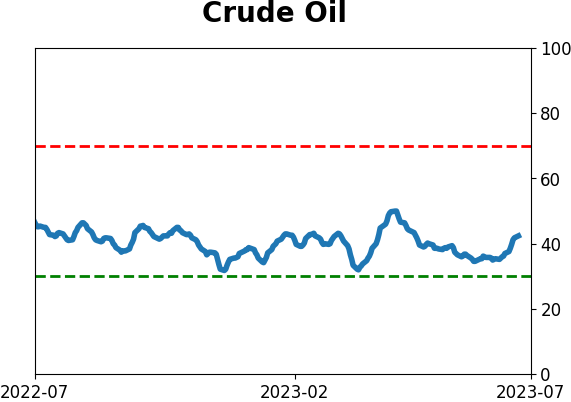
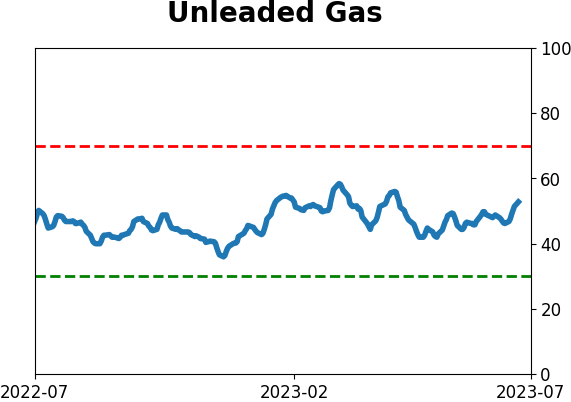
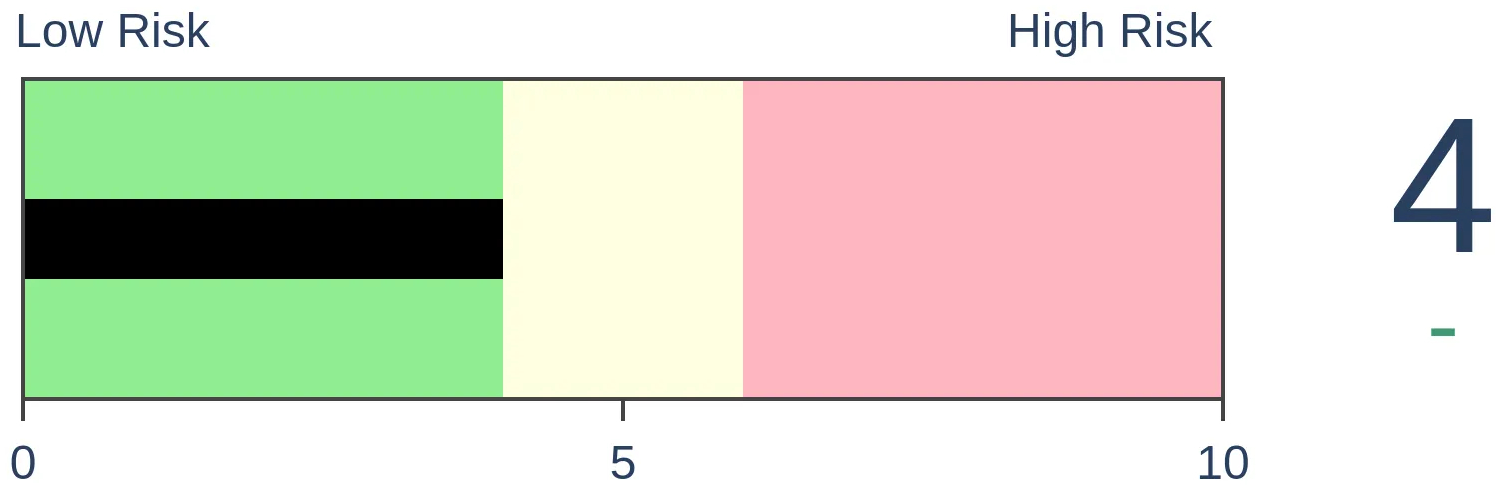
Crude Oil
|
|
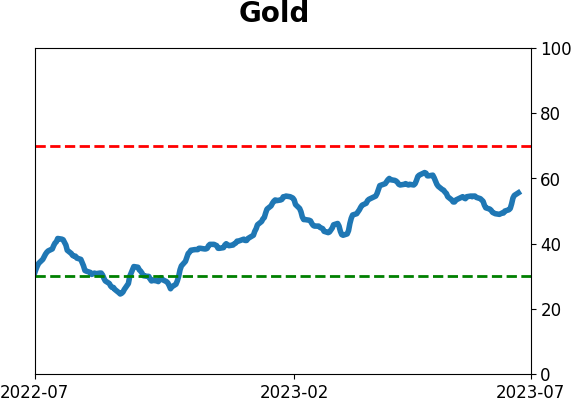
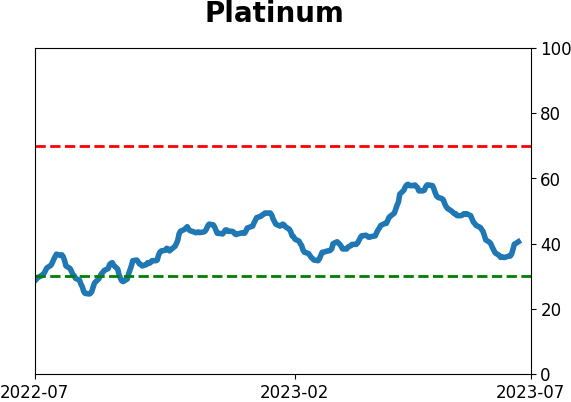
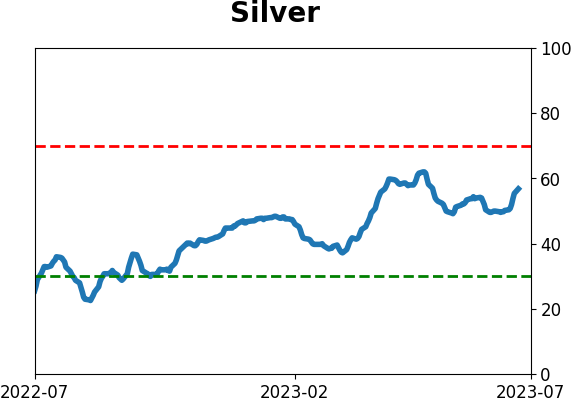
Gold

|
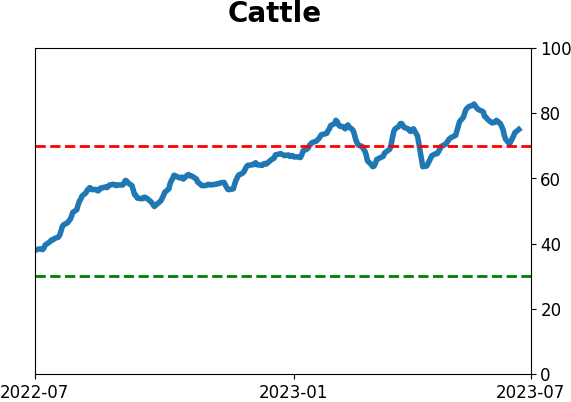
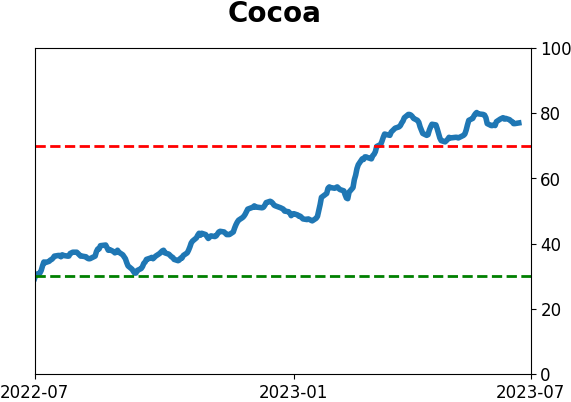
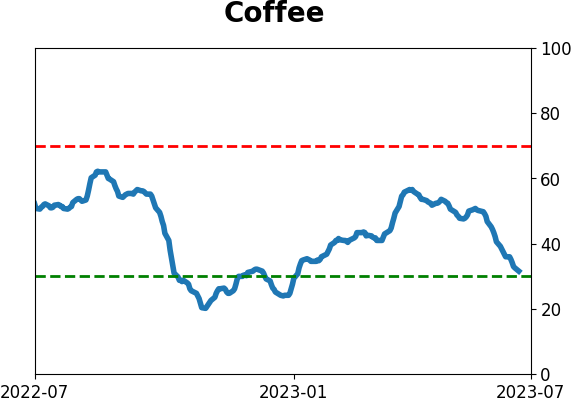
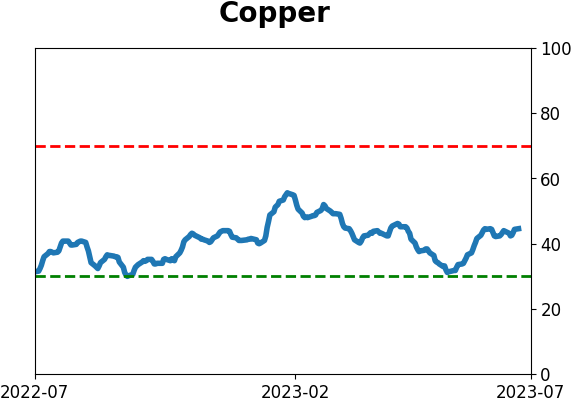
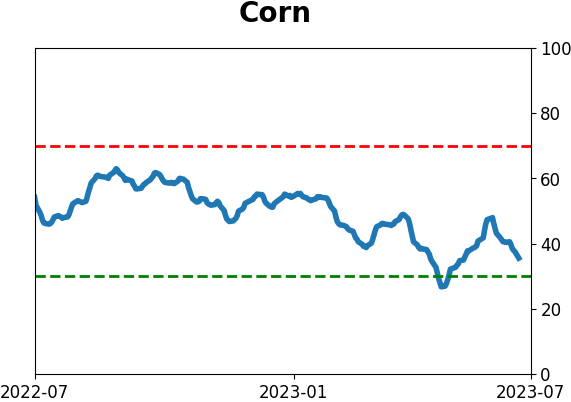
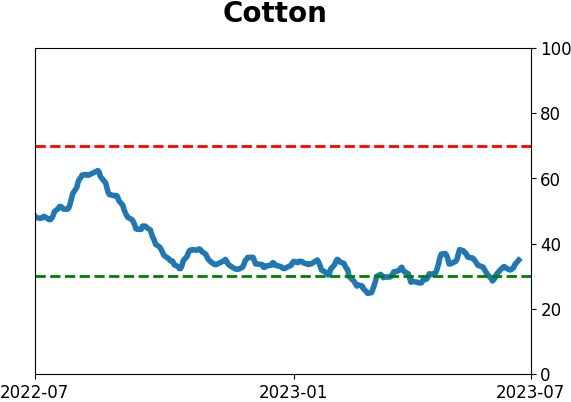
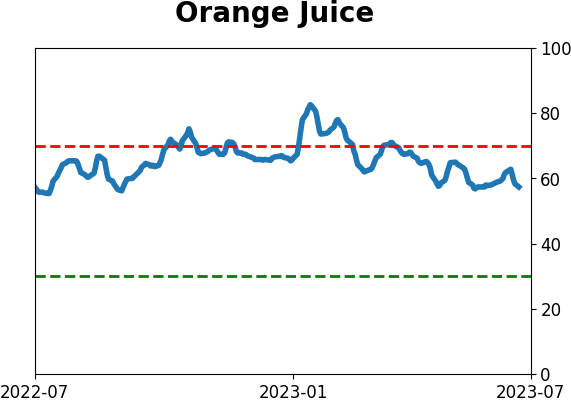
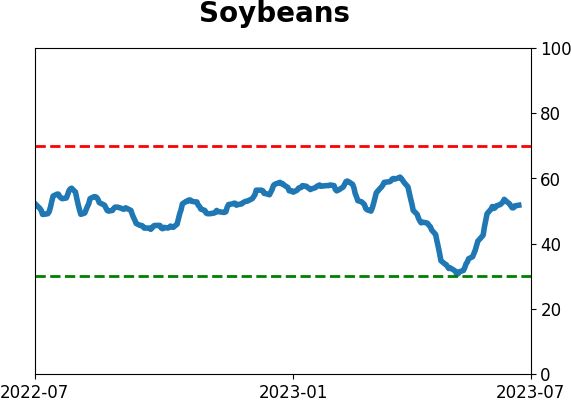
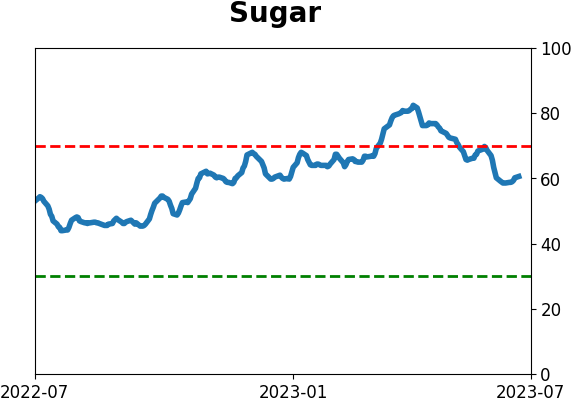
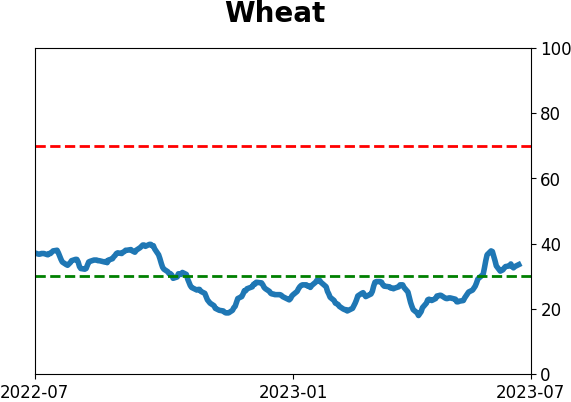
Agriculture
|
|
Research
By Jason Goepfert
BOTTOM LINE
For the first time since the models began 24 years ago, sentiment on the stock market is nearly 70 points higher than on the bond market. Extreme levels of the spread preceded inconsistent results, with the biggest takeaway being that readings like this do not occur during ongoing bear markets.
FORECAST / TIMEFRAME
None
|
Key points:
- Optimism on stocks is over 60 points higher than that of bonds
- This is a record spread in optimism between the two markets since late 1998
- Despite potential contrarian risks, sentiment does not get this stretched during bear markets
Never before have investors favored one major market over another
Investors love stocks. And they hate bonds.
The difference in sentiment between the two markets is so stark it has never been wider in the 24 years we've been calculating the Optimism Index in the two markets.
The Intermediate-Term Optimism Index for stocks has approached 90 and is the 3rd-highest since we began computing it.
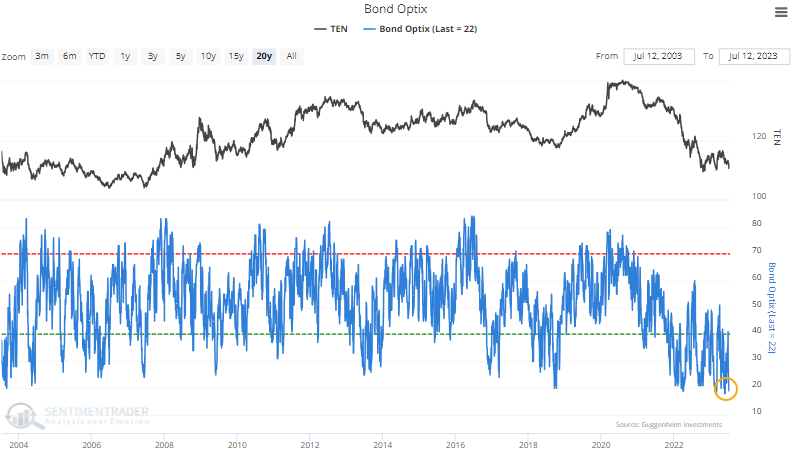
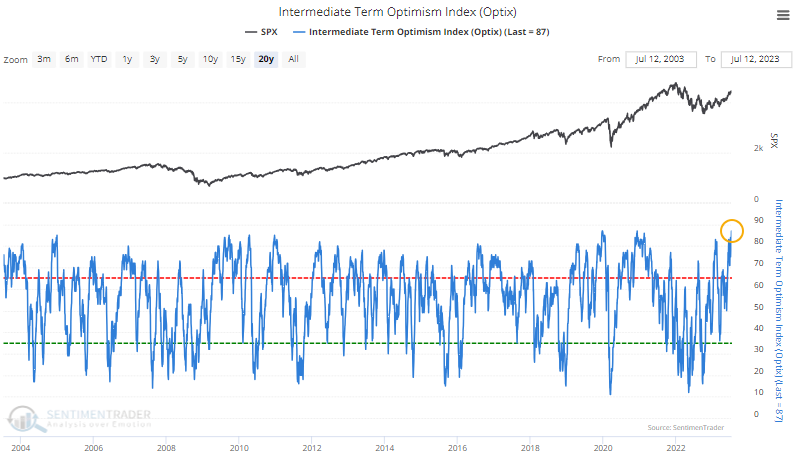 At the same time, the Optimism Index for bonds has cratered to one of its lowest-ever levels.
That means the spread between the two measures just rocketed above +60, a level we've never seen before. How they perform after lesser extremes depends on time frames.
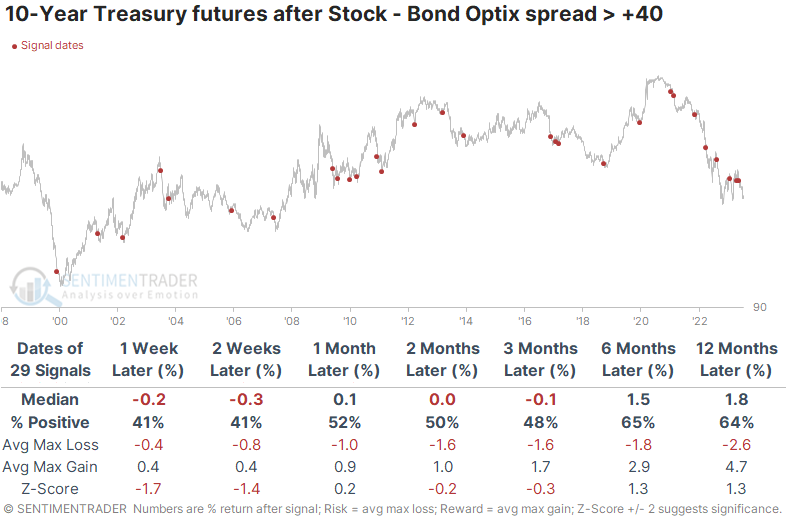
We can see in the chart below that when the spread exceeded +40, the annualized return in the ratio between the S&P 500 and 10-year Treasury futures was abysmal. When the spread plunged below -40, then stocks soared versus Treasuries.
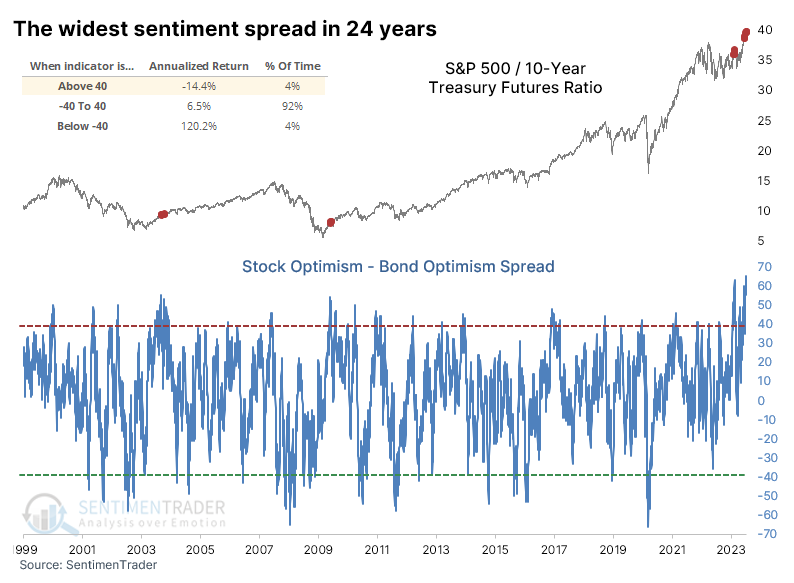
However, when the spread really blew out, above +50 or more, there were only a couple of precedents...and they both triggered at the ends of the last two protracted bear markets. This highlights something we've repeatedly noted in recent weeks and months - sentiment on stocks like we're seeing now doesn't happen during ongoing bear markets.
Extreme differences in sentiment preceded inconsistent reversions
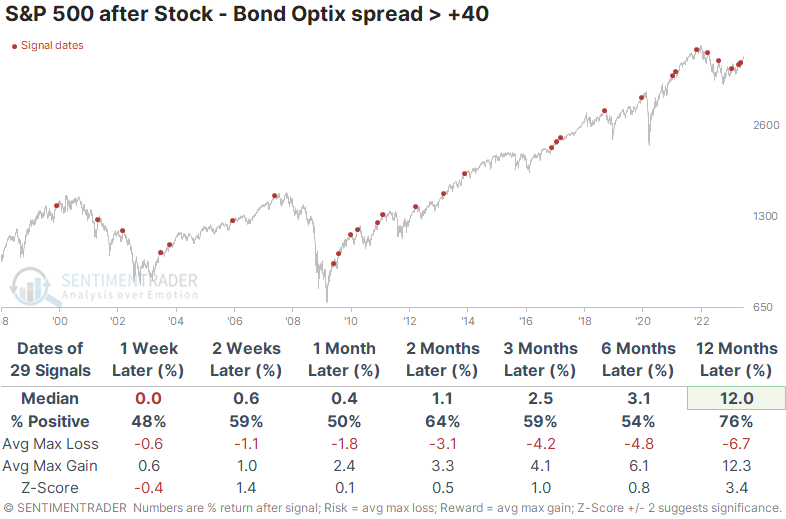
Since we have so few precedents with which to compare the current reading, the table below looks at lesser extremes. It shows future returns in the S&P 500 after the spread between stock and bond optimism exceeds +40 for the first time in weeks. And, overall, those returns were okay. Over most time frames, the S&P modestly outperformed a random return. Nothing up to a year later was especially encouraging, though - win rates, median return, and risk/reward were all yawn-inducing.
For 10-year Treasury futures, it was even less enticing. Prices on the notes didn't show a consistent tendency to snap back. Up to three months later, returns were actually quite poor.
Since we are looking at the spread between stock and bond optimism, it makes the most sense to look at future returns between the two markets. The table below shows how the ratio between the S&P 500 and 10-year Treasury futures behaved after extreme wide spreads in sentiment.
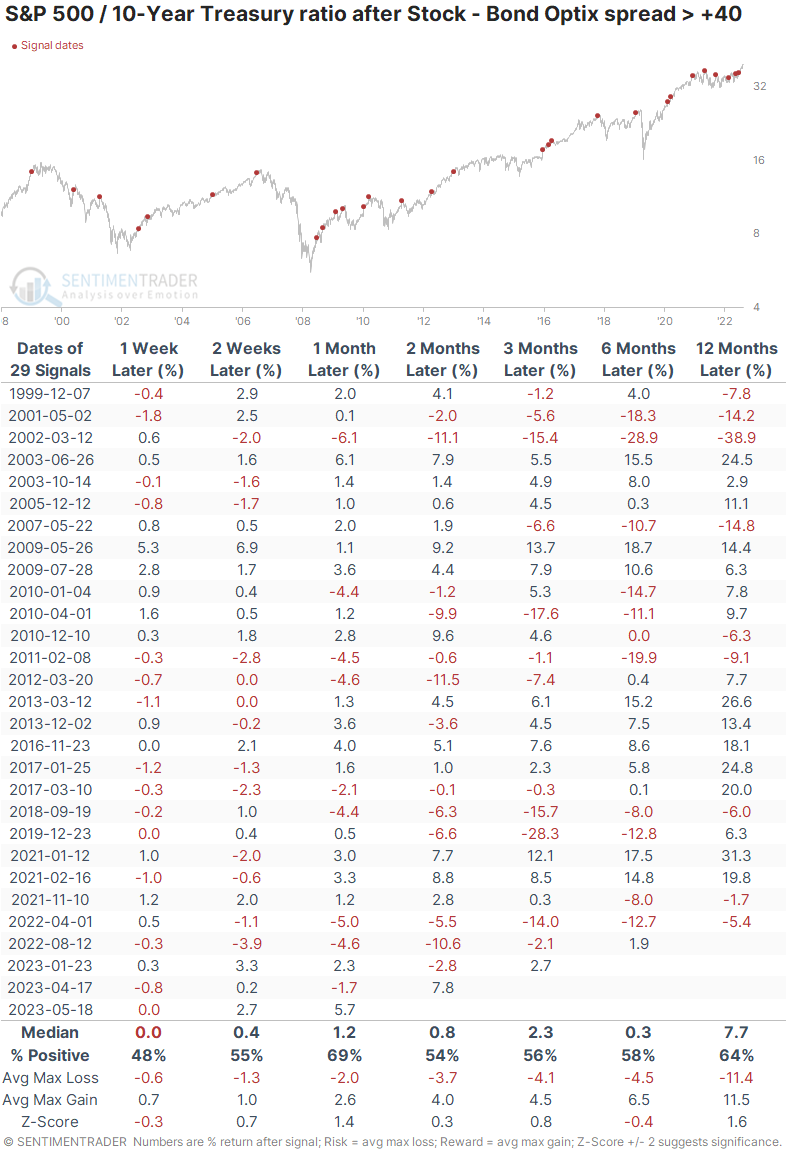
It's somewhat surprising that despite investors preferring stocks over bonds to an extreme degree, stocks still outperformed in the months ahead. There was no consistent contrary tone to the data, though the few signals triggered during ongoing bear markets preceded an almost immediate reversion from stocks to bonds.
What the research tells us...
Multiple times in recent weeks, we've seen evidence that the sentiment investors are exhibiting toward stocks has tilted strongly into excessive optimism. The knee-jerk reaction for any investor with the hint of a contrarian streak is that this is bad. And usually, it is. The most consistent exception is when there is extremely extreme optimism, especially when it's the first instance following a prolonged bear market.
Several times lately, we've looked at readings that simply haven't occurred in other ongoing bear markets. Evidence has piled up since October that we're likely in a new bull market environment, and the current level of sentiment among markets is further evidence of that. Granted, sentiment is so extreme that it likely means subdued forward returns, but it's not good evidence of an imminent and protracted retracement.
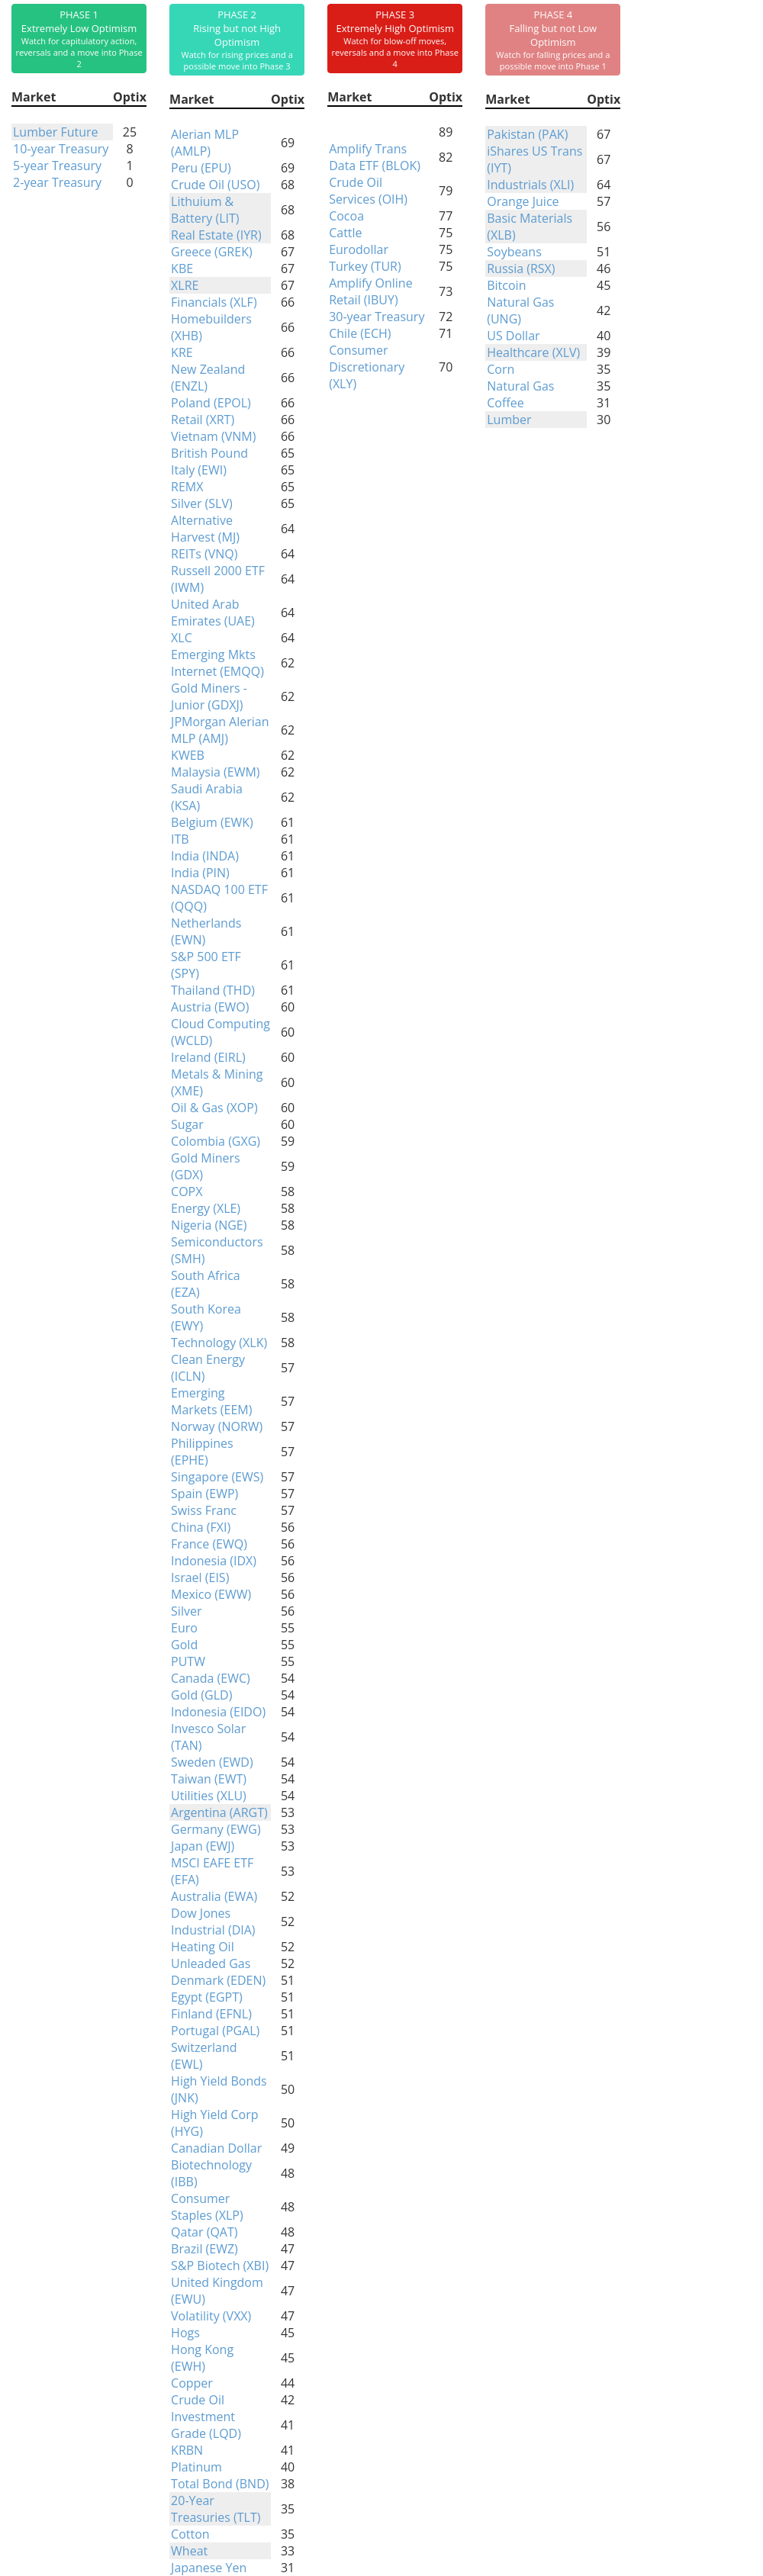
Indicators at Extremes
Phase Table
Ranks
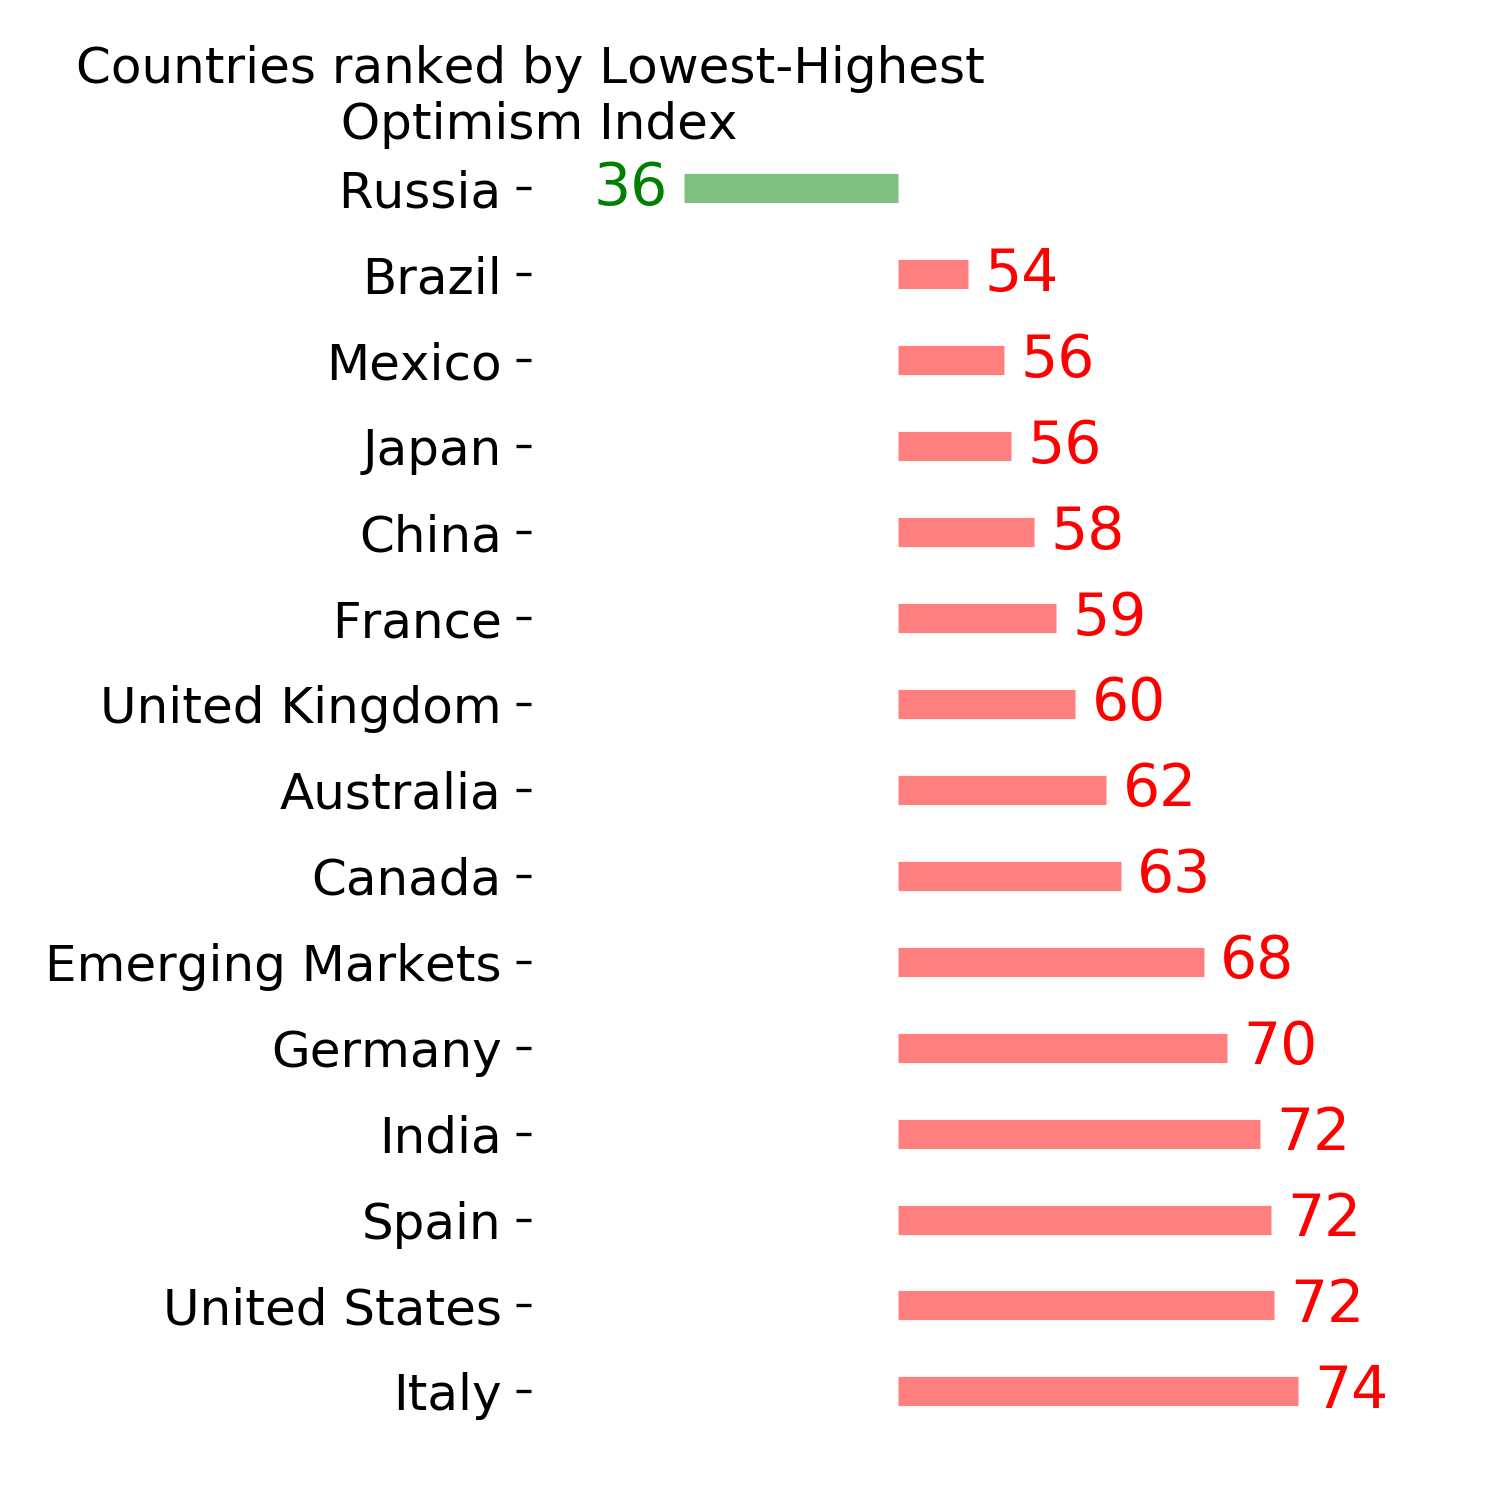
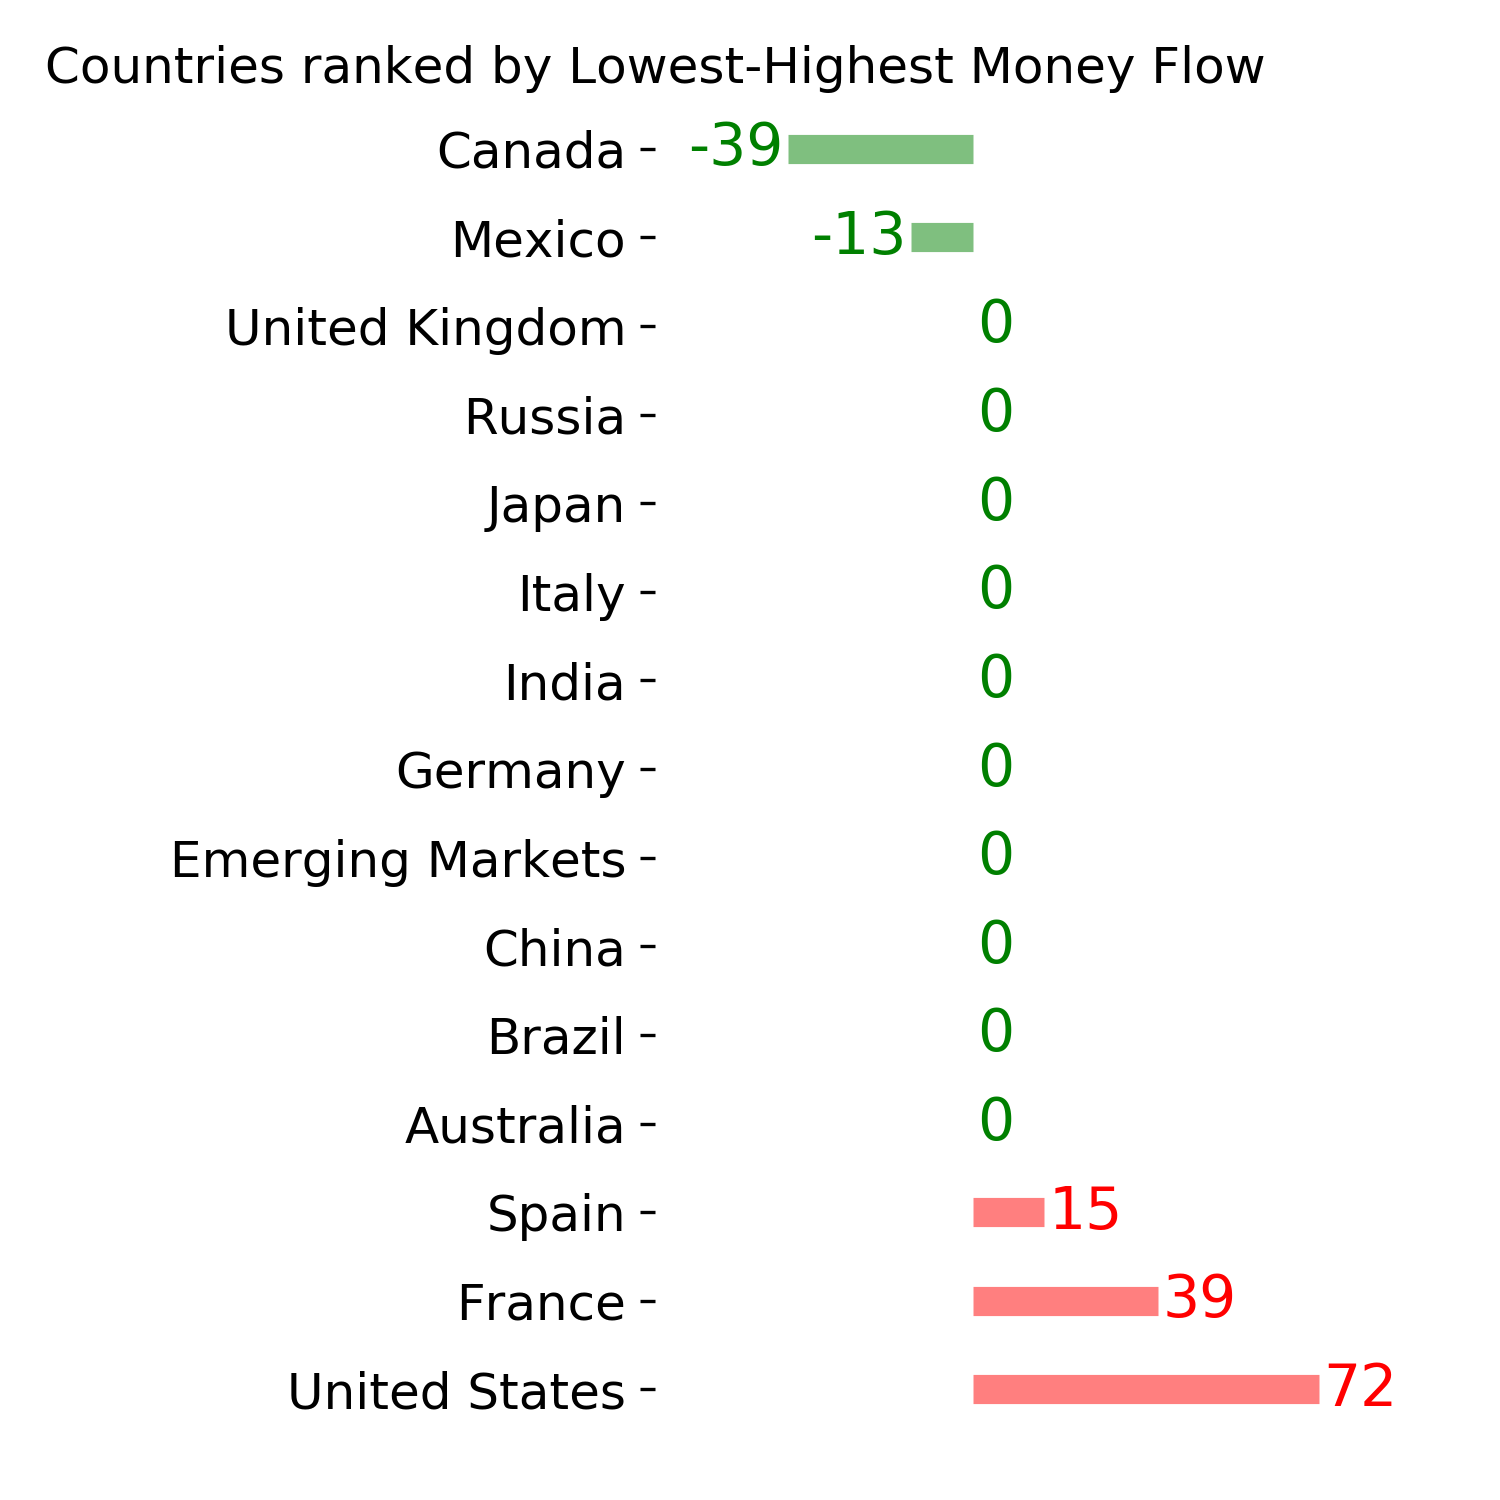
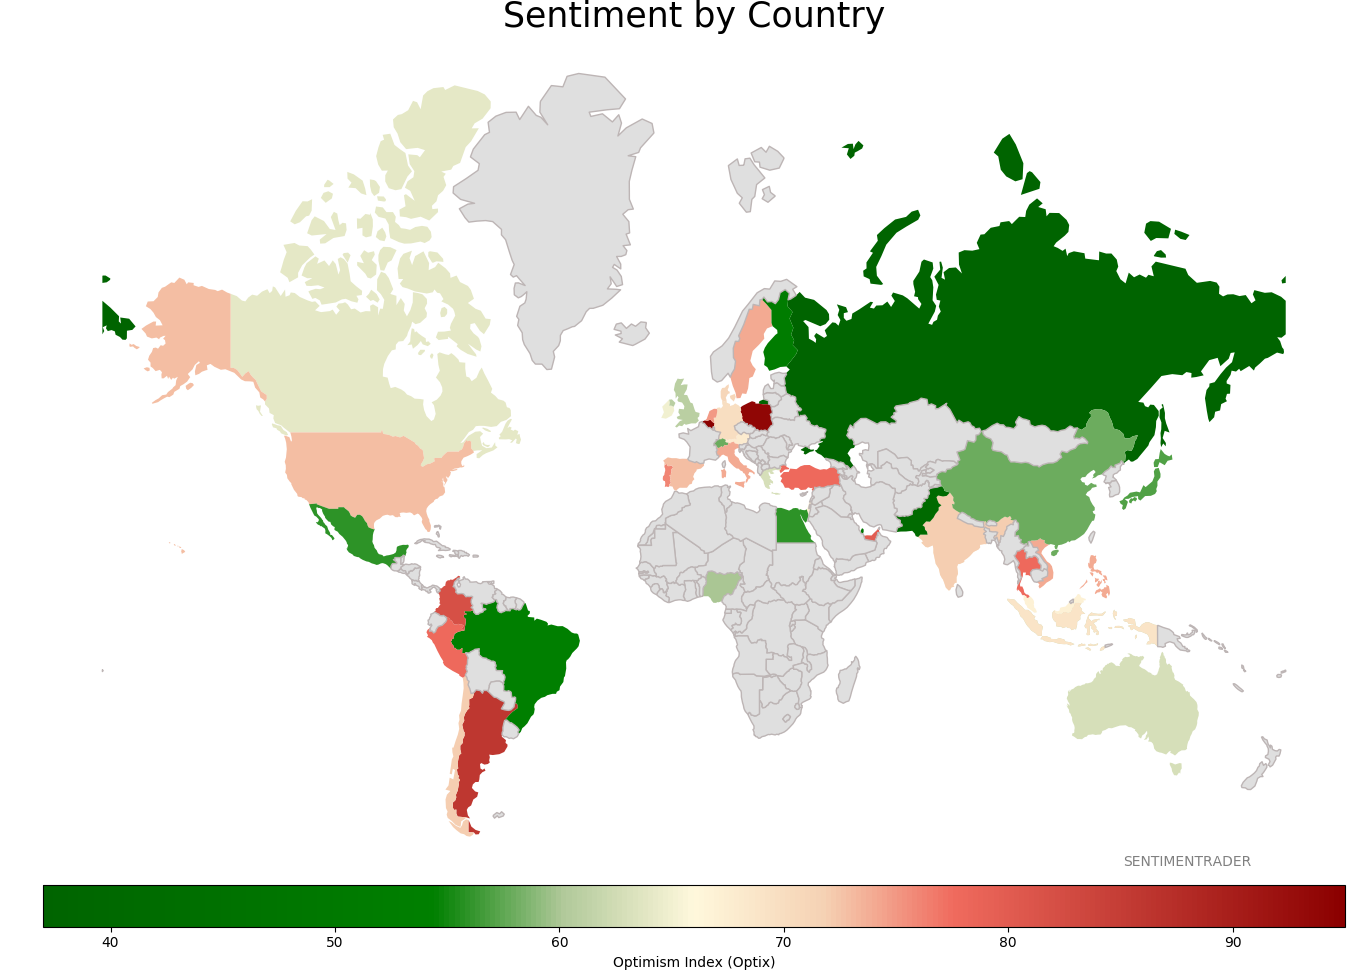
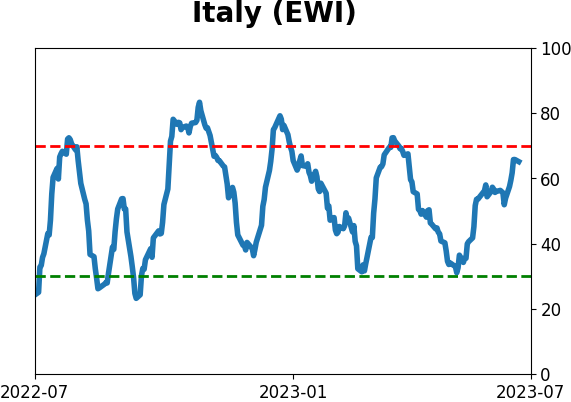
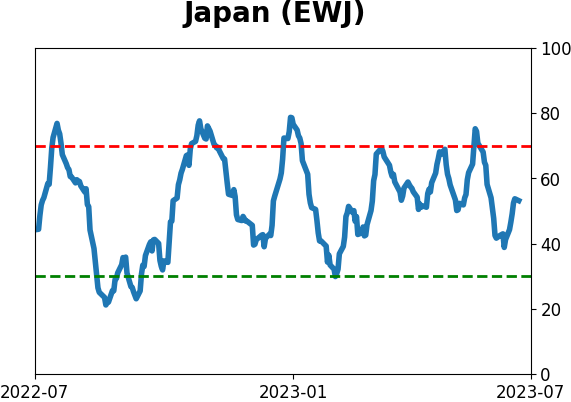
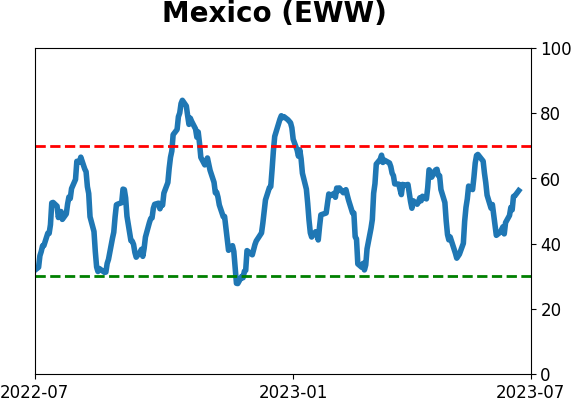
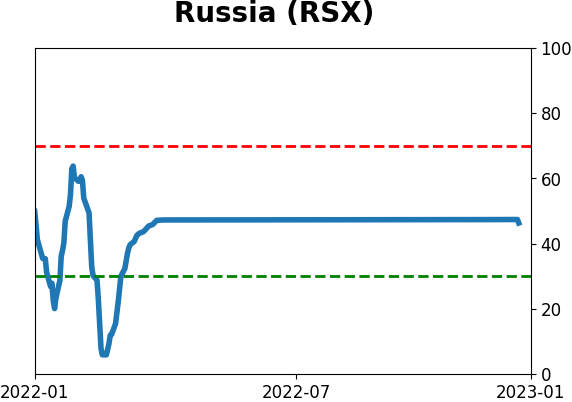
Sentiment Around The World
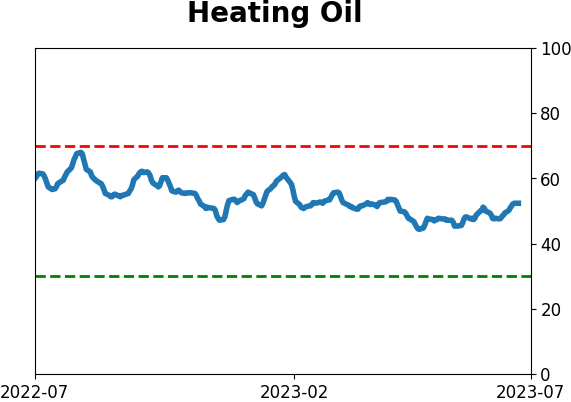
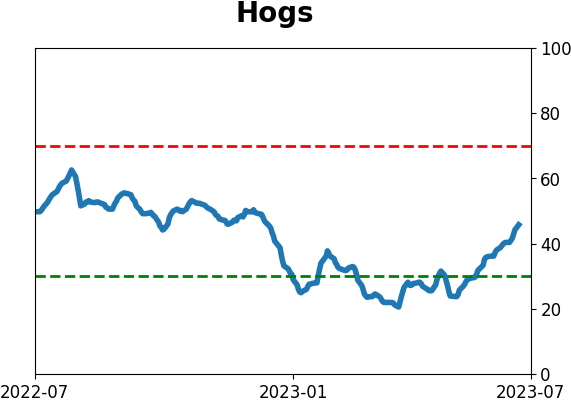
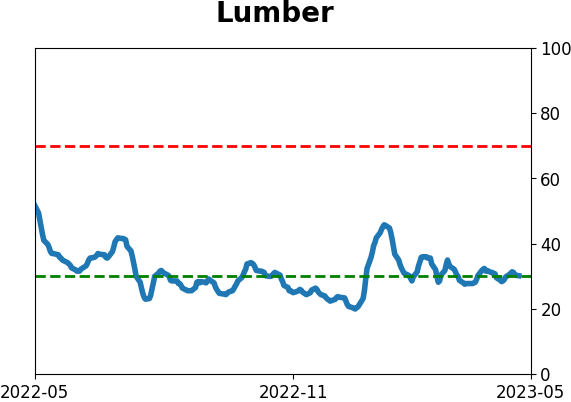
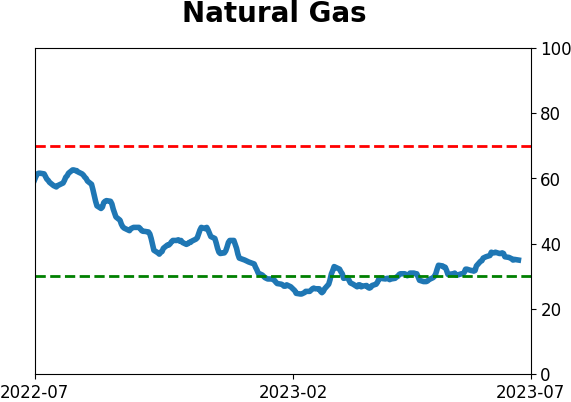
Optimism Index Thumbnails
|
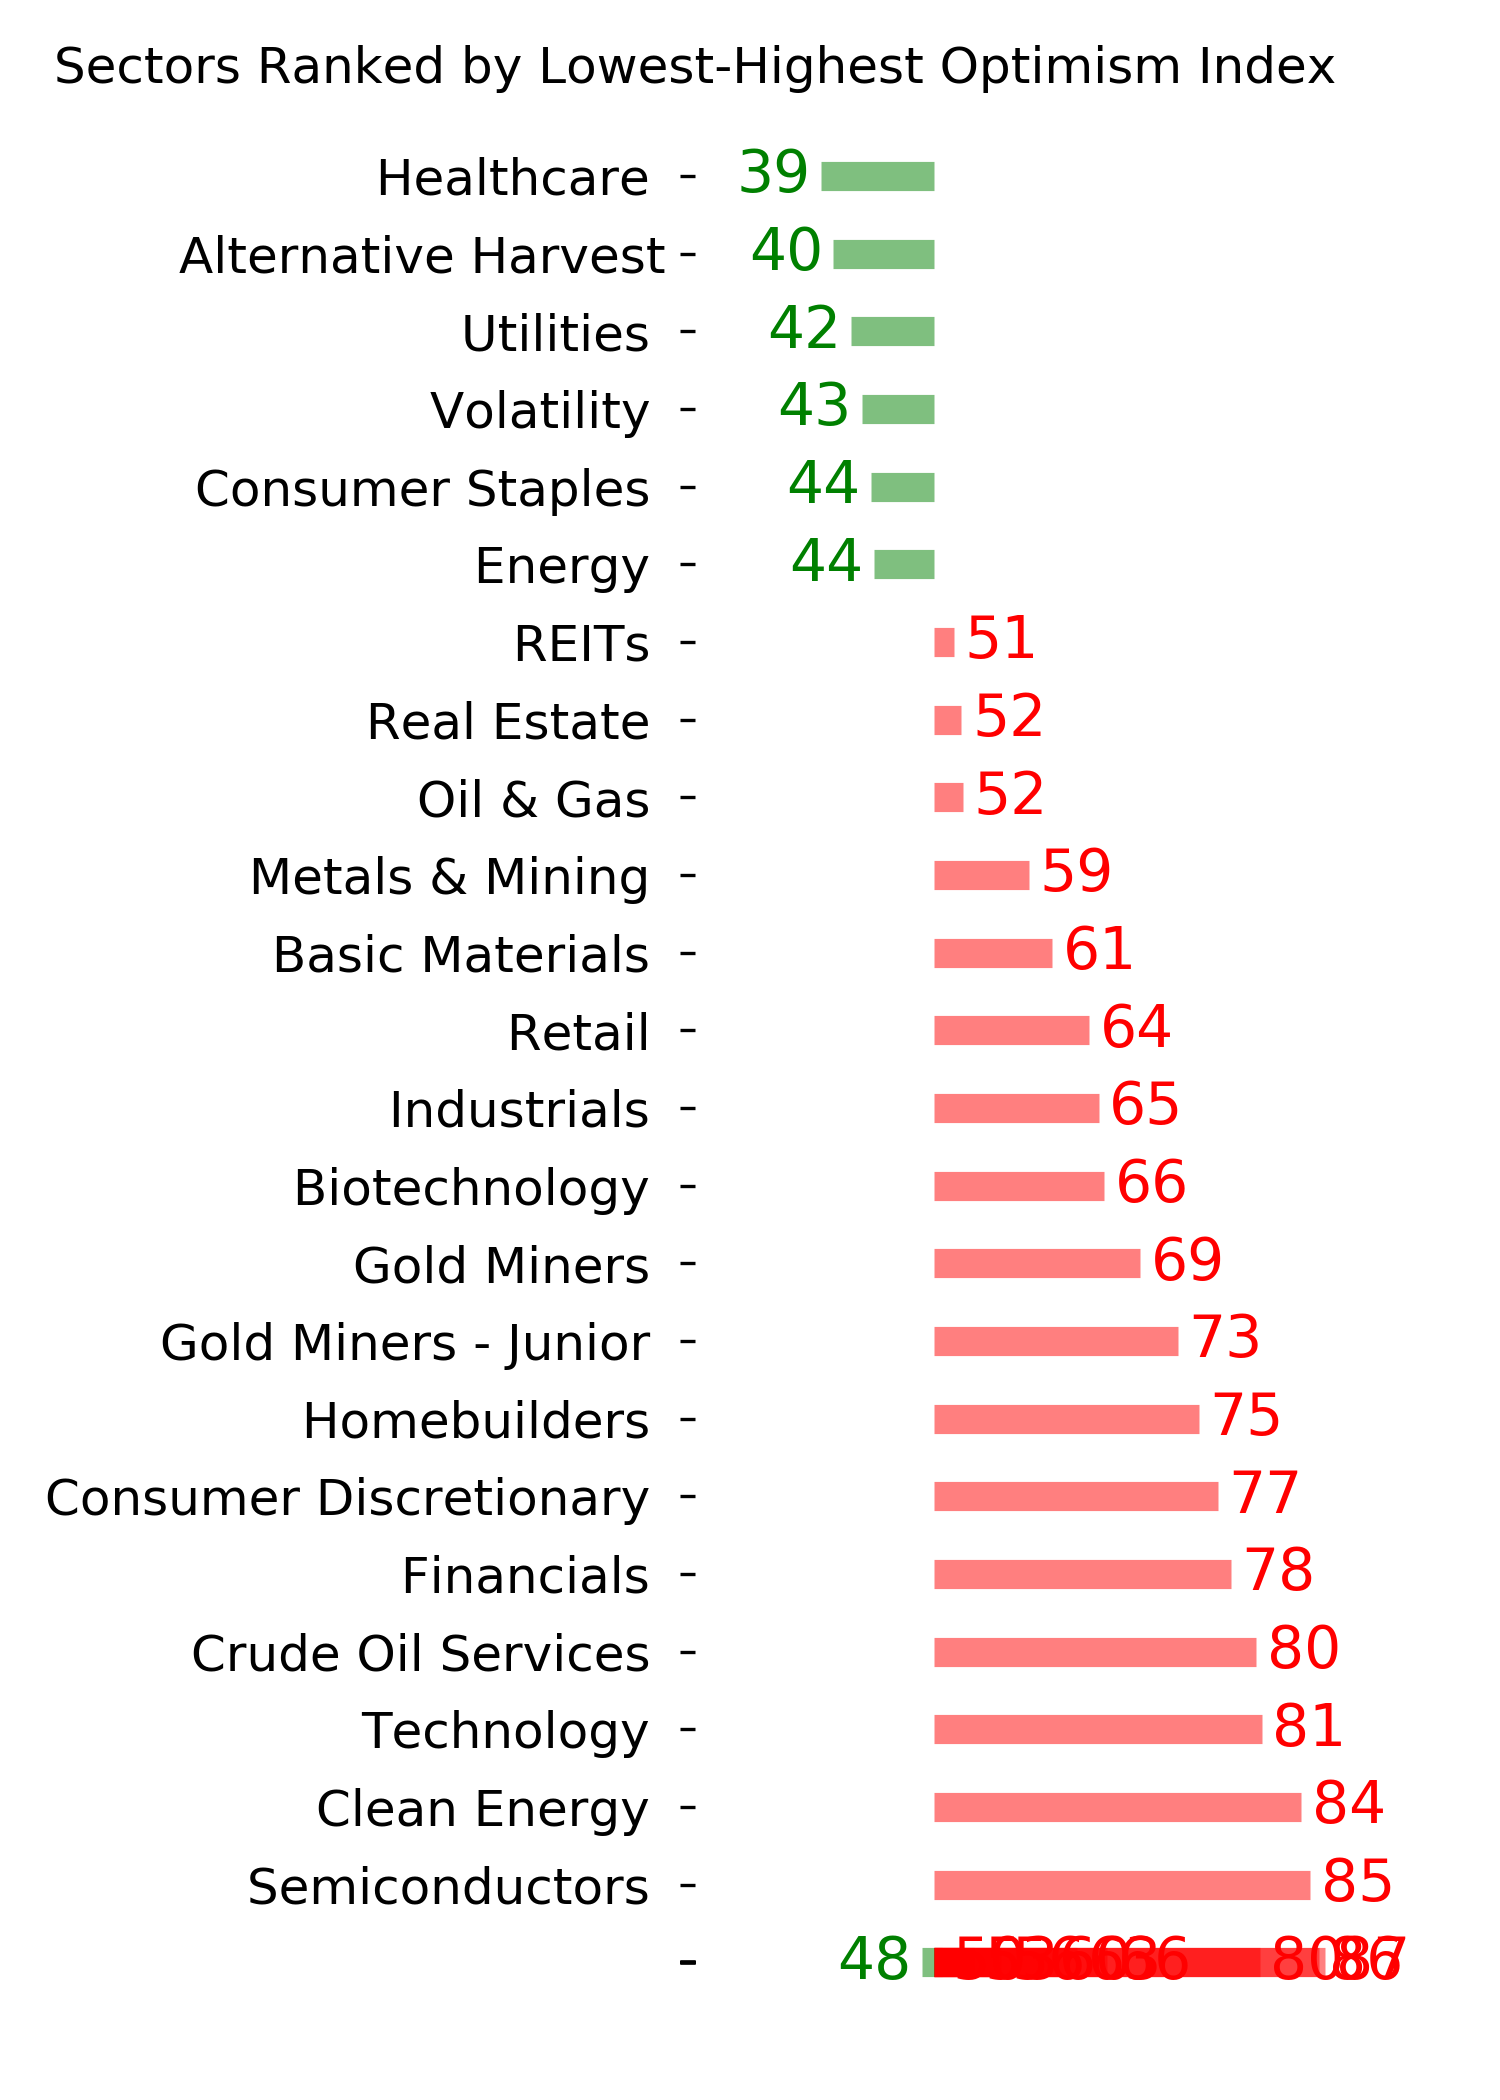
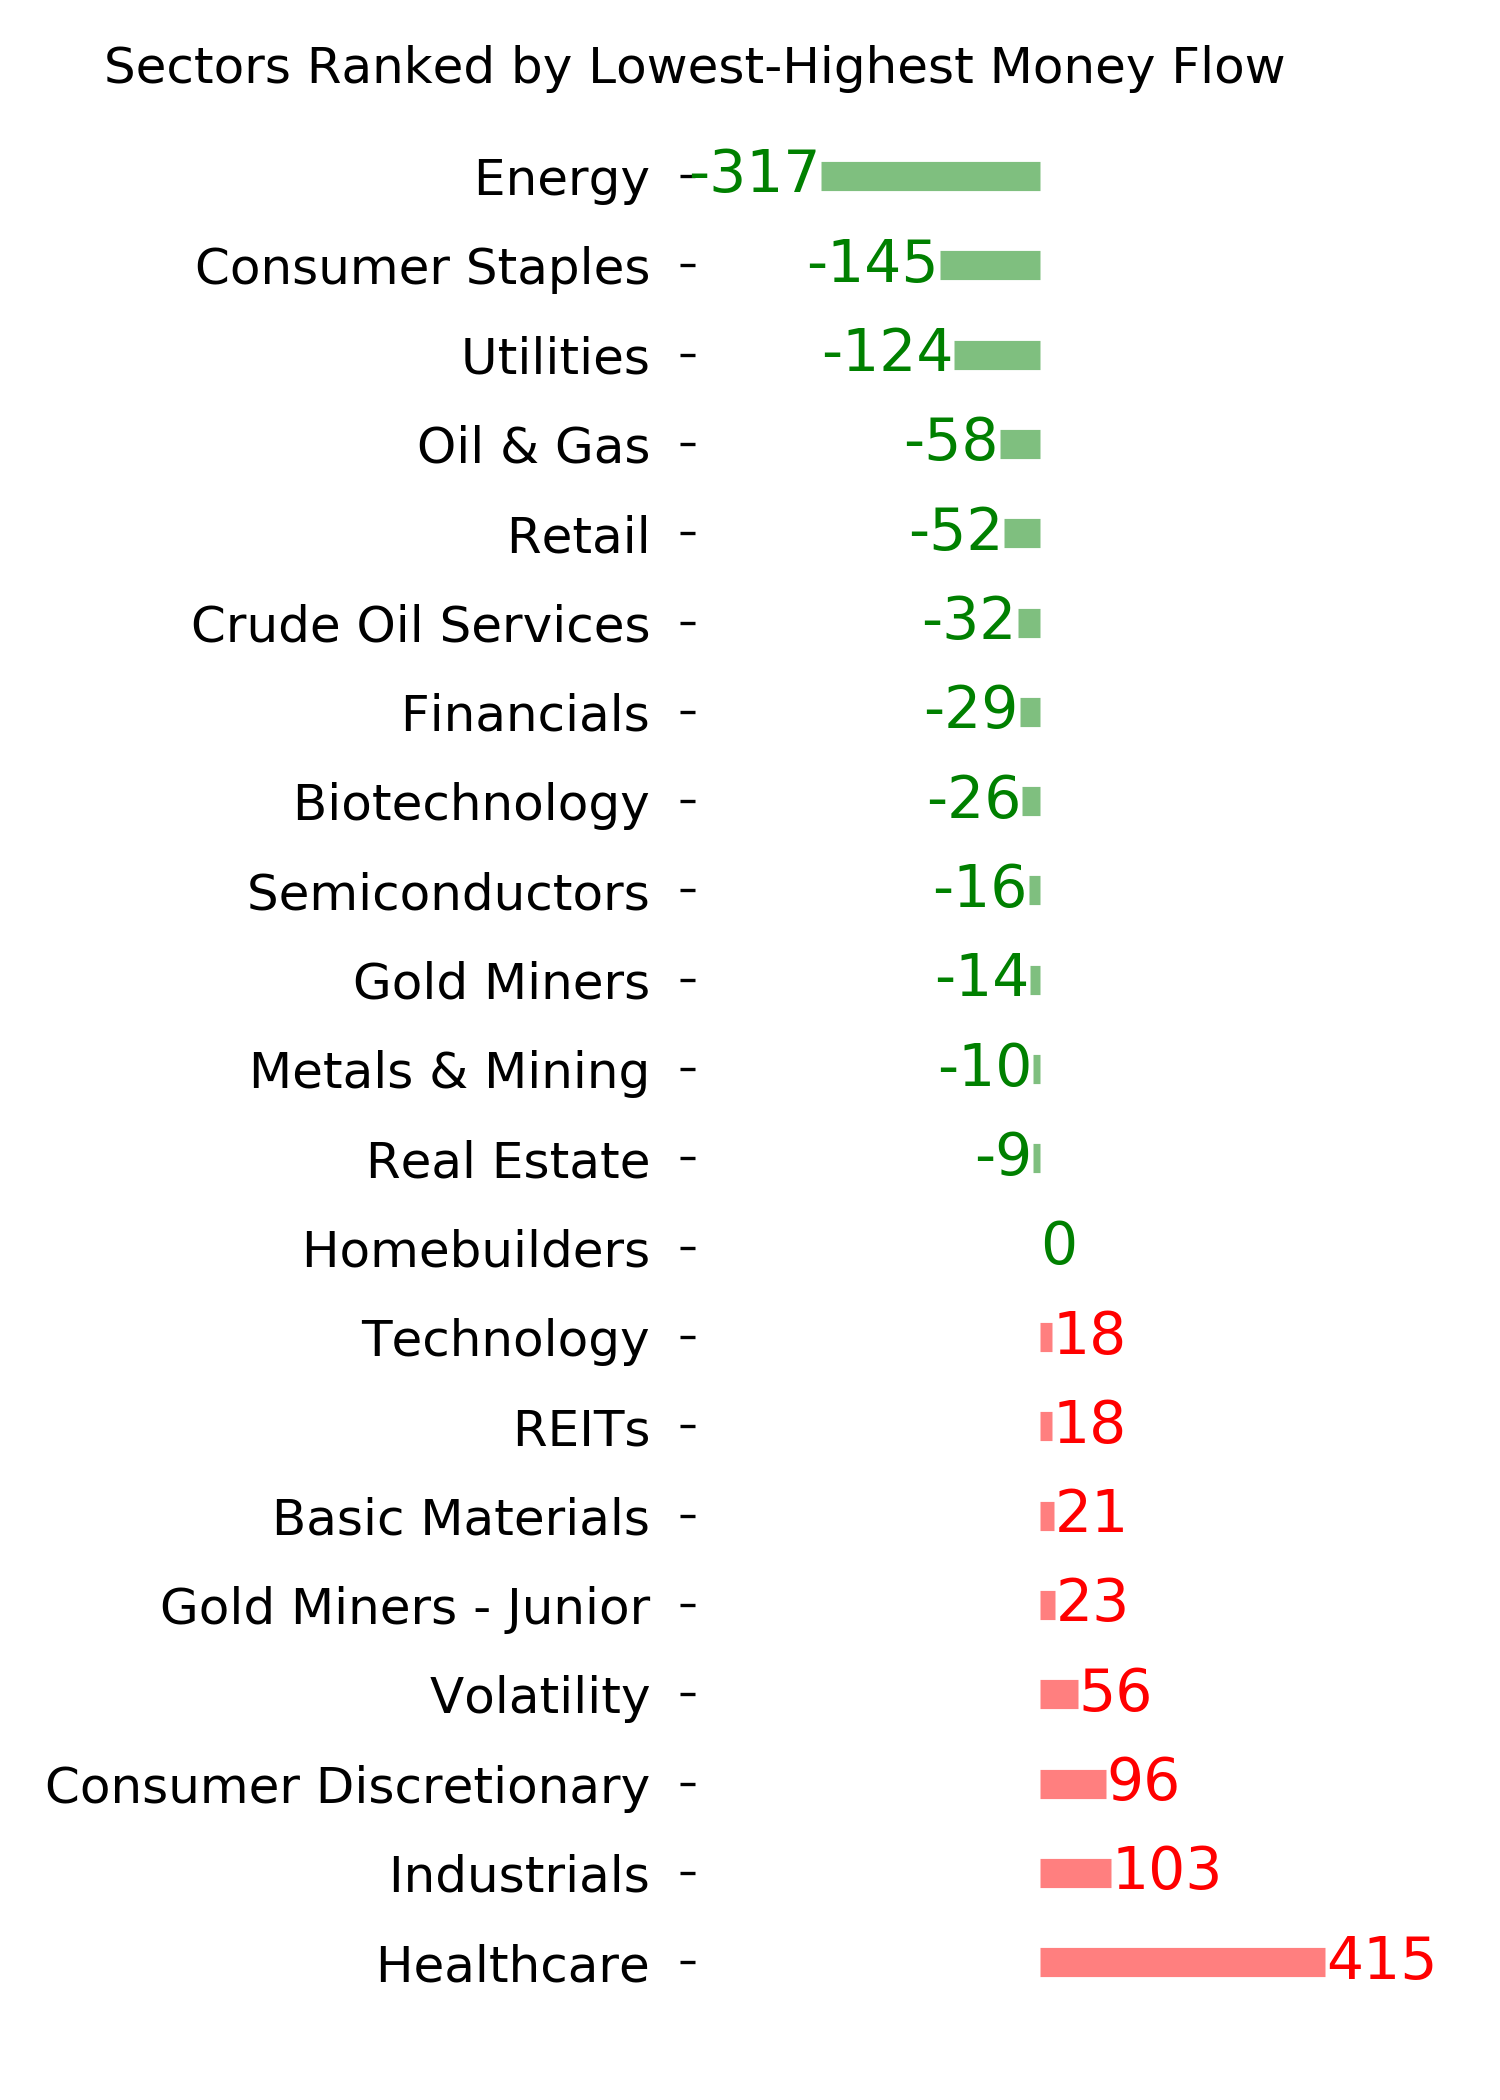
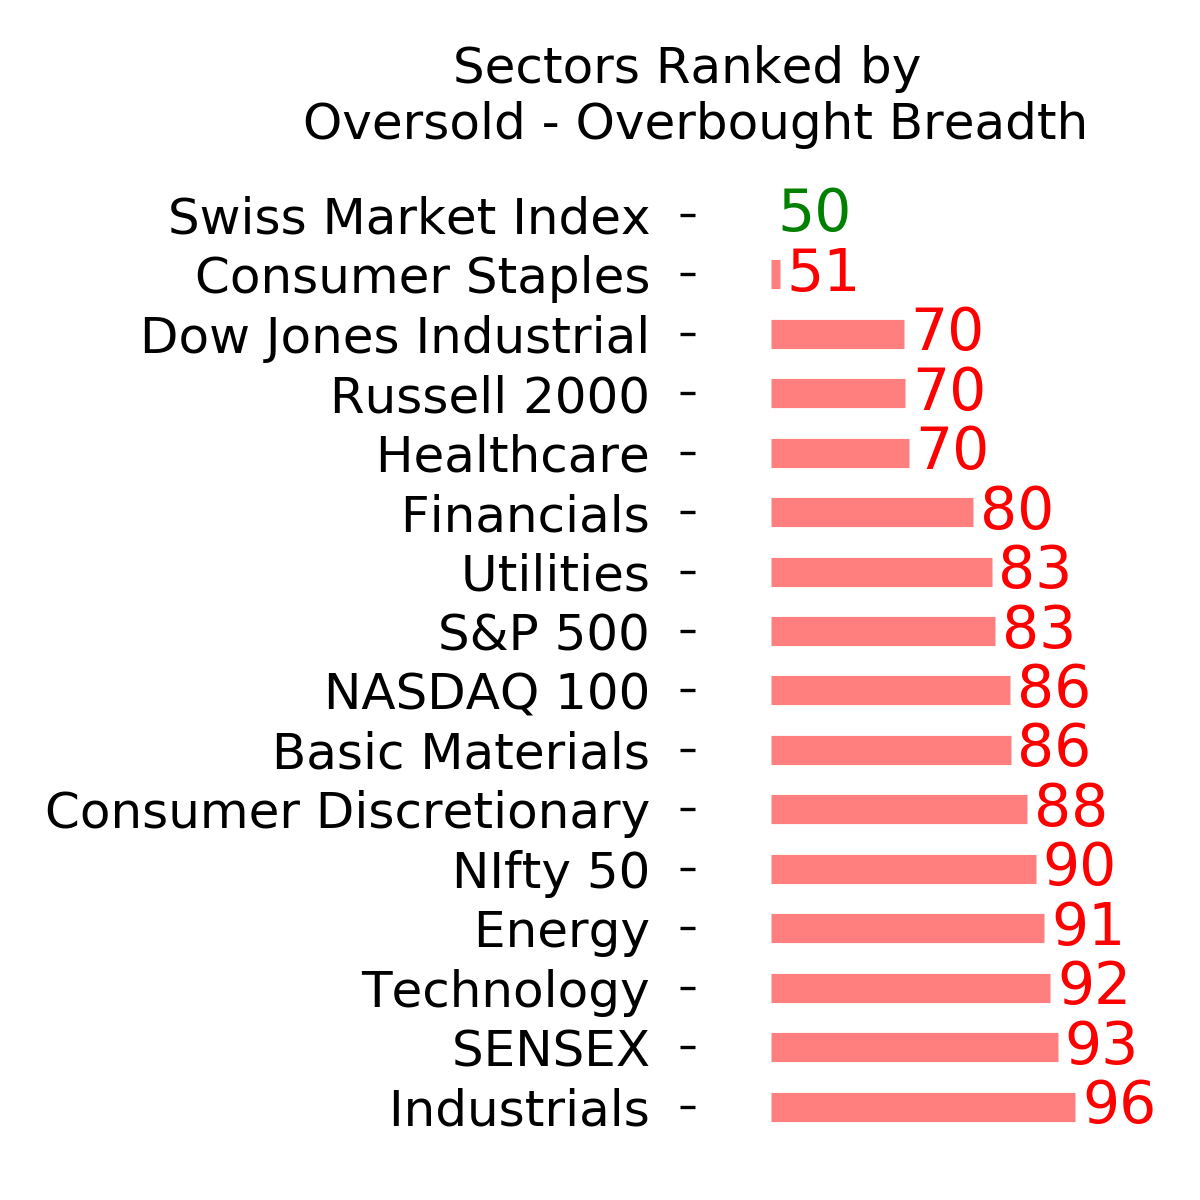
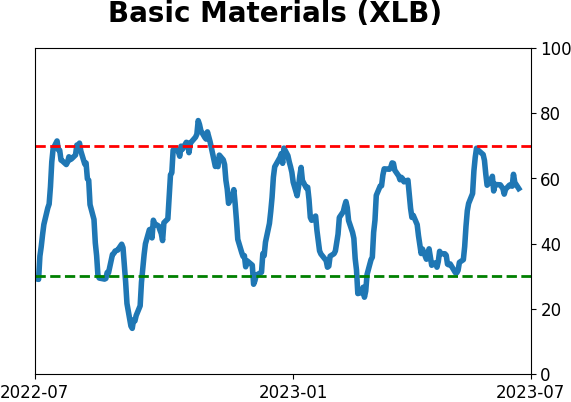
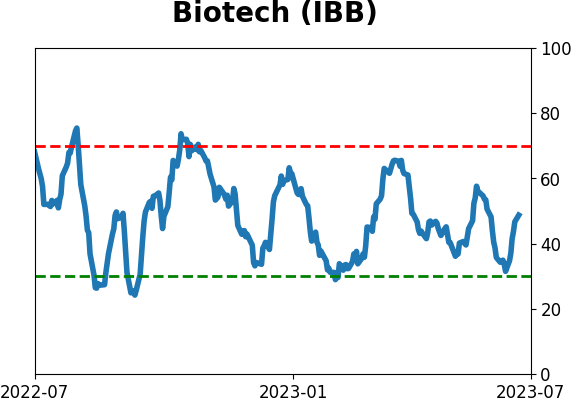
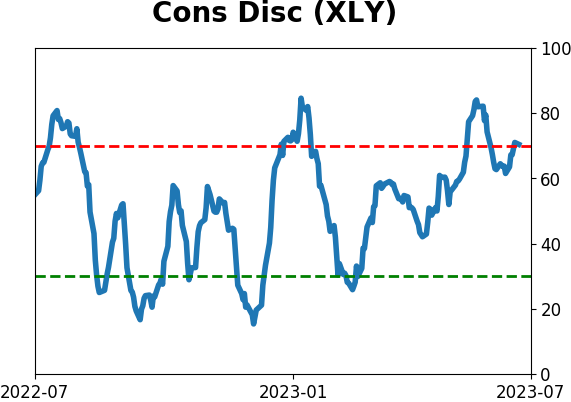
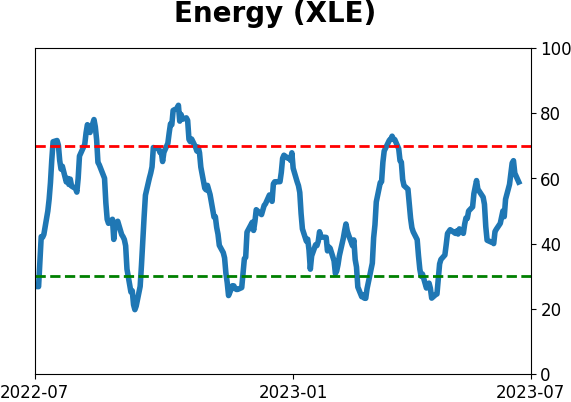
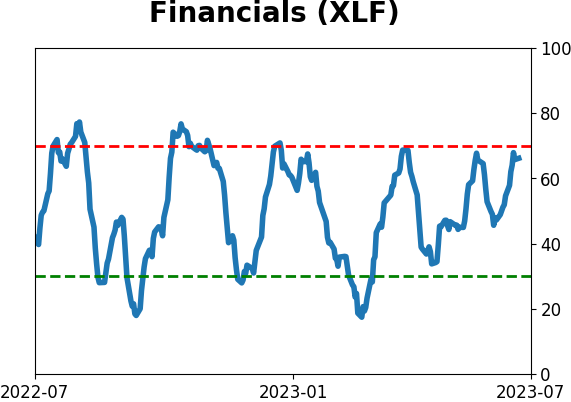
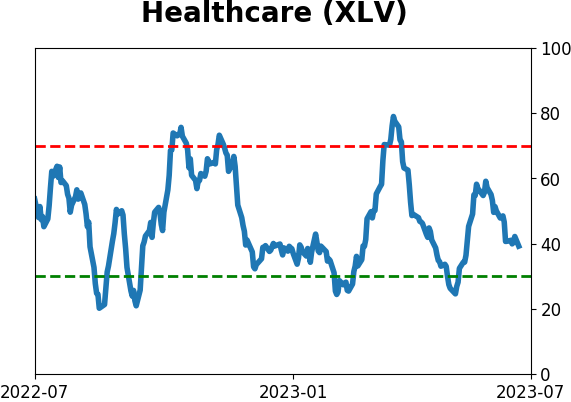
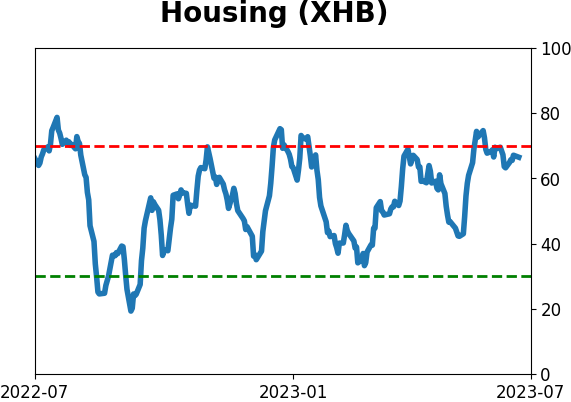
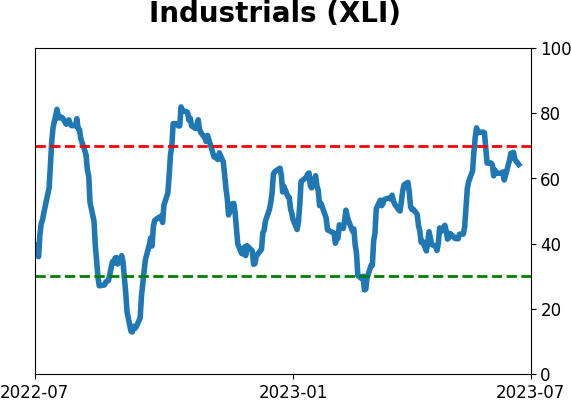
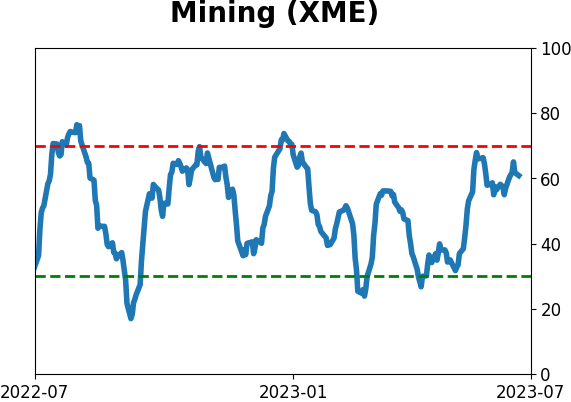
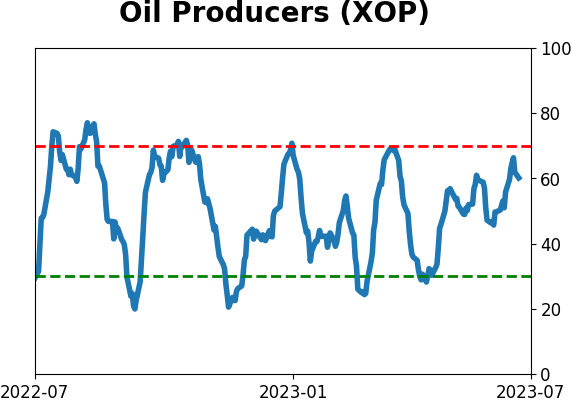
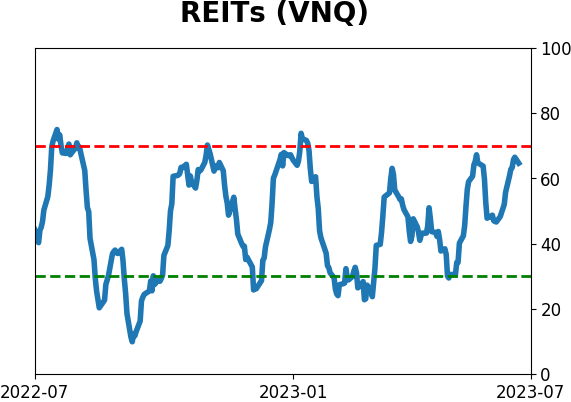
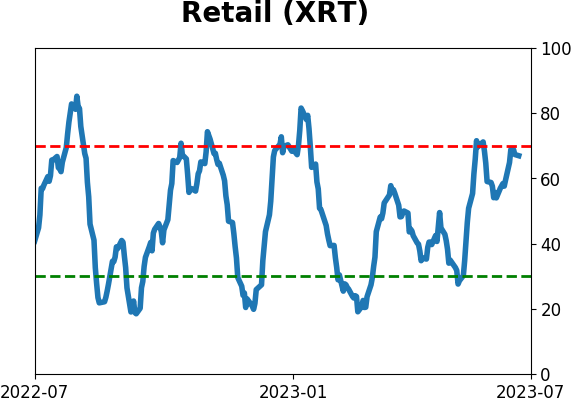
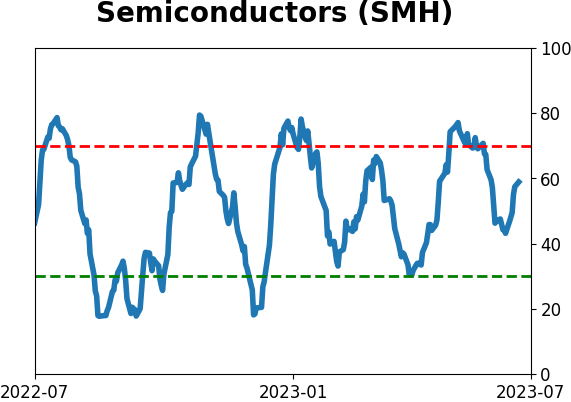
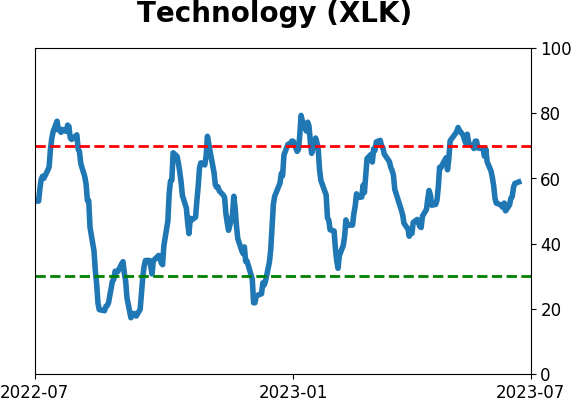
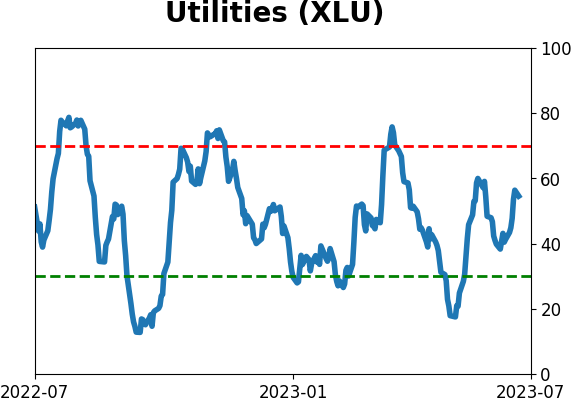
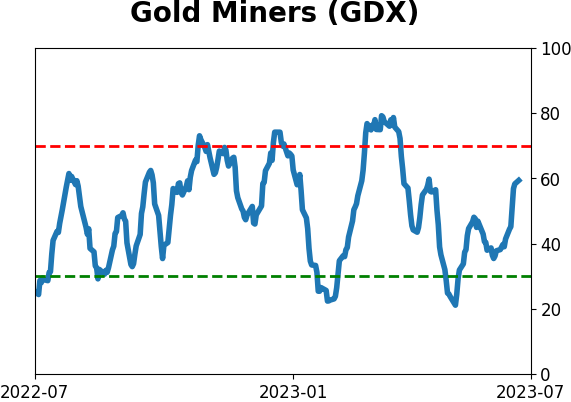
Sector ETF's - 10-Day Moving Average
|
|
|
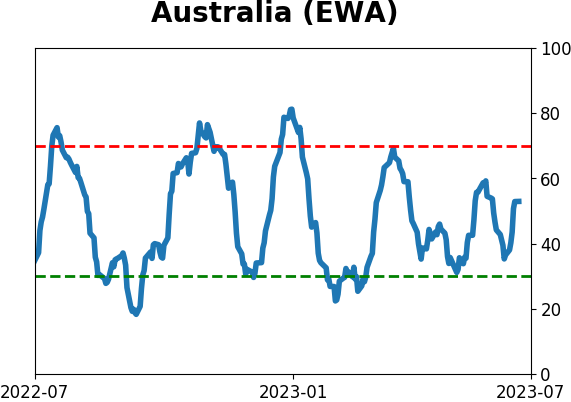
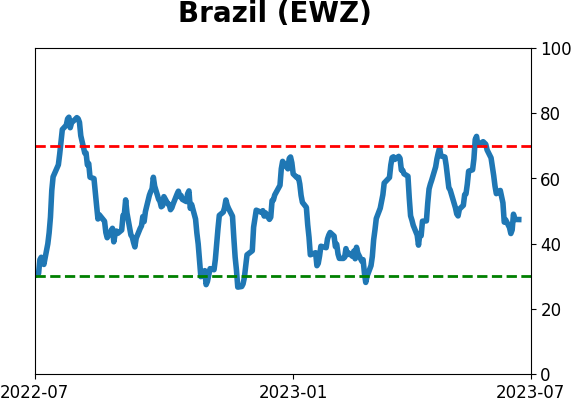
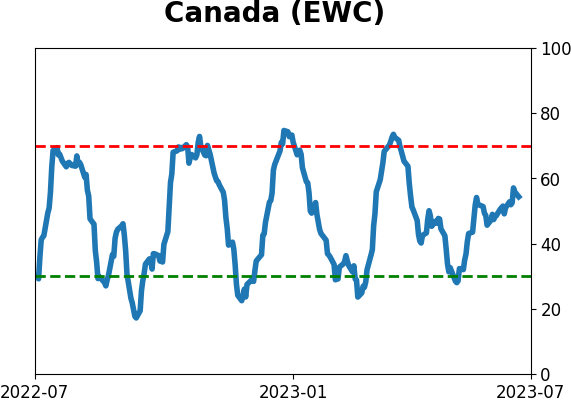
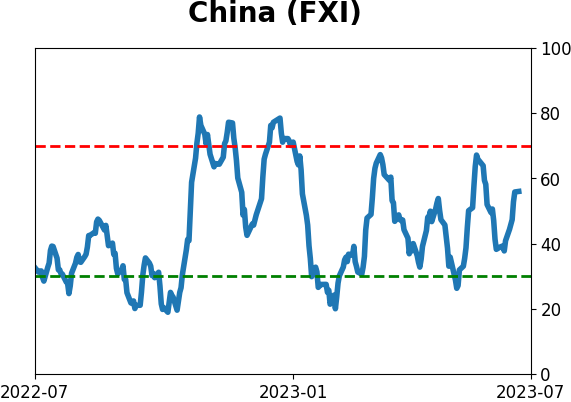
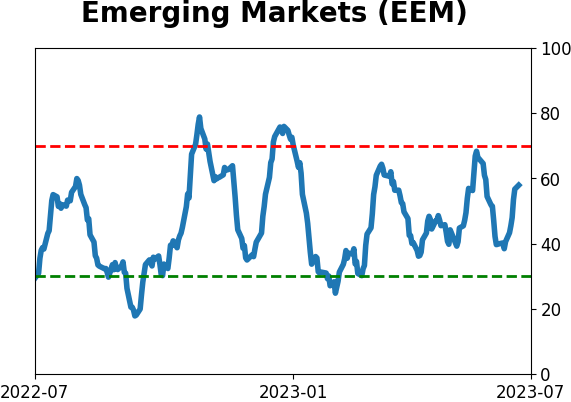
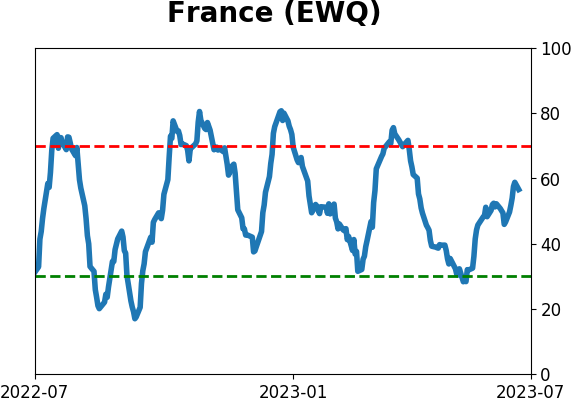
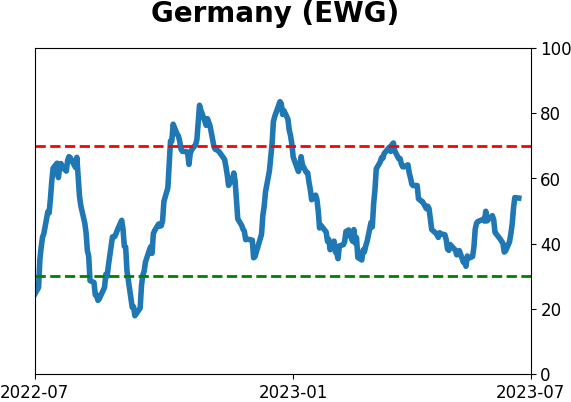
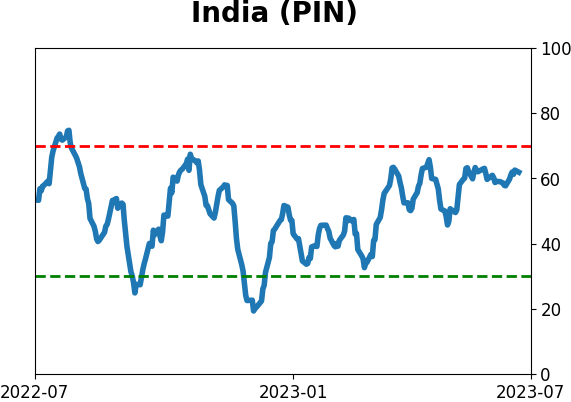
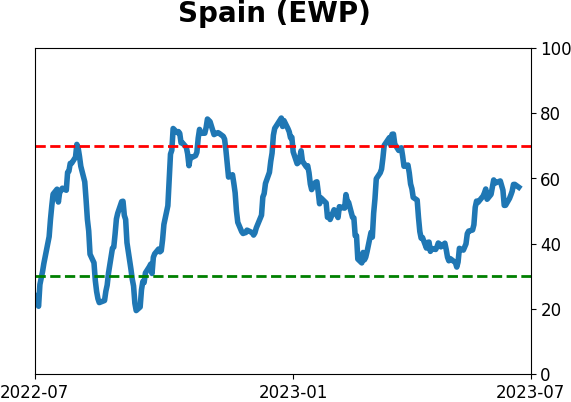
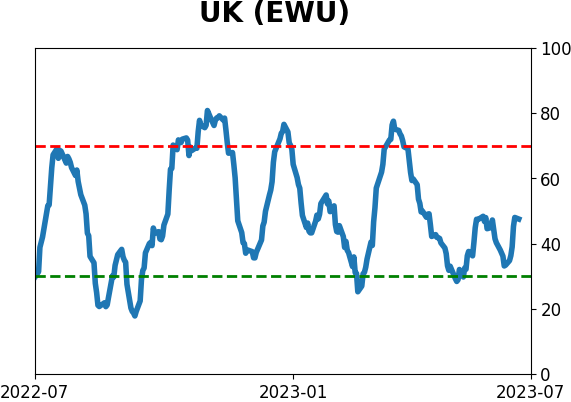
Country ETF's - 10-Day Moving Average
|
|
|
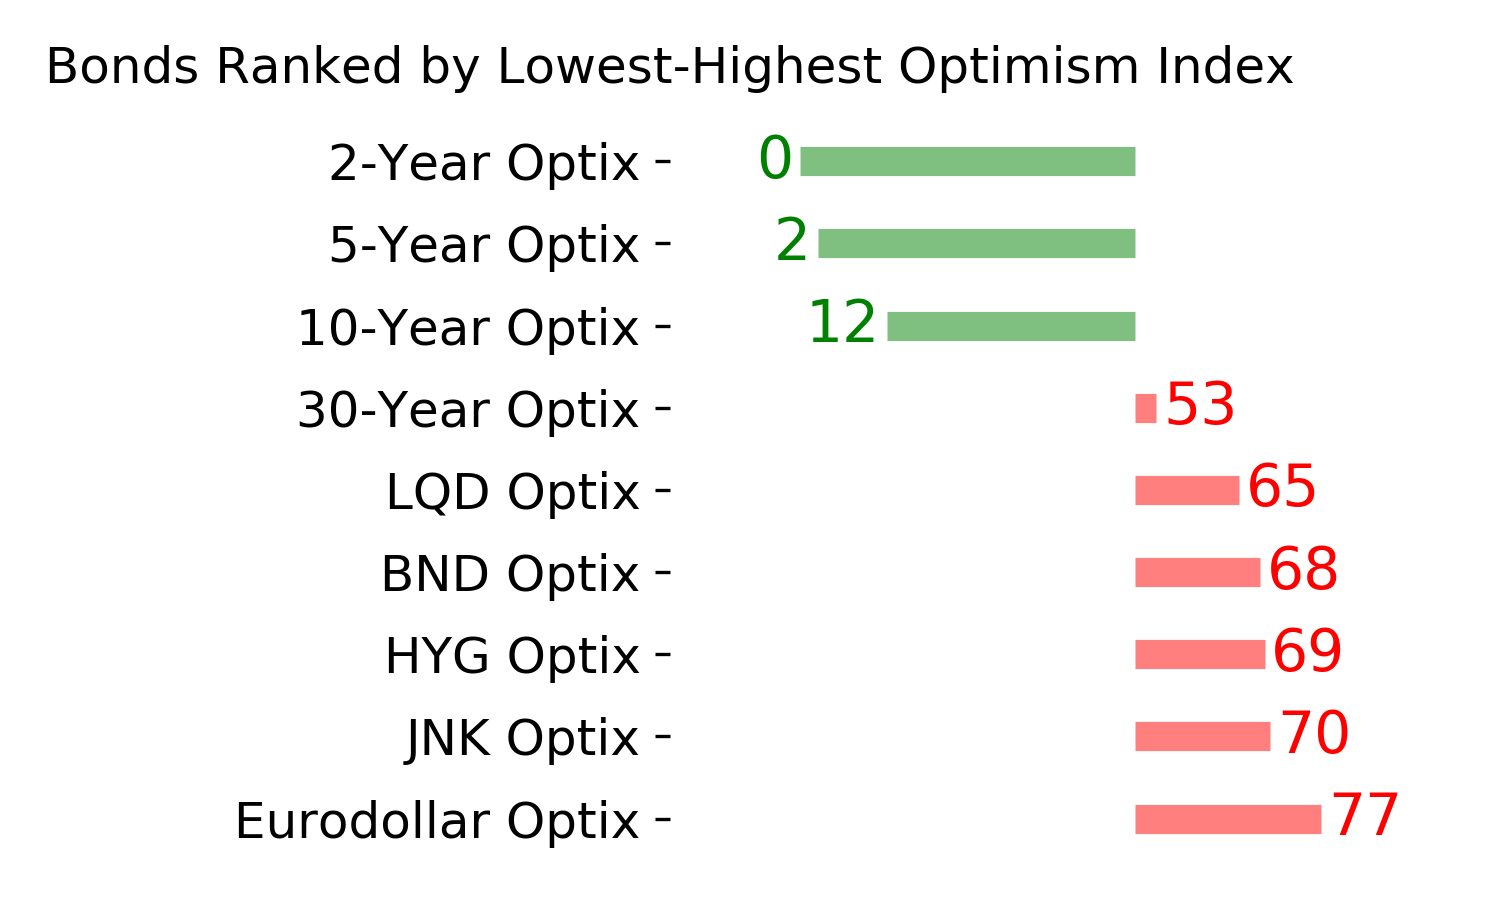
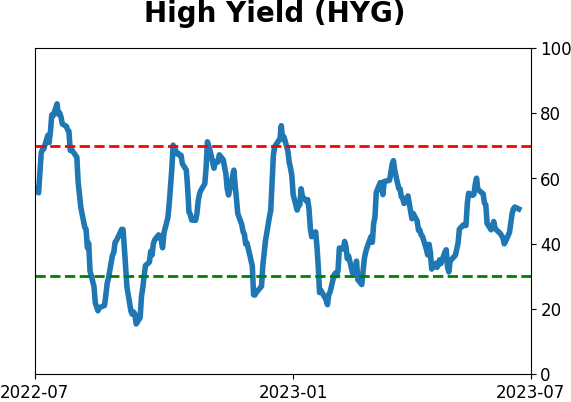
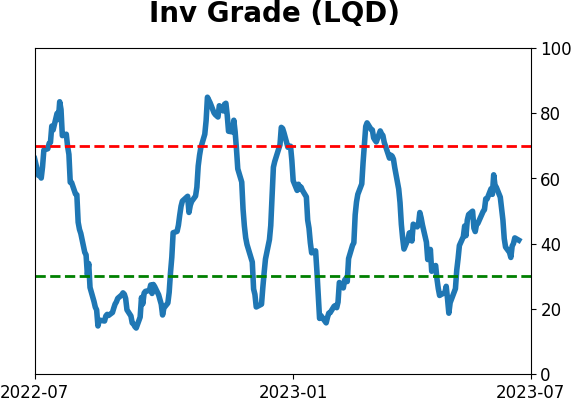
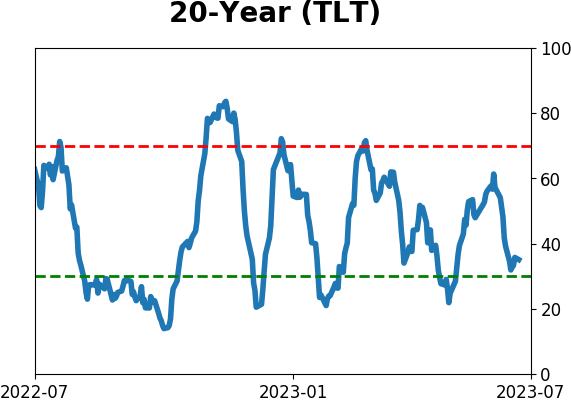
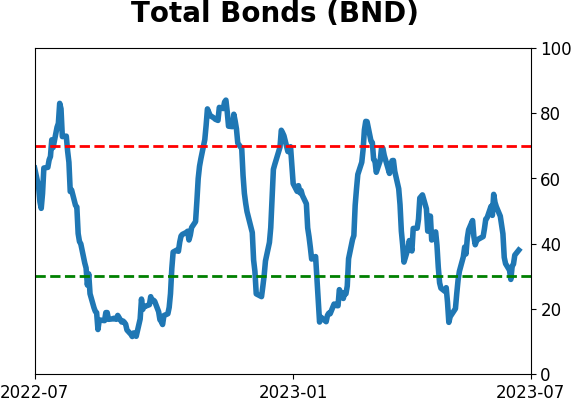
Bond ETF's - 10-Day Moving Average
|
|
|
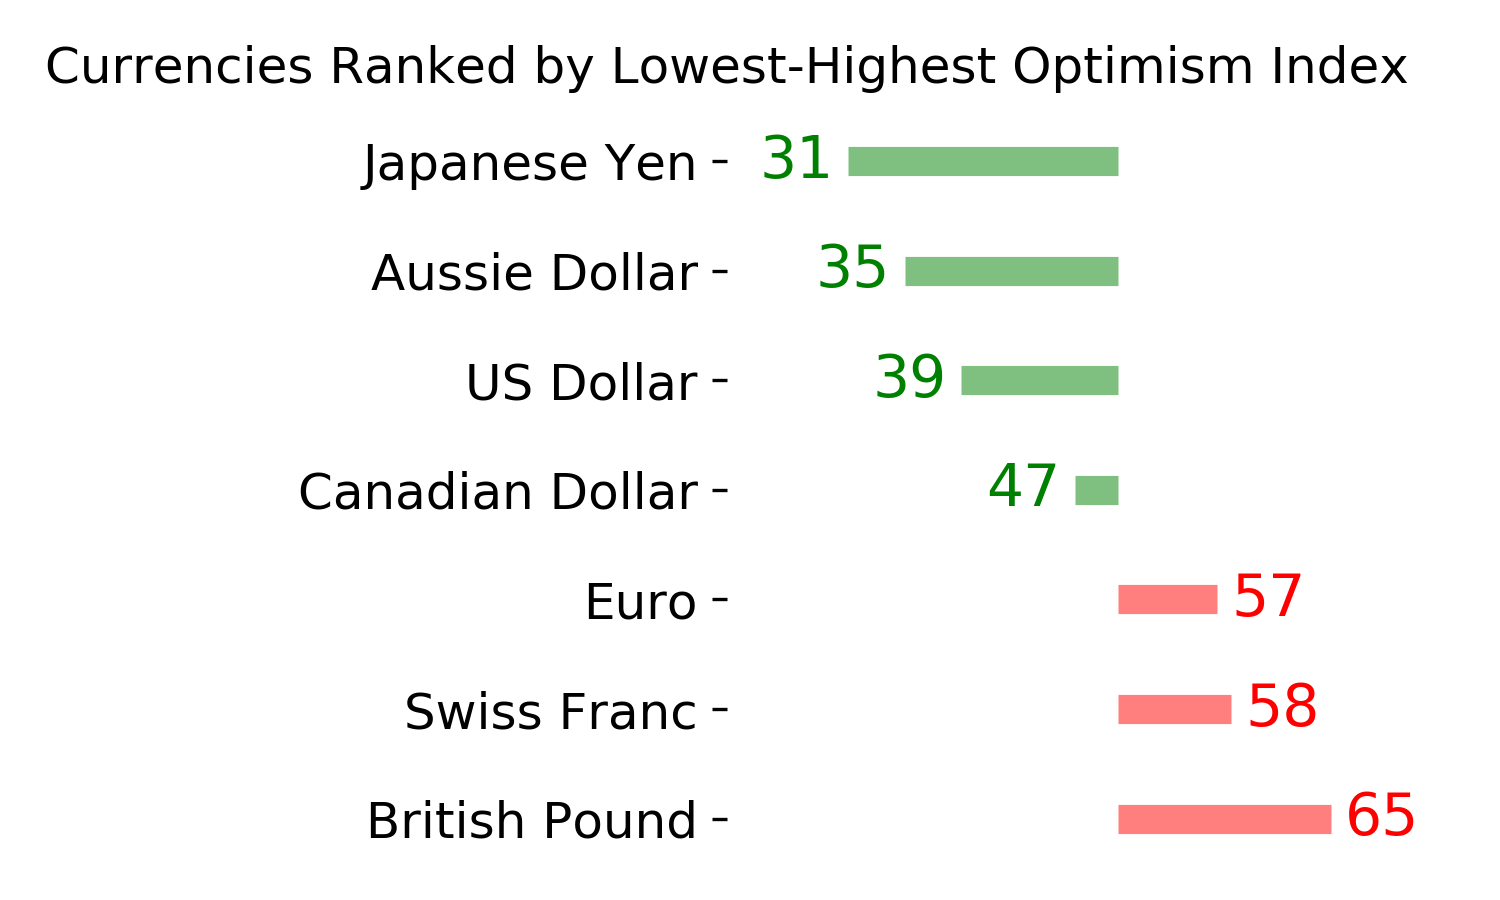
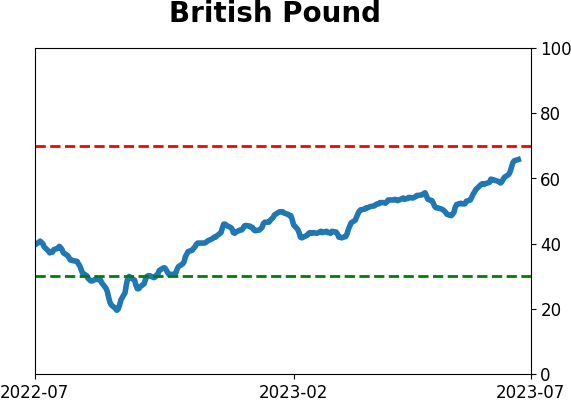
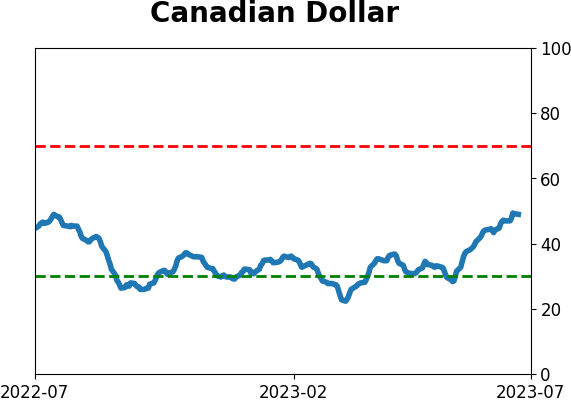
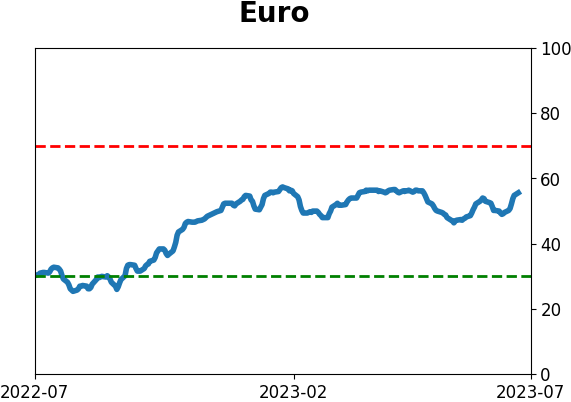
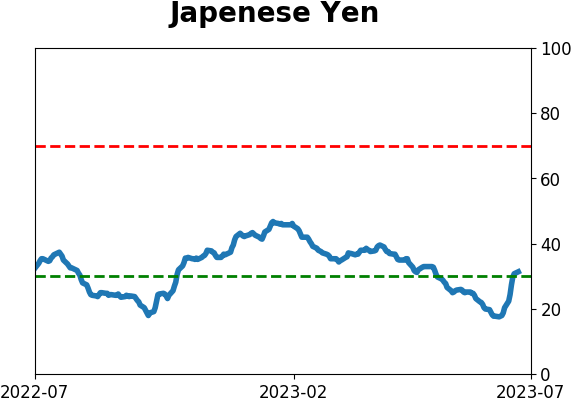
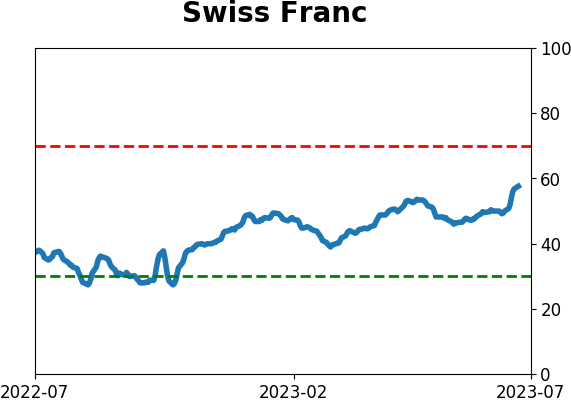
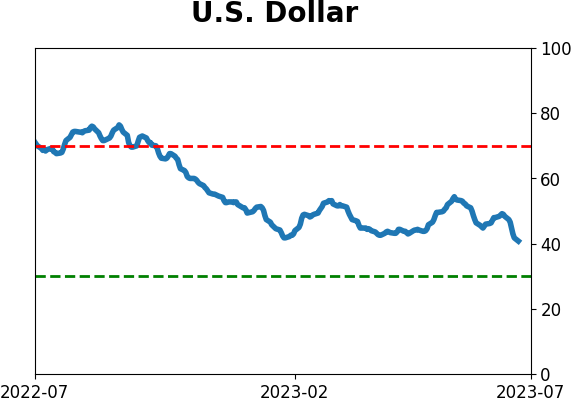
Currency ETF's - 5-Day Moving Average
|
|
|
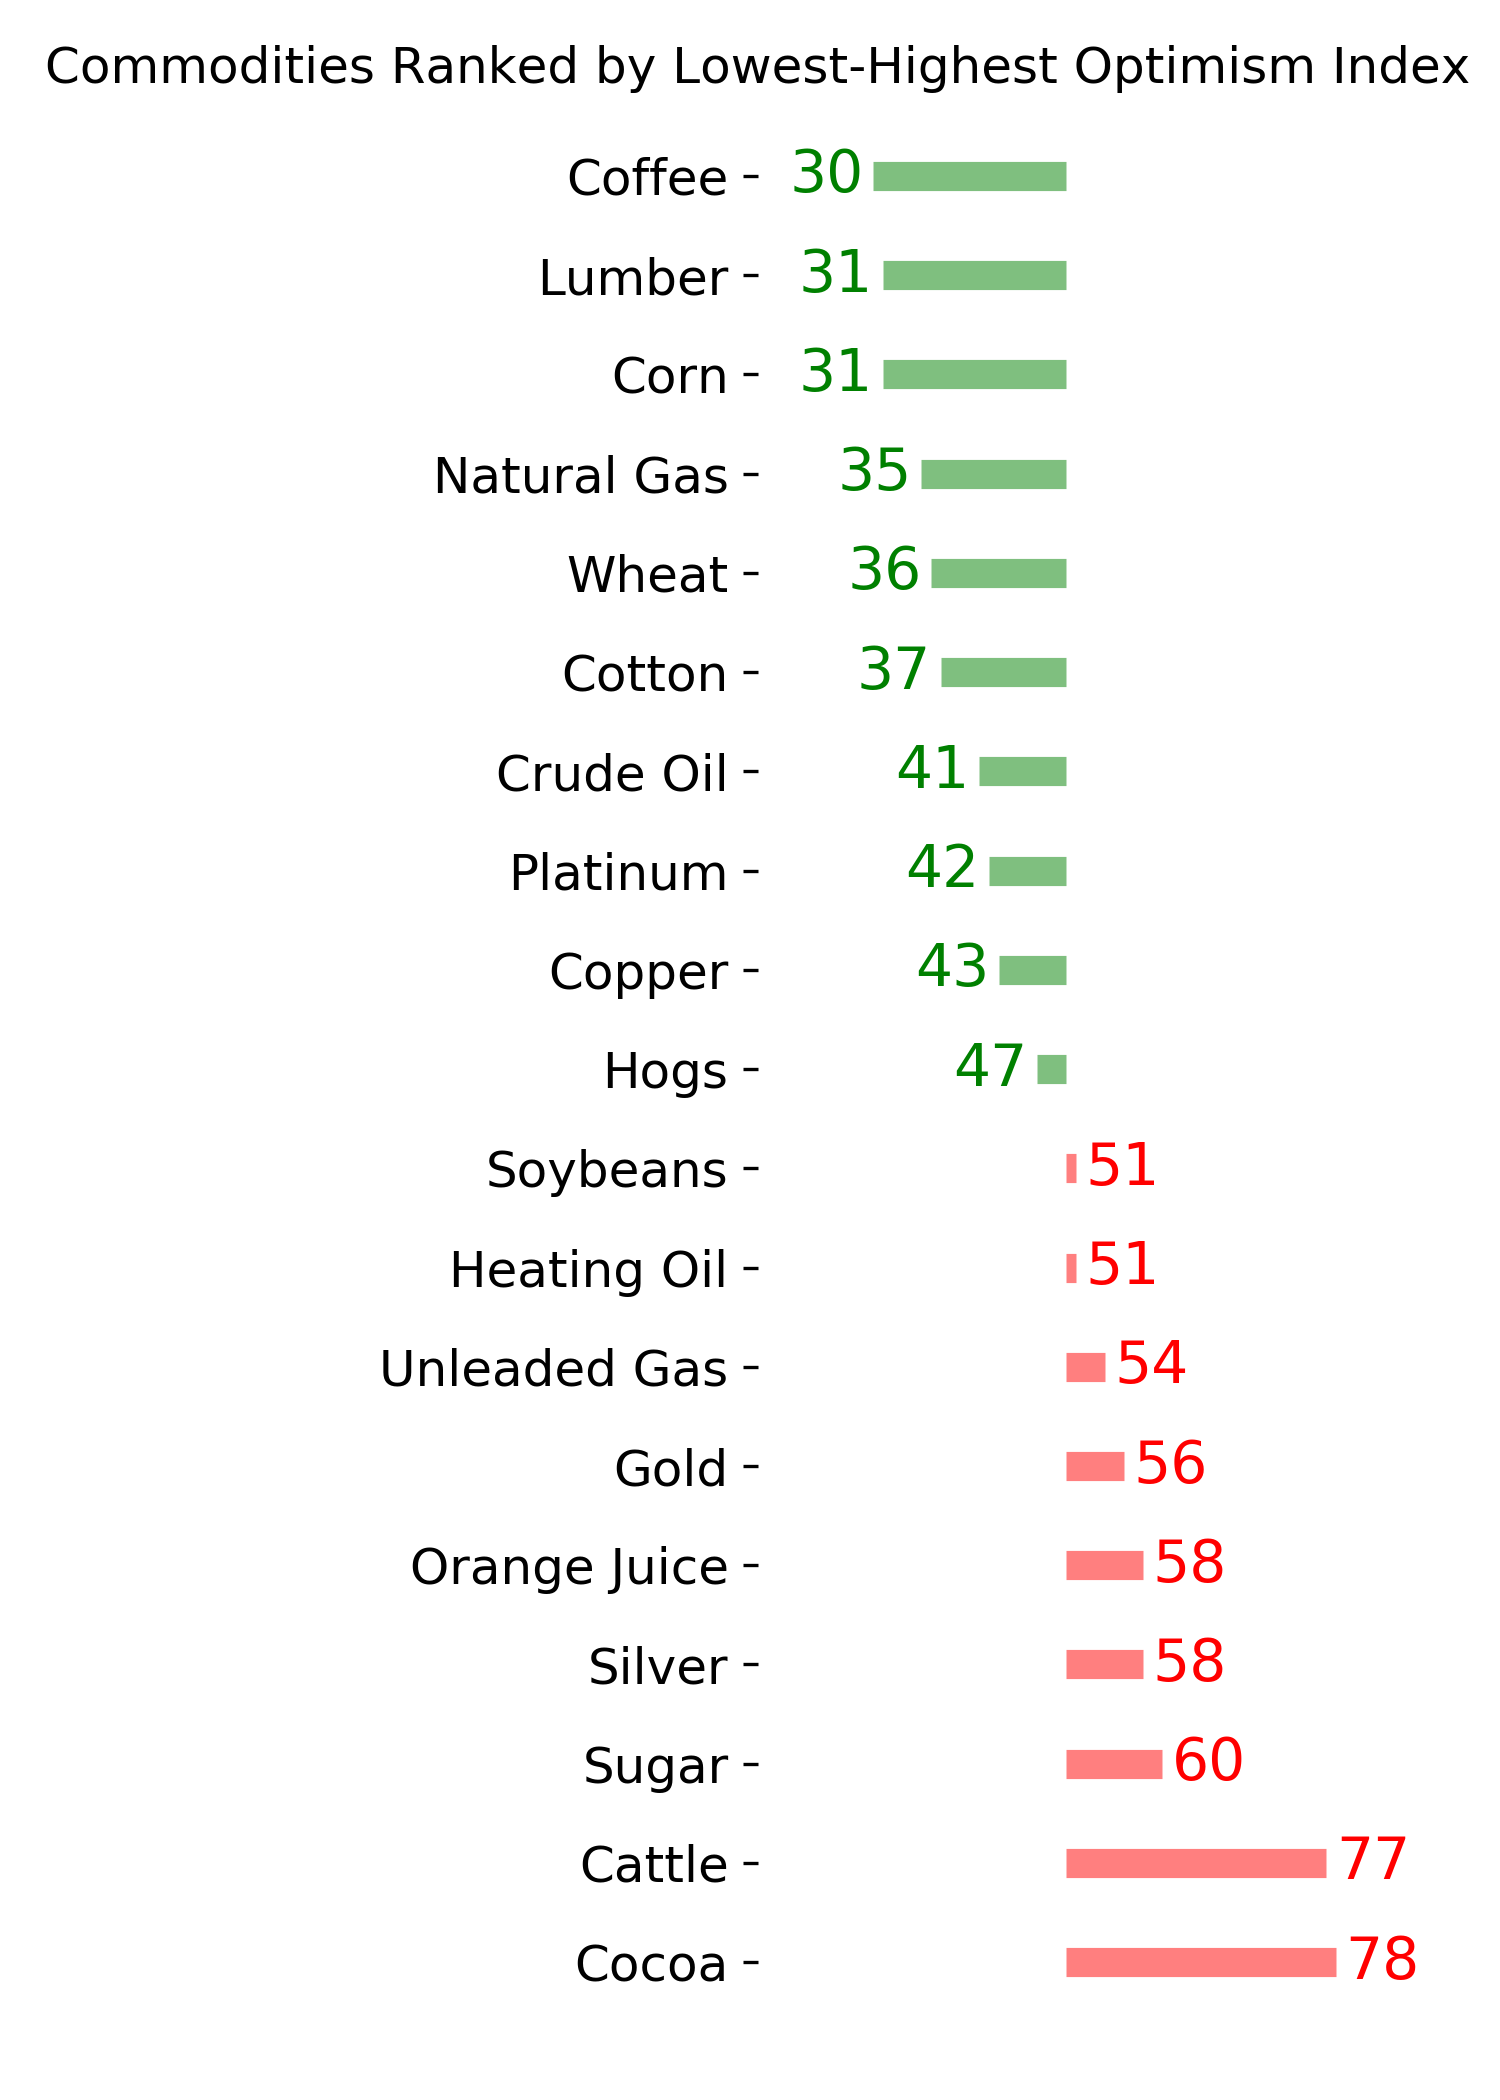
Commodity ETF's - 5-Day Moving Average
|
|