Headlines
|
|
Overbought on every time frame:
The Relative Strength Index (RSI) on the S&P 500 has now become overbought on daily, weekly, monthly, quarterly, and yearly time frames. This is unusually strong and persistent momentum, which has tended to precede good long-term returns. However, the overbought nature across time frames led to below-average short-term returns.
|
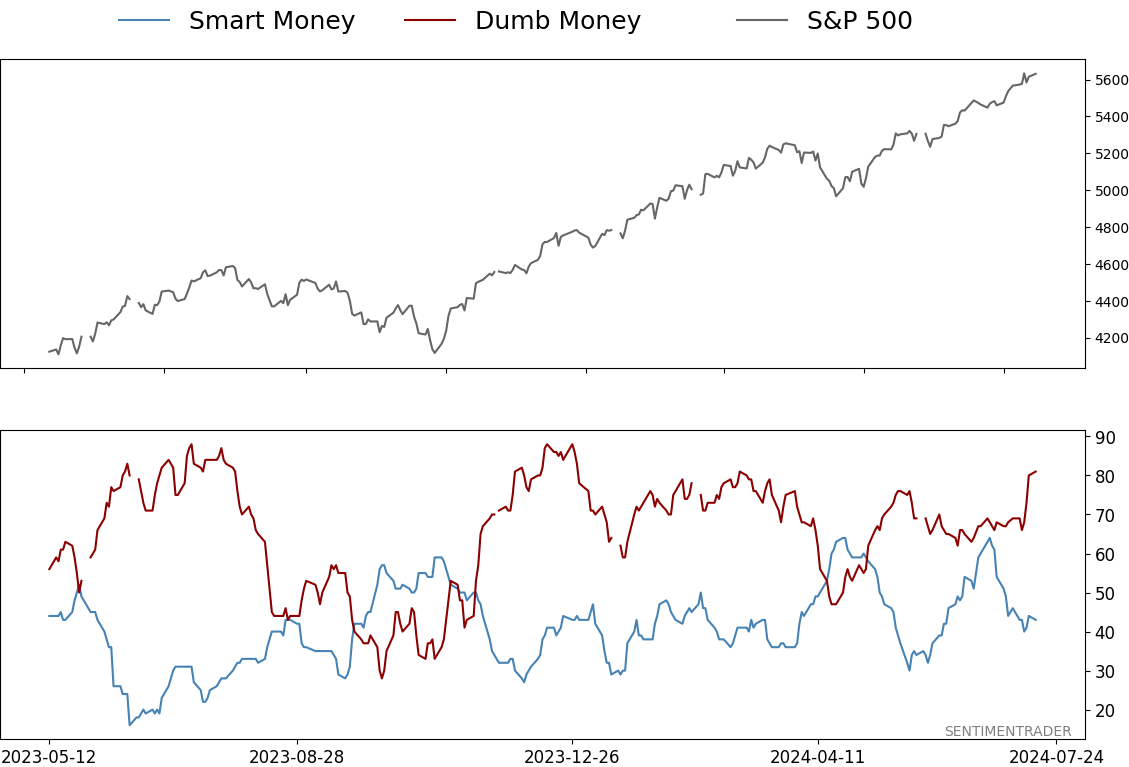
Smart / Dumb Money Confidence
|
Smart Money Confidence: 43%
Dumb Money Confidence: 81%
|
|
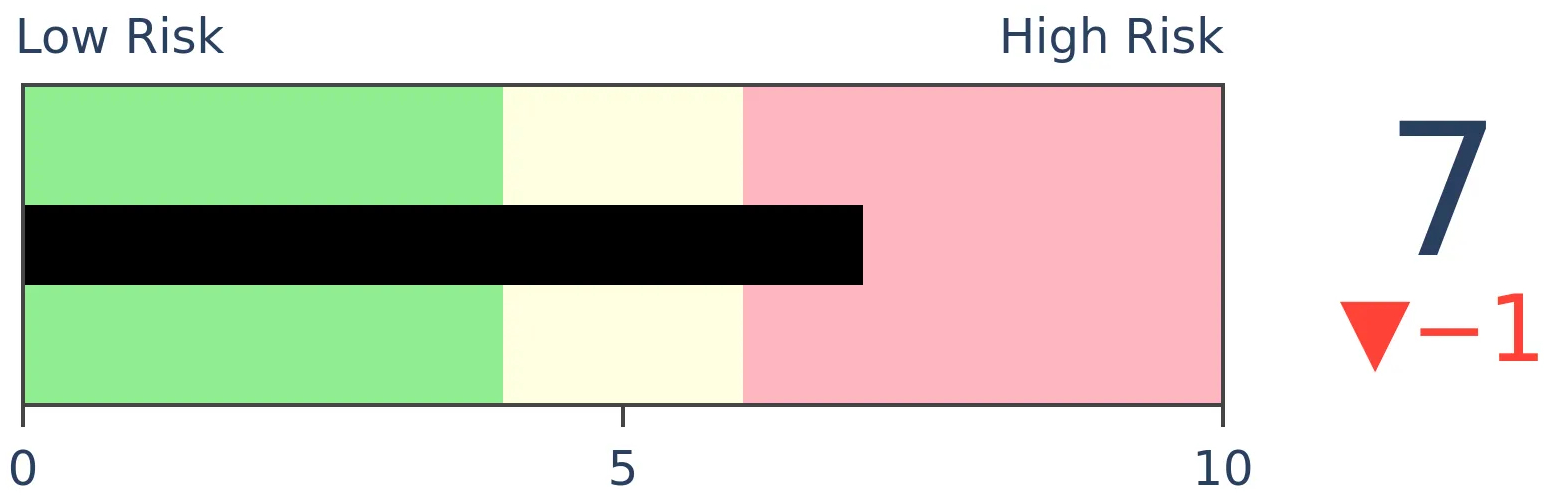
Risk Levels
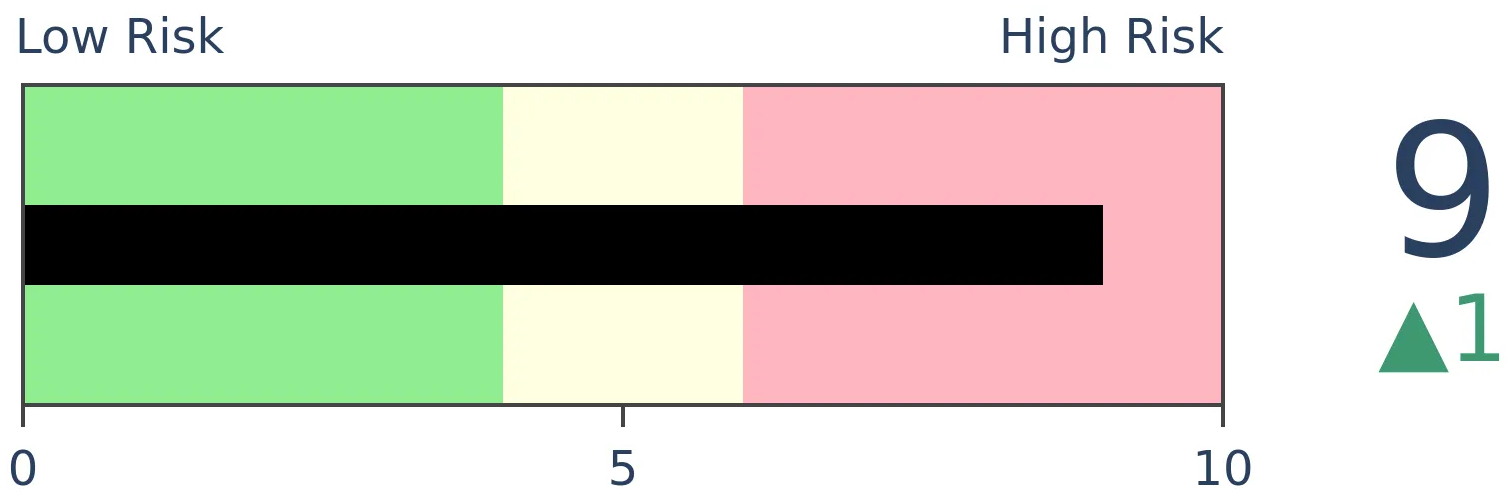
Stocks Short-Term
|
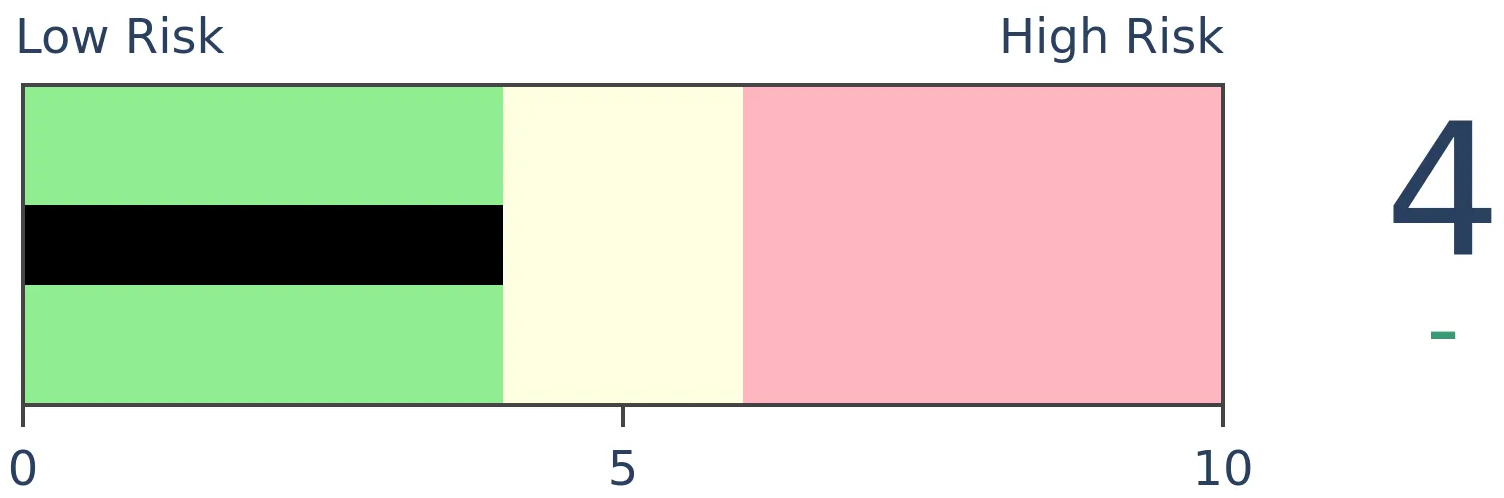
Stocks Medium-Term
|
|
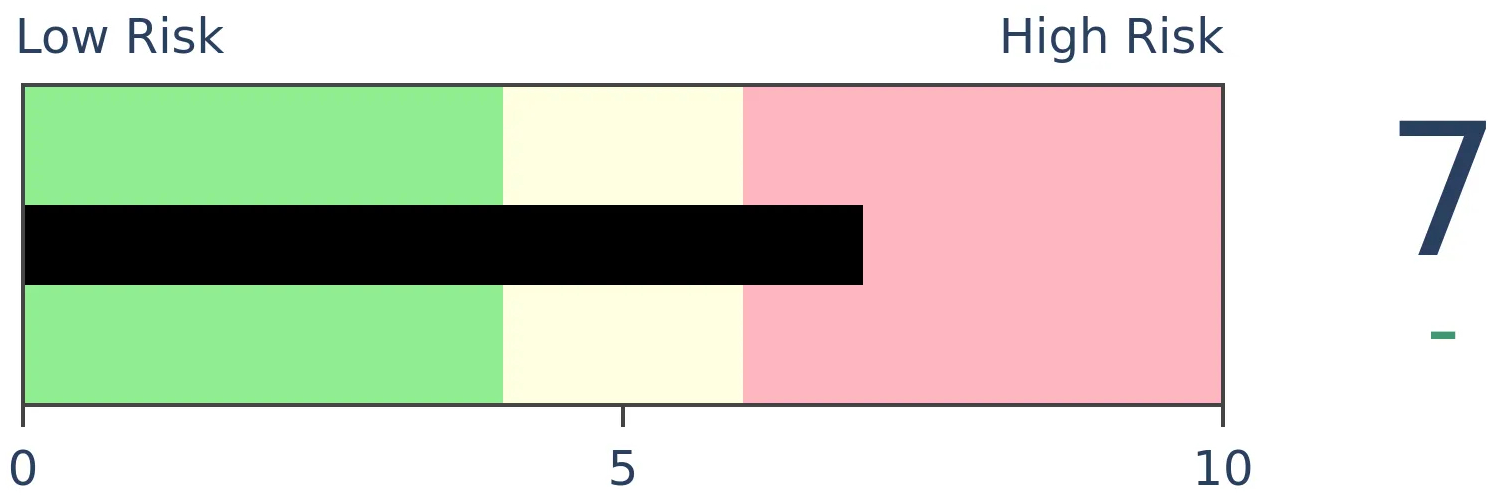
Bonds

|
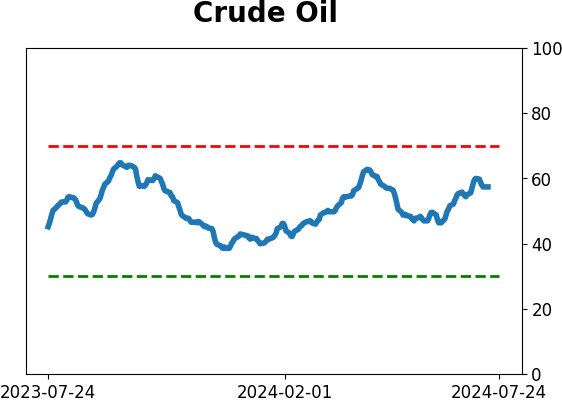
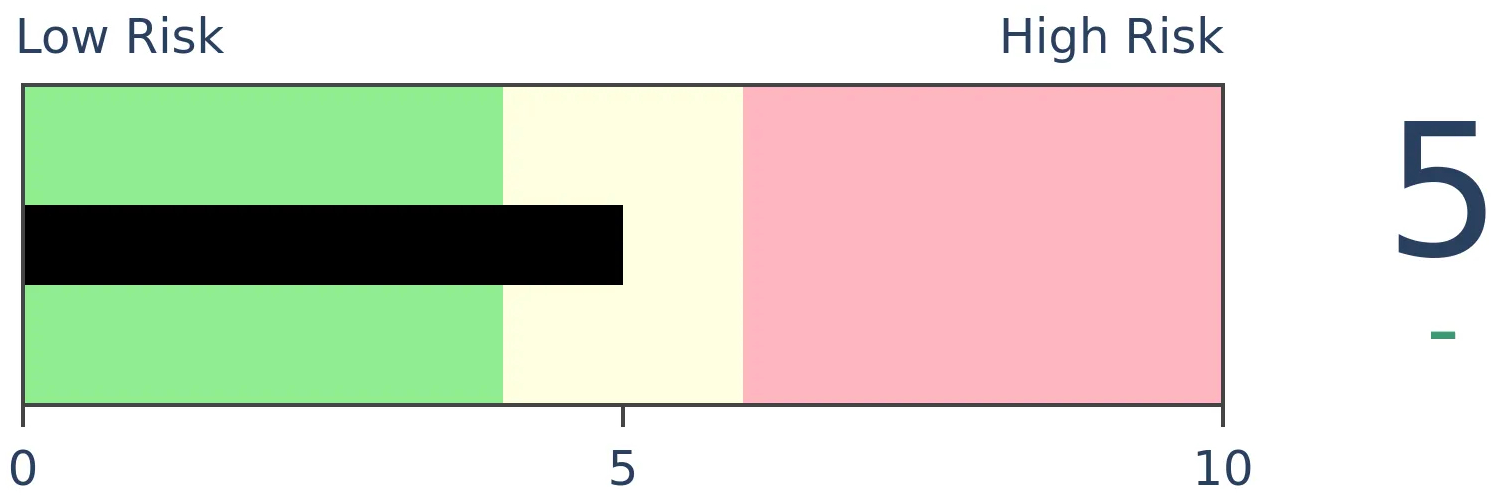
Crude Oil
|
|
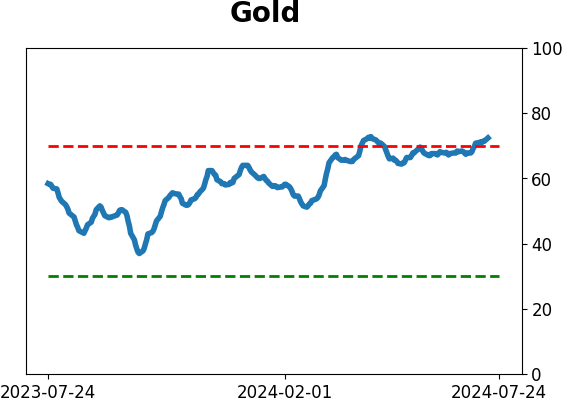
Gold
|
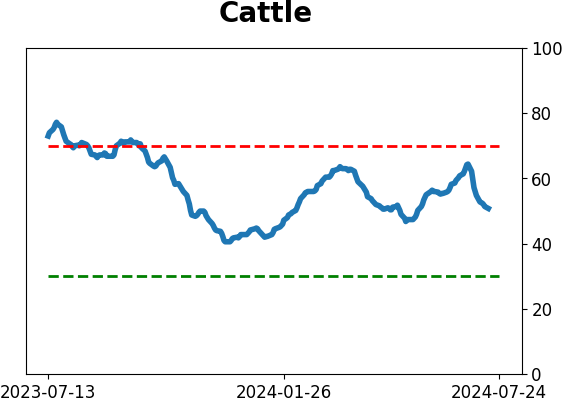
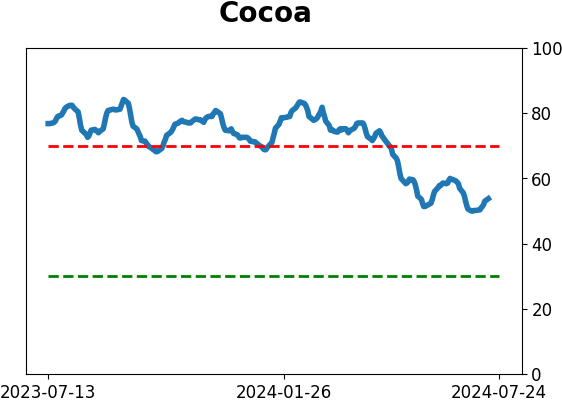
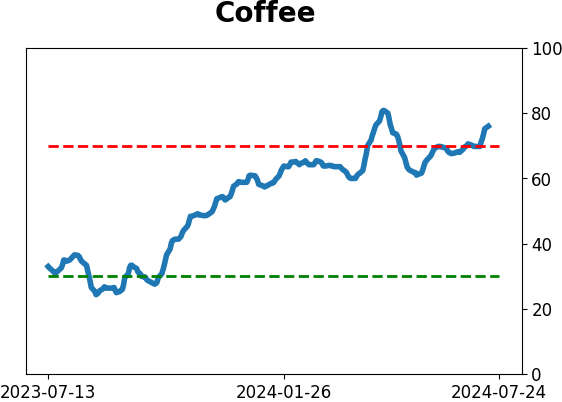
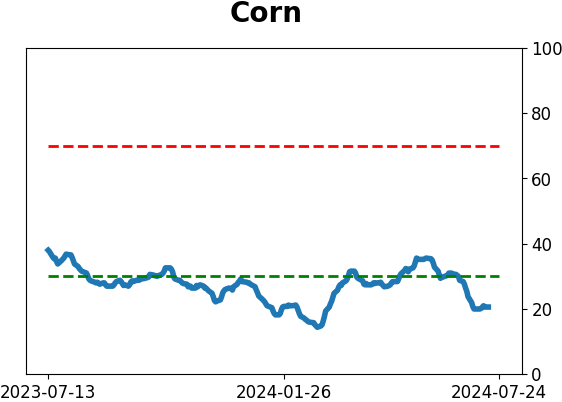
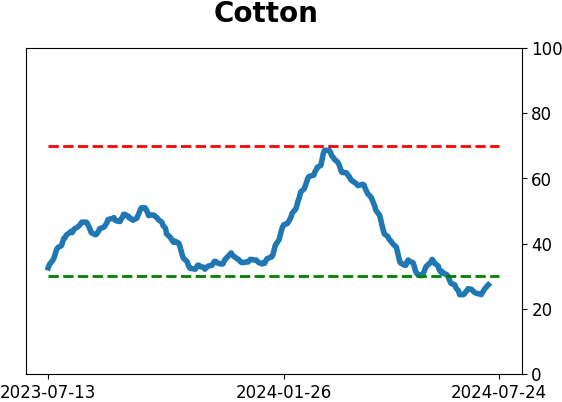
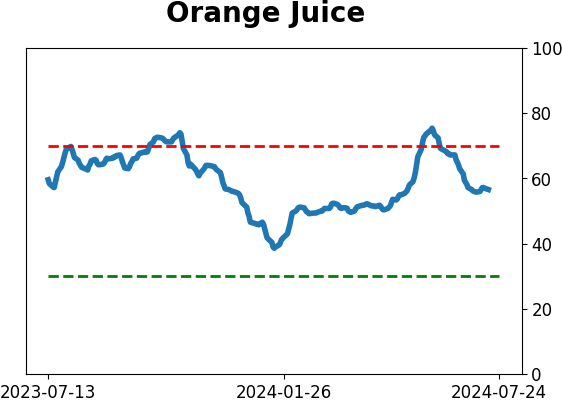
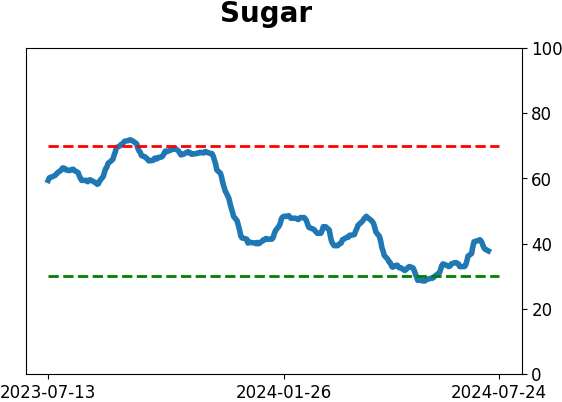
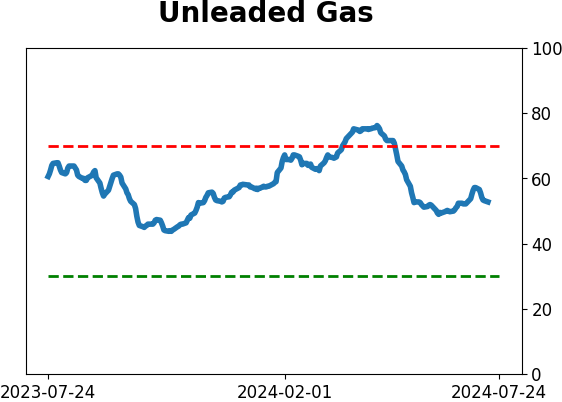
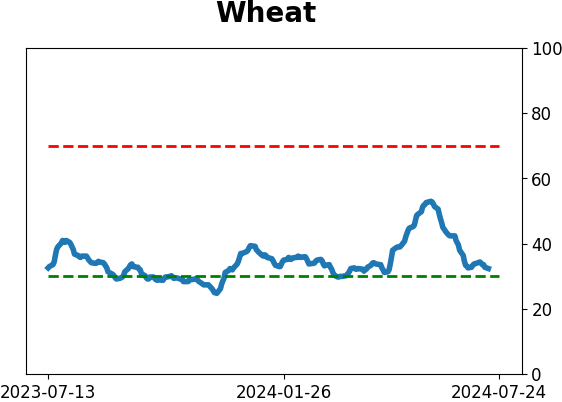
Agriculture
|
|
Research
By Jason Goepfert
BOTTOM LINE
The Relative Strength Index (RSI) on the S&P 500 has now become overbought on daily, weekly, monthly, quarterly, and yearly time frames. This is unusually strong and persistent momentum, which has tended to precede good long-term returns. However, the overbought nature across time frames led to below-average short-term returns.
FORECAST / TIMEFRAME
None
|
Key points:
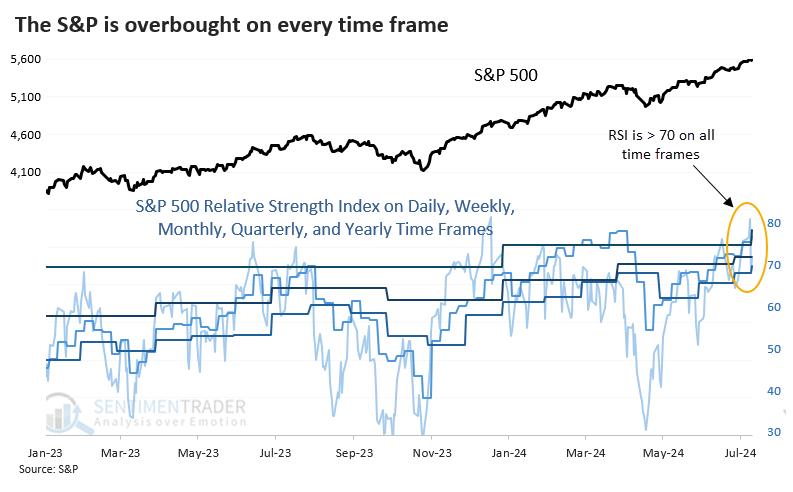
- The S&P 500 is overbought on every time frame
- When the Relative Strength Index is above 70 on five time frames, annualized returns have suffered
- Such strong and persistent momentum tended to lead to poor short-term returns and strong long-term ones
Winning on every time frame
For the stock market, it has been a very good few days. And weeks. And months. And quarters. And years. So good that the S&P 500 is overbought across each of those time frames.
The concept of "overbought" is subjective, easily misconstrued, and usually not very helpful. So, we'll use a standard indicator and standard settings to minimize those dangers and then see how investors behaved after similar performance.
To that end, the 14-period Relative Strength Index (RSI) is now above 70 on daily, weekly, monthly, quarterly, and yearly time frames for the first time in three years.
The chart gets cluttered with multiple time frames, so the one below clarifies how powerful this momentum is by only showing the minimum RSI value across all five time frames. For the indicator to be above 70, the RSI on the daily, weekly, monthly, quarterly, and yearly time frames all have to be above 70.
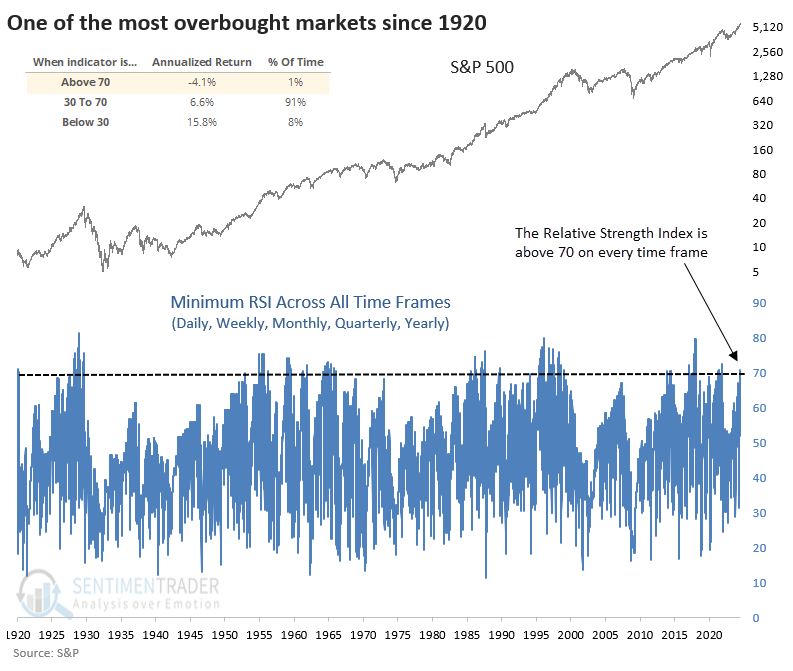
The S&P 500's annualized return was -4.1% when the minimum RSI was 70 or greater. That's far below a non-extreme return.
A victim of its success
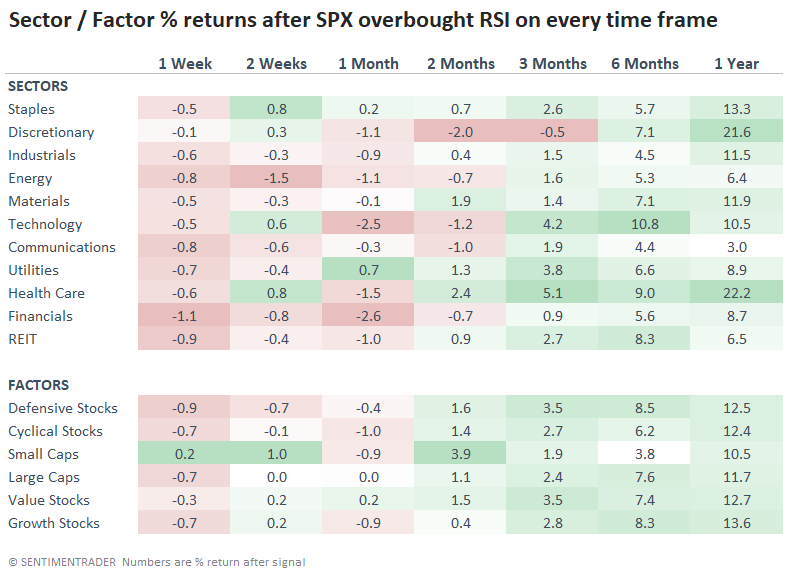
The table below shows how the S&P performed after the minimum RSI across all time frames exceeded 70 for the first time in at least a year.
Because the annualized return was so poor, it's not surprising that short-term returns in the table were also well below average. Risk exceeded reward up to three months later. As we see with many momentum-based signals, returns over the following six months were very good.
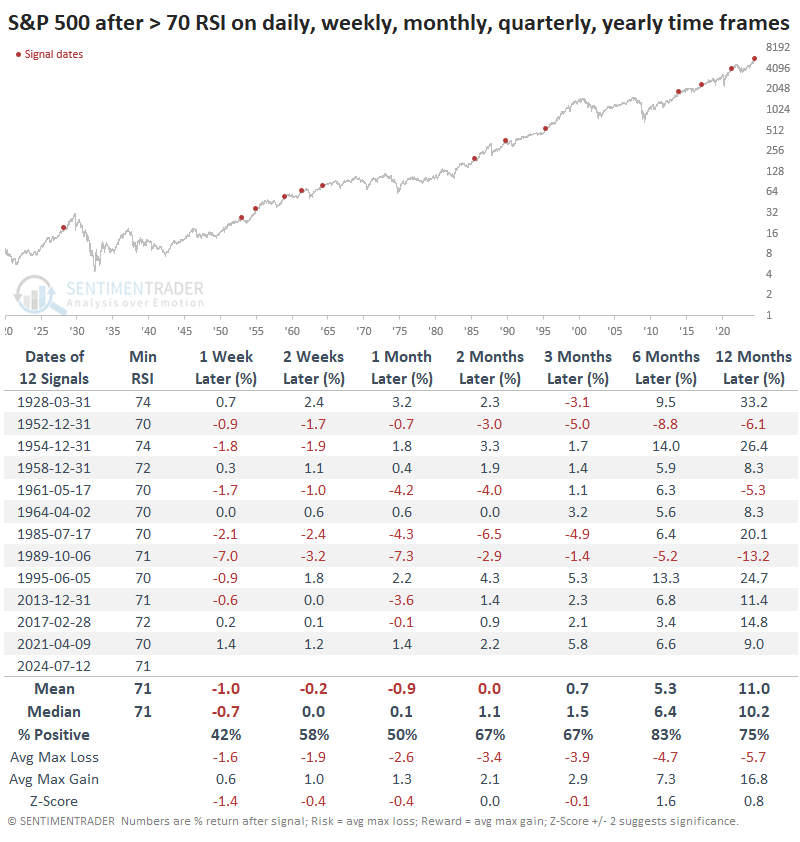
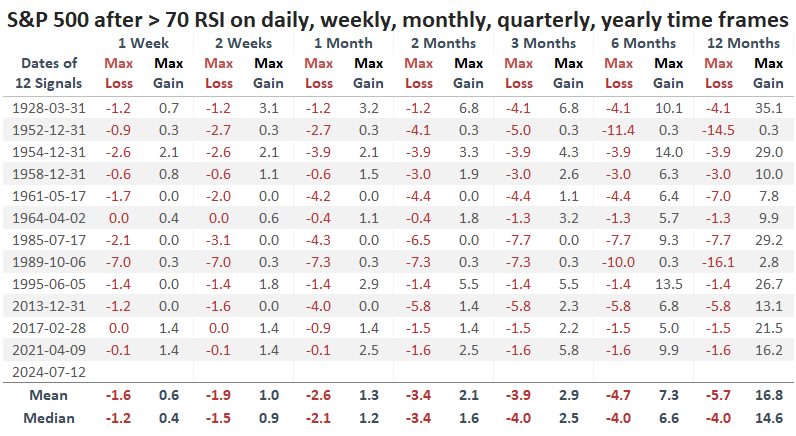
Even though the risk/reward ratio over the next few months was poor, it was rare to see a significant decline, which is also consistent with most momentum-based extremes. Within the next three months, there were no declines larger than -10%; of course, there were no gains larger than +10%, either.
After these momentum extremes in the S&P, there was a pretty clear bias toward defensive sectors. The spread between staples and discretionary stocks was stark over the next two to three months. Technology stocks also fared relatively poorly, while health care did well.
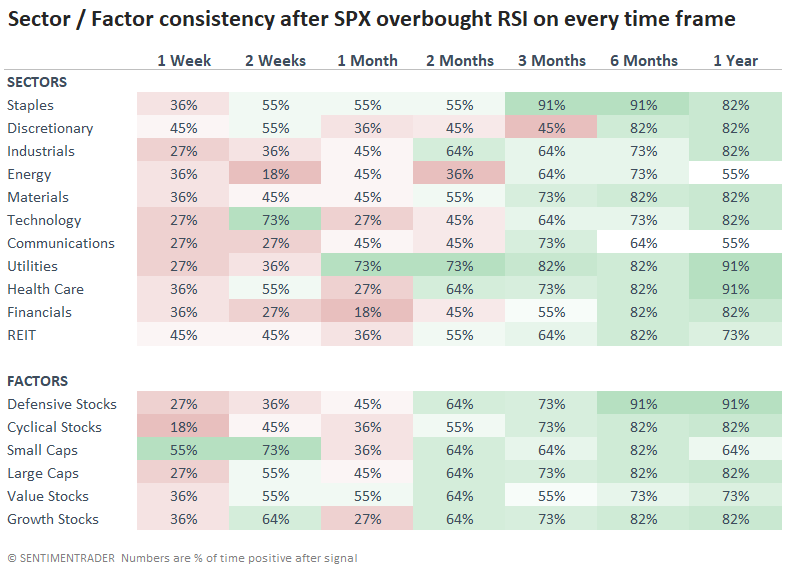
The win rates for the sectors were similarly stark. Three months later, staples gained 91% of the time, versus only 45% for discretionary stocks. Health care struggled in the short term but, as noted above, picked up over the medium term.
What the research tells us...
The major indexes have shrugged off concerns for weeks, even months. While the average stock has not had it nearly as easy, it's picked up its pace lately. That's usually a positive long-term sign.
For the S&P, the tendency to rebound from the slightest weakness has morphed into a situation where momentum is strong in every time frame. This is highly unusual, and when it seems like nothing can take the market down, it tends to become a victim of its own success. When the RSI on all time frames pokes into overbought territory, forward returns were suspect, but only in the short term. Longer term, this is a moderately good sign of investor demand.
Indicators at Extremes
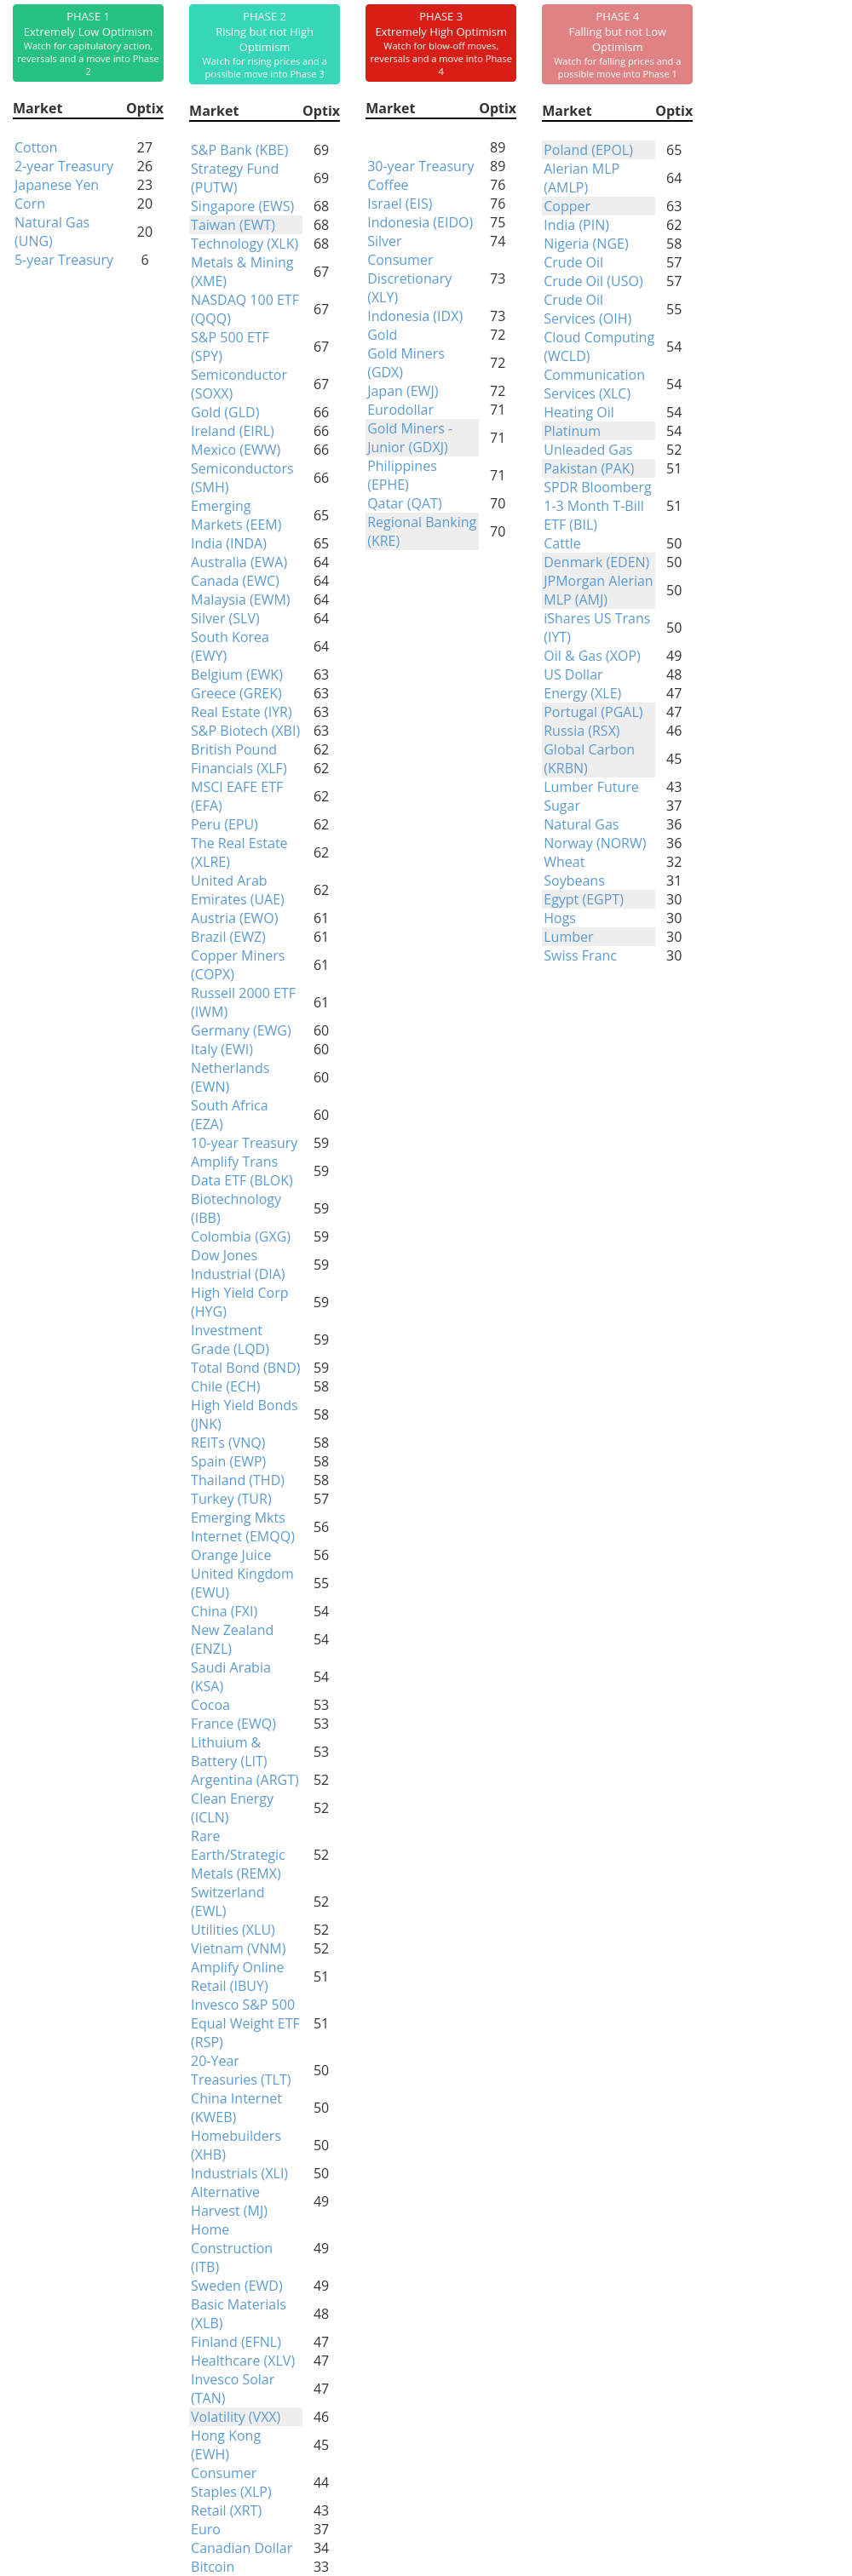
Phase Table
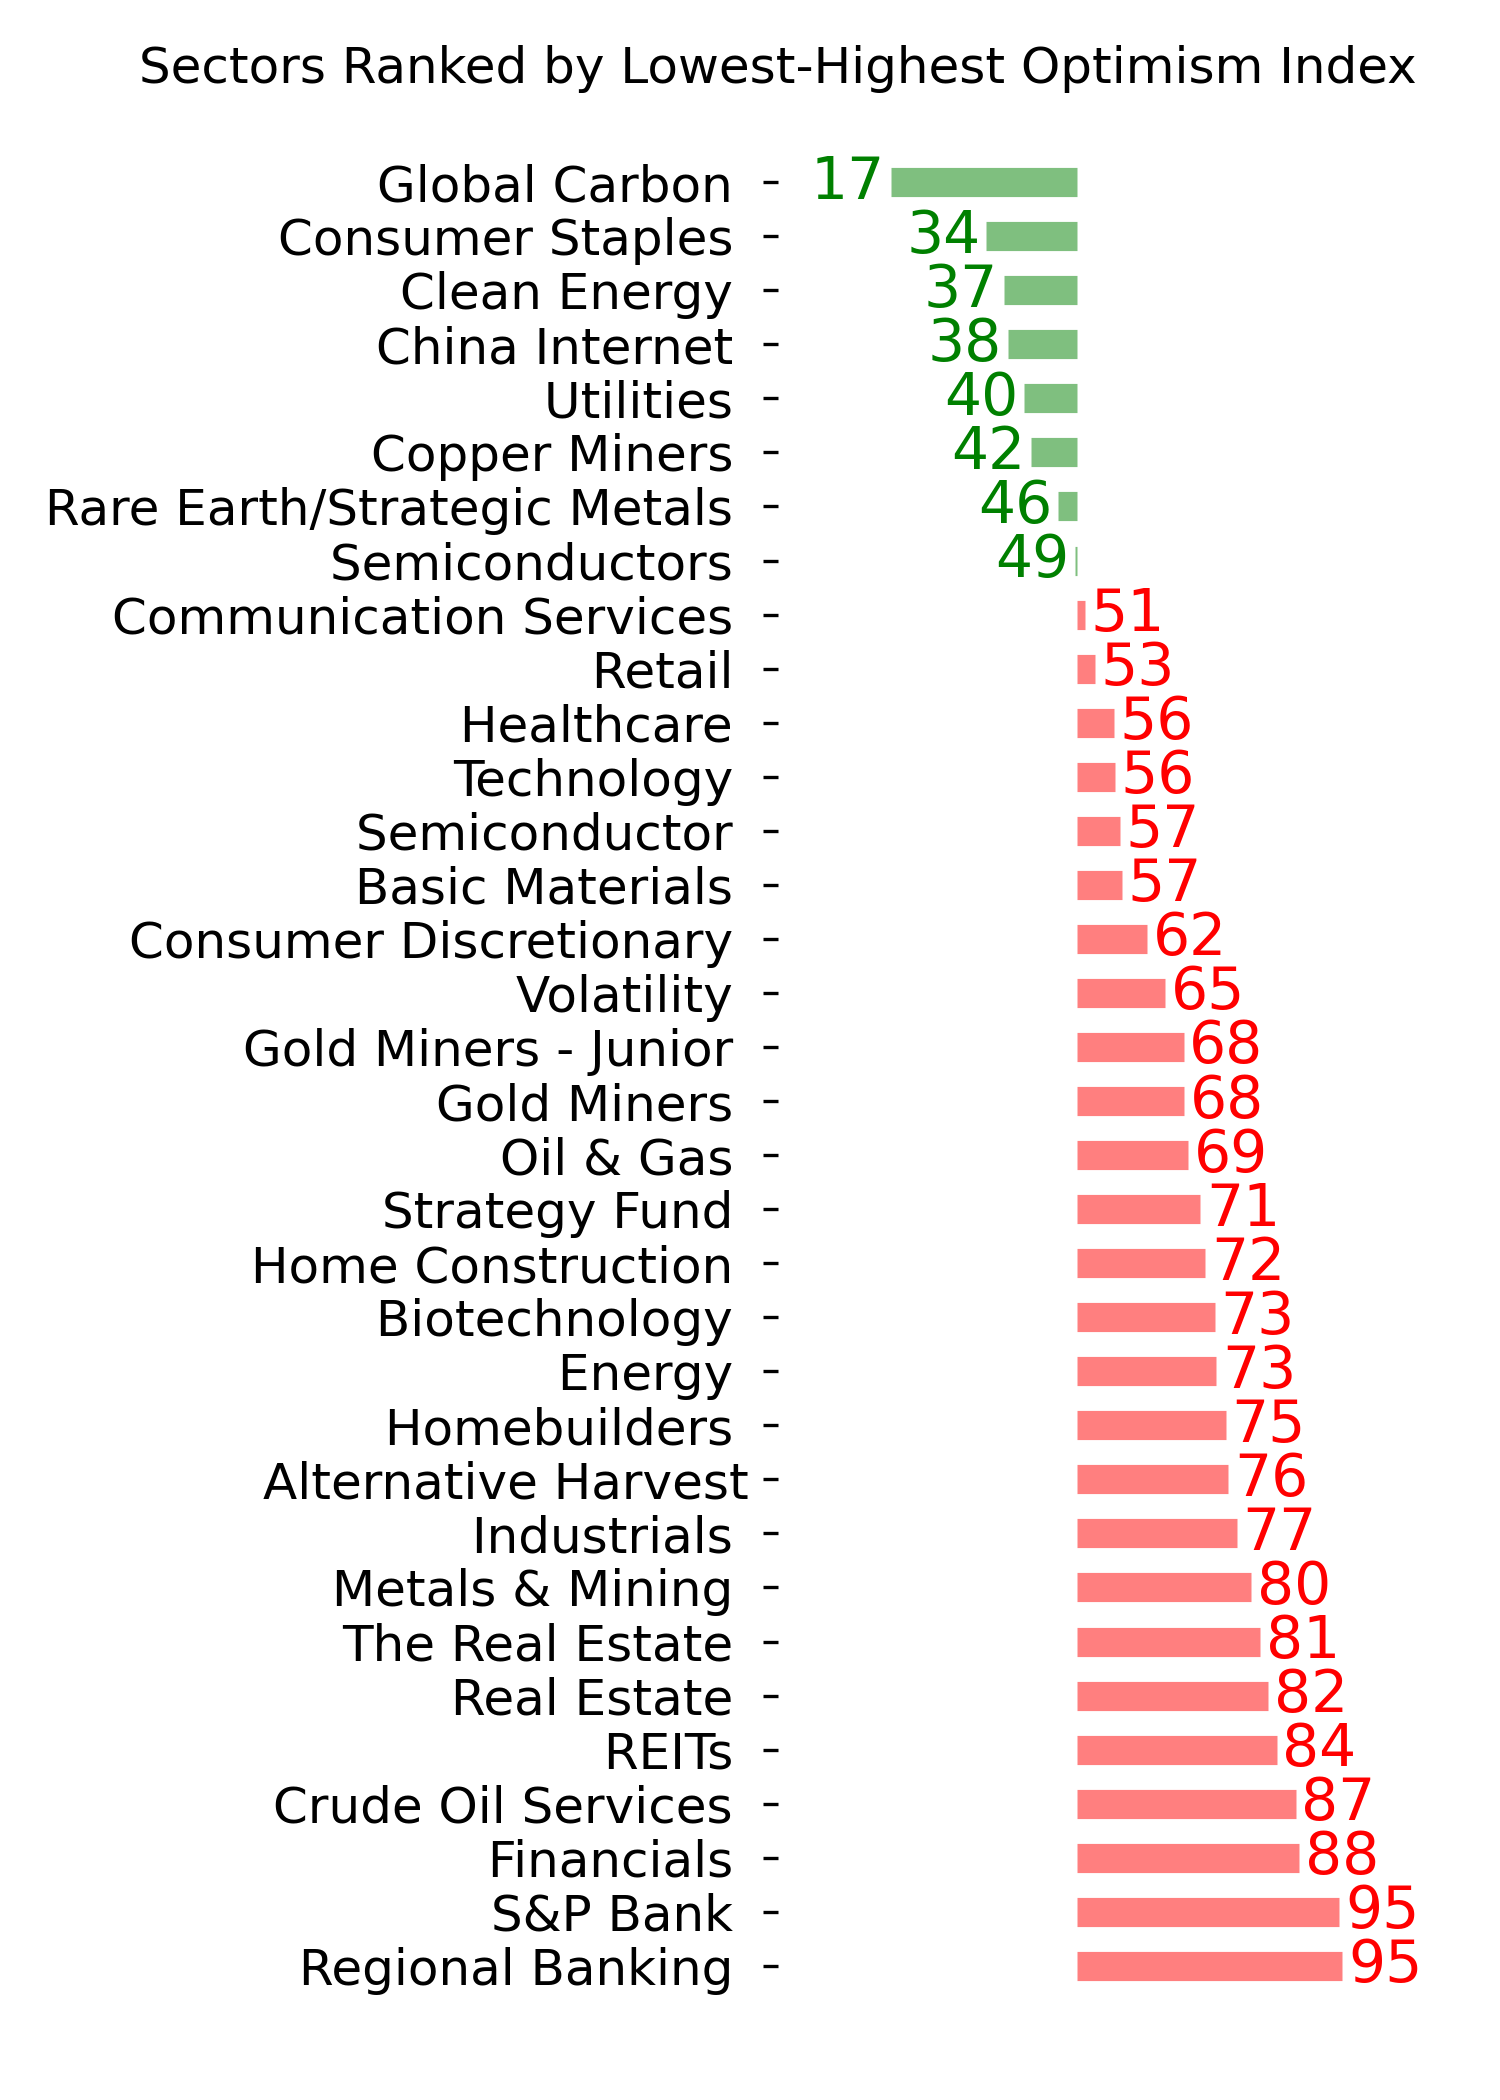
Ranks
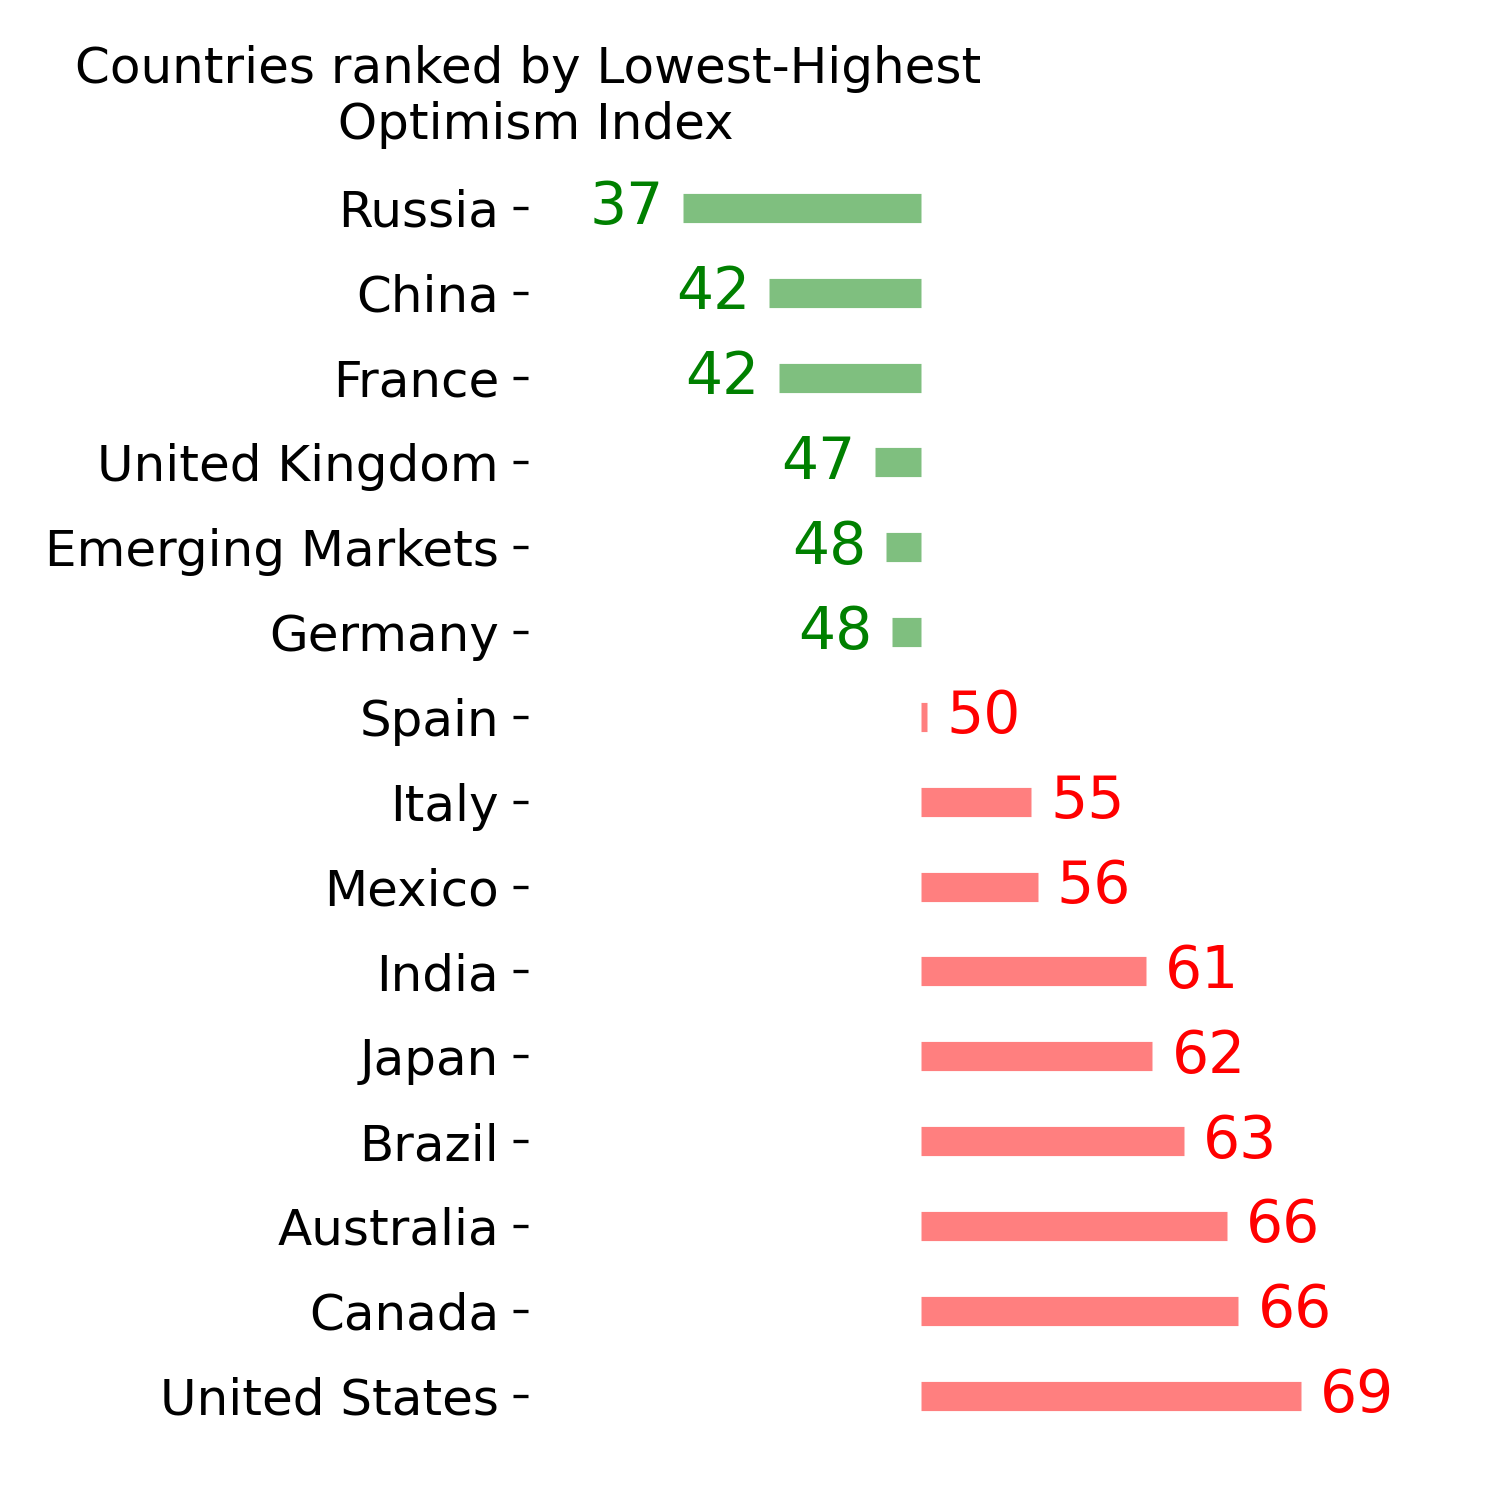
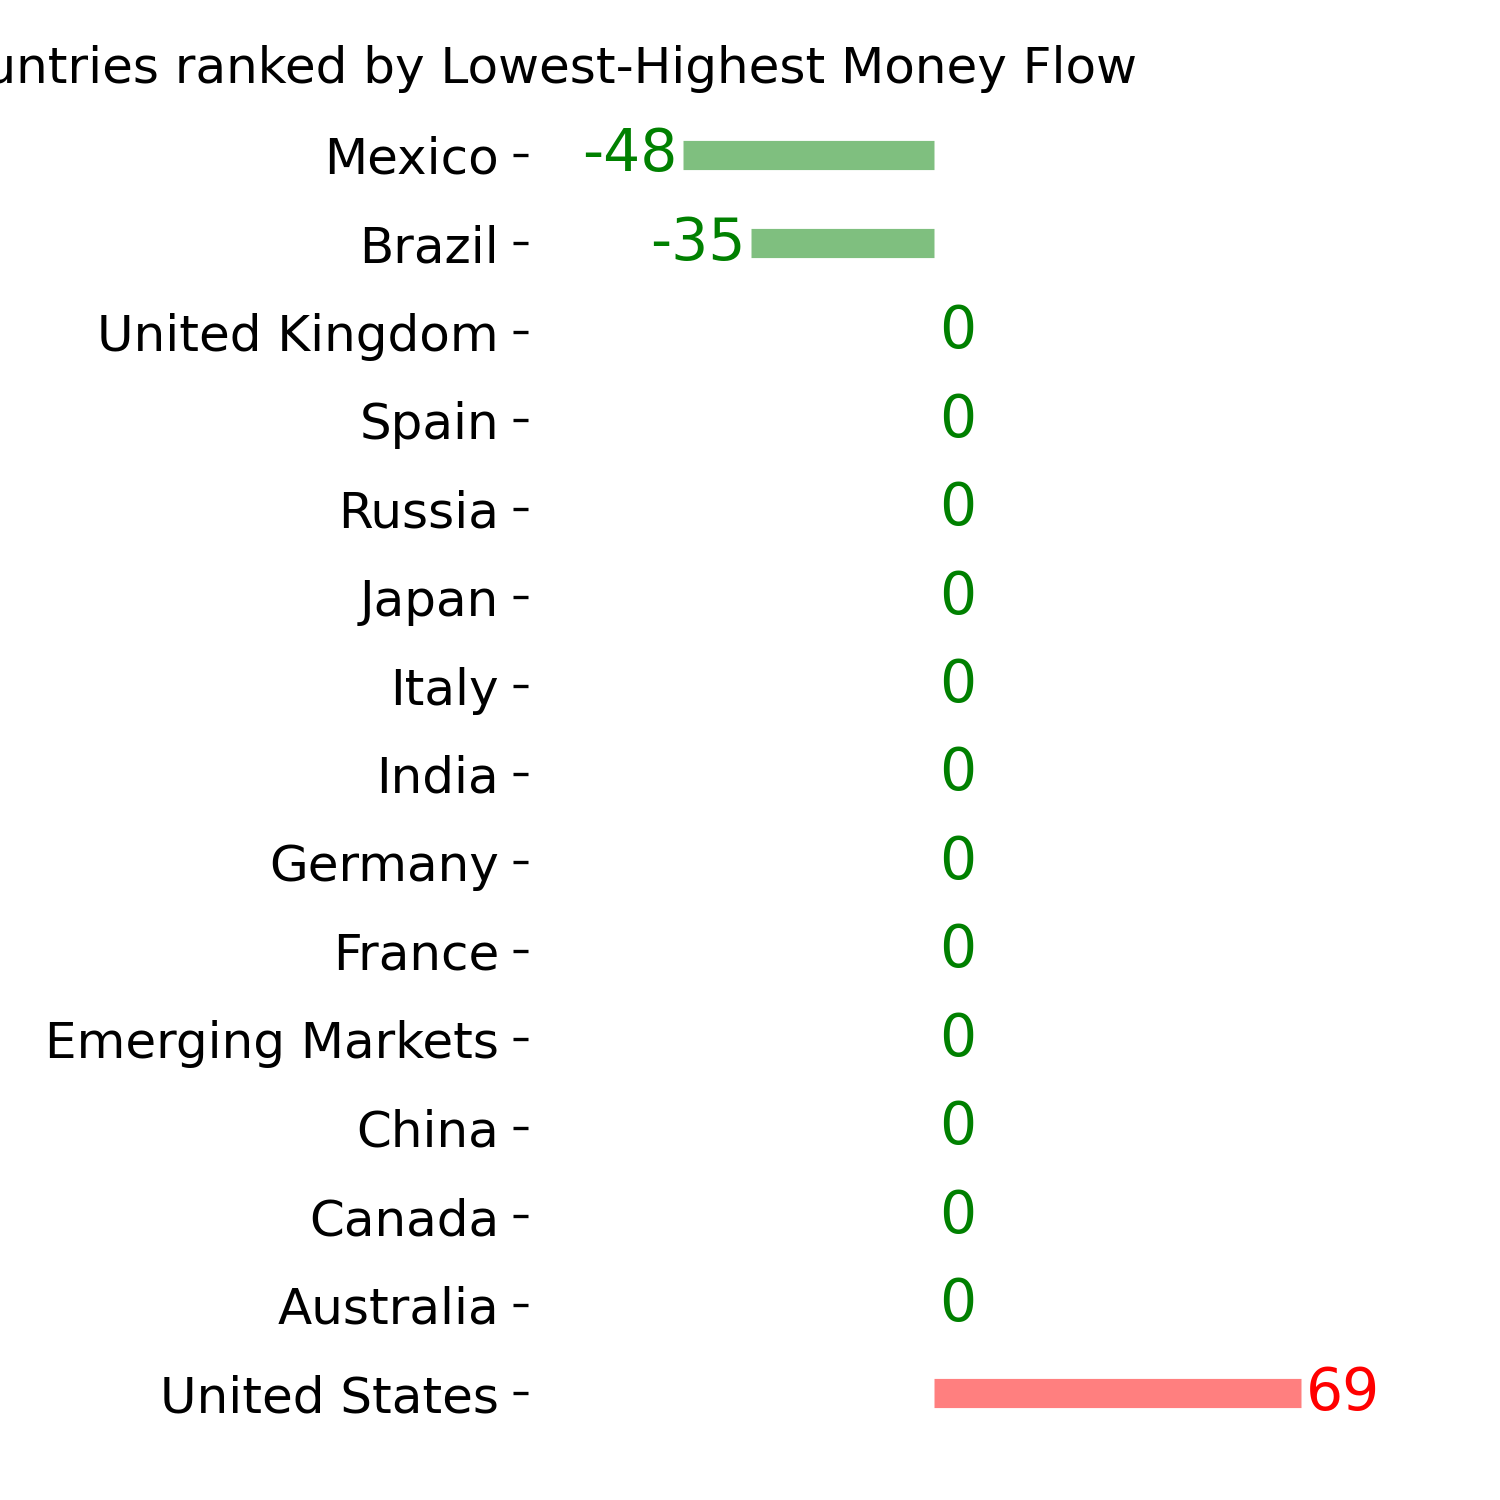
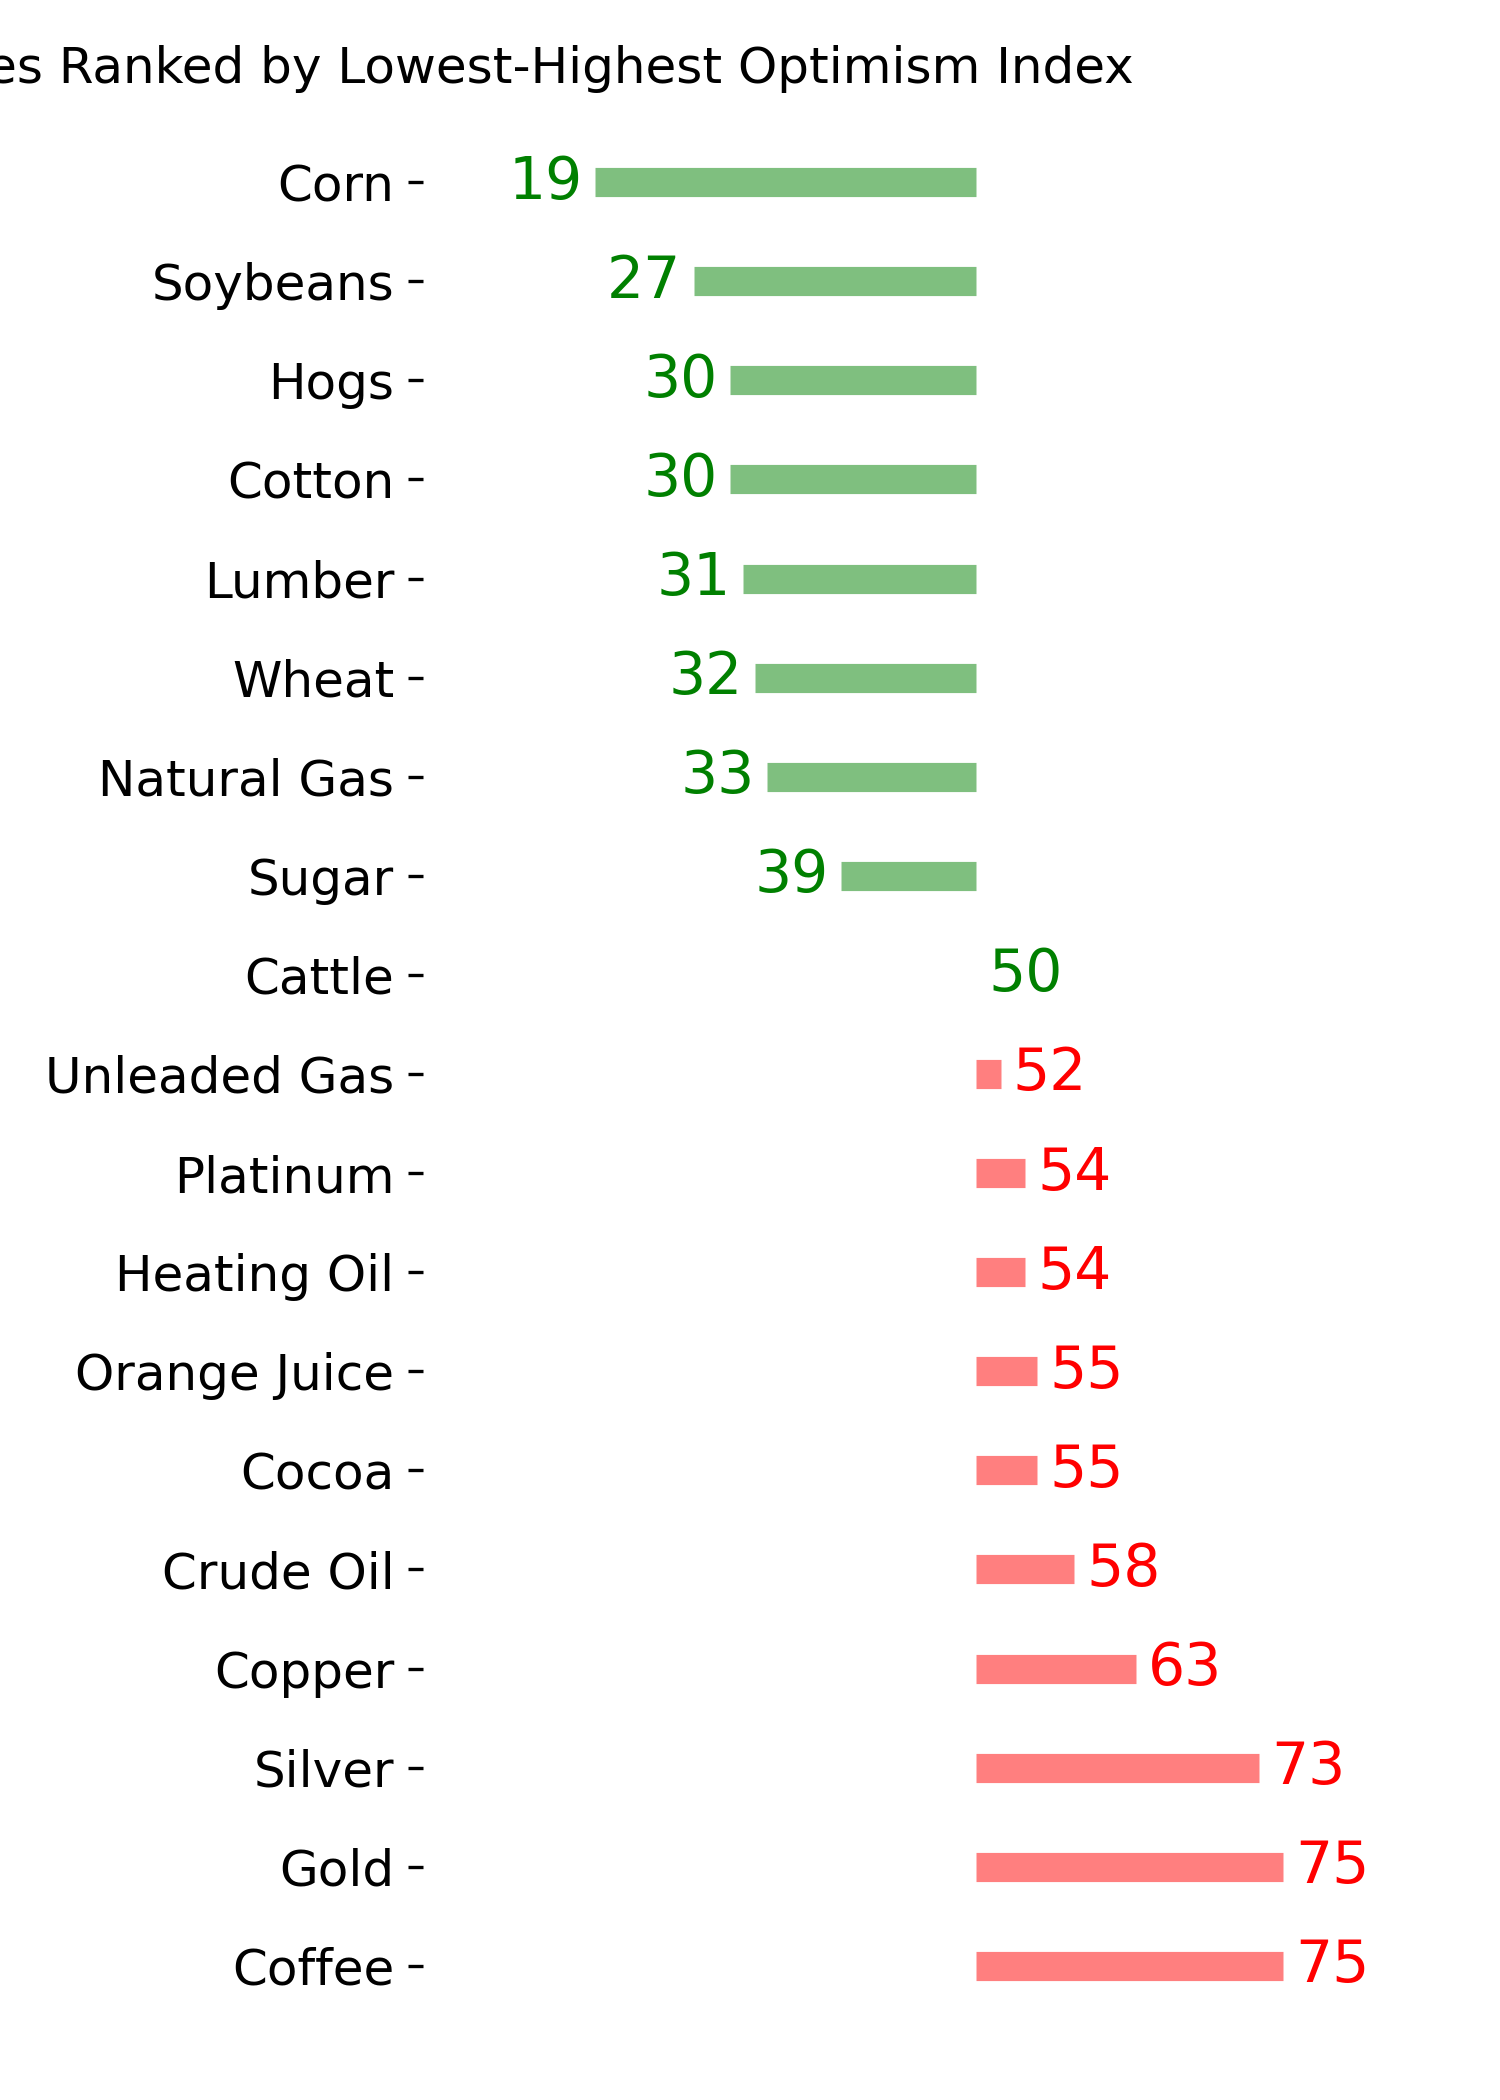
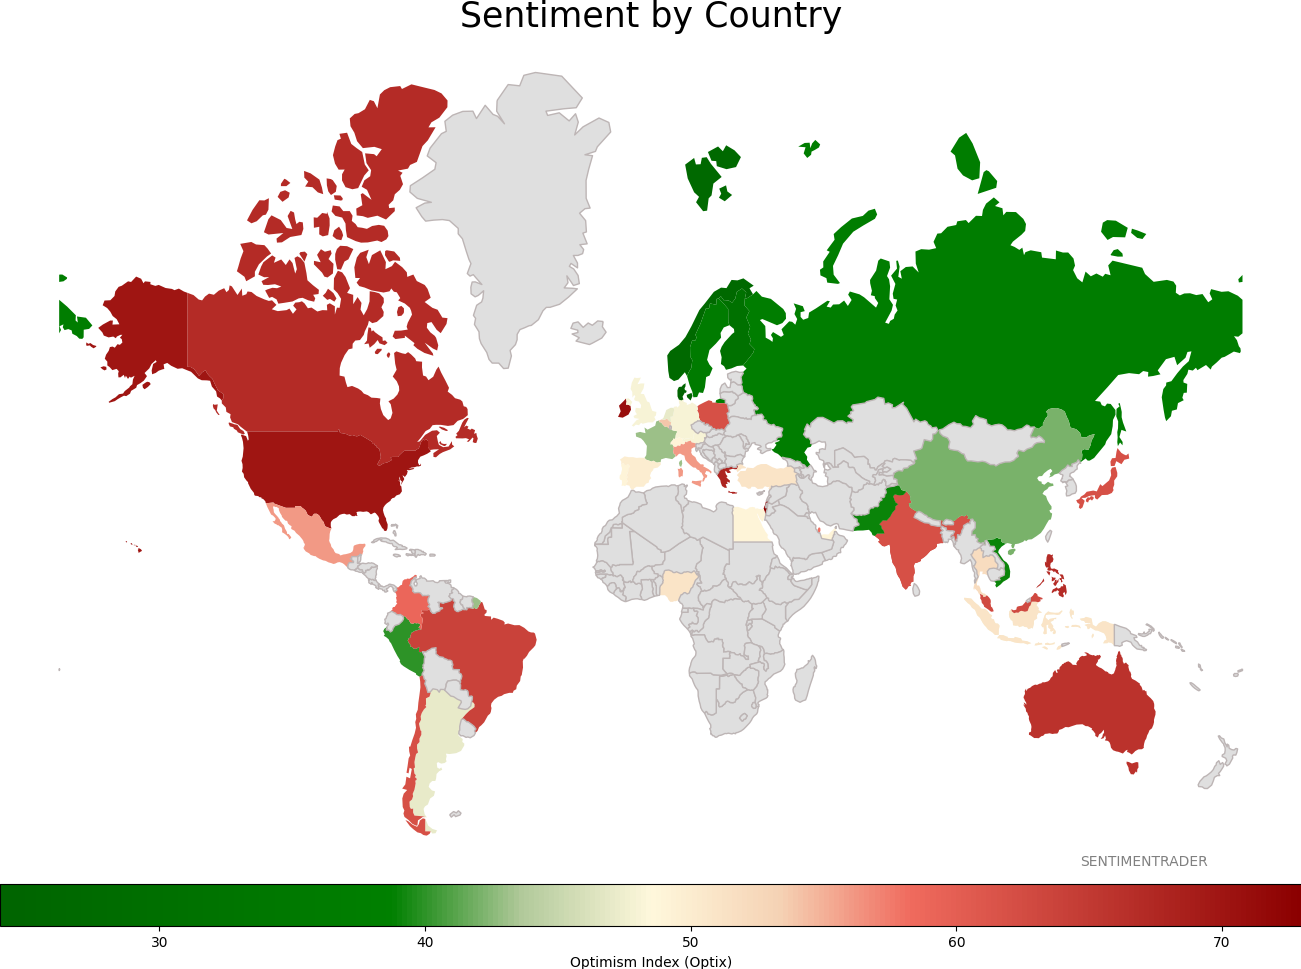
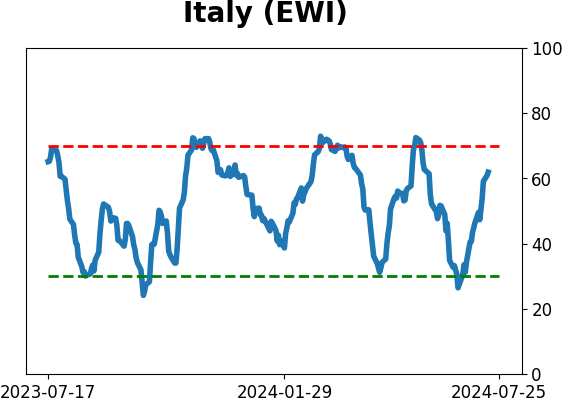
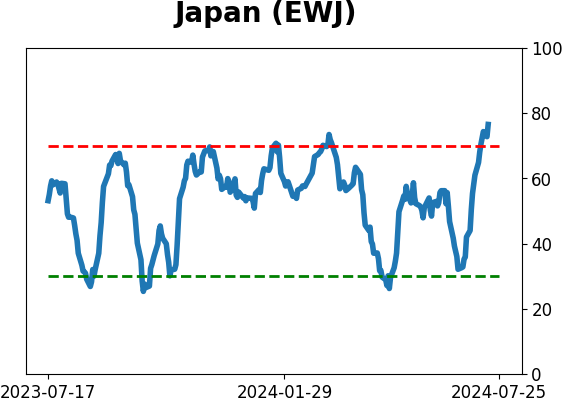
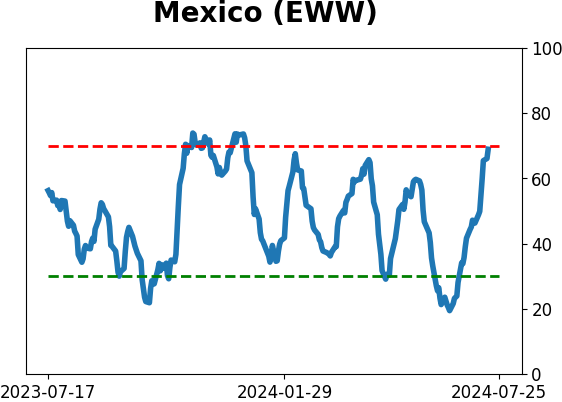
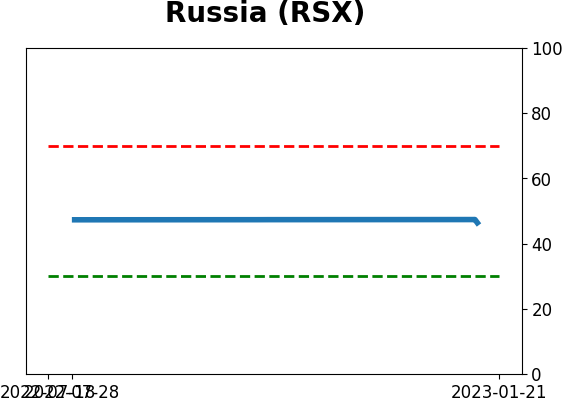
Sentiment Around The World
Optimism Index Thumbnails
|
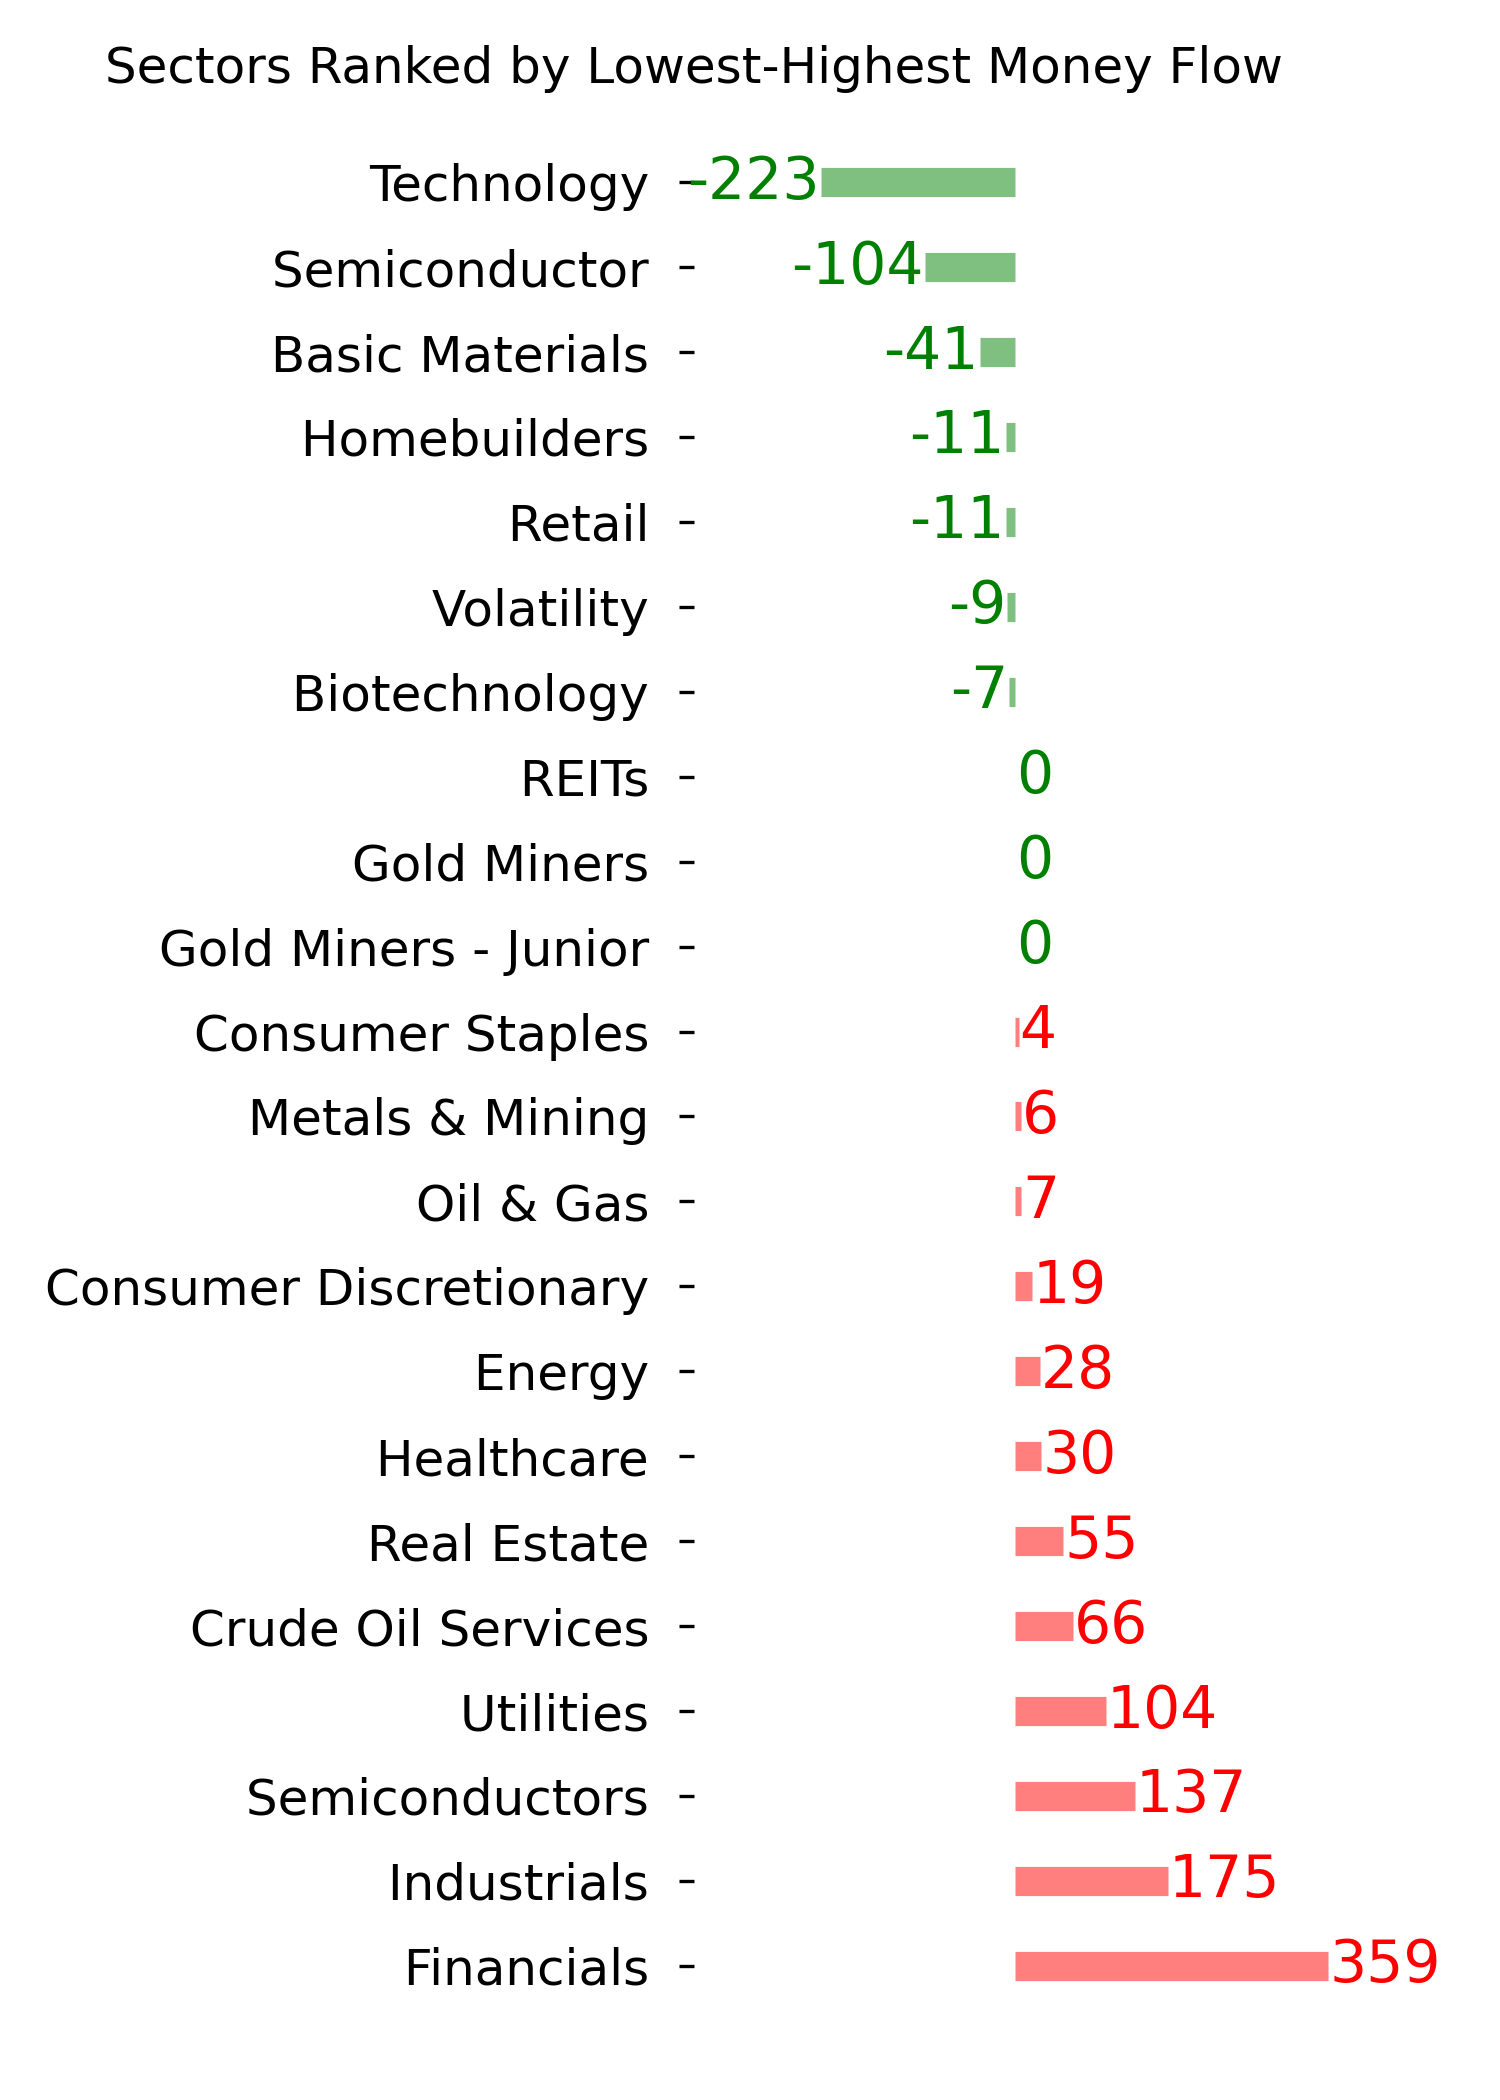
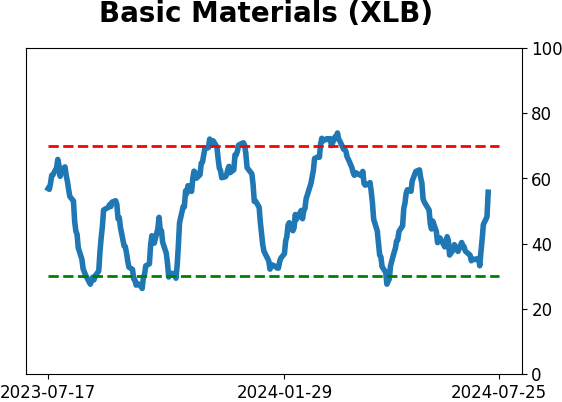
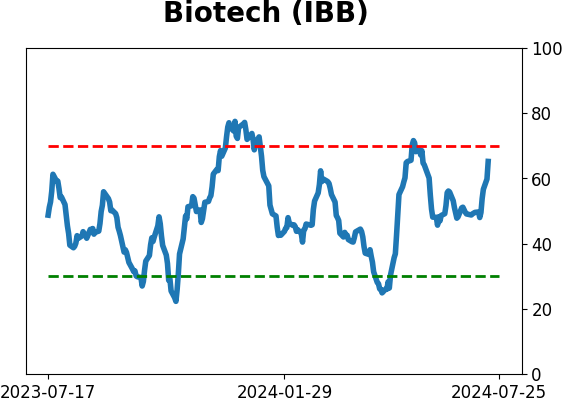
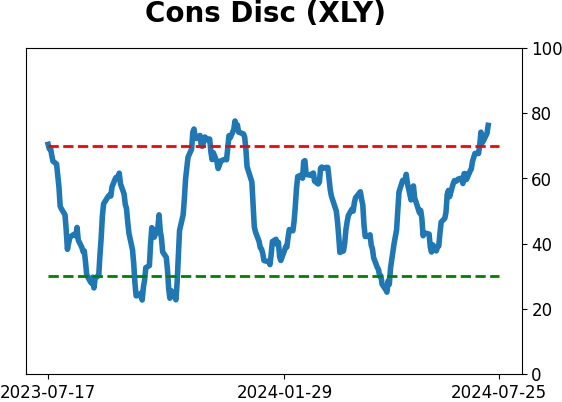
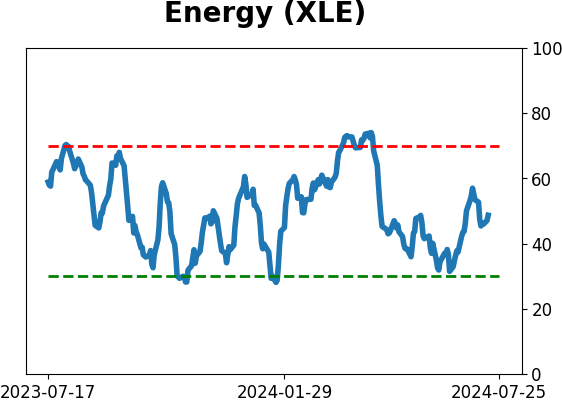
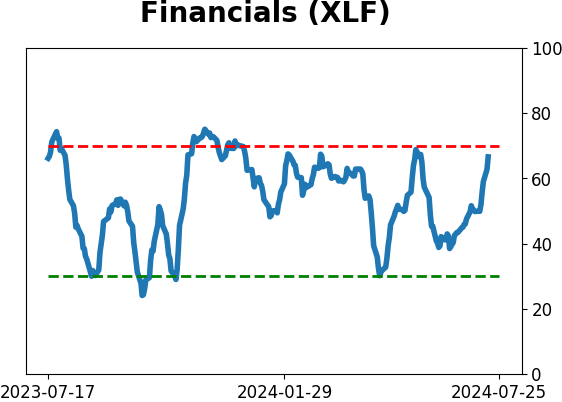
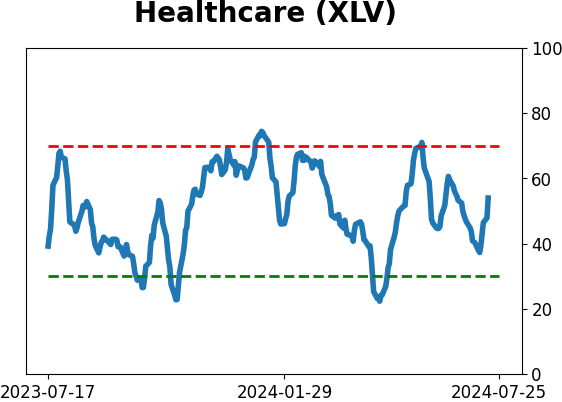
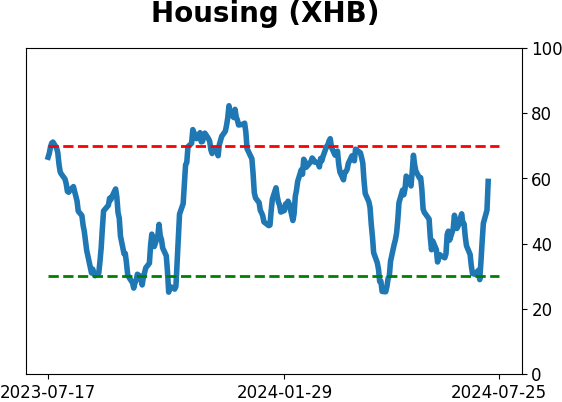
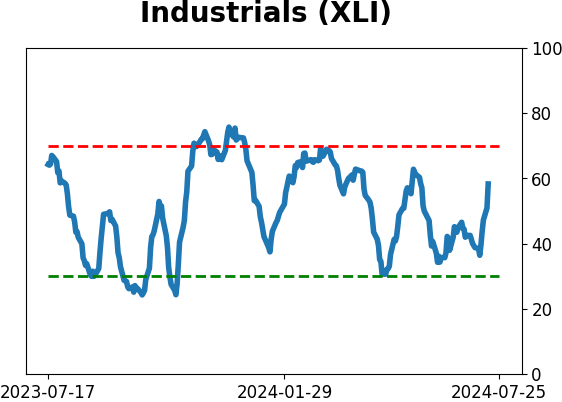
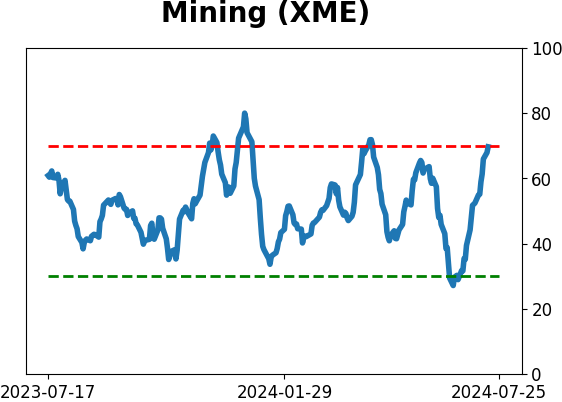
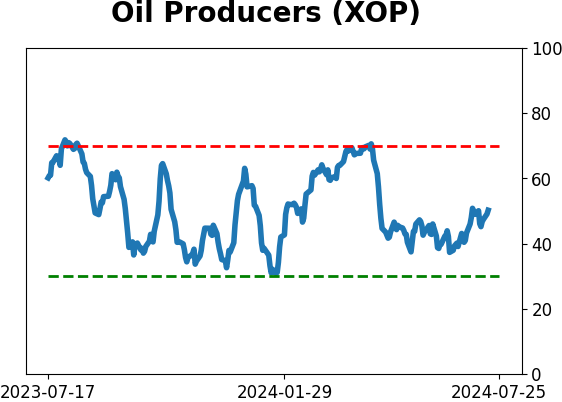
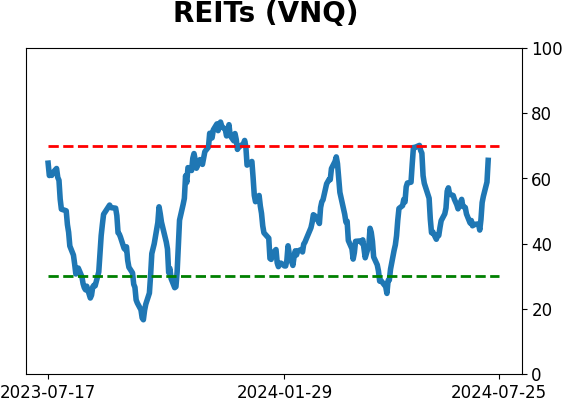
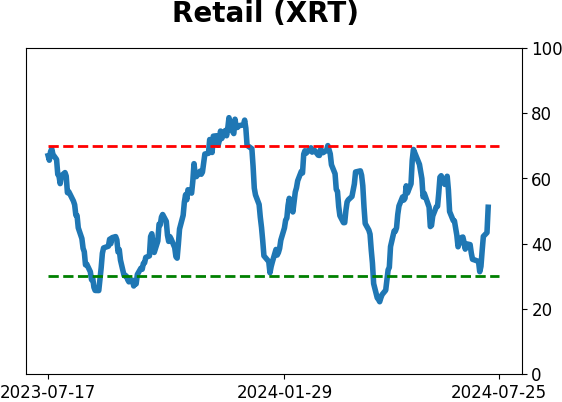
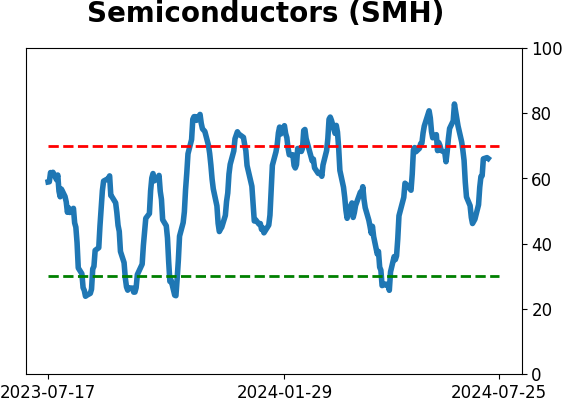
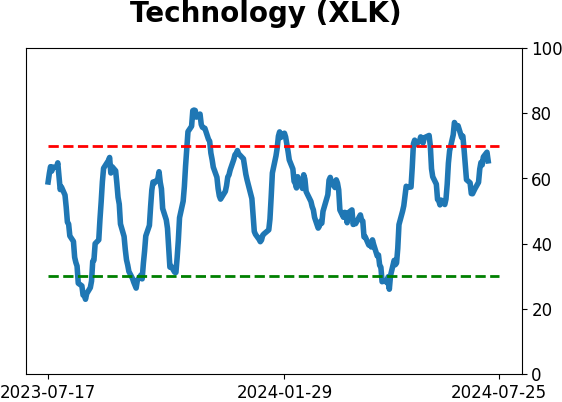
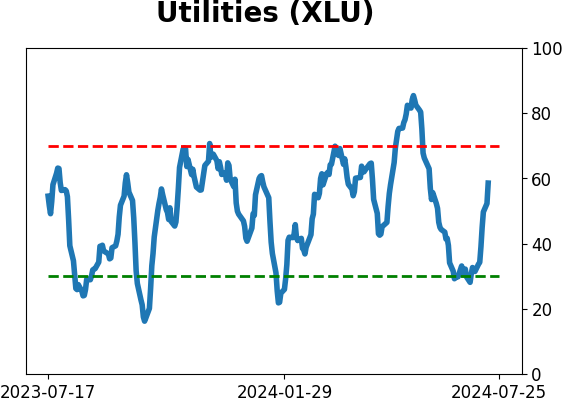
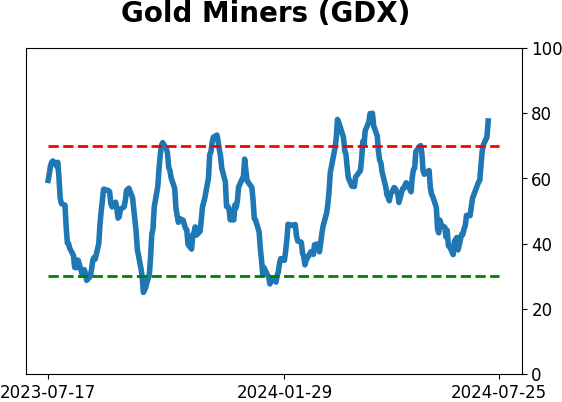
Sector ETF's - 10-Day Moving Average
|
|
|
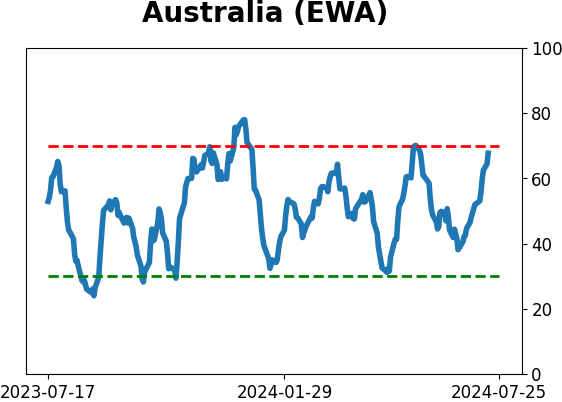
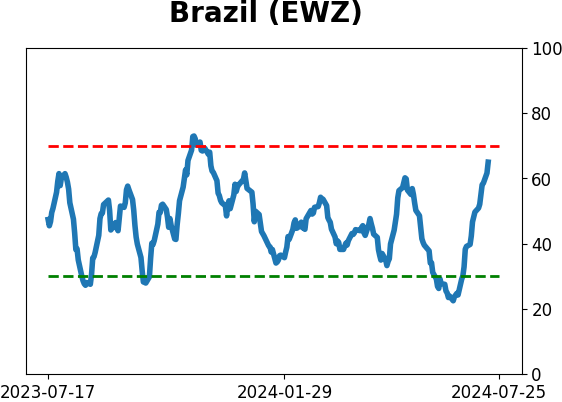
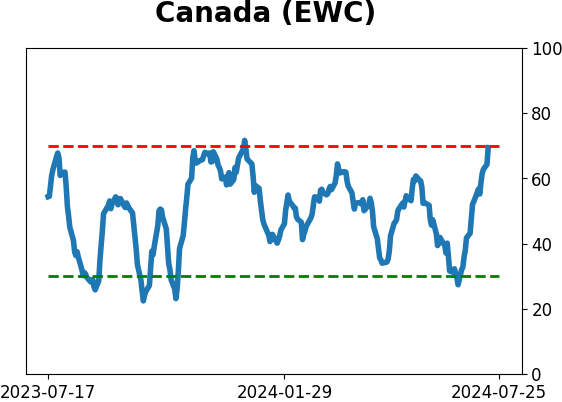
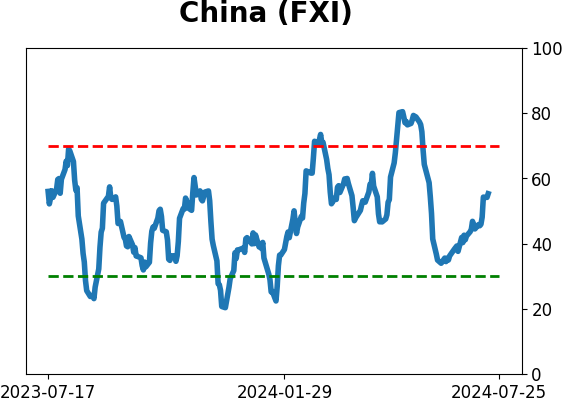
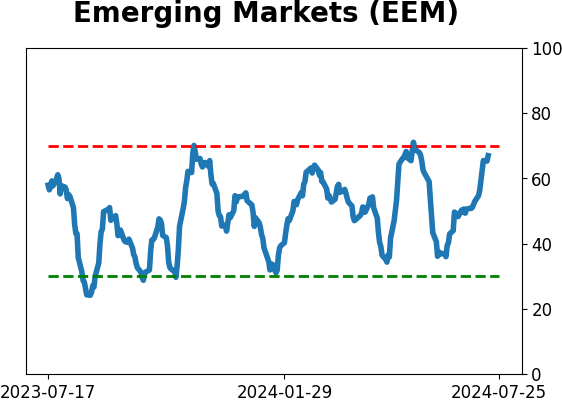
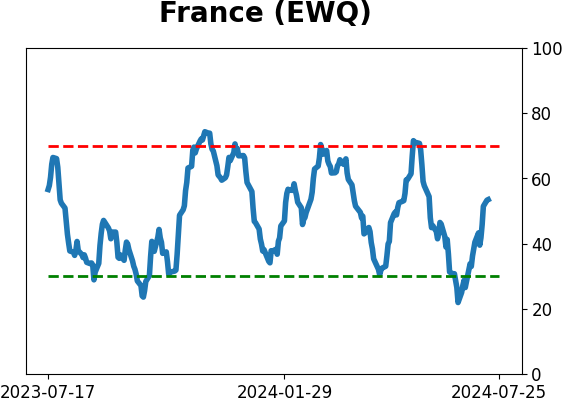
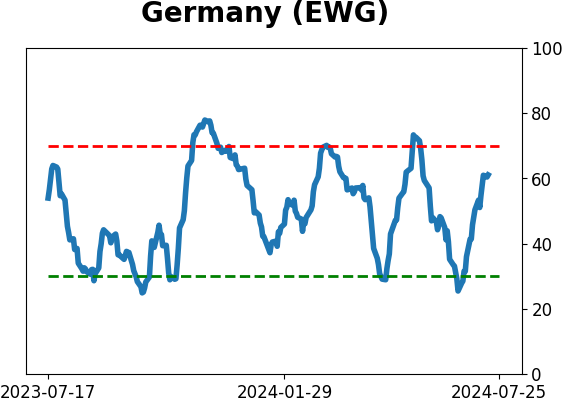
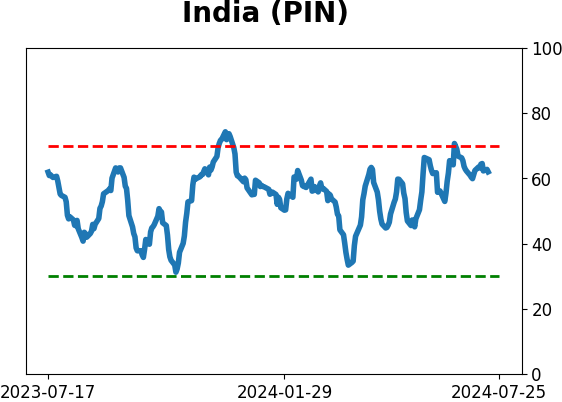
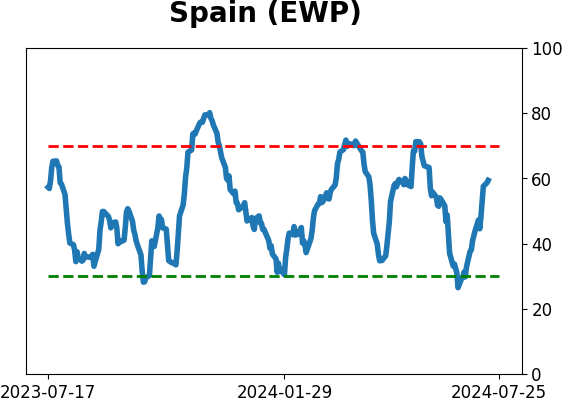
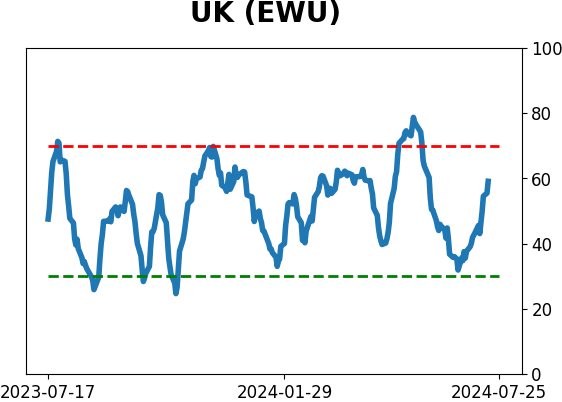
Country ETF's - 10-Day Moving Average
|
|
|
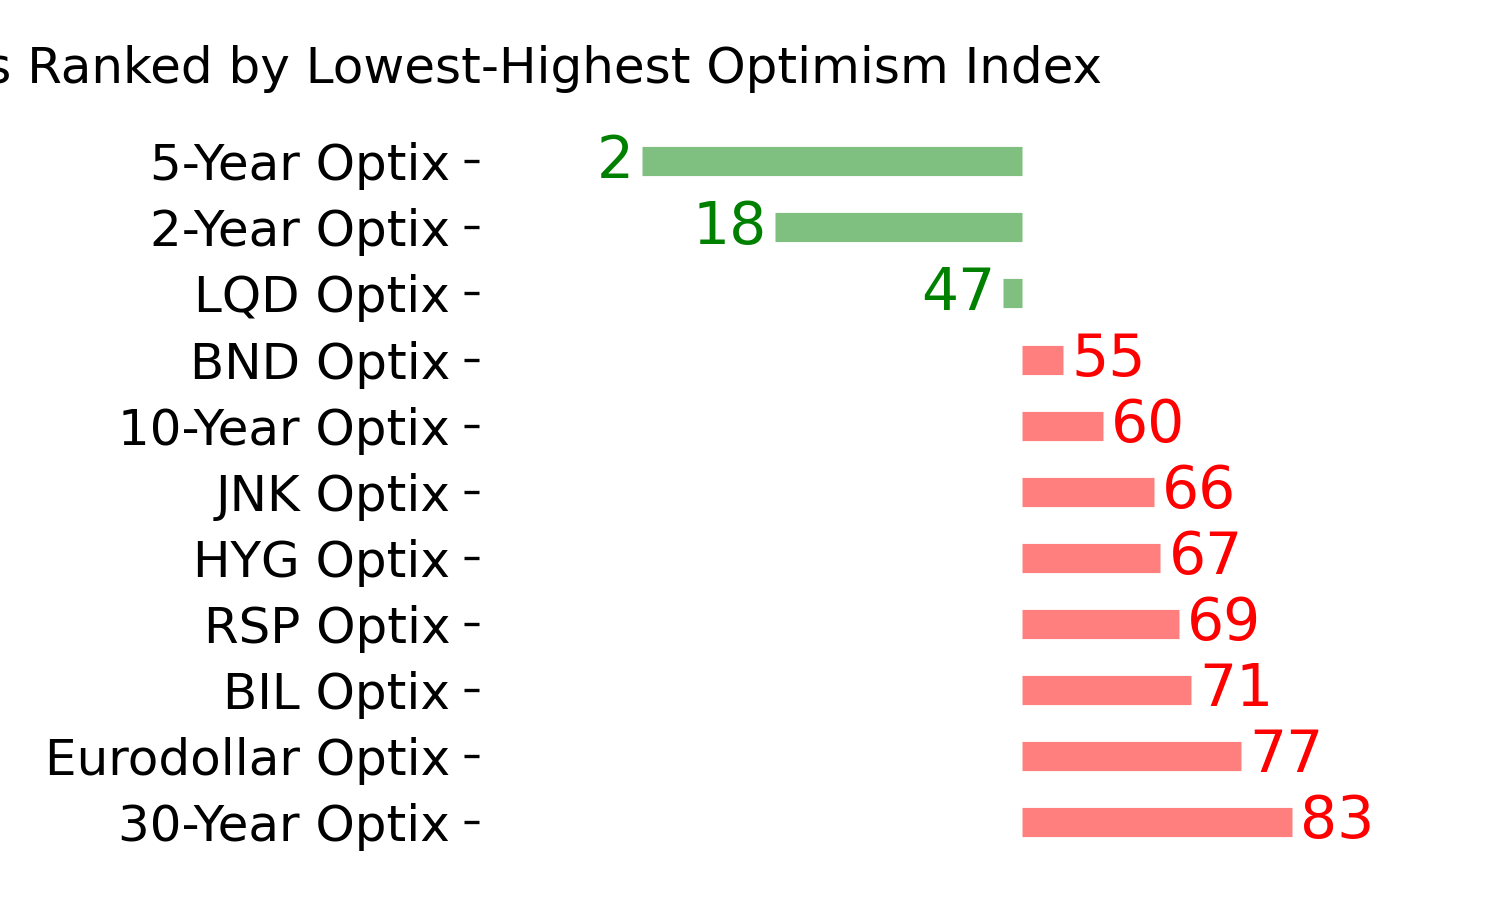
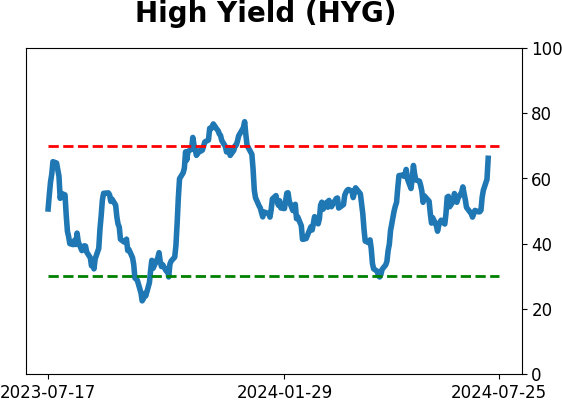
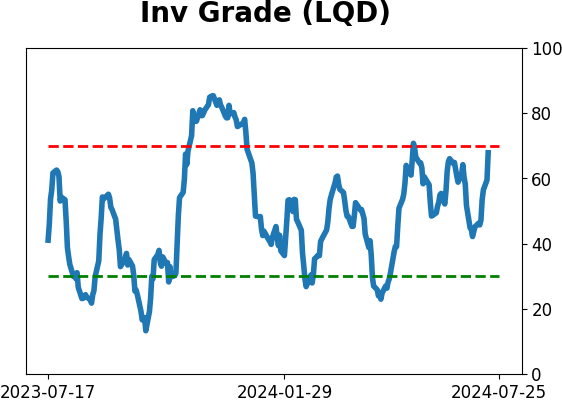
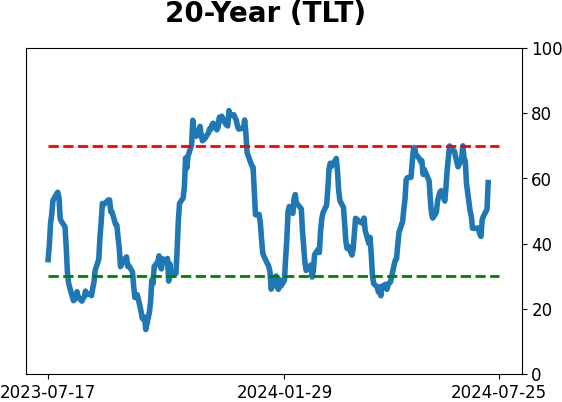
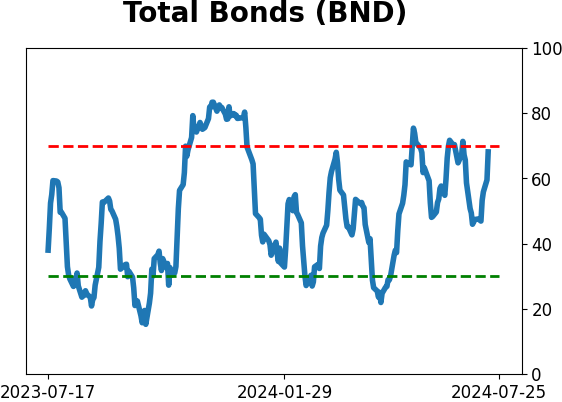
Bond ETF's - 10-Day Moving Average
|
|
|
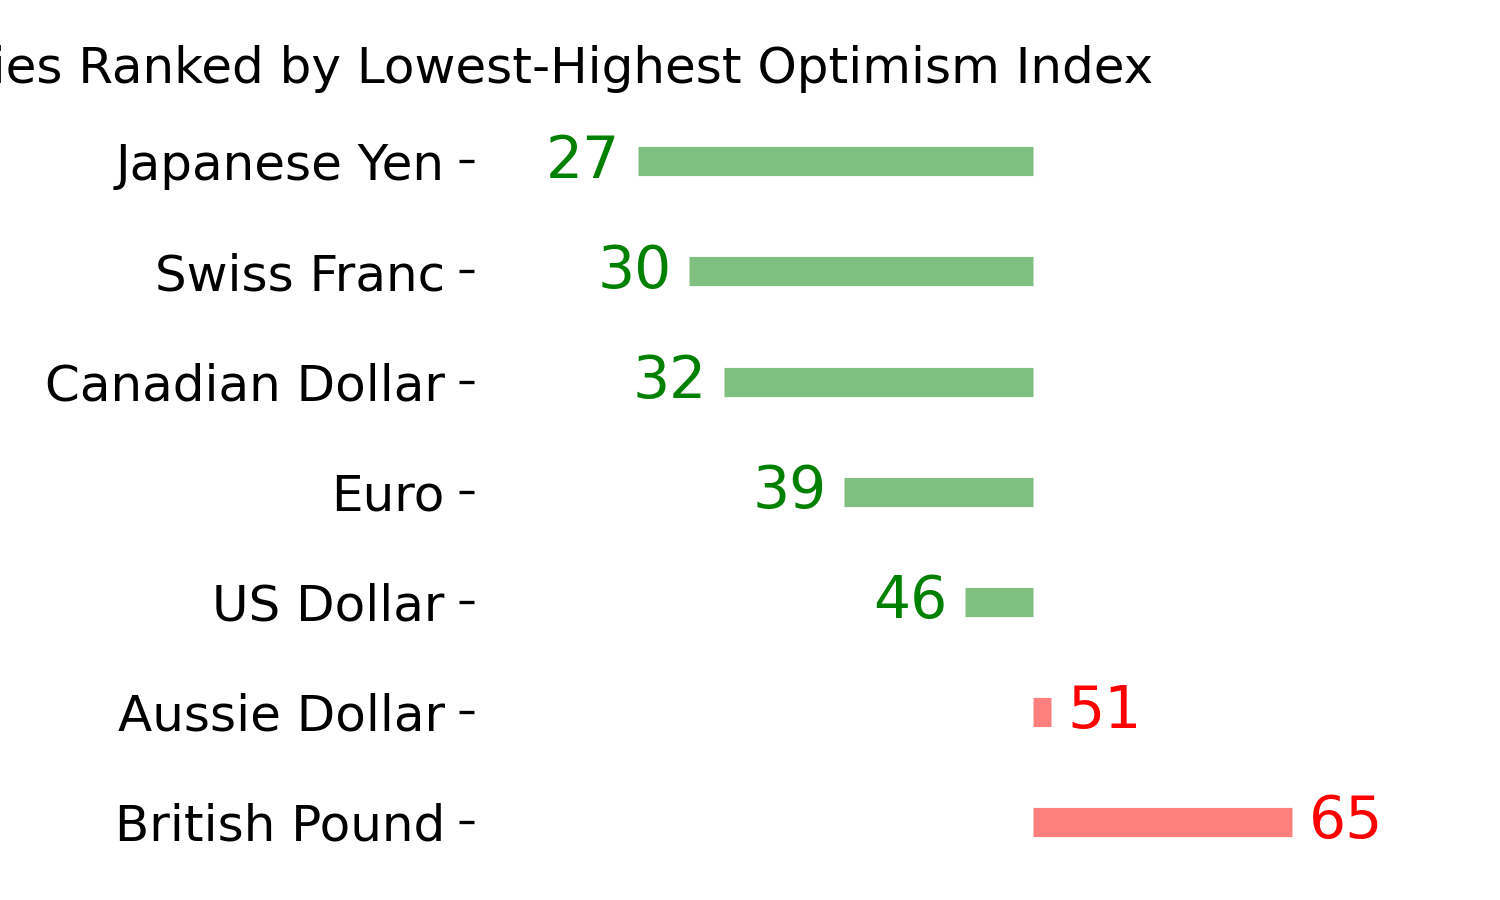
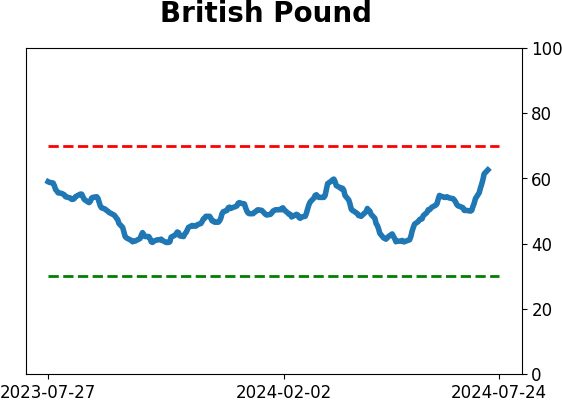
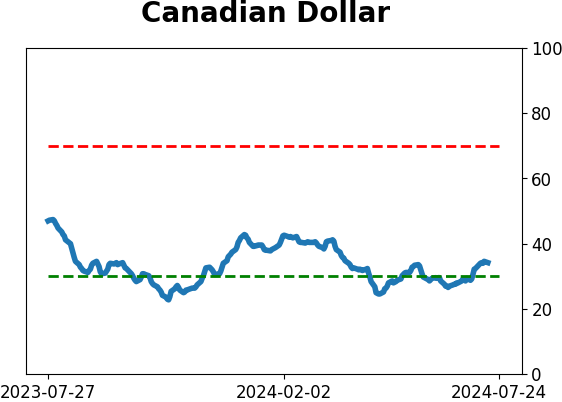
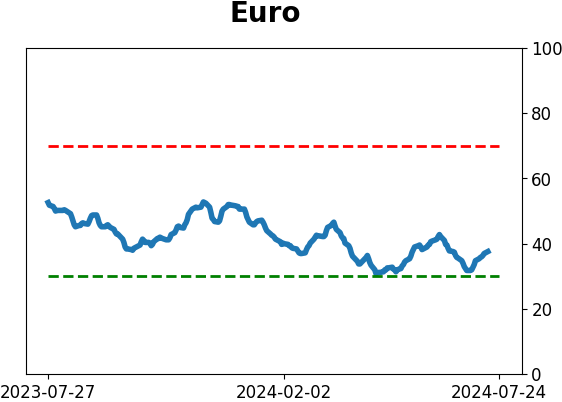
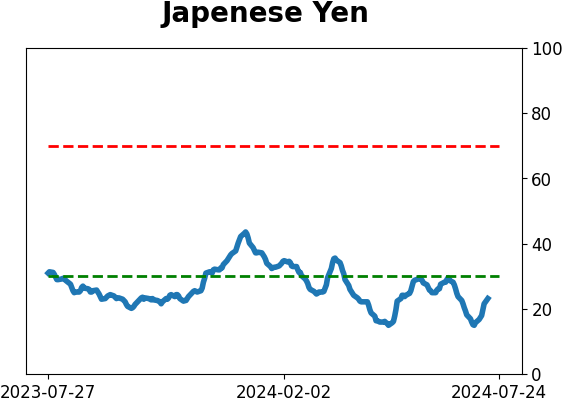
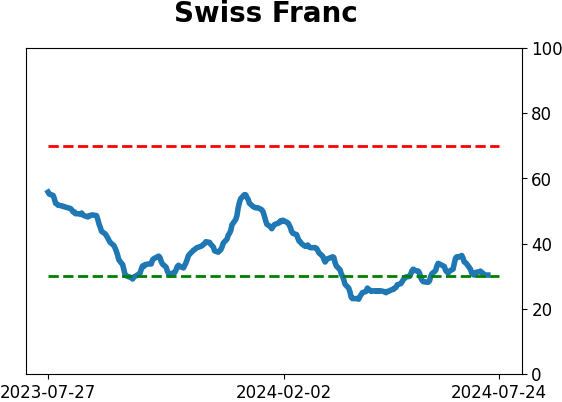
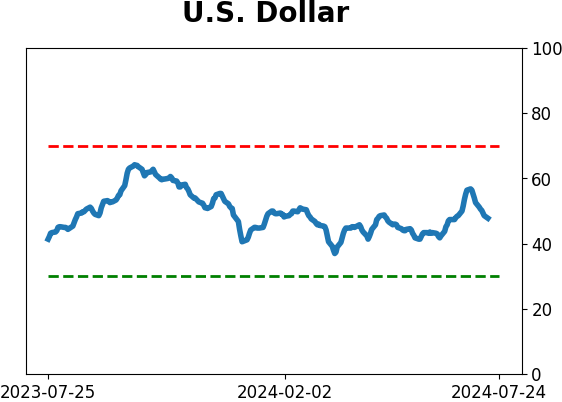
Currency ETF's - 5-Day Moving Average
|
|
|
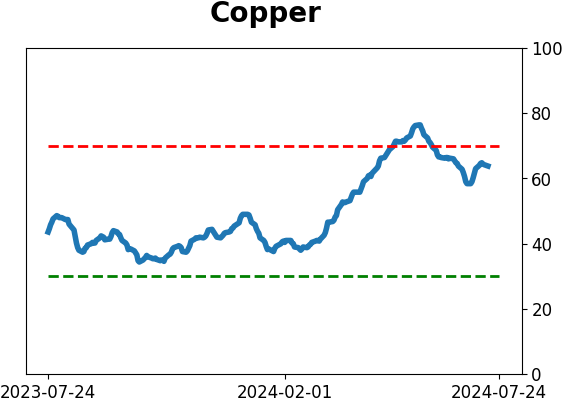
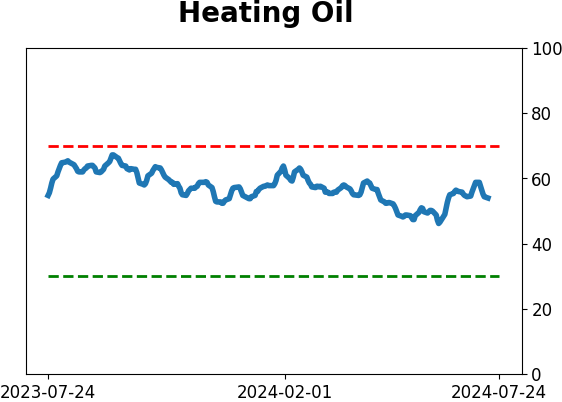
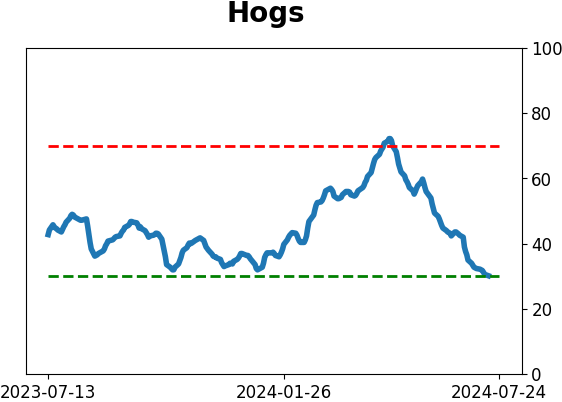
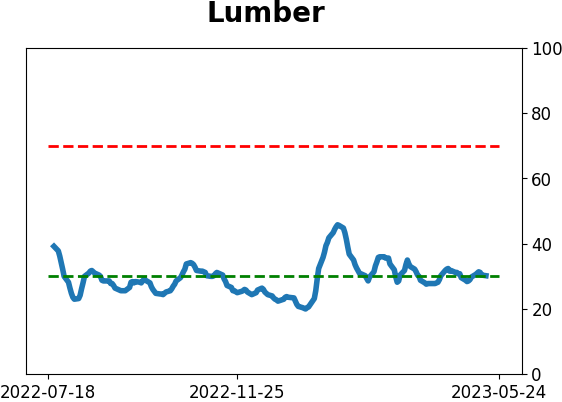
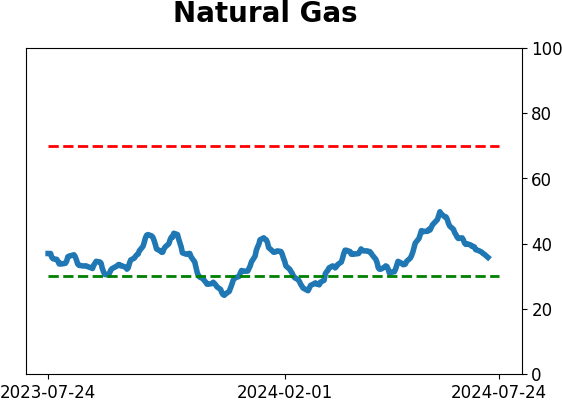
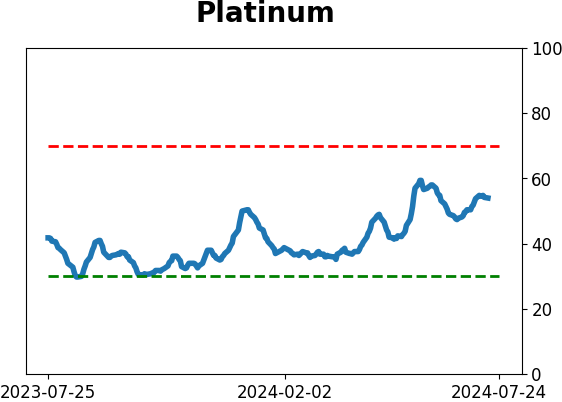
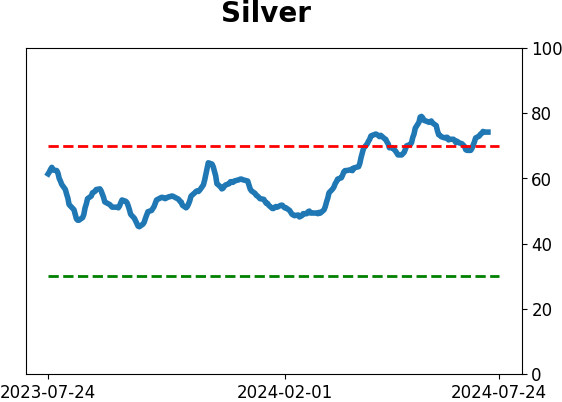
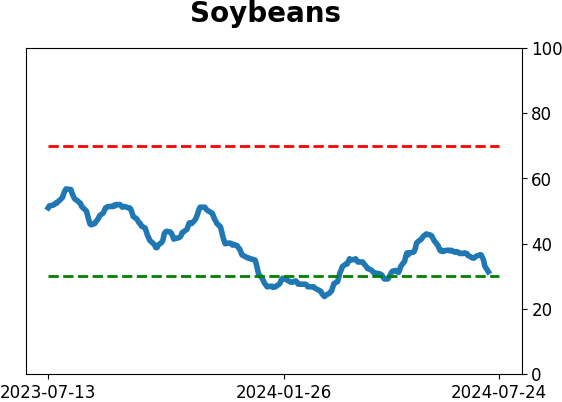
Commodity ETF's - 5-Day Moving Average
|
|