Headlines
|
|
Divergences no more:
After more than a month of meaningful divergences between indexes and individual stocks, those were largely resolved in a historic shift late last week. While a new high in cumulative breadth has been a positive long term sign, returns were more questionable shorter term when the S&P 500 had far outpaced market-wide breadth.
|
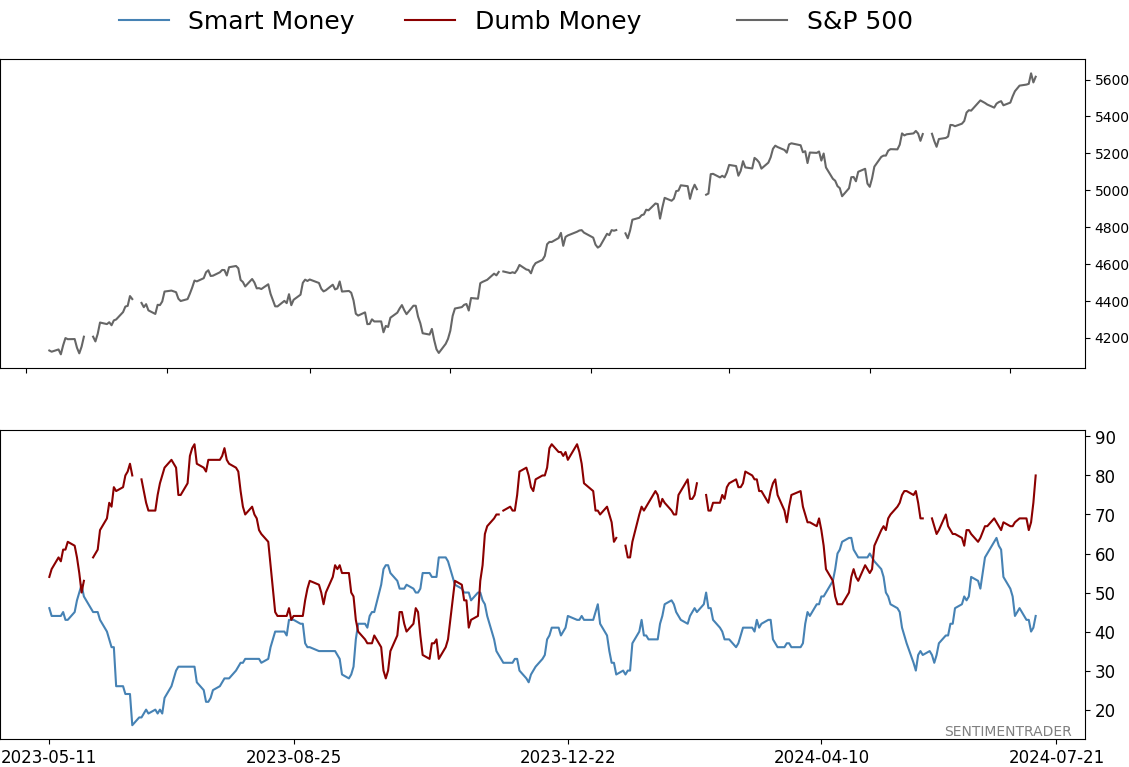
Smart / Dumb Money Confidence
|
Smart Money Confidence: 44%
Dumb Money Confidence: 80%
|
|
Risk Levels
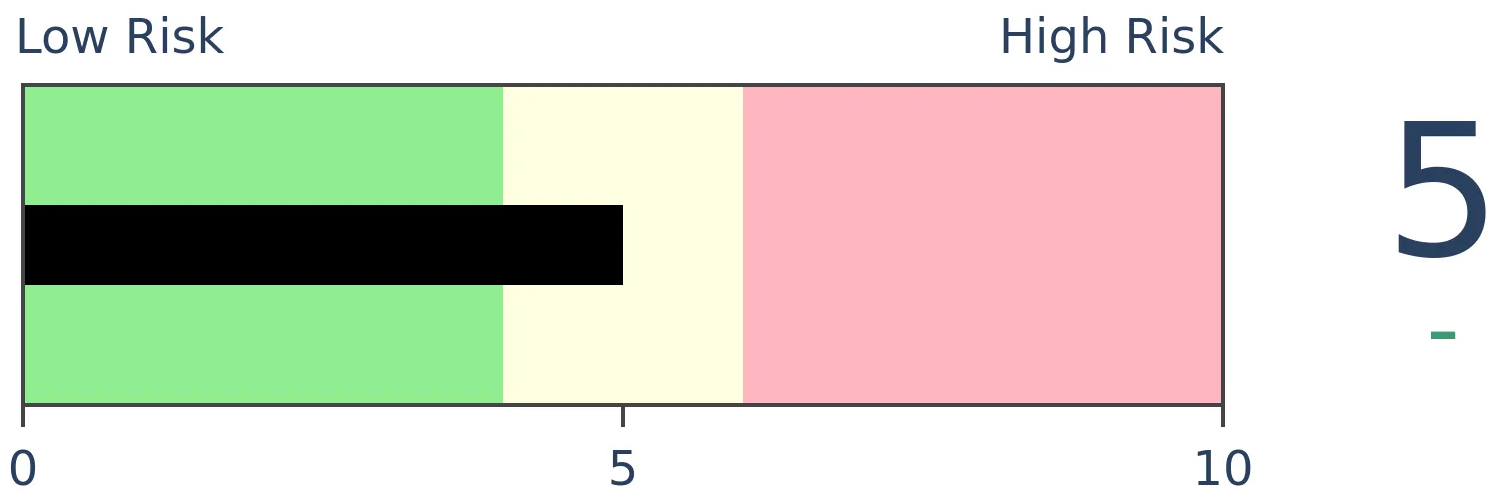
Stocks Short-Term
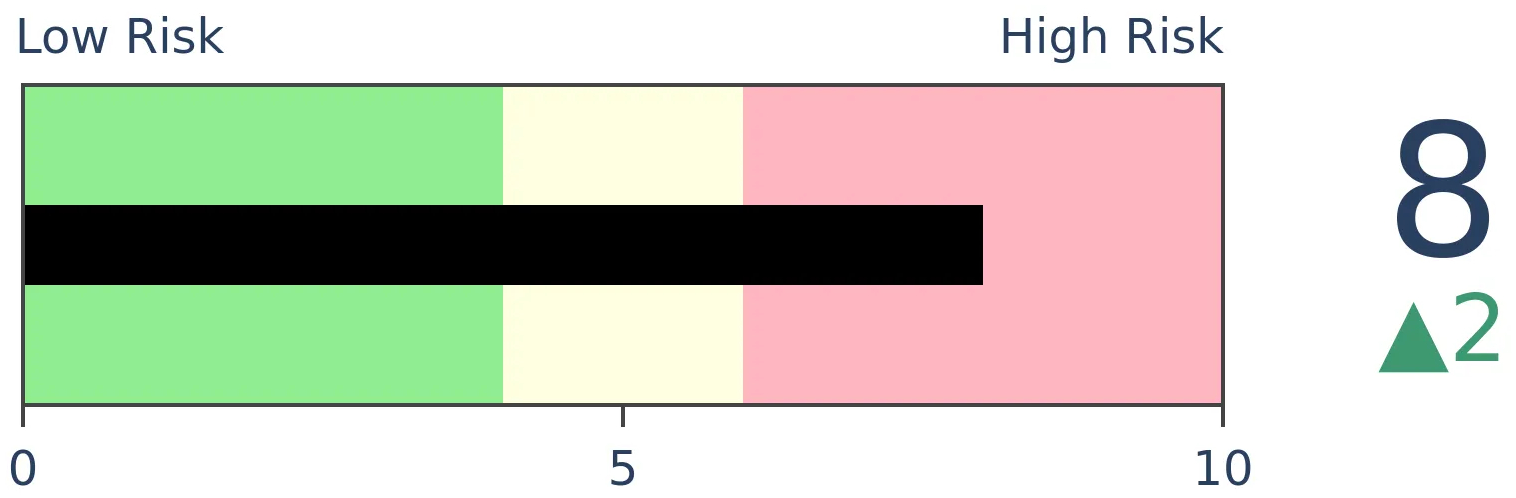
|
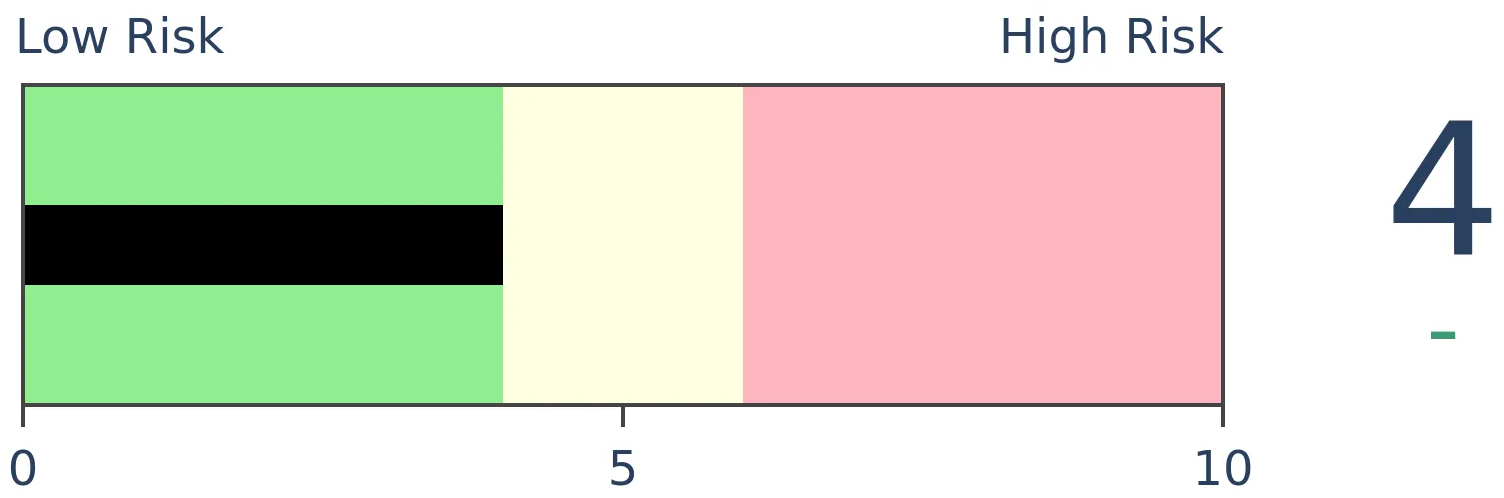
Stocks Medium-Term
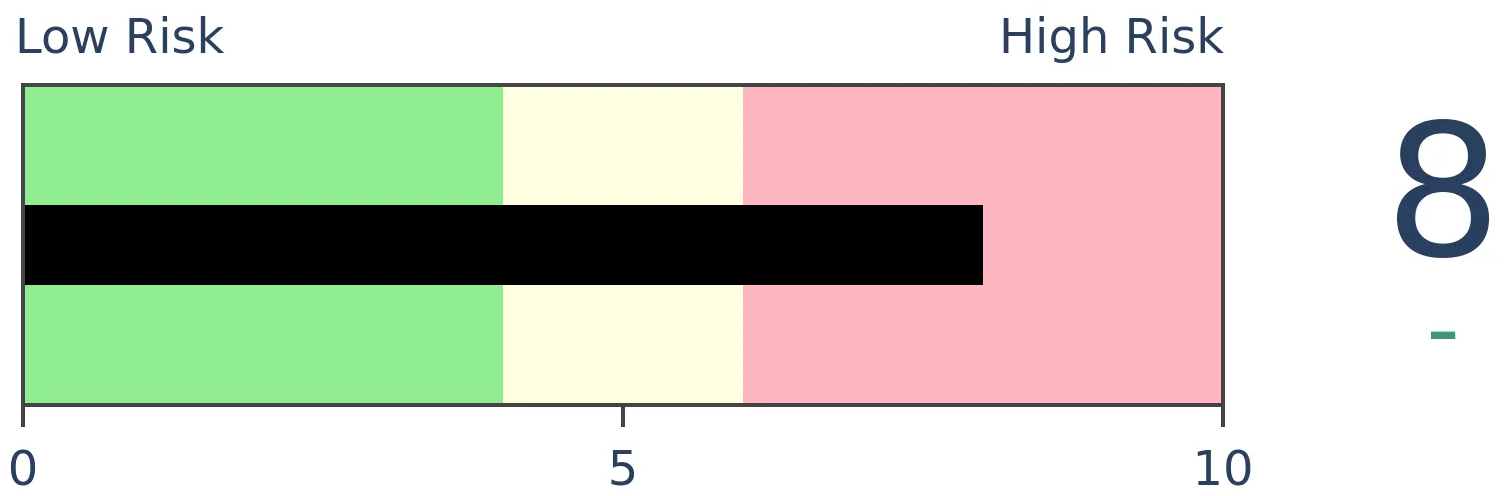
|
|
Bonds
|
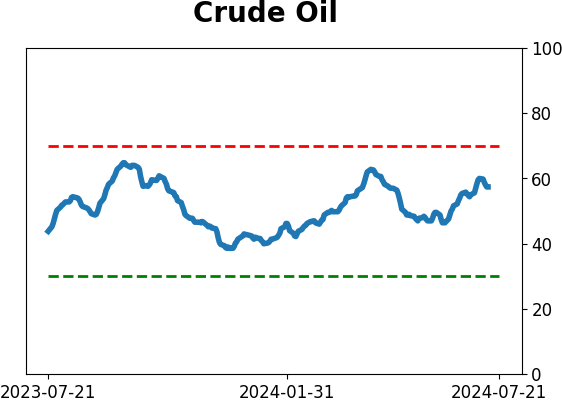
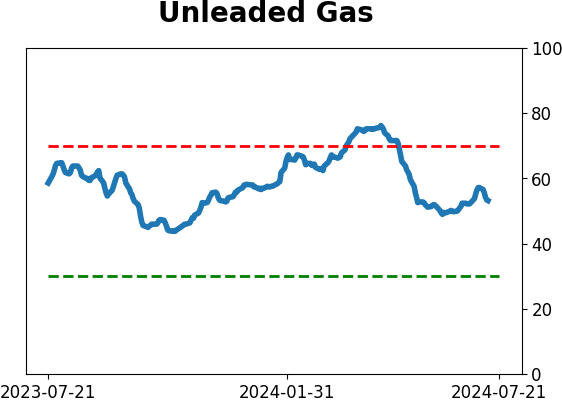
Crude Oil
|
|
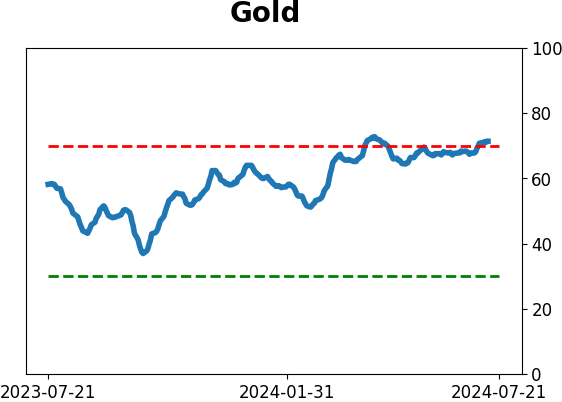
Gold
|
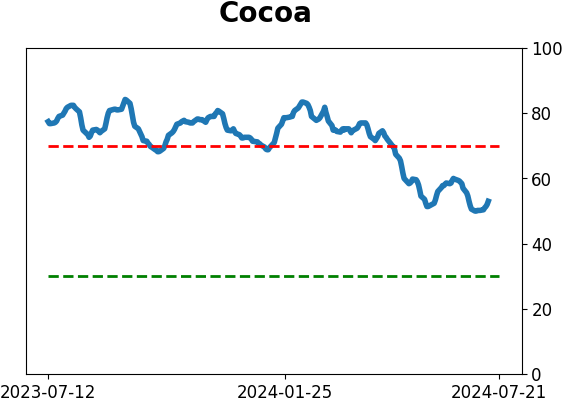
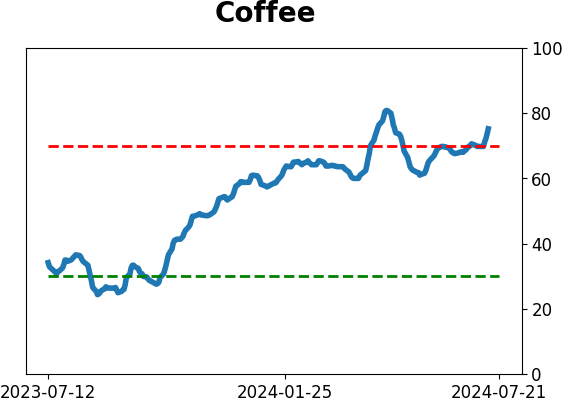
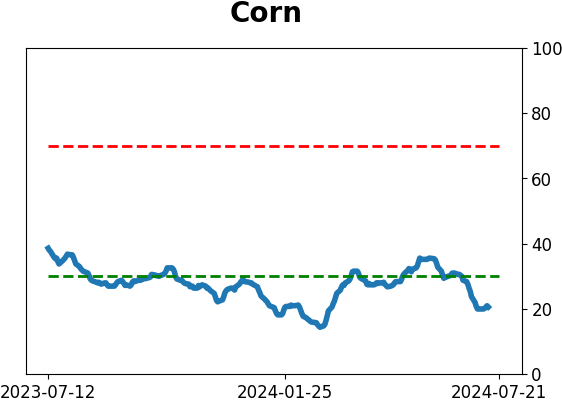
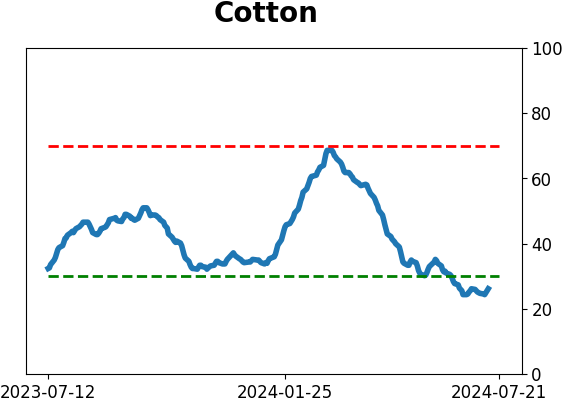
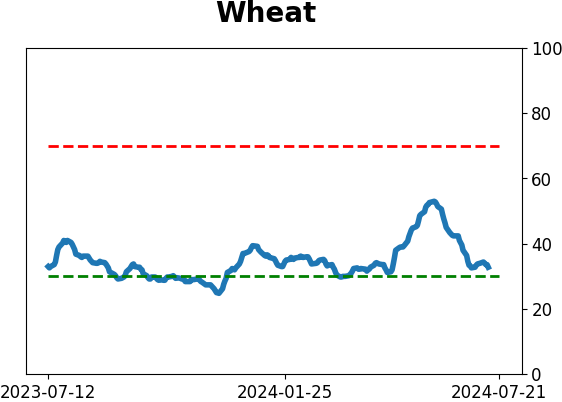
Agriculture

|
|
Research
By Jason Goepfert
BOTTOM LINE
After more than a month of meaningful divergences between indexes and individual stocks, those were largely resolved in a historic shift late last week. While a new high in cumulative breadth has been a positive long term sign, returns were more questionable shorter term when the S&P 500 had far outpaced market-wide breadth.
FORECAST / TIMEFRAME
None
|
Key points:
- A historic shift last week resolved many breadth divergences
- The NYSE Cumulative Advance/Decline Line soared to new highs, erasing a notable lag
- Returns after the A/D Line caught up to the S&P 500 were relatively poor short-term but good long-term
Divergences no more
Over the past 6 weeks or so, there has been an increasing pile of evidence that all was not well under the surface of persistent records in the major indexes, specifically the S&P 500 and Nasdaq 100. It has been rare to see divergences like we've witnessed resolved by the average stock catching up to the indexes rather than the indexes "catching down" to the average stock.
Well, the rare happened. Thanks to a truly historic couple of days - really, just one day - the divergences have mostly been resolved. At the very least, they're less compelling than they were a short time ago.
The overwhelming rush into smaller-cap stocks late last week had a monumental impact on many breadth measures. It was enough to push the NYSE Cumulative Advance/Decline Line to a record high.
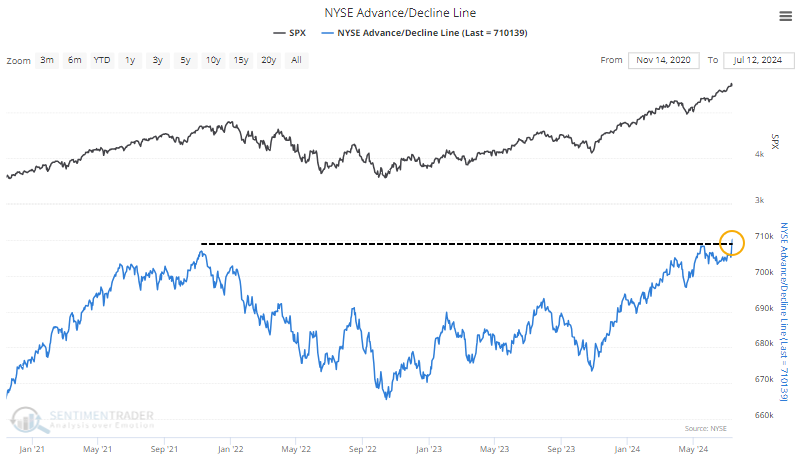
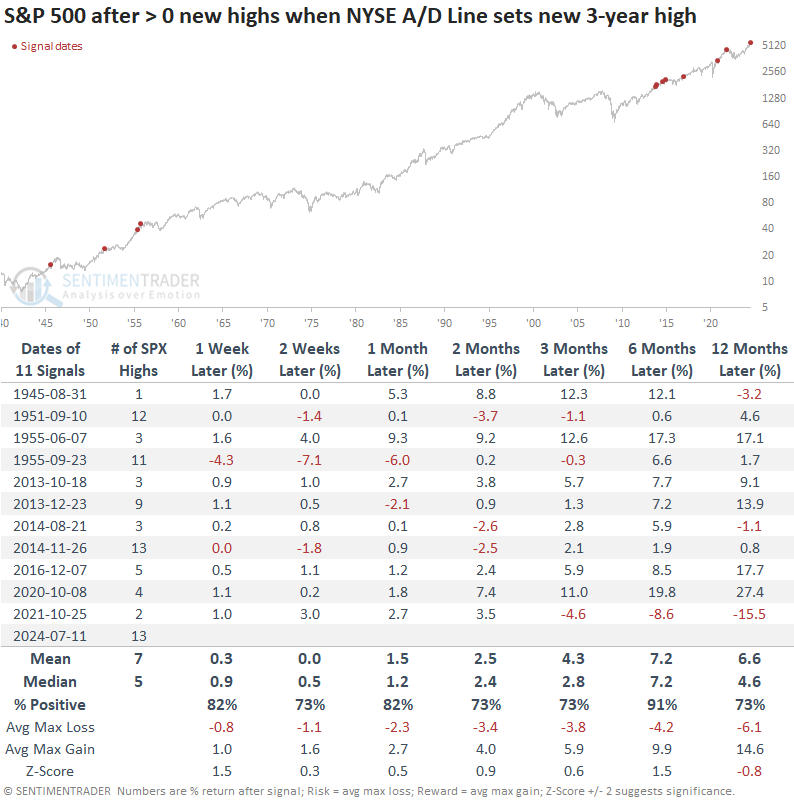
The interesting part of the new high in the A/D Line is that the S&P 500 has been leading it for over a month. The table below shows other times when breadth made a new high for the first time in at least 30 days, while the S&P 500 had already scored at least one new high during that stretch.
It was a consistently positive sign for future returns. Over the next six months, there was only a single loss, which was notable as it preceded a bear market.
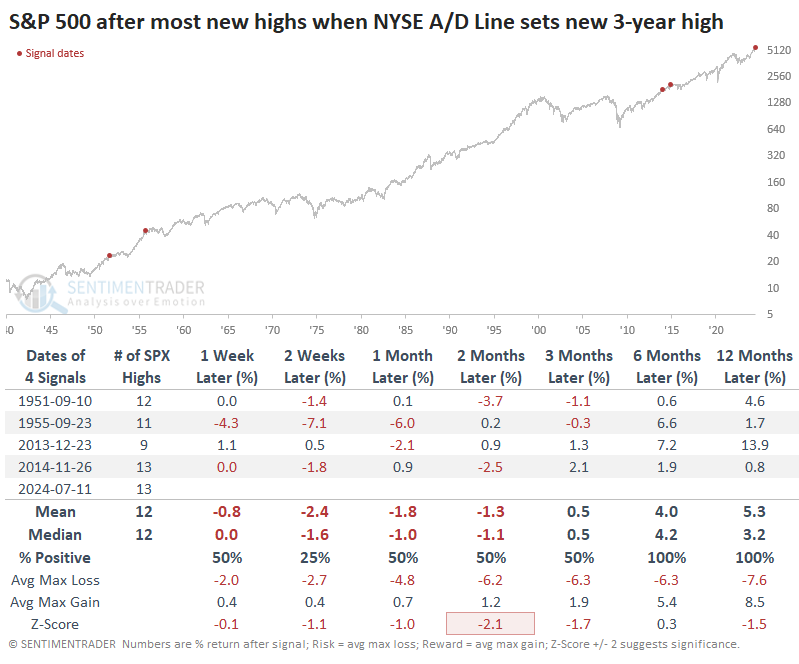
However, if you look at the table, you'll notice how much of an outlier our current scenario is.
The S&P 500 didn't just set a new high; it set more than a dozen over the past 30 days while the A/D Line diverged. It tied November 2014 and edged out September 1951 and September 1955 for setting the most new highs while other stocks were struggling.
When we filter the table to look at the times when the S&P outpaced the A/D Line to the most significant degree, we see that its forward returns were considerably less compelling, though we also have a minuscule sample size.
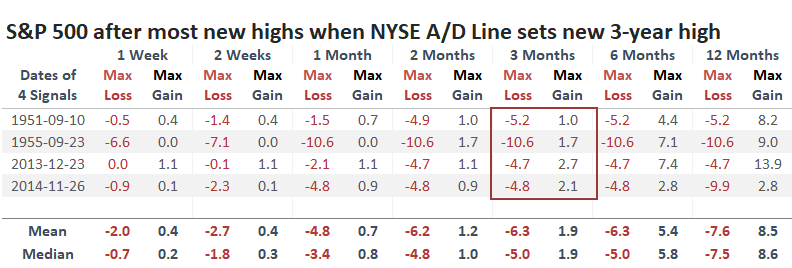
The table of maximum gains and losses across time frames shows that the S&P's gains were capped under +2.7% over the next three months while its risk exceeded -4.5% each time.
Quite a bit of "other stuff" has powered the breakout
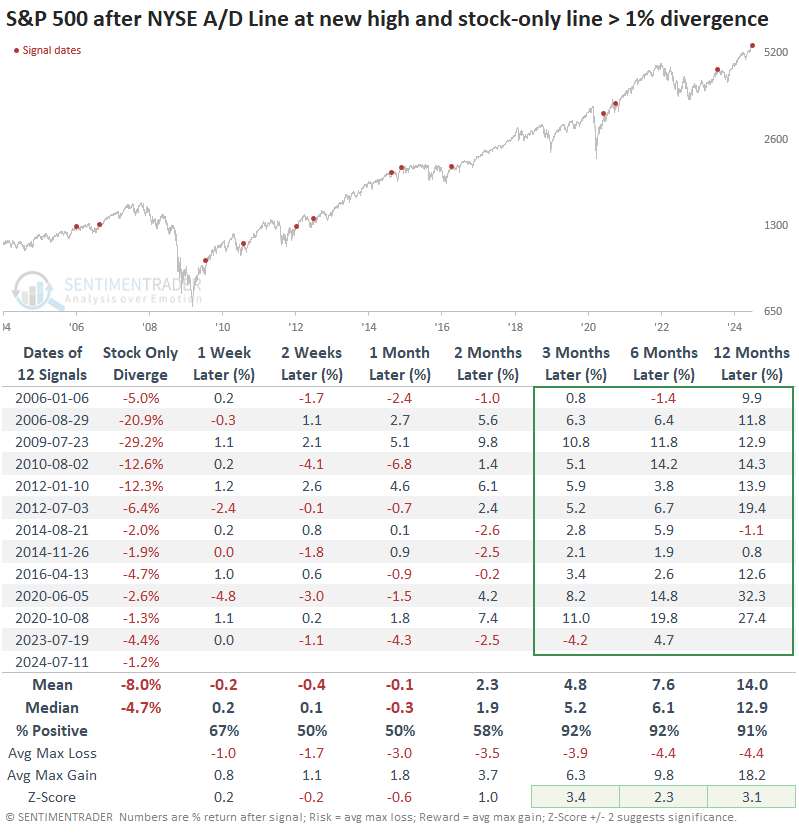
Maybe this is too nit-picky, but the Advance/Decline Line version that includes only common stocks (and not other issues like preferred shares) still hasn't made a new high.
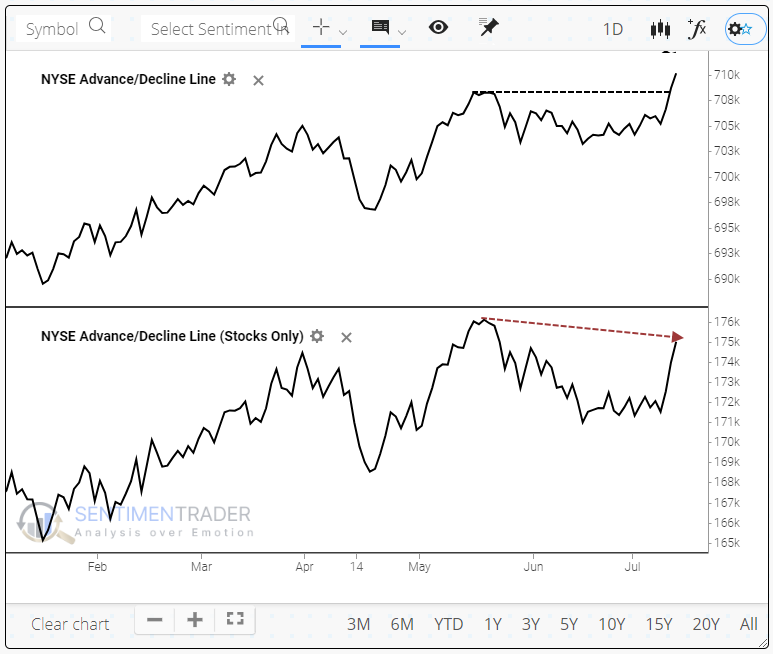
The table below shows us what happened when the main A/D Line set a fresh 52-week high for the first time in at least 30 days, but the stock-only version was at least 1% off its own high. Unfortunately, we only have data going back 20 years, but the other instances showed relatively weak returns up to a month later and strong returns over the next 3-12 months.
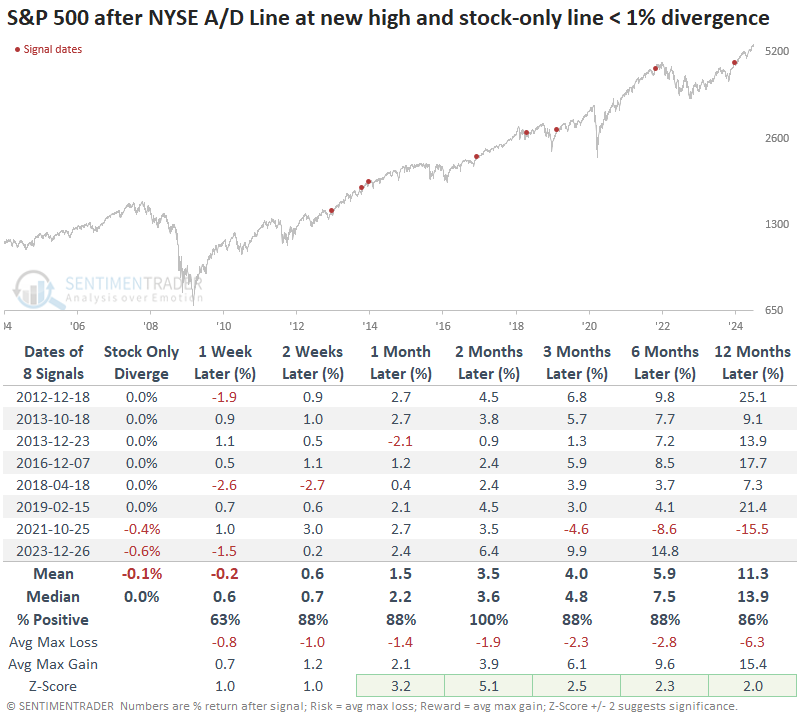
 If we contrast that with times when there was no divergence, or at most a very small one, returns were exceptionally strong across the board except maybe the first week.
 What the research tells us...
The sick and grotesque attempt on former President Trump's life has had little initial impact on stocks. The historical impact of similar attempts is mixed, with mostly weakness in the short term since markets abhor uncertainty. The long-term ramifications will not become clearer for weeks at least, as the initial reports have seemingly raised more questions than answers.
We'll focus on investor behavior instead of opining on unknowables and delving into personal political outlooks. So far, it has been muted and hasn't changed the trajectory launched last week. And that trajectory is mostly positive, with improved probabilities when looking out beyond a few months. The shorter term is much more of a question, and the risk/reward hasn't been all that favorable, even after a breadth breakout like late last week.
Indicators at Extremes
Phase Table
Ranks
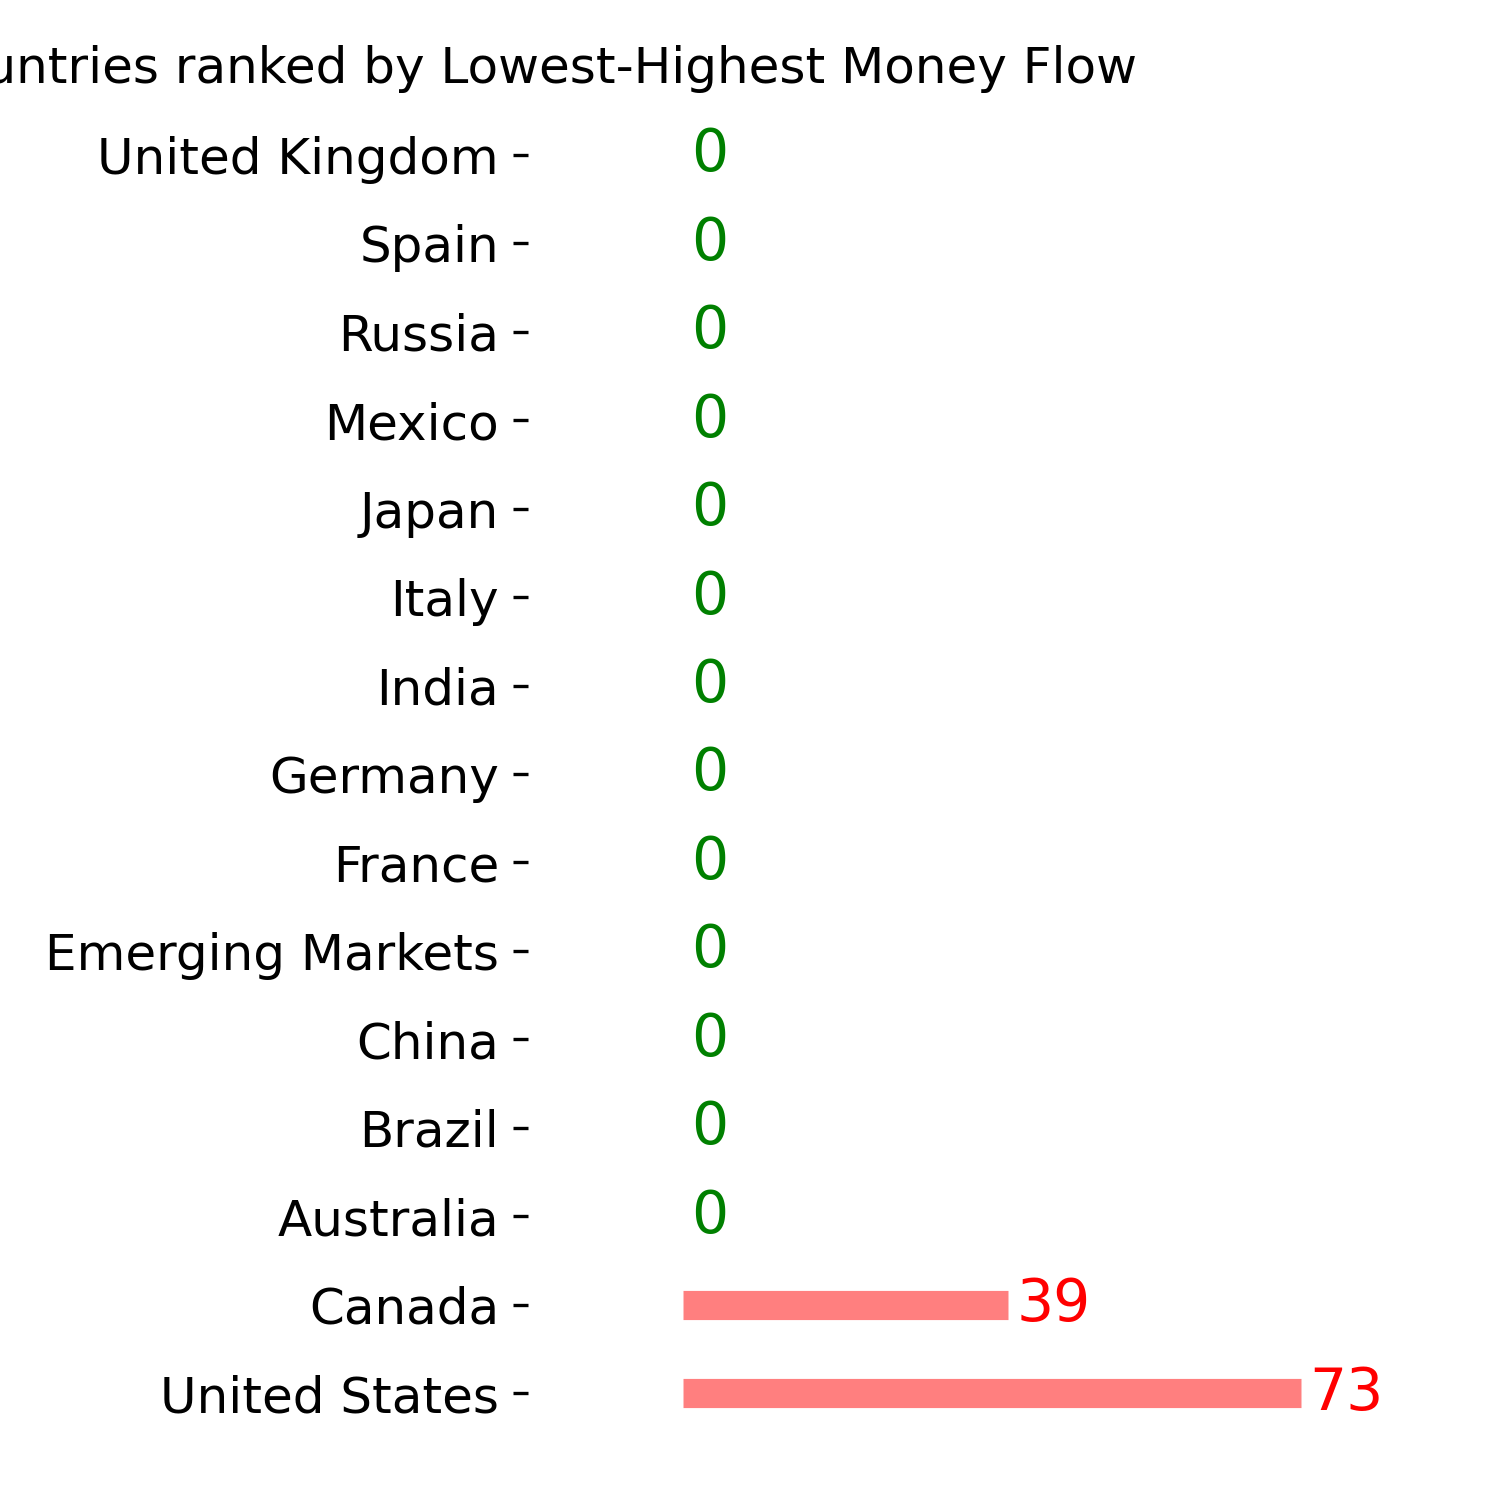
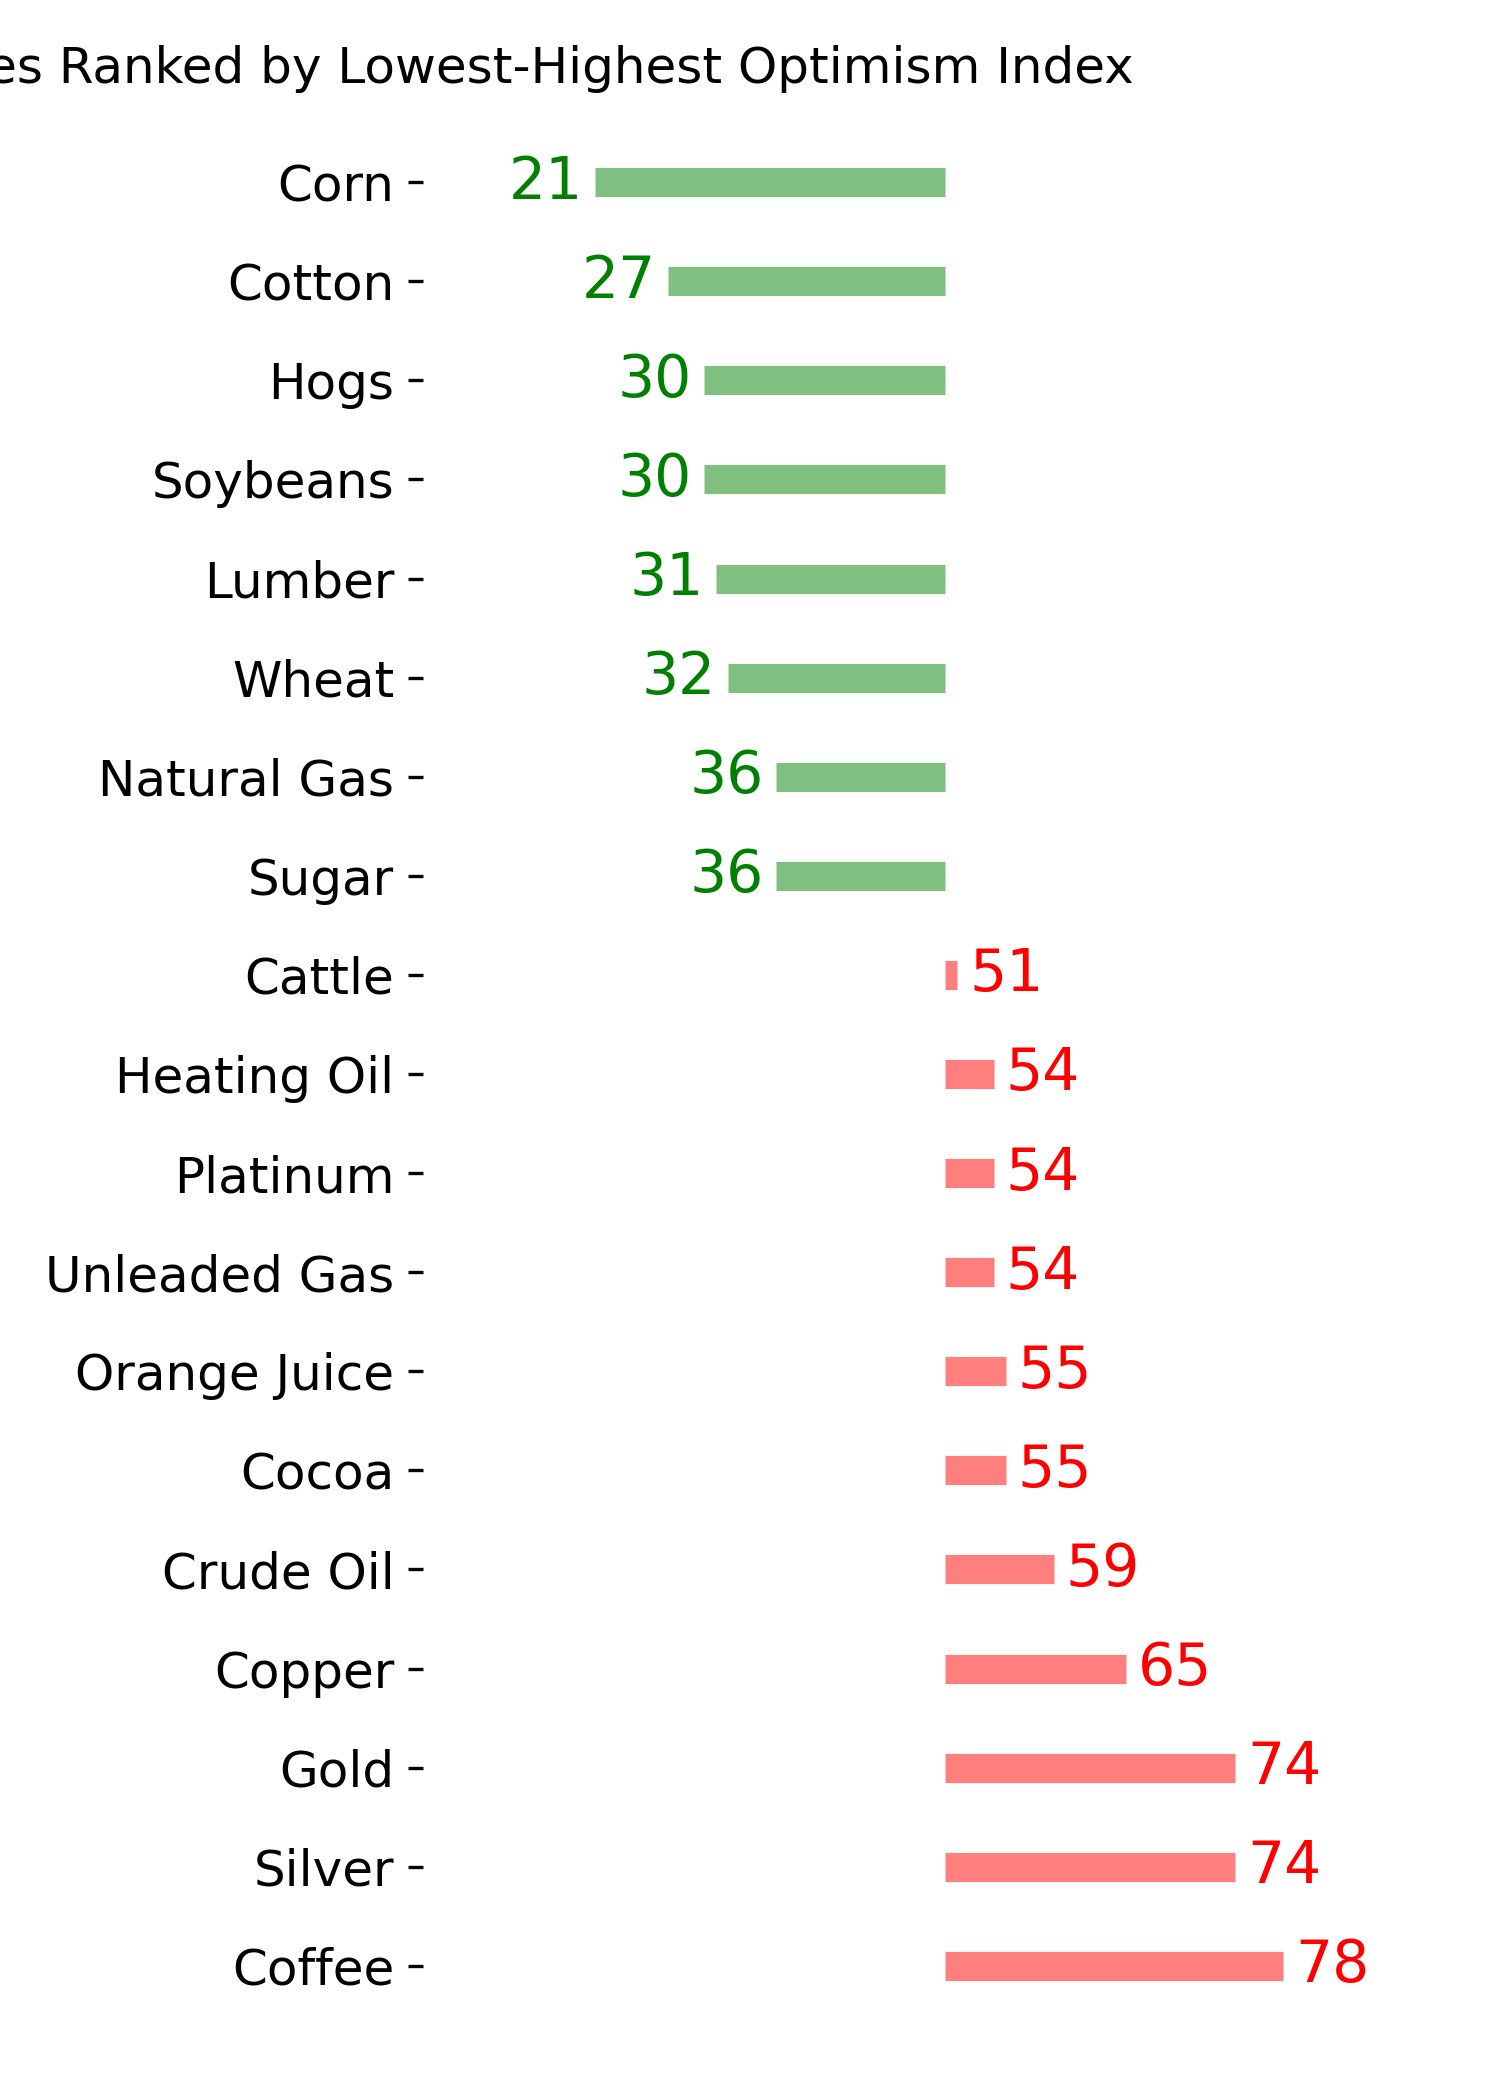
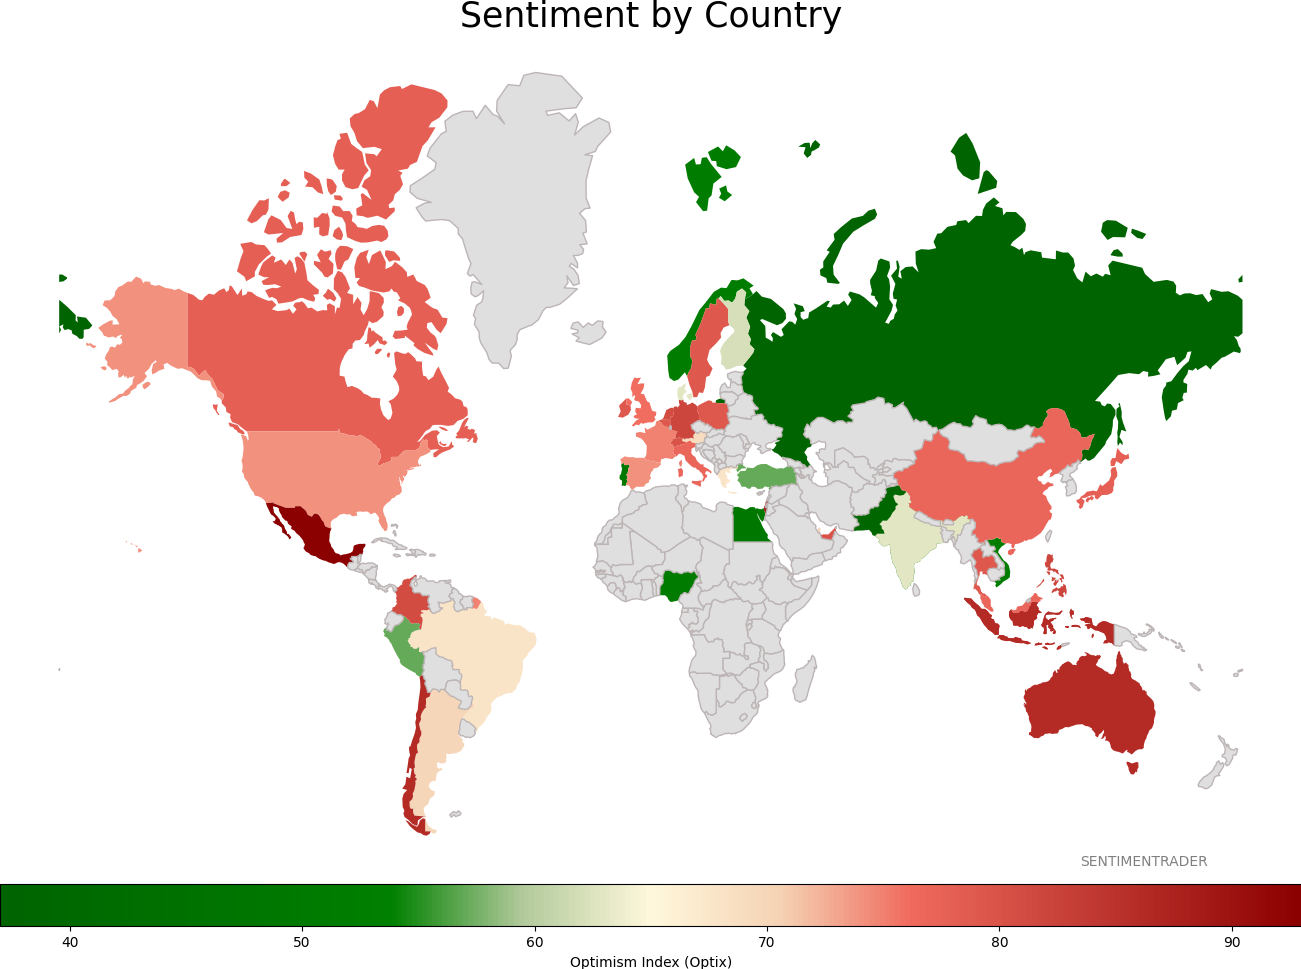
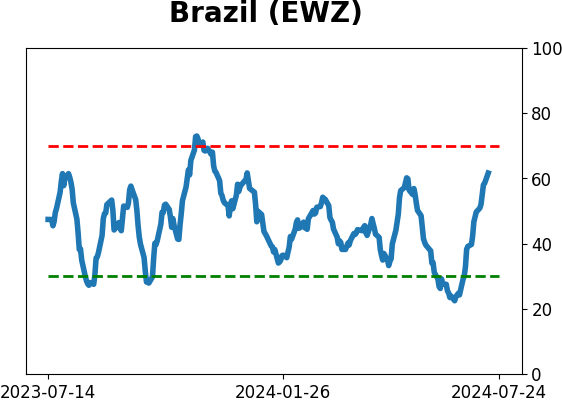
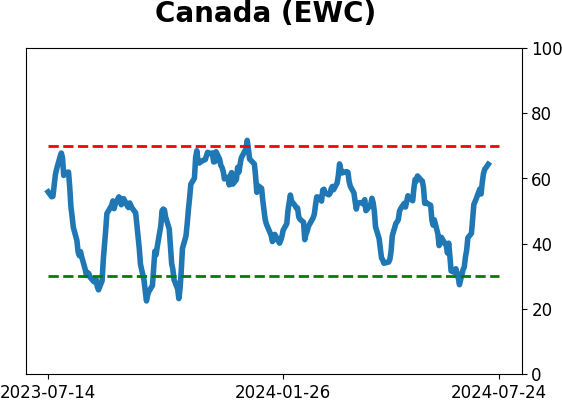
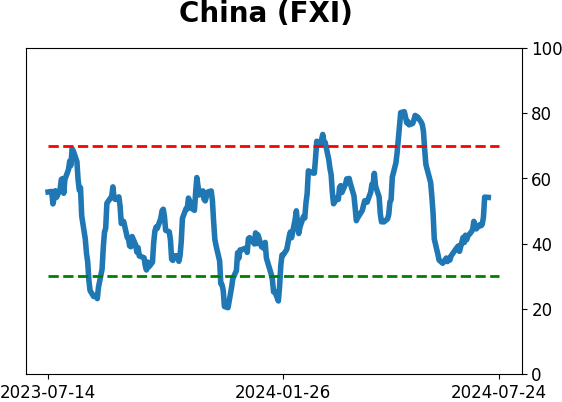
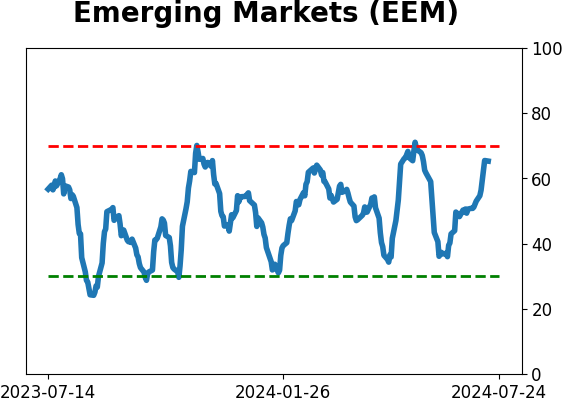
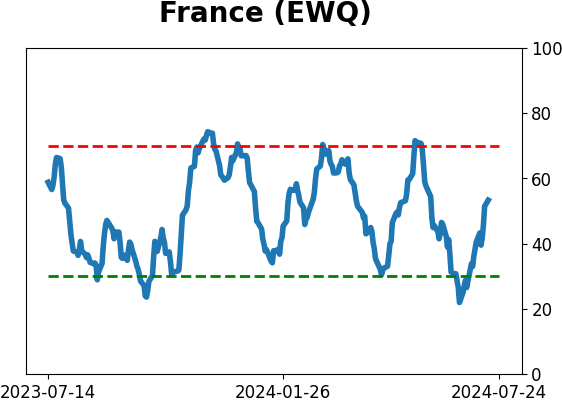
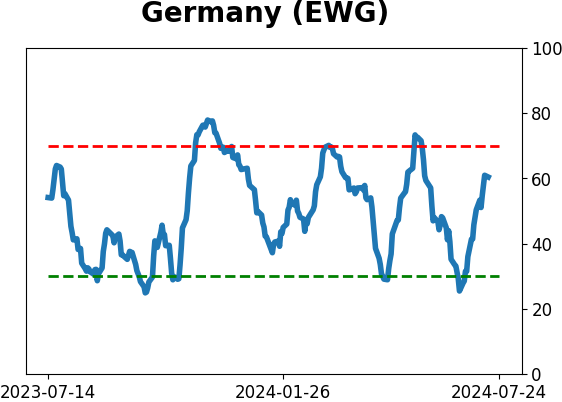
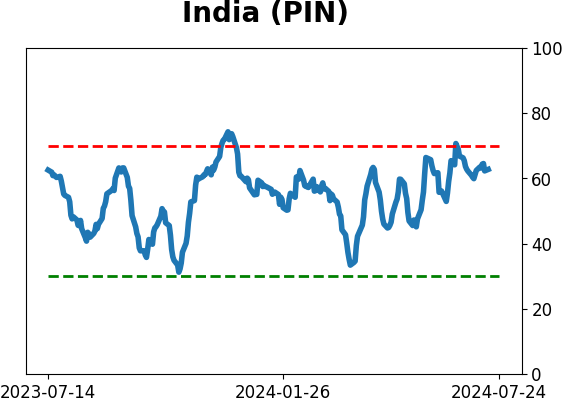
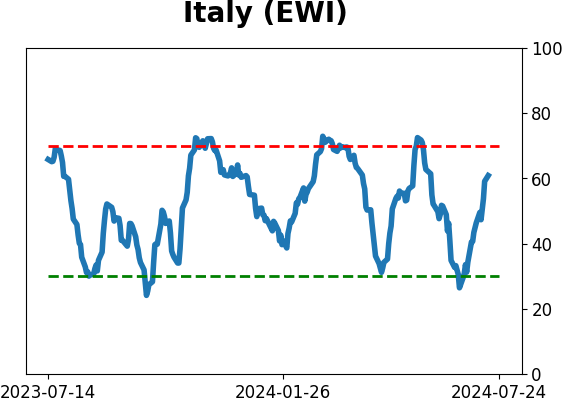
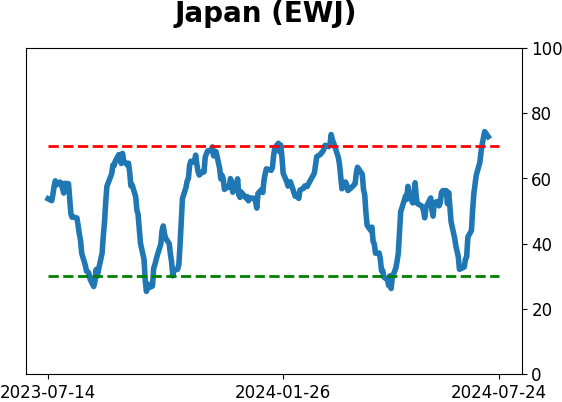
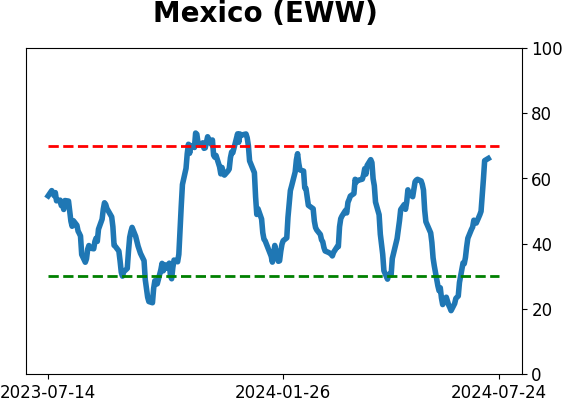
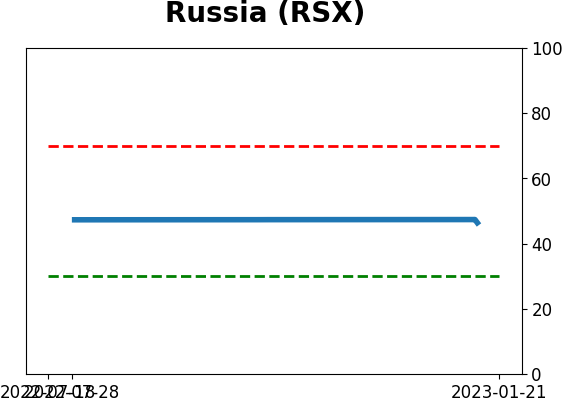
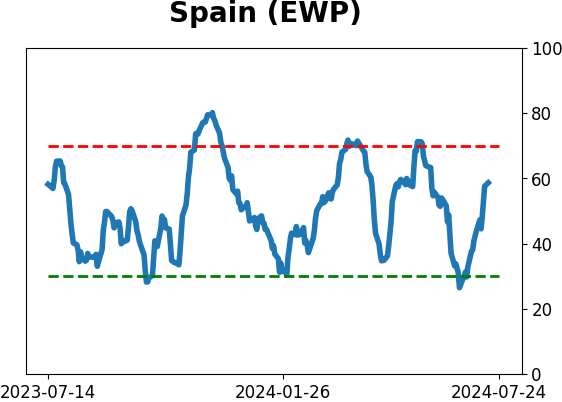
Sentiment Around The World
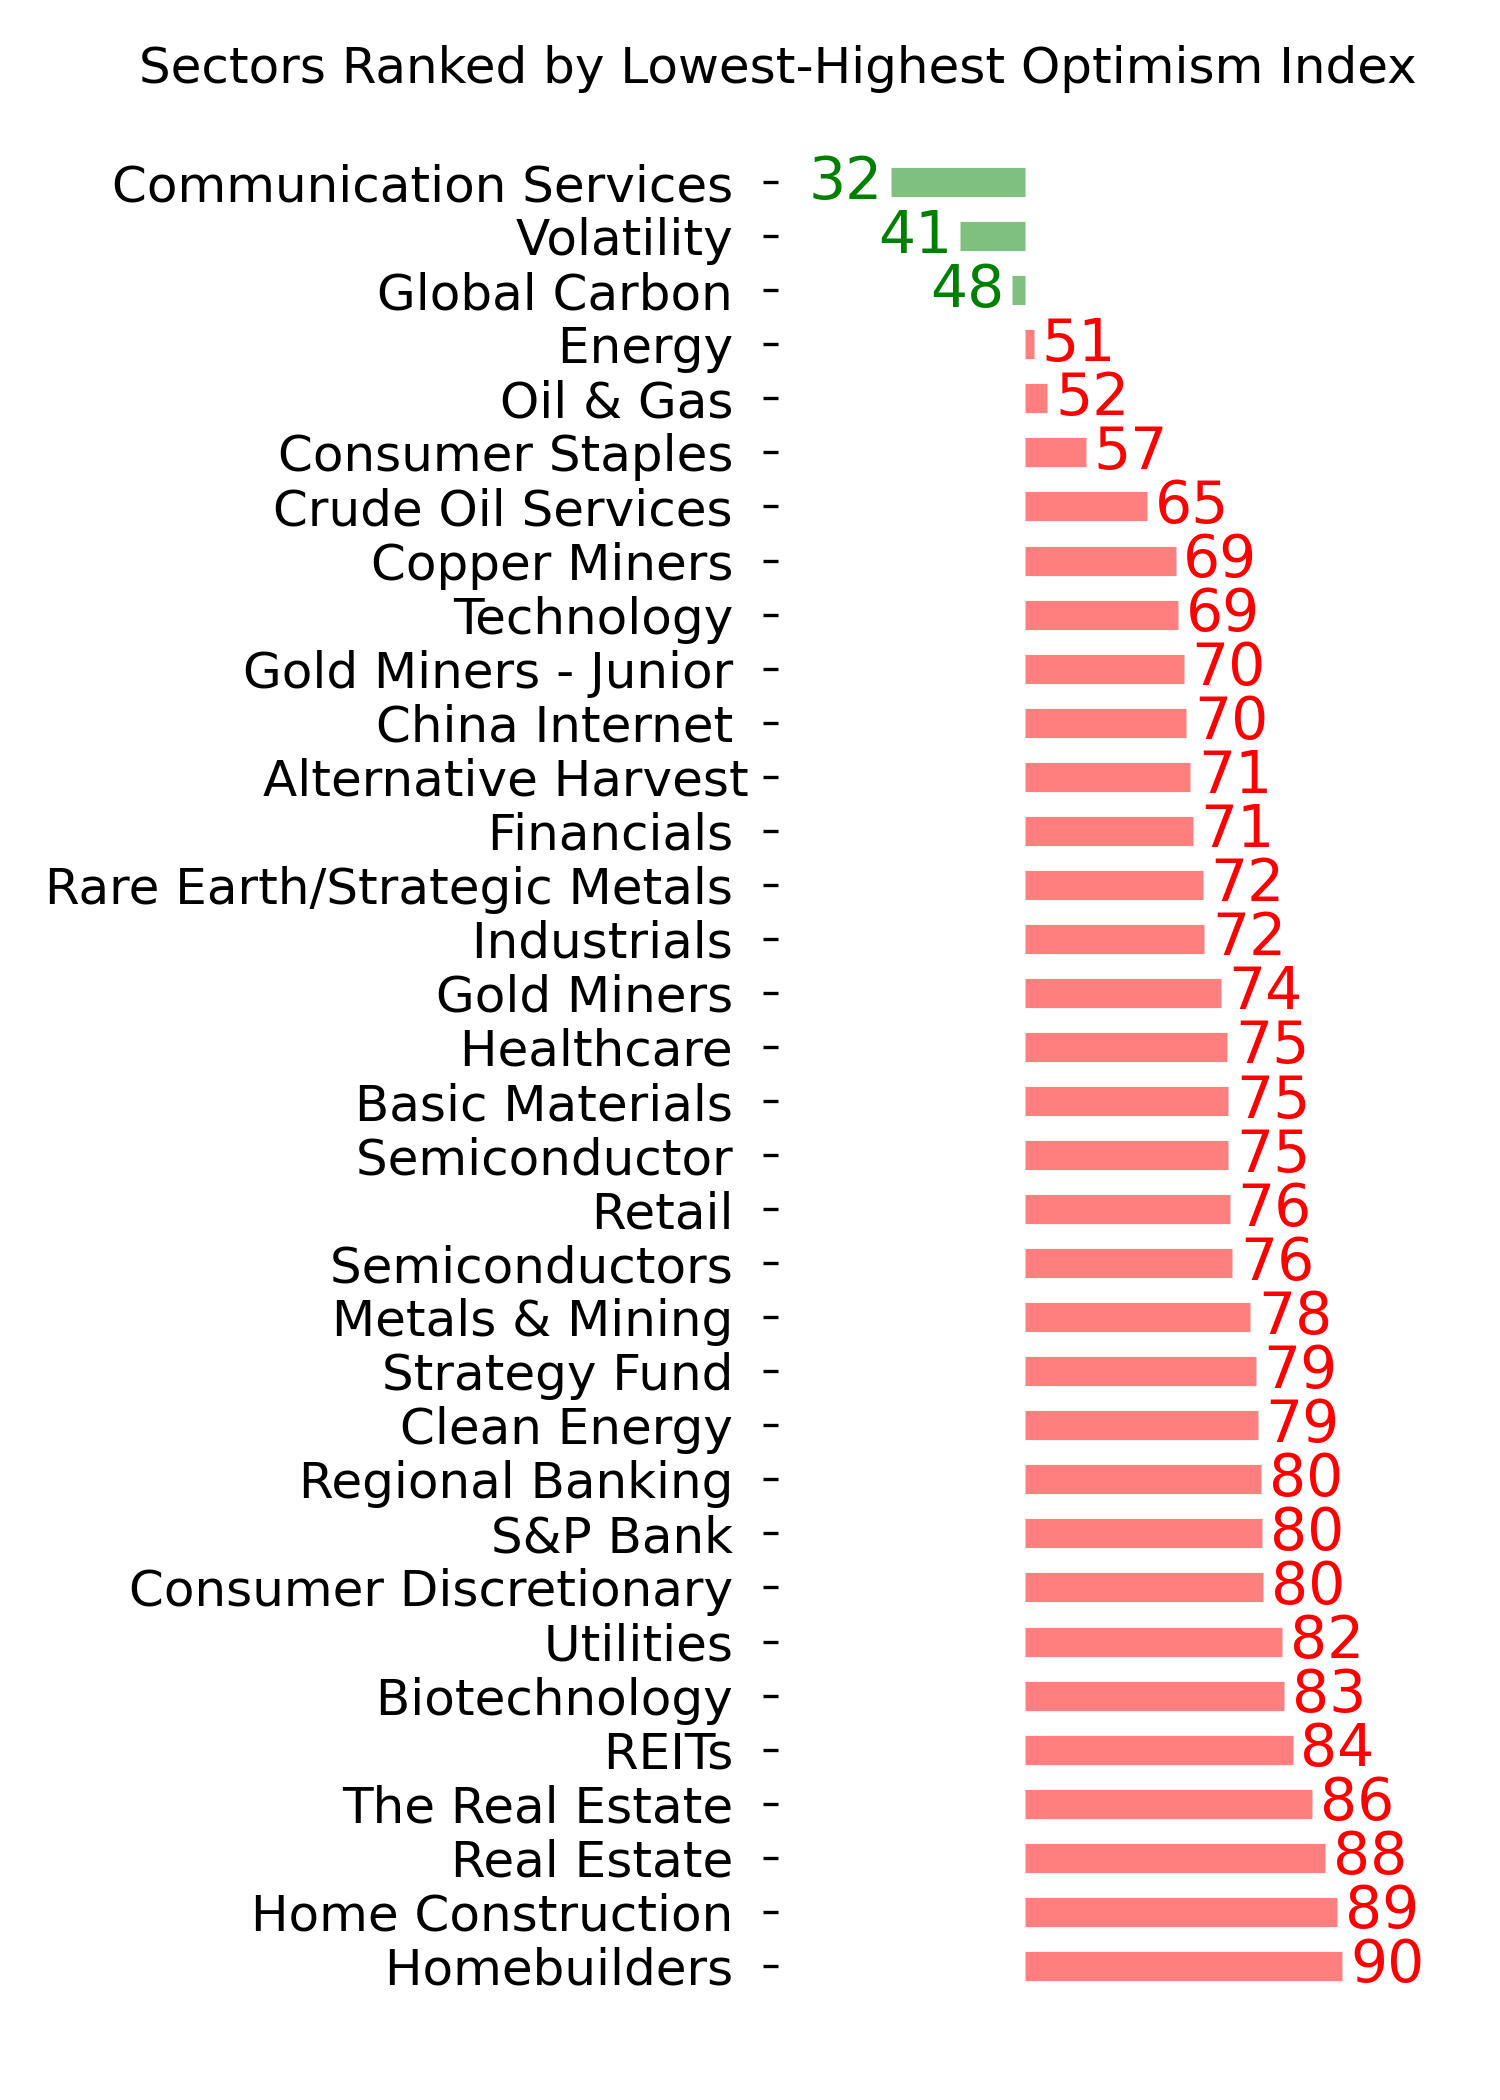
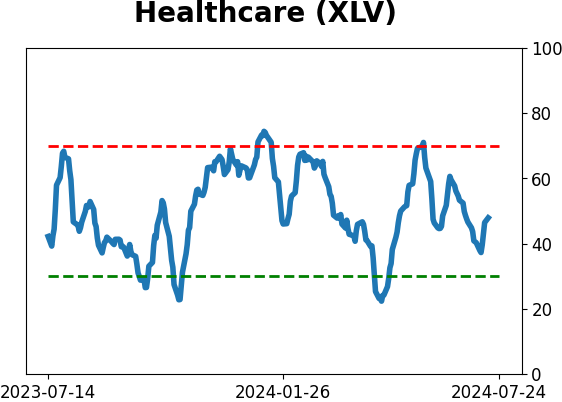
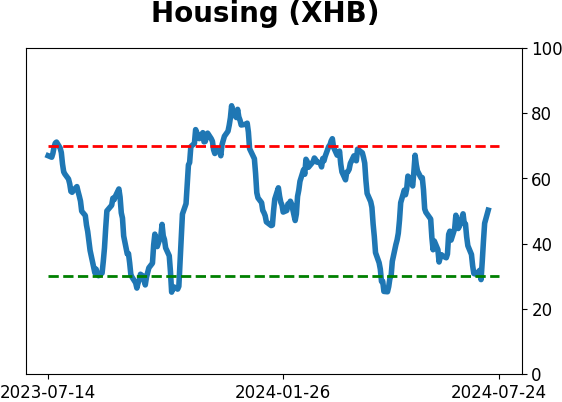
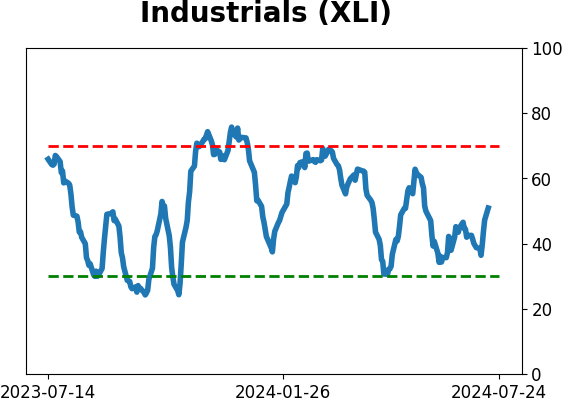
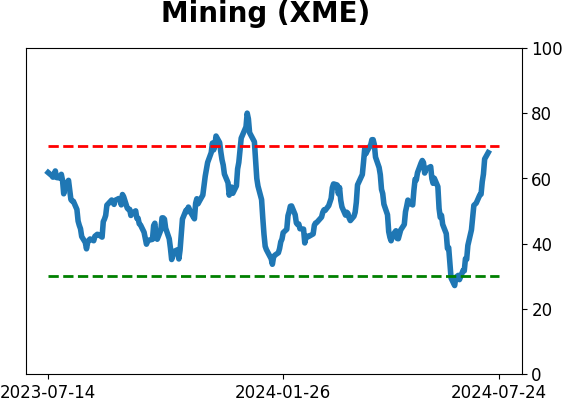
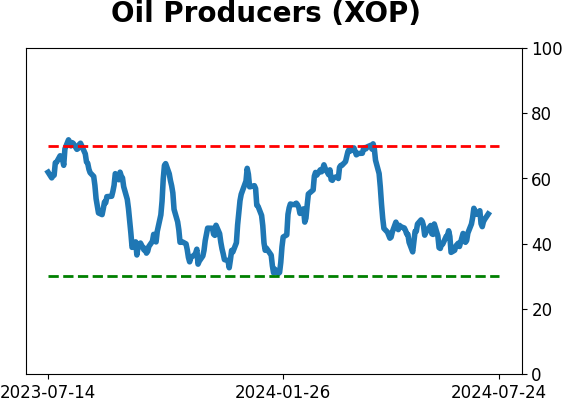
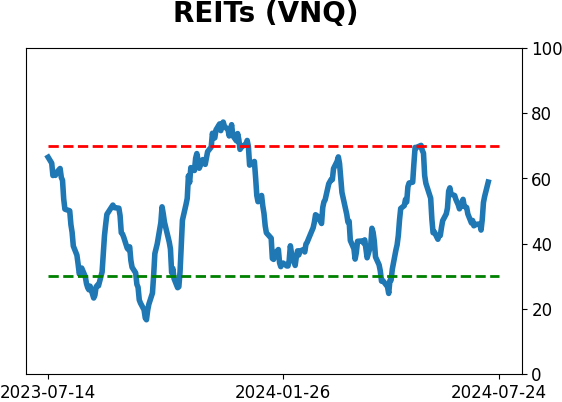
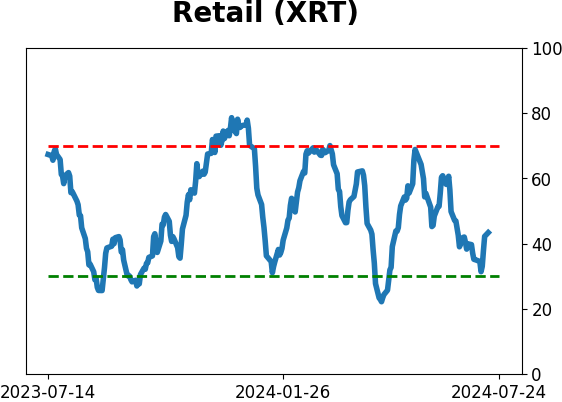
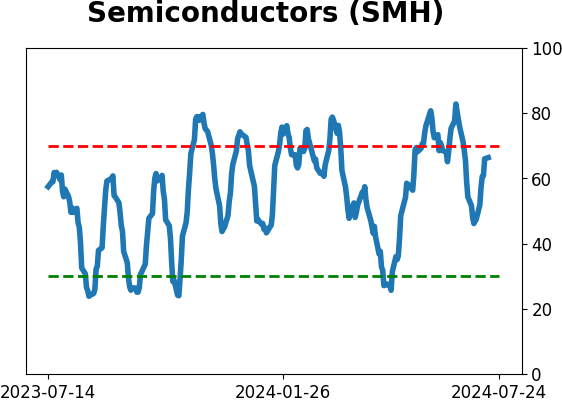
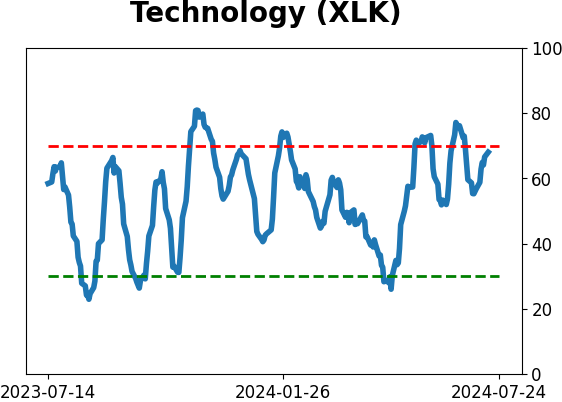
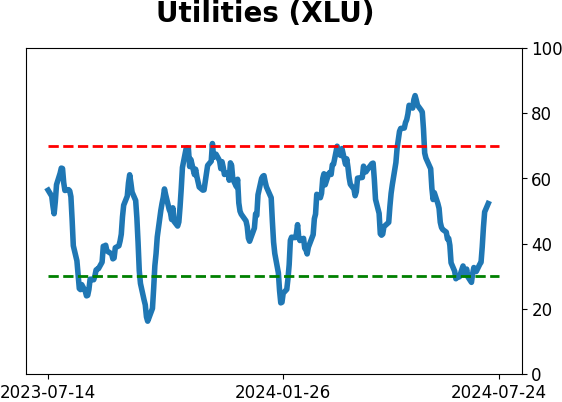
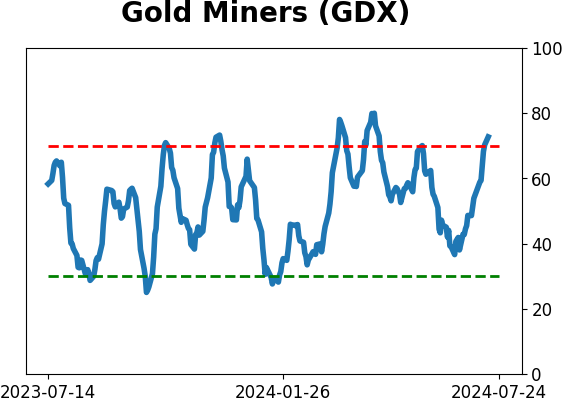
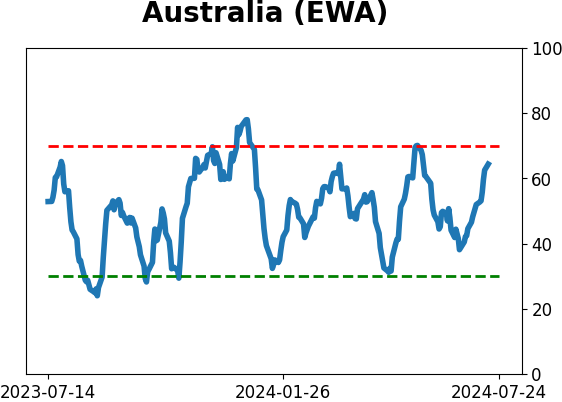
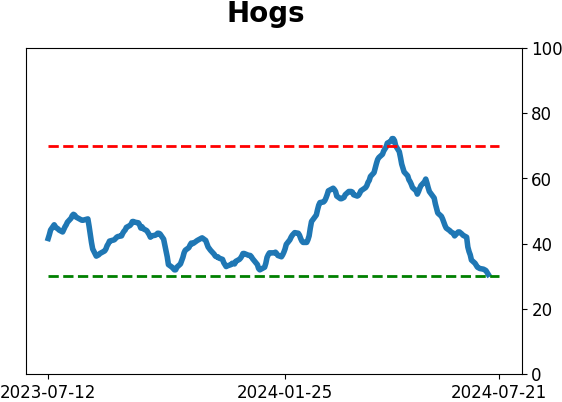
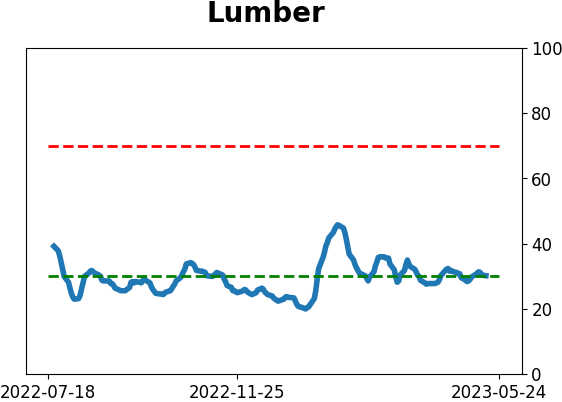
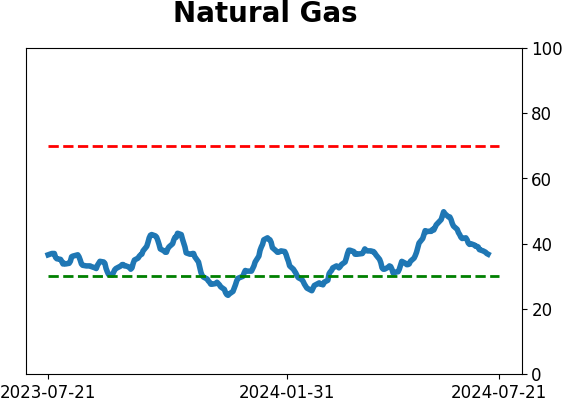
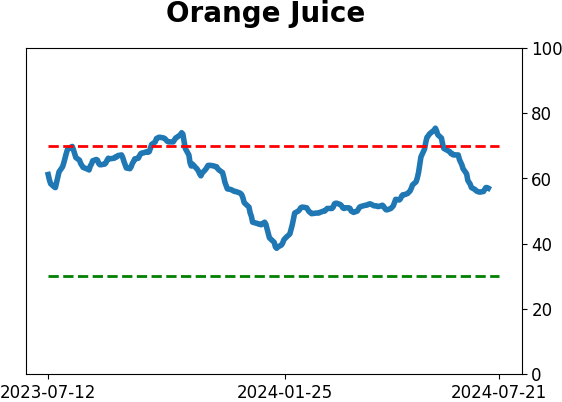
Optimism Index Thumbnails
|
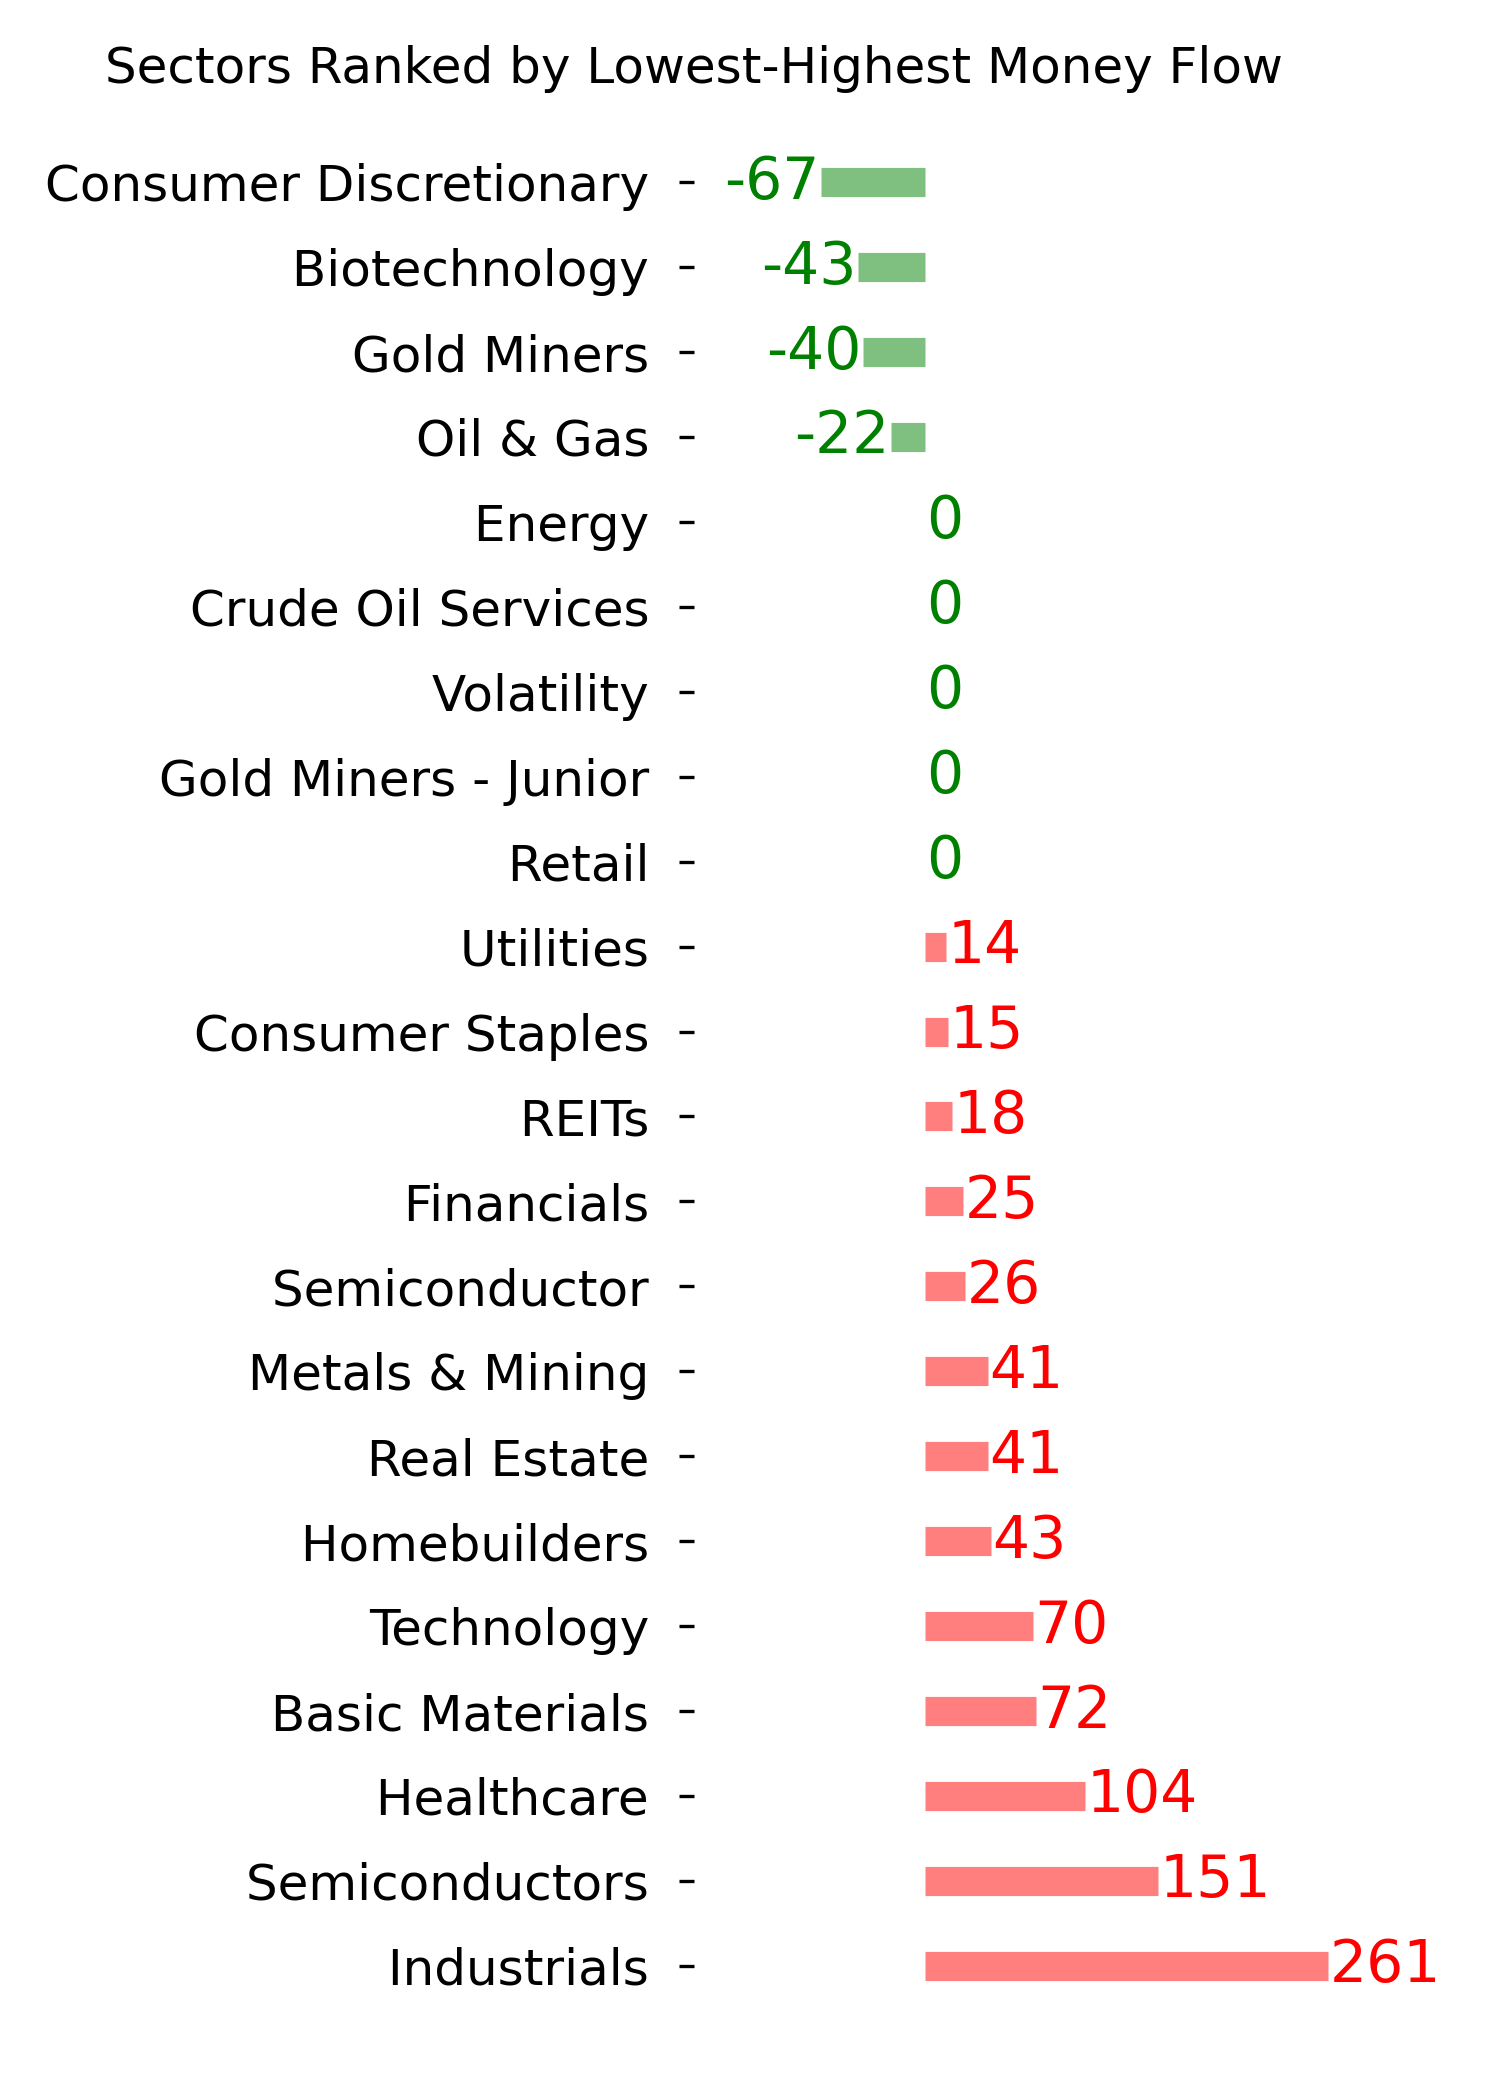
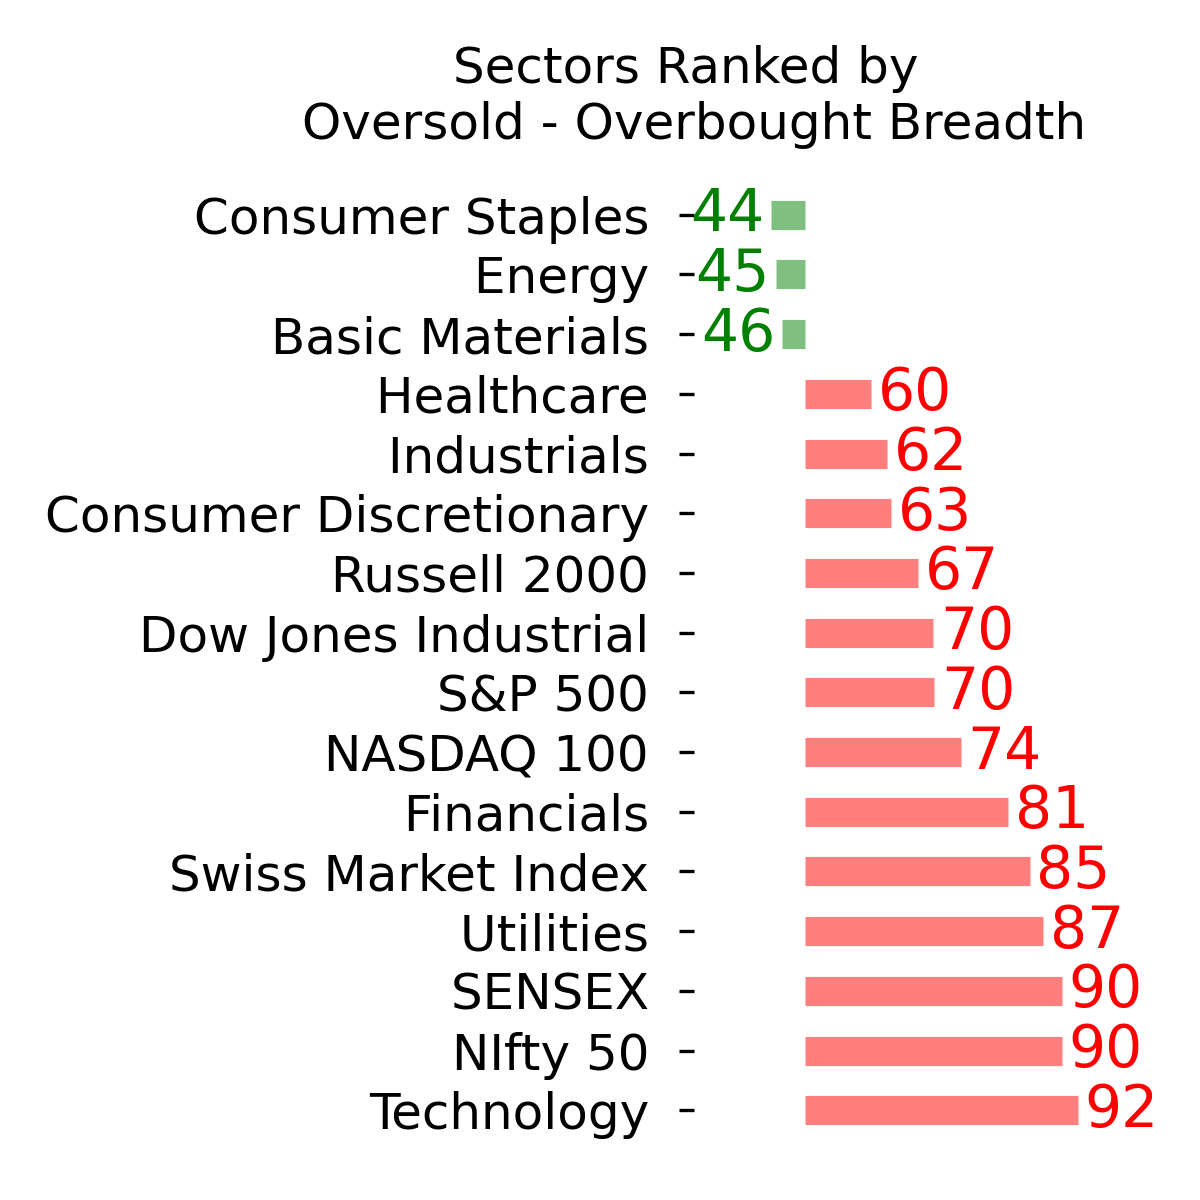
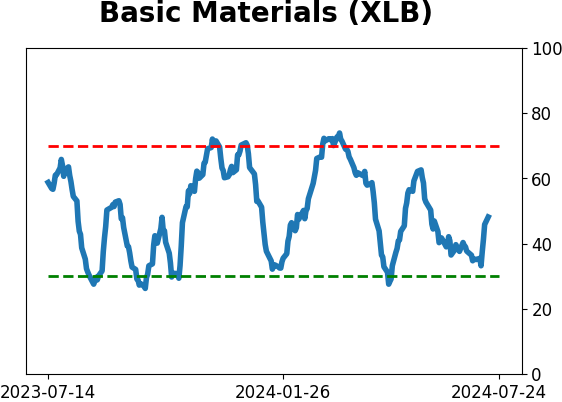
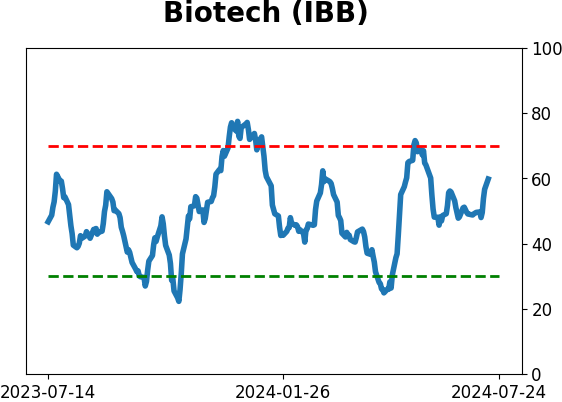
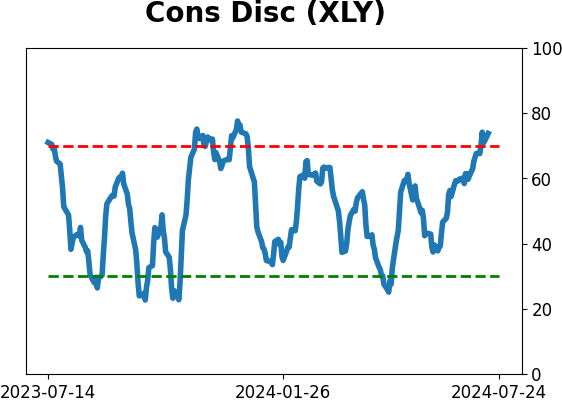
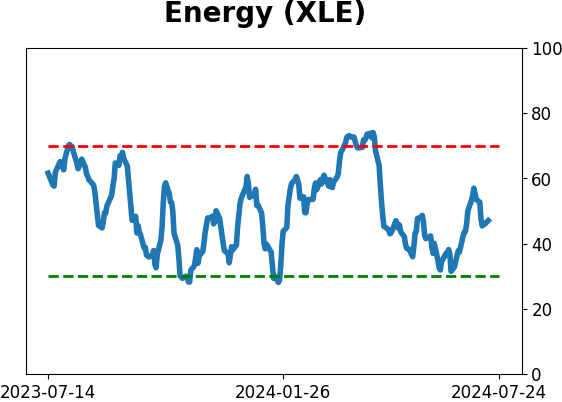
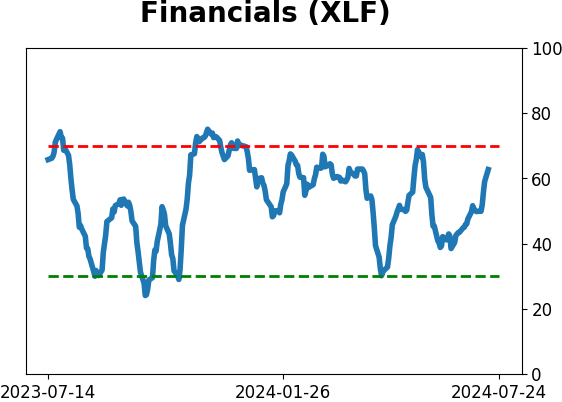
Sector ETF's - 10-Day Moving Average
|
|
|
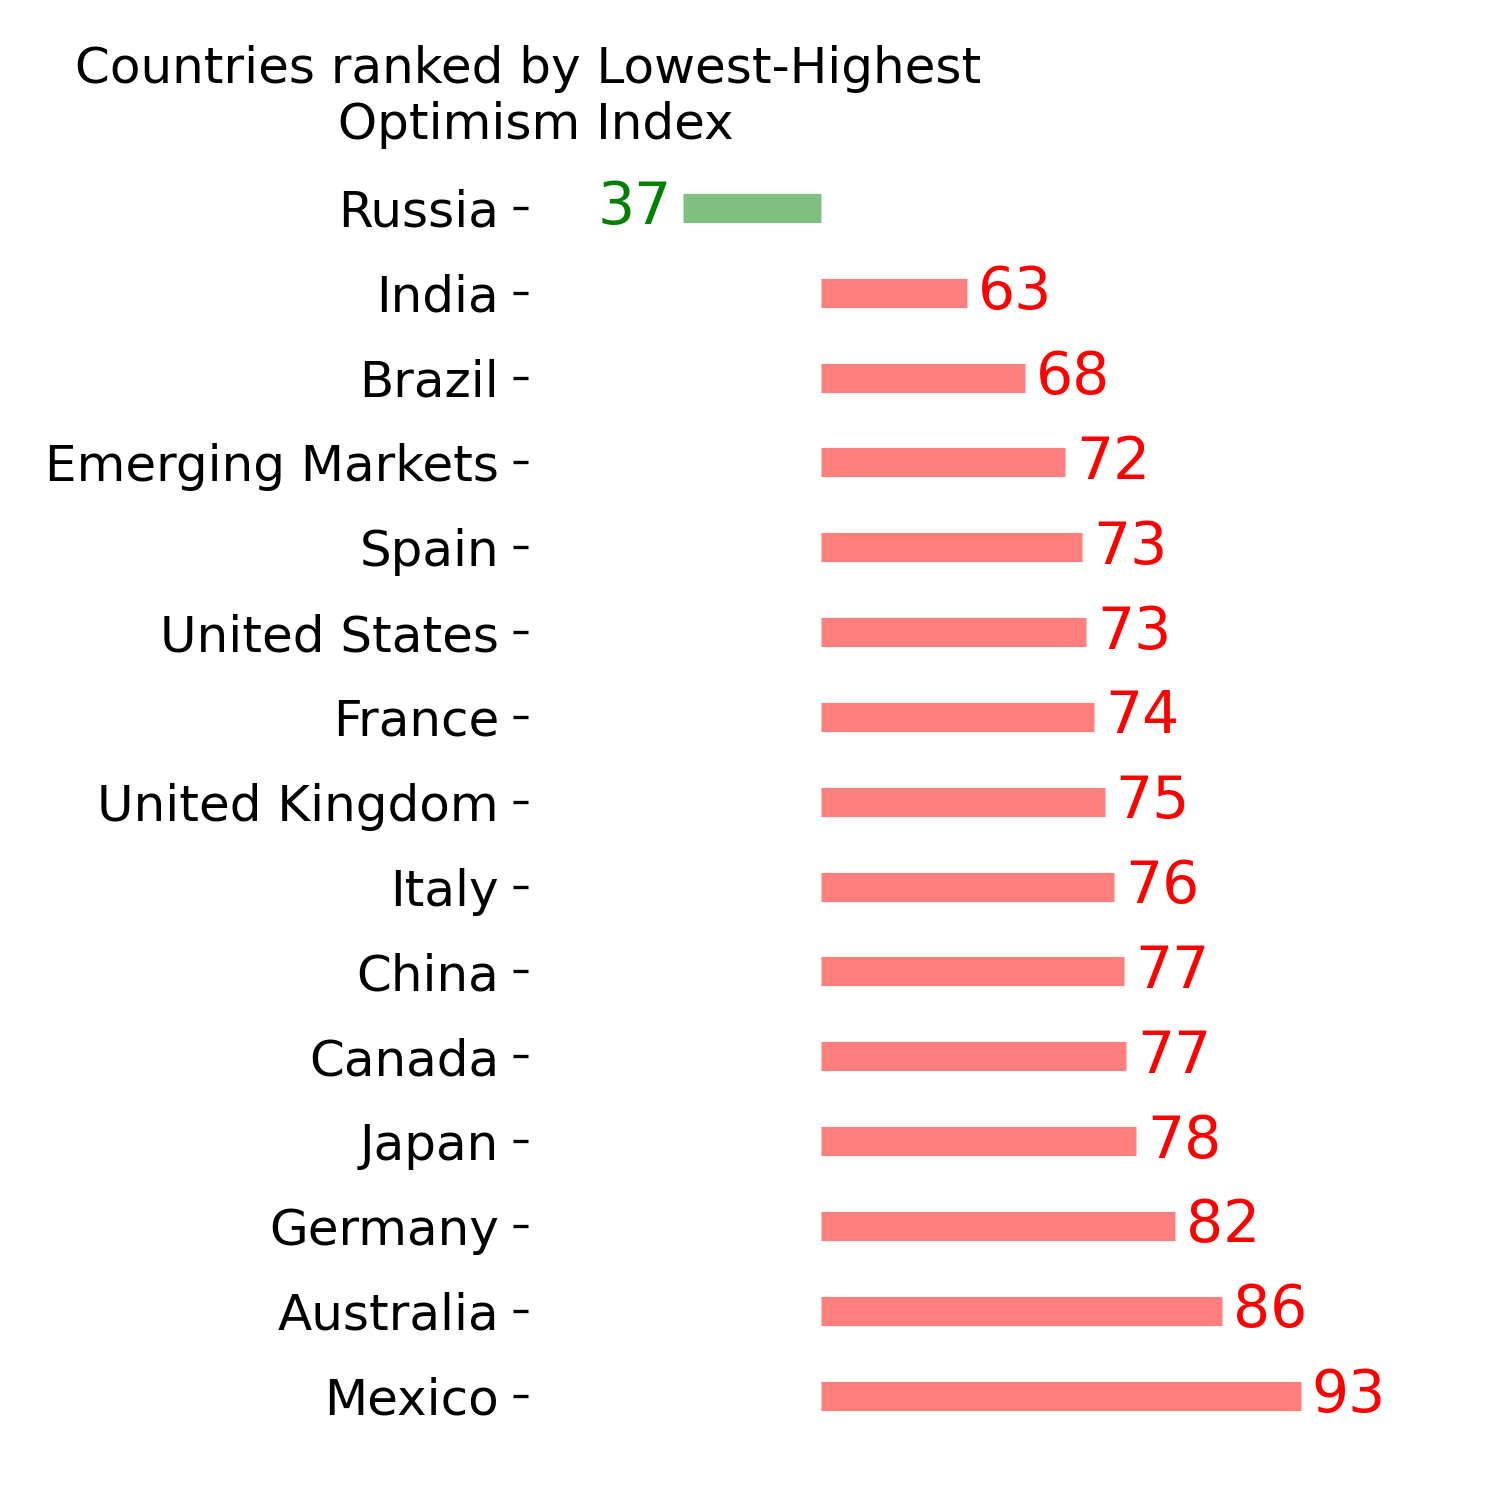
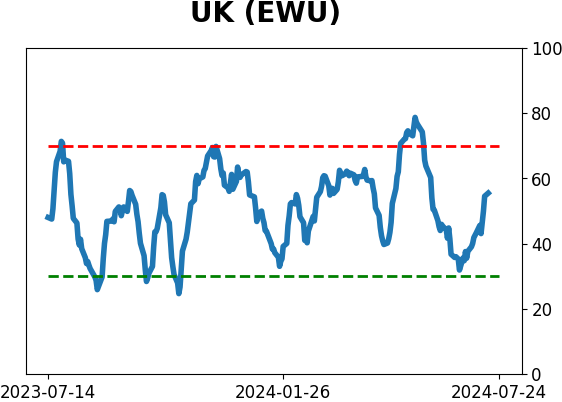
Country ETF's - 10-Day Moving Average
|
|
|
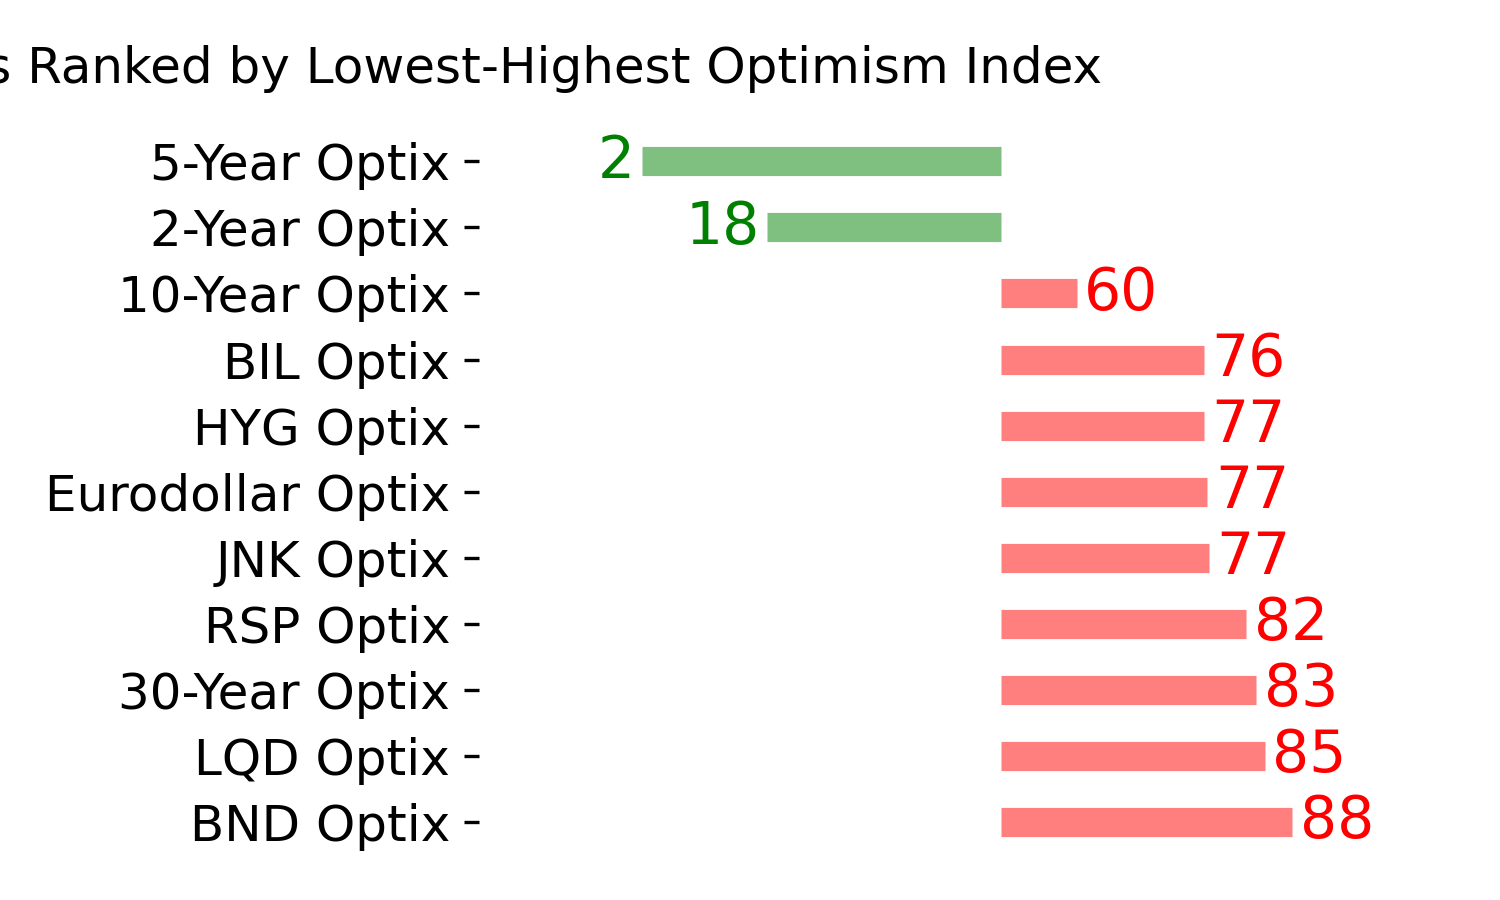
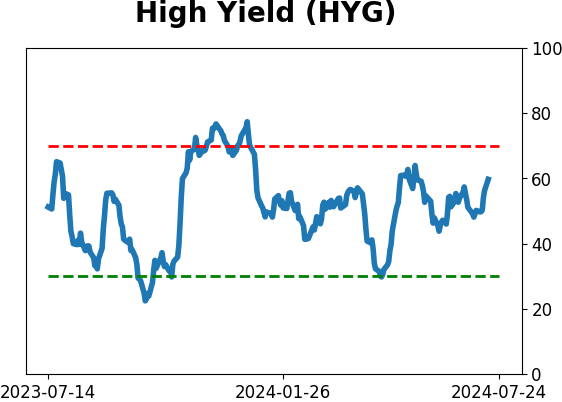
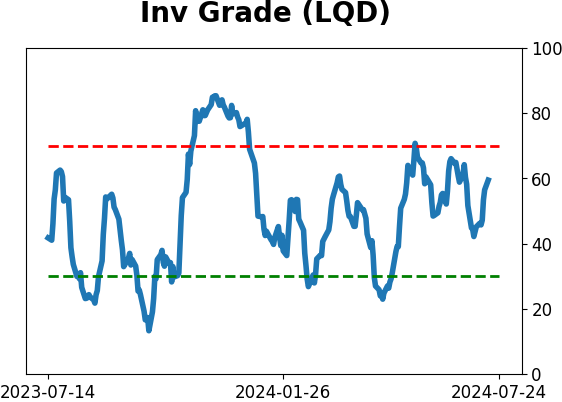
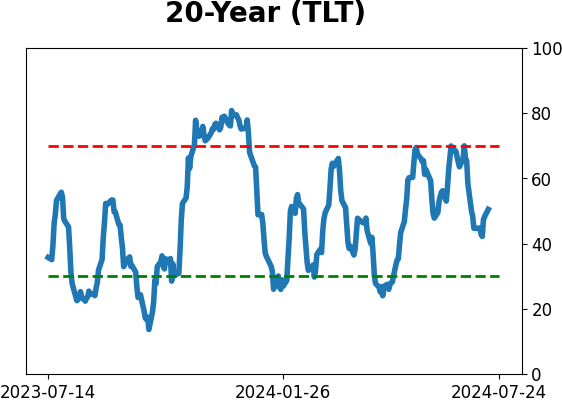
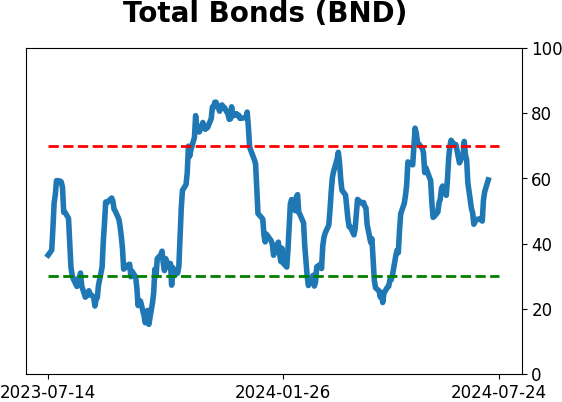
Bond ETF's - 10-Day Moving Average
|
|
|
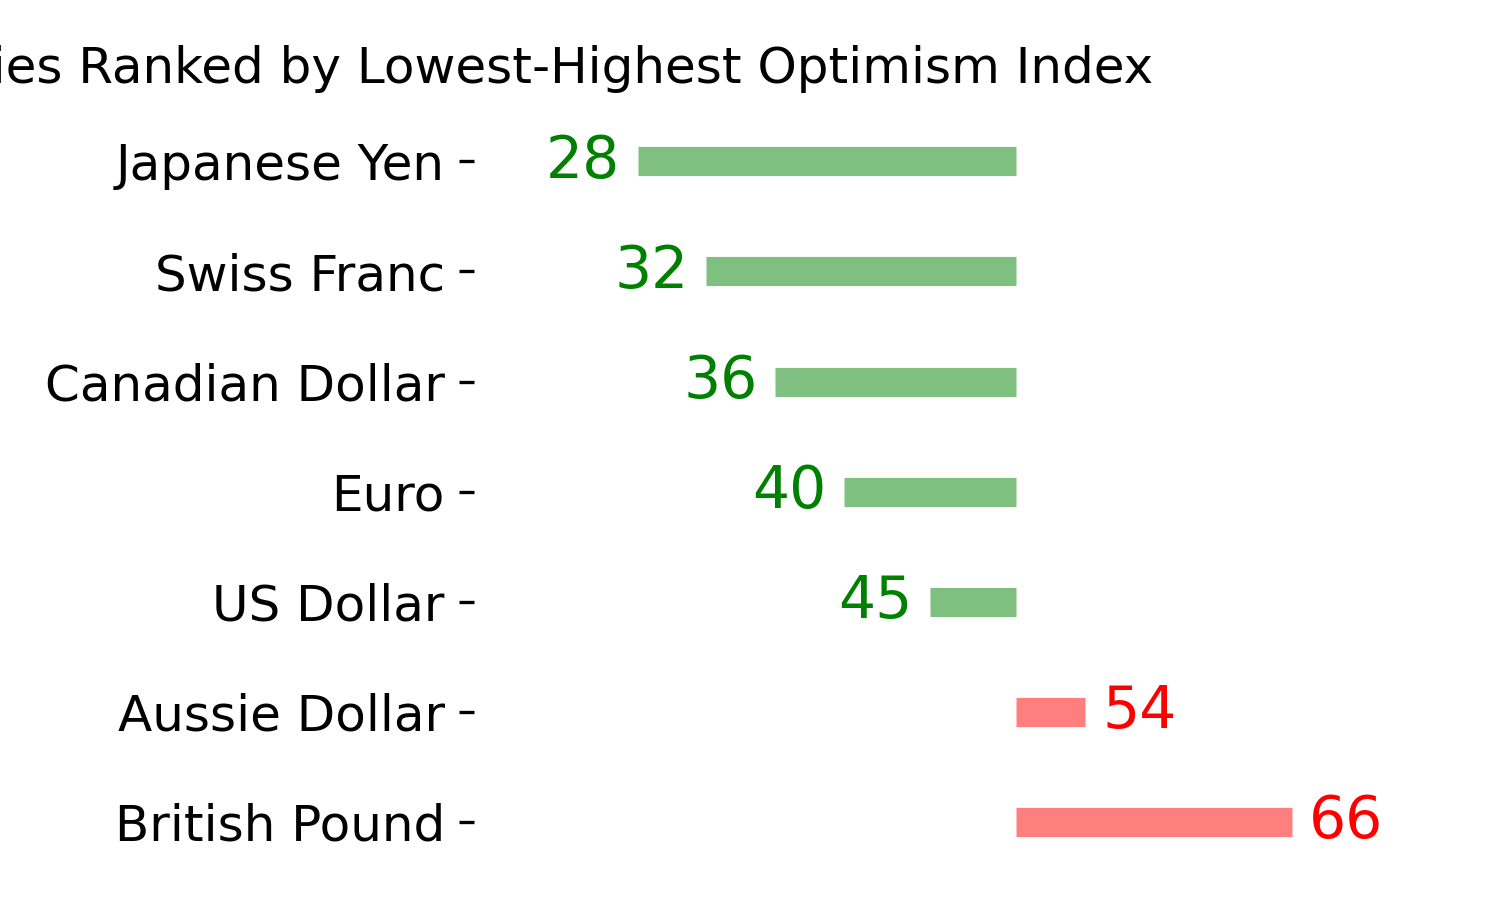
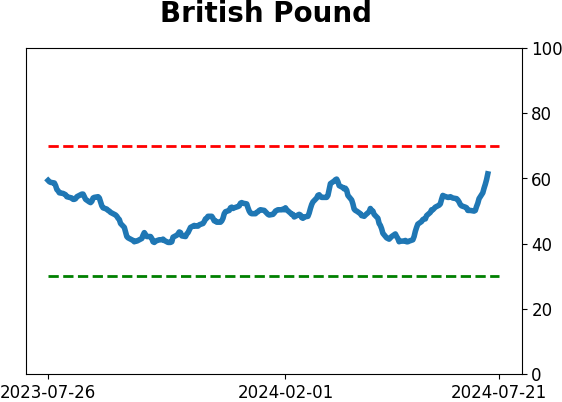
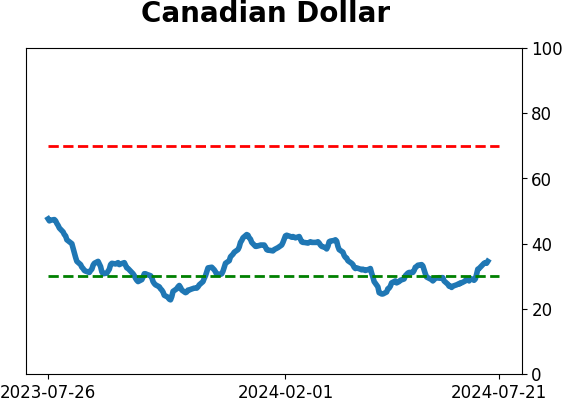
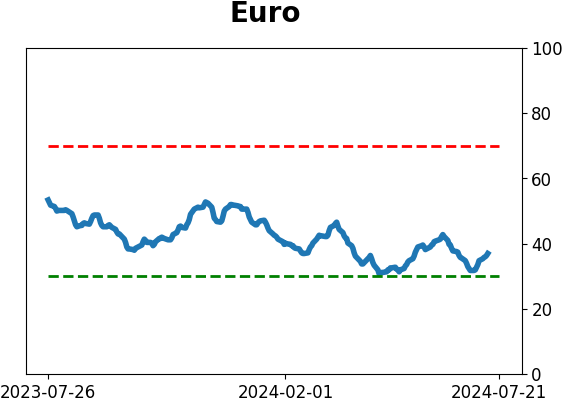
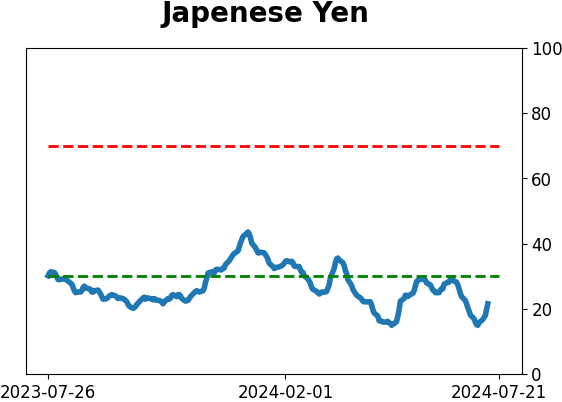
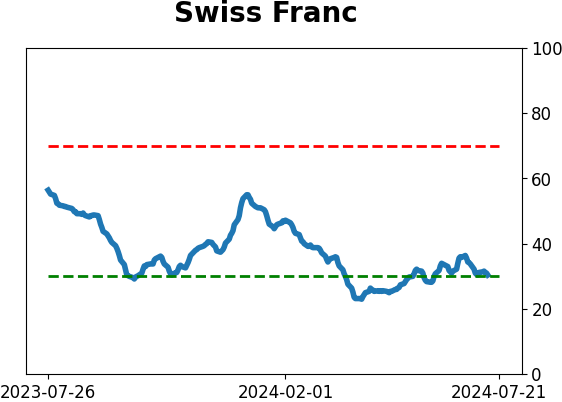
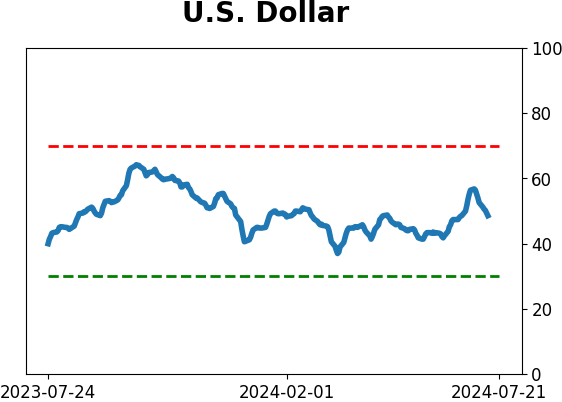
Currency ETF's - 5-Day Moving Average
|
|
|
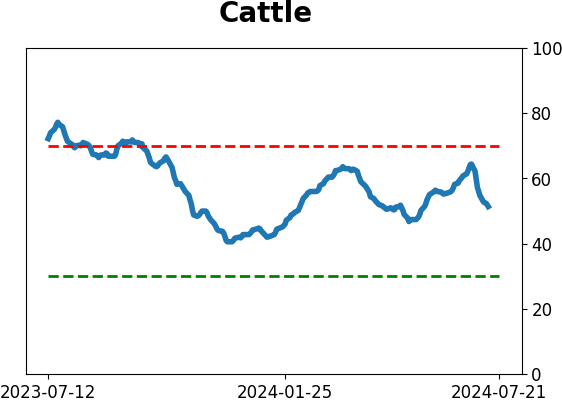
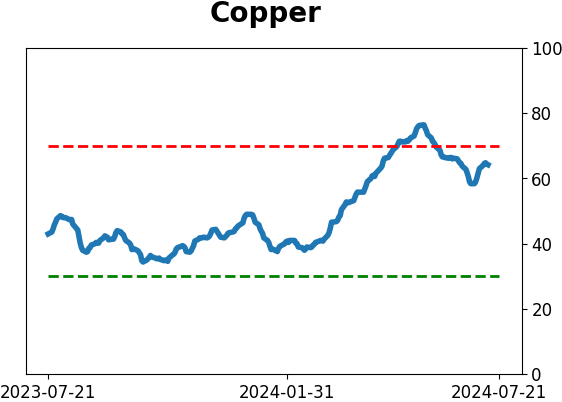
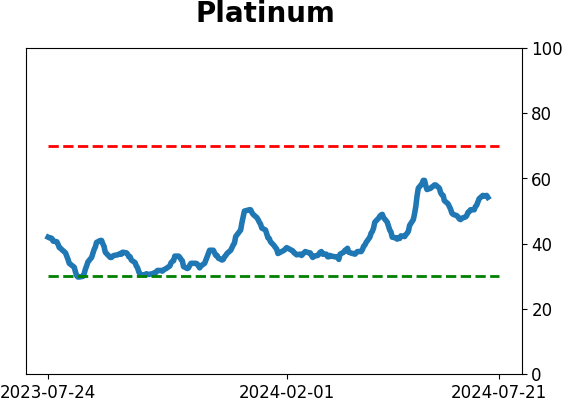
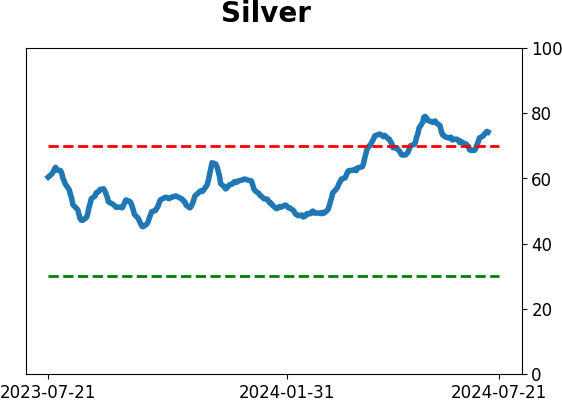
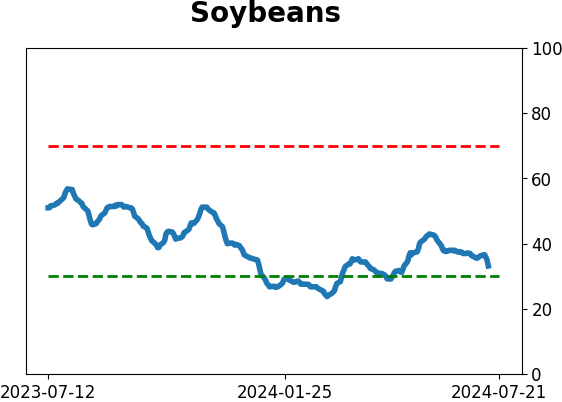
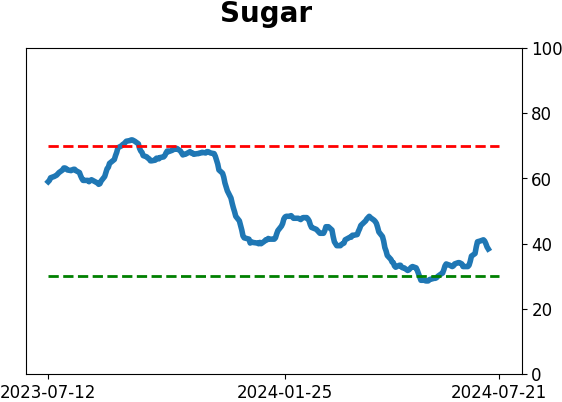
Commodity ETF's - 5-Day Moving Average
|
|