Headlines
|
|
A closer look at the crosscurrents in gold:
Gold appears to be poised for a rally back to test the recent highs. But a few factors call into question its potential to breakout and rally to new all-time highs. In this piece, we lay out the conflicting signals.
|
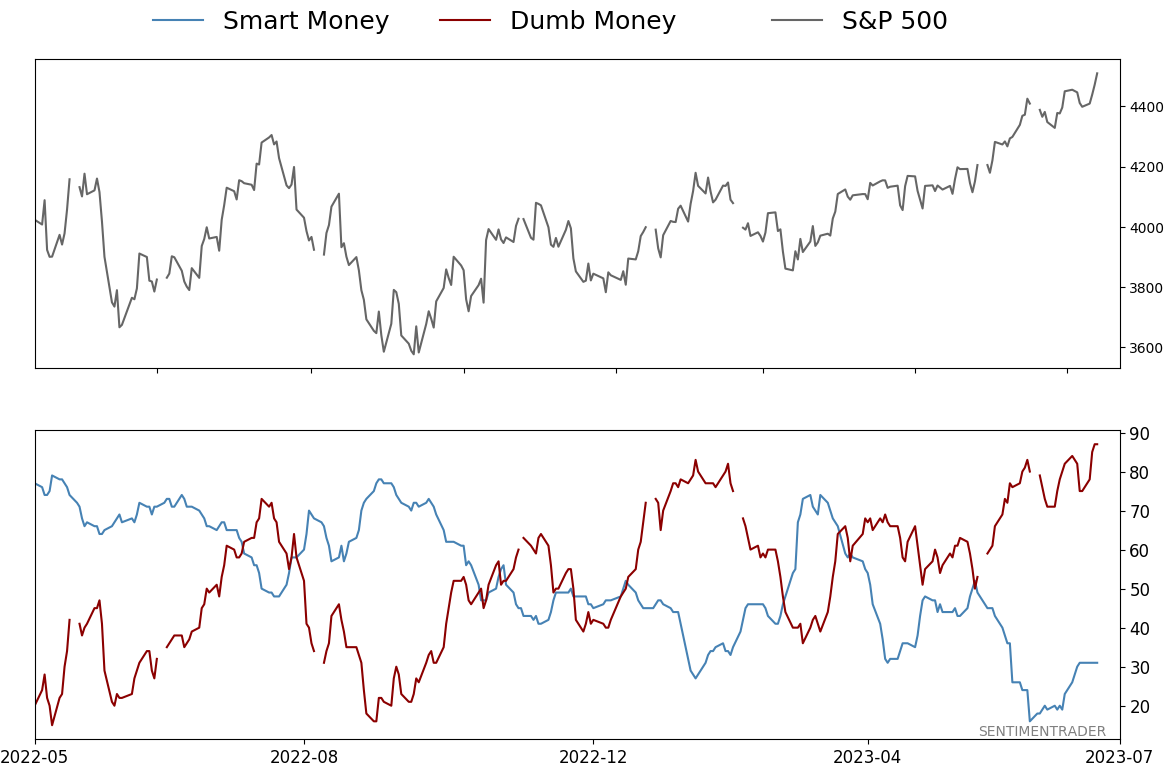
Smart / Dumb Money Confidence
|
Smart Money Confidence: 31%
Dumb Money Confidence: 87%
|
|
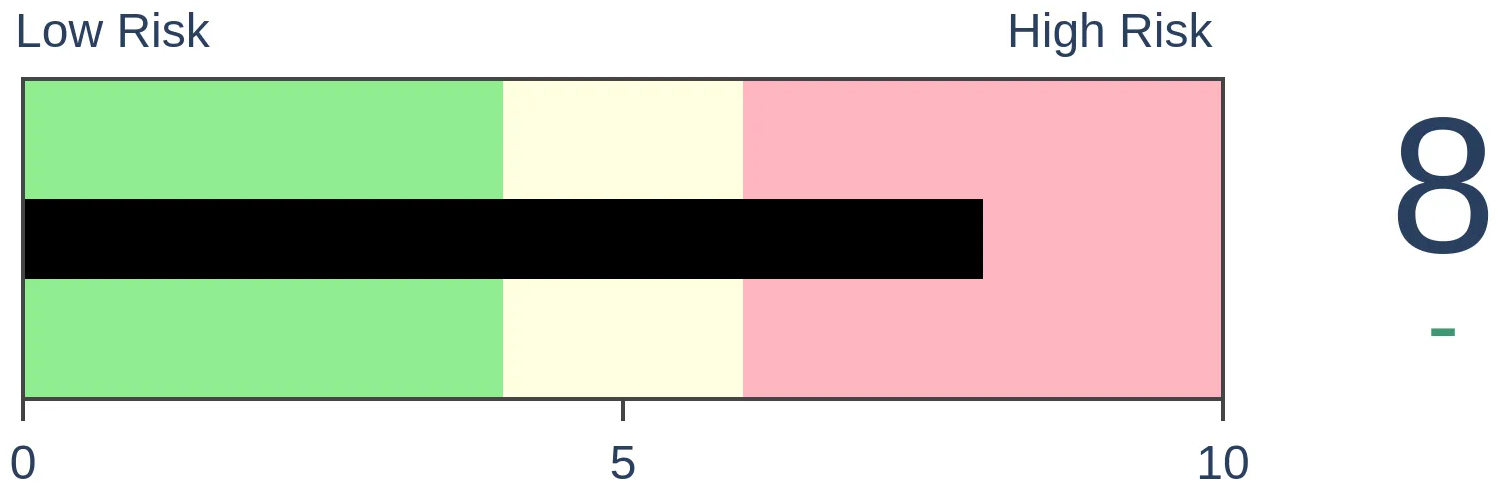
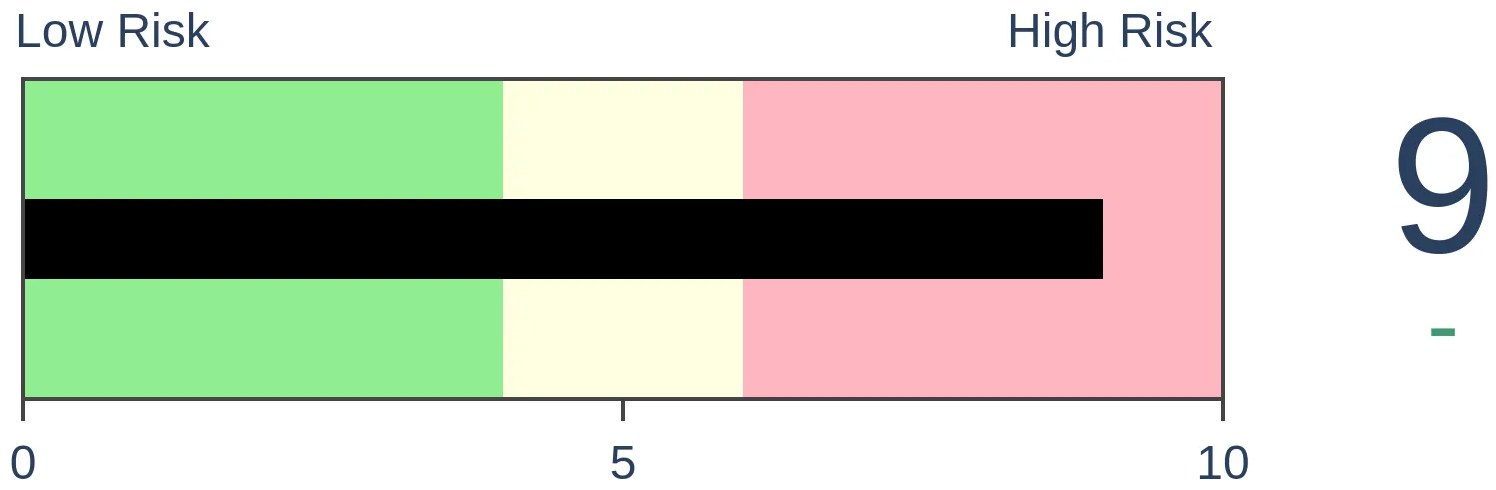
Risk Levels
Stocks Short-Term
|
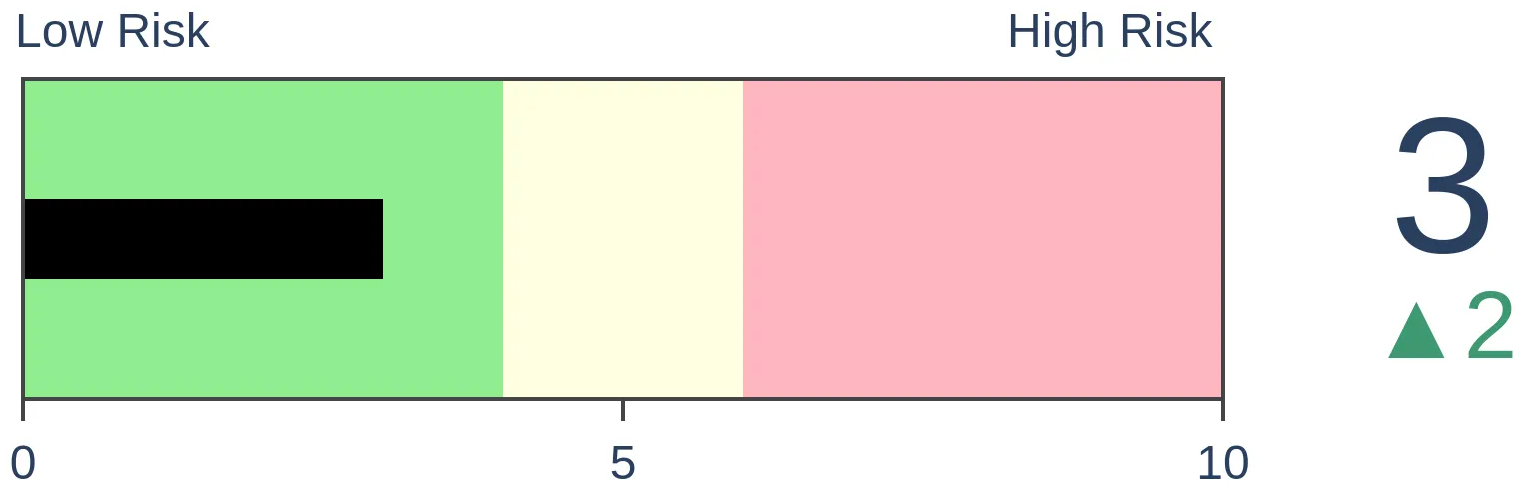
Stocks Medium-Term
|
|
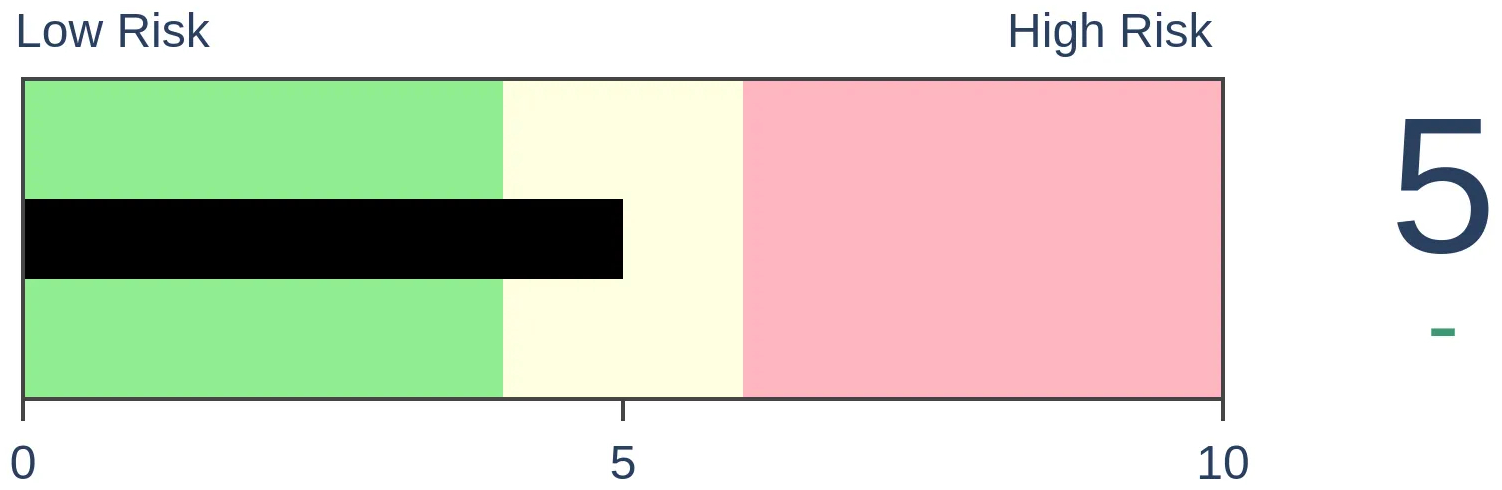
Bonds
|
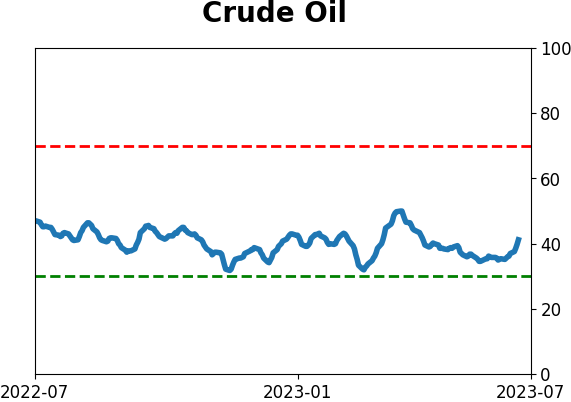
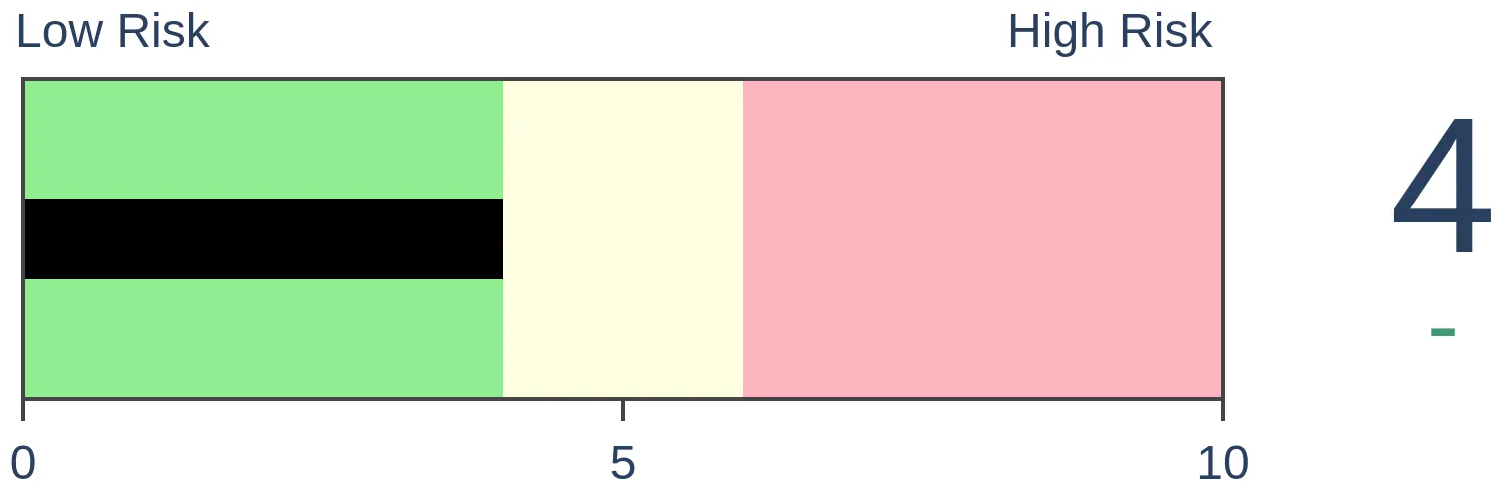
Crude Oil
|
|
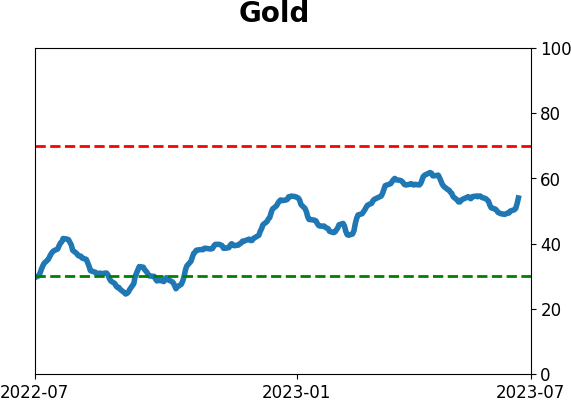
Gold

|
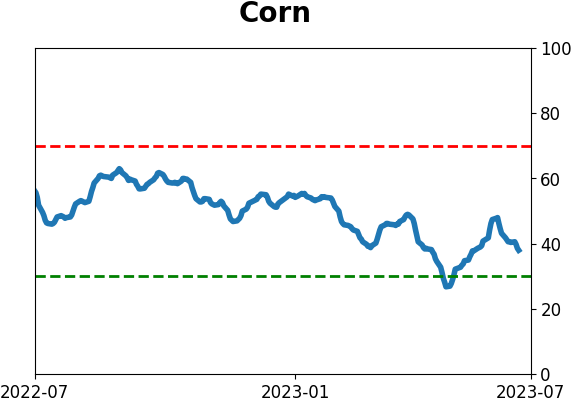
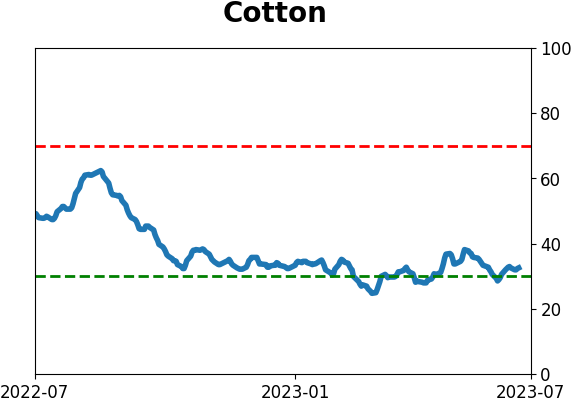
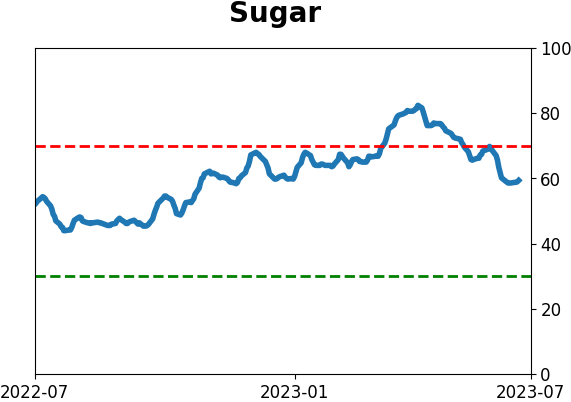
Agriculture
|
|
Research
By Jay Kaeppel
BOTTOM LINE
Gold appears to be poised for a rally back to test the recent highs. But a few factors call into question its potential to breakout and rally to new all-time highs. In this piece, we lay out the conflicting signals.
FORECAST / TIMEFRAME
None
|
Key points
- Gold has formed two distinct - and diametrically opposed - price patterns
- The yellow metal has entered a favorable time of year…
- …but another cycle may take the edge off
Gold has been consolidating
The chart below (courtesy of Barchart.com) displays two diametrically opposed chart formations for gold.
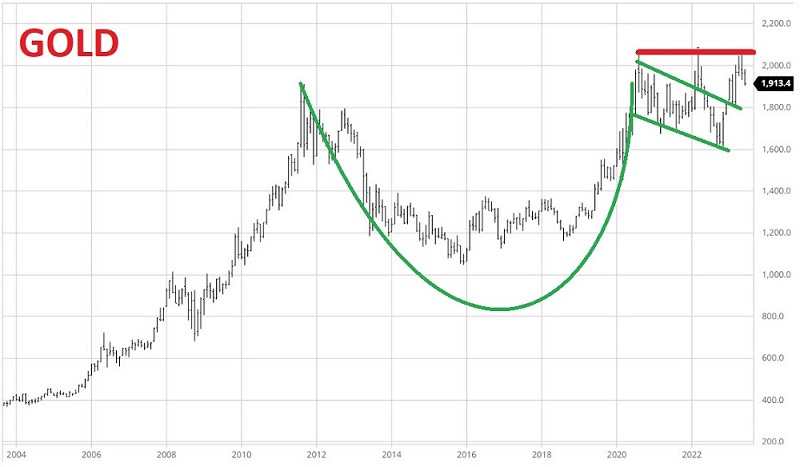
The green lines highlight a "cup-with-handle" formation, first popularized by the late William O'Neil, the founder of Investors Business Daily and the author of "How To Make Money in Stocks." The curved green line represents the "cup," and the parallel downsloping green lines represent the "handle." According to theory, when the price finally breaks out above the high price experienced during the formation of this pattern, it should mark the beginning of a significant upside breakout. This has not yet happened with gold.
Instead, it tried to break out in 2022 and again in May 2023 and was both times rejected near the $2,070 to $2,100 an ounce level. In so doing, it has gold forming what some would argue is a "triple top" (the red horizontal line in the chart above). This pattern is typically thought to suggest lower prices.
So which pattern will win? We can't predict. To complicate matters more, there are two seasonal factors at play.
Gold has entered a period of annual seasonal strength
The chart below displays the annual seasonal trend for gold futures.
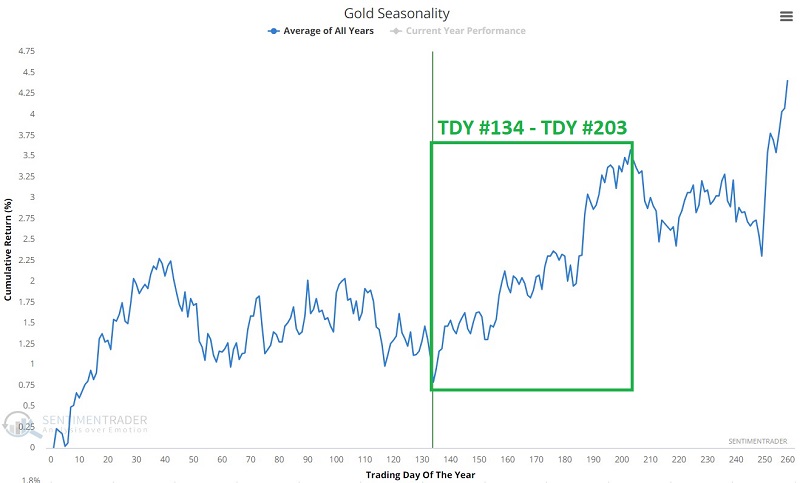
The green box highlights the period that extends from the close on Trading Day of Year #134 through TDY #203. For 2023 this period extends from the close on 2023-07-10 through the close on 2023-10-13.
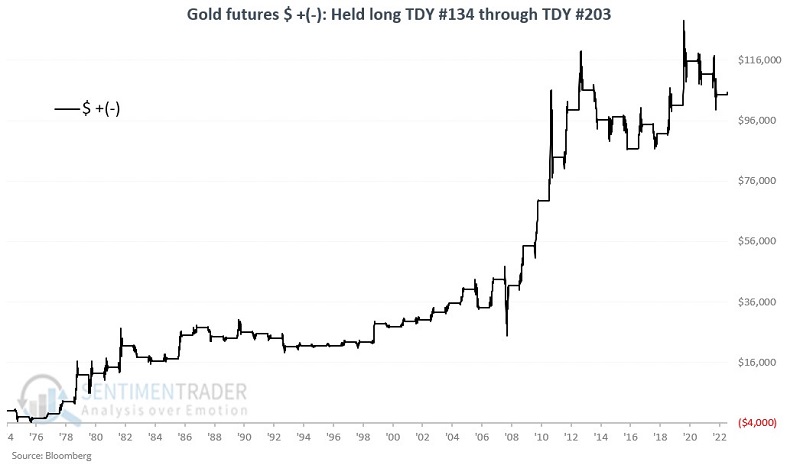
The chart below displays the hypothetical cumulative $ +(-) from holding a long position in gold futures only during this favorable period every year since 1975.
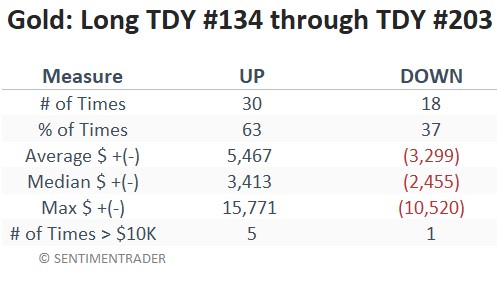
The table below summarizes gold futures' performance during this favorable period for all years since 1976.
One potential fly in the ointment
Gold has historically operated on something of an 8-year cycle. Starting with 1977, it has generally been favorable for four years and then unfavorable for four years. We are currently in an unfavorable four-year period through the end of 2024.
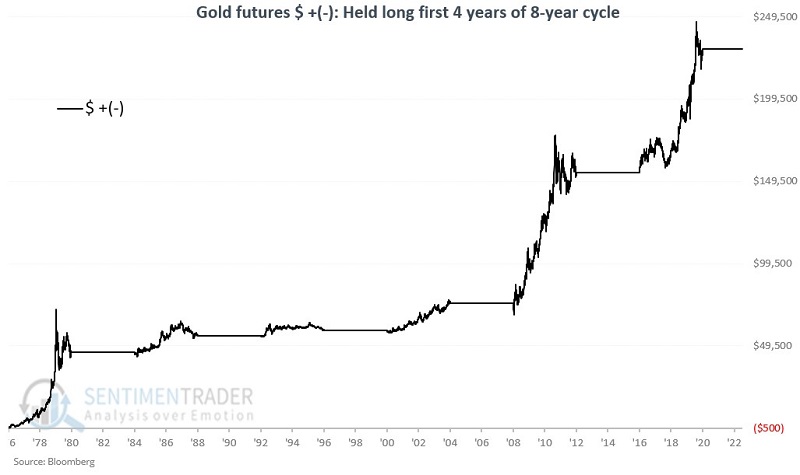
To illustrate, the chart below displays the cumulative $ +(-) for gold futures held long only during the "favorable four-year periods" (1977-1980, 1985-1988, 1993-1996, etc.).
The chart below displays the cumulative $ +(-) for gold futures held long only during the unfavorable four-year periods (1981-1984, 1989-1992, 1997-2000, etc.).
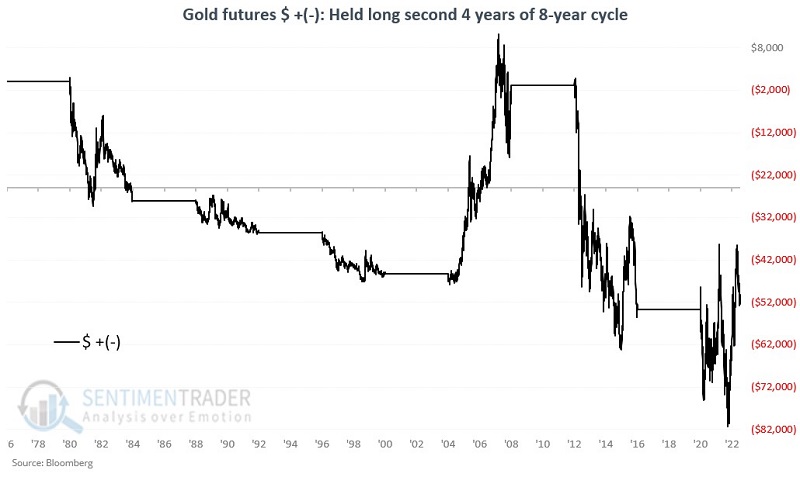
Starting in 1977, gold has:
- Gained $230,006 during favorable four-year periods
- Lost (-$50,233) during the unfavorable four-year periods
The four-year cycle meets annual seasonality
The following four-year periods are deemed "favorable":
1977-1980
1985-1988
1993-1996
2001-2004
2009-2012
2017-2020
2025-2028
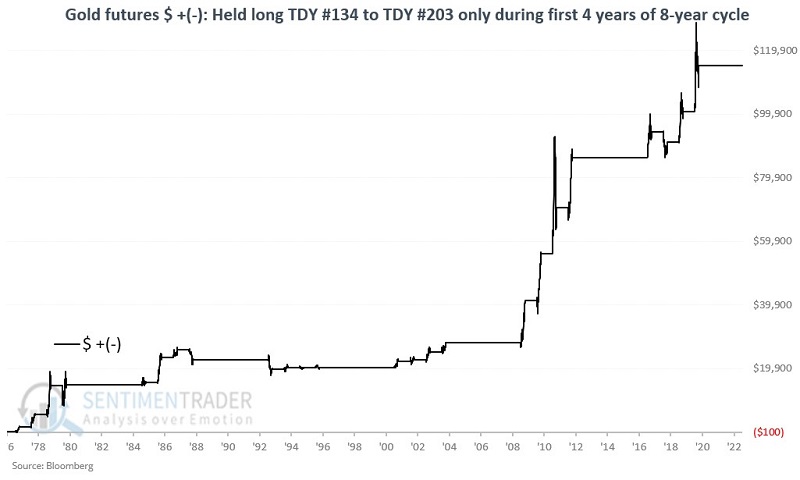
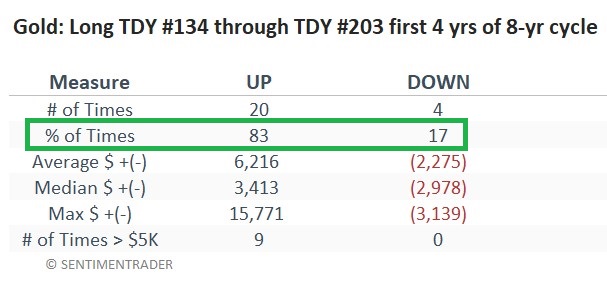
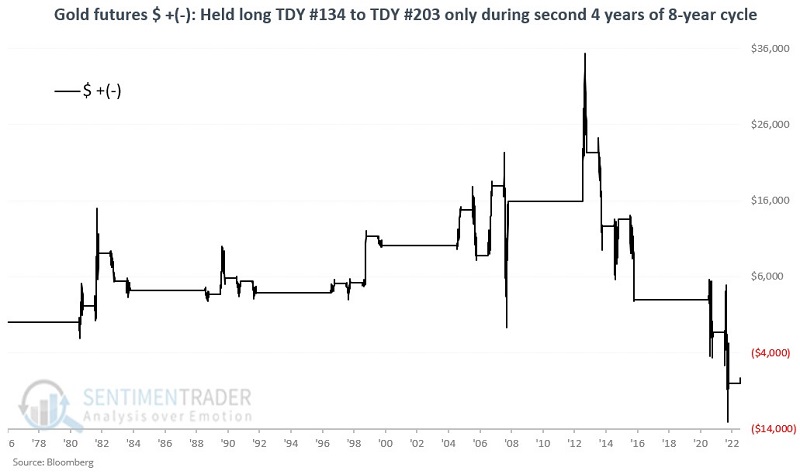
Now let's look at the annual TDY #134 through TDY #203 periods only during these favorable four-year periods. The chart displays the cumulative $ +(-) for gold futures, and the table summarizes gold performance.
The following four-year periods are deemed "unfavorable":
1981-1984
1989-1992
1997-2000
2005-2008
2013-2016
2021-2024
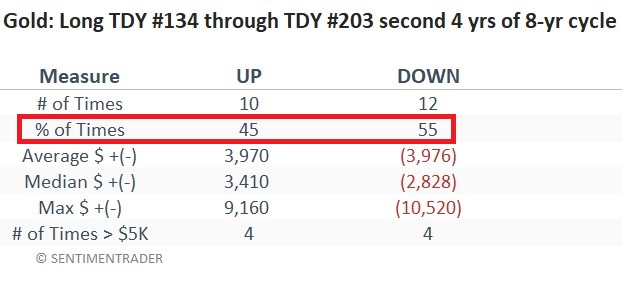
Now let's look at the annual TDY #134 through TDY #203 periods only during these unfavorable four-year periods. The chart displays the cumulative $ +(-) for gold futures, and the table summarizes gold performance.
What the research tells us…
If one looks at a gold price chart and then adds in both the four-year cycle and the current favorable portion of the annual seasonal trend, one can see pretty much whatever they want to see. One trader may see a market with a long-term cup-with-handle formation combined with a favorable annual seasonal trend period and consider playing for the long-awaited upside breakout and run to higher new all-time highs. Based on the four-year cycle, another trader may see a market with significant upside resistance and only so-so prospects.
In the end, each trader must decide a) whether to play the long side of gold, b) which vehicle to trade (gold futures, ETF ticker GLD, options on GLD, etc.), c) how much capital to allocate, and d) how much capital to risk.
Indicators at Extremes
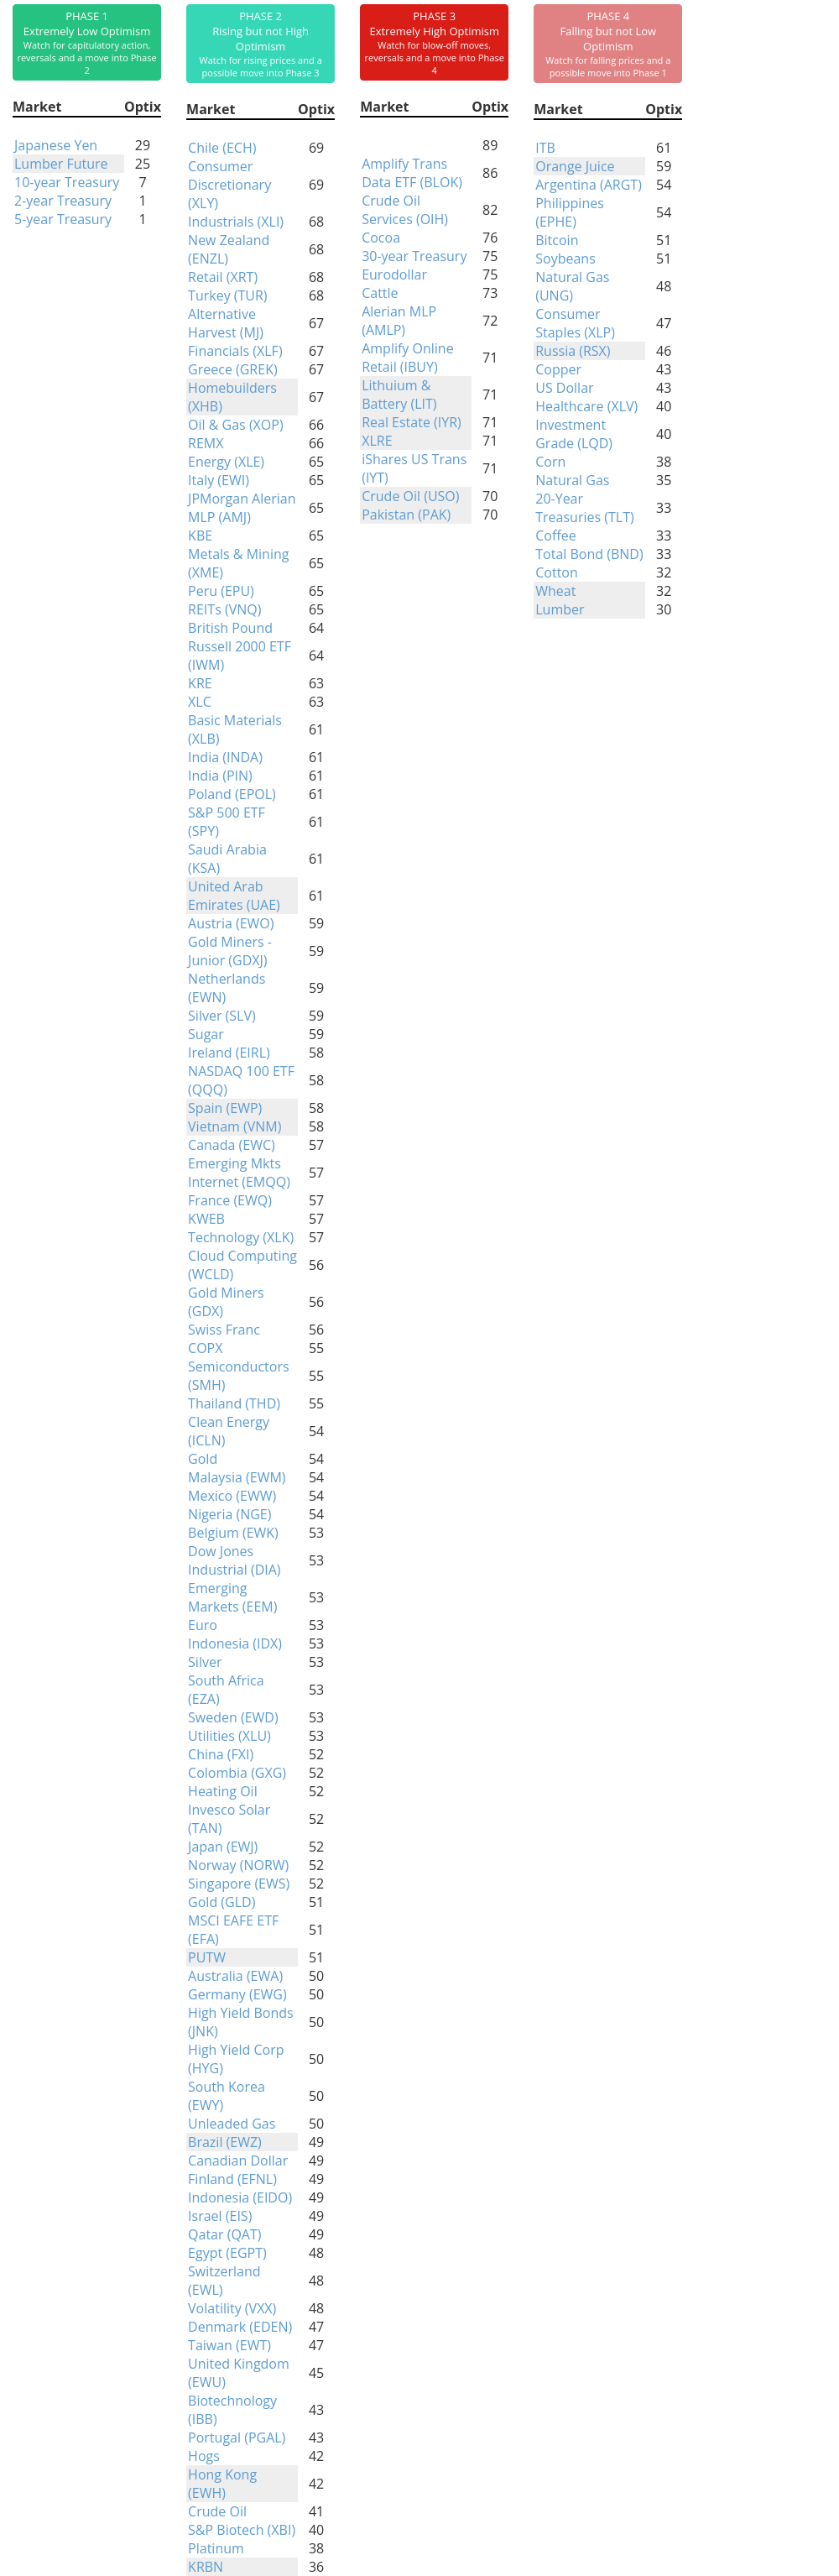
Phase Table
Ranks
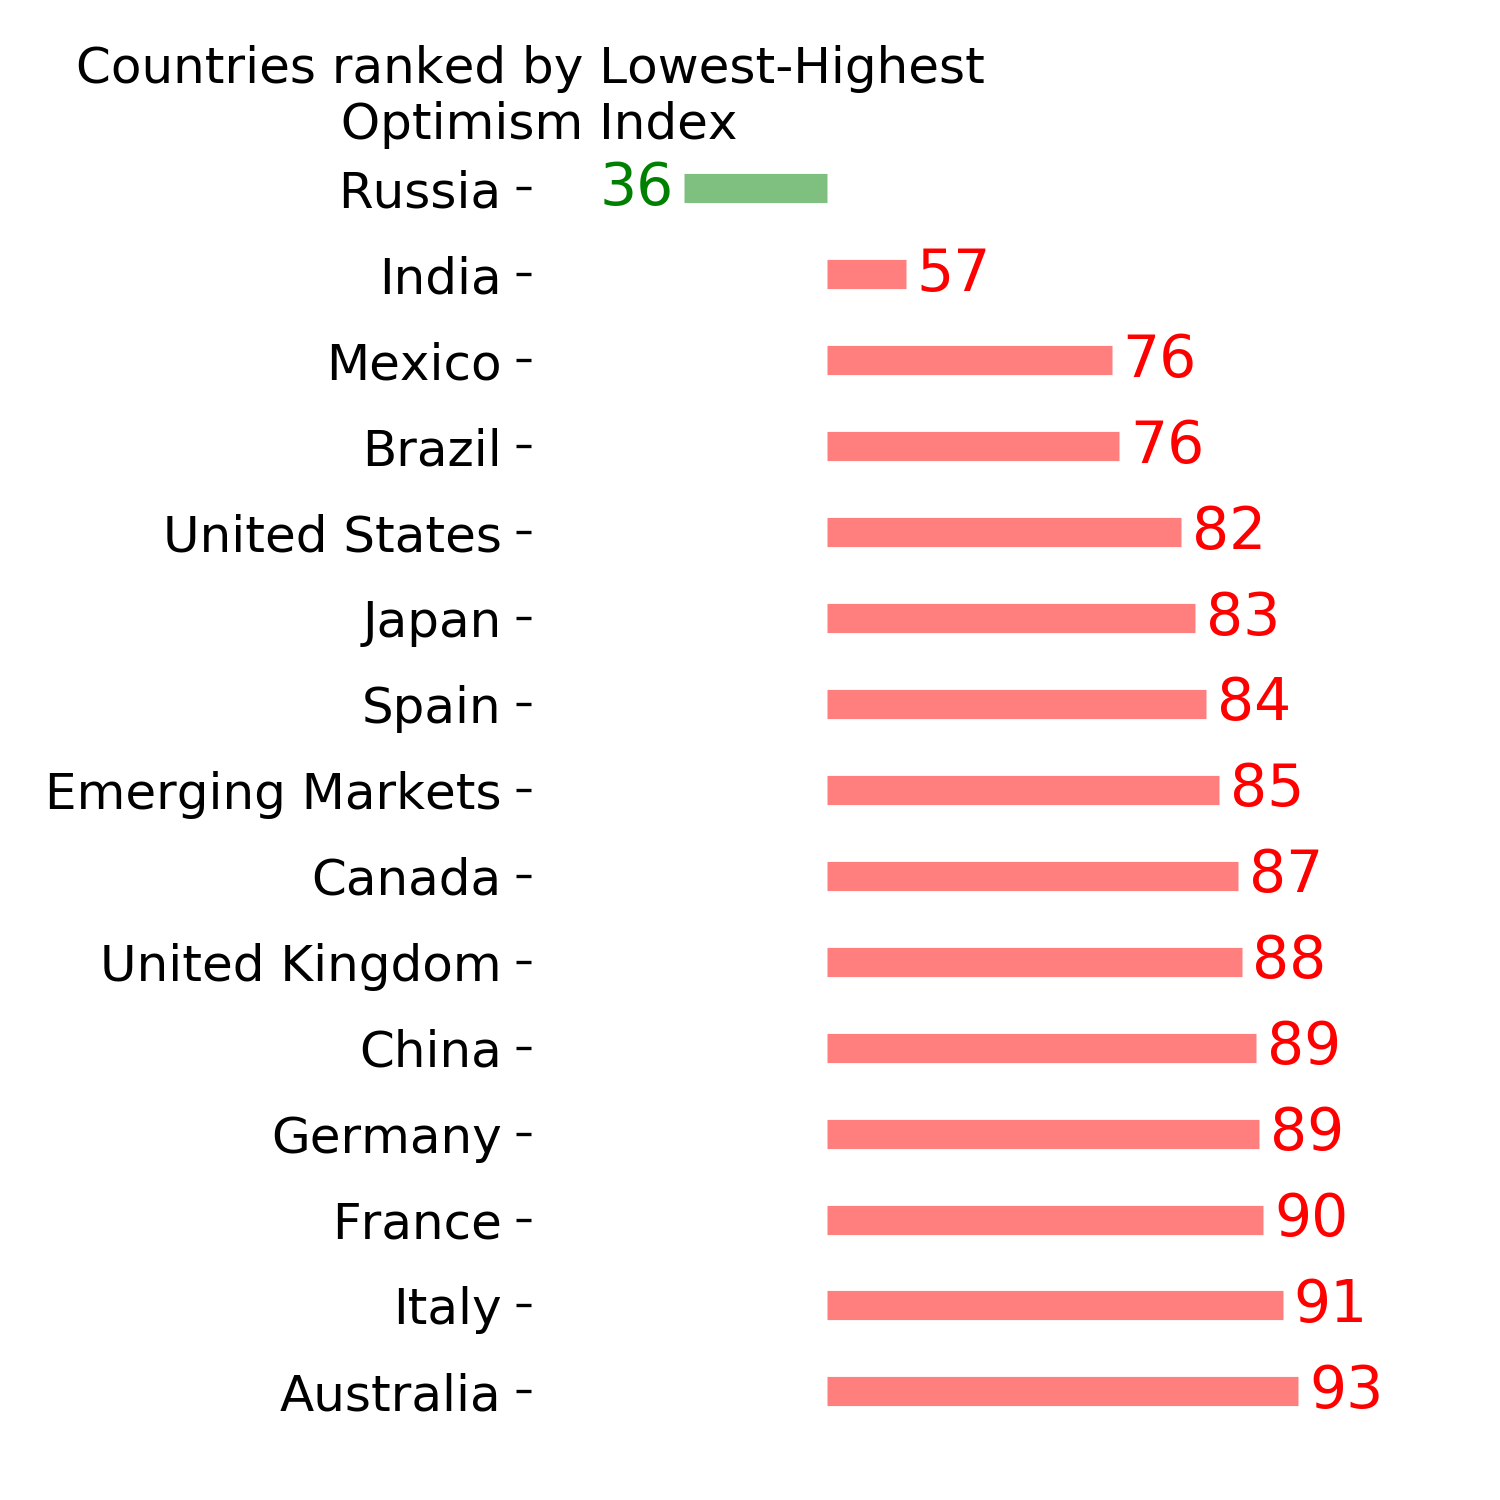
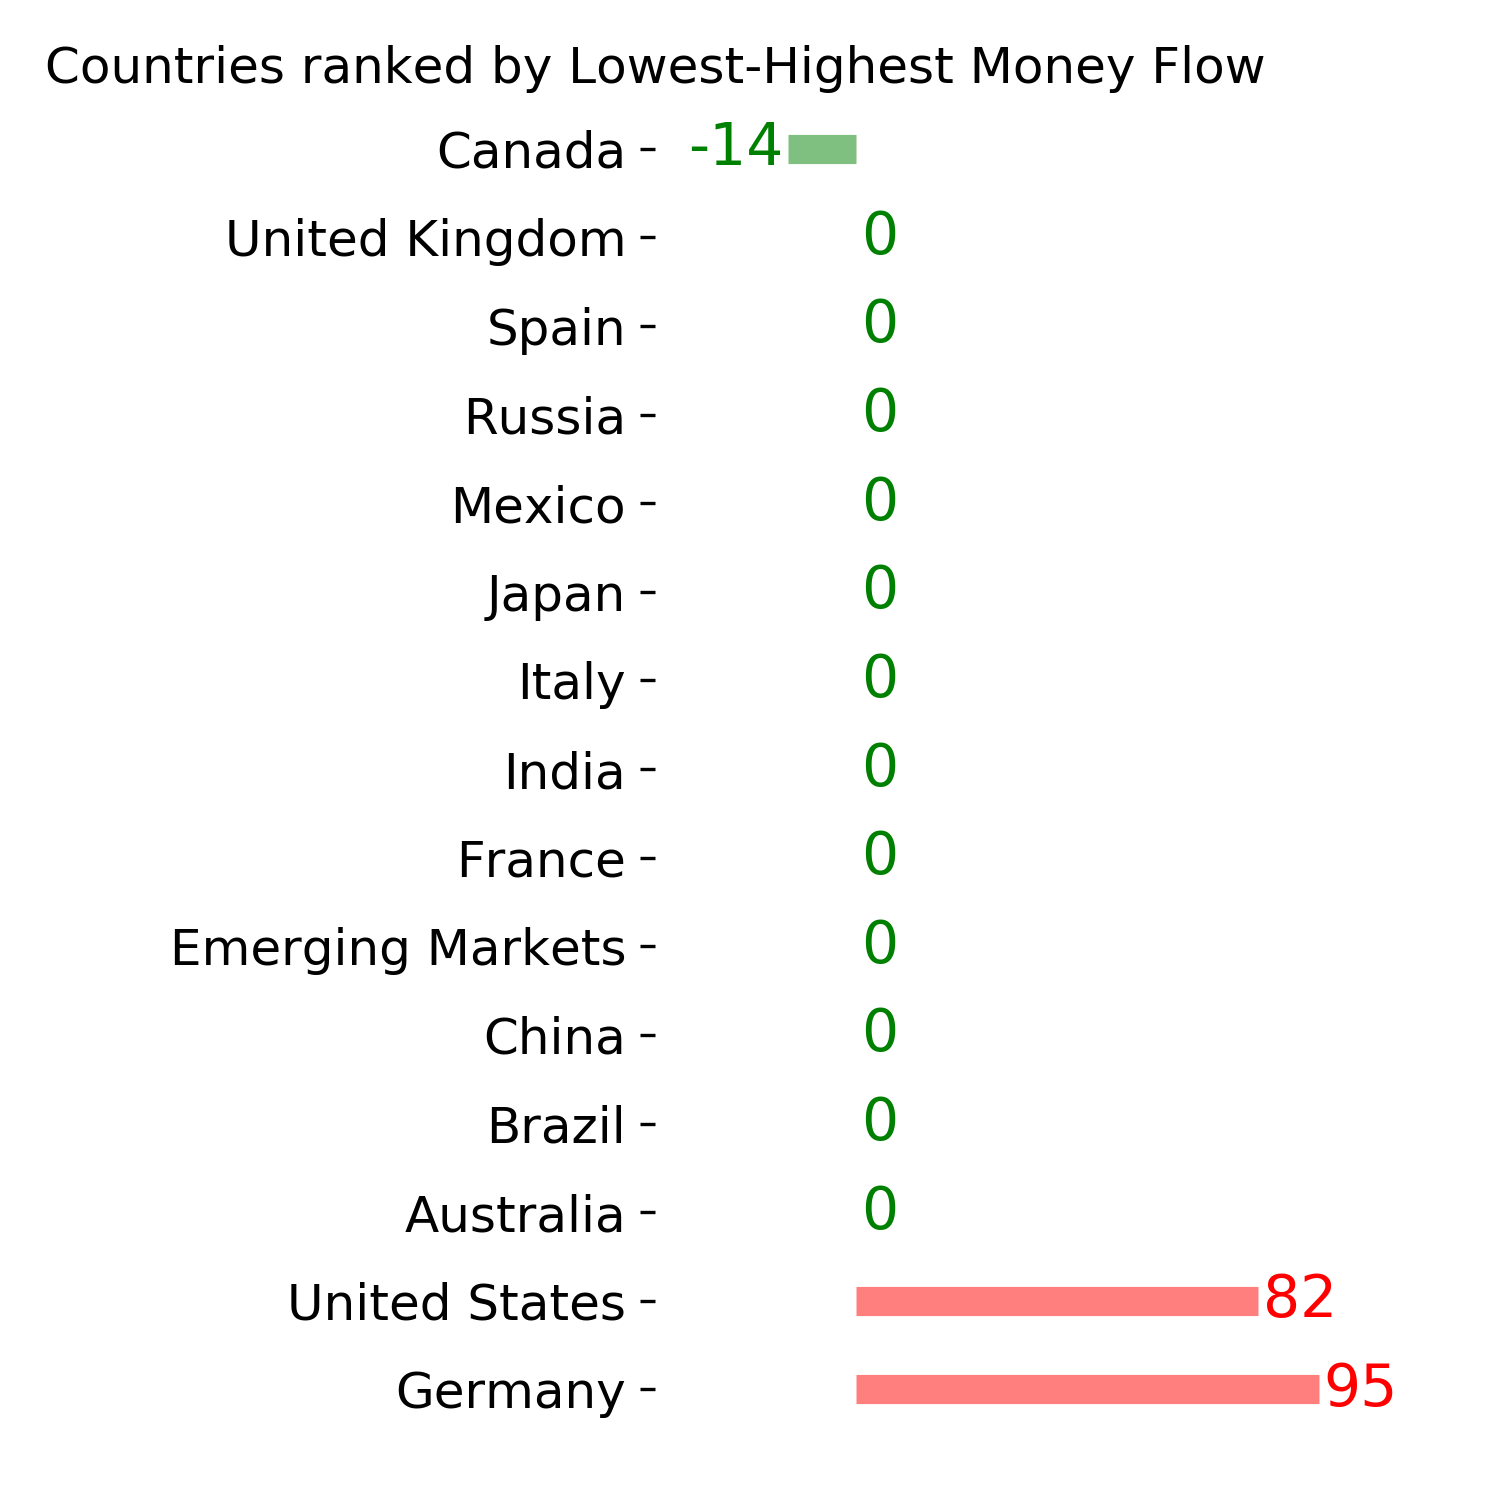
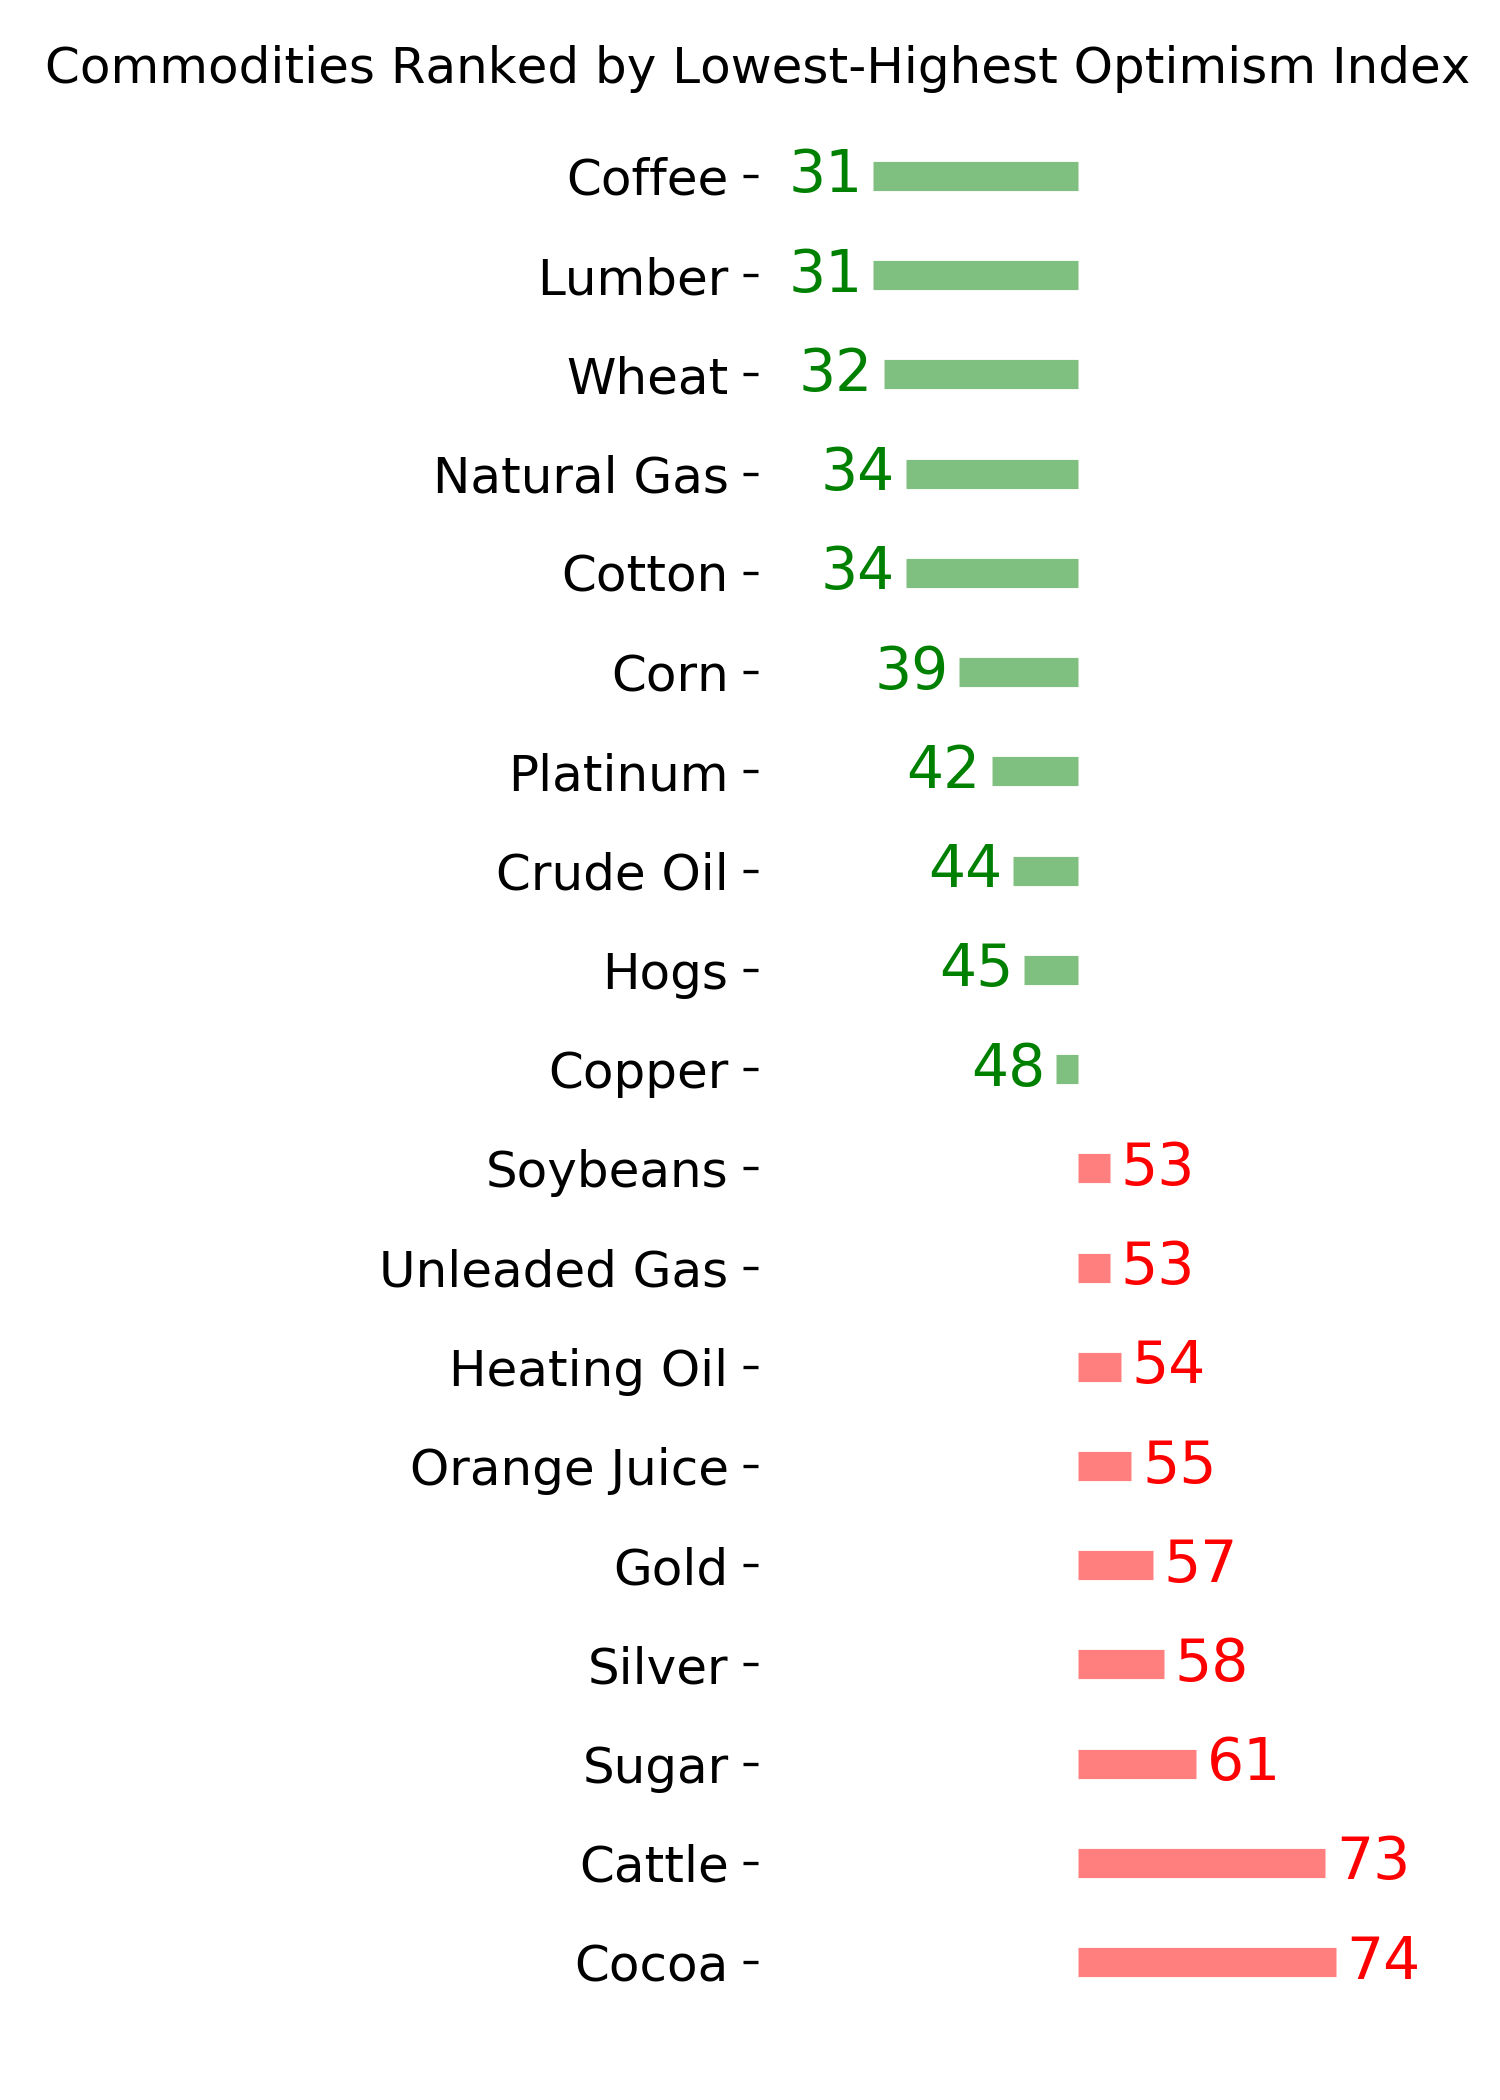
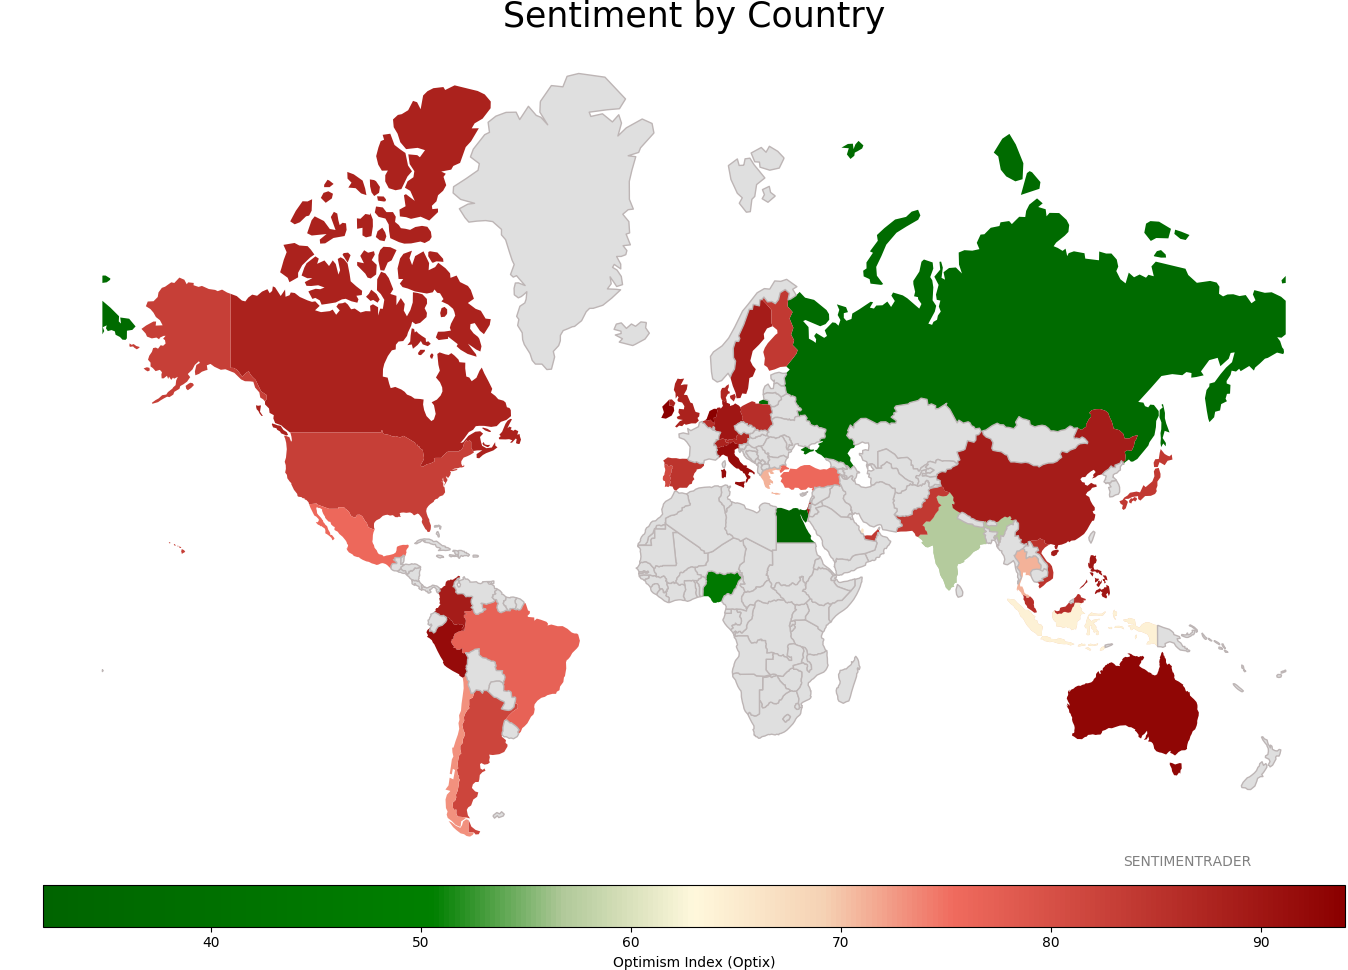
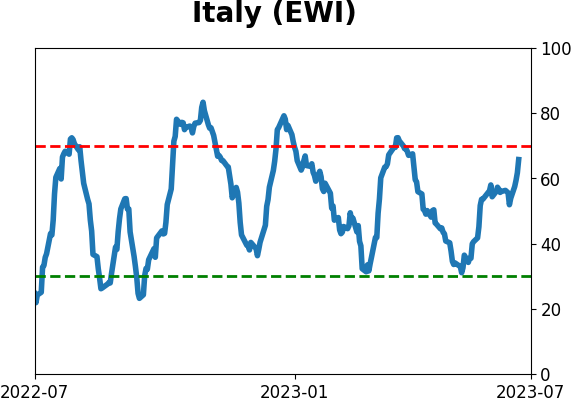
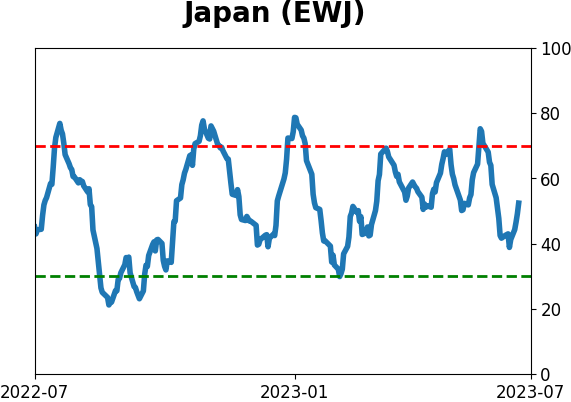
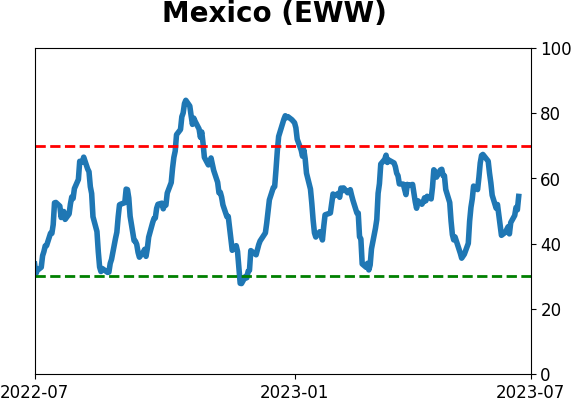
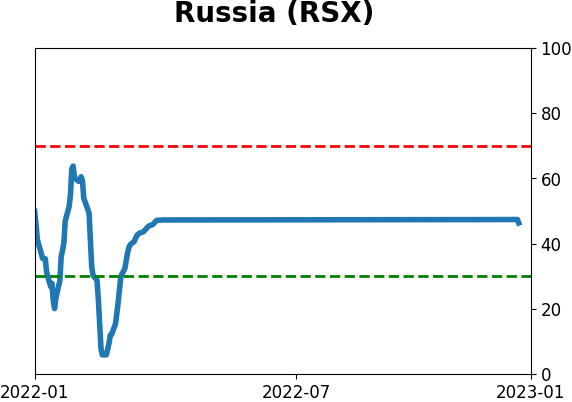
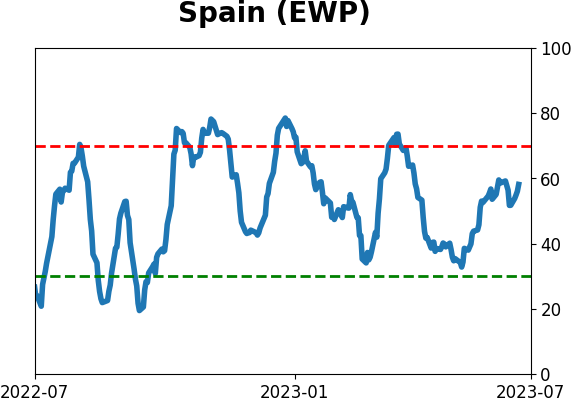
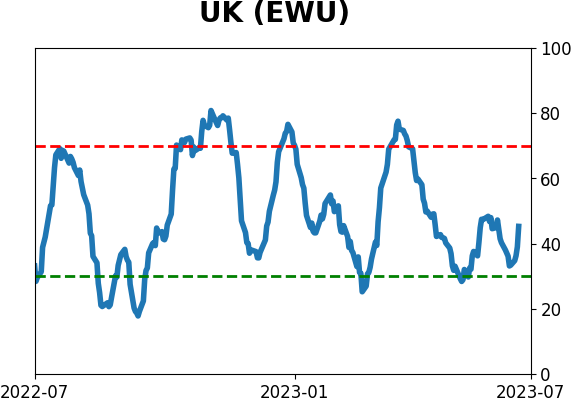
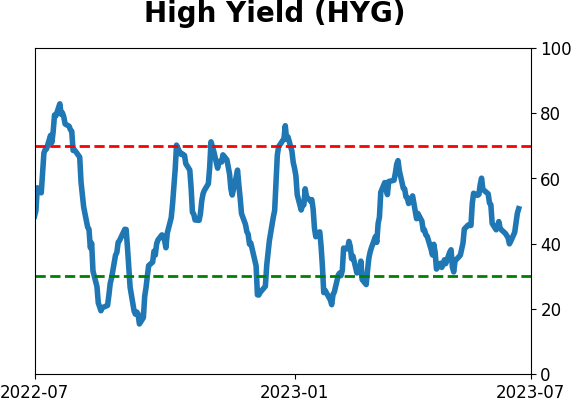
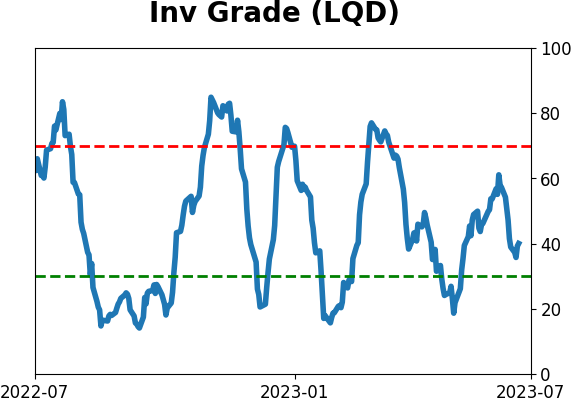
Sentiment Around The World
Optimism Index Thumbnails
|
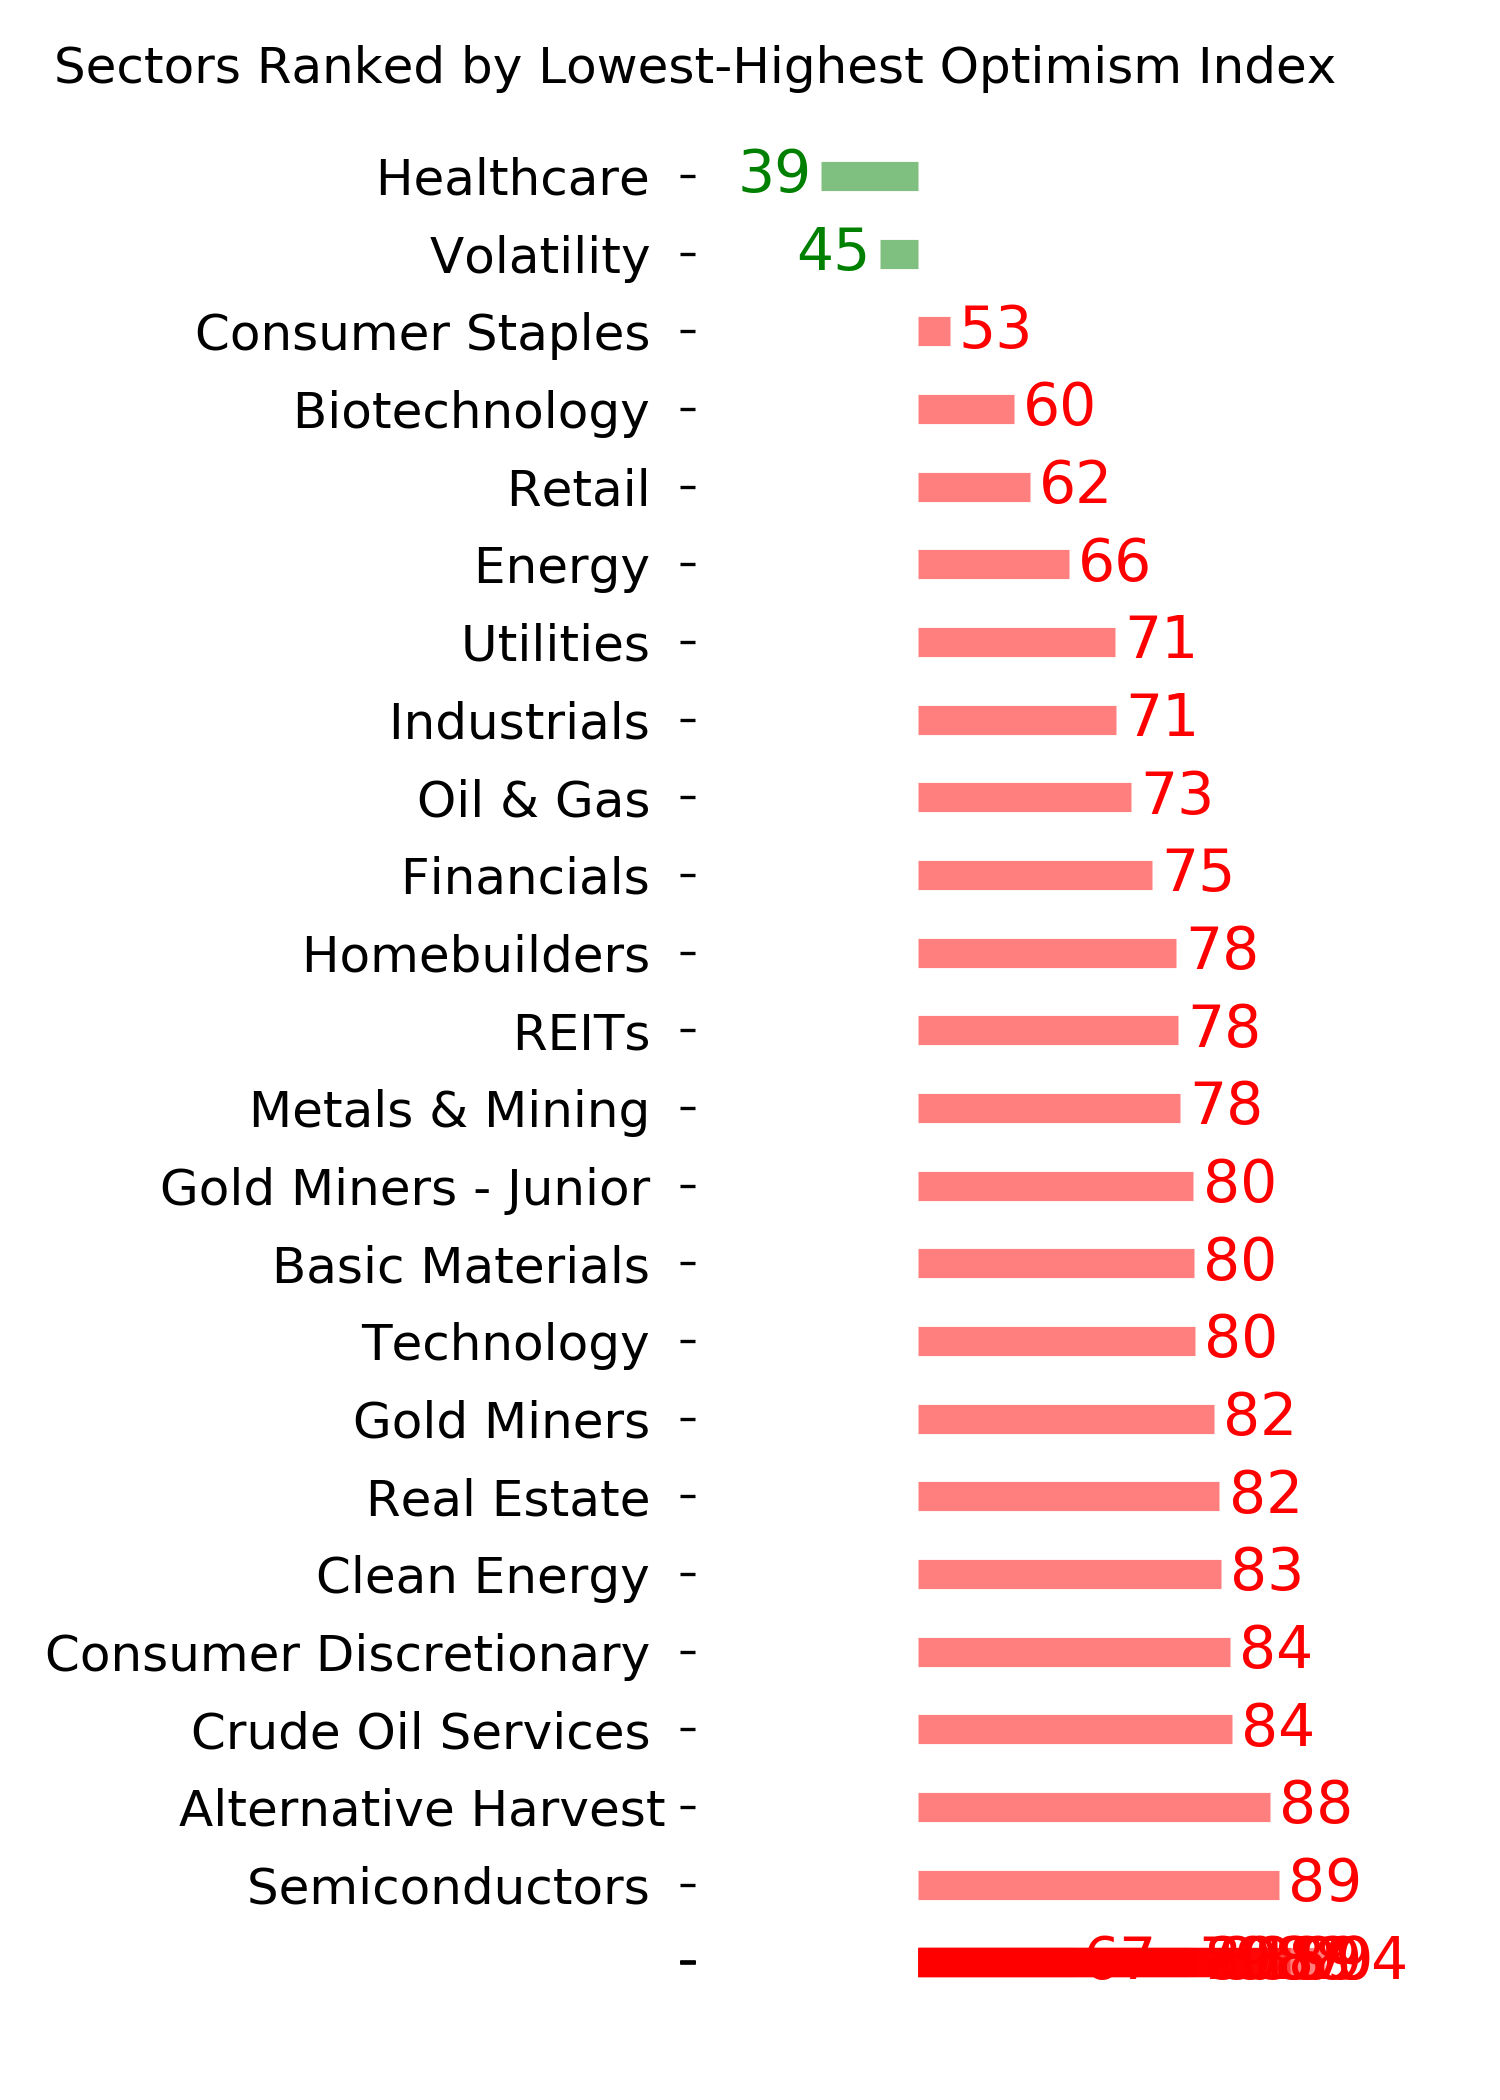
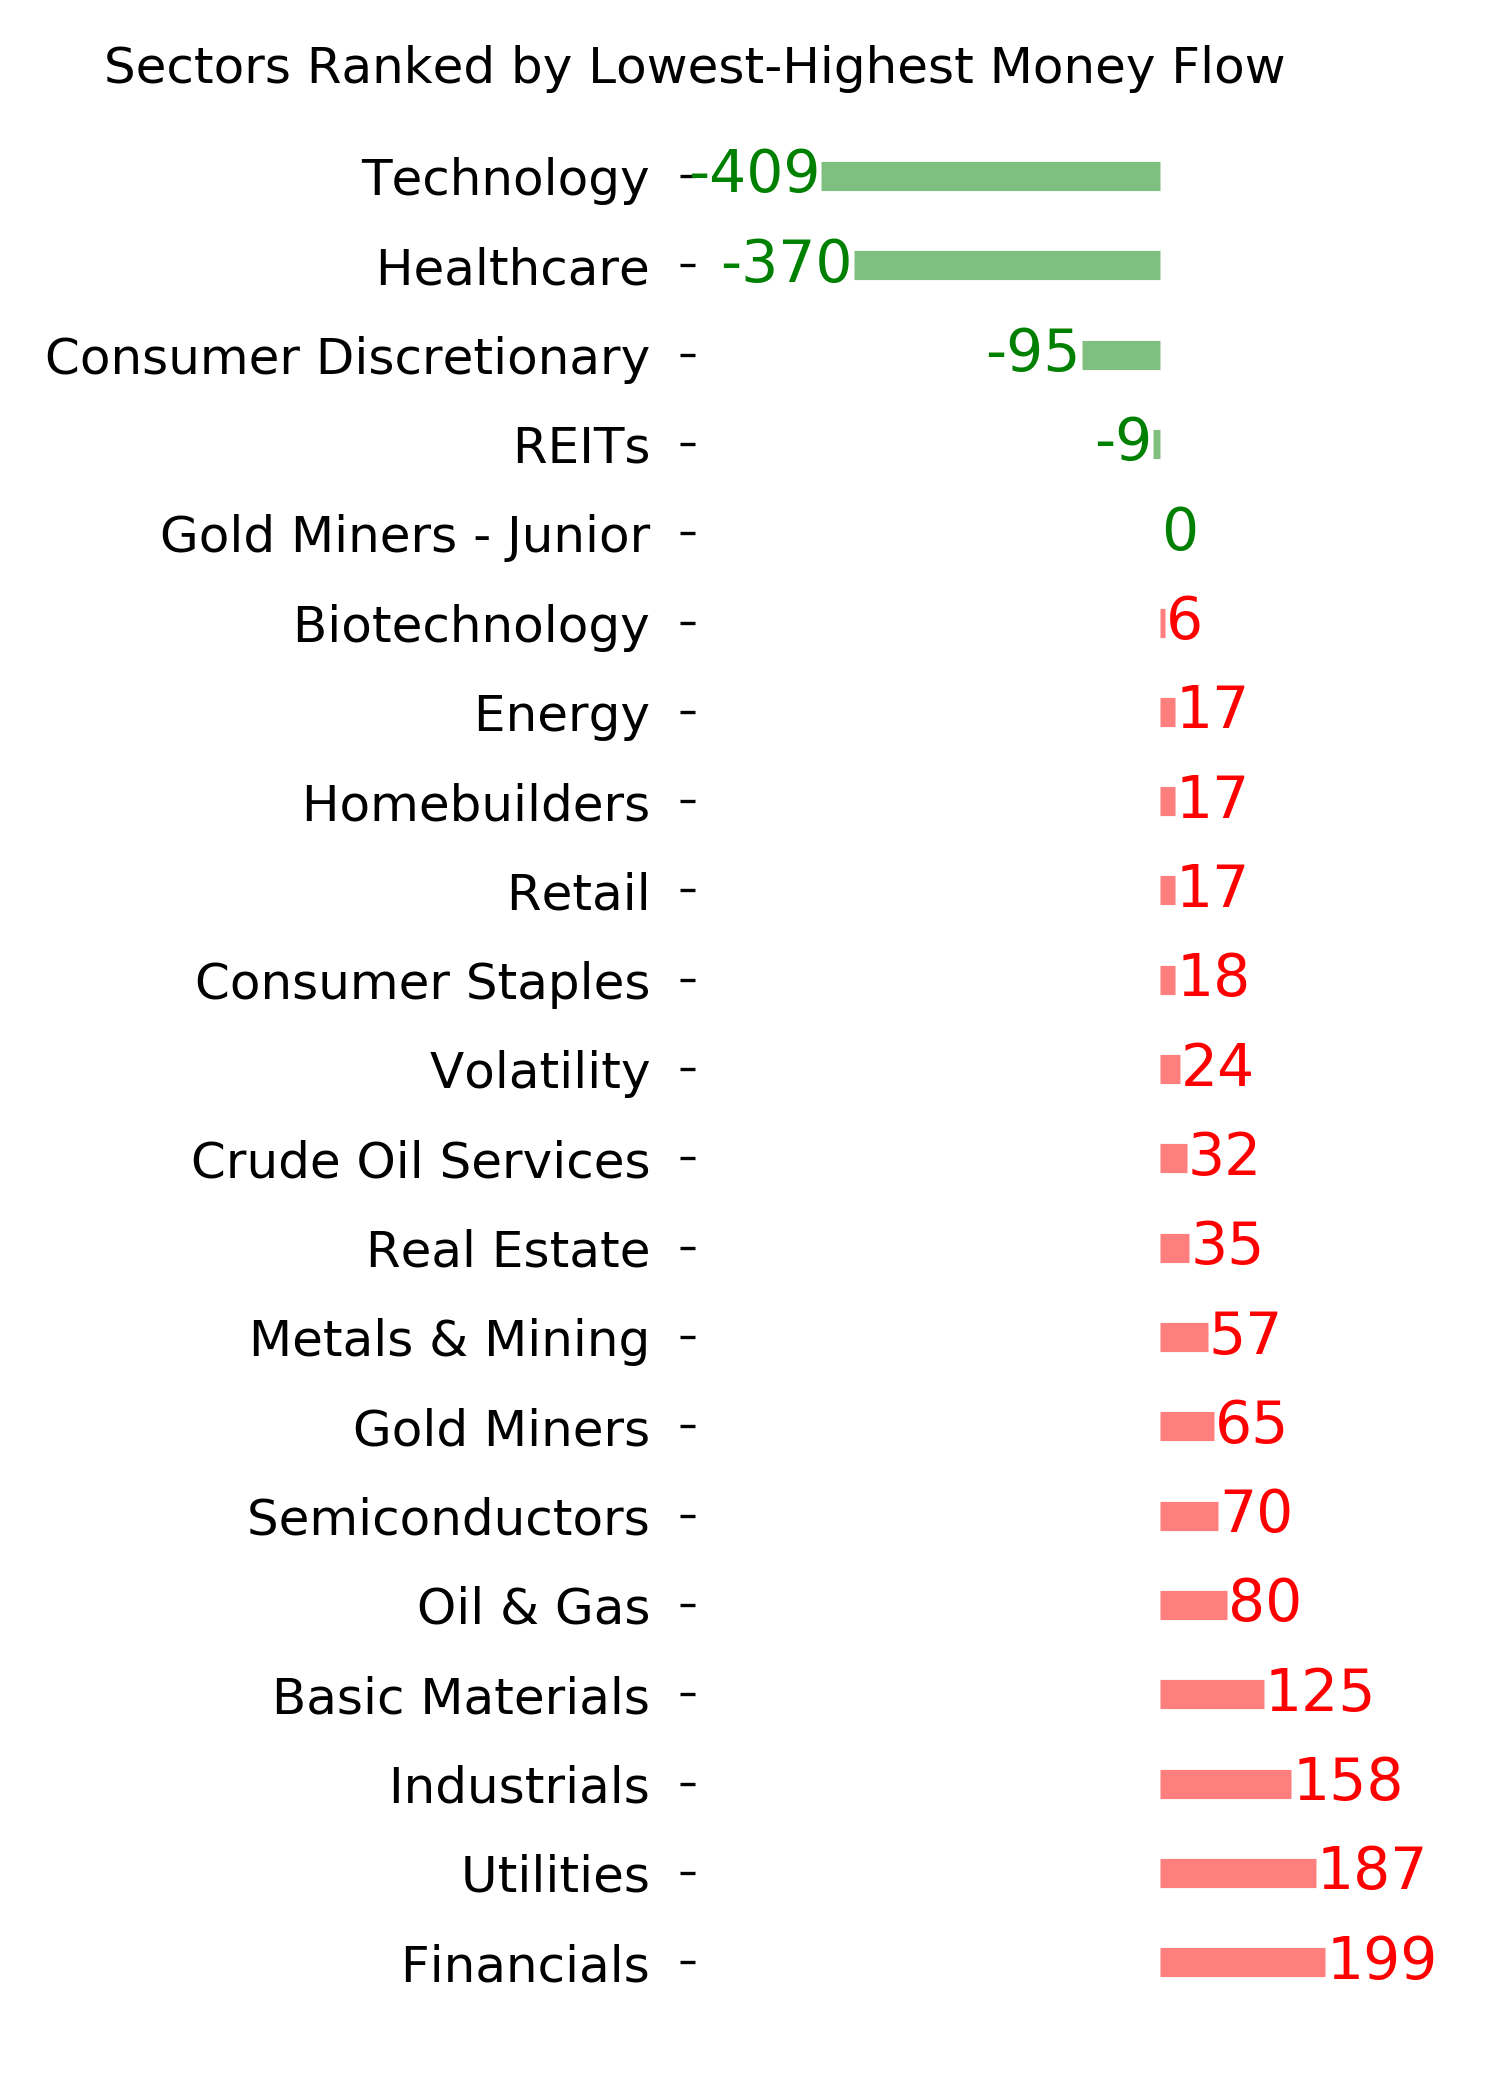
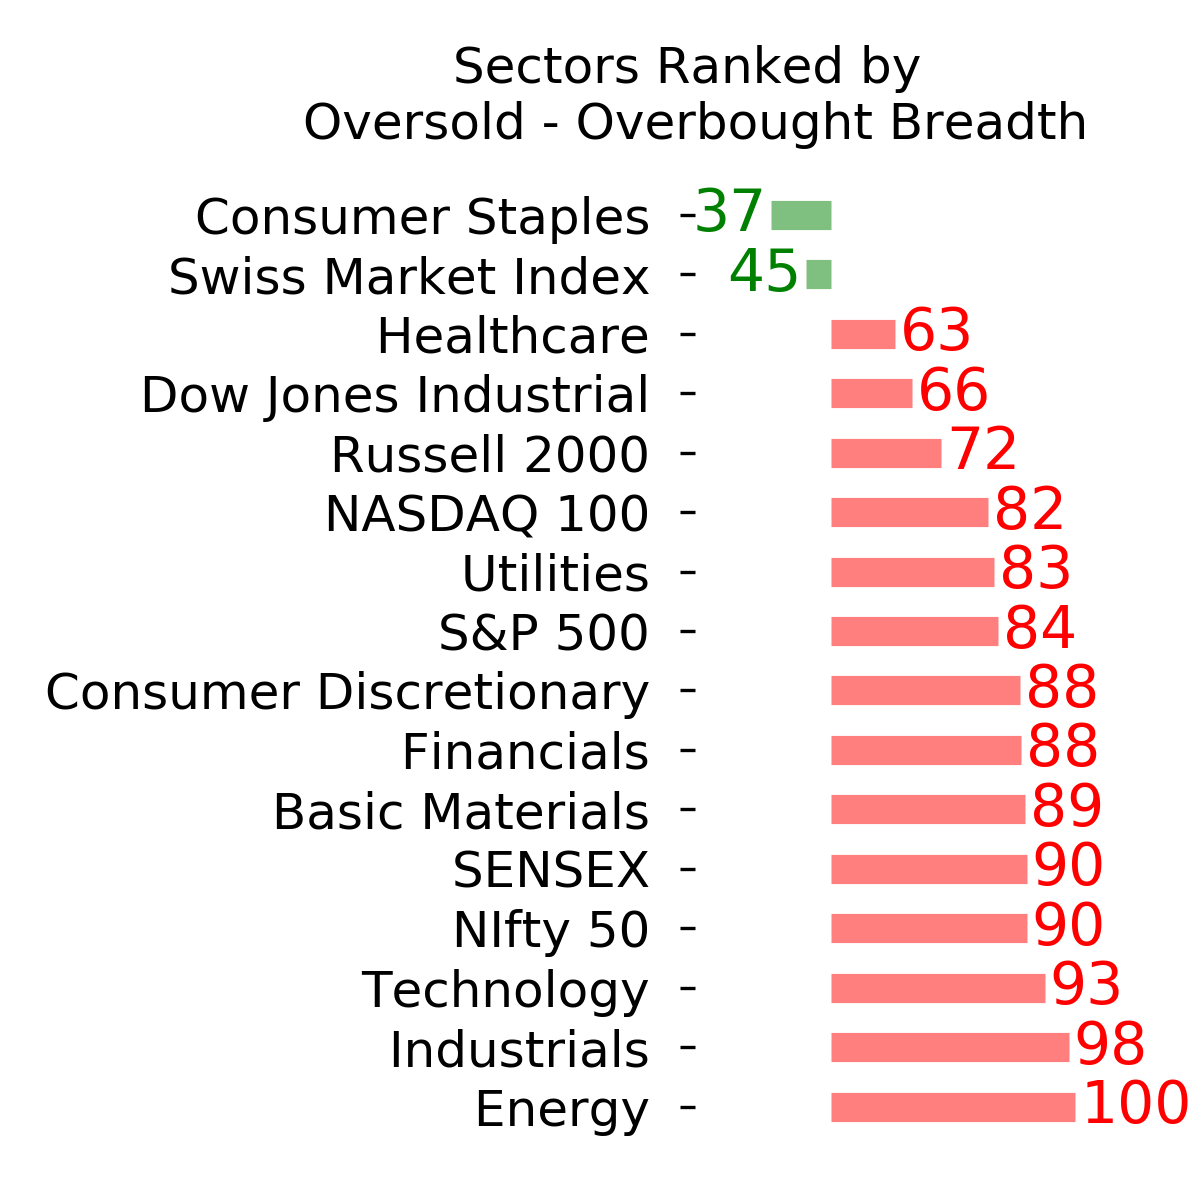
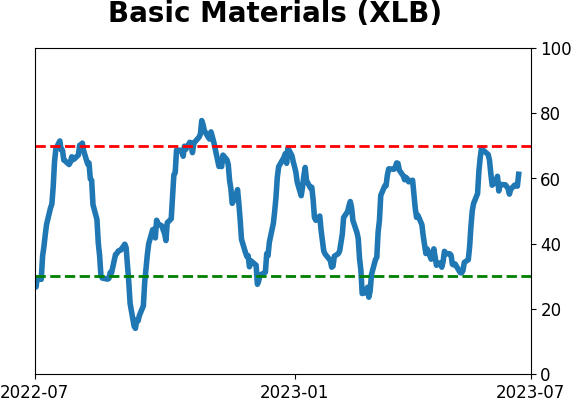
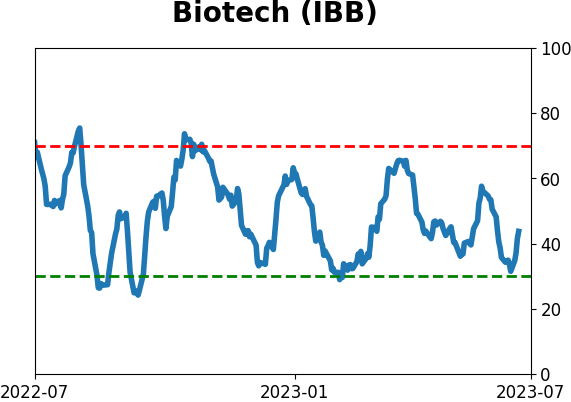
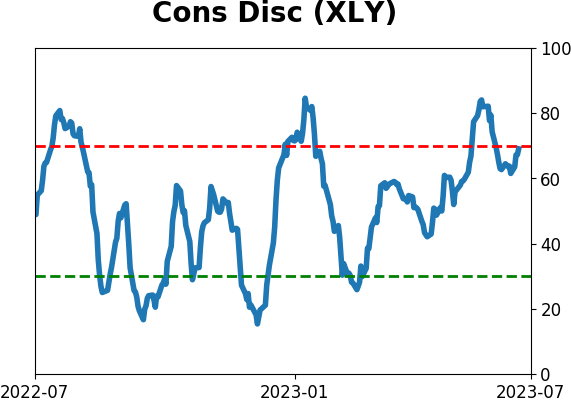
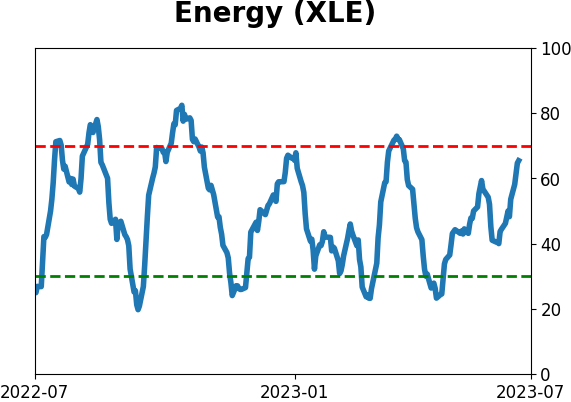
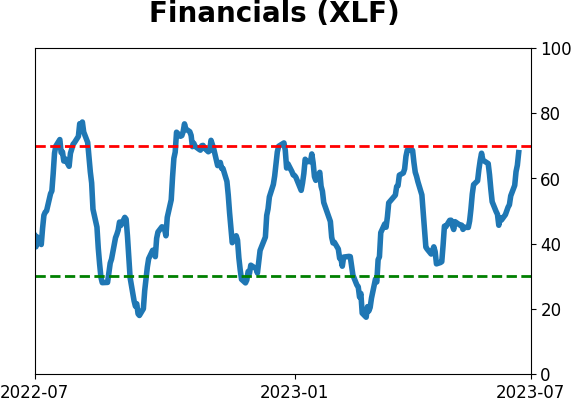
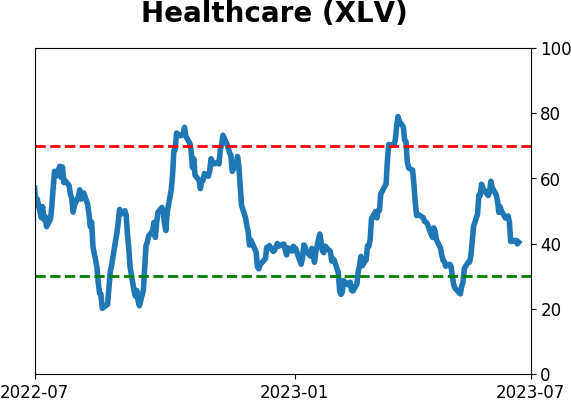
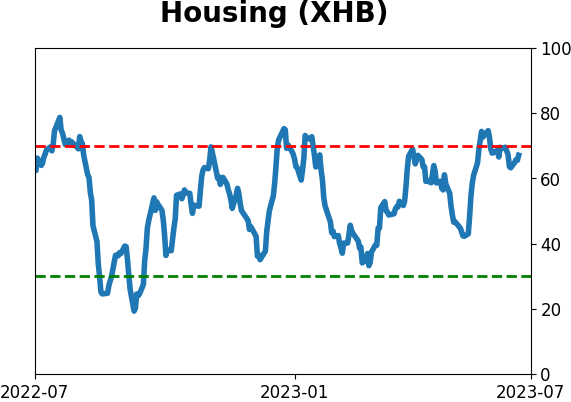
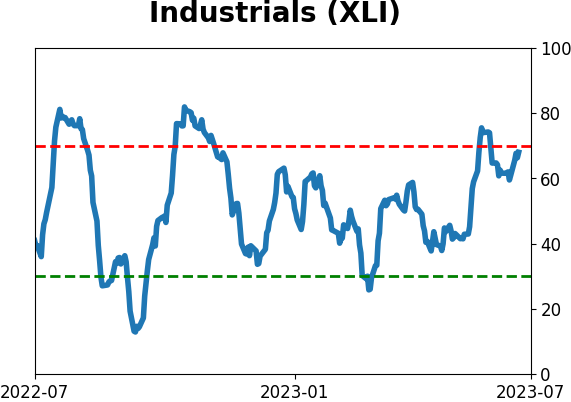
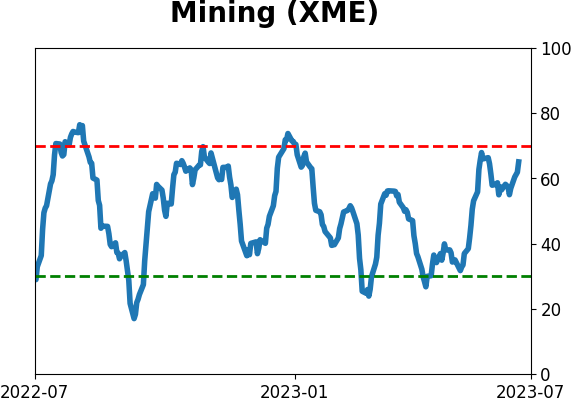
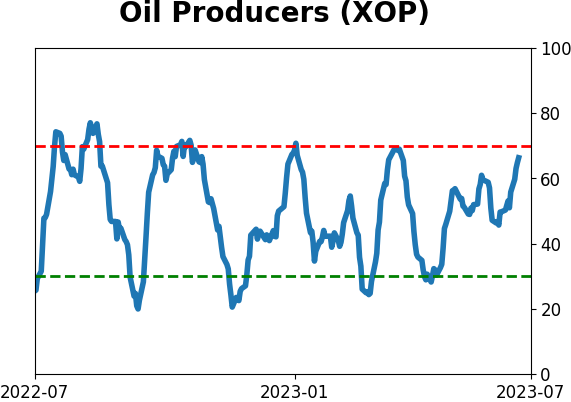
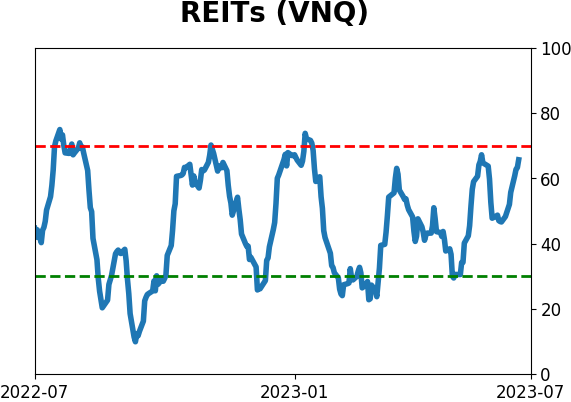
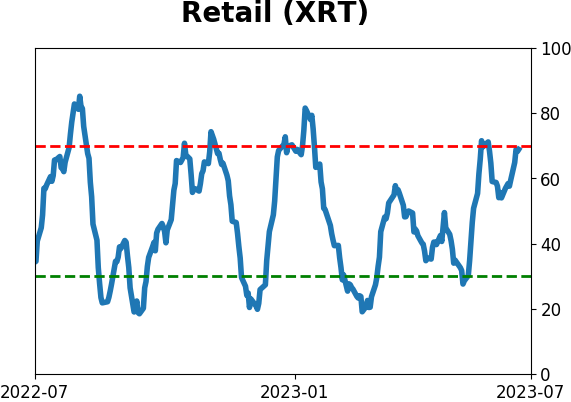
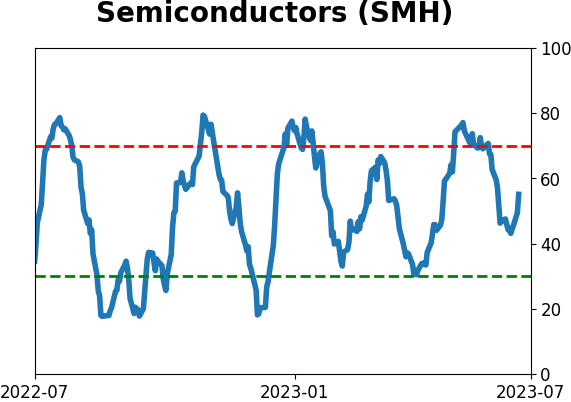
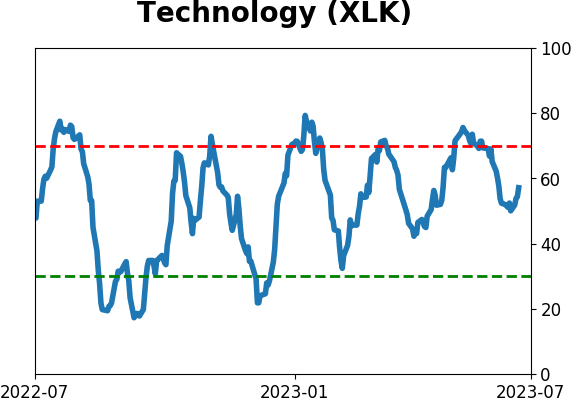
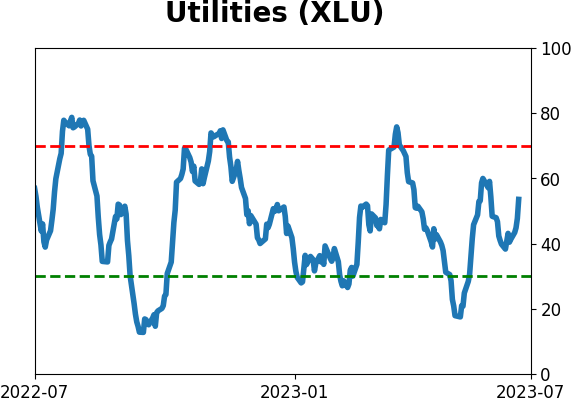
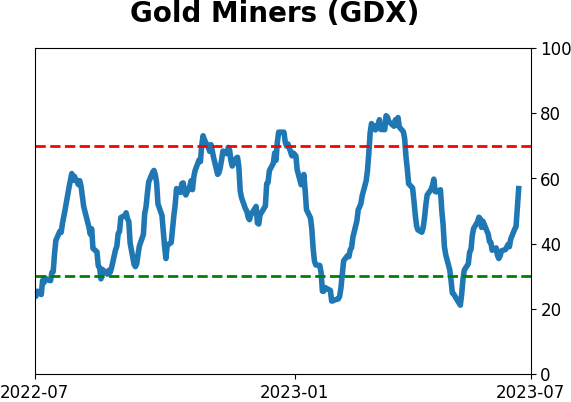
Sector ETF's - 10-Day Moving Average
|
|
|
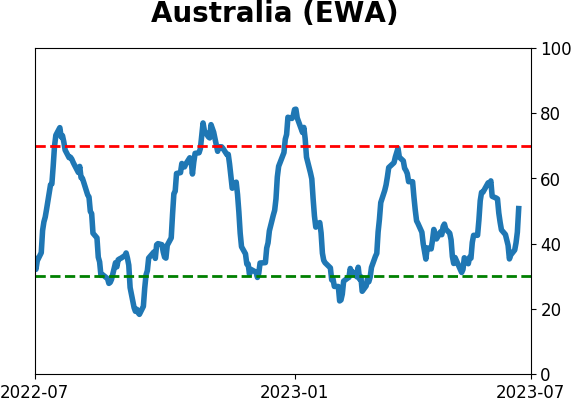
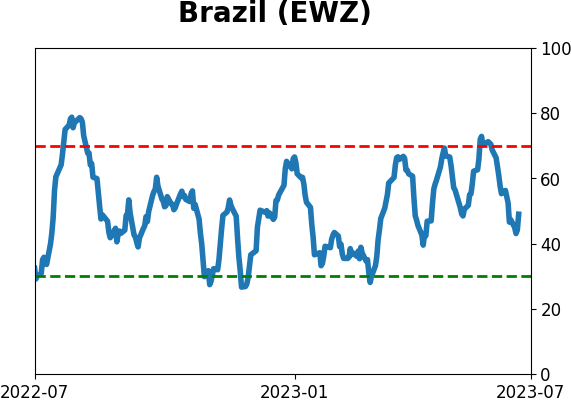
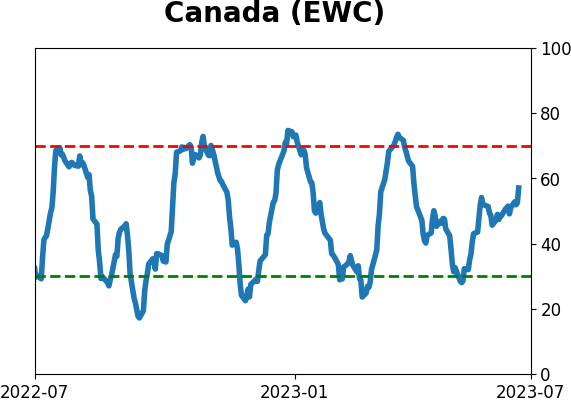
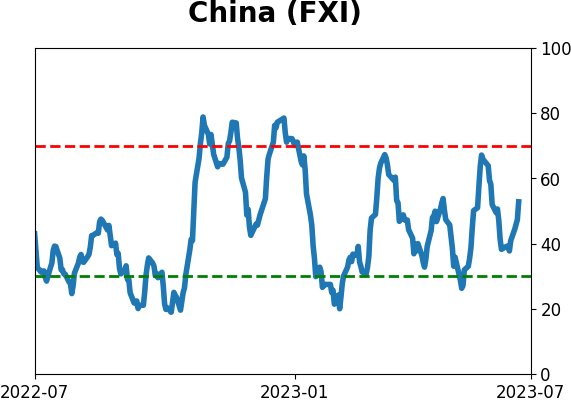
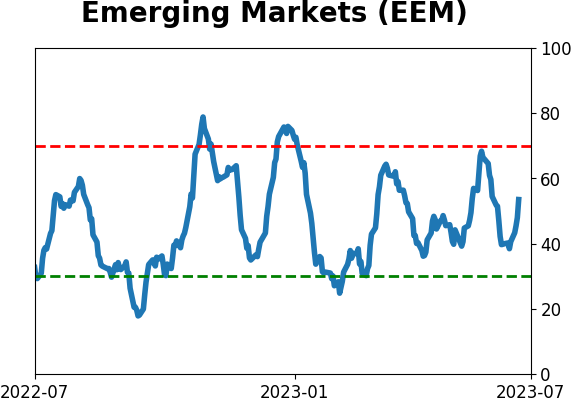
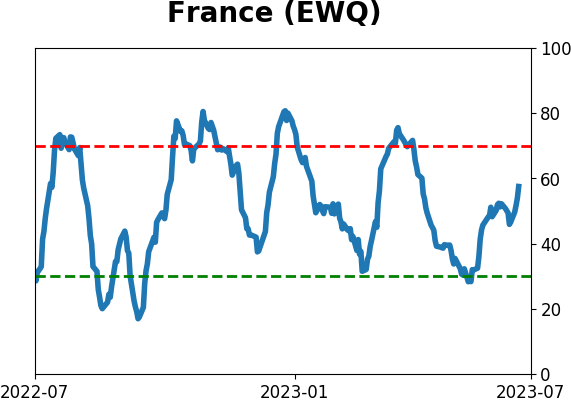
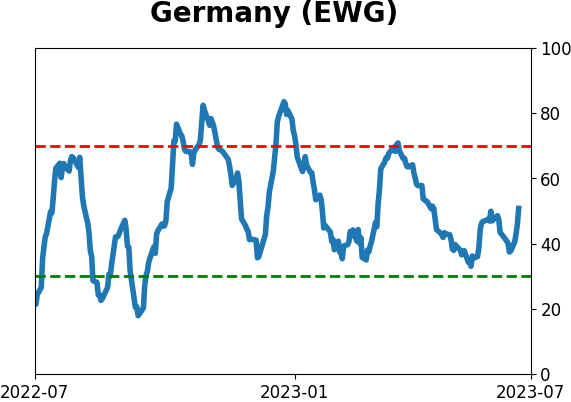
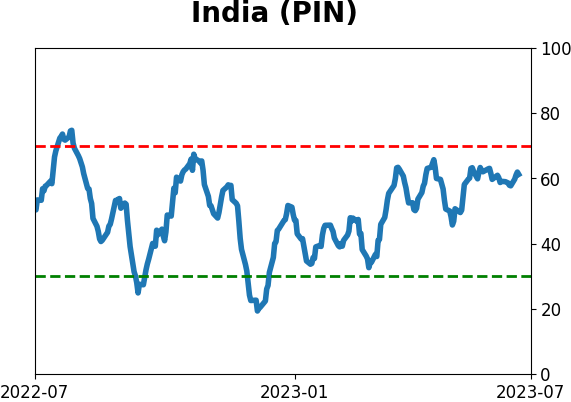
Country ETF's - 10-Day Moving Average
|
|
|
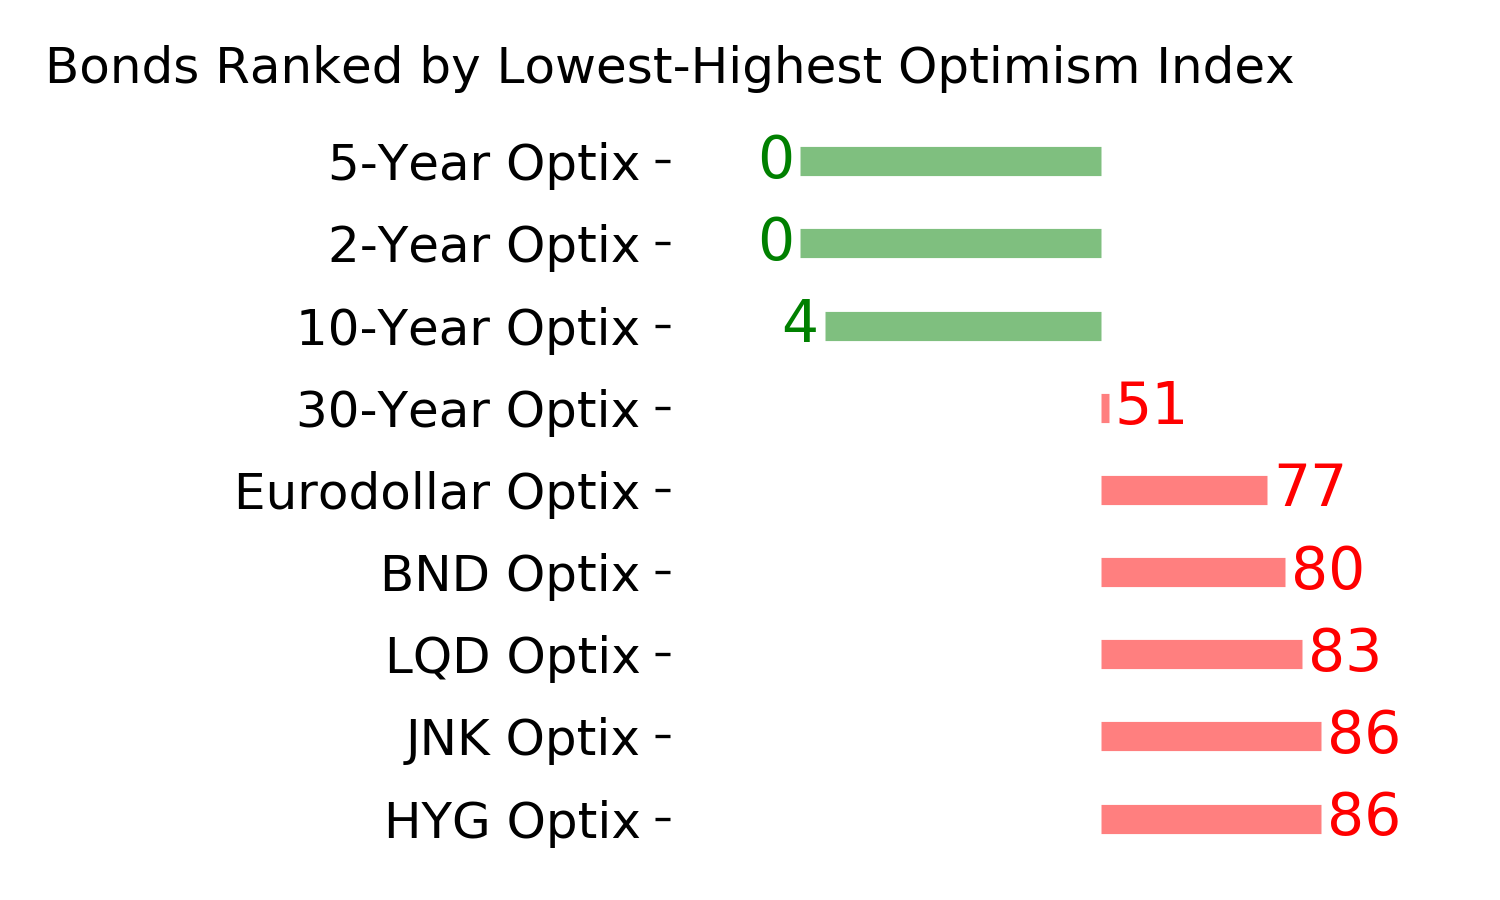
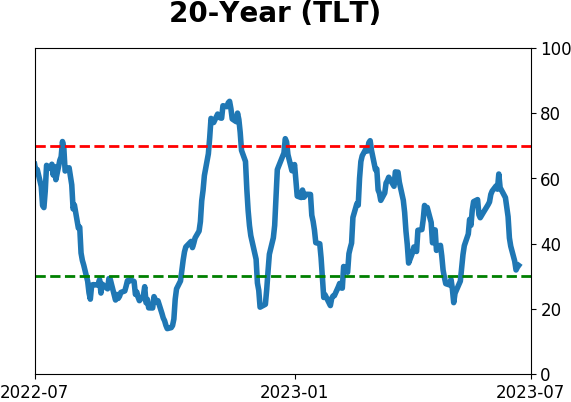
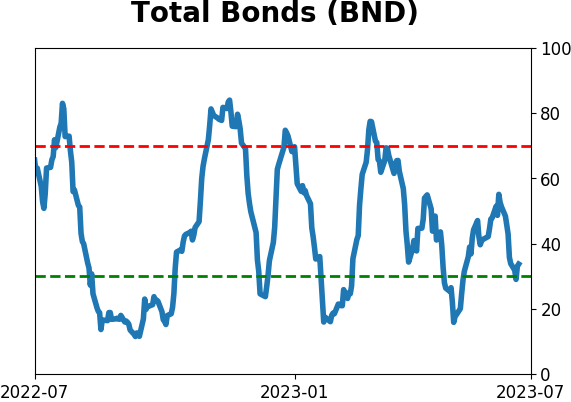
Bond ETF's - 10-Day Moving Average
|
|
|
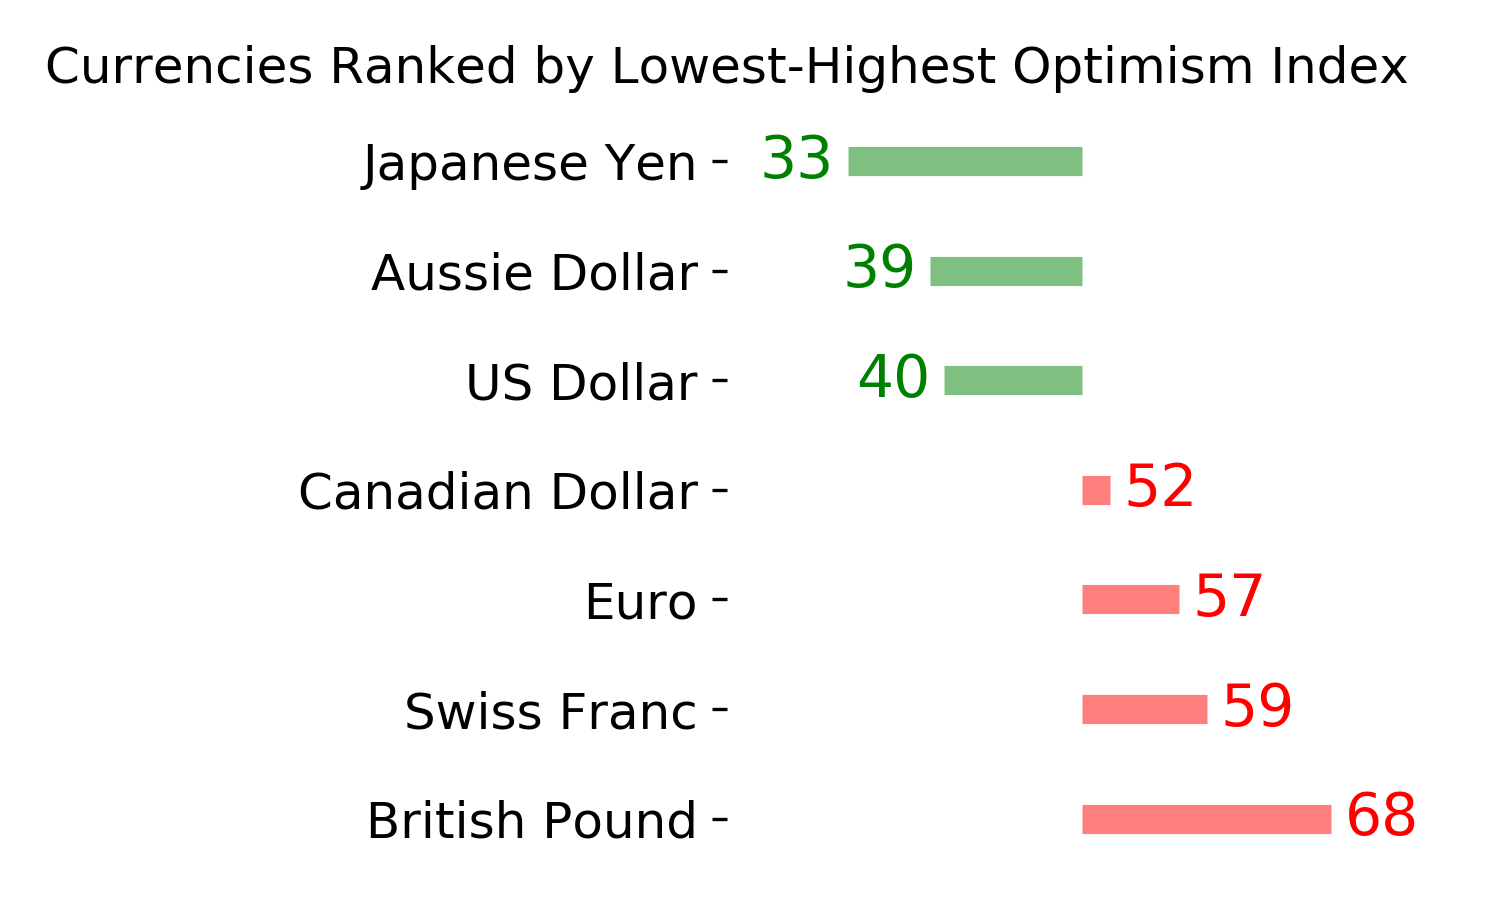
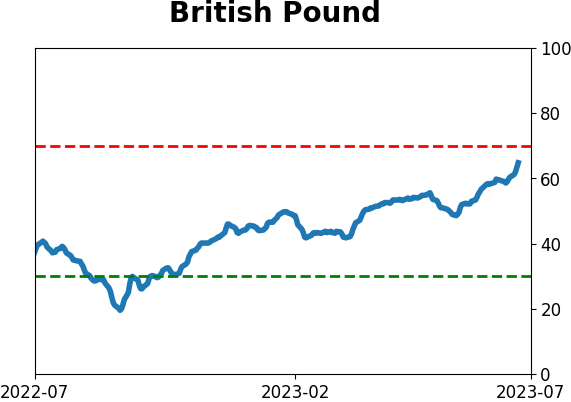
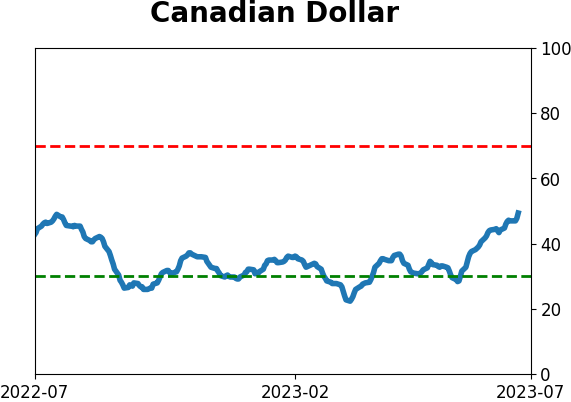
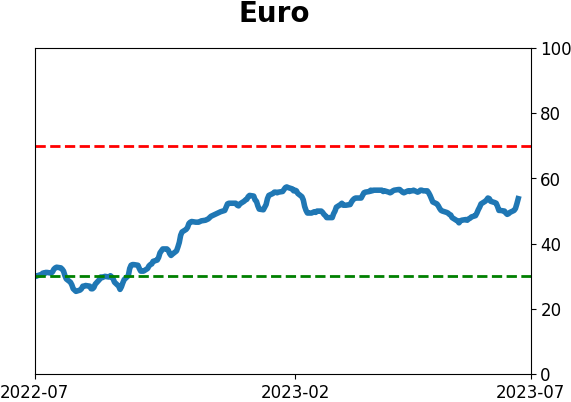
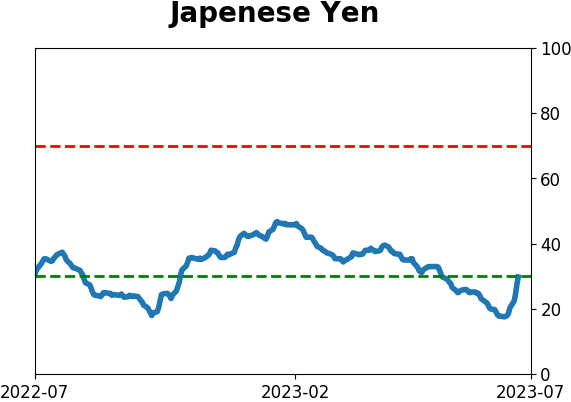
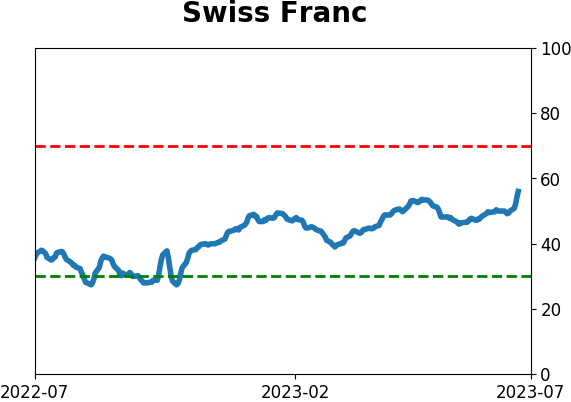
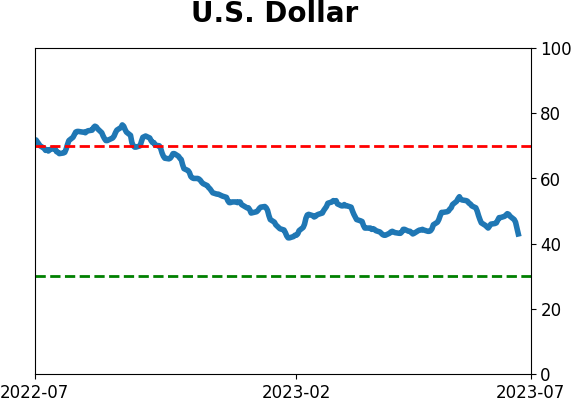
Currency ETF's - 5-Day Moving Average
|
|
|
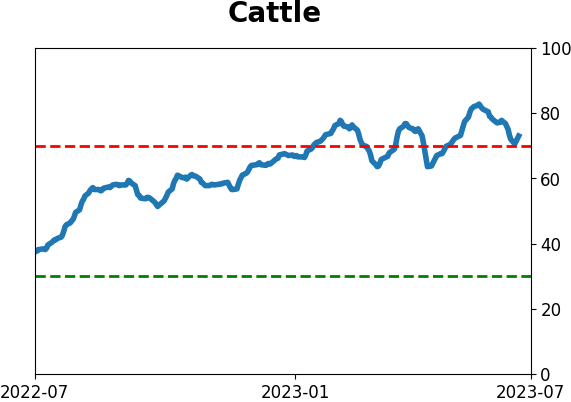
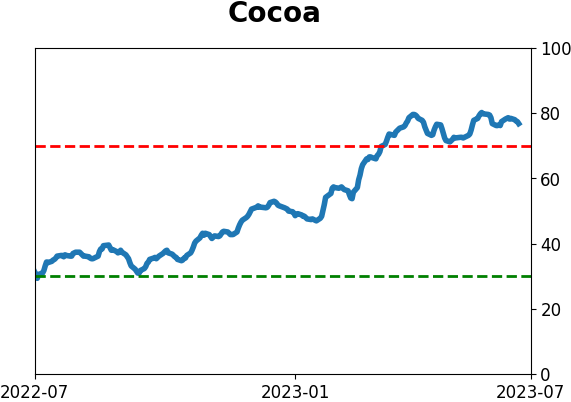
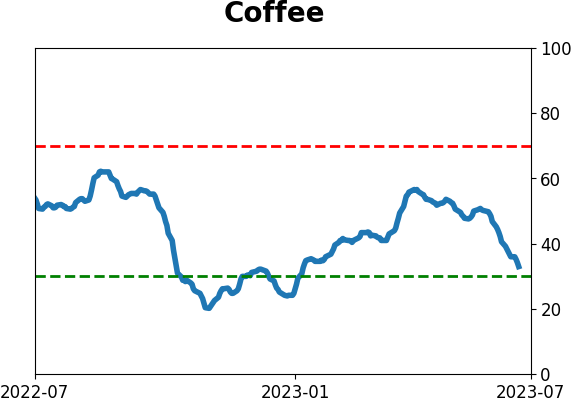
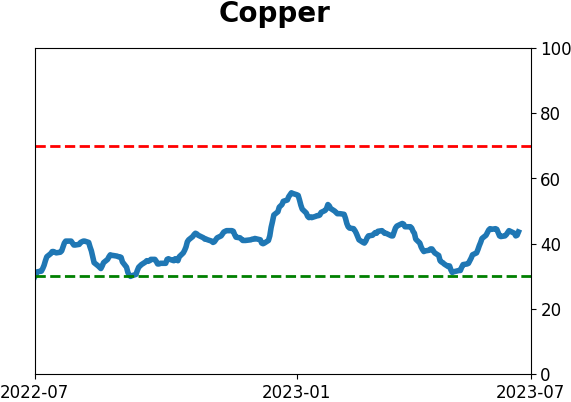
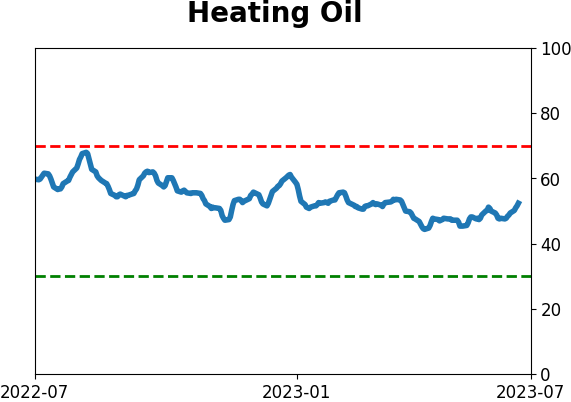
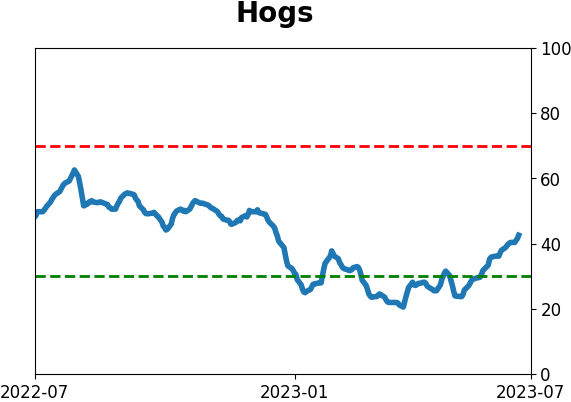
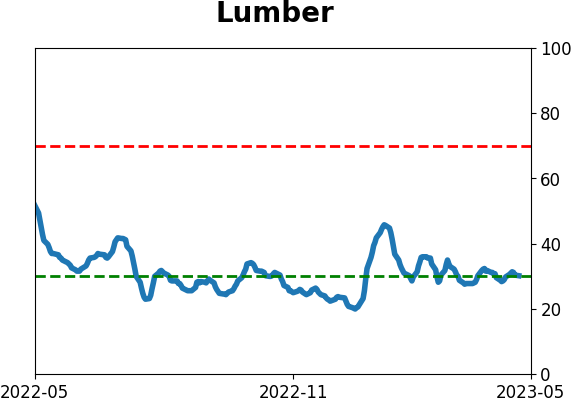
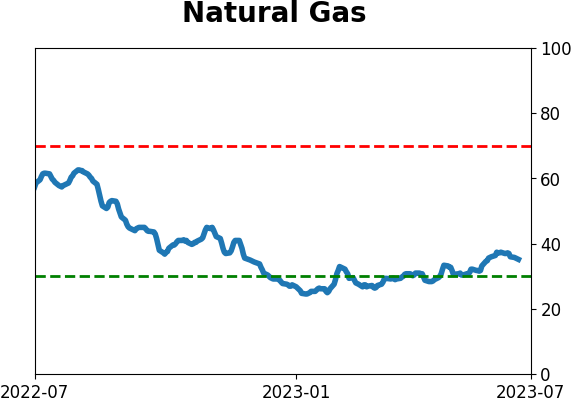
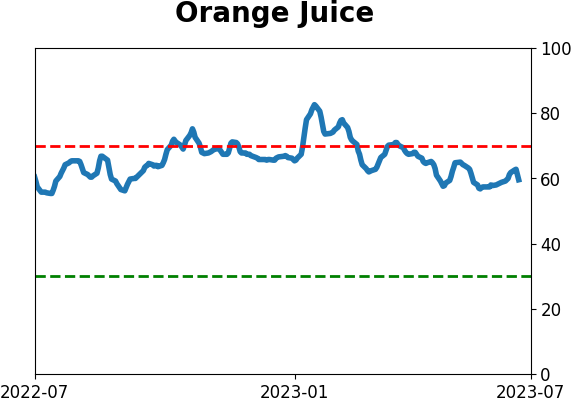
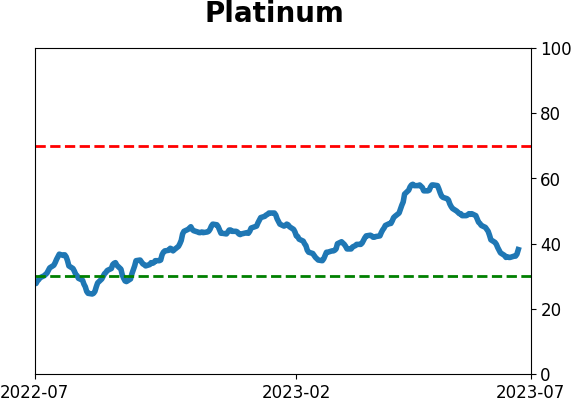
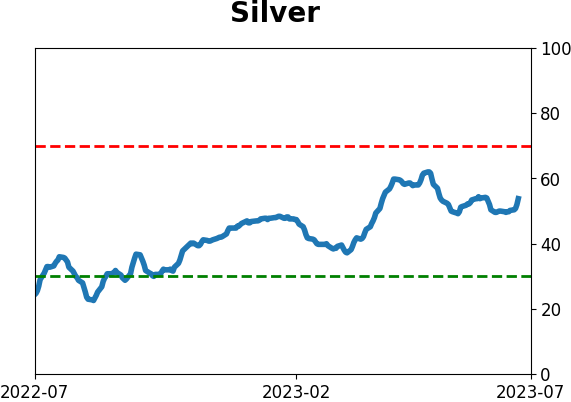
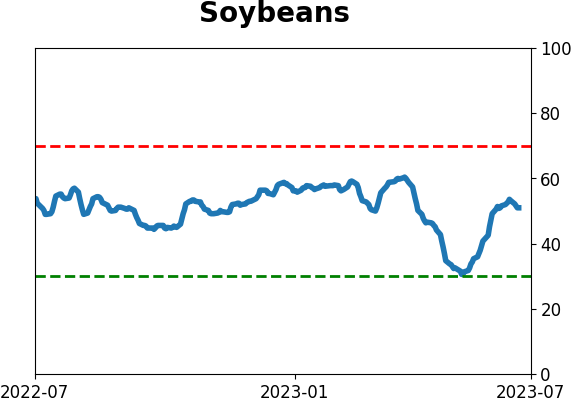
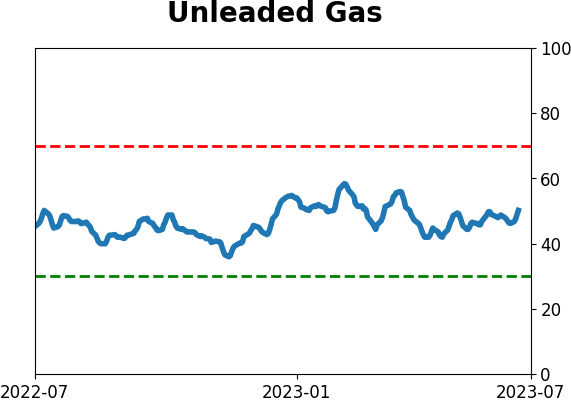
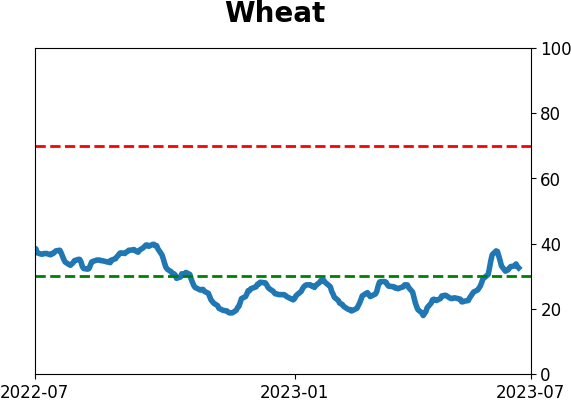
Commodity ETF's - 5-Day Moving Average
|
|