Headlines
|
|
Hedge Funds Try to Get Back in the Game by Ramping Exposure:
Hedge funds have been struggling to outperform, and they seem intent on trying to change that by investing more heavily in stocks. Estimated Hedge Fund Exposure to stocks has recently jumped to the highest level in over a year while it remains low in bonds and the dollar.
Bottom Line:
See the Outlook & Allocations page for more details on these summaries STOCKS: Hold
The speculative frenzy in February is wrung out. Internal dynamics have mostly held up, with some exceptions. Many of our studies still show a mixed to poor short-term view, with medium- and long-term ones turning more positive. BONDS: Hold
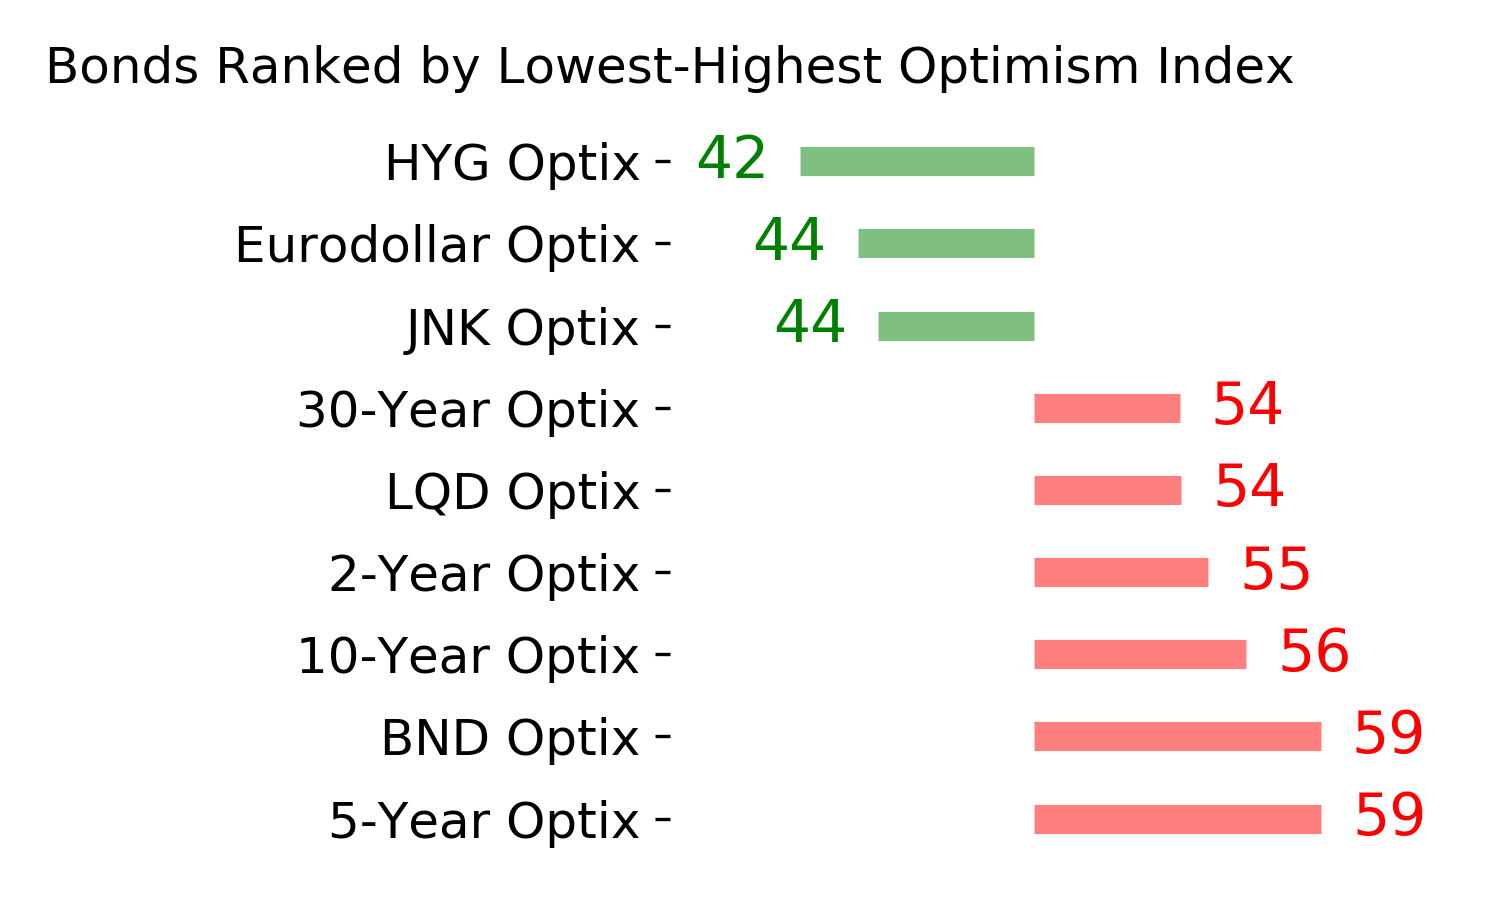
Various parts of the market got hit in March, with the lowest Bond Optimism Index we usually see during healthy environments. After a shaky couple of weeks, the broad bond market has modestly recovered. Not a big edge here either way. GOLD: Hold
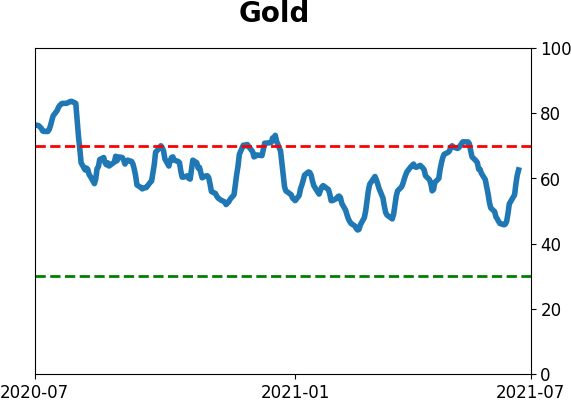
Gold and miners have done very well, recovering above long-term trend lines. The issue is that both have tended to perform poorly after similar situations - will have to wait and see how it plays out.
|
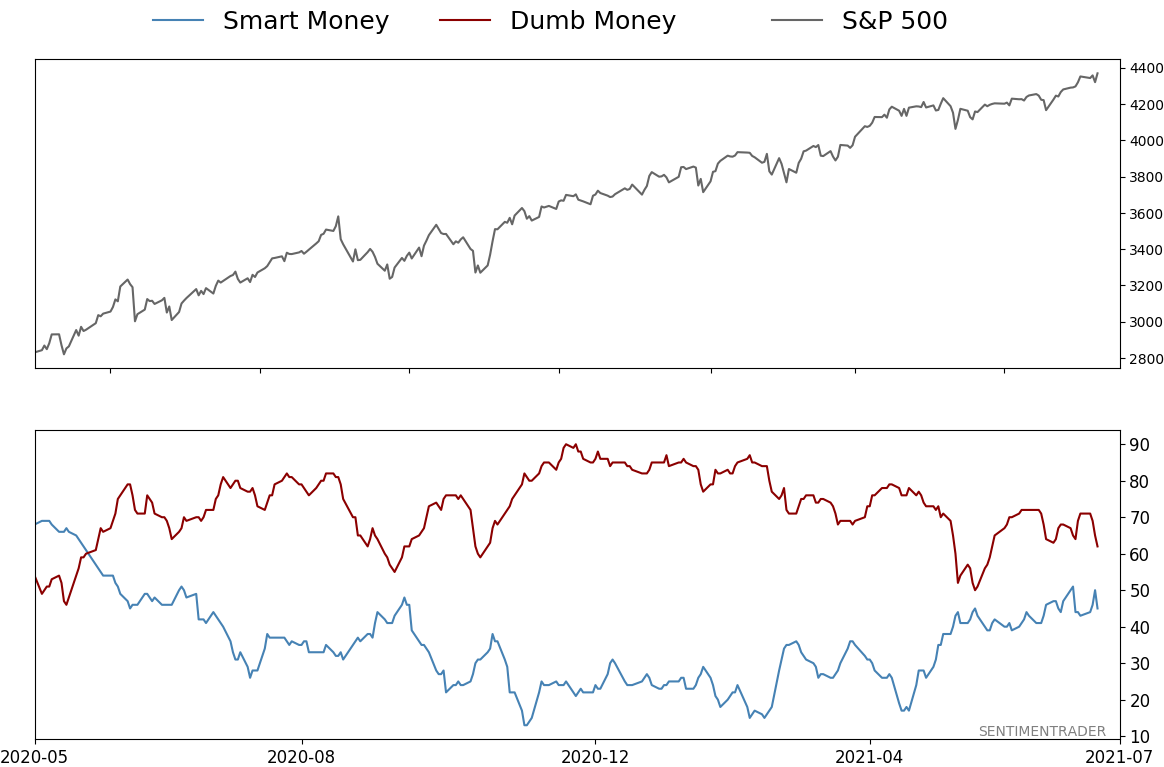
Smart / Dumb Money Confidence
|
Smart Money Confidence: 45%
Dumb Money Confidence: 62%
|
|
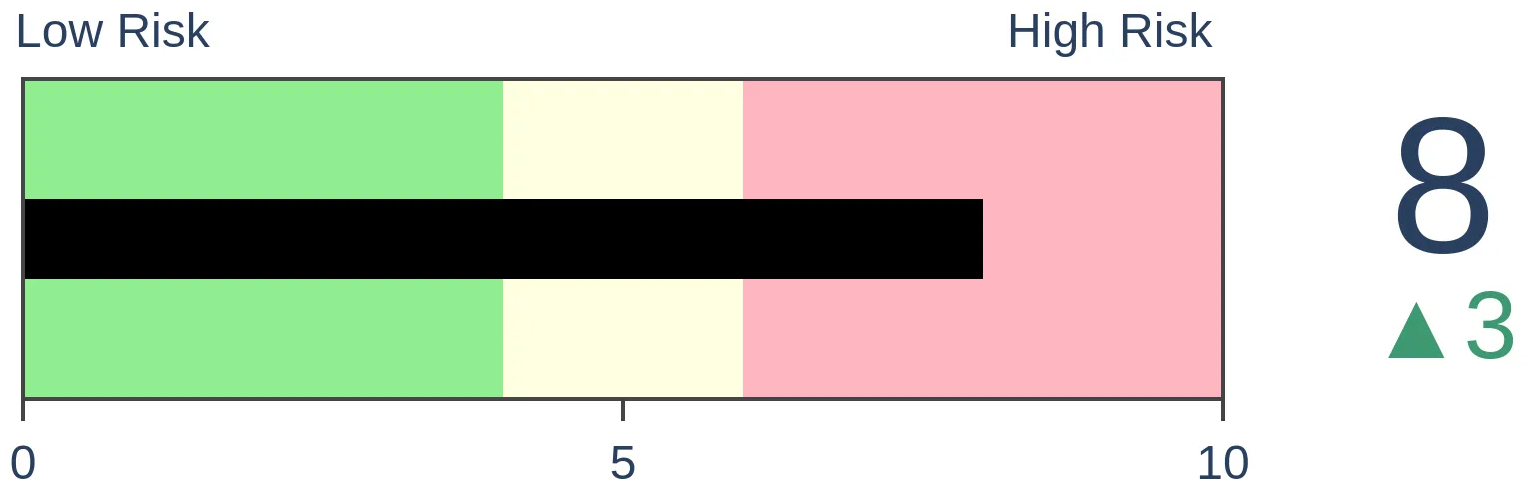
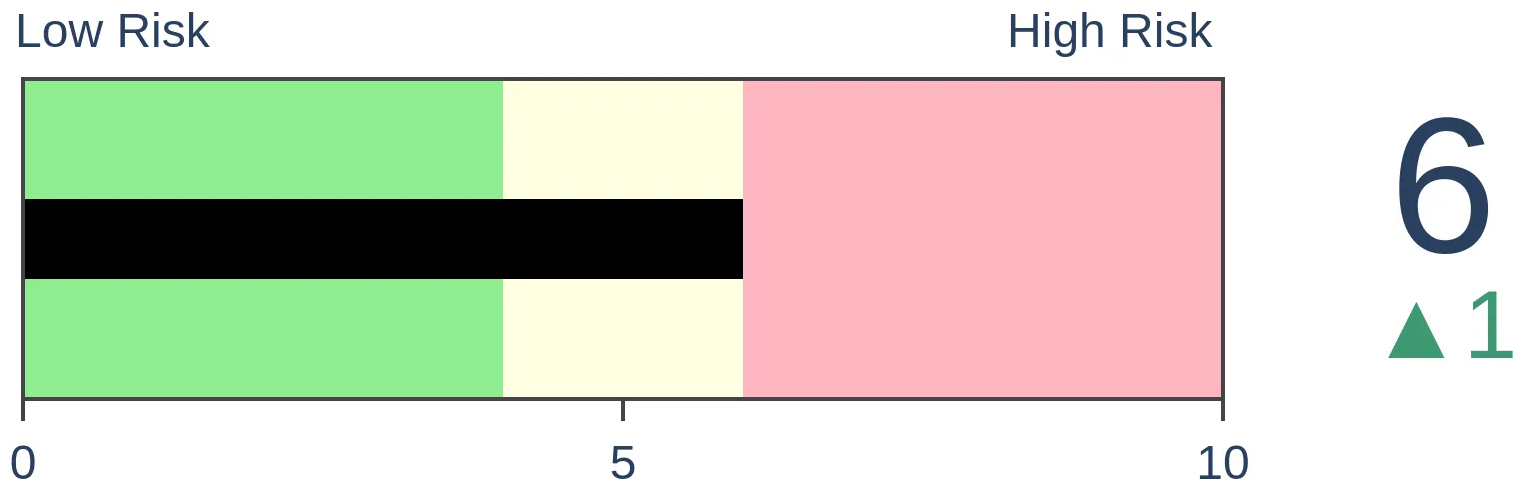
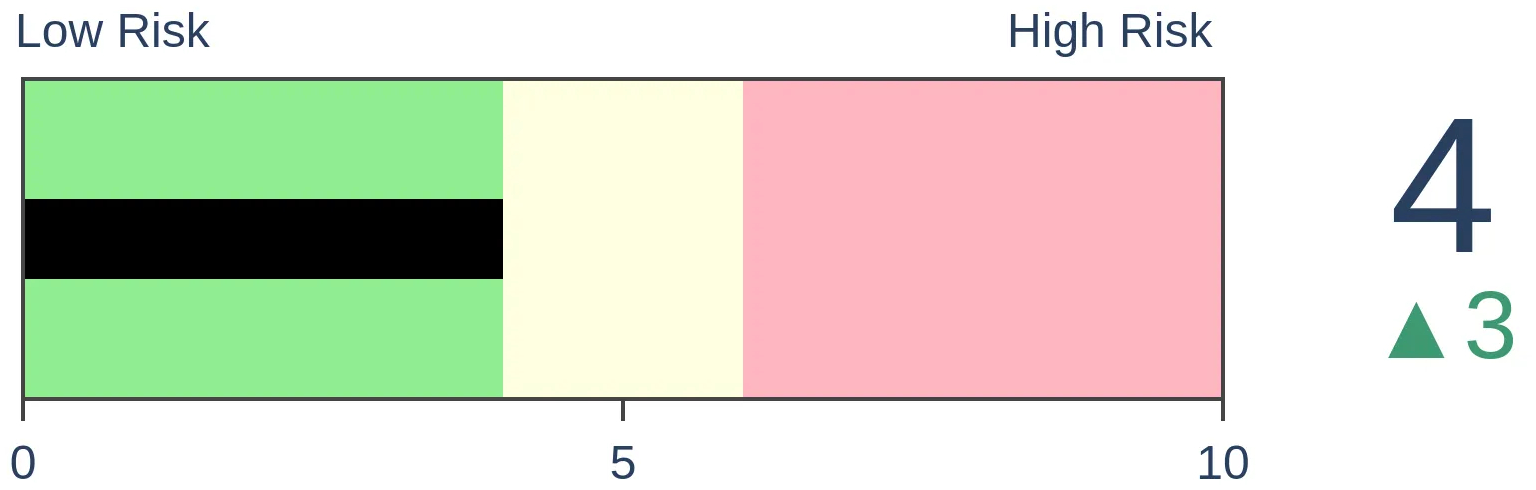
Risk Levels
Stocks Short-Term
|
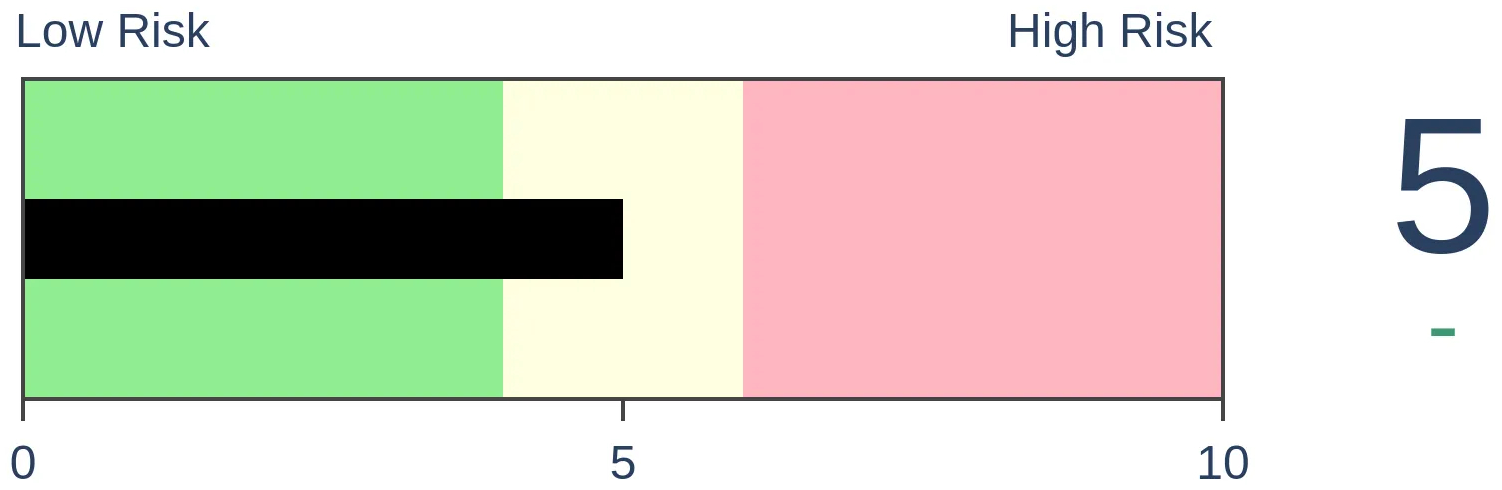
Stocks Medium-Term
|
|
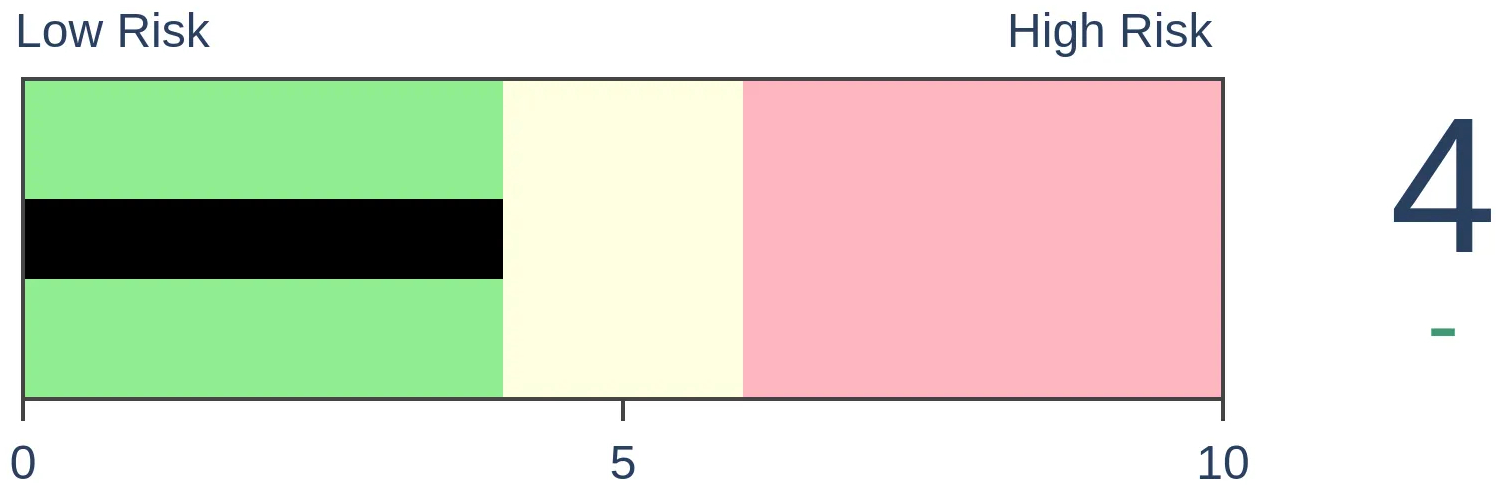
Bonds
|
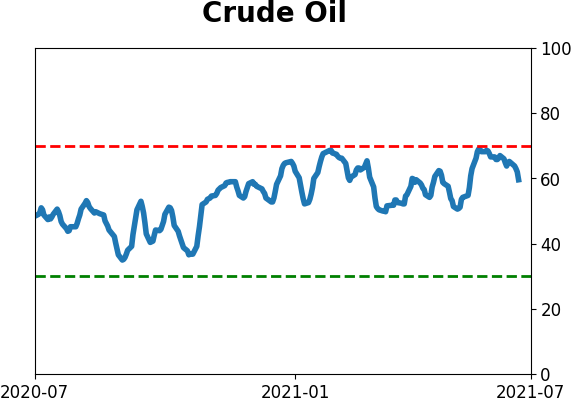
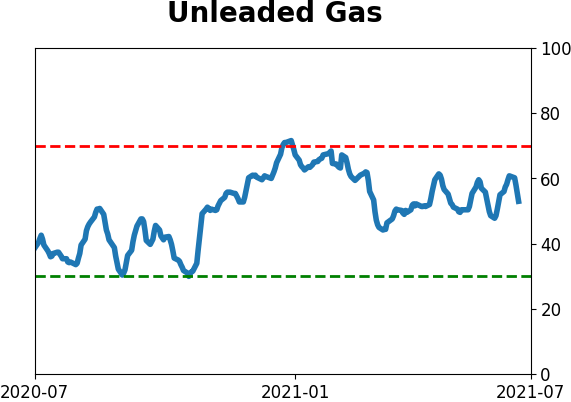
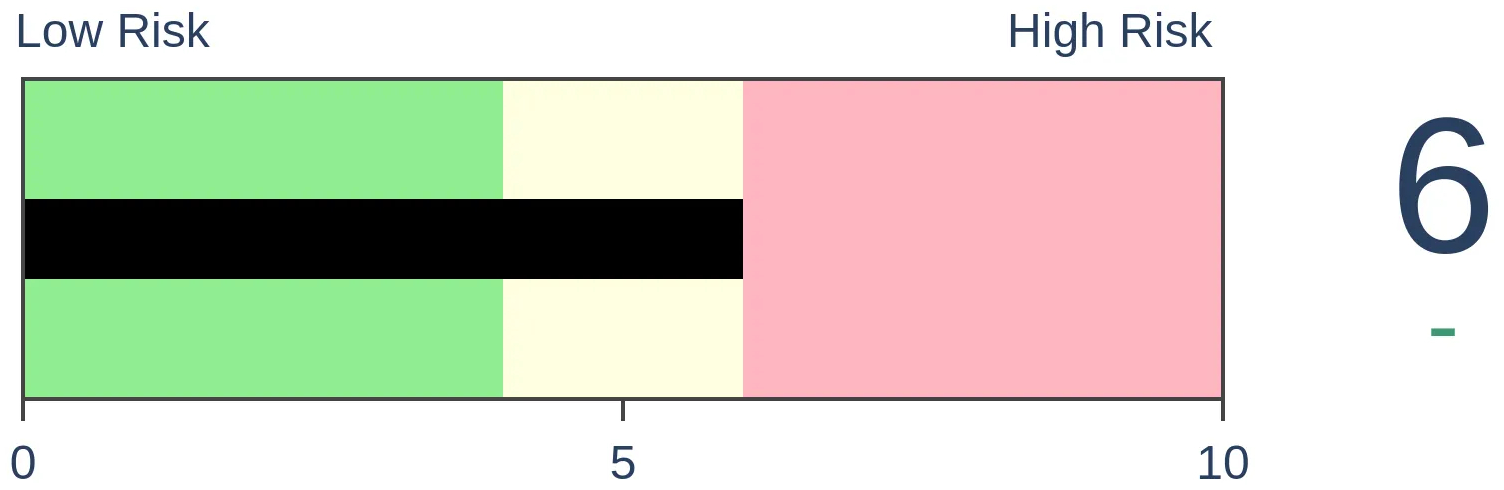
Crude Oil
|
|
Gold
|
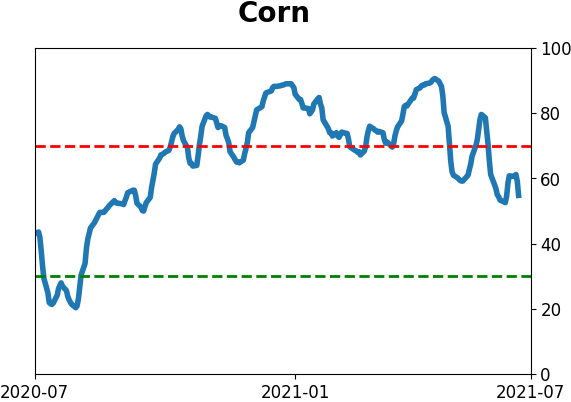
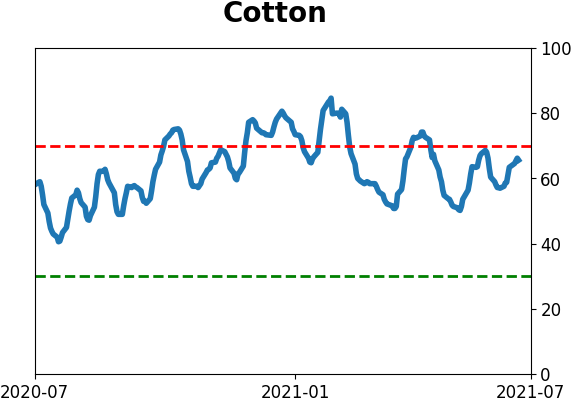
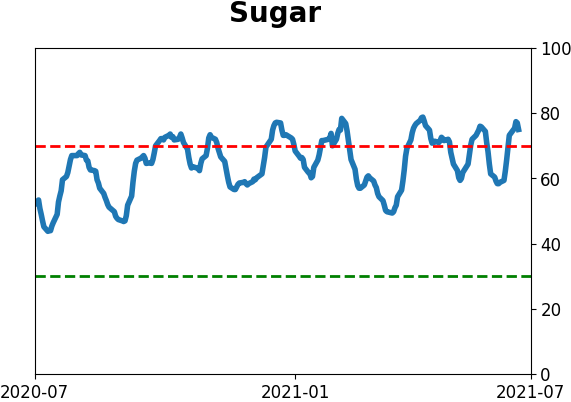
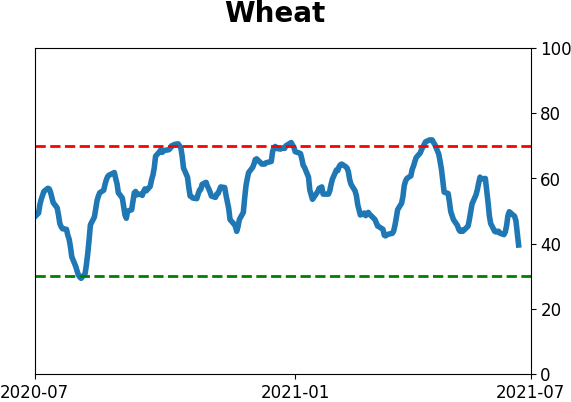
Agriculture
|
|
Research
BOTTOM LINE
Hedge funds have been struggling to outperform, and they seem intent on trying to change that by investing more heavily in stocks. Estimated Hedge Fund Exposure to stocks has recently jumped to the highest level in over a year while it remains low in bonds and the dollar.
FORECAST / TIMEFRAME
None
|
We already know that small options traders, among many others, have been jumping once again into speculative trades. Now we can add hedge funds to the mix.
Many of them have had a rough start to the year, and now seem intent on making up for lost ground. Per the Wall Street Journal:
"Client notes from both Morgan Stanley and Goldman Sachs Group Inc. showed that fundamental stock-picking hedge funds posted negative alpha-trader shorthand for poor performance-in the first half of the year.
Part of the challenge for professional stock pickers is that markets have been heavily rotational, Mr. Dowling and several fund managers said. Markets this year have whipped back and forth between growth stocks and value stocks, making it difficult for managers to find winning trades."
The latest estimate of Hedge Fund Exposure shows that funds are nearly 40% net long stocks, a quick rise from almost being flat a month ago. Over the past few years, when it has climbed this high, the S&P ended up giving any further gains back, though it took a long time to play out during the momentum market immediately prior to the pandemic crash.
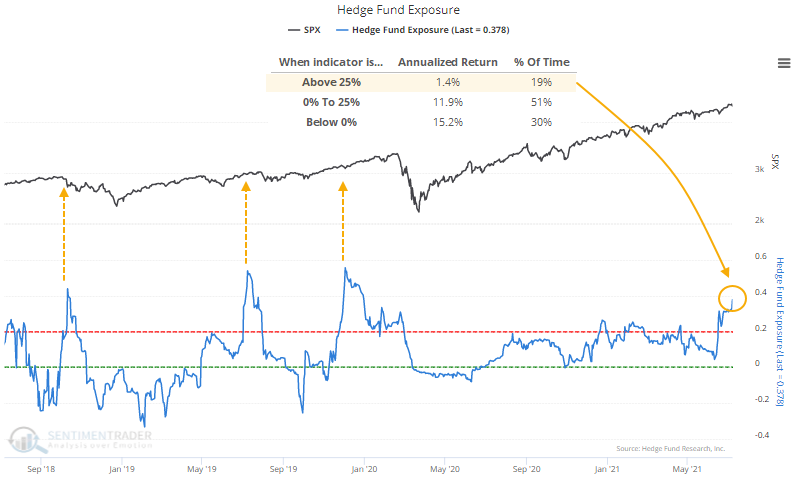
After any day since 2003 when Exposure was below zero, the S&P 500 returned an annualized 15.2%, versus only 1.4% when Exposure was above 25% as it is now.
If we look at what happened after the first reading above 35% in at least six months, medium-term returns were unimpressive.
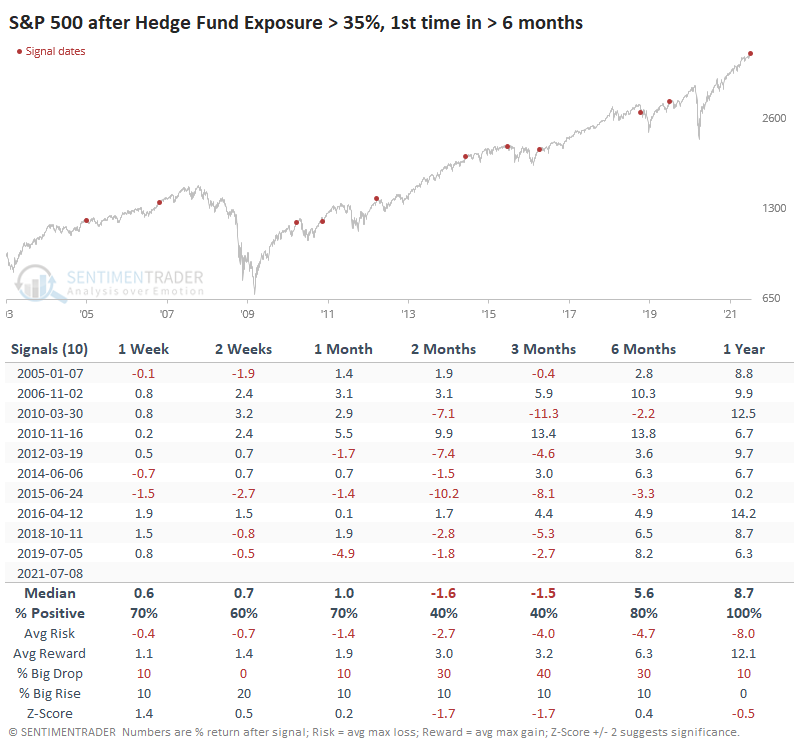
Out of ten prior signals, only two (November 2006 and November 2010) managed to show large and sustained gains over the next 1-3 months. Up to three months later, risk was higher than reward.
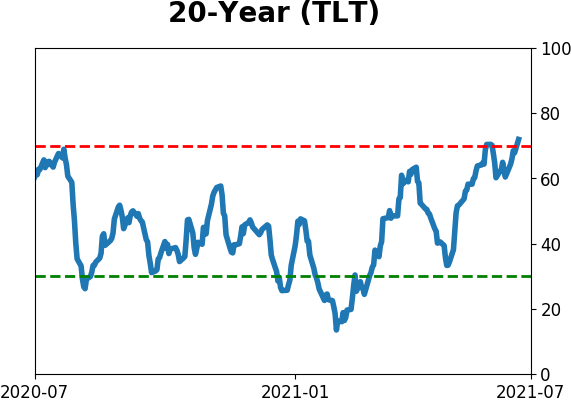
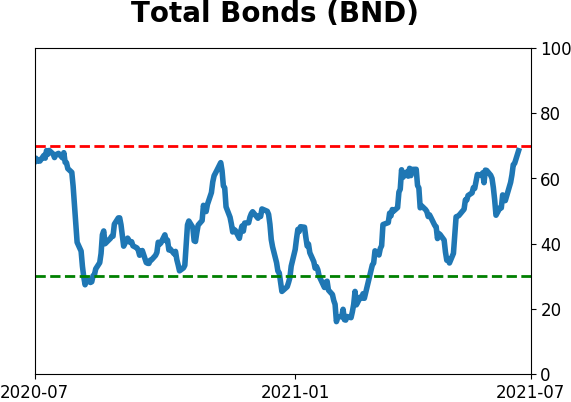
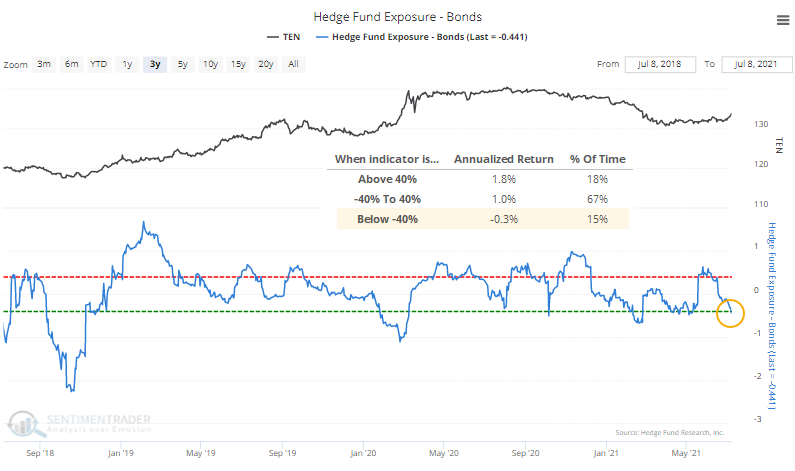
As for other markets, estimated Hedge Fund Exposure in bonds has cycled close to an extreme low, but it has not been effective as a contrary indicator for this market. It's mostly been the opposite, with low exposure leading to poor returns, and vice-versa.
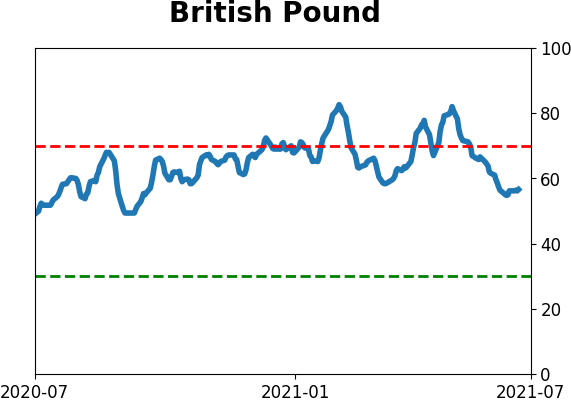
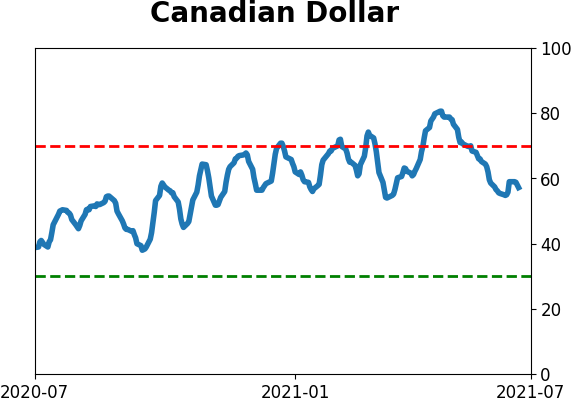
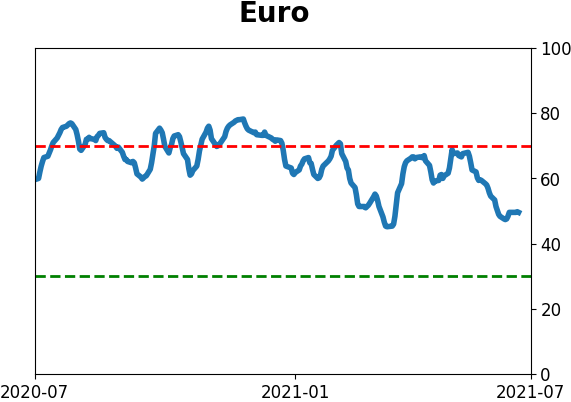
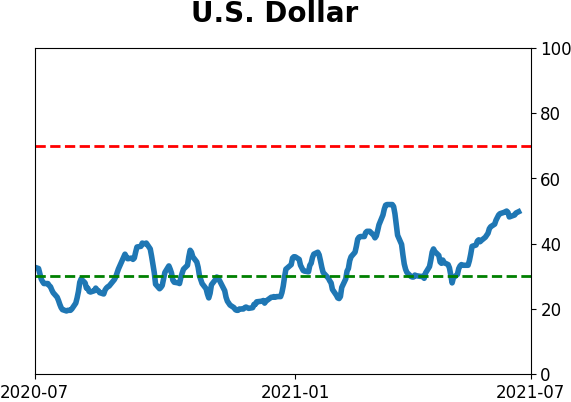
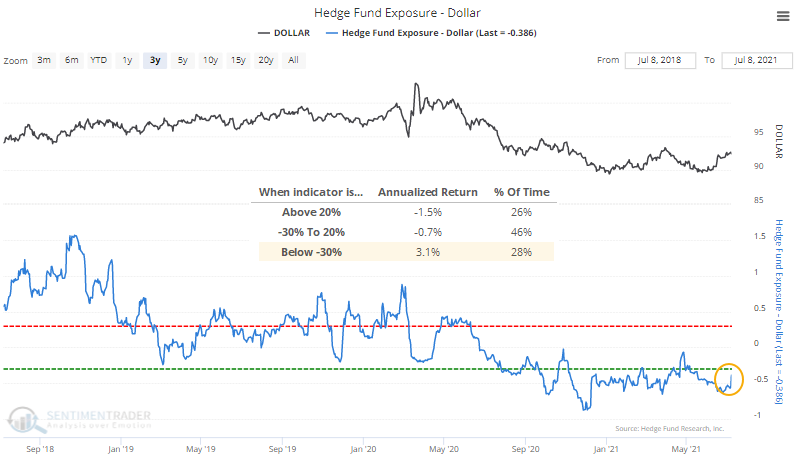
Estimated Hedge Fund Exposure in the dollar is likewise extremely low, and that has preceded positive returns for the buck. Gold returned an annualized -1.0% when Exposure in the dollar was below -30%.
In stocks, we continue to see a frustrating dichotomy between momentum and, well, pretty much everything else. Momentum has clearly been winning and anything counter to that has looked idiotic. Markets cycle between rewarding certain strategies over others but this has been a historically long stretch.
No matter what warning signs have popped up since December, momentum has rolled right over it. More warnings triggered over the past 1-2 weeks, and yet here we are at new highs again. Internals have weakened considerably, and as hedge fund returns show, it's been difficult to outperform with individual stocks or sectors since so many are lagging (there are still fewer than 60% of S&P 500 stocks trading above their 50-day moving averages). Until the indexes show some follow-through to short-term selling pressure, there is no evidence that the environment is changing.
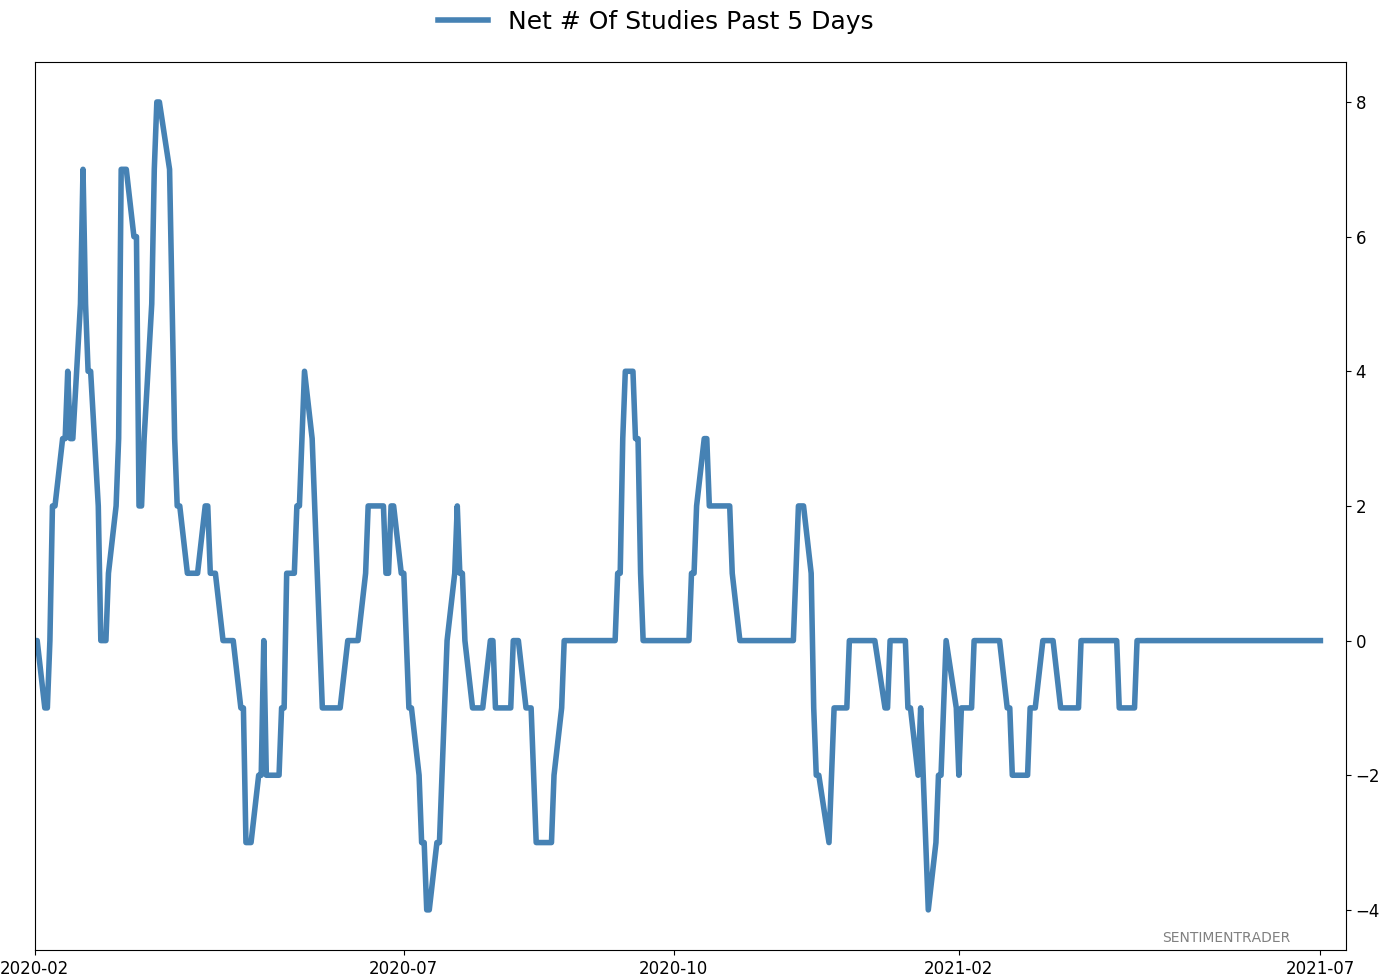
Active Studies
| Time Frame | Bullish | Bearish | | Short-Term | 0 | 1 | | Medium-Term | 2 | 2 | | Long-Term | 9 | 5 |
|
Indicators at Extremes
Portfolio
| Position | Description | Weight % | Added / Reduced | Date | | Stocks | RSP | 4.1 | Added 4.1% | 2021-05-19 | | Bonds | 23.9% BND, 6.9% SCHP | 30.7 | Reduced 7.1% | 2021-05-19 | | Commodities | GCC | 2.6 | Reduced 2.1%
| 2020-09-04 | | Precious Metals | GDX | 5.6 | Reduced 4.2% | 2021-05-19 | | Special Situations | 4.3% XLE, 2.2% PSCE | 7.6 | Reduced 5.6% | 2021-04-22 | | Cash | | 49.4 | | |
|
Updates (Changes made today are underlined)
Much of our momentum and trend work has remained positive for several months, with some scattered exceptions. Almost all sentiment-related work has shown a poor risk/reward ratio for stocks, especially as speculation drove to record highs in exuberance in February. Much of that has worn off, and most of our models are back toward neutral levels. There isn't much to be excited about here. The same goes for bonds and even gold. Gold has been performing well lately and is back above long-term trend lines. The issue is that it has a poor record of holding onto gains when attempting a long-term trend change like this, so we'll take a wait-and-see approach. RETURN YTD: 9.3% 2020: 8.1%, 2019: 12.6%, 2018: 0.6%, 2017: 3.8%, 2016: 17.1%, 2015: 9.2%, 2014: 14.5%, 2013: 2.2%, 2012: 10.8%, 2011: 16.5%, 2010: 15.3%, 2009: 23.9%, 2008: 16.2%, 2007: 7.8%
|
|
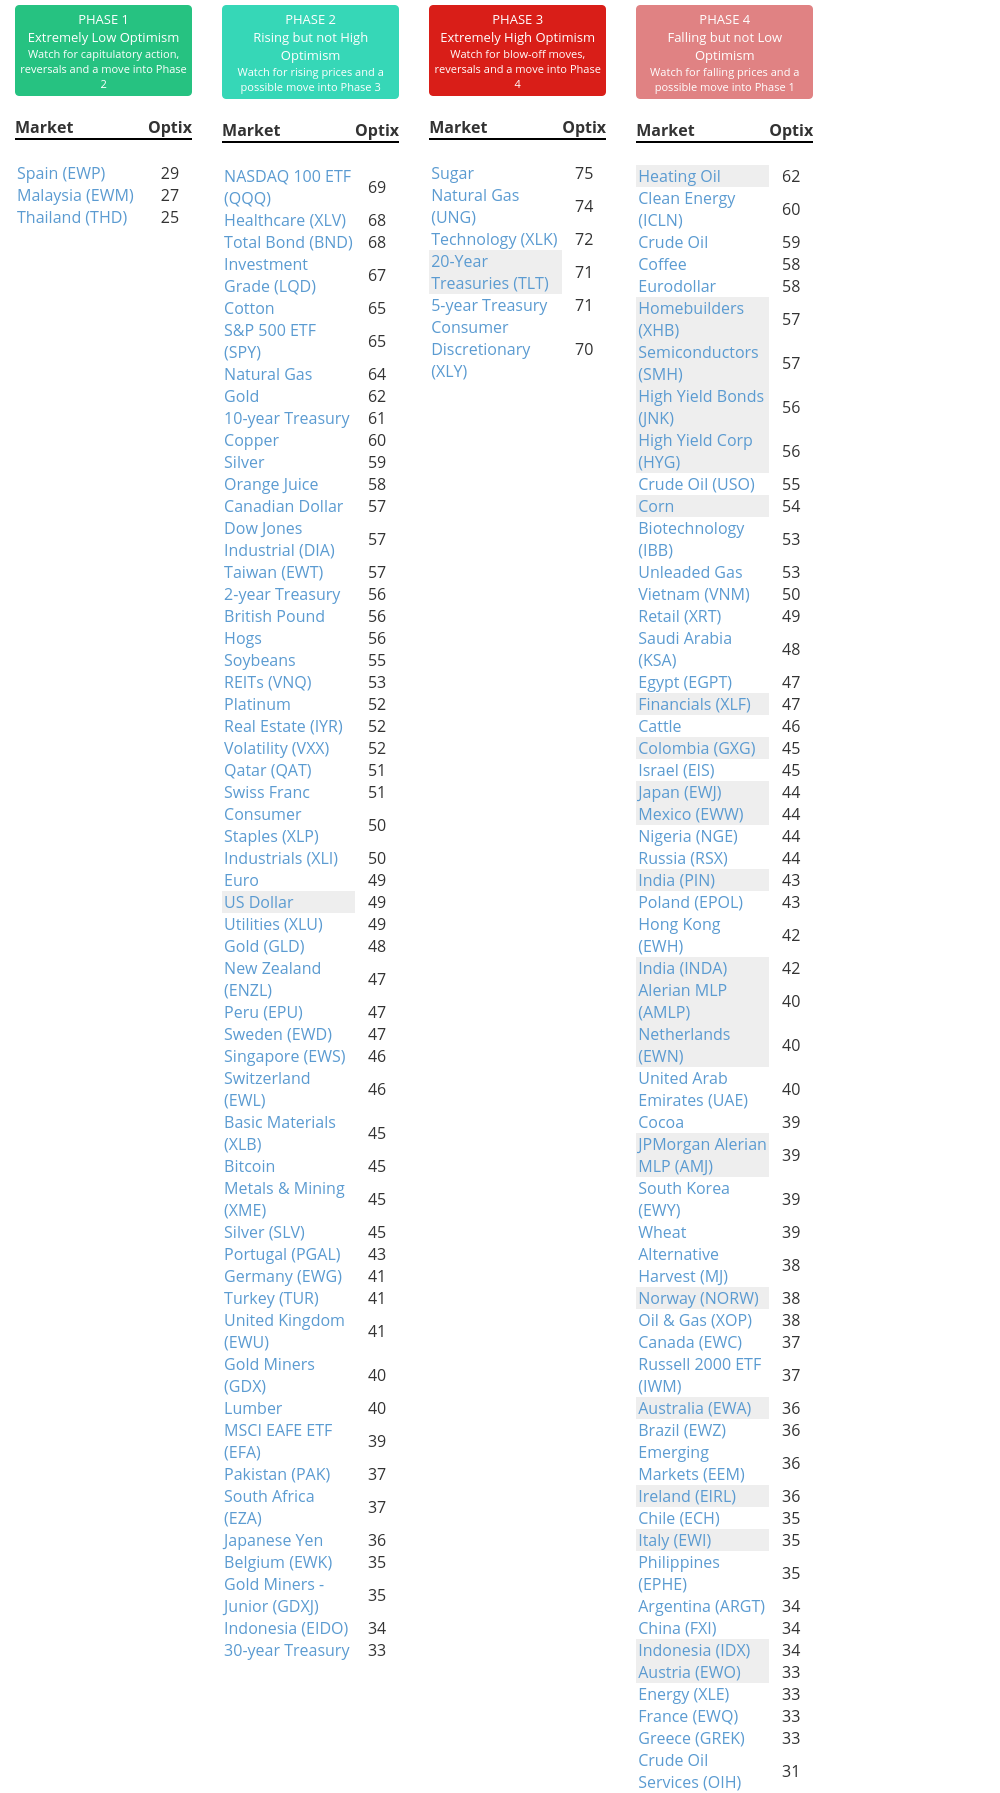
Phase Table
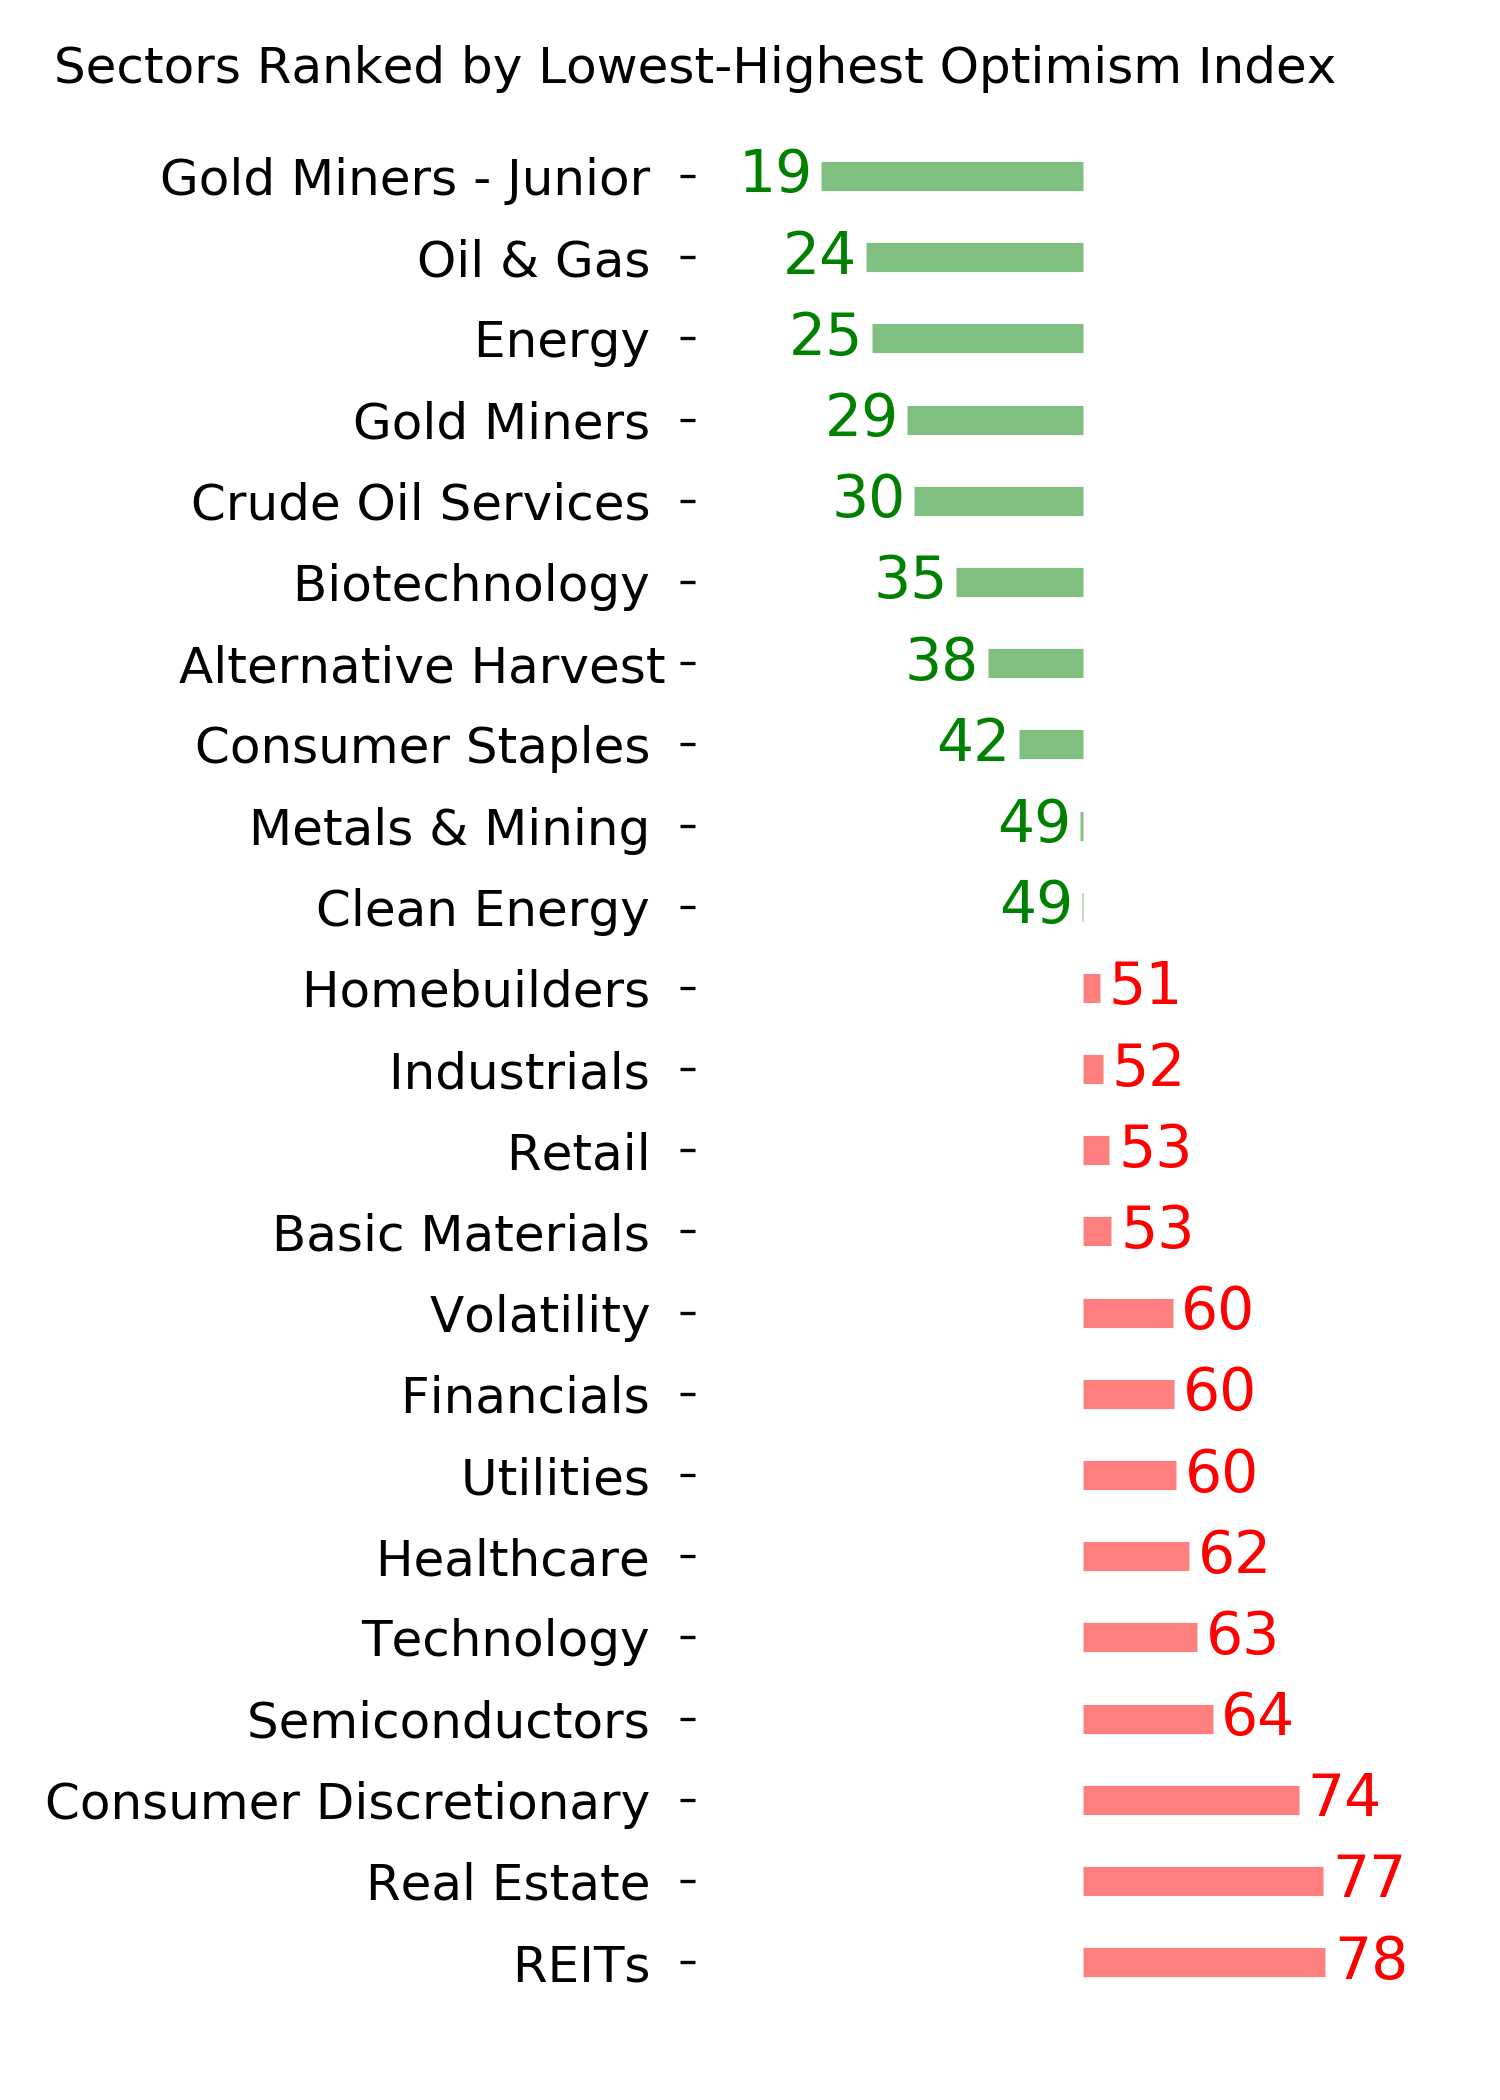
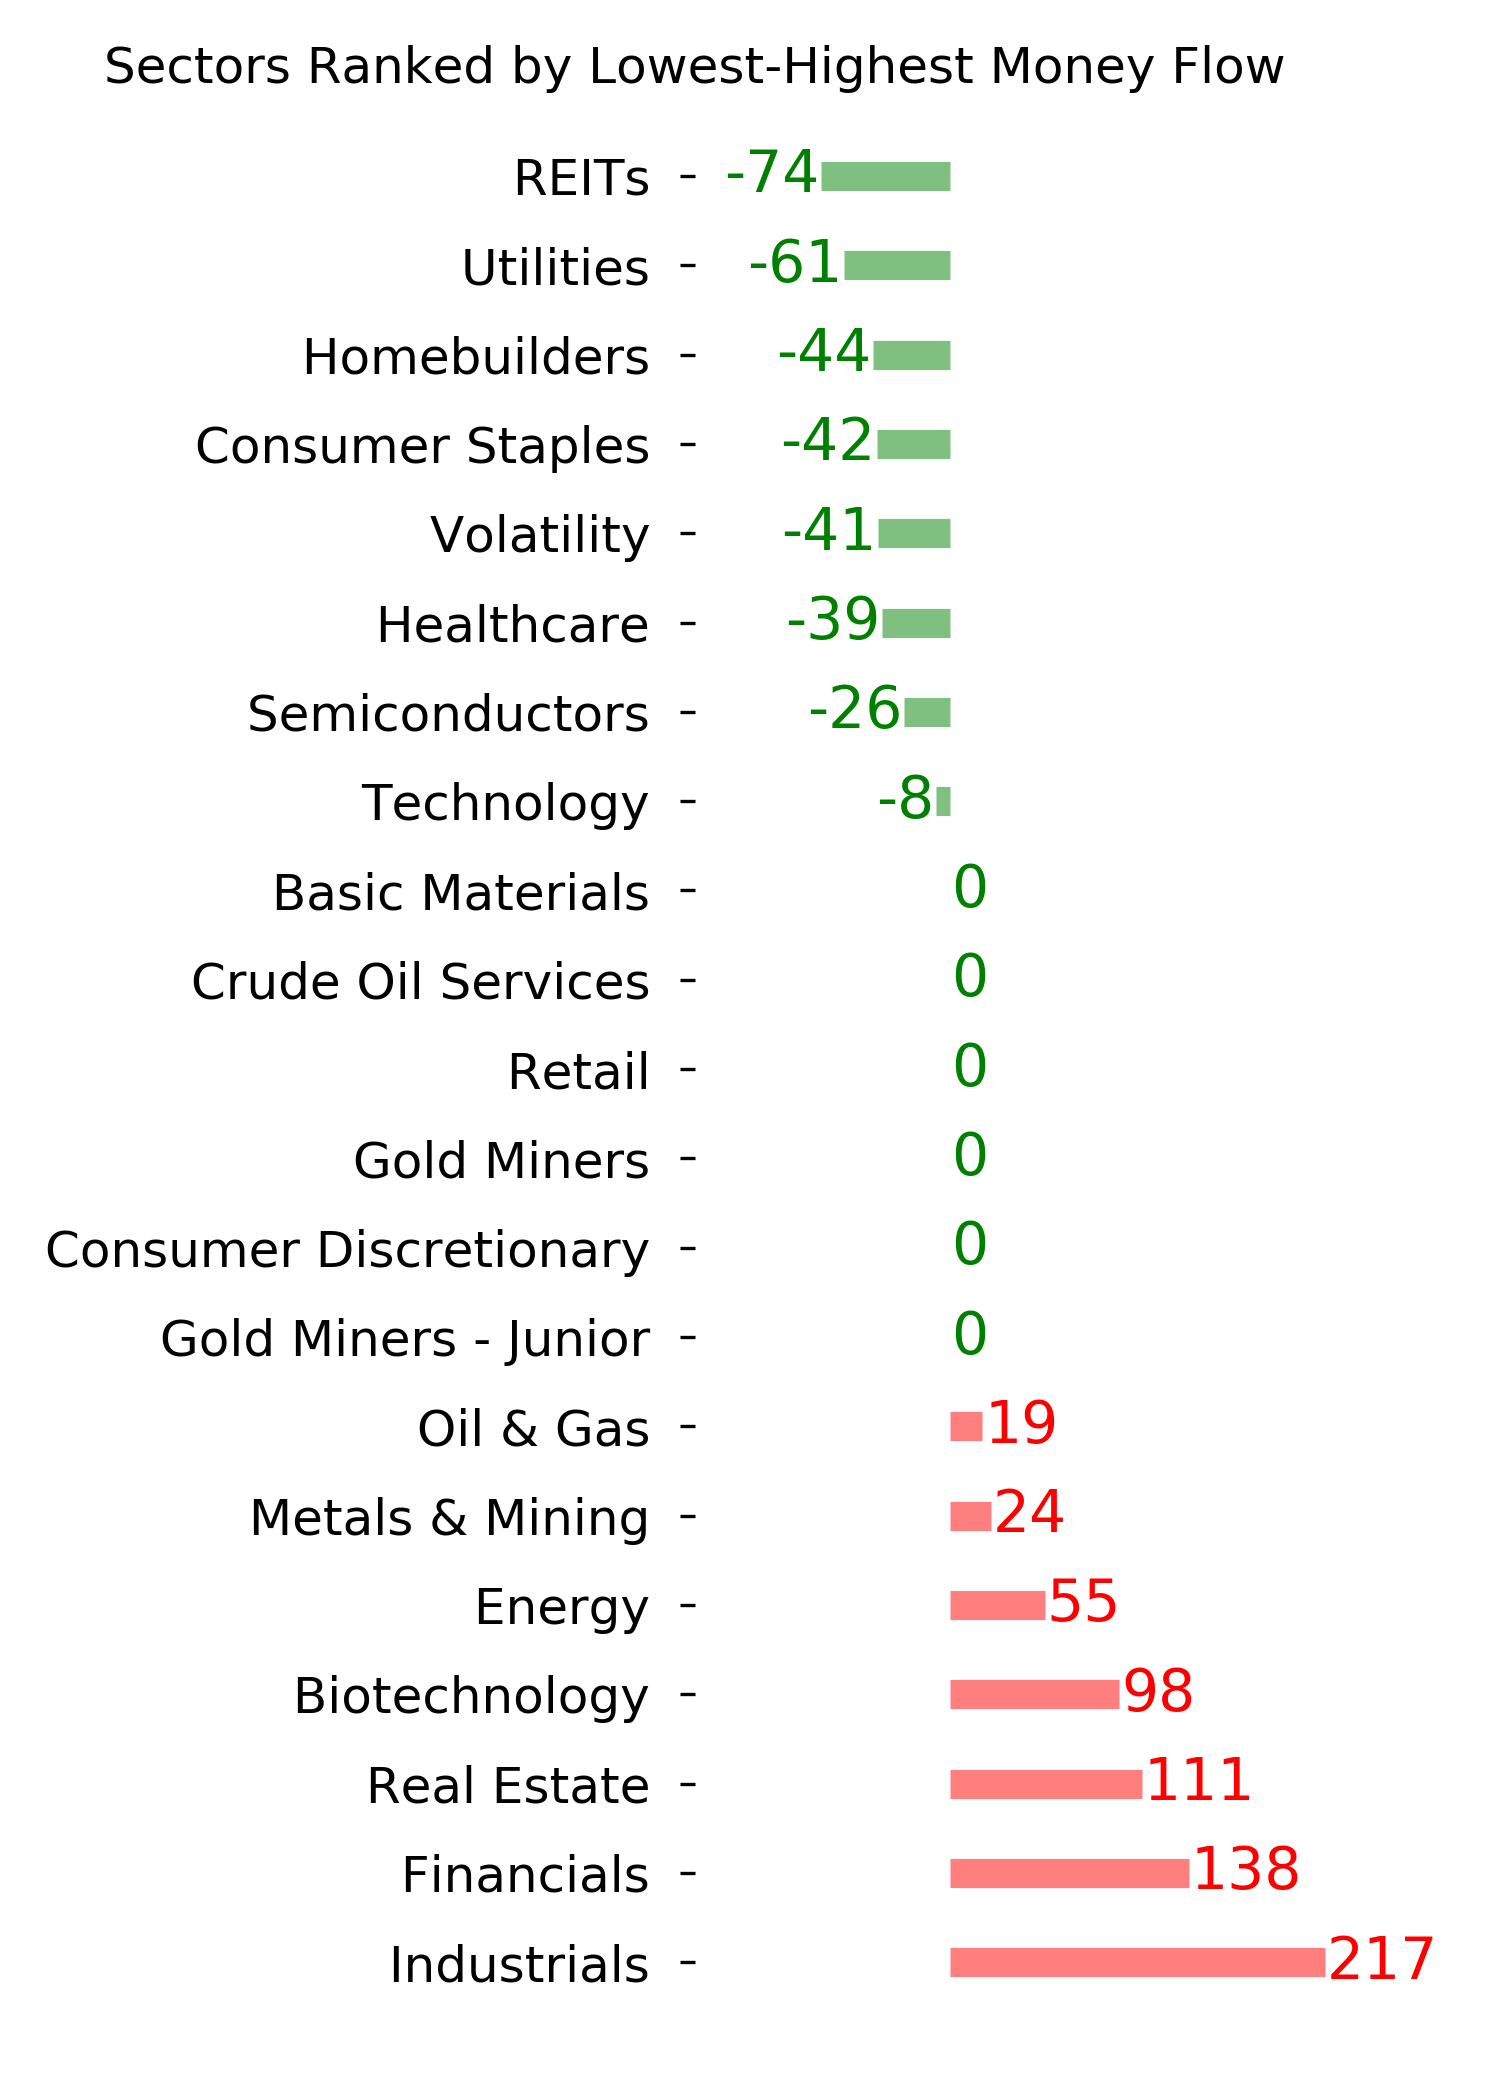
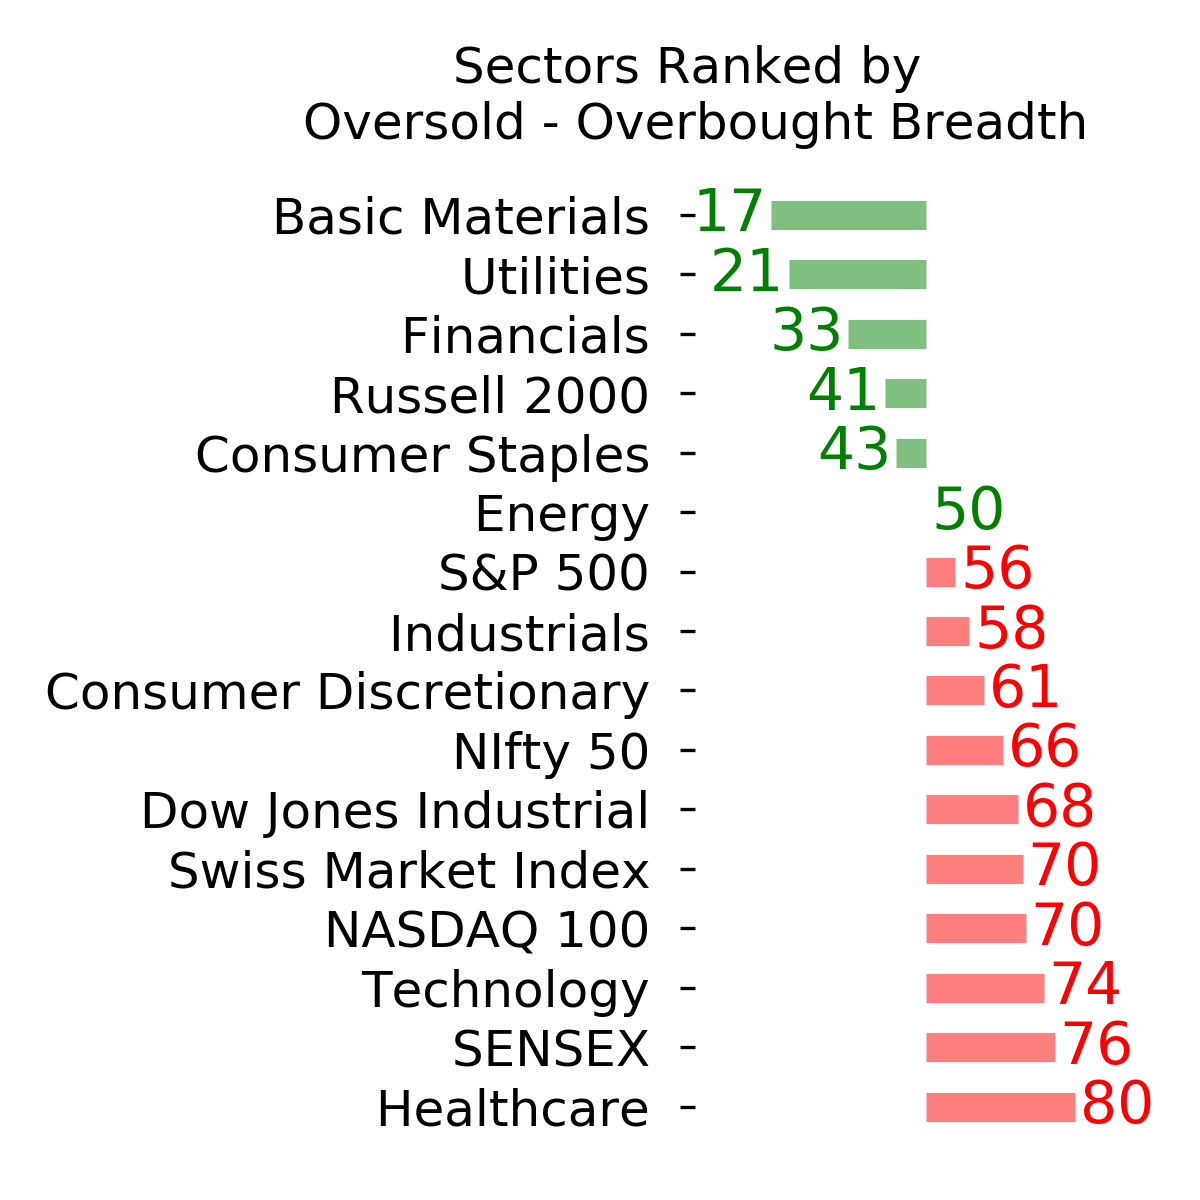
Ranks
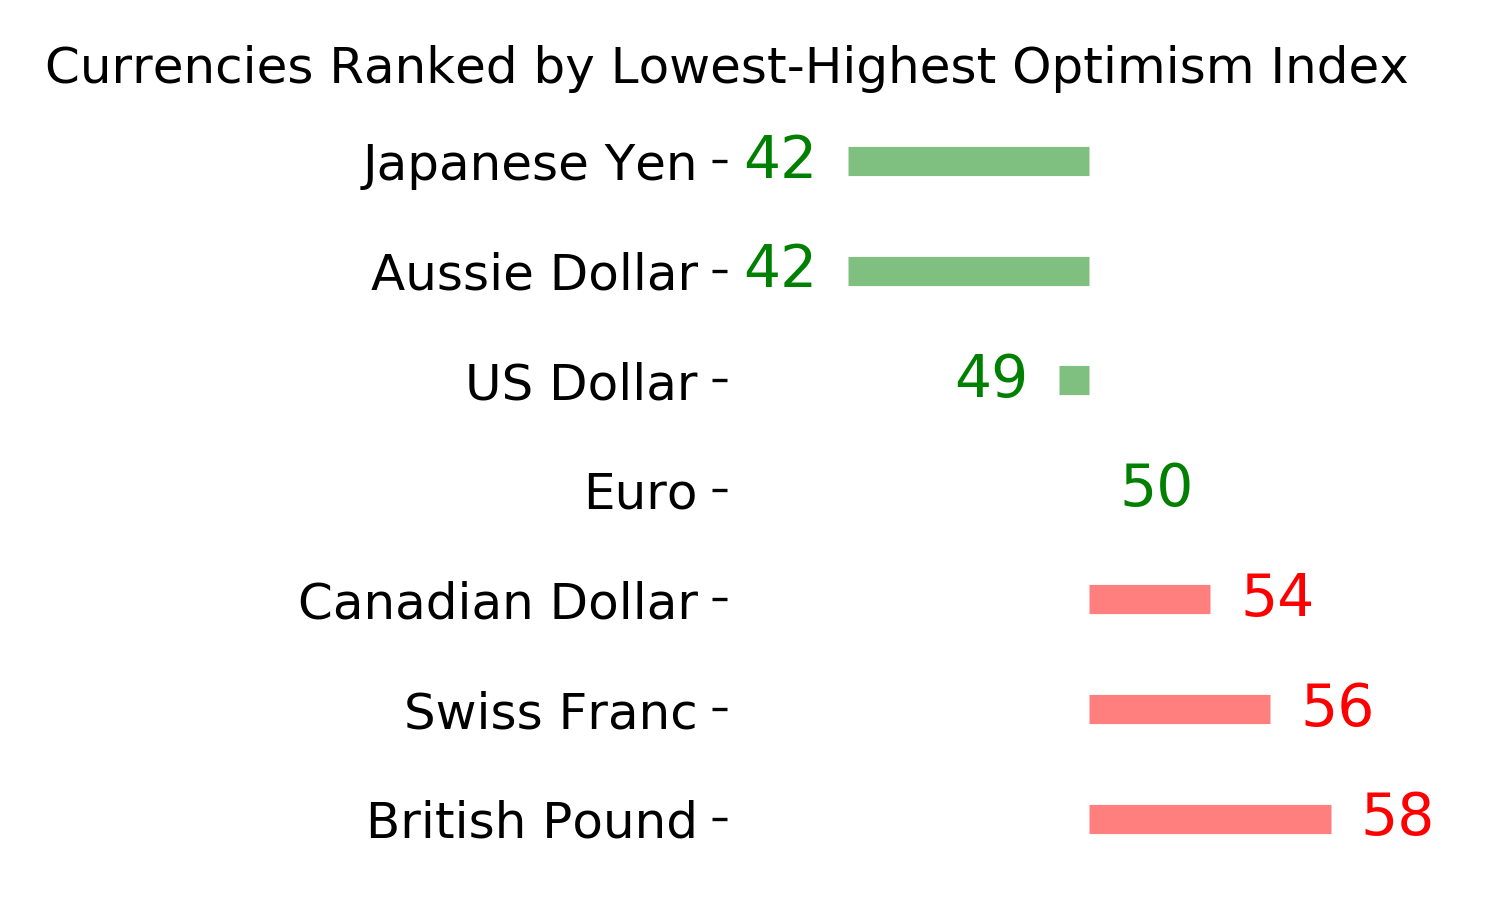
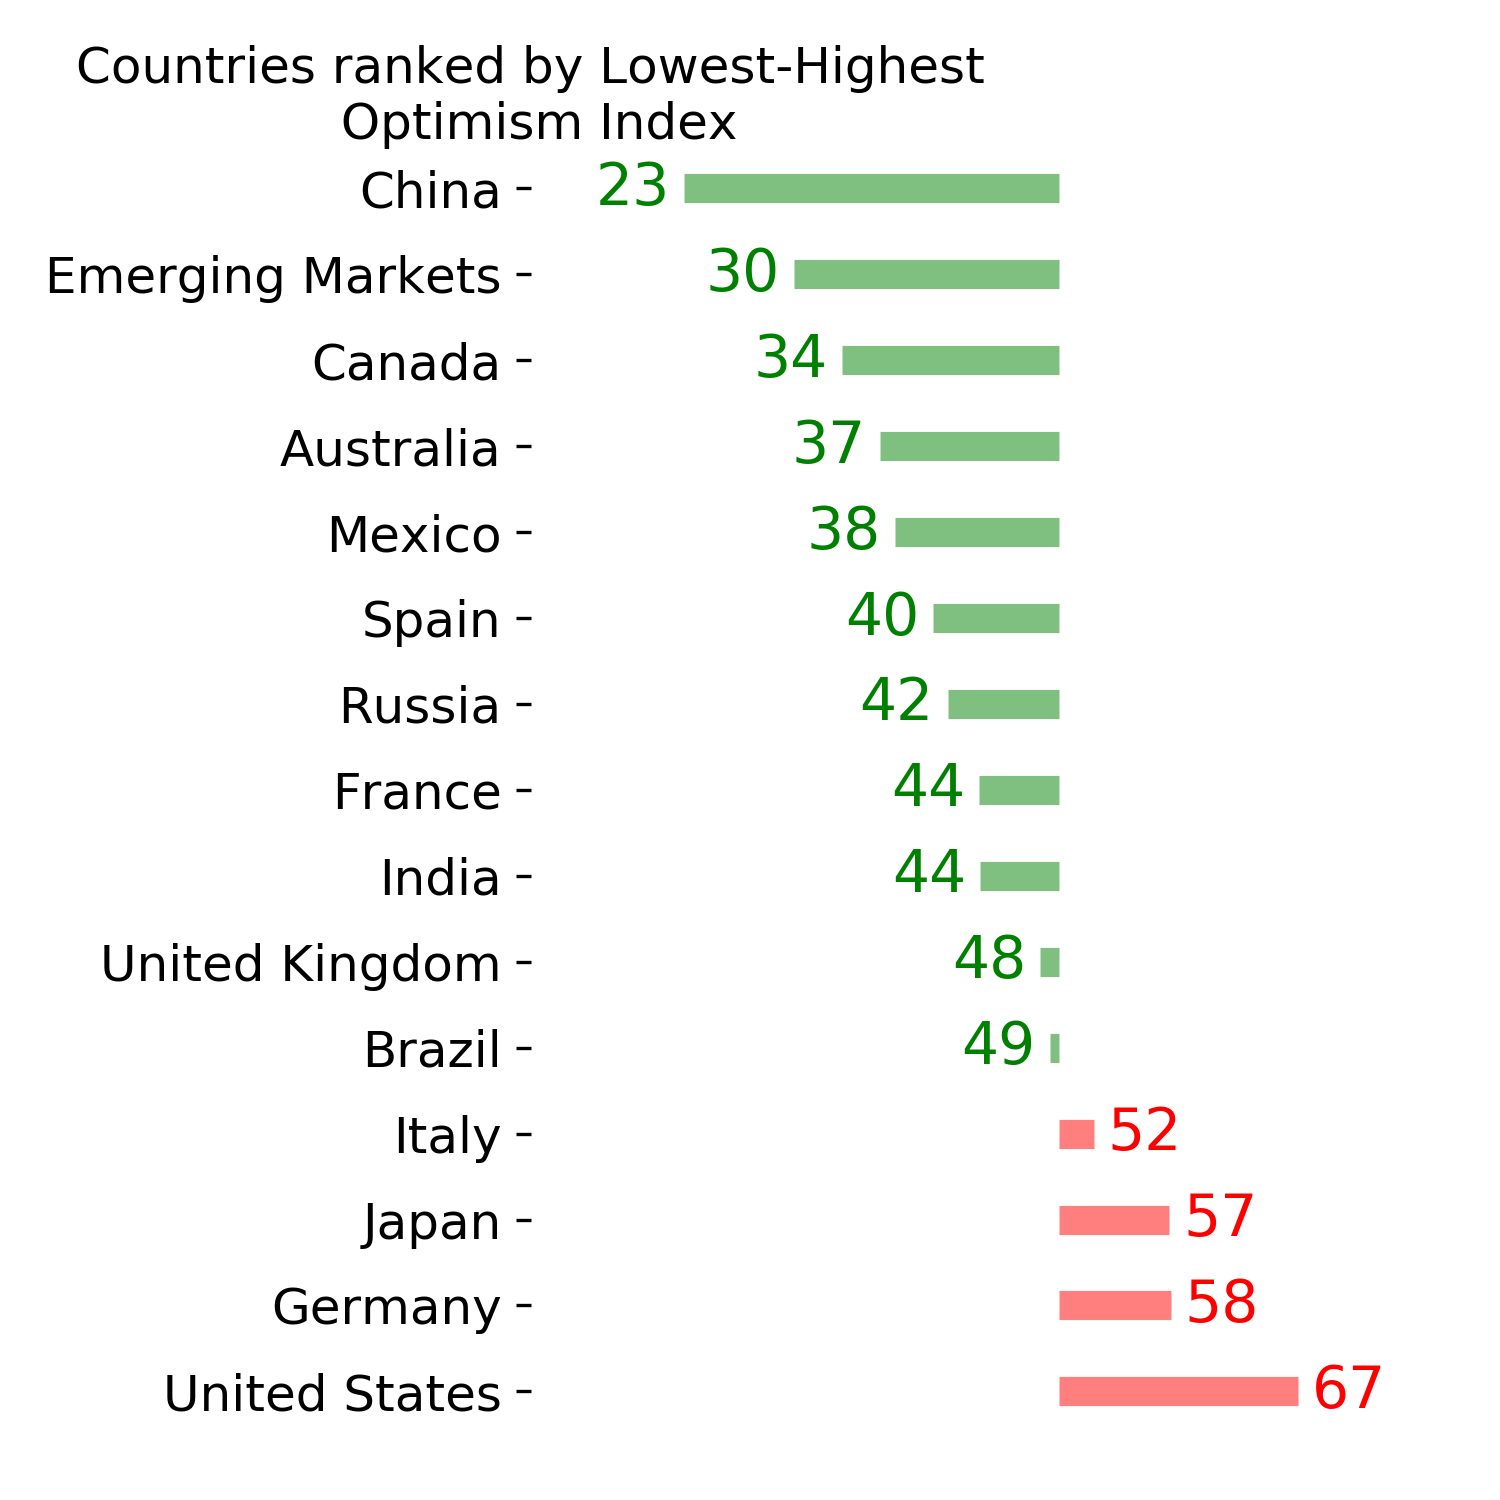
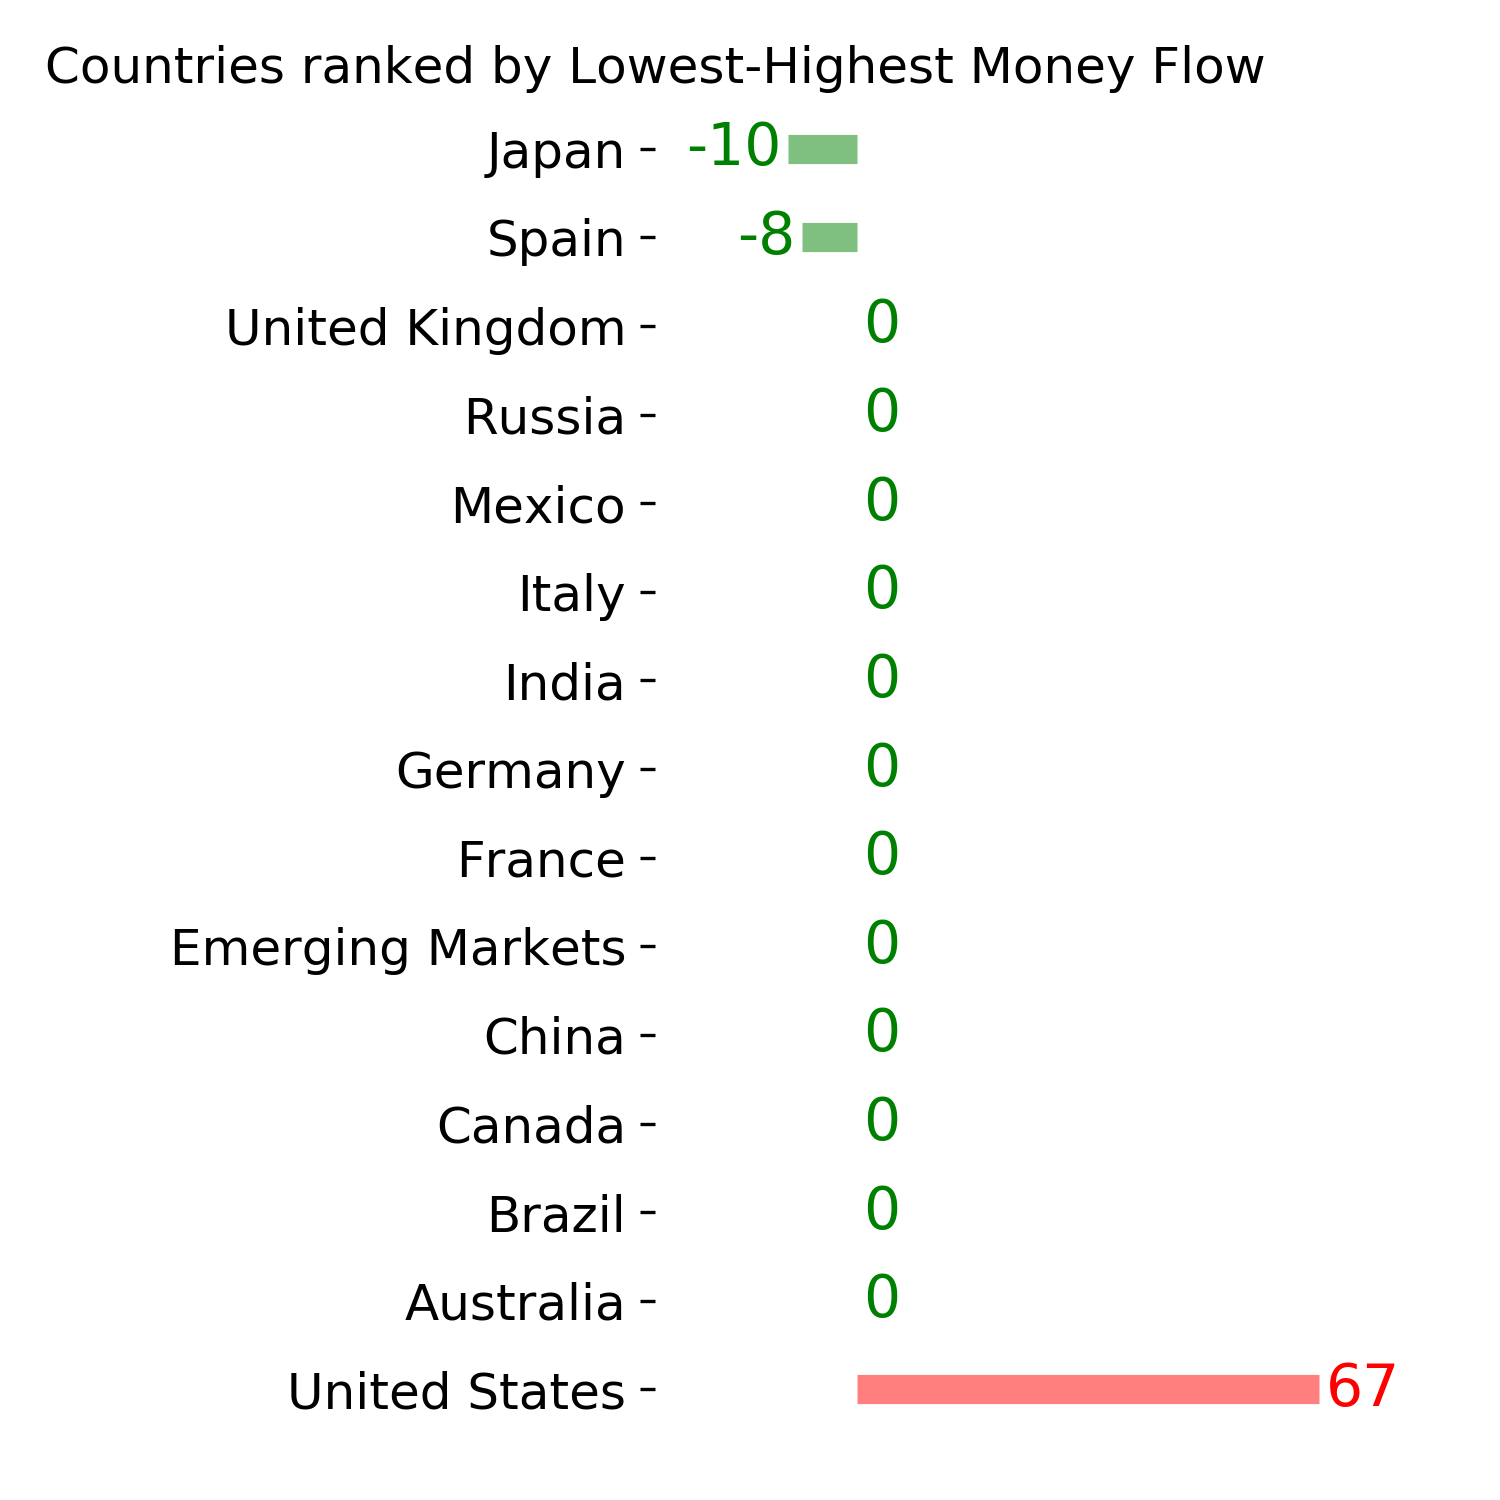
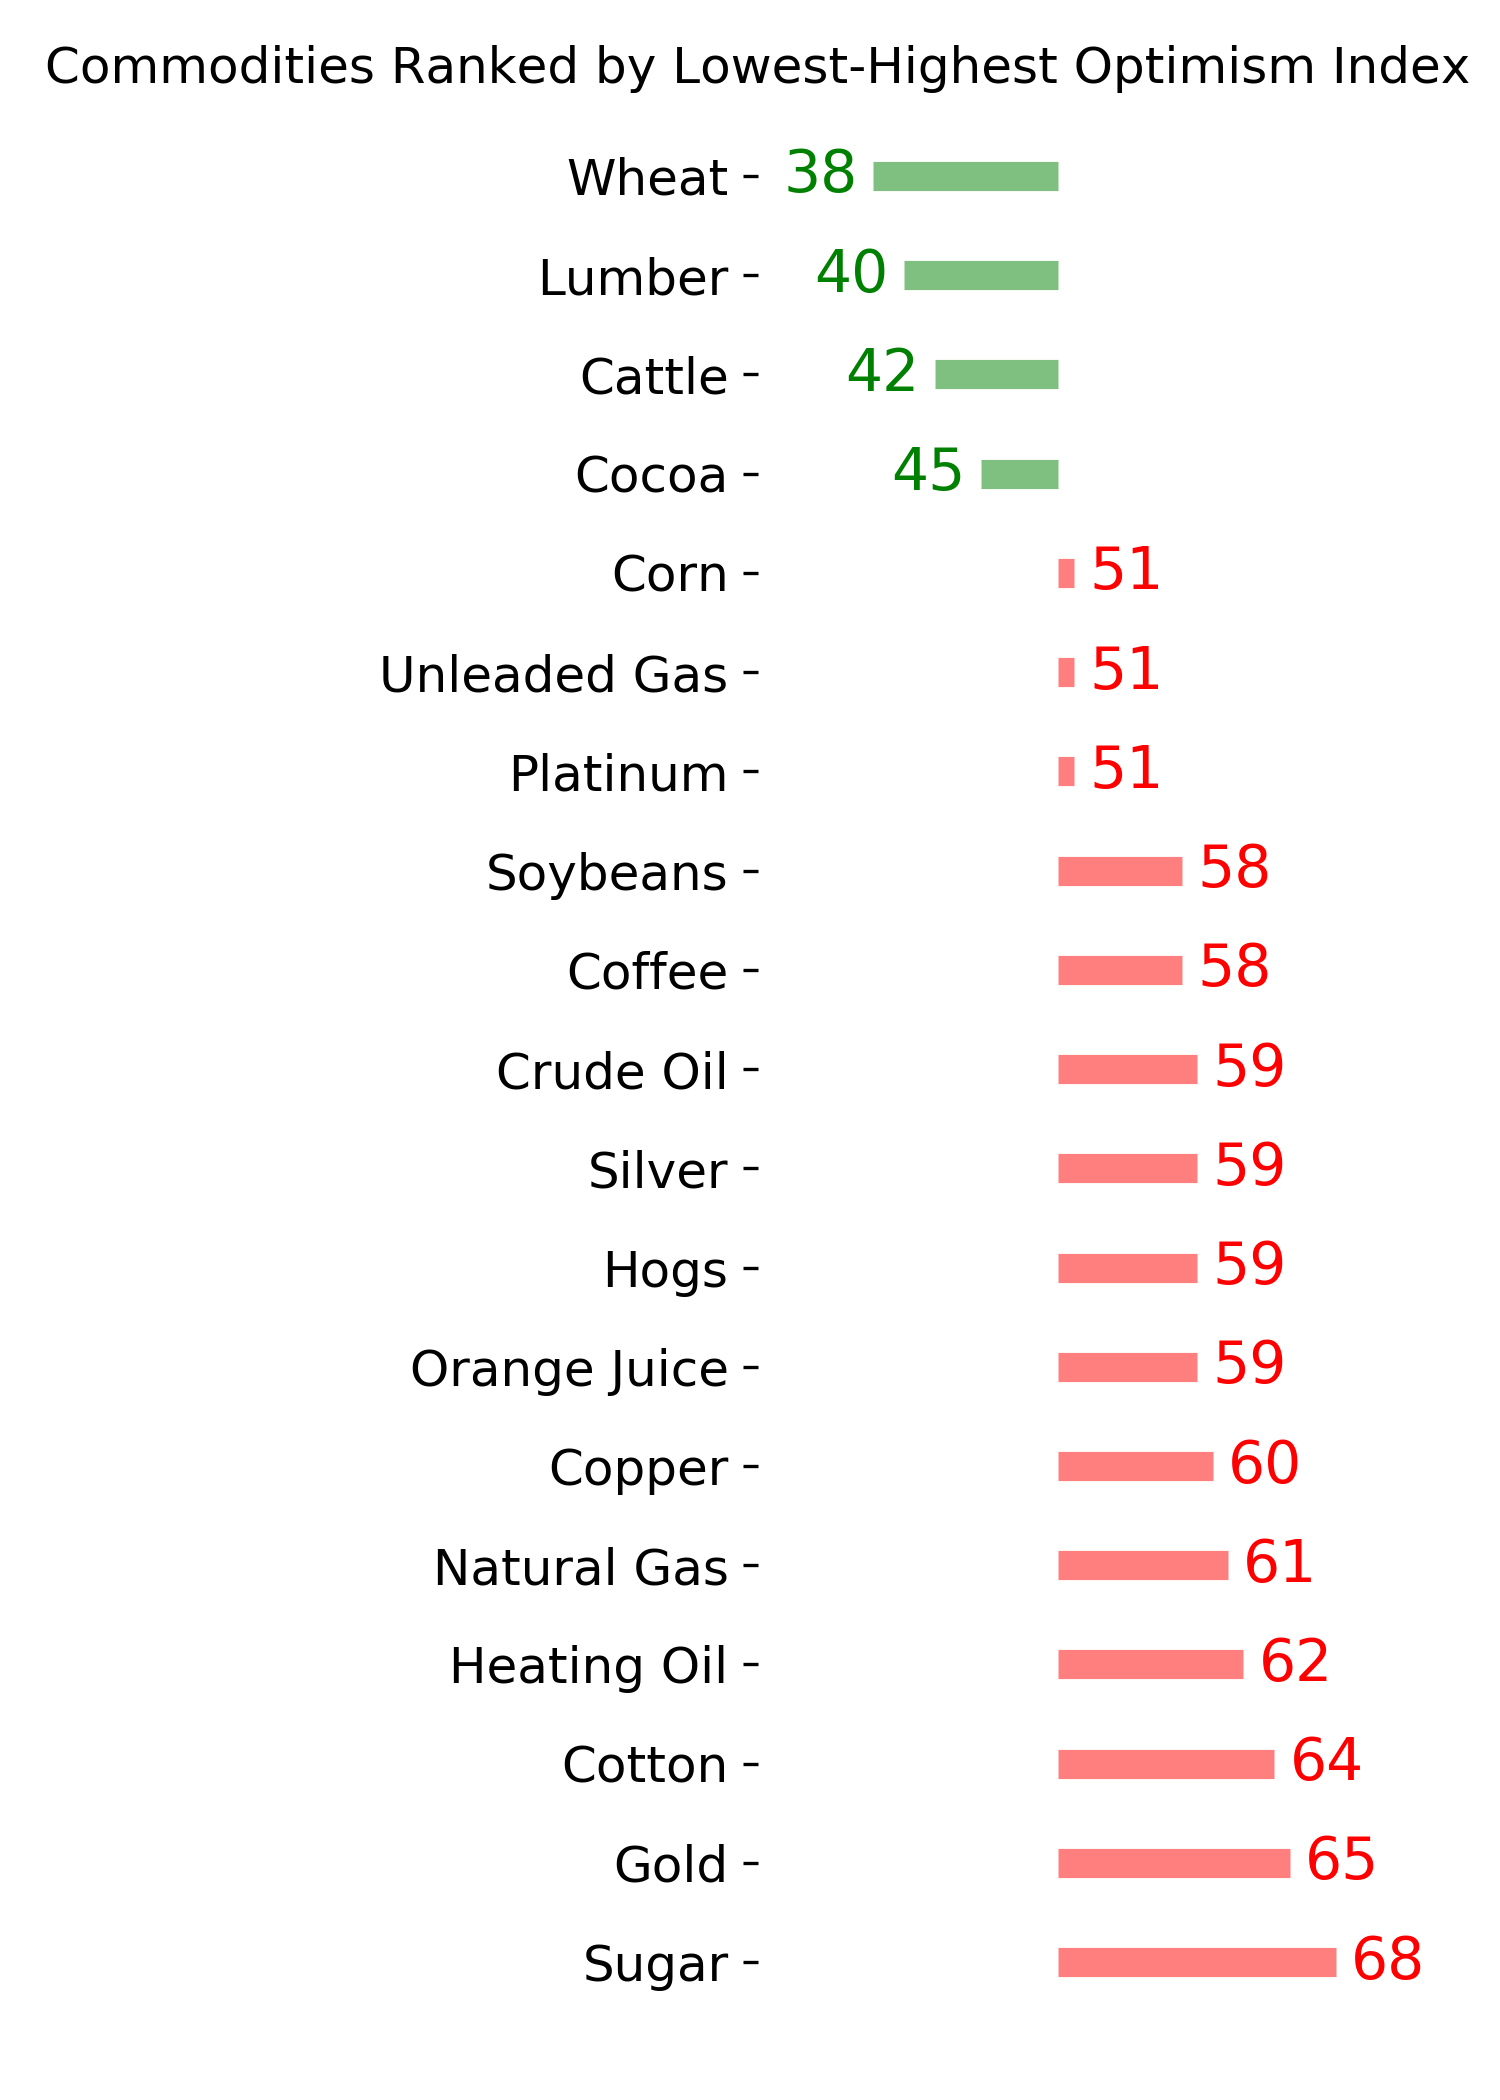
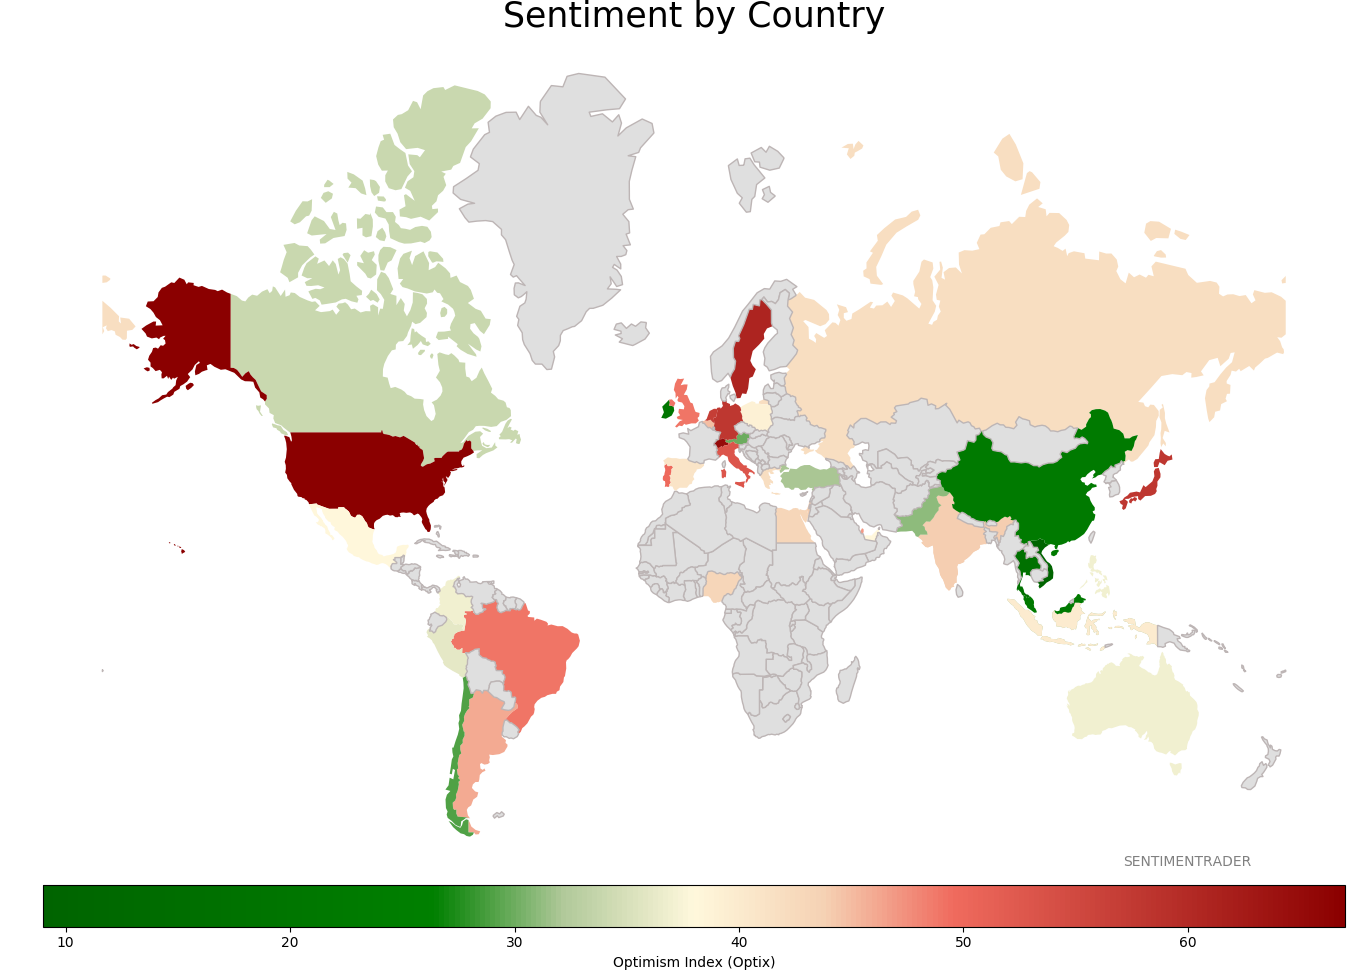
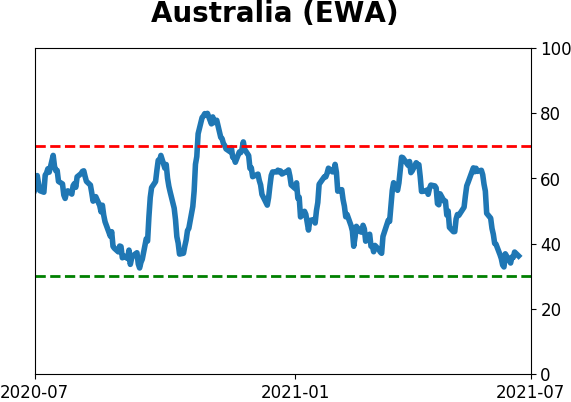
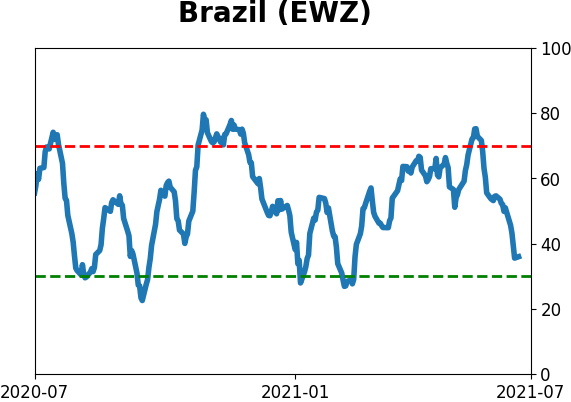
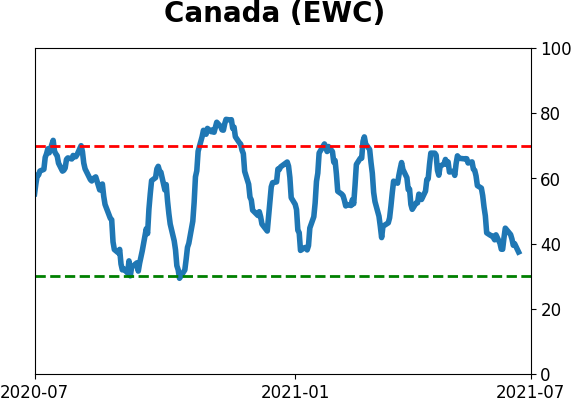
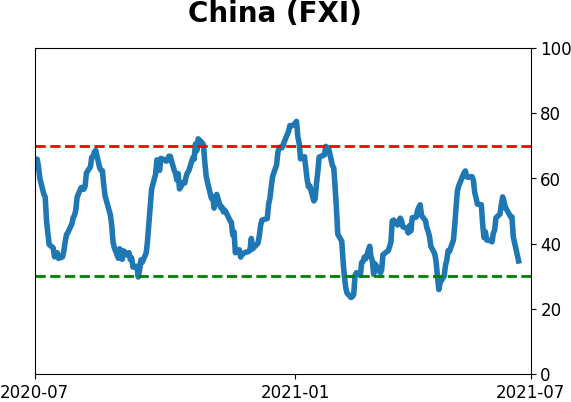
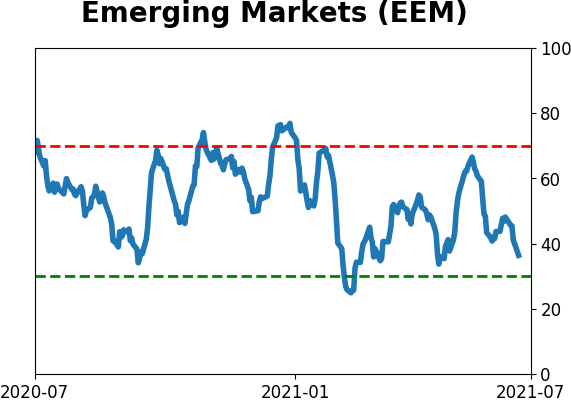
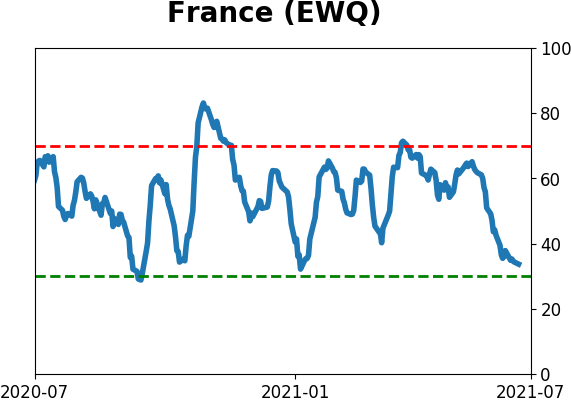
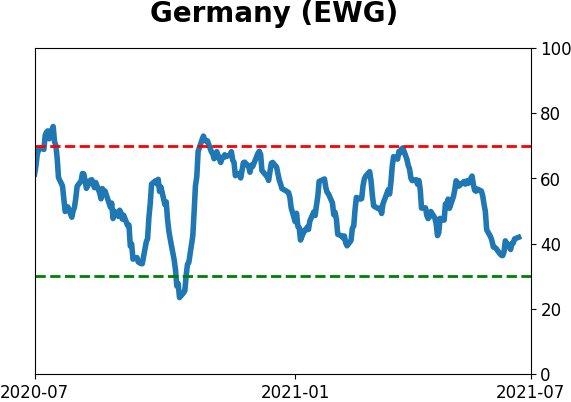
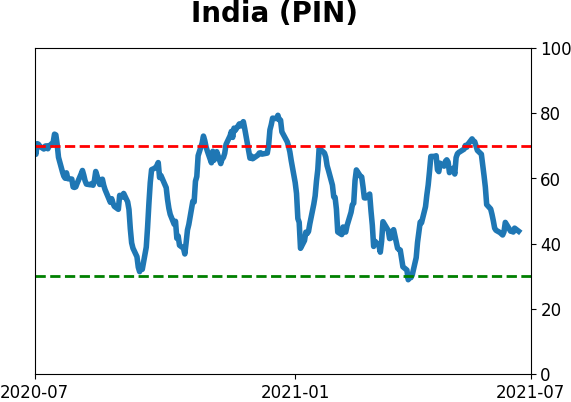
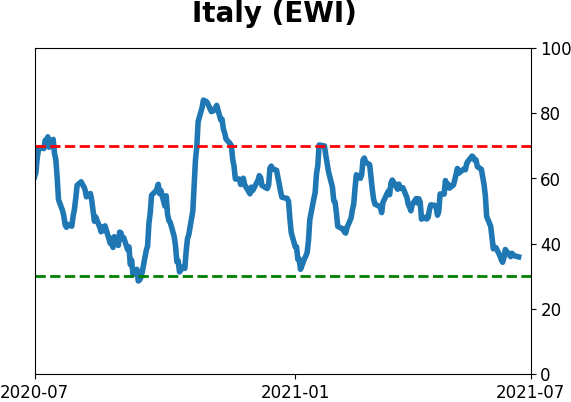
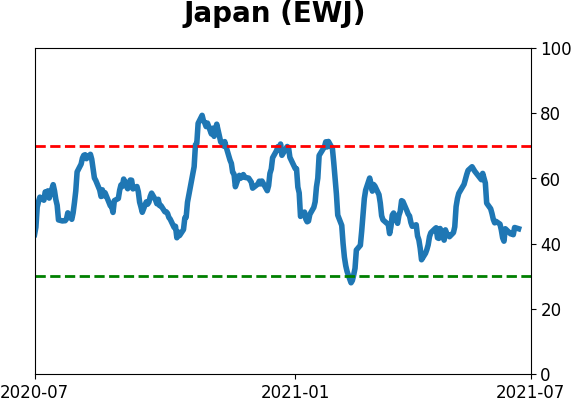
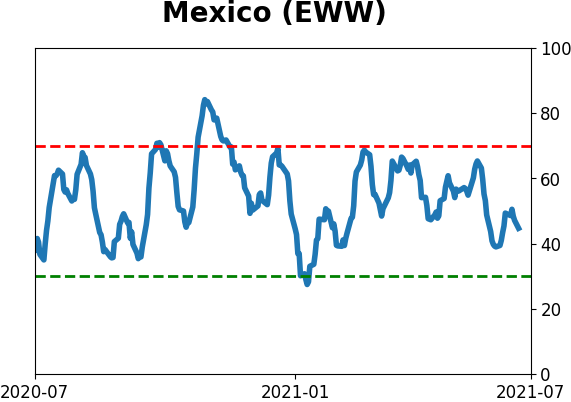
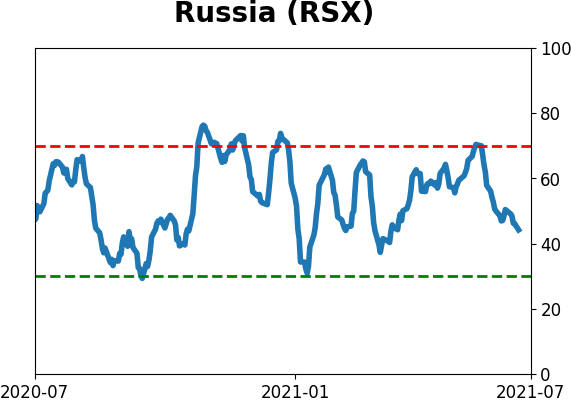
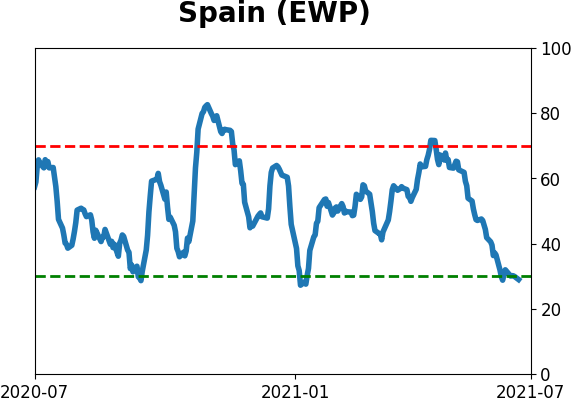
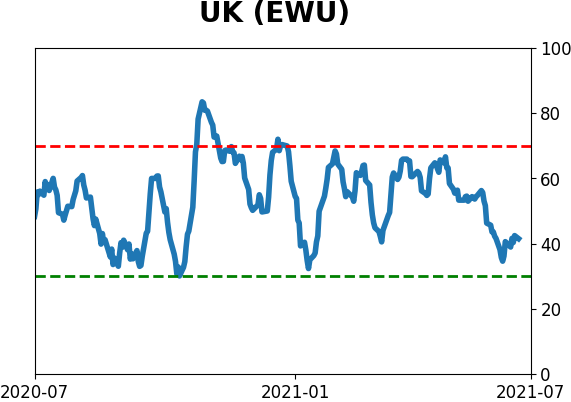
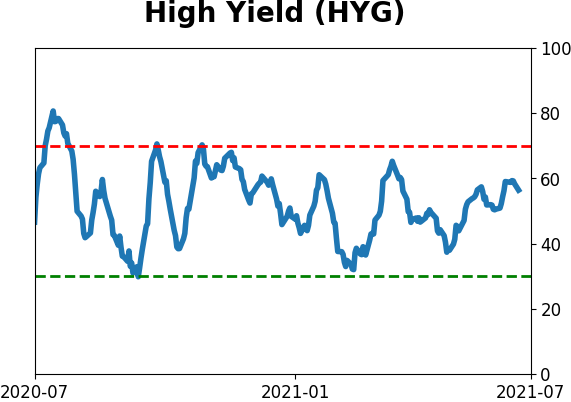
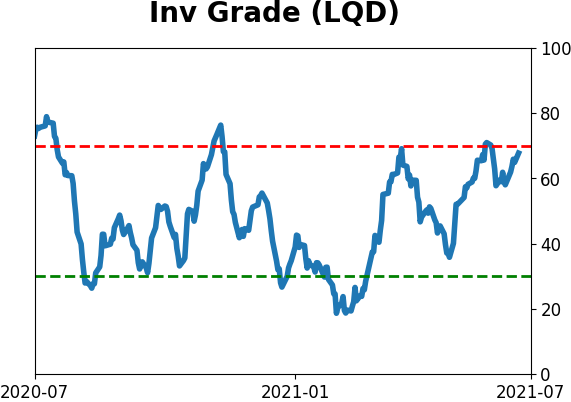
Sentiment Around The World
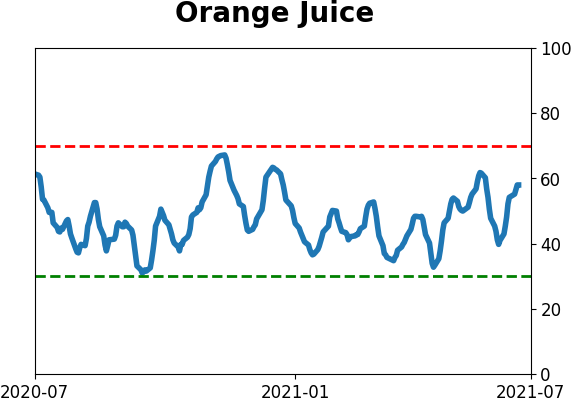
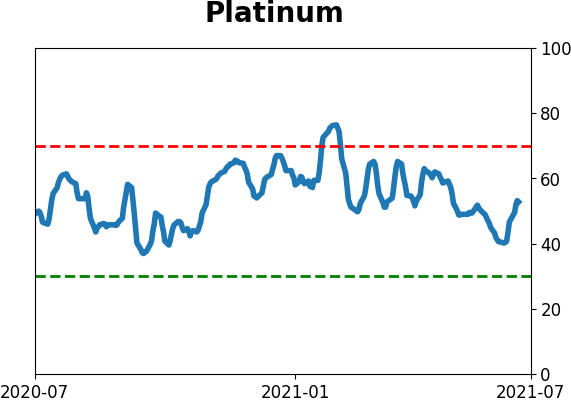
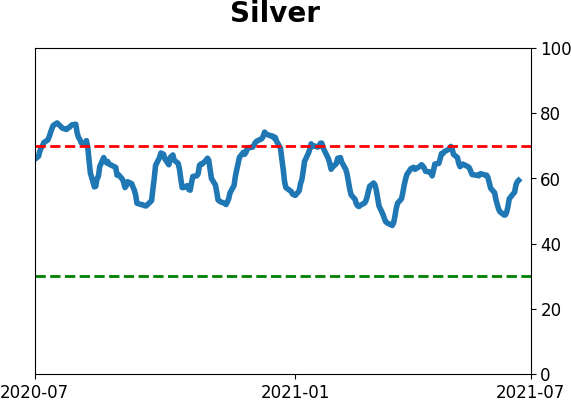
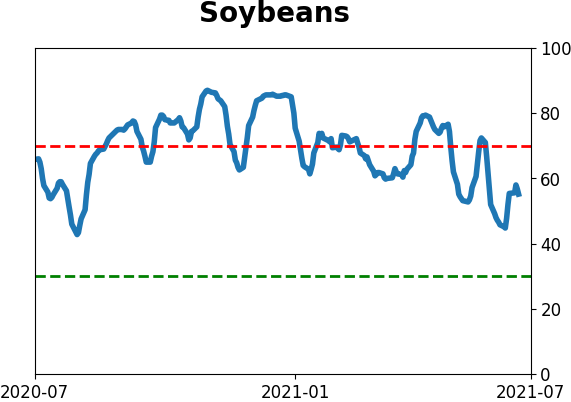
Optimism Index Thumbnails
|
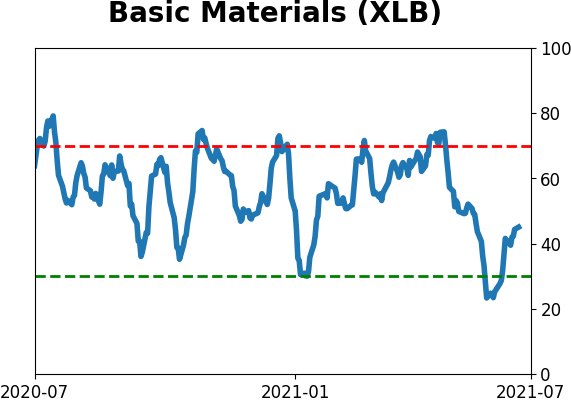
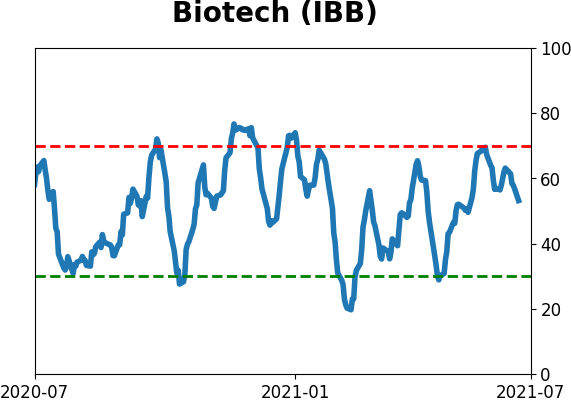
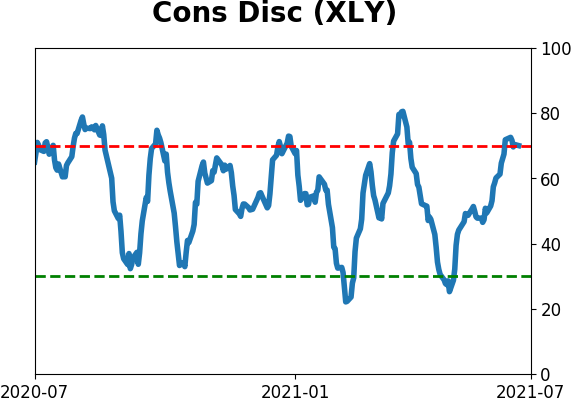
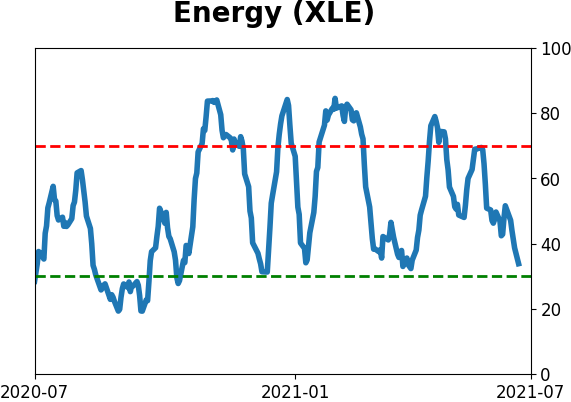
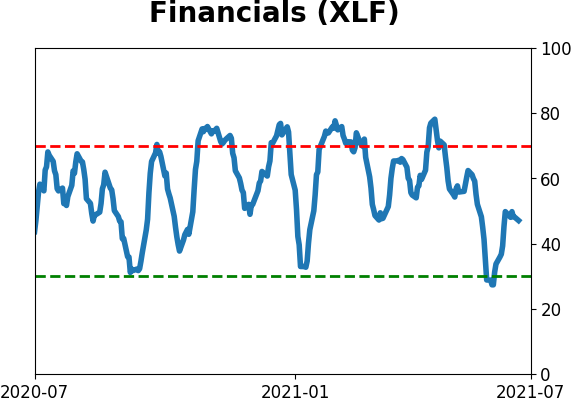
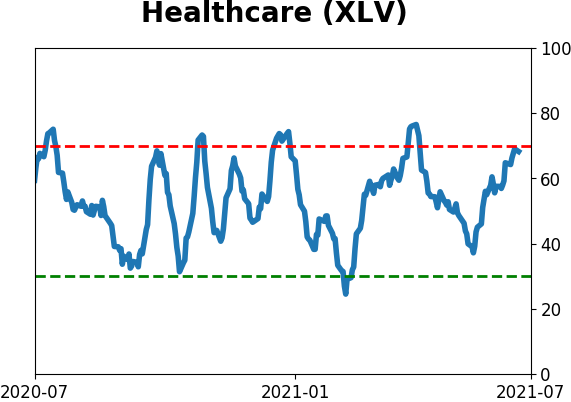
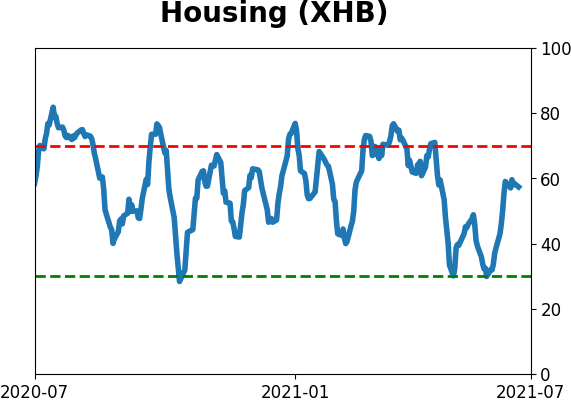
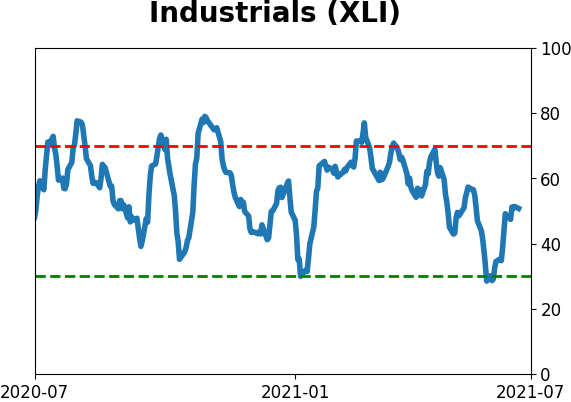
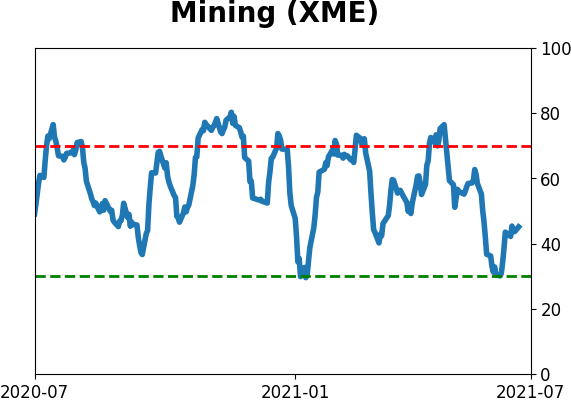
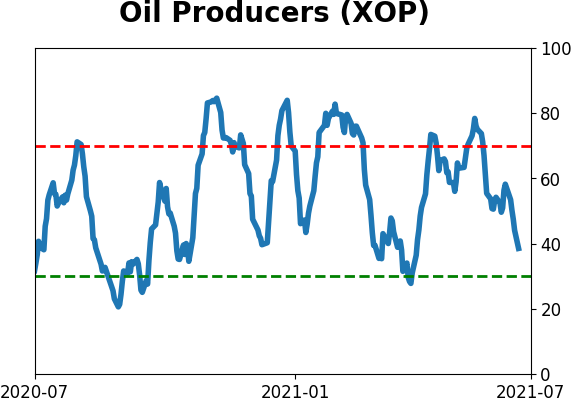
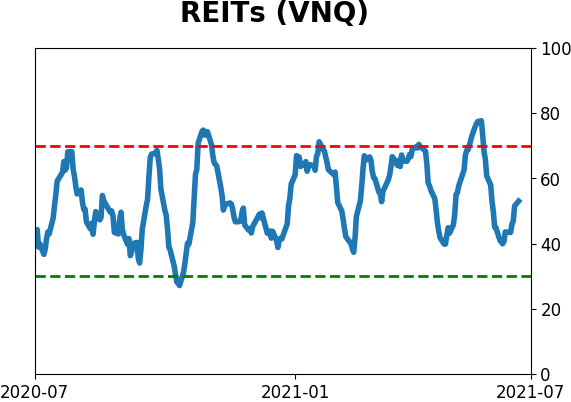
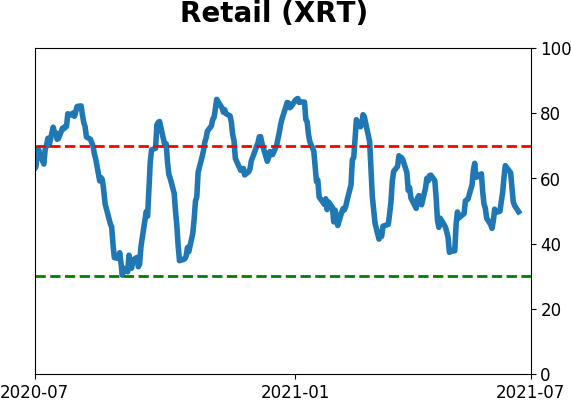
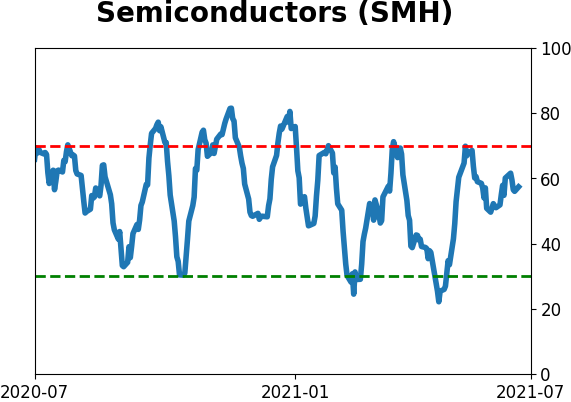
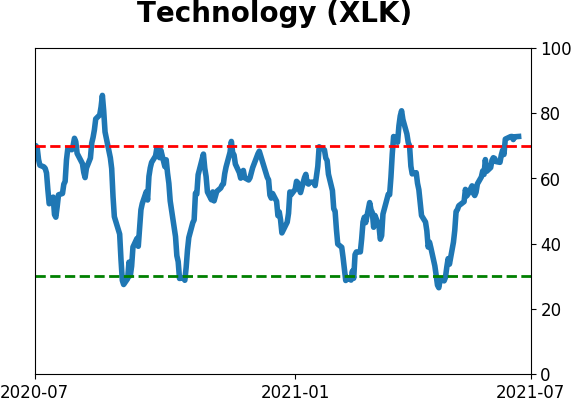
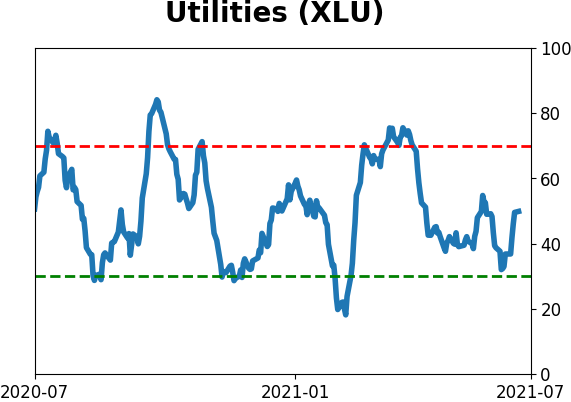
Sector ETF's - 10-Day Moving Average
|
|
|
Country ETF's - 10-Day Moving Average
|
|
|
Bond ETF's - 10-Day Moving Average
|
|
|
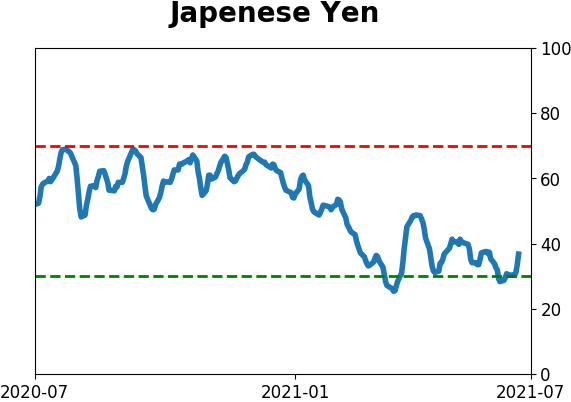
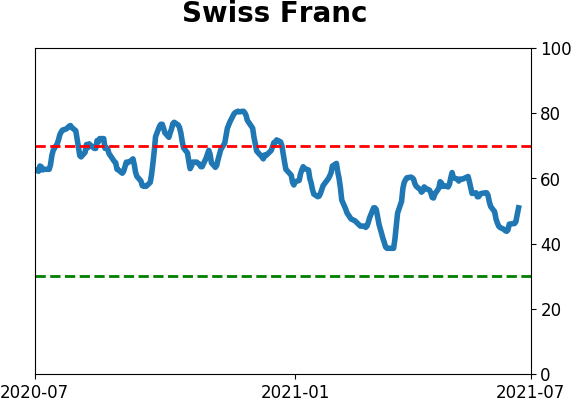
Currency ETF's - 5-Day Moving Average
|
|
|
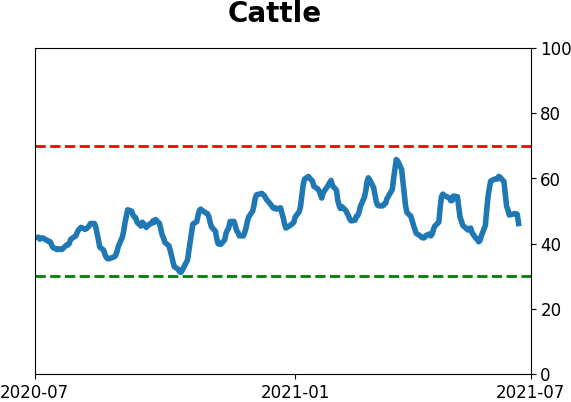
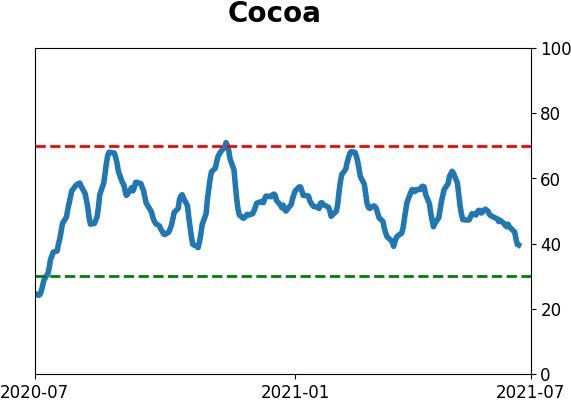
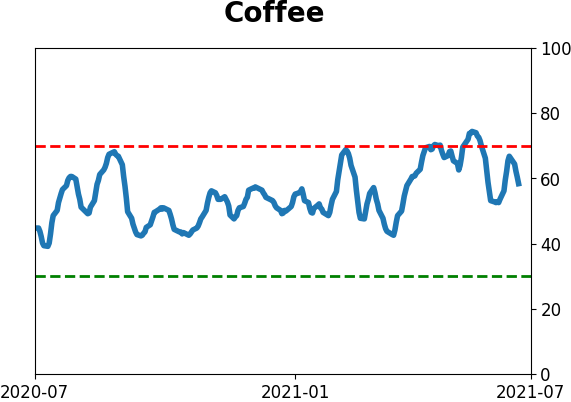
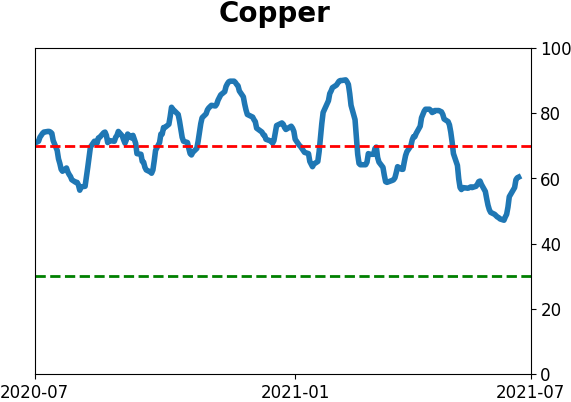
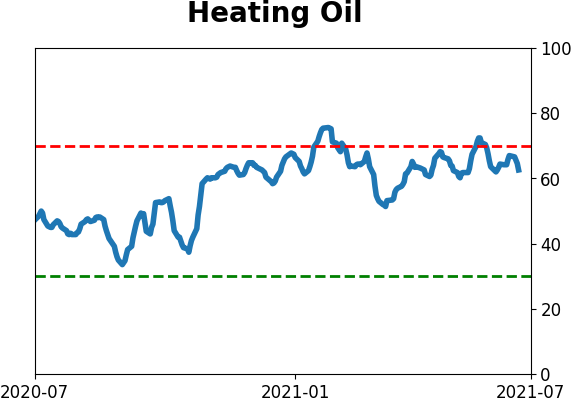
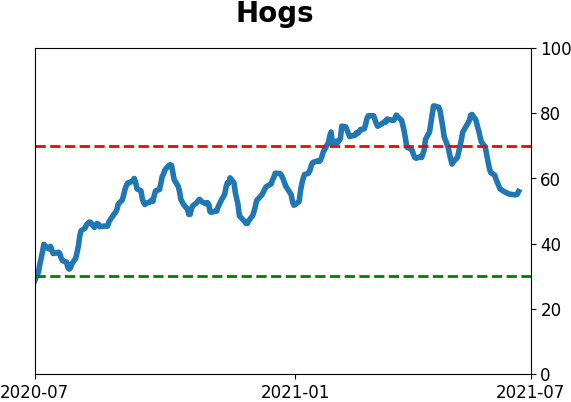
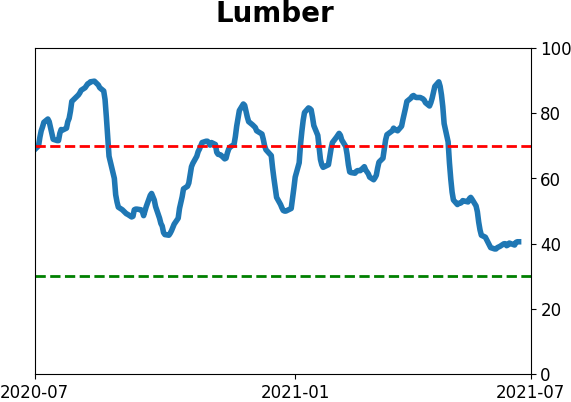
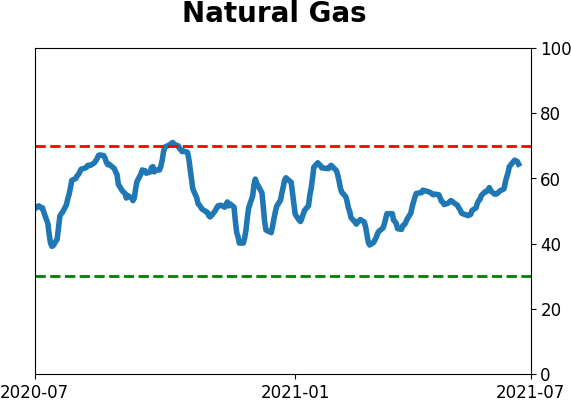
Commodity ETF's - 5-Day Moving Average
|
|